neutrophil chemotaxis in moving gradients of fmlp
TRANSCRIPT

Neutrophil chemotaxis in moving gradients of fMLPP. R. Ebrahimzadeh,* C. Hogfors,† and M. Braide**Department of Anatomy and Cell Biology, Goteborg University; and †Division of Polymeric Materials, ChalmersUniversity of Technology, Goteborg, Sweden
Abstract: In this study the fluid gradient chamber,a modified version of the Boyden chamber thatenables mobile gradients, was used to study themigration of human granulocytes in gradients offMLP. Temporal chemotactic gradients were cre-ated by moving density-stabilized spatial gradientsat different velocities in relation to migrating cells.Random and directed cell migration was quantifiedby applying a theoretical population distributionmodel to experimental cell distributions obtainedfrom cell counts at different depths in the filters.Rates of random and directed migration generallyincreased with gradient velocity. At negative gradi-ent velocities, i.e., when the gradients were movedin a direction opposite to that of cell migration todecrease fMLP concentration over time, randomand directed migration was inhibited. At positivegradient velocities, migration rates were not signifi-cantly different from those seen in immobile gradi-ents. The fact that the rate of directed migrationwas smaller at negative gradient velocities indicatesthat negative temporal gradients reduced the aver-age speed and/or orientation of the chemotacticallymigrating cells. In immobile gradients, the cellsgenerated a small concentration increase over timewhen they migrated in the up-gradient direction.Consequently, a positive temporal gradient as per-ceived by the cells may act as a positive feedbacksignal to maintain chemotactic migration. J. Leu-koc. Biol. 67: 651–661; 2000.
Key Words: cell movement
INTRODUCTION
Although neutrophil chemotaxis has been studied extensively,the cellular mechanisms behind the detection of the chemotac-tic concentration gradient are not known. The two majorprinciples that have been put forward in the discussion aretemporal and spatial gradient detection [1].
The spatial mechanism for gradient detection has been themost popular over the years, and it is supported by the fact thatthe initial polarization of granulocytes, when subjected to achemotactic gradient, is predominantly in the up-gradientdirection [2] before the cells have started to move.
Vickers et al. [3, 4] introduced the theory that a temporalgradient was required to induce chemotaxis. Their deductionwas based on the observation that the leukocytes only migrated
during the initial, diffusive build-up of the experimentalchemotactic gradient but stopped moving once the gradient wasestablished and stable. This theory has led to much dispute[e.g., see ref. 5] because several investigators have produceddata showing sustained chemotactic orientation [6] and migra-tion [7] in stable spatial gradients.
Obviously, there is no reason for the gradient detectionmechanism of the cells to be either purely spatial or purelytemporal. In fact, kinetic data from stimulation of neutrophilswith different concentrations of N-formyl-Met-Leu-Phe (fMLP)suggests a time-dependent adaptation of the depolarizationresponse [8, 9]. The intracellular Ca21 concentration shows asimilar type of response after stimulation with fMLP because astep-elevation of fMLP from zero to a chemotactic concentrationleads to a rapid transient but no sustained increase of Ca21 [10].Neither the depolarization nor the calcium transient is directlylinked to the actin polymerization process that controls cellmigration. It is established theory, however, that intracellularcalcium gradients are involved in the regulation of the pseudo-podal actin polymerization [11]. The intracellular calcium levelas well as the initiation of the actin polymerization process aredependent upon phospholipid metabolites [12, 13], controlledby the interaction between fMLP receptor and various Gproteins, and may therefore express similar kinetics. In addi-tion, a recent study demonstrating that neutrophil orientation isreversed when fMLP concentration decreases over time [14],actually provides evidence for the existence of cellular mecha-nisms for a response to temporal gradients.
So, in addition to the experimental evidence of a spatialmechanism for gradient detection, the response to chemotacticstimulation has temporal features that may be of importance tothe relationship between gradient detection and migration. Thetask of separating the temporal effects from the spatial effects ofchemotactic gradients is a hard one and requires an appropriatemethodology.
The fluid gradient chamber is a rather new method to studyleukocyte migration in filters [15] and it allows the use ofmovable gradients. In recent studies, the fluid gradient cham-ber has been combined with a theoretical population modelused to extract migration parameters from the curve-fitteddistributions of migrated cells. The population model is basedon the properties of the normal distribution, which may be
Correspondence: Magnus Braide, Department of Anatomy and Cell Biology,Goteborg University, Medicinaregatan 3, S-413 90 Goteborg, Sweden. E-mail:[email protected]
Received March 29, 1999; revised November 14, 1999; accepted November30, 1999.
Journal of Leukocyte Biology Volume 67, May 2000 651

directly related to random and directed migration of particles[16]. In earlier models, the process of migration has beendescribed implicitly by partial differential equations [17, 18]requiring numerical simulation in order to produce the ex-pected population distributions created by migration. Theapplication of normal distributions simplifies the analysisconsiderably because the coefficients of the normal distribu-tion, the mean (µ) and the standard deviation (s), which areeasily obtained by curve fitting, directly express the rates ofdirected and random migration, respectively. The application ofthe population model to data from the fluid gradient chamberhas provided evidence for the existence of three discretesubpopulations among the migrating neutrophils [15, and F.Afzal, F. Bazargani, and M. Braide, unpublished results]. Onlyone out of the three subpopulations (,30% of the cells) showedevidence of true chemotactic migration, whereas the rest of thecells migrated randomly in the presence of a chemotacticgradient of fMLP [15].
The unique property of allowing the chemotactic gradients tobe moved in relation to the migrating cells makes the fluidgradient chamber suited for studies of temporal chemotacticgradients. Moving a spatial chemotactic concentration gradientin relation to the filter matrix and the migrating cells adds atemporal effect (concentration change per unit time). The aim ofthis study was to investigate the effects of different positive andnegative gradient velocities on random migration and directedmigration of the chemotactic subpopulation of neutrophils.
MATERIALS AND METHODS
Experiments
Temporal chemotactic gradients were created in the fluid gradient chamber (seebelow) by moving fMLP gradients at different negative and positive velocities inrelation to the filter sandwich harboring the migrating cells. The distributions ofcells over filter sandwich depth were determined microscopically after 20, 40,and 60 min of migration and analyzed by applying the previously establishedthree-subpopulation model [15]. The development over time of the mean(directed migration) and standard deviation (random migration) of the displace-ment of the chemotactically active subpopulation was used to quantitativelydescribe cell migration at different gradient velocities.
Experiments were performed in the fluid gradient chamber at nine differentgradient velocities (240–40 µm/min), three experiments at each velocity. Theregular gradient concentration profile was ramp-shaped, having minimum andmaximum fMLP concentrations of 0 and 2 3 10-8 M, respectively. Additionalcontrol experiments, using inverted chemotactic gradients or constant concen-trations of fMLP, were performed at 240 and 40 µm/min, three experiments ateach velocity, to characterize the influence of factors other than fMLPconcentration change over time.
The fluid gradient chamber
The fluid gradient chamber has been described in an earlier study [15]. Insummary, the chamber has two compartments, separated by a 13-mm-diameterfilter holder (Fig. 1). The lower compartment is connected through a narrowspiral mixing channel to two inlets fed by computer-controlled syringe pumps(Pump 22, Harvard Apparatus, South Natick, MA). The cell samples aredeposited between two filters, clamped in a sandwich by the filter holder. Threefilter chambers are connected in parallel to the pumps and kept in the samethermostated water bath at 37°C.
A density gradient was created by mixing two fluids of different specificweight in gradually changing proportions, with the use of the two syringepumps. In this way, the gradient was formed from below in the bottom of the
lower compartment of the filter chamber. Density gradients are mechanicallystable and may therefore be moved vertically without breaking up. The nominalvolume of the gradient was 0.25 mL, corresponding to a height of 3.1 mm, andthe concentration profile was ramp-shaped (Fig. 2). After being made, thegradient was moved upward by pumping the heavier fluid into the mixingchannel, and positioned at the level of the filter sandwich. The whole procedureof gradient making and positioning was finished within 4 min.
Gradient preparation and characterization
The pair of fluids used to produce each gradient consisted of differentproportions of the chemotactic agent fMLP (Sigma, St. Louis, MO) and thecoated silica density medium Percollt in Hanks’ balanced salt solution (HBSS)with the addition of 0.5% bovine serum albumin (fraction V; Sigma). Each pairof fluids thus generated a chemotactic gradient in parallel with the densitygradient.
The main experiments, designed to study the effects of gradient velocity,were performed with the same type of gradient, named the regular gradient. Thedensity and fMLP concentration ranged from 1.08 kg/L and 0 M at the top to1.12 kg/L and 2 3 10-8 M at the bottom (Fig. 2). The density range was chosenin order to render the cells an upward sedimentation combined with adownward direction of net chemotactic migration, leading to a separation of thechemotactically active cells from the rest of the cell population. The reason forthe separation of the cells is that chemotactically migrating cells in filters areinsensitive to the small gravitational forces in the gradient, whereas therandomly migrating cells add a component of sedimentation to their pattern ofmigration [15, 19]. Because the specific weight of human neutrophils isapproximately normally distributed with mean 1.078 kg/L and standarddeviation 0.0059 kg/L [20], virtually all the cells had specific weights below themean specific weight (1.10 kg/L) of the regular gradient. Chemotactic control
Fig. 1. Schematic drawing of the fluid gradient chamber. The filter sandwichis clamped in a dismountable metal ring, which is seated in the fluid gradientchamber, thus dividing it into two compartments. A personal computer controlsthe two syringe pumps during the generation of the combined density andchemotactic gradient. The gradient is created by gradually decreasing the flowof pump A and simultaneously increasing the flow of pump B. Once created, thegradient is moved in relation to the filter sandwich by operating pump B.
652 Journal of Leukocyte Biology Volume 67, May 2000 http://www.jleukbio.org

experiments were performed in gradients with a density range between 1.04 and1.08 kg/L and the high fMLP concentration (1028 M) at the top. This type ofgradient, named inverted gradient, was characterized by sedimentation mainlydirected downward and a net chemotactic migration directed upward.
Temporal gradients were created by moving the preformed, spatial gradientsat constant velocities during cell migration. This was accomplished by infusingor withdrawing heavy fluid in the lower compartment of the gradient chamber.The fMLP concentration profiles of the gradients were affected by diffusionduring the experiment, which influenced their spatial characteristics, generallyby decreasing their steepness over time. This effect had to be estimated in orderto allow a correct assessment of the temporal gradients created at differentgradient velocities.
The gradient profile at time 0 was determined radiographically as describedearlier [19]. In brief, strips of X-ray film were immersed vertically inradiolabeled (35S) gradients, exposed for 5 min, developed, and measureddensitometrically. Because the effects of diffusion are very small on the(intentionally) chosen type of concentration profile over the time periods usedin the experiments, they could not be measured radiographically. Instead, adiffusion coefficient of fMLP was estimated from the steeper gradients of theradiographic measurements [19] and used to compute (see Appendix) thechanges in gradient profile over time (Fig. 2).
Control experiments were also performed to evaluate the effects of movinggradient fluids on chemokinesis and random migration. These experimentswere performed in density gradients with end-point densities of 1.04 and 1.08kg/L and constant fMLP concentrations of either zero or (1028 M) at thegradient velocities 240 and 40 µm/min.
Cell preparation
Human polymorphonuclear granulocytes were obtained from whole blood bydensity gradient separation, using Percollt (Pharmacia Fine Chemicals,Uppsala, Sweden) according to the technique described by Braide and Bjursten[20]. The cells were washed and suspended in phosphate-buffered saline (PBS),pH 7.20.
Experimental procedure
Loading of the filter sandwiches was performed by applying 50 µL of cellsuspension (2 3 106 granulocytes/mL) to the upper surface of a cellulose filter(Millipore, Bedford, MA; 3 µm, diameter 13 mm). The filter absorbed about halfof the fluid volume and a second dry filter was placed on top to absorb the rest ofthe suspension, making up a filter sandwich with the cells trapped in between.
The filter sandwich was clamped in the filter holder, consisting of twothreaded metal rings, and the filter holder was seated in the filter chamber,immersed in gradient fluid. The gradients were prepared and positionedsimultaneously in the three chambers by pumping high-density fluid into thechamber. The pump was immediately set at the constant speed required to movethe gradient at the desired velocity by either infusing or withdrawing fluidduring the following 60 min allowed for migration. Because the gradients weremoved during the experiments, care was taken to adjust the starting level of thegradient in relation to the filter sandwich. At the highest gradient velocities, 2.4mm of the gradient height passed through the filter sandwich during the 60-minmigration time. Thus, the starting position of the gradient was chosen such thatthe midpoint of the gradient was at the level of the filter sandwich after 30 minof migration time.
The three chambers of the apparatus were harvested at 20, 40, and 60 min ofmigration time in order to characterize the time history of the migration process.After removal and dismounting of the filter holder, the filters were separated,fixed in concentrated ethanol, stained in Mayer’s hematoxylin, dehydrated inalcohol, clarified in xylol, and mounted on glass slides as previously described[21].
Evaluation
The mounted filters were examined in a Leitz Orthoplan microscope using a340; NA 0.60 objective and 310 eyepieces. The in-filter distributions of cellswere obtained by using the fine focus to count the number of cells at each10-µm interval of depth in five different fields of view. The in-filter distributions
Fig. 2. Concentration and density profiles over vertical distance in the gradient fluid (the regular gradient and the inverted gradient) at different times afterestablishment. Directions of sedimentation and chemotaxis are indicated by arrows. The fMLP gradient concentration profile at time 0 is a least-squares best fit ofthree radiographic measurements. The concentration profiles at 20, 40, and 60 min were calculated by modeling the diffusive and convective changes over time of thegradient (see Appendix).
Ebrahimzadeh et al. Chemotaxis in moving gradients 653

Fig
.3.
The
dist
ribu
tions
ofth
em
igra
ting
gran
uloc
yte
popu
latio
nsov
erfil
ter
sand
wic
hde
pth
(212
0–12
0µm
)at2
0,40
,and
60m
inof
chem
otax
isat
diffe
rent
grad
ient
velo
citie
s.Th
eco
lum
nsre
pres
entt
hedi
ffere
ntgr
adie
ntve
loci
ties
betw
een
240
and
40µm
/min
;the
row
sre
pres
entt
heel
apse
dtim
eof
mig
ratio
n.Th
eef
fect
sof
grad
ient
velo
city
are
obvi
ous
afte
r60
min
ofm
igra
tion
(bot
tom
row
)whe
nth
edi
stri
butio
nsob
tain
edat
posi
tive
grad
ient
velo
citie
sar
esk
ewed
inth
edi
rect
ion
ofch
emot
axis
.In
alld
istr
ibut
ions
,asl
owly
mov
ing
subp
opul
atio
nof
cells
rem
ains
clos
eto
the
star
ting
poin
tatz
ero
dept
hin
the
filte
rsa
ndw
ich.
654 Journal of Leukocyte Biology Volume 67, May 2000 http://www.jleukbio.org
were joined to obtain the total cell distribution over the depth range (2120 µmto 1120 µm) of each filter sandwich.
The cell distribution from each filter sandwich, expressing the displacementof the cells, was fitted to a theoretical distribution based on a mixture of threeGaussian distributions representing subpopulations. The curve-fitting algo-rithm was based on the assumption that the size of the subpopulations wasconstant during each entire experiment. Therefore, the three filter sandwichesobtained at different times during the same experiment were analyzed togetherunder this constraint by the least-squares technique, using a standard(gradient) method for multi-parameter optimization. Because of the discretenature of the data (cumulative cell numbers over 10-µm increments of filterdepth), the Gaussian distributions were integrated piecewise over 10-µmintervals before they were fitted to the cell counts. The curve-fitting processproduced best-fit values of n (subpopulation size), µ (mean), and s (standarddeviation) for each of the three subpopulations in each theoretical distribution.Coefficients of random and directed migration were calculated from thedevelopment of µ and s over time, t. The coefficient of directed migration, C,was defined as Dµ/Dt (µm/min) and the coefficient of random migration, D, wasdefined as D(s2)/Dt.
Statistics
Correlations between measurements were evaluated using the Kendall Rankcorrelation coefficient, and differences between groups of measurements wereevaluated using the Mann-Whitney U test. The chosen level of significance wasP , 0.05.
RESULTS
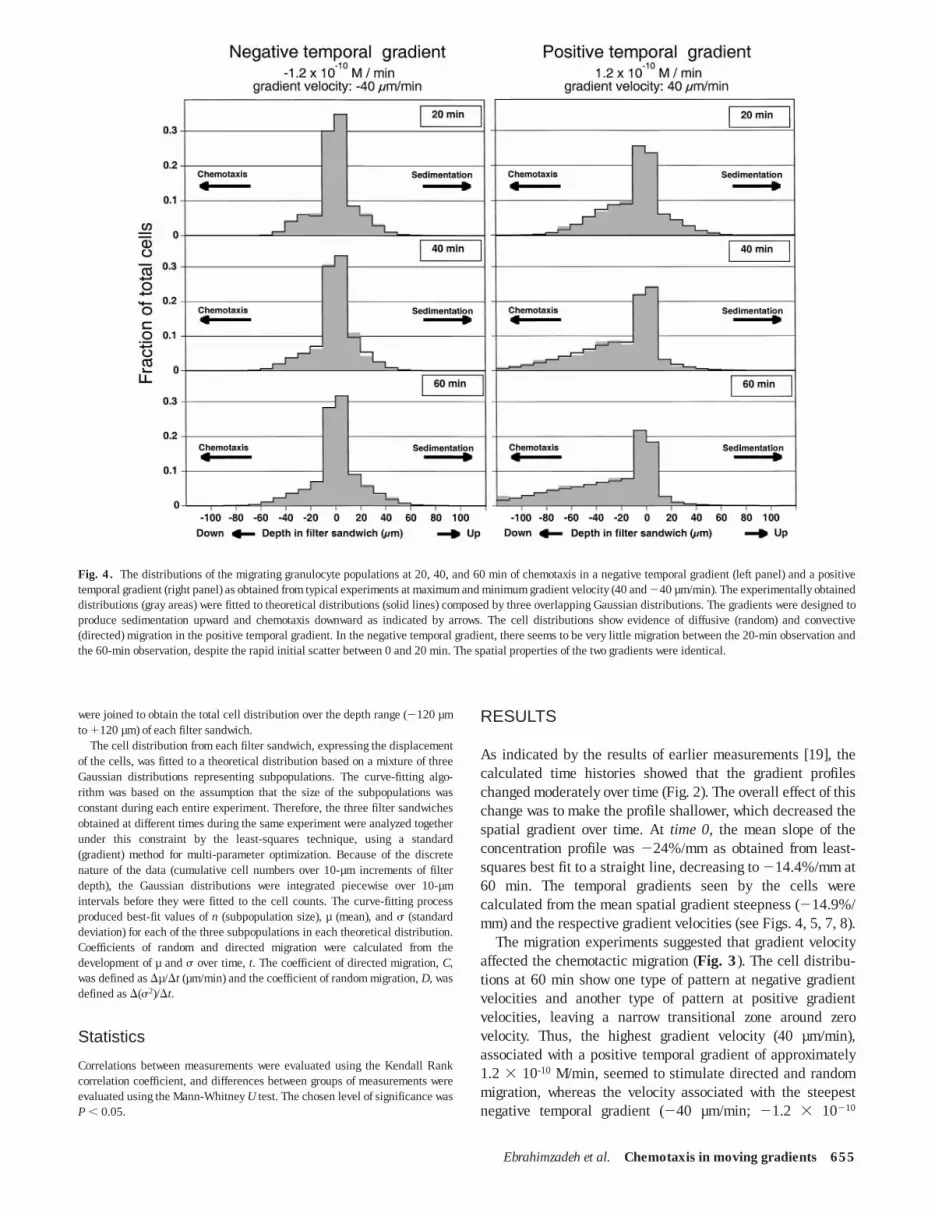
As indicated by the results of earlier measurements [19], thecalculated time histories showed that the gradient profileschanged moderately over time (Fig. 2). The overall effect of thischange was to make the profile shallower, which decreased thespatial gradient over time. At time 0, the mean slope of theconcentration profile was 224%/mm as obtained from least-squares best fit to a straight line, decreasing to 214.4%/mm at60 min. The temporal gradients seen by the cells werecalculated from the mean spatial gradient steepness (214.9%/mm) and the respective gradient velocities (see Figs. 4, 5, 7, 8).
The migration experiments suggested that gradient velocityaffected the chemotactic migration (Fig. 3). The cell distribu-tions at 60 min show one type of pattern at negative gradientvelocities and another type of pattern at positive gradientvelocities, leaving a narrow transitional zone around zerovelocity. Thus, the highest gradient velocity (40 µm/min),associated with a positive temporal gradient of approximately1.2 3 10-10 M/min, seemed to stimulate directed and randommigration, whereas the velocity associated with the steepestnegative temporal gradient (240 µm/min; 21.2 3 10210
Fig. 4. The distributions of the migrating granulocyte populations at 20, 40, and 60 min of chemotaxis in a negative temporal gradient (left panel) and a positivetemporal gradient (right panel) as obtained from typical experiments at maximum and minimum gradient velocity (40 and 240 µm/min). The experimentally obtaineddistributions (gray areas) were fitted to theoretical distributions (solid lines) composed by three overlapping Gaussian distributions. The gradients were designed toproduce sedimentation upward and chemotaxis downward as indicated by arrows. The cell distributions show evidence of diffusive (random) and convective(directed) migration in the positive temporal gradient. In the negative temporal gradient, there seems to be very little migration between the 20-min observation andthe 60-min observation, despite the rapid initial scatter between 0 and 20 min. The spatial properties of the two gradients were identical.
Ebrahimzadeh et al. Chemotaxis in moving gradients 655
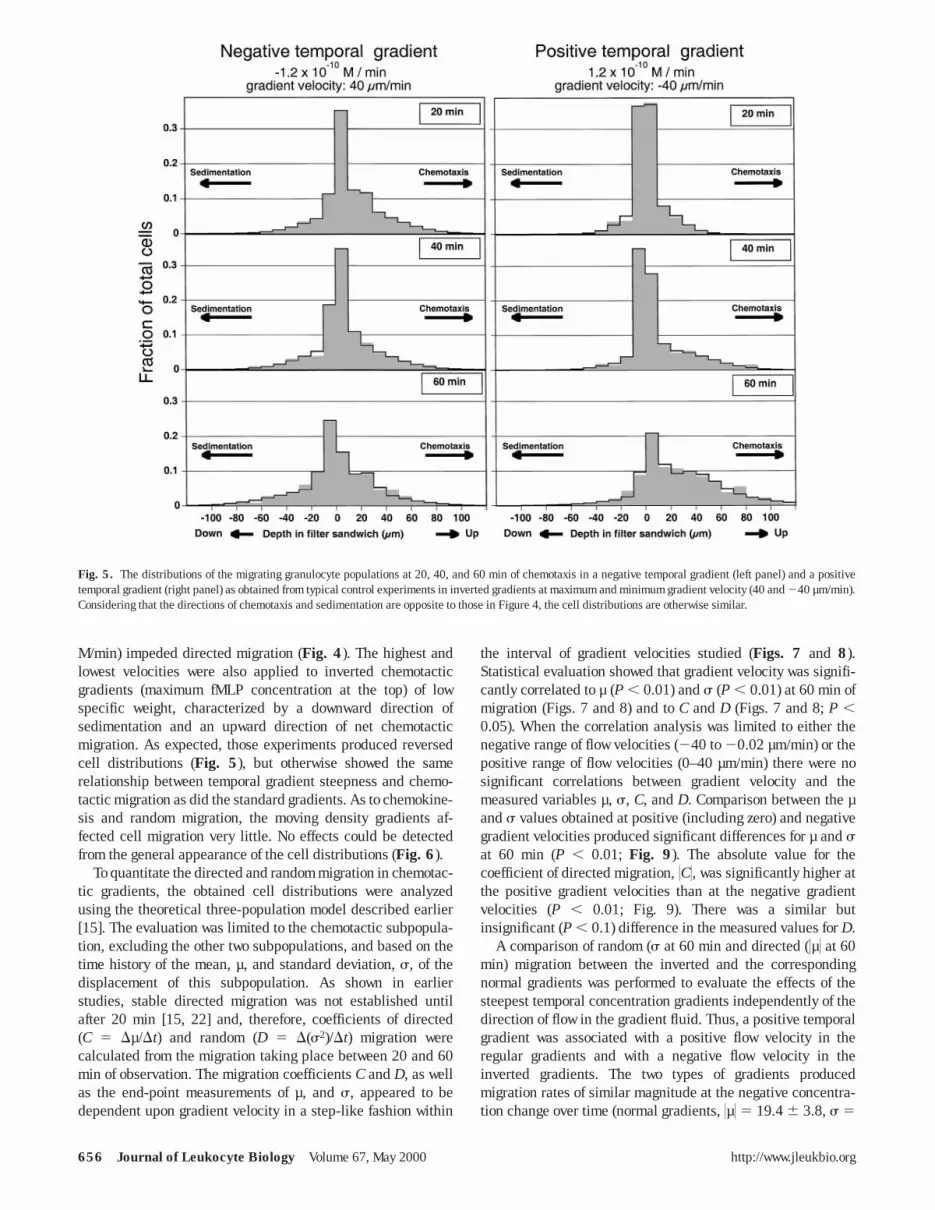
M/min) impeded directed migration (Fig. 4). The highest andlowest velocities were also applied to inverted chemotacticgradients (maximum fMLP concentration at the top) of lowspecific weight, characterized by a downward direction ofsedimentation and an upward direction of net chemotacticmigration. As expected, those experiments produced reversedcell distributions (Fig. 5), but otherwise showed the samerelationship between temporal gradient steepness and chemo-tactic migration as did the standard gradients. As to chemokine-sis and random migration, the moving density gradients af-fected cell migration very little. No effects could be detectedfrom the general appearance of the cell distributions (Fig. 6).
To quantitate the directed and random migration in chemotac-tic gradients, the obtained cell distributions were analyzedusing the theoretical three-population model described earlier[15]. The evaluation was limited to the chemotactic subpopula-tion, excluding the other two subpopulations, and based on thetime history of the mean, µ, and standard deviation, s, of thedisplacement of this subpopulation. As shown in earlierstudies, stable directed migration was not established untilafter 20 min [15, 22] and, therefore, coefficients of directed(C 5 Dµ/Dt) and random (D 5 D(s2)/Dt) migration werecalculated from the migration taking place between 20 and 60min of observation. The migration coefficients C and D, as wellas the end-point measurements of µ, and s, appeared to bedependent upon gradient velocity in a step-like fashion within
the interval of gradient velocities studied (Figs. 7 and 8).Statistical evaluation showed that gradient velocity was signifi-cantly correlated to µ (P , 0.01) and s (P , 0.01) at 60 min ofmigration (Figs. 7 and 8) and to C and D (Figs. 7 and 8; P ,0.05). When the correlation analysis was limited to either thenegative range of flow velocities (240 to 20.02 µm/min) or thepositive range of flow velocities (0–40 µm/min) there were nosignificant correlations between gradient velocity and themeasured variables µ, s, C, and D. Comparison between the µand s values obtained at positive (including zero) and negativegradient velocities produced significant differences for µ and sat 60 min (P , 0.01; Fig. 9). The absolute value for thecoefficient of directed migration, 0C0, was significantly higher atthe positive gradient velocities than at the negative gradientvelocities (P , 0.01; Fig. 9). There was a similar butinsignificant (P , 0.1) difference in the measured values for D.
A comparison of random (s at 60 min and directed (0µ0 at 60min) migration between the inverted and the correspondingnormal gradients was performed to evaluate the effects of thesteepest temporal concentration gradients independently of thedirection of flow in the gradient fluid. Thus, a positive temporalgradient was associated with a positive flow velocity in theregular gradients and with a negative flow velocity in theinverted gradients. The two types of gradients producedmigration rates of similar magnitude at the negative concentra-tion change over time (normal gradients, 0µ0 5 19.4 6 3.8, s 5
Fig. 5. The distributions of the migrating granulocyte populations at 20, 40, and 60 min of chemotaxis in a negative temporal gradient (left panel) and a positivetemporal gradient (right panel) as obtained from typical control experiments in inverted gradients at maximum and minimum gradient velocity (40 and 240 µm/min).Considering that the directions of chemotaxis and sedimentation are opposite to those in Figure 4, the cell distributions are otherwise similar.
656 Journal of Leukocyte Biology Volume 67, May 2000 http://www.jleukbio.org

21.2 6 3.0; inverted gradients, 0µ0 5 18.9 6 3.4, s 5 13.9 66.2) and the positive concentration change over time (normalgradients, 0µ0 5 31.65 6 5.7, s 5 31.2 6 3.5; invertedgradients, 0µ0 5 31.1 6 4.9, s 5 47.6 6 2.6).
The effects of gradient flow velocity on chemokinesis werequantitated by applying the previously described two-population model [15] and calculating µ (sedimentation) and s(random migration) at 60 min for the mobile subpopulation atthe highest negative (240 µm/min) and positive (40 µm/min)gradient flow velocities. At a constant fMLP concentration of1028 M, µ was 24.2 6 0.7 µm and 22.0 6 3.6 µm and s was25.5 6 2.6 µm and 27.2 6 3.1 µm at 240 µm/min and 40µm/min, respectively. Random migration at 0 M fMLP showedcharacteristics that were very similar to those of chemokinesis.
DISCUSSION
The present data show that gradient velocity significantlyaffected chemotaxis and also strongly support the hypothesisthat this effect was due to the concentration changes over timecreated by the moving gradients. Negative temporal gradientssignificantly reduced the rates of directed and random migra-tion (Fig. 9) compared with positive temporal gradients. Thequantitative relationship between temporal gradient steepnessand cell migration had a step-like appearance, which was
supported by a strongly significant overall correlation and alack of correlations in the positive and negative portions of thegradient velocity interval.
Despite a great number of control experiments, the complex-ity of the experimental model requires some consideration ofthe mechanisms possibly involved in the generation of thepresent results. The temporal effect created by moving thegradients was experimentally evaluated only on a macroscopicscale. It is not possible, by any technique known to us, to obtainhigh-resolution data on the convection-diffusion patterns pre-vailing in the filter mesh. Thus, the local concentrationgradients perceived by the cells could not be characterized.However, radiographic studies [19] have indicated that theconcentration profiles of moving gradients are not significantlyaltered on the macroscopic level by a passage through the filtersandwich. Visual inspection of stained moving gradients hasshown that the gradient zone moves as a virtually flat disc in thefluid. Hence, from the consequences of mass conservation,there is an overall temporal gradient in the filter while thegradient is moving. The microscopic flow patterns in the filtermesh necessarily create local gradients in the flow channels ofthe filter but those are counteracted by the actions of diffusion,which tend to equalize any local concentration differences. Therelative importance of diffusion and convection is impossible toestimate because there are no available methods to model theflow of a density gradient in a geometry as complex as that of the
Fig. 6. The distributions of the migrating granulocyte populations at 20, 40, and 60 min of chemokinesis at a constant concentration of 1028 M fMLP in densitygradients moving at 40 µm/min upward (left panel) and downward (right panel), as obtained from typical control experiments. The similarity between the celldistributions indicate that the movement of the density gradient at velocities that modify chemotaxis does not significantly affect chemokinesis.
Ebrahimzadeh et al. Chemotaxis in moving gradients 657

filter mesh. Consequently, the cells may have perceivedvariable local gradients in addition to the global temporalgradient that was intentionally created. Nevertheless, the mostplausible explanation for the effects of gradient velocity is thatthe macroscopic temporal concentration gradient also waspresent on the microscopic level.
The experimental design was created in order to furthersupport the assumption that the gradients were preservedduring the filter passage. When a negative gradient velocity wasused, the gradient had to be rapidly moved up through the filterin the beginning of the experiment to allow the slowerdownward movement during the experiment. This procedurebiased the experiments because only the negative temporalgradients were subjected to this extra filter passage. The use ofinverted gradients eliminated this bias because in this case thepositive temporal gradients were preceded by an extra filterpassage. This set-up also excluded any hypothetical effects ofthe shear stress transmitted to the cells from the movinggradient fluid (Figs. 4 and 5).
It is well established that the motor dose response to fMLP isbiphasic, reaching a maximum between 1029 and 1028 M[23–25]. Thus, at the higher negative and positive velocities,the cells were exposed to sub-optimal fMLP concentrations
during part of the migration time. This effect was, however,independent of the direction of gradient movement becausecare was taken to choose the starting points in the gradientssuch that the cells were in level with the gradient midpoint(fMLP concentration 1028 M) halfway through the experiment.The dose response has been described as a varying size of thechemotactically active cell population in combination with avarying migration rate [17, 23–26]. Because the difference infMLP concentration over the entire filter sandwich (240-µmthick) did not exceed 0.12 3 1028
M, the concentrationdifference over a single subpopulation of cells was 0.05 3 1028
M at the most. Consequently, the fMLP dose-response effectcreated by the spatial gradient should be negligible.
The present analysis is based on the previously publishedsubpopulation model [15]. When published, the model was notformally validated. Two recent studies have been devoted to theevaluation of its validity. The presence of three subpopulationsamong neutrophils migrating in chemotactic gradients of fMLPhas been supported statistically by the use of epidemiologicaltechniques for mixture distribution analysis [27] in anotherstudy [Afzal et al., unpublished results]. The normal distribu-tion, as an approximation of the distribution of migrating cells,has been compared with distributions obtained from computer
Fig. 7. Measured values for mean displacement, µ, of the chemotacticsubpopulation of neutrophils after 60 min in different gradient velocities (toppanel). The corresponding coefficient of convective (directed) migration, 0C0,was calculated from the increase of mean displacement between 20 and 60 min(bottom panel) and expressed in relation to the estimated temporal gradients(calculated from gradient velocity and spatial steepness). Error bars representSEM. The rate of directed migration (0C0) was significantly correlated to gradientvelocity.
Fig. 8. Measured values for the standard deviation, s, of the displacement ofthe chemotactic subpopulation of neutrophils after 60 min in different gradientvelocities (top panel). The corresponding coefficient of diffusive (random)migration, D, was calculated from the increase of the displacement standarddeviation between 20 and 60 min (bottom panel) and expressed in relation tothe estimated temporal gradients (calculated from gradient velocity andgradient spatial steepness). Error bars represent SEM. The rate of randommigration (D) was significantly correlated to gradient velocity.
658 Journal of Leukocyte Biology Volume 67, May 2000 http://www.jleukbio.org

simulations of an earlier accepted model for chemotaxis [17]and the differences have been demonstrated to be severalorders smaller than the experimental errors in any in vitrosystem for migration studies [unpublished results]. Thus, thetheoretical model should be valid beyond reasonable doubt andshould not produce significant systematic errors in the datagenerated.
The temporal gradient affected both directed and randommigration, leading to higher values for µ and s in positivetemporal gradients. The increase of s may suggest that the cellsorient less efficiently in the up-gradient direction in positivetemporal gradients. However, s increases also at zero gradientvelocity and earlier studies have shown that this increase islinear over time [22], unlike the s increase during true randommigration, which is proportional to the square root of time. Thiseffect probably reflects a slight variation in orientation or speedamong the chemotactic subpopulation and, if so, it could beexpected to be proportional to the increase over time of µ.Consequently, the present data may be explained purely on thebasis of an increased average migration speed of the chemotac-tic cells at positive temporal gradients, although any effects oncell orientation cannot be excluded.
A temporal gradient, as seen by the neutrophils, is alsocreated by the migration through a spatial gradient. In this way,the temporal gradient may constitute a positive feedback signal
that maintains migration. The present data may explain thefindings by Vickers et al. [3, 4] that a temporal gradient wasrequired to induce chemotaxis. Assuming that their gradientswere too shallow to produce a sufficient temporal gradient whenthe cells moved forward, the necessary signal to maintain thechemotactic migration was missing and the cells stopped. Theinitial build-up of the gradient that induced cell migration thencorresponded to the present study where the moving gradientsincreased the velocity of the migrating cells. Unfortunately, thepresence of a temporal gradient was combined with an in-creased steepness of the spatial gradient in their experimentalmodel [5], which complicates the interpretation of the initialchemotactic response [4].
The quantitative relationship between gradient velocity andcell migration rate in this study (Fig. 7) suggests that a negativegradient velocity of 25 µm/min could inhibit directed migra-tion more or less completely. If the cells require a positivetemporal gradient to continue migrating, only cells that are ableto overcome the prevailing negative gradient velocity would beable to maintain their migration in a negative temporal gradient.Thus, the present data may imply that the maximum cell speedin the present model is 5 µm/min. This cell speed is well belowthe observed maximum migration speed of 7–20 µm/min in vitro[7, 28], although it is somewhat higher than the highest averagemigration speeds (C < 2 µm/min) observed in our filterchamber. Cell speed, however, depends on the physical charac-teristics of the matrix surrounding the cells and migration infilters is three to four times slower than migration on surfaces[Afzal et al., unpublished results]. The complicated geometry ofthe mesh filters probably imposes restrictions on the move-ments of the migrating cells. The diameters of cells that migratethrough the filters is larger than the nominal pore size,suggesting that the filter mesh is deformed by the penetratingcells [22]. In addition, the fraction of cells that show a verticalpolarization is slightly larger than what could be expected fromtheory [22]. The quantitative effects of the filter mesh on thedistributions of migrating cells are, however, not possible toestimate because no data on the local movements of individualcells are available. In both experimental systems, maximumlocal cell speed is probably higher than average populationmigration speed. On surfaces we have measured ratios of 5–10of maximum local cell speed in relation to average migrationspeed [unpublished observations]. This difference is due tovariations over time in speed and direction of the migratingcells. The variations in direction account for a two-to threefoldsmaller average population migration speed in relation to theaverage local speed of the cells.
If it is assumed that the relation between average local cellspeed and the average speed of population migration in filters issimilar to that measured on surfaces the average local cellspeed in filters may be equal to the lowest speed (5 µm/min)required for a negative temporal gradient in order to inhibit cellmigration. If so, the present data support the hypothesis that thecells require a positive temporal gradient to maintain chemotac-tic migration.
The relationship between the steepness of the temporalgradient and the rate of cell migration has a step-like appear-ance characterized by a steep change in cell migration rate over
Fig. 9. Comparison of the measured coefficients of directed, 0C0, and random,D, migration (20–60 min of migration) and the values for absolute mean, 0µ0, andstandard deviation, s, at 60 min of the chemotactic subpopulation ofneutrophils in positive temporal gradients (positive or zero gradient velocities)and negative temporal gradients (negative gradient velocities). Bars representmean 6 SEM and asterisks denote differences, significant on the 1% level.
Ebrahimzadeh et al. Chemotaxis in moving gradients 659

the range of gradient velocities that lies within the velocityinterval of migrating leukocytes. Due to the resolution of theexperimental model it is, however, impossible to furthercharacterize the quantitative relationship between gradientvelocity and cell migration velocity in this narrow range.Further development of the experimental technique is requiredto address this interesting issue.
As shown by an earlier study [15], an immobile chemotacticgradient induces a rapid, initial scattering of the cell popula-tion, followed by a well-controlled chemotactic migration withlittle further scattering. Data from an earlier study suggest thatthe initial scattering mirrors a phenotypic transformation of thecells, during which they present a different, less efficientresponse to chemotactic stimulation [22]. The present dataindicate that the temporal gradient has very little impact on thecells during the initial phase, whereas during the followingphase of chemotactic migration, the cells are strongly affectedby concentration changes over time, requiring the presence of apositive temporal gradient to maintain chemotaxis.
In conclusion, this study suggests that a concentrationchange of chemotaxin over time may act as a positive feedbacksignal for cell migration, although it is not needed for theorientation of the cells in the up-gradient direction.
APPENDIX
The diffusive and convective changes over time of the chemotactic gradientswere calculated by solving the diffusion equation for radiographically deter-mined initial concentration profiles and diffusion coefficients. Experimentaldata have provided evidence that no detectable convection is present in densitygradients steeper than 0.001 kg/(L · mm). Outside such density gradients,convective transport leads to a rapid mixing of the gradient chamber fluid(optical recordings of spontaneous dye dilution indicate mixing correspondingto an ‘‘effusive’’ diffusion coefficient of 1 · 1026 m2/s). Therefore, inside thedensity gradient [at gradient steepnesses above 0.001 kg/(L · mm)] onlydiffusion was modeled and outside the density gradient [at gradient steepnessesabove 0.001 kg/(L · mm)] only convection was modeled. The rate of diffusionwas determined by an estimated diffusion coefficient, Da, of 1.2 · 1029 m2/s(obtained from radiographic recordings of 35S-methionine labeled densitygradients) and the rate of convection (effusive diffusion) was assumed to beinfinite. The chamber was thus modeled as one diffusive compartment flankedby two convective compartments.
The general diffusion equation was defined as:
J 5 Da
da
dx
where J is the flux of chemotaxin per unit cross-sectional area [in moles(s · m2)]and a(t,x) is the chemotaxin concentration developing over time, t, from theinitial concentration profile a(0,x), available as discrete values for a.
In the diffusive compartment the time history of the chemotaxin concentra-tion was defined as:
da
dt5
dJ
dx5 Da
d2a
dx2
In the upper and lower convective compartments the time history of thechemotaxin concentration was defined as:
lower compartment:da
dt5
J
l5
Da
l
da
dx
upper compartment:da
dt5
2J
l5
Da
l
2da
dx
where l is the length (along the x-axis) of the compartment (10 mm for the lowercompartment and 16 mm for the upper compartment).
The equations were discretized in space (Dx 5 0.2 mm) to form a system of30 ordinary differential equations, the first and the last representing theconvective compartments and the interjacent equations representing thediffusive compartment. The system was formalized as:
A1 5 3Da
lDx0 · · · 0
0Da
(Dx)2· · · 0
······
······
0 0 · · ·Da
lDx
4A2 5 3
21 1 0 0 · · · 0 0
1 22 1 0 · · · 0 0
0 1 22 1 · · · 0 0
······
······
···
0 0 0 0 · · · 1 21
4A 5 A1 3 A2
Y8 5 AY
where Y8 < da/dt and Y < a(t,x).The system of equations was solved, using an implicit algorithm for the
solution of ODEs in the lsode software package (available from http://www.netlib.org/odepack/).
ACKNOWLEDGMENTS
This study was supported by grants from the Swedish MedicalResearch Council (00663 and K97 12X) and Wilhelm andMartina Lundgrens research foundation.
REFERENCES
1. Haston, W. S., Wilkinson, P. C. (1988) Locomotion and chemotaxis ofleukocytes: gradient perception and locomotor capacity. Curr. Opin.Immunol. 1, 5–9.
2. Zigmond, S. H., Levitsky, H. I., Kreel, B. J. (1981) Cell polarity: Anexamination of its behavioral expression and its consequences for polymor-phonuclear leukocyte chemotaxis. J. Cell Biol. 89, 585–592.
3. Vicker, M. G. (1981) Ideal and non-ideal concentration gradient propaga-tion in chemotaxis studies. Exp. Cell Res. 136, 91–100.
4. Vicker, M. G., Lackie, J. M., Schill, W. (1986) Neutrophil leucocytechemotaxis is not induced by a spatial gradient of chemoattractant. J. CellSci. 84, 263–280.
5. Lauffenburger, D., Farrell, B., Tranquillo, R., Kistler, A., Zigmond, S.(1987) Gradient perception by neutrophil leucocytes, continued. J. CellSci. 88, 415–416.
6. Zigmond, S. H. (1977) Ability of polymorphonuclear leukocytes to orient ingradients of chemotactic factors. J. Cell Biol. 75, 606–616.
7. Dunn, G. A., Zicha, D. (1993) Long-term chemotaxis of neutrophils instable gradients: preliminary evidence of periodic behaviour. Blood Cells19, 25–41.
8. Gallin, J. I., Seligmann, B. E., Fletcher, M. P. (1983) Dynamics of humanneutrophil receptors for the chemoattractant fmet-leu-phe. Agents Actions(Suppl.) 12, 290–308.
9. Sklar, L. A., Jesaitis, A. J., Painter, R. G., Cochrane, C. G. (1981) Thekinetics of neutrophil activation. The response to chemotactic peptidesdepends upon whether ligand-receptor interaction is rate-limiting. J. Biol.Chem. 256, 9909–9914.
660 Journal of Leukocyte Biology Volume 67, May 2000 http://www.jleukbio.org

10. Karlsson, C., Nygren, H., Braide, M. (1996) Exposure of blood tobiomaterial surfaces liberates substances that activate PMNGs. J. Lab.Clin. Med. 128, 1–10.
11. Stossel, T. P., Hartwig, J. H., Yin, H. L., Southwick, F. S., Zaner, K. S.(1984) The motor of leukocytes. Federation Proc. 43, 2760–2763.
12. Lofgren, R., Ng Sikorski, J., Sjolander, A., Andersson, T. (1993) Beta 2integrin engagement triggers actin polymerization and phosphatidylinositoltrisphosphate formation in non-adherent human neutrophils. J. Cell Biol.123, 1597–1605.
13. Snyderman, R., Uhing, R. J. (1992) Chemoattractant stimulus-responsecoupling. In Inflammation: Basic Principles and Clinical Correlates (J. I.Gallin, I. M. Goldstein, and R. Snyderman, eds.), New York: Raven Press,421–439.
14. Albrecht, E., Petty, H. R. (1998) Cellular memory: neutrophil orientationreverses during temporally decreasing chemoattractant concentrations.Proc. Natl. Acad. Sci. USA 95, 5039–5044.
15. Ebrahimzadeh, R., Bazargani, F., Afzal, F., Hogfors, C., Braide, M. (1996)A subpopulation analysis of fMLP stimulated granulocytes, migrating infilters. Biorheology 33, 231–250.
16. Reif, F. (1965) Fundamentals of Statistical and Thermal Physics. NewYork: McGraw-Hill.
17. Buettner, H. M., Lauffenburger, D. A., Zigmond, S. H. (1989) Measurementof leukocyte motility and chemotaxis parameters with the Millipore filterassay. J. Immunol. Meth. 123, 25–37.
18. Alt, W. (1980) Biased random walk models for chemotaxis and relateddiffusion approximations. J. Math. Biol. 9, 147–177.
19. Braide, M., Ebrahimzadeh, P. R., Strid, K. G., Bjursten, L. M. (1994)Migration of human granulocytes in filters: Effects of gravity and movablegradients of fMLP. Biorheology 31, 617–630.
20. Braide, M., Bjursten, L. M. (1986) Optimized density gradient separation ofleukocyte fractions from whole blood by adjustment of osmolarity. J.Immunol. Meth. 93, 183–191.
21. Wilkinson, P. C. (1974) Chemotaxis and Inflammation. Edinburgh, UK:Churchill-Livingstone.
22. Ebrahimzadeh, P. R., Braide, M. (1999) The initiation of the neutrophilchemotactic response in filters. J. Leukoc. Biol. 66, 90–94.
23. Kawaoka, E. J., Miller, M. E., Cheung, A. T. (1981) Chemotacticfactor-induced effects upon deformability of human polymorphonuclearleukocytes. J. Clin. Immunol. 1, 41–44.
24. Zigmond, S. H. (1981) Consequences of chemotactic peptide receptormodulation for leukocyte orientation. J. Cell Biol. 88, 644–647.
25. Shields, J. M., Haston, W. S. (1985) Behaviour of neutrophil leucocytes inuniform concentrations of chemotactic factors: contraction waves, cellpolarity and persistence. J. Cell Sci. 74, 75–93.
26. Sherratt, J. A., Sage, E. H., Murray, J. D. (1993) Chemical control ofeukaryotic cell movement: a new model. J. Theor. Biol. 162, 23–40.
27. Schork, N. J., Weder, A. B., Schork, M. A., Bassett, D. R., Julius, S. (1990)Disease entities, mixed multi-normal distributions, and the role of thehyperkinetic state in the pathogenesis of hypertension. Stat. Med. 9,301–314.
28. Skierczynski, B. A., Usami, S., Chien, S., Skalak, R. (1993) Active motionof polymorphonuclear leukocytes in response to chemoattractant in amicropipette. J. Biomech. Eng. 115, 503–509.
Ebrahimzadeh et al. Chemotaxis in moving gradients 661