a general method for patterning gradients of biomolecules on surfaces using microfluidic networks
TRANSCRIPT

A General Method for Patterning Gradients ofBiomolecules on Surfaces Using MicrofluidicNetworks
Xingyu Jiang,† Qiaobing Xu,† Stephan K. W. Dertinger,† Abraham D. Stroock,† Tzung-may Fu,‡ andGeorge M. Whitesides*,†
Department of Chemistry and Chemical Biology, 12 Oxford Street, Cambridge, Massachusetts 02138, and Department ofEarth and Planetary Sciences, Harvard University, 20 Oxford Street, Cambridge, Massachusetts 02138
This report outlines a general method for the fabricationof immobilized gradients of biomolecules on surfaces.This method utilizes a microfluidic network that generatesa gradient of avidin in solution and immobilizes thisprotein on the surface of glass or poly(dimethylsiloxane)by physical adsorption. The immobilized gradient of avidinis then translated into gradients of biotinylated ligands(e.g., small molecules, oligomers of DNA, polysaccha-rides) using the specific interaction between biotin andavidin. This method can also generate immobilized gra-dients of certain proteins and artificial polymers by adirect transfer of gradients from solution onto the surface.The major advantage of this method is that almost any typeof molecule can, in principle, be immobilized in a well-defined surface gradient of arbitrary shape with dimen-sions of a few micrometers to a few centimeters. It ispossible to tailor the precise shapes of gradients onsurfaces from gradients in solution, either kinetically orcompetitively. Kinetic methods rely on controlling the timethat the surface is exposed to the gradient in solution:when a single protein adsorbs from solution, the amountthat adsorbs depends both on its concentration in solutionand on the time allowed for adsorption. Competitivemethods rely on exposure of the surface to a complemen-tary gradient of two proteins in solution (In these experi-ments, the sum of the concentrations of the proteins insolution is independent of positions although the concen-tration of each, individually, depends on the position. Inthis procedure, the relative amount of each protein, atsaturation on the surface, depends only on its concentra-tion.)
This paper describes a general method for generating gradientsof immobilized molecules on surfaces by adsorption from gradi-ents in solution. These gradients are generated using microfluidicdevices described previously;1-5 the gradients can have dimen-sions from micrometers to centimeters.1 We (and others) have
published several techniques that generate gradients in solutionbased on these devices.1-4
Gradients of immobilized biomolecules on surfaces can influ-ence the function and development of cells.6-8 While simplegradients of diffusible substances (in solutions) are experimentallyaccessible on scales down to micrometers by pipetting,9 thefabrication of immobilized gradients (that is, gradients on surfaces)has been a technical challenge. Techniques that generate im-mobilized gradients by retarded diffusion of substances,10,11 orelectrochemical desorption of self-assembled monolayers (SAMs),12
lack the flexibility to fabricate gradients having complex shapesand are difficult to use at the micrometer scale (the scale ofdimensions required for many biological processes). Photoimmo-bilization on SAMs gives gradients with high resolution, and canbe used to fabricate gradients in arbitrary shapes, but usuallyrequires organic synthesis and repeated use of the clean room,and is thus less useful to biologists than relatively simplermethods.13,14
This paper describes a technique that can generate im-mobilized gradients of many kinds of biologically relevant mol-ecules in various shapes, by using a two-step process: (i)patterning of immobilized gradients of avidin using microfluidicsystems and (ii) recognition of derivatives of biotin by immobilized
* To whom correspondence should be addressed. E-mail:[email protected].
† Department of Chemistry and Chemical Biology.‡ Department of Earth and Planetary Sciences.
(1) Jeon, N. L.; Dertinger, S. K. W.; Chiu, D. T.; Choi, I. S.; Stroock, A. D.;Whitesides, G. M. Langmuir 2000, 16, 8311-8316.
(2) Jeon, N. L.; Baskaran, H.; Dertinger, S. K. W.; Whitesides, G. M.; Van DeWater, L.; Toner, M. Nat. Biotechnol. 2002, 20, 826-830.
(3) Lin, F.; Nguyen, C. M.-C.; Wang, S.-J.; Saadi, W.; Gross, S. P.; Jeon, N. L.Biochem. Biophys. Res. Commun. 2004, 319, 576-581.
(4) Dertinger, S. K. W.; Chiu, D. T.; Jeon, N. L.; Whitesides, G. M. Anal. Chem.2001, 73, 1240-1246.
(5) Lin, F.; Saadi, W.; Rhee, S. W.; Wang, S. J.; Mittal, S.; Jeon, N. L. Lab Chip2004, 4, 164-167.
(6) Dertinger, S. K. W.; Jiang, X.; Li, Z.; Murthy, V. N.; Whitesides, G. M. Proc.Natl. Acad. Sci. U.S.A. 2002, 99, 12542-12547.
(7) Hiramoto, M.; Hiromi, Y.; Giniger, E.; Hotta, Y. Nature 2000, 406, 886-889.
(8) Ruardy, T. G.; Schakenraad, J. M.; vander Mei, H. C.; Busscher, H. J. Surf.Sci. Rep. 1997, 29, 3-30.
(9) Block, S. M.; Segall, J. E.; Berg, H. C. Cell 1982, 31, 215-226.(10) Chaudhury, M. K.; Whitesides, G. M. Science 1992, 255, 1230-1232.(11) Smith, J. T.; Tomfohr, J. K.; Wells, M. C.; Beebe, T. P.; Kepler, T. B.; Reichert,
W. M. Langmuir 2004, 20, 8279-8286.(12) Terrill, R. H.; Balss, K. M.; Zhang, Y.; Bohn, P. W. J. Am. Chem. Soc. 2000,
122, 988-989.(13) Herbert, C. B.; McLernon, T. L.; Hypolite, C. L.; Adams, D. N.; Pikus, L.;
Huang, C. C.; Fields, G. B.; Letourneau, P. C.; Distefano, M. D.; Hu, W.-S.Chem. Biol. 1997, 4, 731-737.
(14) Dillmore, W. S.; Yousaf, M. N.; Mrksich, M. Langmuir 2004, 20, 7223-7231.
Anal. Chem. 2005, 77, 2338-2347
2338 Analytical Chemistry, Vol. 77, No. 8, April 15, 2005 10.1021/ac048440m CCC: $30.25 © 2005 American Chemical SocietyPublished on Web 03/05/2005

avidin. The generation, in solution, of gradients in solutionspanning dimensions of a few micrometers to a few centimetersessentially involves mixing two different solutions in a microfluidicnetwork (µFN) and repeatedly splitting and recombining thesestreams according to well-defined designs, to generate gradients(as a series of steps in concentration).1,4 We can transfer thisgradient in solution to a gradient on surfaces by adsorption. Whenone of the streams is a solution of avidin, and the other stream iseither phosphate-buffered saline (PBS) or a second protein suchas bovine serum albumin (BSA), this procedure generates agradient of avidin immobilized by physical (noncovalent) adsorp-tion on the surface. We can immobilize ligands that have beenbiotinylated, using irreversible recognition and binding of biotinby avidin, to generate the gradients of desired molecules.
We incorporated several chaotic advective mixers (CAMs) intothe µFN.15 The combination of these CAMs, and a folded designof the µFN, made it possible to have a microfluidic device withsmall dimensions (∼2 × 5 cm). Fabrication of a CAM, however,requires two levels of photolithography, and this level of technol-ogy may be inconvenient for some biochemists. The same resultscan be obtained by using a µFN that does not incorporate theCAM, a simpler design of network that requires only one level ofphotolithography.1-4
EXPERIMENTAL SECTIONSource of Materials. All materials commercially obtained
were used as received. Poly(dimethylsiloxane) (PDMS) prepoly-mer (Sylgard 184), SU-8, and silicon wafers (test grade) werepurchased from Dow Corning (Midland, MI), MicroChem Corp.(Newton, MA), and Silicon Sense (Nashua, NH). Dextran-fluorescein-biotin conjugates were from Molecular Probes(www.probes.com). All other reagents were purchased fromSigma-Aldrich (www. sigmaaldrich.com).
Fabrication of Masters by Photolithography. Fabricationof the two-step features that contain the microchannels (first step)with the CAM (second step) followed a published protocol.15
Designs for channel systems were generated in a CAD program(Freehand 10.0, Macromedia, San Francisco, CA). The designsfor the microchannels and CAMs were printed on separate masks,with registration marks for alignment. High-resolution (5000 dpi)transparencies were produced by a commercial printer (Page-works Prepress Output, Cambridge, MA) from the CAD files.
Negative photoresist (SU-8 10) was spin-coated (∼1500 rpm,15s) on a silicon wafer and baked to drive off solvent (105 °C, 5min).16,17 We performed photolithography on the photoresist withthe transparency film as the first photomask (carrying the featurefor the microchannels, ∼30-s exposure time) to generate features∼50 µm high. This process generated the structures of thechannels. After baking at 105 °C for 5 min, another layer offeatures ∼50 µm high was generated by spin coating and bakedunder the same conditions as the first layer. We aligned thesecond mask, which carried the features of the CAM, with thealignment marks generated on the first layer of photoresist (thefeatures on this layer became visible after the second step of
baking) under a microscope attached to the mask aligner andperformed photolithography. This procedure generated the CAMson top of the microchannels. After postbaking (105 °C, 2 min),we developed the microfeatures on the silicon wafer in 1-methoxy-2-propanol acetate to remove the unexposed areas of the photo-resist. The surface of the SU-8 master was exposed to a vapor ofperfluoro-1,1,2,2-tetrahydrooctyltrichlorosilane (United ChemicalTechnologies, www.unitedchem.com) in a vacuum desiccator for∼2 h to prevent the adhesion of the PDMS to the silicon wafer.
The surfaces of the replica of PDMS with embossed µFN anda clean glass slide (both were sonicated in soapy water for 5 min,then washed with distilled water, and dried under a stream ofnitrogen) were oxidized in an air plasma (∼2 Torr, 60 s, 1000 W,Harrick Scientific, Ossining, NY) and brought into contact.18,19 Itis important to thoroughly clean the surfaces of the PDMS beforeoxidation. In case the sealing repetitively fails, extraction of PDMSwith organic solvents improves the rate of success in the sealingprocess.18 The two adhered to one another irreversibly to generatethe closed channels. Once the closed channels had formed, wepassed an aqueous solution of PBS through them immediately.When the entire assembly was under distilled water, the walls ofthe microchannels remained hydrophilic for a few days.
Microfluidics. The solutions of proteins were pumped throughthe µFN using syringe pumps or gravity. The rates of pumpingwere ∼20 µL min-1 in most experiments. The concentration ofall proteins (avidin, laminin, fibronectin) was 20 µg mL-1; poly-lysine was 20 µg mL-1. Immediately after the formation of thegradient of avidin on the surface, we incubated the µFN with BSAfor 2 h at room temperature. We then incubated biotin orbiotinylated reagents (oligo DNA and dextran, all used at 1 µg/mL) in the µFN for 1 h and visualized the sample underfluorescence microscopy with a Hamamatsu camera (ORCA ER).We fabricated gradients of polymers directly, the same way thatwe fabricated the gradient of avidin.
Microcontact Printing. We coated glass slides for microcon-tact printing with titanium (2 nm) and gold (20 nm) in an e-beamevaporator. We “inked” a PDMS stamp with desired features in a2 mM solution of HS(CH2)15CH3 in ethanol. The stamp was driedby a stream of compressed air and brought in contact with thegold surface to form the first SAM. The substrate of glass slidewas then incubated with HS(CH2)11(CH2CH2O)3OH (2 mM, inethanol) for 12 h. The opaque protective box (4 × 6 × 2 cm)used for protection of the SAMs in air plasma treatment was madeby adding iron(II, III) oxide (∼100 µm) in the prepolymer ofPDMS.
SIMULATIONS OF ADSORPTION OF PROTEINSWe fabricated gradients of proteins on surfaces by transferring
gradients in solution onto the surface by physical adsorption.There are two strategies for transferring gradients from solutionto the surface: (i) The first uses a gradient of protein in a solutionof noncompeting buffer (e.g., PBS). In this protocol, the amountof protein deposited on the surface depends on the concentrationin solution and the time of contact between the solution and thesurface (Figure 1). (ii) The second involves transferring proteinsfrom a competing gradient of two proteins in solution in which(15) Stroock, A. D.; Dertinger, S. K.; Ajdari, A.; Mezic, I.; Stone, H. A.; Whitesides,
G. M. Science 2002, 295, 647-651.(16) Linder, V.; Wu, H.; Jiang, X.; Whitesides, G. M. Anal. Chem. 2003, 75,
2522-2527.(17) Xia, Y.; Whitesides, G. M. Angew. Chem.-Int. Ed. 1998, 37, 550-575.
(18) Lee, J. N.; Park, C.; Whitesides, G. M. Anal. Chem. 2003, 75, 6544-6554.(19) Ng, J. M. K.; Gitlin, I.; Stroock, A. D.; Whitesides, G. M. Electrophoresis
2002, 23, 3461-3473.
Analytical Chemistry, Vol. 77, No. 8, April 15, 2005 2339
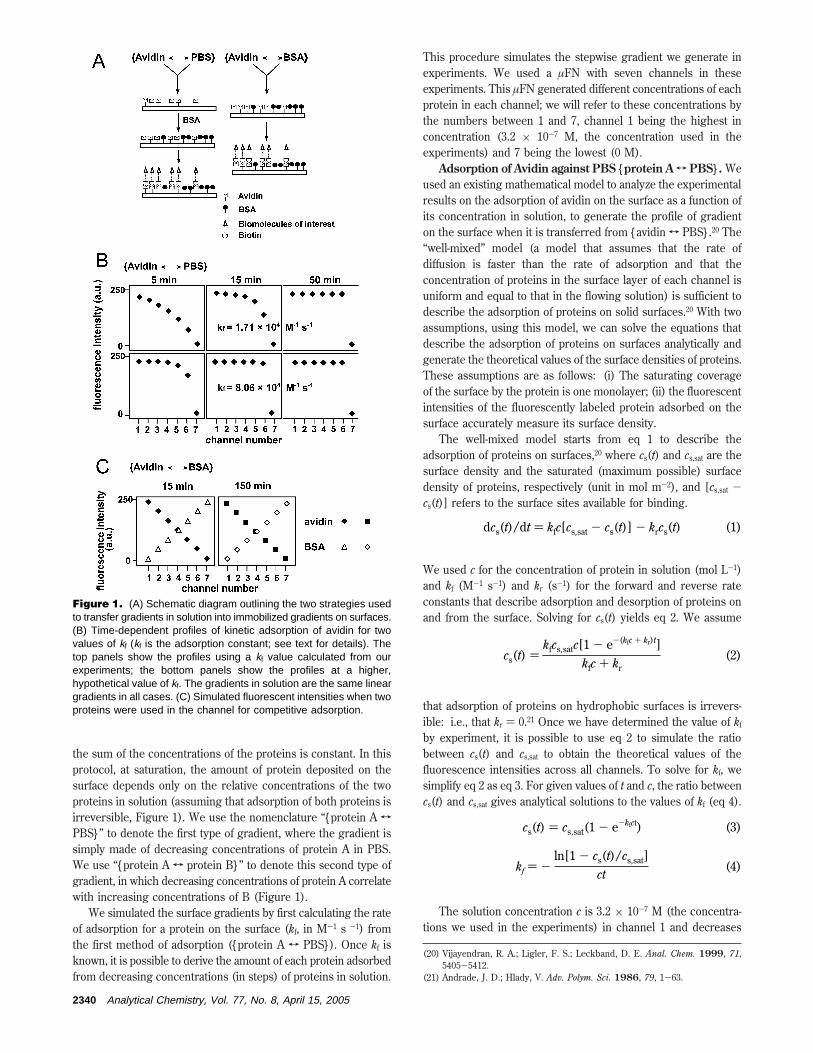
the sum of the concentrations of the proteins is constant. In thisprotocol, at saturation, the amount of protein deposited on thesurface depends only on the relative concentrations of the twoproteins in solution (assuming that adsorption of both proteins isirreversible, Figure 1). We use the nomenclature “{protein A T
PBS}” to denote the first type of gradient, where the gradient issimply made of decreasing concentrations of protein A in PBS.We use “{protein A T protein B}” to denote this second type ofgradient, in which decreasing concentrations of protein A correlatewith increasing concentrations of B (Figure 1).
We simulated the surface gradients by first calculating the rateof adsorption for a protein on the surface (kf, in M-1 s -1) fromthe first method of adsorption ({protein A T PBS}). Once kf isknown, it is possible to derive the amount of each protein adsorbedfrom decreasing concentrations (in steps) of proteins in solution.
This procedure simulates the stepwise gradient we generate inexperiments. We used a µFN with seven channels in theseexperiments. This µFN generated different concentrations of eachprotein in each channel; we will refer to these concentrations bythe numbers between 1 and 7, channel 1 being the highest inconcentration (3.2 × 10⁻⁷ M, the concentration used in theexperiments) and 7 being the lowest (0 M).
Adsorption of Avidin against PBS {protein A T PBS}. Weused an existing mathematical model to analyze the experimentalresults on the adsorption of avidin on the surface as a function ofits concentration in solution, to generate the profile of gradienton the surface when it is transferred from {avidin T PBS}.20 The“well-mixed” model (a model that assumes that the rate ofdiffusion is faster than the rate of adsorption and that theconcentration of proteins in the surface layer of each channel isuniform and equal to that in the flowing solution) is sufficient todescribe the adsorption of proteins on solid surfaces.20 With twoassumptions, using this model, we can solve the equations thatdescribe the adsorption of proteins on surfaces analytically andgenerate the theoretical values of the surface densities of proteins.These assumptions are as follows: (i) The saturating coverageof the surface by the protein is one monolayer; (ii) the fluorescentintensities of the fluorescently labeled protein adsorbed on thesurface accurately measure its surface density.
The well-mixed model starts from eq 1 to describe theadsorption of proteins on surfaces,20 where cs(t) and cs,sat are thesurface density and the saturated (maximum possible) surfacedensity of proteins, respectively (unit in mol m-2), and [cs,sat -cs(t)] refers to the surface sites available for binding.
We used c for the concentration of protein in solution (mol L-1)and kf (M-1 s-1) and kr (s-1) for the forward and reverse rateconstants that describe adsorption and desorption of proteins onand from the surface. Solving for cs(t) yields eq 2. We assume
that adsorption of proteins on hydrophobic surfaces is irrevers-ible: i.e., that kr ) 0.21 Once we have determined the value of kf
by experiment, it is possible to use eq 2 to simulate the ratiobetween cs(t) and cs,sat to obtain the theoretical values of thefluorescence intensities across all channels. To solve for kf, wesimplify eq 2 as eq 3. For given values of t and c, the ratio betweencs(t) and cs,sat gives analytical solutions to the values of kf (eq 4).
The solution concentration c is 3.2 × 10⁻⁷ M (the concentra-tions we used in the experiments) in channel 1 and decreases
(20) Vijayendran, R. A.; Ligler, F. S.; Leckband, D. E. Anal. Chem. 1999, 71,5405-5412.
(21) Andrade, J. D.; Hlady, V. Adv. Polym. Sci. 1986, 79, 1-63.
Figure 1. (A) Schematic diagram outlining the two strategies usedto transfer gradients in solution into immobilized gradients on surfaces.(B) Time-dependent profiles of kinetic adsorption of avidin for twovalues of kf (kf is the adsorption constant; see text for details). Thetop panels show the profiles using a kf value calculated from ourexperiments; the bottom panels show the profiles at a higher,hypothetical value of kf. The gradients in solution are the same lineargradients in all cases. (C) Simulated fluorescent intensities when twoproteins were used in the channel for competitive adsorption.
dcs(t)/dt ) kfc[cs,sat - cs(t)] - krcs(t) (1)
cs(t) )kfcs,satc[1 - e-(kfc + kr)t]
kfc + kr(2)
cs(t) ) cs,sat(1 - e-kfct) (3)
kf ) -ln[1 - cs(t)/cs,sat]
ct(4)
2340 Analytical Chemistry, Vol. 77, No. 8, April 15, 2005
linearly (in steps) over seven channels. We know from experi-ments that the surfaces are not saturated at 5 min and mostlysaturated at 50 min (see the Results and Discussion section, Figure4). At 5 min, we cannot estimate the value of cs,sat (i.e., no channelgives saturating fluorescent intensities); at 50 min, there is nousable ratio between cs(t) and cs,sat (i.e., all channels but channel0 are saturated). Neither of these conditions allows us to solvefor kf analytically. At intermediate values of time (e.g., 15 min),some of the channels have unsaturated signals and some of thechannels have saturated signals; this condition allows us to solvefor kf.
Thus, for each c that gives rise to a cs(t) (t ) 15 min, the valuesof fluorescence intensities of all channels after the immobilizationof proteins) smaller than cs,sat, there is a unique solution of kf thatcan be calculated from eq 4. For channel 5, c ) 1.07 × 10⁻⁷ M, kf
) 1.82 × 10⁴ M-1 s-1; for channel 6, c ) 5.33 × 10⁻⁸ M, kf ) 1.60× 10⁴ M-1 s-1. These two values are reasonably close to eachother; this result validates our assumptions in the calculations.We therefore use the average of the two, as the kf ) 1.71 × 10⁴
M-1 s-1.Using values of kf obtained through this analytical procedure,
we solved for the cs(t) as a function of any values of c and t andthus generated expected values of fluorescence intensities for eachchannel. Figure 1B shows simulated results generated using thisprocedure for each channel. The surface densities of proteins areclearly dependent on the concentration of the proteins in solutionand on the time the solutions remain in contact with the surface.Control of the concentration, and the time allowed for adsorption,yields different profiles of gradients on the surface. For example,we can fabricate an approximately linear gradient if we maintain
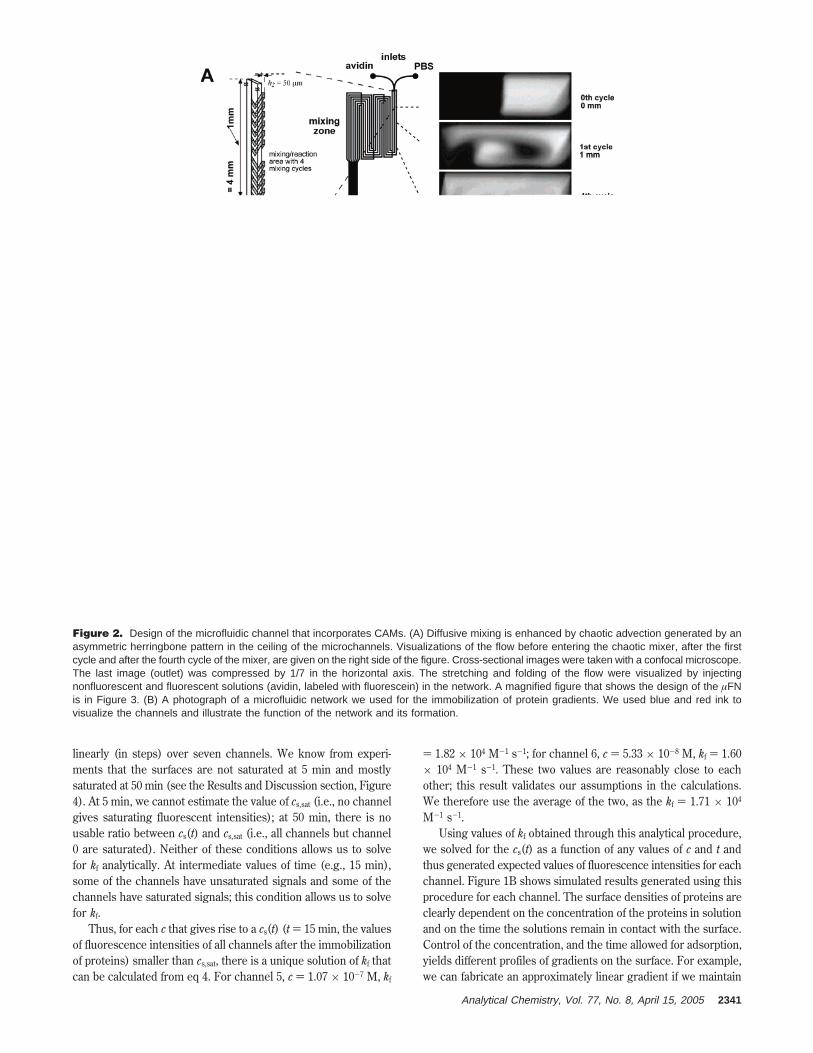
Figure 2. Design of the microfluidic channel that incorporates CAMs. (A) Diffusive mixing is enhanced by chaotic advection generated by anasymmetric herringbone pattern in the ceiling of the microchannels. Visualizations of the flow before entering the chaotic mixer, after the firstcycle and after the fourth cycle of the mixer, are given on the right side of the figure. Cross-sectional images were taken with a confocal microscope.The last image (outlet) was compressed by 1/7 in the horizontal axis. The stretching and folding of the flow were visualized by injectingnonfluorescent and fluorescent solutions (avidin, labeled with fluorescein) in the network. A magnified figure that shows the design of the µFNis in Figure 3. (B) A photograph of a microfluidic network we used for the immobilization of protein gradients. We used blue and red ink tovisualize the channels and illustrate the function of the network and its formation.
Analytical Chemistry, Vol. 77, No. 8, April 15, 2005 2341
the gradient in solution in contact with the surface for 5 min(Figure 1B).
Competitive Adsorption of Avidin against BSA {proteinA T protein B}. We next simulated the type of experiment inwhich a gradient of two proteins in solutions{avidin T BSA}s
generated a gradient immobilized on the surface. The totalconcentration of proteins in solution is the same in all channels(i.e., [cA(t) + cB(t)]). We assume that cs,sat is a constant number,such that a site (an area) on the surface occupied by one adsorbedprotein cannot adsorb another. We can describe the system ofadsorption of two proteins (proteins A and B) on solid surfacesusing eqs 5a and 5b.
For kr,A ) 0, kr,B ) 0
For simplicity, we used the same kf for both avidin and BSA,kf,A ) kf,B ) 1.71 × 10⁴ M-1 s-1(calculated for adsorption of avidin
in the previous section). We integrated eqs 6a and 6b in time usingthe Runge-Kutta scheme and solved for the values of cs,A(t) andcs,B(t).22 For each unique value of cA and cB, there was a numericalsolution for cs,A and cs,B. These simulations show that the transferof the gradient from solution to the surface is independent of timeat times between 15 and 150 min (Figure 1C). Experimental datathat correspond to this simulation can be found in the Resultsand Discussion section (Figure 4).
Although the predictions of our model agree with the resultsof the experiments, our model may not account for all cases ofthe adsorption of molecules on solid surfaces. We believe thatthe relative large molecular weights and similar avidities for thesurface of the molecular species make several of our simplifica-tions valid.
RESULTS AND DISCUSSIONDesign of the Gradient Generators. Figure 2 shows the
microfluidic network we used for fabricating linear gradients.Figure 2A illustrates the design of the generator of gradient andfour repetitive cycles of mixing. We used blue and red dyes totrace the process of the mixing of fluids and the generation of
(22) Press: W. H.; Teukolsky, S. A.; Veterling, W. T.; Flannery, B. P. Numericalreciples in FORTRAN: the art of scientific computing, 2nd ed.; CambridgeUniversity Press: Cambridge, 1992.
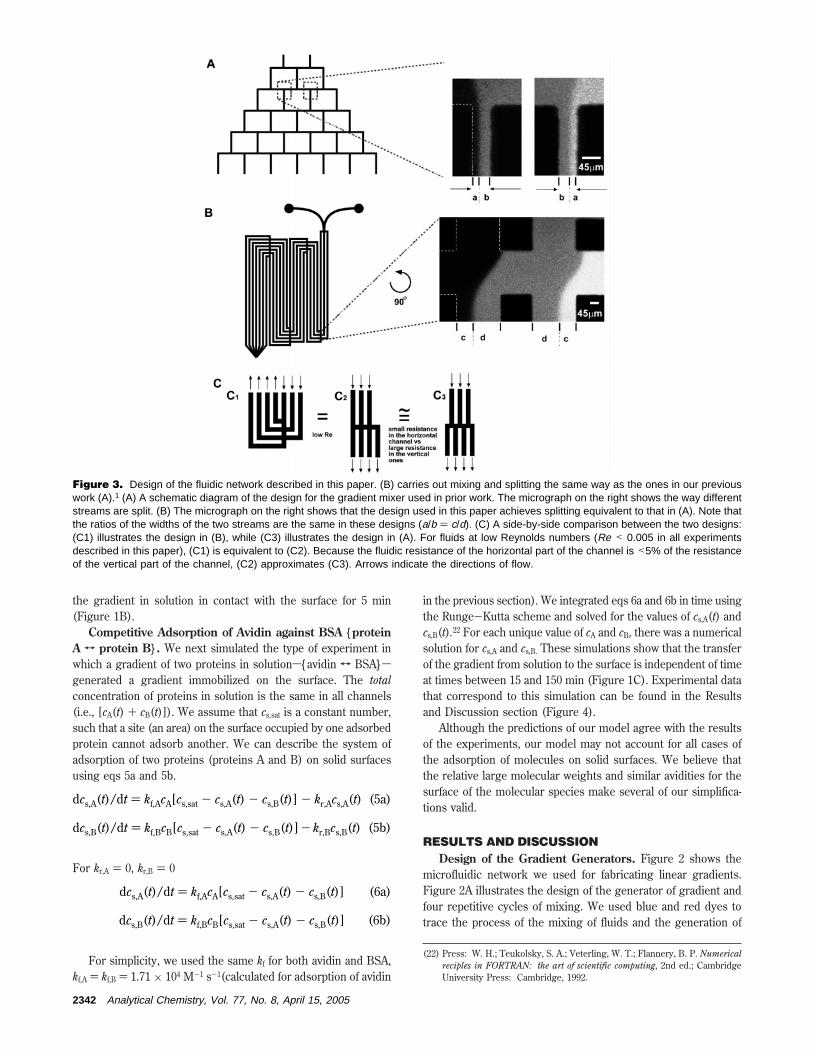
Figure 3. Design of the fluidic network described in this paper. (B) carries out mixing and splitting the same way as the ones in our previouswork (A).1 (A) A schematic diagram of the design for the gradient mixer used in prior work. The micrograph on the right shows the way differentstreams are split. (B) The micrograph on the right shows that the design used in this paper achieves splitting equivalent to that in (A). Note thatthe ratios of the widths of the two streams are the same in these designs (a/b ) c/d). (C) A side-by-side comparison between the two designs:(C1) illustrates the design in (B), while (C3) illustrates the design in (A). For fluids at low Reynolds numbers (Re < 0.005 in all experimentsdescribed in this paper), (C1) is equivalent to (C2). Because the fluidic resistance of the horizontal part of the channel is <5% of the resistanceof the vertical part of the channel, (C2) approximates (C3). Arrows indicate the directions of flow.
dcs,A(t)/dt ) kf,AcA[cs,sat - cs,A(t) - cs,B(t)] - kr,Acs,A(t) (5a)
dcs,B(t)/dt ) kf,BcB[cs,sat - cs,A(t) - cs,B(t)] - kr,Bcs,B(t) (5b)
dcs,A(t)/dt ) kf,AcA[cs,sat - cs,A(t) - cs,B(t)] (6a)
dcs,B(t)/dt ) kf,BcB[cs,sat - cs,A(t) - cs,B(t)] (6b)
2342 Analytical Chemistry, Vol. 77, No. 8, April 15, 2005
gradients (Figure 2B). We injected dye solutions into the networkthrough the two inlets at the top of the photograph. As the streamstraveled down the network, they were repeatedly split, combinedwith neighboring streams, and mixed by horizontal and verticaltransport of fluids and diffusion over the CAM.15,23,24 At the endof the network, all streams (in this case, seven) carrying differentconcentrations of blue and red dyes combined into a broadchannel (Figure 2A). Because lateral diffusion in the broad channelwas slow relative to the time for the gradient in solution to passthrough the broad channel, the profiles of the gradients acrossthe broad channel were maintained (over several tens of seconds).The folded design of the system of microchannels makes efficientuse of space on the chip. Supporting Information, Figure 1, givesa detailed description of the design of the network.
Detailed descriptions of the way the network functions, andof the types of profiles it can generate, are given elsewhere.4 Weused the design shown in Figure 3B, because it was compact.This design is the functional equivalent of the simpler andconceptually more transparent design shown in Figure 3A if twoconditions are met: (i) The Reynolds number (Re) is low for fluidflow in the microchannels (in our experiments, Re ) 0.005, for aflow rate of 20 nL min-1); (ii) the fluidic resistance of the horizontalconnecting channel is less than 5% of the resistance of the long,vertical mixing channel (Figure 3C).4 The distribution of thestreams carrying different concentrations in Figure 3B is the sameas the distribution of the streams of different concentrations in
the microfluidic network used in Figure 3A; hence, the gradientsformed in the two designs described in Figure 3A and B areequivalent.
Use of CAMs. In the design with CAM, diffusional mixing inthe mixing zones was enhanced by a mixer that stretches andfolds the flows into each other and quickly reduces the distancesbetween fluids of different compositions to values where diffusionalone can rapidly homogenize the fluid on a molecular scale.15
Figure 2A illustrates the patterned topography that generatesappropriate transverse flows for chaotic mixing in microchannels.Four cycles of mixing, each using a set of asymmetric herringbonepatterns, were sufficient homogenization of the solutions for thegeneration of gradient.25 The panels on the right of Figure 2Ashow confocal micrographs of the vertical cross section of thechannel at three positions downstream in the mixing channel. TheCAM and its performance are described elsewhere.23
All gradients described in this paper utilized CAMs in the µFN.CAMs allow the mixing channels to be shorter and wider thandesigns that do not incorporate CAMs. Short channels thatincorporate CAMs enable the gradient generator to make gradi-ents of molecules having high molecular weights in relatively shortchannels using this design. The incorporation of CAMs in theµFN allows the use of higher flow rates than in the design withoutCAM; high flow rates shorten the time required to generategradients (instead of hours, minutes). The performance of a designwithout the CAM is dependent on the flow rate, because it relieson keeping two laminar streams in the same channel for asufficiently long time to complete mixing by diffusion.4 Forexample, the typical mixing time in the design without CAM is∼20 s for a protein (calculated for a channel of the width of ∼50µm, assuming the coefficient of diffusion of a protein is 5 × 10-11
m2 s-1).26 For streams traveling down ∼5 mm of the mixingchannel, the maximum rate of flow for complete mixing is 0.25mm s-1 ) 12 mm min-1. For a channel that has a cross section of50 µm × 50 µm, the maximum rate of flow is ∼1 nL/minsa valuemuch smaller than the rates that we use for the immobilizationof protein on surfaces in the current design (typically ∼20 µL/min).1,4 In addition, when the channels in the µFN are shorterand wider than those in the design without the CAM, theresistance is a value low enough that gravity alone can drive thefluids. Due to a larger cross section of this µFN than that in thedesign without the CAM, networks using CAMs are less proneto clogging and fouling caused by dust particles than networksusing narrower channels described elsewhere.1,4 The majordisadvantage of networks incorporating CAMs is that theirfabrication is more complicated than that of networks that do notincorporate CAMs; for inexperienced users of photolithography,the µFN without the CAM still works efficiently for generatinggradients.4
Generation of Molecular Gradients on the Surface. Weused two types of gradients in solution, {avidin T PBS} and{avidin T BSA}, to generate gradients of avidin on surfaces ofPDMS (Figure 4).27
(23) Stroock, A. D.; Dertinger, S. K.; Whitesides, G. M.; Ajdari, A. Anal. Chem.2002, 74, 5306-5312.
(24) Stroock, A. D.; Whitesides, G. M. Acc. Chem. Res. 2003, 36, 597-604.
(25) Jiang, X.; Ng, J. M. K.; Stroock, A.; Dertinger, S. K. W.; Whitesides, G. M.J. Am. Chem. Soc. 2003, 125, 5294-5295.
(26) Alberty, R. A.; Silbey, R. J. Physical Chemistry; 2nd ed.; John Wiley & Sons:New York, 1997.
(27) Clerc, D.; Lukosz, W. Biosens. Bioelectron. 1997, 12, 185-194.
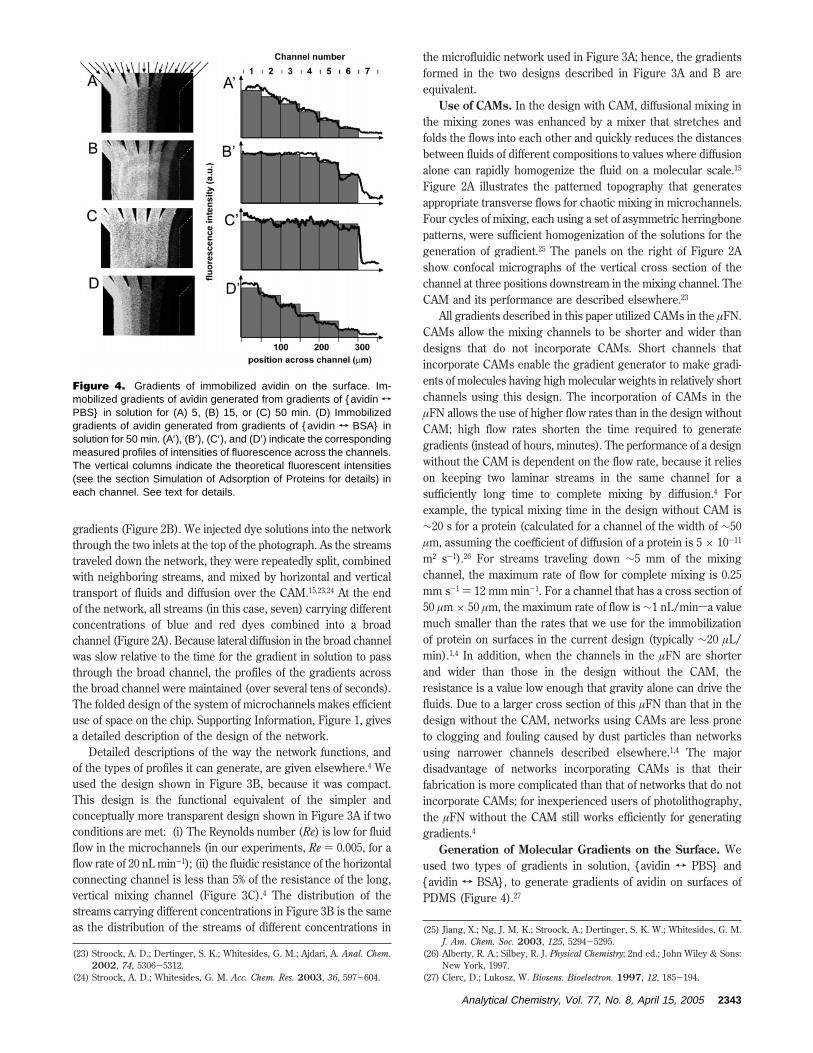
Figure 4. Gradients of immobilized avidin on the surface. Im-mobilized gradients of avidin generated from gradients of {avidin T
PBS} in solution for (A) 5, (B) 15, or (C) 50 min. (D) Immobilizedgradients of avidin generated from gradients of {avidin T BSA} insolution for 50 min. (A′), (B′), (C′), and (D′) indicate the correspondingmeasured profiles of intensities of fluorescence across the channels.The vertical columns indicate the theoretical fluorescent intensities(see the section Simulation of Adsorption of Proteins for details) ineach channel. See text for details.
Analytical Chemistry, Vol. 77, No. 8, April 15, 2005 2343
To generate these two types of gradients, we passed a gradientof decreasing concentrations of avidin in PBS and increasingconcentrations of BSA through the µFN, at ∼20 µL/min in theseexperiments. The rapid rate of flow makes possible the generationof gradients in a few minutes. By using a high rate of flow, wealso reduced the diffusion-mediated blurring of the profile of thegradientsthe profile of the gradient can remain relatively welldefined over 50 mm.
As discussed in the section entitled Simulation of Adsorptionof Proteins, the interval of time over which the solution of proteinis in contact with the surface, and during which adsorption takesplace, is important when transferring a gradient of a single protein{avidin T PBS} to the surface. Passing the solution through theµFN for 5 min at these concentrations yields an approximatelylinear gradient (Figure 4A), while passing the solution throughfor 50 min under the same conditions saturates the surface (Figure4C). Passing the solution for 15 min under the same conditionssaturates some of the channels (Figure 4B).
In principle, the second method is operationally more straight-forward, but it does require two proteins. One of these proteinsmay be “inert” (e.g., BSA) and serves only to passivate the surface.The first method allows the fabrication with only a single proteinbut requires a more detailed understanding of the influence ofthe time of exposure of the surface to the solution on therelationship between the shapes of the gradients in solution andon the surface. It can generate immobilized gradients that wouldbe complicated by the presence of a second protein (used in thesecond method). Generation of a gradient by competitive adsorp-tion of two proteins {avidin T BSA} is essentially independent oftime, after the surface reaches saturation, provided the totalconcentration of protein in solution is constant across the gradient(Figure 4D, Figure 1).
The second procedure {avidin T BSA} is therefore, in mostcircumstances, more straightforward to use, if we do not want tobother with kinetic control. It also has the advantage that it allowstwo (or more) proteins to be patterned in one step and that it canleave the entire surface covered by a protein that can resist theadsorption of additional proteins from solution. The advantage ofthe first method {avidin T PBS} is that it is fast and does notrequire the use of a second blocking agent. A short period of timemakes this technique convenient for the generation of gradientsof molecules that are easily degraded (some biomolecules aresensitive to oxidation or thermal denaturation in ambient condi-tions). Once the gradient of avidin is generated (from eithermethod), we can generate gradients of biotinylated molecule usingthe same procedure.
Since desorption of adsorbed proteins from the hydrophobicsurface of PDMS is negligible over the course of a few days,28
these immobilized gradients are stable under conditions that donot allow for degradation of the protein. For example, theimmobilized gradients can be stored for a long period of time at4 °C.29 When used in cell culture, however, these immobilizedgradients may decay within 2-3 days due to the presence ofproteases in the culture media that degrade immobilized mol-ecules.6
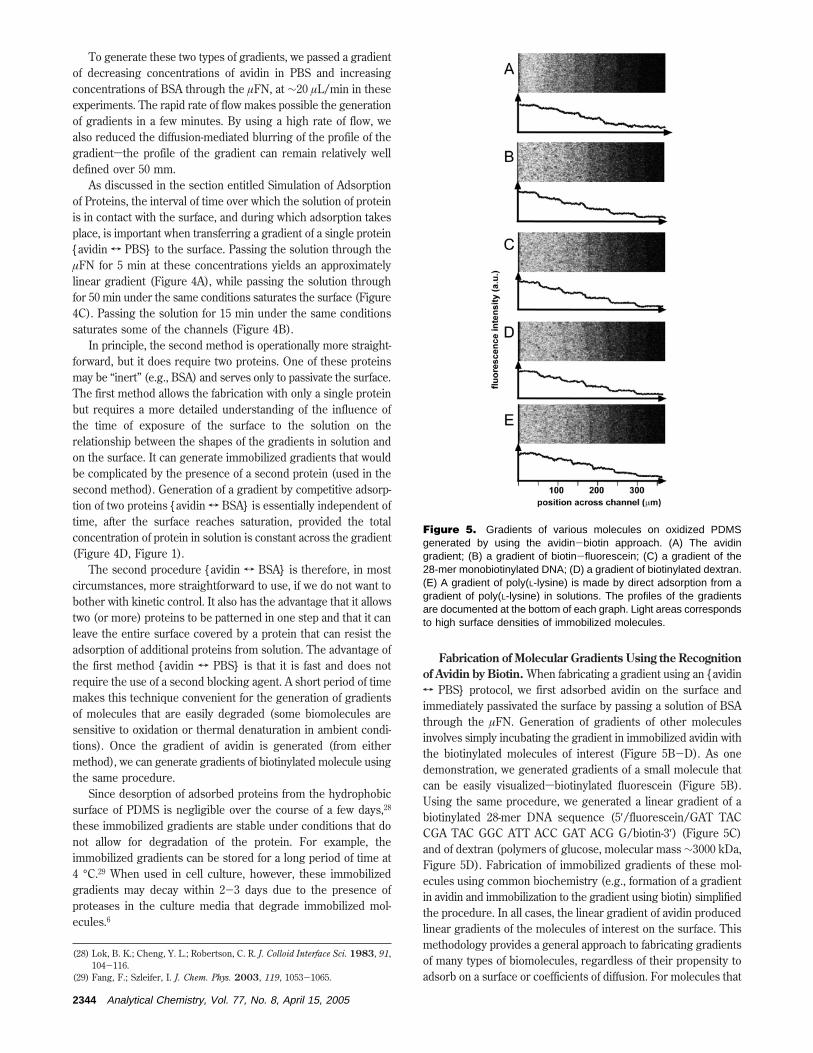
Fabrication of Molecular Gradients Using the Recognitionof Avidin by Biotin. When fabricating a gradient using an {avidinT PBS} protocol, we first adsorbed avidin on the surface andimmediately passivated the surface by passing a solution of BSAthrough the µFN. Generation of gradients of other moleculesinvolves simply incubating the gradient in immobilized avidin withthe biotinylated molecules of interest (Figure 5B-D). As onedemonstration, we generated gradients of a small molecule thatcan be easily visualizedsbiotinylated fluorescein (Figure 5B).Using the same procedure, we generated a linear gradient of abiotinylated 28-mer DNA sequence (5′/fluorescein/GAT TACCGA TAC GGC ATT ACC GAT ACG G/biotin-3′) (Figure 5C)and of dextran (polymers of glucose, molecular mass ∼3000 kDa,Figure 5D). Fabrication of immobilized gradients of these mol-ecules using common biochemistry (e.g., formation of a gradientin avidin and immobilization to the gradient using biotin) simplifiedthe procedure. In all cases, the linear gradient of avidin producedlinear gradients of the molecules of interest on the surface. Thismethodology provides a general approach to fabricating gradientsof many types of biomolecules, regardless of their propensity toadsorb on a surface or coefficients of diffusion. For molecules that
(28) Lok, B. K.; Cheng, Y. L.; Robertson, C. R. J. Colloid Interface Sci. 1983, 91,104-116.
(29) Fang, F.; Szleifer, I. J. Chem. Phys. 2003, 119, 1053-1065.
Figure 5. Gradients of various molecules on oxidized PDMSgenerated by using the avidin-biotin approach. (A) The avidingradient; (B) a gradient of biotin-fluorescein; (C) a gradient of the28-mer monobiotinylated DNA; (D) a gradient of biotinylated dextran.(E) A gradient of poly(L-lysine) is made by direct adsorption from agradient of poly(L-lysine) in solutions. The profiles of the gradientsare documented at the bottom of each graph. Light areas correspondsto high surface densities of immobilized molecules.
2344 Analytical Chemistry, Vol. 77, No. 8, April 15, 2005
denature when adsorbed, using the avidin-biotin approach (thathas a layer of avidin as an initial layer on the surface) may providea less denaturing alternative than direct adsorption.30
Using avidin to generate the gradient has three advantagescompared to other strategies for producing the gradients: (i)avidin is a protein that adsorbs onto the surface while retainingits ability to bind biotin. (ii) It has a relatively high molecularweight (molecular mass ∼68 kDa), for the tetramer), and itsrate of diffusion is relatively slow. The shape of the gradientin solution, and on the surface, can therefore be maintainedfor distances as long as a few centimeters. (iii) Since biotinyla-tion of most biomolecules is available through commerciallyavailable kits, this method can generate immobilized gradientsof many kinds of biomolecules. The strong interaction betweenavidin and biotin (KD ) 10-15 M) allows essentially irreversible
immobilization of biotinylated ligands to the surface of an avidingradient.
Fabrication of Gradients of Artificial Polymers. We alsofabricated gradients of several other types of polymers andproteins by direct adsorption from solution, since many types ofpolymers adsorb to solid surfaces. For example, we fabricatedgradients of poly(L-lysine) (PL) on the surface of oxidized PDMSby direct physical adsorption from {PL T PBS} (Figure 5E), sincePL adsorbs strongly to anionic surfaces (e.g., oxidized PDMS orglass).
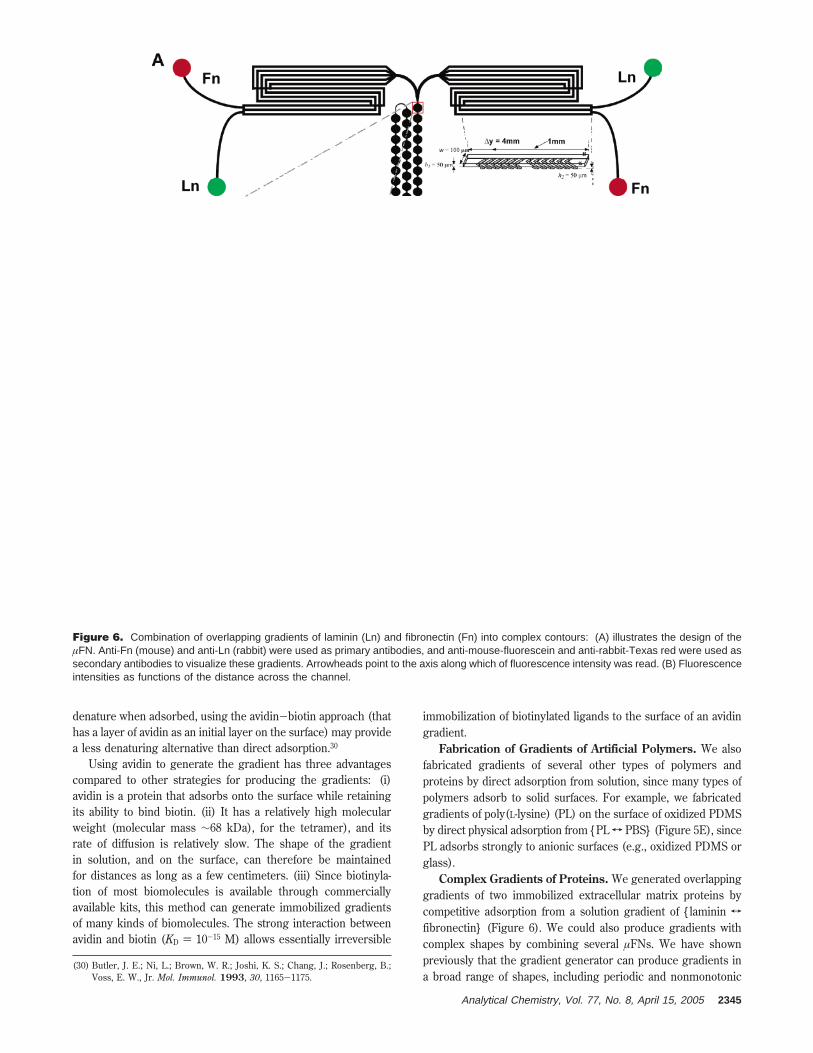
Complex Gradients of Proteins. We generated overlappinggradients of two immobilized extracellular matrix proteins bycompetitive adsorption from a solution gradient of {laminin T
fibronectin} (Figure 6). We could also produce gradients withcomplex shapes by combining several µFNs. We have shownpreviously that the gradient generator can produce gradients ina broad range of shapes, including periodic and nonmonotonic
(30) Butler, J. E.; Ni, L.; Brown, W. R.; Joshi, K. S.; Chang, J.; Rosenberg, B.;Voss, E. W., Jr. Mol. Immunol. 1993, 30, 1165-1175.
Figure 6. Combination of overlapping gradients of laminin (Ln) and fibronectin (Fn) into complex contours: (A) illustrates the design of theµFN. Anti-Fn (mouse) and anti-Ln (rabbit) were used as primary antibodies, and anti-mouse-fluorescein and anti-rabbit-Texas red were used assecondary antibodies to visualize these gradients. Arrowheads point to the axis along which of fluorescence intensity was read. (B) Fluorescenceintensities as functions of the distance across the channel.
Analytical Chemistry, Vol. 77, No. 8, April 15, 2005 2345
profiles, on the scale between 1 and 1000 µm.4 (The smallest spanof the gradient cannot be much less than 1 µm, because diffusionof molecules quickly obscures the patterns of laminar flows atthis length scale.) To illustrate the fabrication of a complexgradient, we combined two simple gradients and merged themtogether. In addition, we varied the width of the channel to addanother level of complexity to the structure of the gradients(Figure 6). Figure 6A demonstrates the design of the networkrequired for the generation of overlapping gradients of laminin(Ln) and fibronectin (Fn) by adsorption of these two proteinsdirectly from solution. The contoured main channel overcomesthe limitation that the direction of a gradient is always perpen-dicular to the direction of the flow of liquid inside straightchannels: thus, the µFN generated gradients along two axes inthe plane.
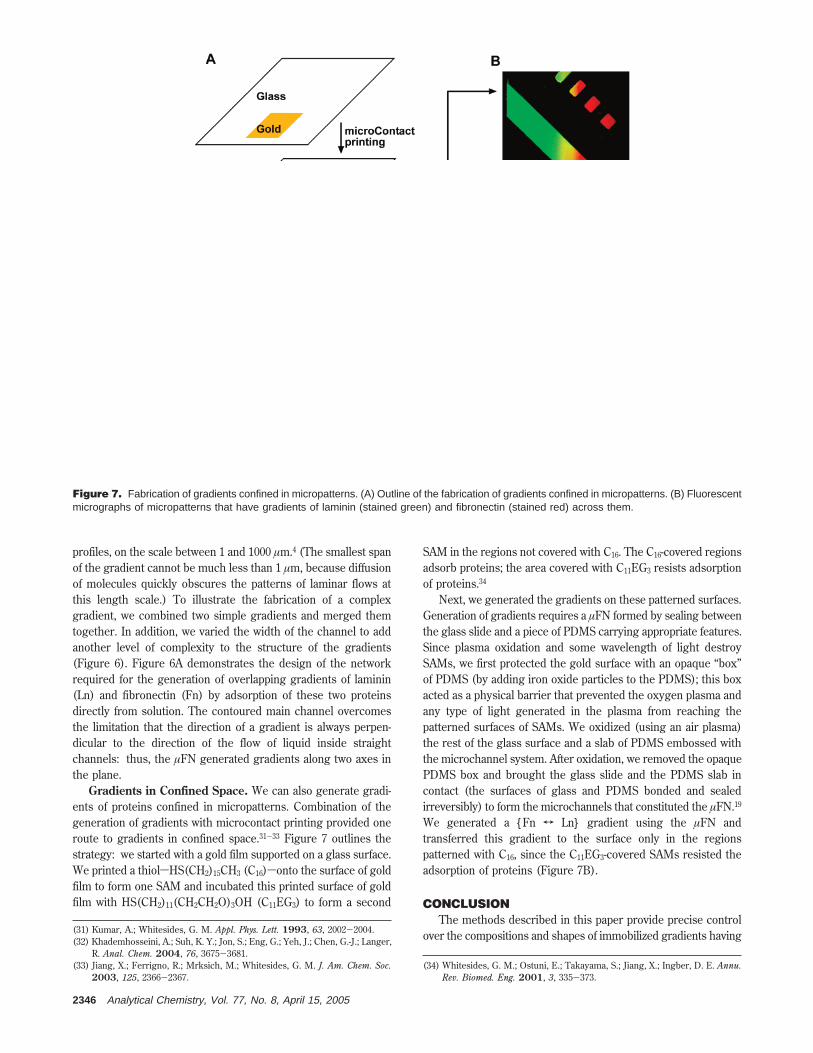
Gradients in Confined Space. We can also generate gradi-ents of proteins confined in micropatterns. Combination of thegeneration of gradients with microcontact printing provided oneroute to gradients in confined space.31-33 Figure 7 outlines thestrategy: we started with a gold film supported on a glass surface.We printed a thiolsHS(CH2)15CH3 (C16)sonto the surface of goldfilm to form one SAM and incubated this printed surface of goldfilm with HS(CH2)11(CH2CH2O)3OH (C11EG3) to form a second
SAM in the regions not covered with C16. The C16-covered regionsadsorb proteins; the area covered with C11EG3 resists adsorptionof proteins.34
Next, we generated the gradients on these patterned surfaces.Generation of gradients requires a µFN formed by sealing betweenthe glass slide and a piece of PDMS carrying appropriate features.Since plasma oxidation and some wavelength of light destroySAMs, we first protected the gold surface with an opaque “box”of PDMS (by adding iron oxide particles to the PDMS); this boxacted as a physical barrier that prevented the oxygen plasma andany type of light generated in the plasma from reaching thepatterned surfaces of SAMs. We oxidized (using an air plasma)the rest of the glass surface and a slab of PDMS embossed withthe microchannel system. After oxidation, we removed the opaquePDMS box and brought the glass slide and the PDMS slab incontact (the surfaces of glass and PDMS bonded and sealedirreversibly) to form the microchannels that constituted the µFN.19
We generated a {Fn T Ln} gradient using the µFN andtransferred this gradient to the surface only in the regionspatterned with C16, since the C11EG3-covered SAMs resisted theadsorption of proteins (Figure 7B).
CONCLUSIONThe methods described in this paper provide precise control
over the compositions and shapes of immobilized gradients having(31) Kumar, A.; Whitesides, G. M. Appl. Phys. Lett. 1993, 63, 2002-2004.(32) Khademhosseini, A.; Suh, K. Y.; Jon, S.; Eng, G.; Yeh, J.; Chen, G.-J.; Langer,
R. Anal. Chem. 2004, 76, 3675-3681.(33) Jiang, X.; Ferrigno, R.; Mrksich, M.; Whitesides, G. M. J. Am. Chem. Soc.
2003, 125, 2366-2367.(34) Whitesides, G. M.; Ostuni, E.; Takayama, S.; Jiang, X.; Ingber, D. E. Annu.
Rev. Biomed. Eng. 2001, 3, 335-373.
Figure 7. Fabrication of gradients confined in micropatterns. (A) Outline of the fabrication of gradients confined in micropatterns. (B) Fluorescentmicrographs of micropatterns that have gradients of laminin (stained green) and fibronectin (stained red) across them.
2346 Analytical Chemistry, Vol. 77, No. 8, April 15, 2005
micrometer-scale dimensions, either by direct transfer fromsolution or by indirect immobilization via the recognition ofbiotinylated ligands by avidin. It is applicable to many types ofbiomolecules (proteins, oligonucleotides, small molecules, artificialpolymers), as long as they can be linked to biotin. Immobilizedgradients of biomolecules such as oligomers of DNA, polysac-charides, and small molecules are difficult to generate, because,unlike proteins, they usually do not spontaneously and irreversiblyadsorb onto solid surfaces such as glass; immobilization of thesemolecules on different types of substrates would normally requiredifferent types of chemistry.
This method has examined the transfer of two types ofgradients in solution to the surface: {avidin T PBS} and {avidinT BSA}. The former is less time-consuming and can generategradient on the surface of one single protein; but it requires adetailed understanding of the kinetics of adsorption of protein onsolid surfaces to obtain the right profile of gradient on the surface.The latter is more useful when the precise shapes of the gradienton the surface must be controlled; but it requires the use of twoproteins.
The incorporation of the CAM and the folded design of theµFN make the generation of gradient convenient and efficient.The fabrication of the master for the µFN that contains the CAM,however, requires some expertise in photolithography. The design
of the µFN without the CAM is also applicable to all experimentsdescribed in this work.
This method is useful for cell biologists who are interested inphenotype-associated immobilized gradients, such as migration,formation of processes, and polarity of cells. We believe that thismethod is also useful for screening the activities of immobilizedgradients of biomolecules that are known to affect chemotaxis insolution.1,2,4,6,35 It is simpler and more versatile than most othermethods for generating gradients on surfaces.
ACKNOWLEDGMENTThis work was supported by NIH (GM 065364) and DARPA
(ECS-0004030). S.K.W.D. acknowledges a DFG (DeutscheForschungsgemeinschaft) research fellowship.
SUPPORTING INFORMATION AVAILABLEAdditional information as noted in text. This material is
available free of charge via the Internet at http://pubs.acs.org.
Received for review October 21, 2004. Accepted January25, 2005.
AC048440M
(35) Palecek, S. P.; Loftus, J. C.; Ginsberg, M. H.; Lauffenburger, D. A.; Horwitz,A. F. Nature 1997, 388, 210.
Analytical Chemistry, Vol. 77, No. 8, April 15, 2005 2347