lita2 2014 - using the rvt and livt toolboxes for advanced archaeological visualisation of lidar...
TRANSCRIPT
LITA Summer School, Poznan 28th July – 1st Aug 2014
Using the RVT and LiVT Toolboxes (beta) – a quick guide
Table of ContentsAims.....................................................................................................................................................2Using RVT............................................................................................................................................2Task 1 – Exporting your data to .tif......................................................................................................2Task 2 – Using RVT.............................................................................................................................4Task 3 – Viewing the model.................................................................................................................7Using LiVT...........................................................................................................................................8Task 1 – Exporting your data to .bil.....................................................................................................8Task 2 – Using LiVT............................................................................................................................8Task 3 – Viewing the model.................................................................................................................9
Course Materials designed by Rebecca Bennett, June2013
Please use freely for your own information and the instruction of others but recognise the rights ofthe author to be acknowledged if the material contained is disseminated.
LITA Lab 3 – RVT / LiVT 1
LITA Summer School, Poznan 28th July – 1st Aug 2014
Aims
The aim of this lab is familiarise yourself with the Lidar Visualisation Toolkit (LiVT), developed by Dr Ralf Hesse and provided free by Archaeolandscapes Europe
The toolkit is in beta and so has to be used with caution but provides a powerful interface for creating a number of lidar visualisations.
In this guide we will cover
• Using RVT for creating a range of visualisations
• exporting your data to the correct formats (.tif for use in RVT / .bil format for use in LiVT (using lastools)
• Processing in LiVT
• Bringing your RVT / LiVT created models in to QGIS
Using RVT
Task 1 – Exporting your data to .tif
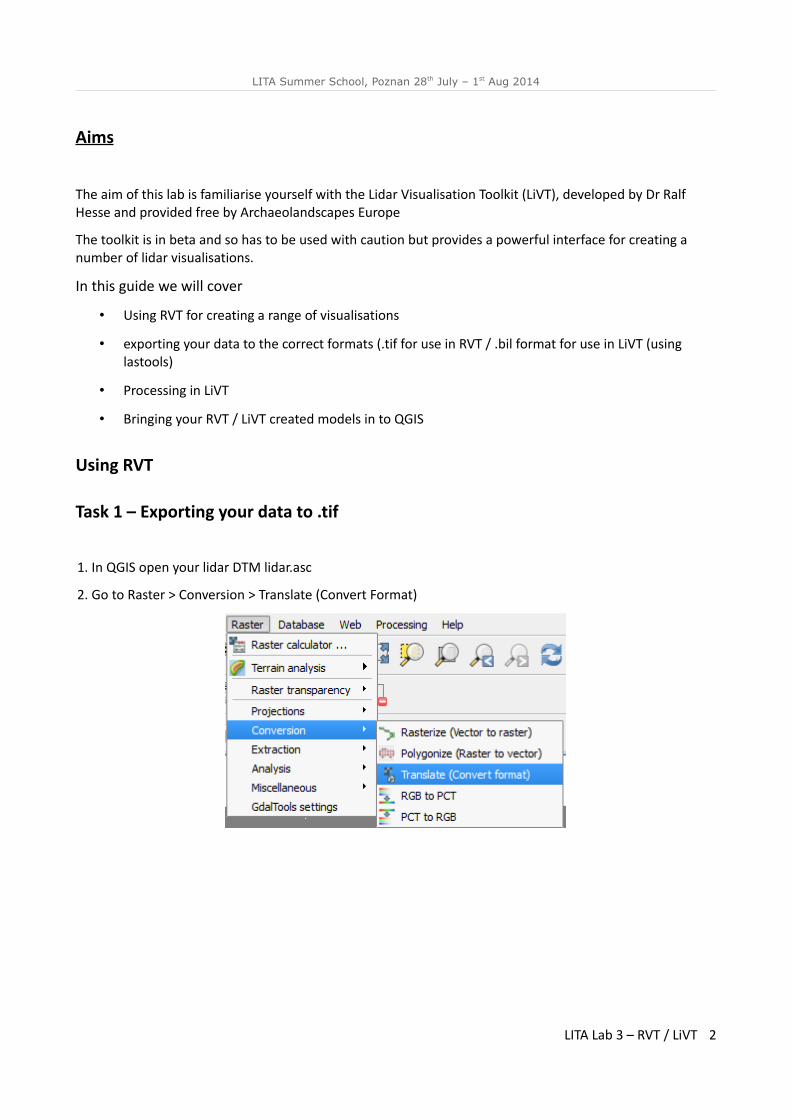
1. In QGIS open your lidar DTM lidar.asc
2. Go to Raster > Conversion > Translate (Convert Format)
LITA Lab 3 – RVT / LiVT 2
LITA Summer School, Poznan 28th July – 1st Aug 2014
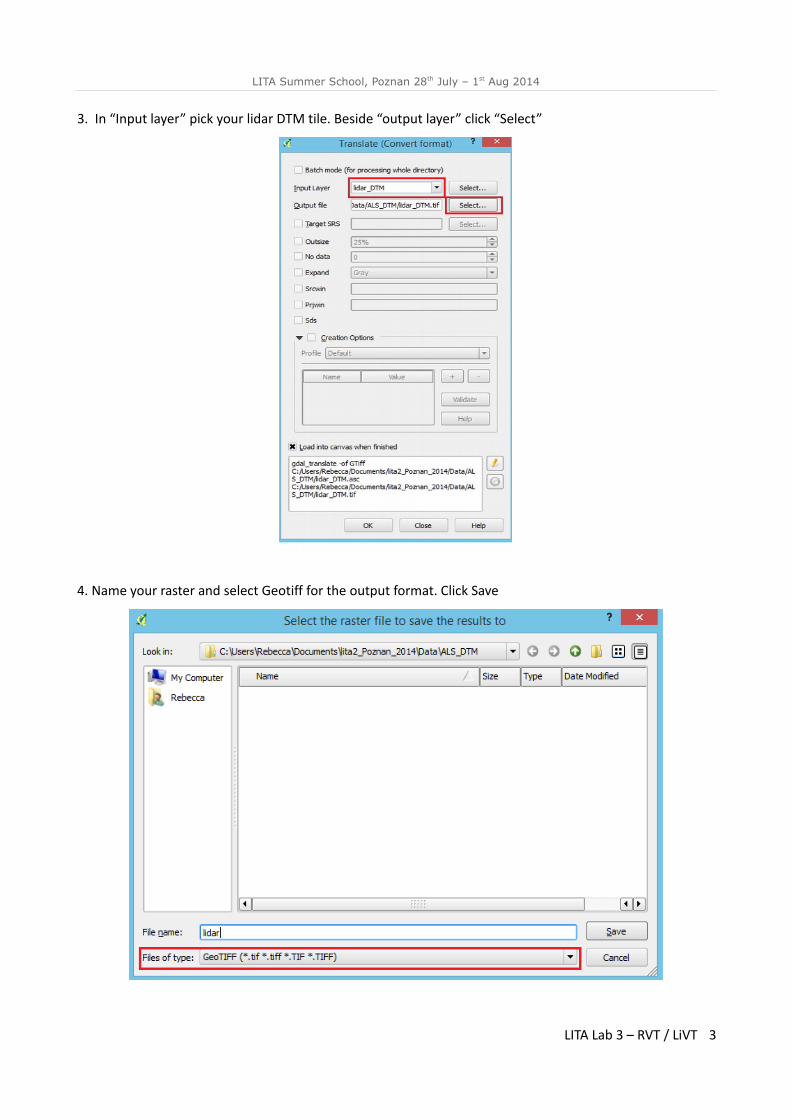
3. In “Input layer” pick your lidar DTM tile. Beside “output layer” click “Select”
4. Name your raster and select Geotiff for the output format. Click Save
LITA Lab 3 – RVT / LiVT 3
LITA Summer School, Poznan 28th July – 1st Aug 2014
5. The tool will automatically load the converted file into QGIS (and will ask for the CRS). Once loaded, the tool will produce a pop-up to tell you that the processing is done.
Task 2 – Using RVT1. Download RVT from
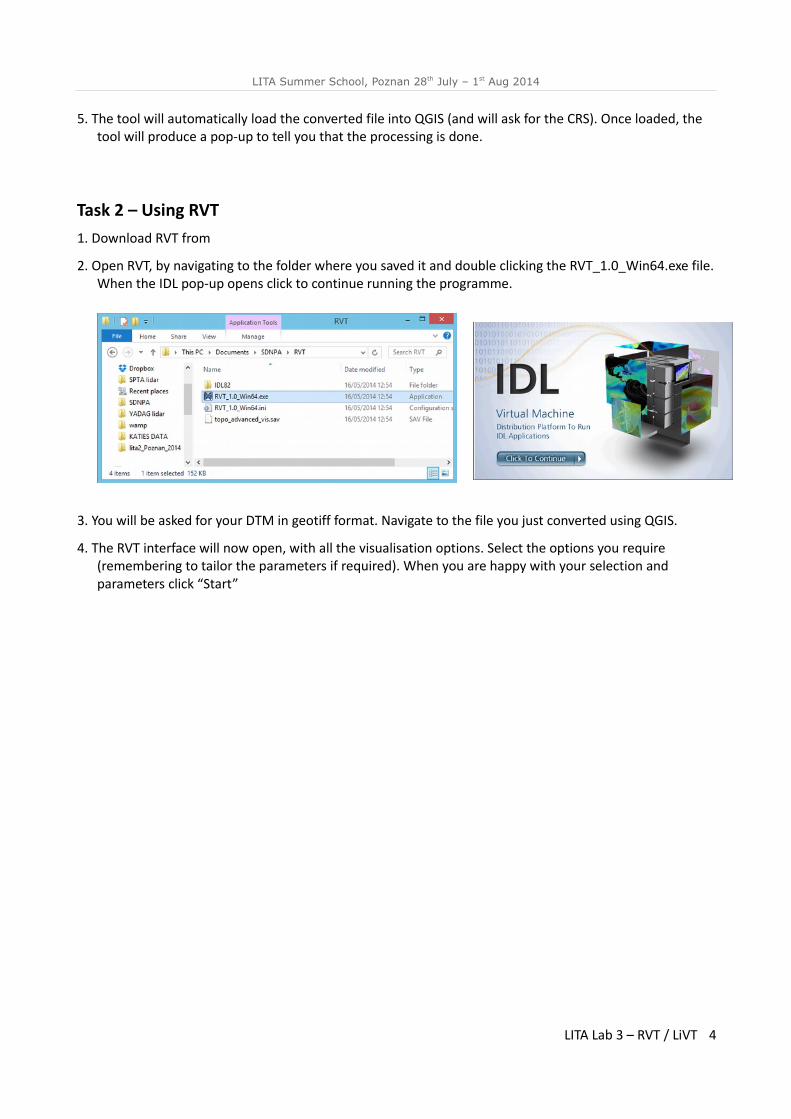
2. Open RVT, by navigating to the folder where you saved it and double clicking the RVT_1.0_Win64.exe file.When the IDL pop-up opens click to continue running the programme.
3. You will be asked for your DTM in geotiff format. Navigate to the file you just converted using QGIS.
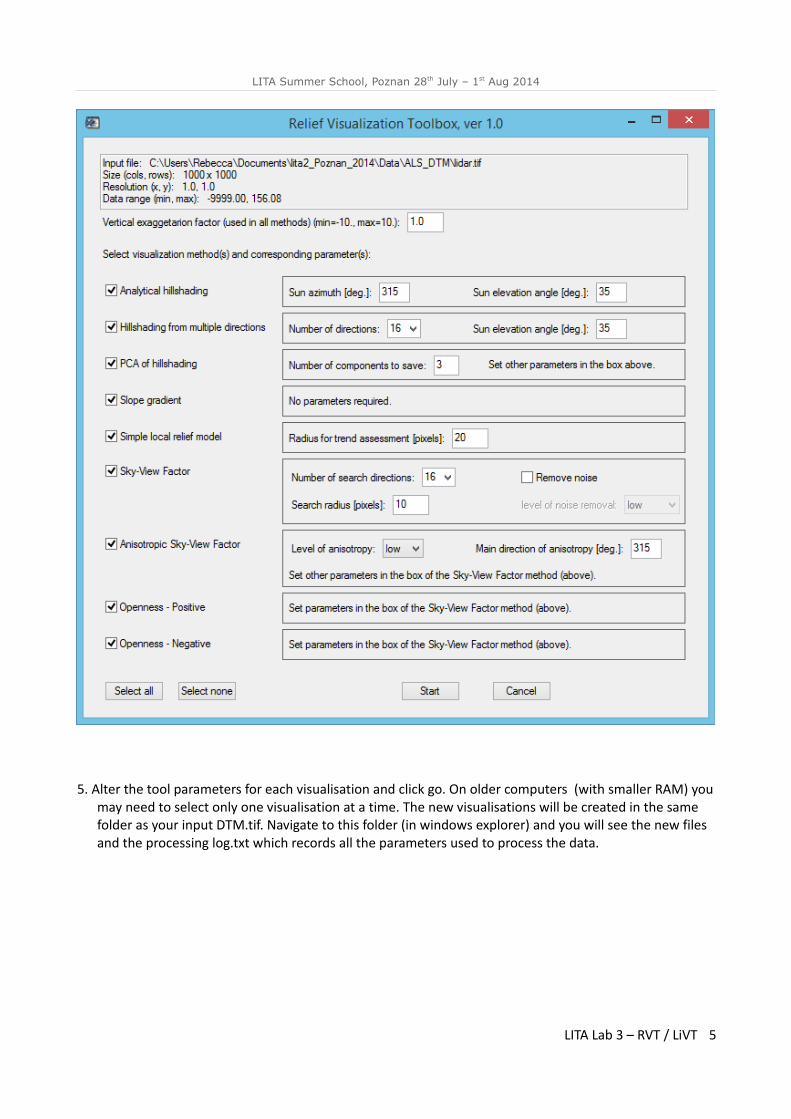
4. The RVT interface will now open, with all the visualisation options. Select the options you require (remembering to tailor the parameters if required). When you are happy with your selection and parameters click “Start”
LITA Lab 3 – RVT / LiVT 4
LITA Summer School, Poznan 28th July – 1st Aug 2014
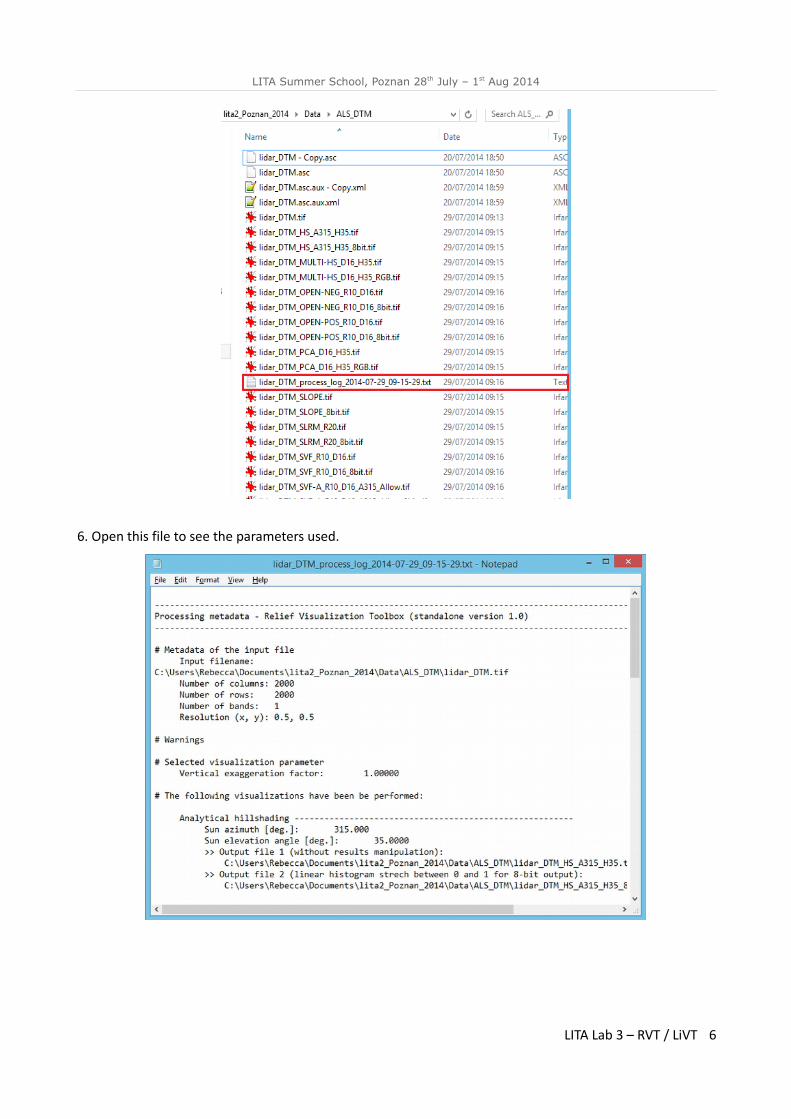
5. Alter the tool parameters for each visualisation and click go. On older computers (with smaller RAM) youmay need to select only one visualisation at a time. The new visualisations will be created in the same folder as your input DTM.tif. Navigate to this folder (in windows explorer) and you will see the new files and the processing log.txt which records all the parameters used to process the data.
LITA Lab 3 – RVT / LiVT 5
LITA Summer School, Poznan 28th July – 1st Aug 2014
6. Open this file to see the parameters used.
LITA Lab 3 – RVT / LiVT 6
LITA Summer School, Poznan 28th July – 1st Aug 2014
Task 3 – Viewing the model1. All the models created using RVT can be opened in QGIS
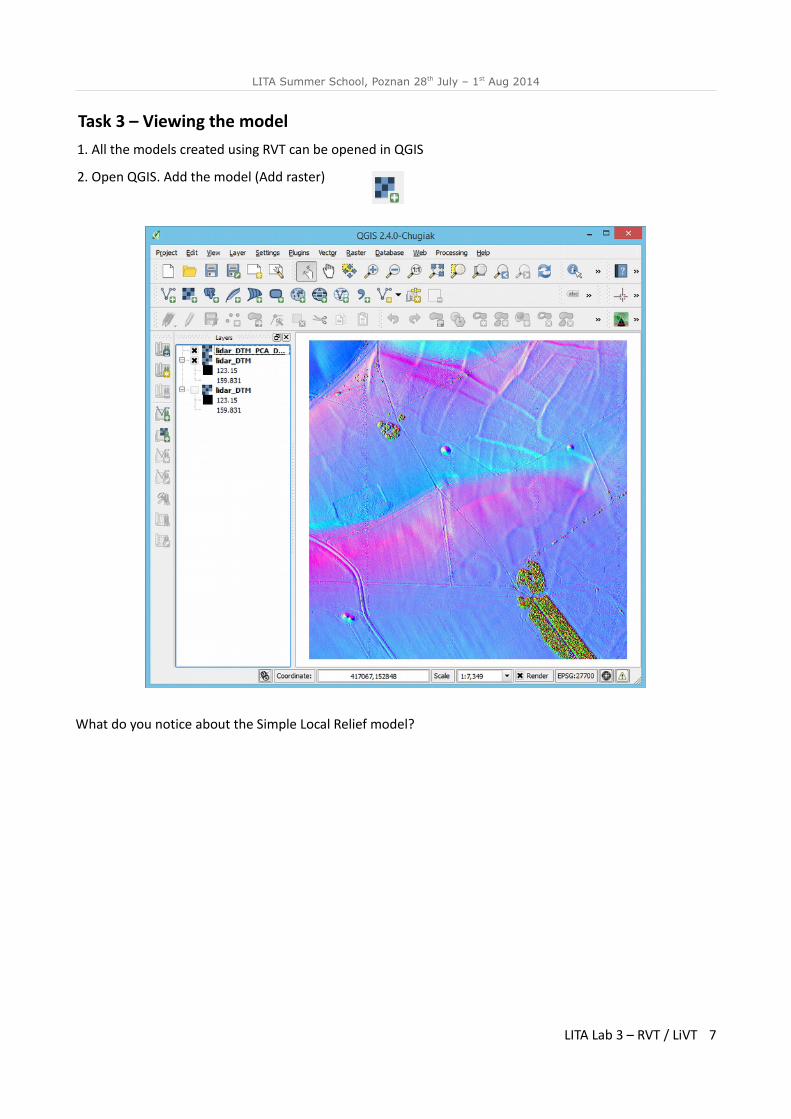
2. Open QGIS. Add the model (Add raster)
What do you notice about the Simple Local Relief model?
LITA Lab 3 – RVT / LiVT 7
LITA Summer School, Poznan 28th July – 1st Aug 2014
Using LiVTIn order to create a Local Relief Model (as published in Hesse 2010) we will also need to use the LiVT.
Task 1 – Exporting your data to .bilCurrently LiVT beta can only handle data in a limited range of formats, of which the best to use is .bil. We can export to .bil from LAStools. (You can export a .bil from QGIS but this format is imperfect and will be rejected by LiVT – RBennett 29/7/14)
1. Use lasgrid to convert your lidar.asc into a bil. Make sure you select the correct step size ()
Using the command line: lasgrid -i "filepath/to/lidar.asc" -step 0.5 -elevation - lowest -obil
Using the lasgrid GUI: Navigate to your lidar.asc >Pick the correct stepsize for the resolution of your DTM > Run the tool
2. LAStools will create three files (.bil, .blw and .bil.hdr) in the same location as your DTM .asc
Task 2 – Using LiVT
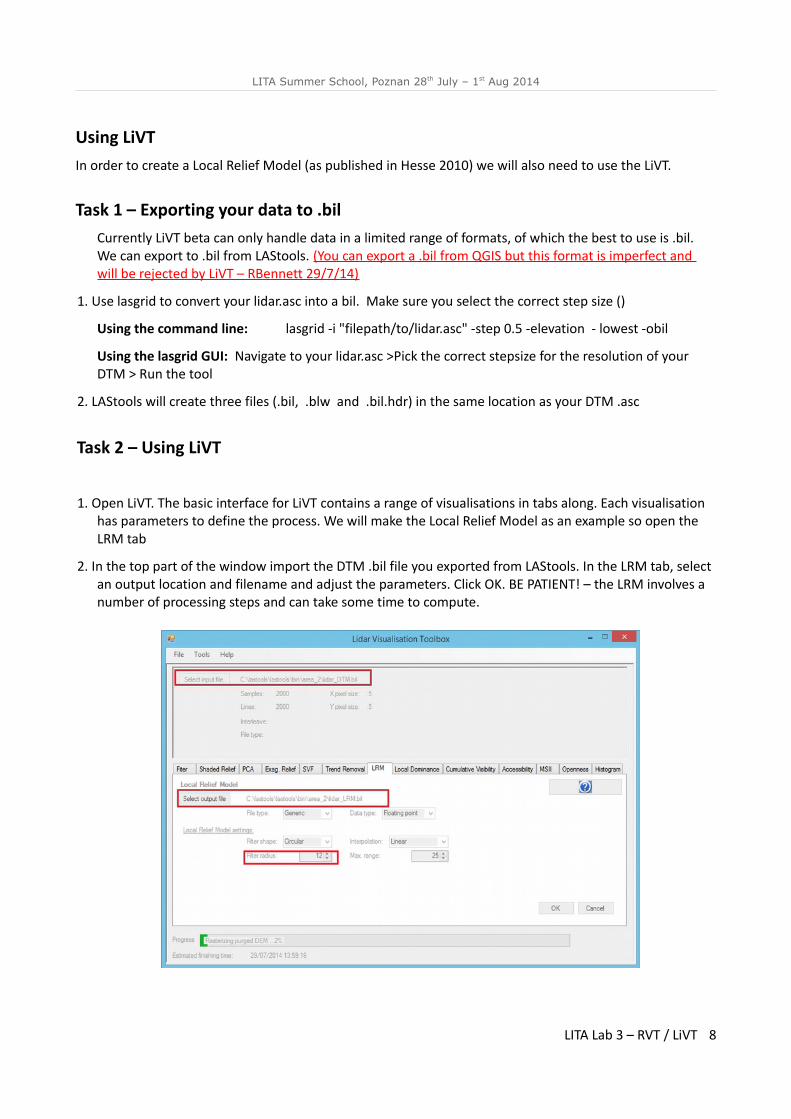
1. Open LiVT. The basic interface for LiVT contains a range of visualisations in tabs along. Each visualisation has parameters to define the process. We will make the Local Relief Model as an example so open the LRM tab
2. In the top part of the window import the DTM .bil file you exported from LAStools. In the LRM tab, select an output location and filename and adjust the parameters. Click OK. BE PATIENT! – the LRM involves a number of processing steps and can take some time to compute.
LITA Lab 3 – RVT / LiVT 8
LITA Summer School, Poznan 28th July – 1st Aug 2014
Task 3 – Viewing the model
1. Open QGIS. Add the LRM.bil (Add raster)
2. Edit the raster properties to improve the view of the model.
LITA Lab 3 – RVT / LiVT 9