investigation of flow instabilities in the inlet ducts of dp–1c
TRANSCRIPT

Jan LepicovskyASRC Aerospace Corporation, Cleveland, Ohio
Investigation of Flow Instabilities in theInlet Ducts of DP–1C VTOL Aircraft
NASA/CR—2008-215216
June 2008

NASA STI Program . . . in Profi le
Since its founding, NASA has been dedicated to the advancement of aeronautics and space science. The NASA Scientifi c and Technical Information (STI) program plays a key part in helping NASA maintain this important role.
The NASA STI Program operates under the auspices of the Agency Chief Information Offi cer. It collects, organizes, provides for archiving, and disseminates NASA’s STI. The NASA STI program provides access to the NASA Aeronautics and Space Database and its public interface, the NASA Technical Reports Server, thus providing one of the largest collections of aeronautical and space science STI in the world. Results are published in both non-NASA channels and by NASA in the NASA STI Report Series, which includes the following report types: • TECHNICAL PUBLICATION. Reports of
completed research or a major signifi cant phase of research that present the results of NASA programs and include extensive data or theoretical analysis. Includes compilations of signifi cant scientifi c and technical data and information deemed to be of continuing reference value. NASA counterpart of peer-reviewed formal professional papers but has less stringent limitations on manuscript length and extent of graphic presentations.
• TECHNICAL MEMORANDUM. Scientifi c
and technical fi ndings that are preliminary or of specialized interest, e.g., quick release reports, working papers, and bibliographies that contain minimal annotation. Does not contain extensive analysis.
• CONTRACTOR REPORT. Scientifi c and
technical fi ndings by NASA-sponsored contractors and grantees.
• CONFERENCE PUBLICATION. Collected
papers from scientifi c and technical conferences, symposia, seminars, or other meetings sponsored or cosponsored by NASA.
• SPECIAL PUBLICATION. Scientifi c,
technical, or historical information from NASA programs, projects, and missions, often concerned with subjects having substantial public interest.
• TECHNICAL TRANSLATION. English-
language translations of foreign scientifi c and technical material pertinent to NASA’s mission.
Specialized services also include creating custom thesauri, building customized databases, organizing and publishing research results.
For more information about the NASA STI program, see the following:
• Access the NASA STI program home page at http://www.sti.nasa.gov
• E-mail your question via the Internet to help@
sti.nasa.gov • Fax your question to the NASA STI Help Desk
at 301–621–0134 • Telephone the NASA STI Help Desk at 301–621–0390 • Write to:
NASA Center for AeroSpace Information (CASI) 7115 Standard Drive Hanover, MD 21076–1320

Jan LepicovskyASRC Aerospace Corporation, Cleveland, Ohio
Investigation of Flow Instabilities in theInlet Ducts of DP–1C VTOL Aircraft
NASA/CR—2008-215216
June 2008
National Aeronautics andSpace Administration
Glenn Research CenterCleveland, Ohio 44135
Prepared under Grant NNCO6BA07B

Acknowledgments
The work was performed under the ONR contract SAA3-675 managed by Mr. J.F. Kinzer, and NASA subcontract NNCO6BA07B managed by Mr. C.L. Meyers. The author would like to thank Mr. A.A. DuPont, president of DAC, and the entire DAC crew for extraordinary support and cooperation during these tests. Without their help it would be impossible to
acquire data presented in a short test period of three days. The support of Mr. J.A. Burkhart of ASRC Aerospace Corporation is also gratefully acknowledged.
Available from
NASA Center for Aerospace Information7115 Standard DriveHanover, MD 21076–1320
National Technical Information Service5285 Port Royal RoadSpringfi eld, VA 22161
Available electronically at http://gltrs.grc.nasa.gov
Trade names and trademarks are used in this report for identifi cation only. Their usage does not constitute an offi cial endorsement, either expressed or implied, by the National Aeronautics and
Space Administration.
This work was sponsored by the Fundamental Aeronautics Program at the NASA Glenn Research Center.
Level of Review: This material has been technically reviewed by NASA technical management.
NASA/CR—2008-215216 1
Investigation of Flow Instabilities in the Inlet Ducts of DP–1C VTOL Aircraft
Jan Lepicovsky ASRC Aerospace Corporation
Cleveland, Ohio 44135
Abstract
An investigation of flow instabilities in the inlet ducts of a two-engine vertical takeoff and landing aircraft DP-1C is described in this report. Recent tests revealed that the engines stall during run ups while the aircraft is operating on the ground. These pop stalls occurred at relatively low power levels, sometimes as low as 60% of the engine full speed. Inability to run the engines up to the full speed level is attributed to in-ground effects associated with hot gas ingestion. Such pop stalls were never experienced when the aircraft was tested on a elevated grid platform, which ensured that the aircraft was operating in out-of-the-ground-effect conditions. Based on available information on problems experienced with other vertical takeoff and landing aircraft designs, it was assumed that the engine stalls were caused by partial ingestion of hot gases streaming forward from the main exit nozzle under the aircraft inlets, which are very close to the ground. It was also suggested that the nose wheel undercarriage, located between the inlets, may generate vortices or an unstable wake causing intense mixing of hot exit gases with incoming inlet flow, which would enhance the hot gas ingestion. After running a short three-day series of tests with fully instrumented engine inlets, it is now believed the most probable reason for engine pop stalls are random ingestions of a vortex generated between the two streams moving in opposite directions: outbound hot gas stream from the main nozzle close to the ground and inbound inlet flow above. Originally, the vortex is in a horizontal plane. However, at a certain velocity ratio of these two streams, the vortex attaches either to the ground or the aircraft surface at one end and the other end is swallowed by one of the aircraft inlets. Once the vortex enters the inlet duct, a puff of hot air can be sucked through the vortex core into the engine, which causes a serious inlet flow field distortion followed by an engine stall. Once the engine stalls, the outflow from the inlet pushes the vortex away and the engine resumes normal operation. This hypothesis needs to be verified experimentally; e.g., by extensive smoke flow visualization ahead of the aircraft inlets.
The report is divided into several chapters presenting background information, detailed description of modules for unsteady pressure measurements, data acquisition setup, and an instrumentation layout. This is followed by an overview of two basic test conditions, which are out-of-the ground effect tests and in-the-ground effect tests. In the chapter on the in-the-ground effect tests, the experimental results for three aircraft configurations are presented. The aircraft configurations investigated were (1) deployed bare nose wheel tests, (2) deployed faired nose wheel tests, and (3) retracted nose wheel tests. In the final chapter of the report a summary of the in-the-ground effect tests is presented. Based on analysis of the results of all the tests performed it appears that the engine pop stalls are most likely evoked by a sudden ingestion of a vortex generated between two streams running in opposite directions; the hot jet exit stream running along the ground and the cold stream of air above being sucked into the aircraft inlets.
NASA/CR—2008-215216 2
Nomenclature List of symbols alfa [dg, hr] port clockwise angular position f [Hz, kHz] frequency fLP [Hz] low-pass filter cut-off frequency mA [kg.s-1] actual mass flow rate mC [kg.s-1] mass flow rate corrected for standard day conditions N1 [%] engine speed pAMP [Pa] amplitude of pressure oscillations t [ms] time VA [m.s-1] actual flow velocity at inlet lip during engine pop stall V0 [m.s-1] mean flow velocity at inlet lip x [mm, in] port distance from fan front face πx [1] pressure ratio (relative to ambient pressure) Abbreviations BPF blade passing frequency IGE in-ground effects MCU mobile control unit OGE out-of-the-ground effects RSF rotor shaft frequency VTOL vertical takeoff and landing 1 Background
Recent tests of the vertical takeoff and landing (VTOL) aircraft DP-1C revealed
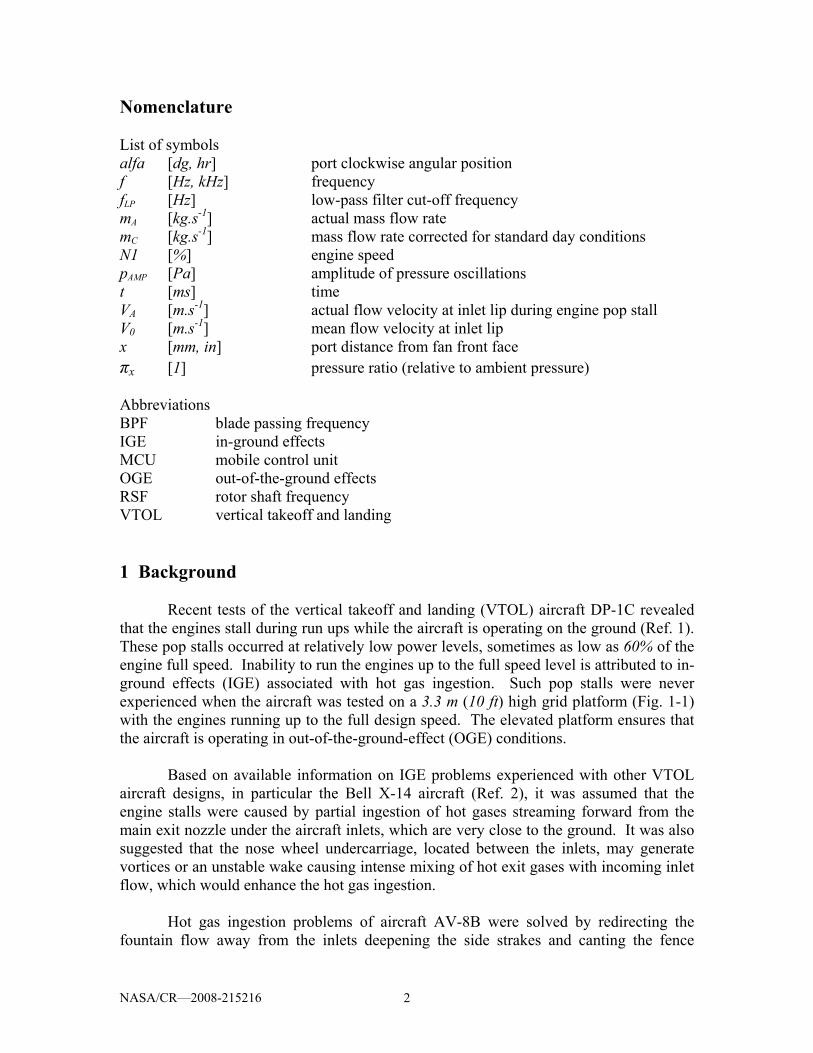
that the engines stall during run ups while the aircraft is operating on the ground (Ref. 1). These pop stalls occurred at relatively low power levels, sometimes as low as 60% of the engine full speed. Inability to run the engines up to the full speed level is attributed to in-ground effects (IGE) associated with hot gas ingestion. Such pop stalls were never experienced when the aircraft was tested on a 3.3 m (10 ft) high grid platform (Fig. 1-1) with the engines running up to the full design speed. The elevated platform ensures that the aircraft is operating in out-of-the-ground-effect (OGE) conditions.
Based on available information on IGE problems experienced with other VTOL
aircraft designs, in particular the Bell X-14 aircraft (Ref. 2), it was assumed that the engine stalls were caused by partial ingestion of hot gases streaming forward from the main exit nozzle under the aircraft inlets, which are very close to the ground. It was also suggested that the nose wheel undercarriage, located between the inlets, may generate vortices or an unstable wake causing intense mixing of hot exit gases with incoming inlet flow, which would enhance the hot gas ingestion.
Hot gas ingestion problems of aircraft AV-8B were solved by redirecting the
fountain flow away from the inlets deepening the side strakes and canting the fence

NASA/CR—2008-215216 3
further forward (Ref. 3). In case of the airplane DP-1C, several attempts to prevent the hot flow lift up by inserting a ‘roof’ above the nose wheel did not prevent the engine stalls. Also a fence around the inlets (Fig. 1-2), which simulated a similar arrangement on the Bell X-14, did not succeed in elimination of engine stalls. Later on, laser-sheet flow visualization tests were carried out to map the flow around the engine inlets; however, no firm conclusion was reached about the cause of the engine stalls. A detailed description of these experiments is presented in Ref. 4.
After reviewing the results of these trials it was suggested that the engine stalls
may be caused by either an inlet ‘organ pipe’ resonance excited by a vortex street generated by the nose wheel, or by inlet instability due to the mutual interaction of two closely coupled engine inlets (flow swinging). The latter option was based on apparent flow jumping between the inlets sometimes observed during the laser-sheet flow visualization. A third possibility was that the engine stalls are caused by a ground vortex being ingested into the engine inlet. Of course, the core of ingested ground vortex would also suck in hot gas from the exit nozzle stream adjacent to the ground.
In order to assess any of these three options, it was decided to run only one
engine, while the other engine was completely shut down. Running only the left engine, the engine was accelerated up to full speed without experiencing engine stall. As will be seen later, this was not always the case, and even running a single engine, the engine sometime stalled, albeit at a speed of 80% and higher. However, at the time of the first test of a single engine it was viewed as proof that the engine stalls were not caused by the ‘organ pipe’ resonance or by a steady ingestion of exit hot gases. Therefore, the experimental effort was focused on double inlet instability, or more likely, on inlet flow distortions due to ground vortex ingestion, because engine stall problems had been reported in the past on aircraft using thrust reversing to assist braking (Ref. 5). It was decided to instrument the engine inlets with pressure modules for unsteady pressure measurements along the inlet duct walls to further investigate the problem.
2 Modules for unsteady pressure measurements The NASA Glenn Research Center has multiyear experience with measurement of
high frequency pressure oscillations in aircraft propulsion systems (Refs. 6, 7, and 8). In order to diagnose the reasons for engine stalls reliably, unsteady pressure oscillations inside the engine, in the inlets, and in front of the aircraft must be measured. However, in the case of the DP1 aircraft, no instrumentation was permitted inside the engines without revoking their flight worthiness. Therefore, only measurements inside the inlets, and in front of the aircraft were planned for. In the first phase of experiments the measurements were carried out in both engine inlets. Measurements of the flow field in front of the aircraft were planned for the second phase of experiments.
Miniature pressure transducers for measurements of high frequency pressure
oscillations are very fine and fragile devices that must be treated very carefully to acquire reliable pressure data and secure longevity of these expensive instruments. In order to

NASA/CR—2008-215216 4
achieve these goals, NASA engineers have adopted an approach of packaging miniature transducers into modules that allow easy installation, simple and reliable electric and pneumatic connections, quick removal for recalibration, and maximum transducer protection for mishandling and harsh environment.
The pressure modules, which were eventually installed in the inlets of aircraft
DP-1C, were designed with the same philosophy as those developed for NASA testing. A drawing of the pressure module is shown in Fig. 2-1. The miniature pressure transducer (part 1 in Fig. 2-1) is mounted on a transducer bed (part 4) in such a way that the sensitive diaphragm of the transducer is about 1 mm away from the flow surface of the engine inlet. The transducer cover (part 5) protects the transducer against mishandling and supports electrical (part 6) as well as pneumatic (part 7) connectors. Fine electric wires and the back pressure tube of a miniature pressure transducer, both sensitive to possible damage, are attached to cover connectors and thus protected from the excessive loads often encountered with installations of bare transducers only. The electric wires and back pressure tube are not shown in Fig. 2-1. Components of a pressure module prior to assembly are shown in a photograph in Fig. 2-2, a pressure transducer mounted on the transducer bed is shown in Fig. 2-3, and finally a view of a partially assembled pressure module is in Fig. 2-4, where electric wires and connecting tubes to cover connectors are clearly visible.
After the assembly of the transducer module was completed, the cover side walls
were closed with two lids. The metallic cover is also an excellent shield against electromagnetic interference. Two views of all pressure modules fabricated are in Figs. 2-5 and 2-6. Pressure modules were color coded and labeled for easy identification. All pressure transducers used had a range ±35 kPa (±5 psid). Modules labeled WS1A, B, C were furnished with Kulite transducers XCS-190-5D, modules WS2A,B were furnished with extended temperature range transducers Kulite XTE-190-5D. Finally module WS3A1 was equipped with transducer XCS-190-5D; however the static tap had a larger diameter than the rest of the modules (1.5 mm versus 0.75 mm) in order to increase the frequency range of this module.
The pressure module also contains a conventional static tap the serves to verify
the average pressure levels measured by the miniature pressure transducer. Transducer signals tend to drift sometimes, and therefore a ‘sanity’ check by the static pressure tap is highly recommended. Both pressure taps can be seen in Fig. 2-7 where a ‘flow’ face of a mounted pressure module is shown.
The pressure modules were mounted in the aircraft inlet on inserted base plates, as
described in the following section. Overall dimensions of the transducer module assembly, including the base plate, are given in Fig. 2-1, indicating the space requirements needed for the installation of transducer modules.

NASA/CR—2008-215216 5
3 Data acquisition setup and instrumentation layout
A schematic drawing of the entire data acquisition setup is shown in Fig. 3-1. The aircraft inlets were instrumented with six pressure modules (Pos. 1 in Fig. 3-1). The pressure transducers were powered and their signals were recorded by a National Instrument (NI) unit PXI 1010 (Pos. 6). The connections were provided by four-wire shielded cables (Pos. 2). The pneumatic conventional taps were connected by tubing (Pos. 3) to individual Validyne P855 pressure transducers (Pos.4). The low-frequency Validyne transducers were powered and their signals were recorded by the unit PXI 1010 (Pos. 6) via shielded cables (Pos. 5). The data acquisition unit PXI 1010 was controlled remotely by a NI unit PXI 1000B (Pos. 10), which was located in the Mobile Control Unit. The connection between both PXI units was provided via fiber optics cable (Pos. 7). Finally, both units were powered by an external generator (Pos. 9) supplying a voltage of 120 V via a grounded power cabled (Pos. 8).
Signals from rotational speed pickups N1 (fan revolutions) for each engine were
also acquired by the NI unit PXI 1010. Connections for these two signals are not shown in Fig. 3-1. All the signals acquired were recorded by the same unit, and therefore the signals have a common time datum base, and all the signals recorded are mutually synchronized.
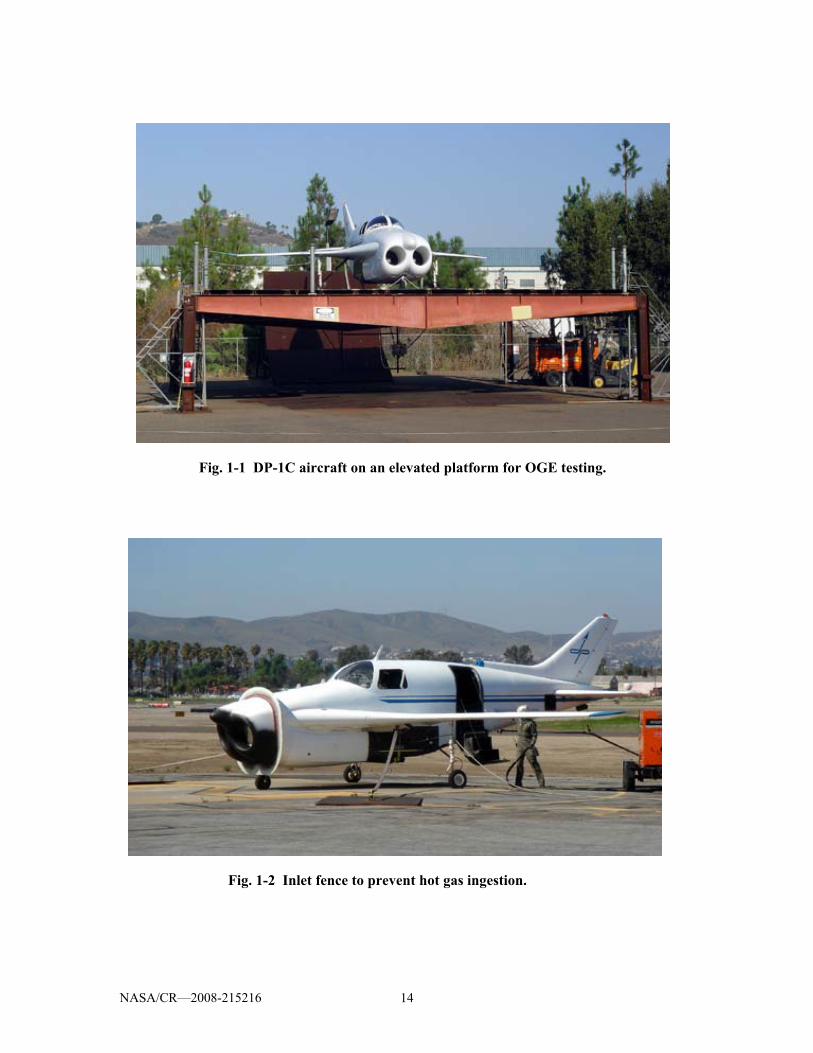
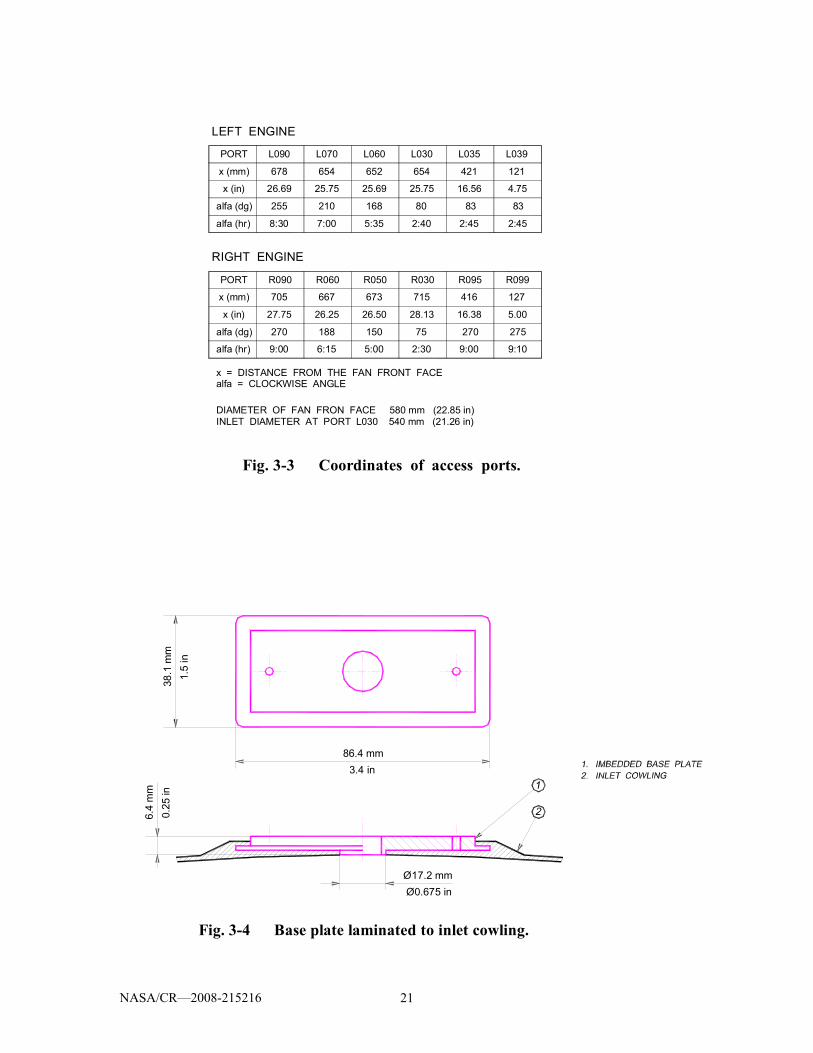
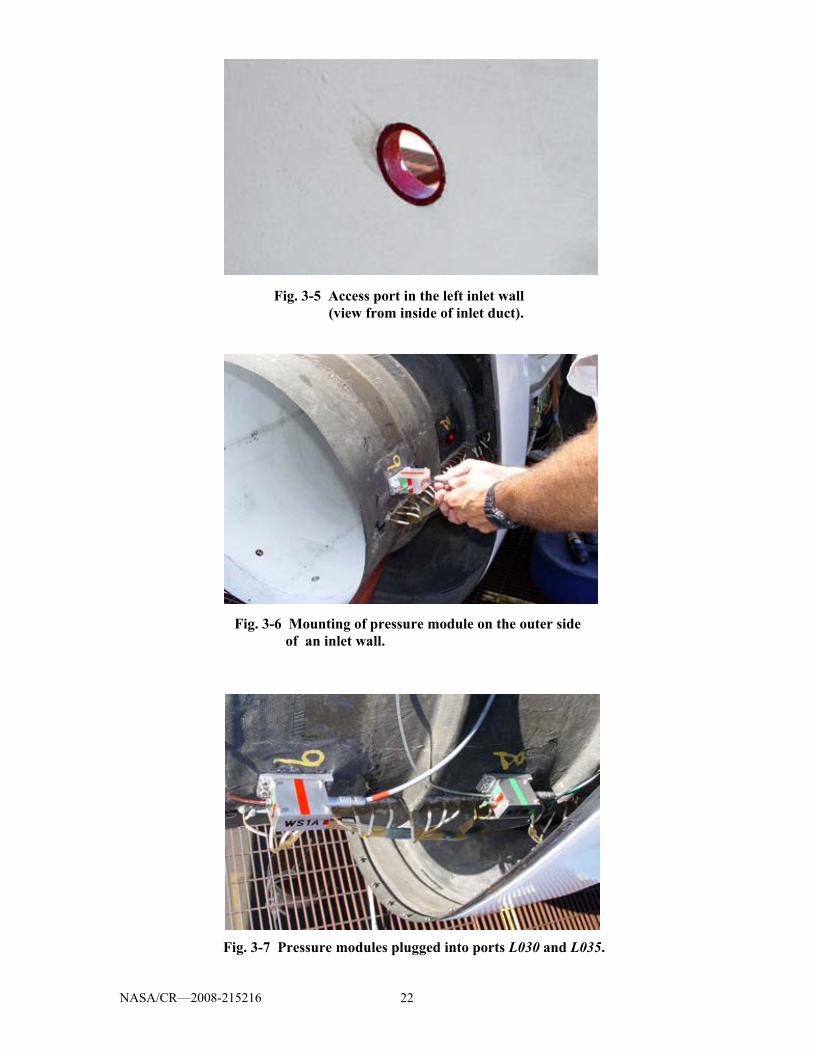
A layout of the measurement ports made in both engine inlets is presented in Fig. 3-2; altogether 12 measurement ports were made. A table shown in Fig. 3-3 lists all the relevant dimensions. Pressure modules must be mounted flush with the flow surface to measure the wall static pressure correctly. Any protrusion or cavity at the module face, relative to the flow surface, will generate pressure fluctuations or at least noise levels that are not present in the undisturbed flow. The thickness of the DP-1 inlet cowling varies between 1.0 mm and 1.5 mm (40 and 60 μinch). In addition to varying thickness, the cowling surface is curved. To assure that pressure modules are mounted correctly, it was decided to implant a metal base plate into the cowling, and to attach a pressure module to this base. The base plate is shown in Fig. 2-1 (part 3) and Fig. 3-4 (part 1). For a proper plate insertion, the edge of the central hole in the base plate was first aligned with the flow surface of the cowling, and then the plate was laminated to the cowling on the opposite surface of the cowling. By this method, all the base plates were correctly placed on the cowling even in locations where the curvature of the surface was quite high. A finished measurement port, ready for pressure module insertion, is shown in Fig. 3-5. Mounting of a pressure module in port L030 is depicted in Fig. 3-6. Two pressure modules, mounted in ports L030 and L035, with electrical and pneumatic connections in place are shown in Fig. 3-7. A view of a measurement port from inside an inlet duct with a pressure transducer inserted in the inlet wall was already shown in Fig. 2-7. Ports with base plates that were not used for a particular test run were closed with plugs flush with the inner wall of an inlet duct. An outside view of such plugs is shown in Fig. 3-8. A photograph of instrumented inlets prior mounting of the front cowling is in Fig. 3-9. Finally, Figs. 3-10 and 3-11 show the instrumented left and right inlets, respectively, with a front cowling mounted on the aircraft.

NASA/CR—2008-215216 6
The main data acquisition unit PXI-1010 was located on board the DP-1C aircraft. The photograph in Fig. 3-12 depicts the unit on the aircraft floor during shake down tests of communication with the main computer located in the Mobile Control Unit (MCU). For the actual testing, the unit was squeezed behind the pilot seat as seen in Fig. 3-13. An overall view of the entire test site is shown in Fig. 3-14; the MCU is on the left hand side of the photograph, the DP-1C aircraft in on the raised platform for the OGE testing. A view of the tested aircraft from the MCU cockpit is in Fig. 3-15. The controlling program for the instability tests was written in LabVIEW 8.5. An image of the main screen of the controlling program is captured in Fig. 3-16.
After unsteady pressure measurement tests were completed, the available ports
were expected to be utilized for thermocouple probes to measure flow temperature distribution in the inlets in case that hot gas ingestion was encountered at high engine power settings. Unfortunately, these tests were not performed because of termination of the development program. 4 Overview of test conditions
The inlet instability tests were carried out for two basic ‘flight’ conditions: (1)
out-of-the-ground effects (OGE) and (2) in-ground effects (IGE). The OGE tests were carried out on a raised platform with a deployed bare nose wheel (Fig. 4-1). The IGE tests were executed for three configurations: (1) a deployed bare nose wheel, (2) deployed faired nose wheel, and (3) removed nose wheel (simulating retracted nose undercarriage). The IGE test configurations are shown in Figs. 4-2 through 4-4.
A summary of selected test runs carried out during the inlet instability tests is
presented in Figs. 4-5 through 4-8. The OGE tests carried out on the raised platform are presented in Fig. 4-5. As seen in this figure, the OGE tests were performed with both engines running simultaneously, as well as for a single engine, left or right, operating. The tests carried out on the ground (IGE) are presented in Fig. 4-6 for the deployed bare nose wheel, in Fig. 4-7 for the deployed faired nose wheel, and finally in Fig. 4-8 for the nose wheel removed.
No engine stalls were observed for the OGE conditions. For the IGE conditions,
however, several engine stalls were recorded. There is no obvious pattern for engine stalls. From nine recorded engine stalls, seven stalls were experienced for the left engine and two stalls for the right engine. The engine stalls happened for engine speeds between 60% and 82%, with either both engines or a single engine running. Sometimes the engines ran at a higher speed than one for which they stalled in other runs. In one case, two stalls separated only by 300 ms occurred on the same engine. There was no detectable correlation of nose wheel configuration with engine stalling. The entire phenomenon of engine stalls appears to be somewhat random.
Several comments should be made about acquired and plotted parameters before
analyzing the available data. The instantaneous engine speed was recorded by sampling

NASA/CR—2008-215216 7
the frequency signal generated by the engine pick-up. The frequency of this signal is proportional to the engine speed, and its amplitude also varies somewhat with the engine speed. A conversion of digitized high frequency signal (6340 Hz for full engine speed) into engine speed required approximations that unfortunately added a certain jitter to the speed signal. The following two-step procedure was performed to minimize jitter in the engine speed signals. First, the entire speed signal record was subdivided into subintervals coincident with rotor revolution periods, and then average values for each rotor revolution were computed. Similar procedures were also applied to pressure signals in cases when it was desirable to improve plot readability by suppressing pressure fluctuations generated by passing fan blades.
5 Out-of-ground effect tests Unsteady pressure measurements in the engine inlet ducts while the aircraft was
placed on a raised platform served two purposes. First, the out-of-the-ground effect test runs were considered as shake-down tests for the entire data acquisition system and data reduction procedures. Secondly, the results acquired were used to establish a base line data set for the follow up IGE experiments.
There were no pop stalls recorded or observed for the out-of-the-ground effects
while the both engines were operated up to 90% of the full speed. The unsteady pressure data, recorded at left engine inlet port L030 were used to estimate the engine mass flow rate and inlet flow velocity as a function of engine speed. These estimates were based on a recorded ambient pressure, temperature, and humidity, and on a static pressure measured at a single port in the engine inlet. Consequently, the effects of possible non-uniform static pressure distribution around the inlet lip are not reflected in these estimated values. Measured engine mass flow rate and inlet flow velocity were corrected for the standard day conditions and are presented in Fig. 5-1. As seen in this figure the maximum corrected engine mass flow rate recorded was 46.3 kg/s for 90% of the engine speed, and the corresponding maximum inlet flow velocity was 198.2 m/s. The engine mass flow rate presented is in all likelihood slightly higher than the actual value, because no boundary layer effects, ‘vena contracta’, or possible flow separation around the inlet lip were considered here.
Unsteady pressure data from several test runs were subjected to a frequency
analysis to investigate possible self induced flow oscillations in the engine inlet ducts. While performing the OGE tests, both engines were operated at several speeds that were kept constant during the data acquisition intervals. Frequency spectra of pressure fluctuations can easily be generated for constant test conditions. For a constant engine speed, a frequency line that is not associated with an engine order will be clearly detectable among shaft and blade passing harmonics. For the IGE tests, however, mostly transient data were recorded for variable engine speeds. The spectra for transient test runs do not show sharp frequency lines, the engine order harmonics are smeared over the range of speed variations, which masks all other frequency lines of interest. Therefore, only pressure spectra for the OGE test are presented here.

NASA/CR—2008-215216 8
Unsteady pressure spectra for ports L030 (inlet lip of the left engine) and R050 (inlet lip of the right engine) are presented in plots in Fig. 5-2 and 5-3. These spectra were generated using data of test run D1_02_19. The upper plot in each figure is for the frequency range up to 12 kHz, whereas the lower plot has a range to 4 kHz only, which is just up to the first harmonic of the blade passing frequency for the given engine speed. The upper plots clearly show that the pressure oscillations at a frequency of the first and second harmonics of the fan blade passing frequency (BPF) propagate upstream through the entire inlet duct up to the lip. The right engine exhibits pressure oscillations that are a little more intense than those of the left engine. As seen in the lower plots, the harmonics of the rotor shaft frequency (RSF) are stronger for the right engine (Fig. 5-3), in particular the 3rd, 4th, 5th, 12th, 13th, and 16th harmonics. Of course the 17th RSF harmonic is also the 1st BPF harmonic. Asynchronous frequencies, that are not RSF or BPF harmonics, can be detected in pressure spectra of both engine inlets. These frequencies are labeled A for the left engine (Fig. 5-2), and B or C for the right engine (Fig. 5-3).
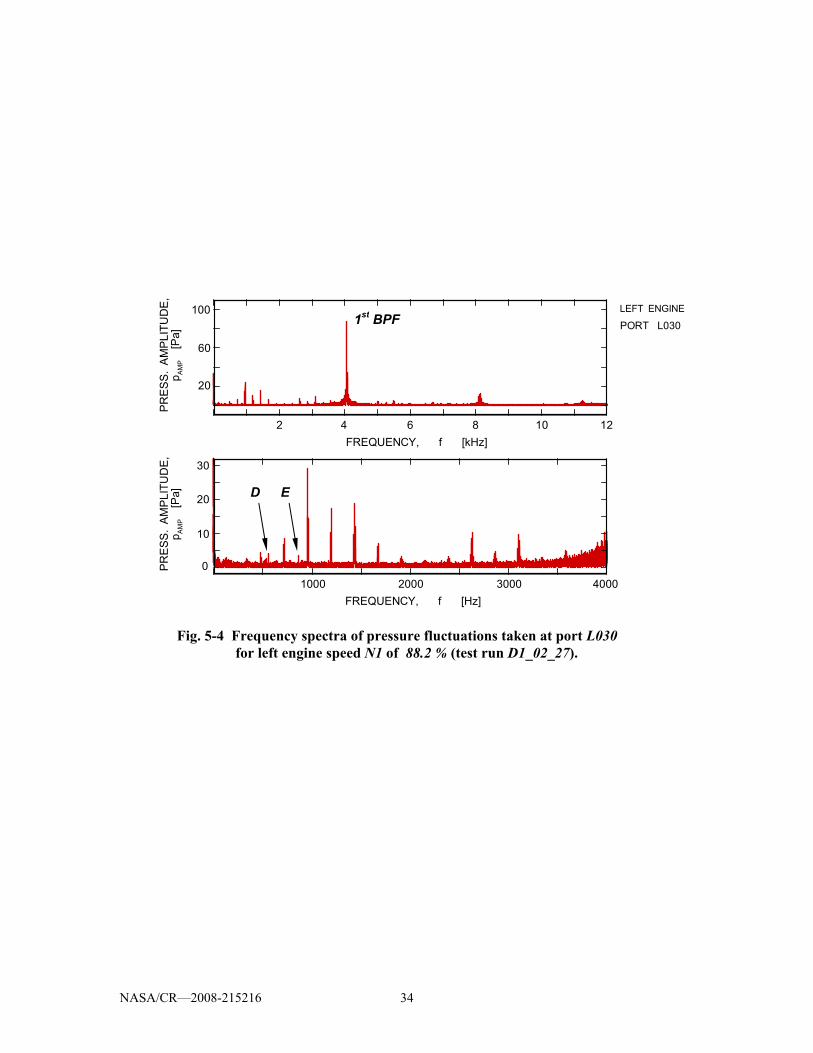
Spectra for three sensors located along the length of the left engine inlet duct (Ports L030, L035, and L039) are presented in Figs. 5-4 through 5-6. These spectra were generated for test run D1_02_27. On comparing the upper plots in these figures, it is obvious that the amplitude of the blade passing frequency (1st BPF) oscillations increases significantly closer to the engine fan face. The amplitude increases from 90 Pa at the inlet lip (Port L030, Fig. 5-4) up to 420 Pa just in front of the engine fan (Port L039, Fig. 5-6). Contrary to it, the RSF harmonics below the blade passing frequency, presented in lower plots, maintain more or less the same amplitudes. Amplitudes of asynchronous frequencies, labeled D and E, increase slightly closer to the engine fan. The origin of these asynchronous frequencies is not clear; their amplitudes are less than 10 Pa. Flow or pressure disturbances of such small amplitude will not, for sure, instigate any engine instability, as is manifested by the smooth engine operation under the OGE conditions up to the full engine speed.
6 In-the-ground effect tests As stated above, in-the-ground effect testing was carried out for three
configuration of the aircraft nose undercarriage. These configurations were (1) deployed bare nose wheel, (2) deployed faired nose wheel, and (3) retracted (actually removed) nose wheel. Generally, no significant differences were found among these three configurations as far as engine stalls were concerned. All together, nine cases of engine stalls were recorded. Seven out of the nine recorded engine stalls occurred on the left engine, and only two stalls were recorded for the right engine. There was no case during this phase of testing, in which both engines stalled on the same test run.

NASA/CR—2008-215216 9
6.1 Deployed bare nose wheel tests In order to better understand the time sequence of pressure changes during an
engine stall, test run D1-04-18 will be explored in detail. The entire 20 s long run is depicted in Fig. 6-1. The plots show the history of speeds of both engines (the upper plot), the associated history of pressure changes recorded by four pressure transducers in the left inlet duct (the middle plot), and finally two pressure traces recorded in the right inlet duct. Locations of pressure transducer modules in both inlet ducts were presented in Fig. 3-2.
As seen in Fig. 6-1, both engines accelerated from about 60% to 70% speed, the
left engine (red curve) being slightly faster. At about 72% speed, the left engine stalled (small dip in the red speed curve, arrow A), while the right engine was running smoothly. Approximately 1.5 seconds after the engine stall the pilot throttled back both engines (arrow B), and the engines decelerated to 25% speed. As seen in the middle plot, wall pressures in the left inlet duct were initially decreasing at the beginning of the record as the engine accelerated, and then a sudden pressure spike (arrow C) appeared indicating the engine stall. Wall pressure traces in the right inlet duct (the bottom plot) do not exhibit a pressure spike, which indicates no stalling of the right engine. After the engines were throttled down (arrows D and E), the wall pressures in both inlet ducts increased to nearly an ambient pressure level. Pressure levels measured close to the fan face (ports L039 and R099) are slightly higher than pressure levels at the inlet lips (ports L030 and R050) due to a mild diffusion of the inlet ducts.
To improve the time resolution and readability of the plots, the data are replotted
for a smaller time interval centered about the pressure stall spike. First the time interval was reduced to 4 s, as shown in Fig. 6-2, and also the scale of fan revolutions was refined. A sudden drop in the speed of the left engine is now clearly visible (arrow A, red line). The fan velocity reaches its local minimum in about 0.2 s from the instant of the stall start, then the speed increases rapidly for about 0.3 s, and finally after additional 0.7 s the fan speed is back at its prestall level.
The time resolution was further increased to observe the changes in pressure
signals. Figs. 6-3 and 6-4 depict time interval of 240 ms. The period of one engine revolution for the 70% speed is about 5.4 ms, which means that the plots depict an interval of 44 engine revolutions. Engine revolution averaging, as described above, is still suitable for engine speed graphs because of the relatively slow changes in the engine speed. However, in the case of pressure data such averaging may suppress important details in the fast changes of pressure fluctuations. Therefore, the pressure data in Fig. 6-3 is plotted as acquired. As seen in this figure, the pressure traces are very wide now, due to the fluctuations generated by fan blades. The width or ‘fuzziness’ of the traces is a measure of signal unsteadiness. For the left engine, the traces from all pressure transducers are of the same width. For the right engine, however, the situation is different. The signal measured in front of the fan (port R099) exhibits much higher unsteadiness than the one taken at the inlet lip (port R050). As stated earlier, the pressure transducer module plugged into port R099 (WS3A1) was designed for a higher frequency

NASA/CR—2008-215216 10
response than the rest of the modules, and thus it captures a wider spectrum of pressure fluctuations. To improve the graph readability, the pressure signals were filtered with a low pass filter with a cut-off frequency of 1000 Hz. A low pass filter removes high frequency fluctuations from a signal, but also introduces a certain small time delay. Because all the pressure data presented were filtered with the same cut-off filter, the time delay is identical for all the signals. Consequently, the mutual time relation among all pressure signals is not affected by filtering. Filtered data are presented in Fig. 6-4, where the individual pressure traces can be easily observed. There is no visible disturbance in pressure data of the left engine ahead of the engine stall (arrow A). There is an increased level of unsteadiness on the right engine pressure signals (arrow B), about 40 ms ahead of the left engine stall. It is not clear, however, if this had anything to do with the left engine stalling.
A sequence of pressure changes in the inlet duct can be detected in Fig. 6-5. The
interval depicted in this plot is reduced to 60 ms. It is difficult to reconstruct the flow behavior based solely on the wall static pressure data (total pressure or velocity data would have been more definitive); nevertheless, the following scenario is most probable. Ahead of the pressure surge the pressure level in front of the fan is slightly higher than that at the inlet lip which indicates undisturbed flow through a mildly diffusing inlet duct (red line versus blue line). Once the engine stalls, a pressure burst (arrow A) propagates from the fan face (port L039, red line) through the inlet duct (port L035, green line) towards the inlet lip (ports L030 and L070, dark and light blue lines). The pressure level in the entire duct increases significantly, and then for a short period the flow in the inlet duct stops (all pressures in the inlet duct are equal). While there is a little flow in the inlet duct, the pressure level in the entire duct is uniformly dropping (arrow B). After that, the pressure level at the fan face increases again (arrow C), whereas the pressures at the inlet lip and mid channel are more or less steady (disregarding small very low frequency oscillations), and close to the ambient pressure level (arrow D). Such a static pressure distribution may indicate reverse flow in the inlet duct, which lasts for about 30 ms (approximately 6 engine revolutions). Finally, the flow stops again (all pressures in the inlet duct are equal), and inflow in the fan starts again (arrow E) as the engine resumes normal operation.
The propagation speed of the pressure burst can be determined reliably by
measuring the time interval for the pressure burst to travel from one measurement port to another. As indicated in Fig. 6-6, the pressure burst for a pressure level of πx = 1.05 spreads from port L039 to port L035 in 0.947 ms, and it takes an additional 1.073 ms for the burst to reach port L030. The average propagation velocity of the pressure burst is 289.2 m/s (948.8 fps ). This is a propagation velocity relative to the inlet surface, not relative to the incoming flow; of course, a pressure disturbance propagates in air with the speed of sound, which in the case of test D1_04_18 was about 349 m/s, based on the measured total (ambient) temperature of 303 K. The measured speed of the pressure burst relative to the inlet walls was 289 m/s, which implies that the air inlet velocity could not be higher than 60 m/s. In the case of the OGE operation (Fig. 5.1) the inlet flow velocity was about 135 m/s at the relative engine speed of 72%. Obviously, the pop stall occurrence must decrease the inlet flow velocity significantly.

NASA/CR—2008-215216 11
Variations of the inlet flow velocity for the pop stall occurrence were calculated using a wall pressure signal detected at port L030, and the measured ambient (total) conditions. A procedure similar to that used to determine the engine mass flow rate for the OGE tests (Fig. 5.1) was employed again, this time however for the unsteady static pressure input. Results of these calculations are presented in Fig. 6-7. As seen here, the inlet flow velocity, and consequently also the engine mass flow rate, drops to zero or even to very low negative values, for a short period of about 5 ms, just after the pressure burst reaches the inlet duct lip. During 2 ms of this rapid inlet velocity deceleration from about 130 m/s to zero was an instant when the inlet velocity passed the level of 60 m/s, which most likely was the instant for which the burst propagation velocity of 289 m/s was determined. Results presented in Fig. 6.7 correlate very well with the description of inlet flow behavior, which was based on pressure changes depicted in Fig. 6-6, and was described above.
Values of the mass flow rate and inlet velocity during the instant of the pop stall
back flow appear to be extremely high; however, it all happens in a very short time interval. The design pressure ratio of the PWC 535A engine is about 1.84, thus there is a sufficient pressure buildup behind the fan rotor to drive the flow back once the fan is stalled. Also, the back flow through the inlet duct lasts for only about 5 ms, and during that period the accumulated air mass pushed back through the inlet is less than 0.15 kg.
Finally, the shortest segment of data (6 ms) presented in Fig 6-6 is shown once
again in Fig. 6-8; however, this time unfiltered data are shown. As seen in this figure, in particular in the data for the right engine, the data acquisition setup has a sufficiently high sampling frequency to distinguish blade potential flow fluctuations ahead of the engine fan. As marked in this figure, effects of all 17 blades are clearly captured during one fan revolution. It is worthwhile to note that the fan blade potential flow fluctuations can be detected as far as at the inlet lip (port R050).
6.2 Deployed faired nose wheel tests
Two out of the nine recorded engine stalls occurred on the right engine. One of
these stalls, which occurred for the configuration with the faired nose wheel, is depicted in Figs. 6-9 and 6-10. Basically, there is no visible difference in the right engine response to an inlet disturbance compared to the left engine response. Engine stall was manifested by a rapid drop in the engine revolution level (arrow A in Fig. 6-9), followed by a recovery to normal operation conditions. As in all previous cases this recovery was interrupted by throttling the engines. The right engine stall is replotted on a finer time scale in Fig. 6-10. The pressure trace recorded at the inlet port close to the fan face (port R099) exhibits higher instabilities than was the case for a similar port on the left inlet (port L039). The reason for it is the wider frequency range of the WS3A1 pressure module as discussed earlier.

NASA/CR—2008-215216 12
6.3 Retracted nose wheel tests An extremely interesting data set was recorded for the configuration with the nose
wheel retracted (record D1-03-18.). During this test run, two pop stalls were recorded as presented in Fig. 6-11 (arrows A and B). The left engine stalled twice in a row, with only 256 ms separating the stalls, as depicted in Fig. 6-12. The stall pressure bursts are labeled Stall A and Stall B for later identification. Surprisingly, Stall B occurred during the recovery phase of Stall A at visibly lower engine speed than the one at the Stall A instant. This may indicate that engine stalls are not set off by continuous or a long time scale event, but by some sudden intermittent disturbance in the inlet flow. If, for example, the engine stall is set off by a ground vortex intrusion in the inlet, then in this case the pressure burst and outflow from the inlet generated by Stall A did not blow the ground vortex away from the inlet, but the vortex returned back in the inlet, set the Stall B, and then finally was blown away by the burst generated by Stall B. It appears that after Stall B, the engine was recovering to normal operation, but was terminated by throttling both engines (arrow C in Fig. 6-11).
7 Summary of in-the-ground effect tests In-the-ground effect test runs for all three nose wheel configurations for which
engine stalls were recorded are summarized in Figs. 7-1 and 7-2 for the left engine and for the right engine, respectively. Segments of data 60 ms long were chosen for this comparison. The charts in these figures are arranged in an increasing order of the stall engine speed, regardless of nose wheel configuration. The nose wheel configuration is marked in each chart. Also, the test run labels are given in each chart which allows a quick cross reference to the summary of test runs presented in Figs 4-6 through 4-8. Viewing the charts in Figs 7-1 and 7-2 clearly indicates that the nose wheel configuration has little or no effect on the engine stall response and its effect on the inlet flowfield fluctuations. The character of the inlet flowfield is basically the same for all the data sets presented, except that the intensity of the pressure fluctuations increases with increasing engine speed at which the stall occurred. As seen in the lowest two charts in Fig. 7-1 (left engine running alone and stalling at 80% speed and higher), the intense pressure fluctuations detected in front of the fan face (port L039, red line) spread upstream even beyond the mid point of the inlet duct (port L035, green line). A rough estimate of the period of these fluctuations and its ratio to the engine revolution period indicates that these fluctuations are probably generated by a rotating stall cell on the fan rotor. For example, for the left engine at 82.7% speed (D1-03-42), the ratio of periods is 45%, and for the right engine at 67.8% speed (D1-04-07), the ratio is 28%. These values are within a commonly accepted range of rotating stall cell speed to engine shaft speed ratio of 25% to 60%.
An important fact to be noticed in these figures is that there is no detected
instability in the inlet duct wall static pressures prior to the arrival of pressure bursts caused by to engine stalls. It is true that only 10 ms of data (about two engine revolutions) are shown ahead of the burst, but no static pressure instability was observed

NASA/CR—2008-215216 13
even for several seconds of data ahead of the stall (e.g. Figs. 6-8 and 6-10). It appears that the inlet disturbance which leads to engine stalls is not manifested by changes in the wall static pressure distribution of the inlet flow. Also, it should be mentioned that stalls of both engines at the same time were never recorded.
The facts stated above indicate that engine stalls are probably evoked by a sudden
ingestion of a vortex generated between the two streams moving in opposite directions: outbound hot gas stream from the main nozzle close to the ground and inbound inlet flow above. At a certain velocity ratio of these two streams, which is a function of engine speed, the vortex reaches an intensity level at which the left or the right end of the vortex attaches to a firm surface (either ground or the surface of the aircraft) and the other end is swallowed by one of the aircraft inlets. Once the vortex enters the inlet duct a puff of hot air can be sucked through the vortex core into the engine. Because the vortex core size is significantly smaller than the inlet diameter, wall static pressures on the inlet inner walls are not or only very little affected by the vortex presence. Once the engine stalls, the outflow from the inlet pushes the vortex away and the engine resumes normal operation. Because the engines were always throttled down after the pilot heard the pop noise, it is difficult to predict what would happen next. Of course this is just a hypothesis based on circumstantial evidence. Extensive smoke flow visualization ahead of the aircraft inlets, accompanied by velocity and unsteady total pressure measurements in the inlets are needed to provide a full explanation of the causes for engine stalls, and suggest corrective measures to ensure flawless operation of the engines at full power while the aircraft is in close proximity to the ground. References
1. DuPont, A.A. and Reuss, R.P.: “Testing an Inlet for a Twin Engine VTOL Aircraft,” Paper ISABE 2003-1112, Sep. 2003.
2. Bell Aircraft Corporation: “X-14 Research Airplane Summary Report,” Report no. 68-989-004, Sep. 1958.
3. Saripalli, K.R., Flood, J.D., and Moss, G.M.: “Inlet Hot Gas Ingestion (HGI) and Its Control in V/STOL Aircraft,” AIAA Paper 975517, 1997.
4. DuPont, A.A.: “Tethered Hover of DP-1C Test Aircraft,” Final report, ONR Contract no. N00014-07-C-0385, Dec. 2007.
5. Motycka, D.L.: “Ground Vortex – Limit to Engine/Reverse Operation,” Transaction of the ASME, Journal of Engineering for Power, pp. 258-264, Apr. 1976.
6. Lepicovsky, J. et al: “Methodology of Blade Unsteady Pressure Measurement in the NASA Transonic Flutter Cascade,” NASA/TM—2002-211894, Oct. 2002.
7. Lepicovsky, J. and Braunscheidel, E.P.: “Measurement of Flow Pattern Within a Rotating Stall Cell in an Axial Compressor,” NASA/TM—2006-214270, Jun. 2006.
8. Lepicovsky, J.: “Unsteady Velocity Measurements in the NASA Research Low Speed Axial Compressor”, NASA/CR—2007-214815, May 2007.
NASA/CR—2008-215216 14
Fig. 1-1 DP-1C aircraft on an elevated platform for OGE testing.
Fig. 1-2 Inlet fence to prevent hot gas ingestion.

NASA/CR—2008-215216 15
Fig. 2-2 Components of the transducer module.
Fig. 2-1 Transducer module assembly for DP-1C tests.
3.40
50.8
mm
2.0
in38
.1 m
m1.
5 in

NASA/CR—2008-215216 16
Fig. 2-3 Wall pressure module under construction.
Fig. 2-4 Partially assembled wall pressure module.

NASA/CR—2008-215216 17
Fig. 2-5 Assembled wall pressure modules (side view).
Fig. 2-6 Assembled wall pressure modules (view from ‘pneumatic end’).

NASA/CR—2008-215216 18
Fig. 2-7 Pressure module mounted in an inlet wall (view from inlet).
Conventional static tap
Unsteady pressure tap

NASA/CR—2008-215216 19
Fig. 3-1 Basic instrumentation layout for DP-1C inlet instability tests.
1 2 4
3
6
5 7
DP-1C AIRCRAFT
8 9
1 - unsteady pressure transducer (Kulite) 2 - shielded electric cable 3 - pneumatic pressure line 4 - back pressure unit & pressure transducer (Validyne) 5 - shielded electrical cable 6 - signal conditioning unit & A/D boards National Instruments 7 - fiber optics communication cable 8 - power cable AC 120 V 9 - external power source 10 - main data acquisition computer National Instruments
MOBILE CONTROL UNIT
10

NASA/CR—2008-215216 20
Fig. 3-2 Layout of measurement ports in DP-1C inlets.
NASA/CR—2008-215216 21
LEFT ENGINE
PORT L090 L070 L060 L030 L035 L039
x (mm)
x (in)
678 654 421 121654
26.69 25.75
652
25.75 16.56 4.7525.69
alfa (dg)
alfa (hr) 8:30 7:00 5:35 2:40 2:45 2:45
255 210 168 80 83 83
alfa (hr)
alfa (dg)
x (in)
x (mm)
PORT
RIGHT ENGINE
R090 R060 R050 R030 R095 R099
27.75 26.25 26.50 28.13 16.38 5.00
9:109:006:15 5:00 2:309:00
705 667 673 715 416 127
27527075150270 188
x = DISTANCE FROM THE FAN FRONT FACE alfa = CLOCKWISE ANGLE
DIAMETER OF FAN FRON FACE 580 mm (22.85 in)INLET DIAMETER AT PORT L030 540 mm (21.26 in)
Fig. 3-3 Coordinates of access ports.
Fig. 3-4 Base plate laminated to inlet cowling.
38.1
mm
1.5
in
6.4
mm
0.25
in
86.4 mm3.4 in
Ø17.2 mmØ0.675 in
NASA/CR—2008-215216 22
Fig. 3-7 Pressure modules plugged into ports L030 and L035.
Fig. 3-6 Mounting of pressure module on the outer side of an inlet wall.
Fig. 3-5 Access port in the left inlet wall (view from inside of inlet duct).

NASA/CR—2008-215216 23
Fig. 3-8 Unused access ports closed with wall plugs.
Fig. 3-9 View of instrumented inlets with front cowling removed.
Fig. 3-10 Fully instrumented left engine inlet.

NASA/CR—2008-215216 24
Fig. 3-11 Fully instrumented right engine inlet.

NASA/CR—2008-215216 25
Fig. 3-14 Overall view of the test site with the mobile control unit on the left.
Fig. 3-13 Unit PXI-1010 at its final location behind the pilot seat.
Fig. 3-12 Data acquisition unit PXI-1010on board during shake down tests.

NASA/CR—2008-215216 26
Fig. 3-15 View of the tested aircraft from the cockpit of the mobile control unit.
Fig. 3-16 Captured screen of the controlling LabVIEW program.

NASA/CR—2008-215216 27
Fig. 4-1 Configuration with deployed bare nose wheel for out-of-the-ground effect tests.

NASA/CR—2008-215216 28
Fig. 4-2 Configuration with deployed bare nose wheel for in ground effect tests.
Fig. 4-3 Configuration with deployed faired nose wheel for in ground effect tests.

NASA/CR—2008-215216 29
Fig. 4-4 Configuration with removed nose wheel for in ground effect tests.

NASA/CR—2008-215216 30
Fig. 4-5 Out-of–the-ground effects -- selected test conditions for deployed bare nose wheel.
60 80 100
LEFT RIGHT ENGINE
ENGINE
RIGHT ENGINELEFT ENGINE
ENGINELEFT ENGINERIGHT
RIGHT ENGINELEFT ENGINE
ENGINEENGINERIGHT
LEFT
ENGINEENGINERIGHT
LEFT
LEFT RIGHT ENGINE
ENGINE
ENGINEENGINERIGHT
LEFT
LEFT RIGHT ENGINE
ENGINE
ENGINEENGINERIGHT
LEFT
40
ENGINEENGINERIGHT
LEFT
LEFT RIGHT ENGINE
ENGINE
ENGINEENGINERIGHT
LEFT
BARE NOSE WHEEL
D1-02-03
D1-02-07
D1-02-14
D1-02-16
D1-02-17
D1-02-18
D1-02-19
D1-02-23
D1-02-24
D1-02-25
D1-02-26
D1-02-27
D1-02-29
20ENGINE SPEED N1 [ % ]
Fig. 4-6 In-ground effects -- selected test conditions for deployed bare nose wheel.
50 60 70 80 90 100
ENGINEENGINERIGHT
LEFT
ENGINEENGINERIGHT
LEFT
LEFT RIGHT ENGINE
ENGINE
40
ENGINE STALLBARE NOSE WHEEL
D1-04-17
D1-04-18
D1-04-20
ENGINE SPEED N1 [ % ]

NASA/CR—2008-215216 31
Fig. 4-7 In-ground effects -- selected test conditions for deployed faired nose wheel.
ENGINEENGINERIGHT
LEFT
LEFT RIGHT ENGINE
ENGINE
ENGINEENGINERIGHT
LEFT
ENGINE STALLFAIRED NOSE WHEEL
D1-04-07
D1-04-08
D1-04-09
40 1009080706050ENGINE SPEED N1 [ % ]
Fig. 4-8 In-ground effects -- selected test conditions for nose wheel removed (retracted).
D1-03-44
50 60 70 80 90 100
D1-03-45
LEFT RIGHT ENGINE
ENGINE
RIGHT ENGINELEFT ENGINE
ENGINELEFT ENGINERIGHTD1-03-46
RIGHT ENGINELEFT ENGINED1-03-47
ENGINEENGINERIGHT
LEFT D1-03-43
ENGINEENGINERIGHT
LEFT D1-03-42
LEFT RIGHT ENGINE
ENGINE
ENGINEENGINERIGHT
LEFT
LEFT RIGHT ENGINE
ENGINED1-03-18
D1-03-19
D1-03-20 ENGINEENGINERIGHT
LEFT
D1-03-30
40
ENGINEENGINERIGHT
LEFT
D1-03-12 LEFT RIGHT ENGINE
ENGINE
D1-03-16
ENGINEENGINERIGHT
LEFT D1-03-31
ENGINEENGINERIGHT
LEFT D1-03-11
NOSE WHEEL REMOVED ENGINE STALL
ENGINE SPEED N1 [ % ]

NASA/CR—2008-215216 32
10
50
40
30
20
4020 1007030 50 60 9080
MAS
SFL
OW
RA
TE,
-1m
C[k
g.s
].
ENGINE SPEED, N1 [%]
LEFT ENGINEPORT
20
180
60
100
140
INLE
TV
ELO
CIT
Y-1
V0
[m.s
]
L030
Fig. 5-1 Engine mass flow rate and inlet flow velocity as functions of engine speed.

NASA/CR—2008-215216 33
Fig. 5-2 Frequency spectra of pressure fluctuations taken at port L030 for left engine speed N1 of 87.5 % (test run D1_02_19).
4 126 82 10
PR
ESS
.AM
PLI
TUD
E,
p AM
P[P
a]P
RE
SS.
AM
PLIT
UD
E,p A
MP
[Pa]
1000 40002000 3000FREQUENCY, f [Hz]
LEFT ENGINE
PORT L030
10
50
30
120
0
80
40
FREQUENCY, f [kHz]
A
Fig. 5-3 Frequency spectra of pressure fluctuations taken at port R050 for right engine speed N1 of 87.9 % (test run D1_02_19).
4 126 82 10
PRES
S.A
MP
LITU
DE
,p A
MP
[Pa]
FREQUENCY, f [kHz]
RIGHT ENGINE
R050
1000 40002000 3000FREQUENCY, f [Hz]
10
50
30
PR
ESS
.A
MPL
ITU
DE,
p AM
P[P
a]
120
0
80
40
PORT
C B 3 rd 5 th 12 th 16 th RSF
1st BPF = 17 th RSF
NASA/CR—2008-215216 34
Fig. 5-4 Frequency spectra of pressure fluctuations taken at port L030 for left engine speed N1 of 88.2 % (test run D1_02_27).
4 126 82 10
PR
ES
S.
AM
PLI
TUD
E,
p AM
P[P
a]
100
20
60
FREQUENCY, f [kHz]
LEFT ENGINE
PORT L030
1000 40002000 3000FREQUENCY, f [Hz]
PR
ESS
.A
MP
LITU
DE
,p A
MP
[Pa]
10
30
0
20 E D
1st BPF

NASA/CR—2008-215216 35
Fig. 5-6 Frequency spectra of pressure fluctuations taken at port L039 for left engine speed N1 of 88.2 % (test run D1_02_27).
4 126 82 10FREQUENCY, f [kHz]
PR
ESS
.A
MP
LITU
DE
,p A
MP
[Pa]
500
100
300
LEFT ENGINE
PORT L039
D1_02_27_WS1C1-B.spc
1000 40002000 3000FREQUENCY, f [Hz]
10
30
0
20
PR
ESS
.A
MPL
ITU
DE
,p AM
P[P
a]
1st BPF
E D
Fig. 5-5 Frequency spectra of pressure fluctuations taken at port L035 for left engine speed N1 of 88.2 % (test run D1_02_27).
4 126 82 10
PR
ESS
.A
MP
LITU
DE
,p A
MP
[Pa]
0
300
100
200
FREQUENCY, f [kHz]
LEFT ENGINE
PORT L035
FREQUENCY, f [Hz]
10
30
0
20
PR
ESS
.A
MPL
ITU
DE,
p AM
P[P
a]
1000 40002000 3000
1st BPF
E D

NASA/CR—2008-215216 36
Fig. 6-1 Engine stall test D1-04-18; entire recorded segment of 20 s.
PRES
S.R
ATIO
,[1
]π X
PR
ESS
.R
ATIO
,[1
]π X 0.95
1.05
0.85
0.90
1.00
0.95
1.05
0.85
0.90
1.00
LEFT ENGINE
RIGHT ENGINE
TIME, t [s]
20
80
60
40
62 2010 144 8 12 1816
LEFT ENGINE
L039
L035
L030L070
R099
RIGHT ENGINE
R050PORT
PORT
ENG
INE
SPEE
D,
N1
[%]
DC
A B
E
BARE NOSE WHEEL
Fig. 6-2 Engine stall test D1-04-18; plotted time interval of 4 s.
PRES
S.R
ATIO
,[1
]π X
PR
ESS
.R
ATIO
,[1
]π X 0.95
1.05
0.85
0.90
1.00
0.95
1.05
0.85
0.90
1.00
LEFT ENGINE
RIGHT ENGINE
TIME, t [s]
62
74
70
66
0.5 4.02.0 2.51.0 1.5 3.53.0
PORT
L039
L035
L030L070
R099R050
LEFT ENGINELEFT ENGINE
RIGHT ENGINEPORT
ENG
INE
SPEE
D,
N1
[%]
A
BARE NOSE WHEEL

NASA/CR—2008-215216 37
Fig. 6-3 Engine stall test D1-04-18; plotted time interval of 240 ms; unfiltered pressure data.
PRES
S.R
ATIO
,[1
]π X
PR
ESS
.R
ATIO
,[1
]π X
1.1
0.9
1.0
0.8
1.2
1.1
0.9
1.0
0.8
1.2
LEFT ENGINE
RIGHT ENGINE
TIME, t [ms]
68
73
72
71
70
69
8040 200120 160 240
PORT
R099R050
L039
L035
L030L070
PORT
RIGHT ENGINE
LEFT ENGINE
ENG
INE
SPEE
D,
N1
[%]
TWENTY ENGINE REVS
BARE NOSE WHEEL
Fig. 6-4 Engine stall test D1-04-18; plotted time interval of 240 ms, filtered pressure data fLP = 1000 Hz.
PRES
S.R
ATIO
,[1
]π X
PR
ESS
.R
ATIO
,[1
]π X
1.1
0.9
1.0
0.8
1.2
1.1
0.9
1.0
0.8
1.2
LEFT ENGINE
RIGHT ENGINE
TIME, t [ms]
68
73
72
71
70
69
8040 200120 160 240
LEFT ENGINE
L039
L035
L030L070
R099R050
PORT
RIGHT ENGINEPORT
ENG
INE
SPEE
D,
N1
[%]
B
A
BARE NOSE WHEEL

NASA/CR—2008-215216 38
Fig. 6-5 Engine stall test D1-04-18; plotted time interval of 60 ms; filtered pressure data fLP = 1000 Hz.
PRES
S.R
ATIO
,[1
]π X
PR
ESS
.R
ATIO
,[1
]π X
1.1
0.9
1.0
0.8
1.2
1.1
0.9
1.0
0.8
1.2
TIME, t [ms]
68
73
72
71
70
69
2010 5030 40 60
LEFT ENGINE
LEFT ENGINEPORT
RIGHT ENGINE
PORTRIGHT ENGINE
L039
L035
L030L070
R099R050
ENG
INE
SPEE
D,
N1
[%]
FIVE ENGINE REVS
A E
CB
D
BARE NOSE WHEEL
Fig. 6-6 Engine stall test D1-04-18; plotted time interval of 6 ms; filtered pressure data fLP = 1000 Hz.
PRES
S.R
ATIO
,[1
]π X
PR
ESS
.R
ATIO
,[1
]π X
1.1
0.9
1.0
0.8
1.2
1.1
0.9
1.0
0.8
1.2
TIME, t [ms]
68
73
72
71
70
69
LEFT ENGINE
LEFT ENGINEPORT
RIGHT ENGINE
PORTRIGHT ENGINE
L039
L035
L030L070
R099R050
21 53 4 6
ENG
INE
SPEE
D,
N1
[%]
ONE ENGINE REVOLUTION
0.947 ms 1.073 ms
BARE NOSE WHEEL

NASA/CR—2008-215216 39
Fig. 6-8 Engine stall test D1-04-18; plotted time interval of 6 ms; unfiltered pressure data.
PRES
S.R
ATIO
,[1
]π X
PR
ESS
.R
ATIO
,[1
]π X
1.1
0.9
1.0
0.8
1.2
1.1
0.9
1.0
0.8
1.2
TIME, t [ms]
68
73
72
71
70
69
LEFT ENGINE
LEFT ENGINEPORT
RIGHT ENGINE
21 53 4 6
L070L030
L035
L039
R050R099
PORTRIGHT ENGINE
ENG
INE
SPEE
D,
N1
[%]
SEVENTEEN FAN BLADE PASSAGES
ONE ENGINE REVOLUTION
BARE NOSE WHEEL
Fig. 6-7. Mass flow rate and inlet velocity variations during engine stall test D1-04-18; filtered data fLP = 1000 Hz.
BARE NOSE WHEEL
TIME, t [ms]
68
73
72
71
70
69
2010 5030 40 60
LEFT ENGINE
PORT
PORT
INLE
TFL
OW
VEL
OC
ITY,
V A[m
.s]
-1
LEFT ENGINE
LEFT ENGINE
L030
L030
200
-40
120
40
-120
0
40
20
-40
-20
ENG
INE
SPEE
D,
N1
[%]
INLE
TM
ASS
FLO
WR
ATE
,m
A[k
g.s
]-1

NASA/CR—2008-215216 40
Fig. 6-9 Engine stall test D1-04-07; entire recorded segment of 18 s.
PRES
S.R
ATIO
,[1
]π X
PR
ESS
.R
ATIO
,[1
]π X 0.95
1.05
0.85
0.90
1.00
0.95
1.05
0.85
0.90
1.00
LEFT ENGINE
RIGHT ENGINE
TIME, t [s]
20
80
60
40
62 2010 144 8 12 1816
LEFT ENGINE
L039
L035
L030L070
R099
RIGHT ENGINE
R050PORT
PORT
ENG
INE
SPEE
D,
N1
[%]
A
FAIRED NOSE WHEEL
Fig. 6-10 Engine stall test D1-04-07; plotted time interval of 240 ms; filtered pressure data fLP = 1000 Hz.
FAIRED NOSE WHEEL
PRES
S.R
ATIO
,[1
]π X
PR
ESS
.R
ATIO
,[1
]π X
1.1
0.9
1.0
0.8
1.2
1.1
0.9
1.0
0.8
1.2
LEFT ENGINE
RIGHT ENGINE
TIME, t [ms]8040 200120 160 240
LEFT ENGINE
L039
L035
L030L070
R099R050
PORT
RIGHT ENGINEPORT
71
69
67
65ENG
INE
SPEE
D,
N1
[%]

NASA/CR—2008-215216 41
Fig. 6-11 Engine stall test D1-03-18; entire recorded segment of 18 s.
PRES
S.R
ATIO
,[1
]π X
PR
ESS
.R
ATIO
,[1
]π X
LEFT ENGINE
RIGHT ENGINE
LEFT ENGINE
L039
L035
L030L070
R099R050
PORT
62 2010 144 8 12 1816TIME, t [s]
20
80
60
40
1.1
0.9
1.0
RIGHT ENGINEPORT1.1
0.9
1.0
ENG
INE
SPEE
D,
N1
[%]
B
A C
RETRACTED NOSE WHEEL
Fig. 6-12 Engine stall test D1-03-18; plotted time interval of 600 ms; unfiltered pressure data.
PRES
S.R
ATIO
,[1
]π X
PR
ESS
.R
ATIO
,[1
]π X
LEFT ENGINE
RIGHT ENGINE
TIME, t [ms]
LEFT ENGINE
L039
L035
L030L070
R099R050
PORT
RIGHT ENGINEPORT
200100 500300 400 600
71
69
67
65
1.1
0.9
1.0
1.1
0.9
1.0
ENG
INE
SPEE
D,
N1
[%]
256 ms STALL A STALL B
STALL A
STALL B
RETRACTED NOSE WHEEL

NASA/CR—2008-215216 42
PR
ESS.
RAT
IO,
[1]
π X
L039L035L030L070
PRES
S.R
ATIO
,[1
]π X
PRE
SS.
RAT
IO,
[1]
π X
1.1
0.9
1.0
1.3
1.2
1.1
0.9
1.0
1.3
1.2
1.1
0.9
1.0
1.3
1.2
LE N1= 59.5% NOSE WHEEL REMOVEDBOTH ENGINES RUNNINGD1-03-20
NOSE WHEEL REMOVEDBOTH ENGINES RUNNING
LE N1= 67.2%D1-03-18B
NOSE WHEEL REMOVEDBOTH ENGINES RUNNING
LE N1= 69.1%D1-03-18A
LEFT ENGINEPORT
PRES
S.R
ATI
O,
[1]
π X10
PRES
S.R
ATIO
,[1
]π X
1.1
0.9
1.0
1.3
1.2
1.1
0.9
1.0
1.3
1.2BARE NOSE WHEEL
BOTH ENGINES RUNNINGD1-04-18LE N1= 72.4%
FAIRED NOSE WHEELBOTH ENGINES RUNNING
LE N1= 69.1%D1-04-09
PR
ESS
.R
ATI
O,
[1]
π X
TIME, t [ms]2010 5030 40 60
PR
ES
S.
RA
TIO
,[1
]π X
1.1
0.9
1.0
1.3
1.2
1.1
0.9
1.0
0.8
1.3
1.2 REMOVED
RUNNING
NOSE WHEEL
ONLY LEFTENGINE
D1-03-42LE N1= 82.7%
NOSE WHEEL REMOVED
RUNNINGONLY LEFT ENGINE
LE N1= 79.1%D1-03-44
Fig. 7-1 Selected test conditions of left engine stalls.

NASA/CR—2008-215216 43
PR
ES
S.
RA
TIO
,[1
]π X
PR
ES
S.
RAT
IO,
[1]
π X
1.1
0.9
1.0
1.3
1.2
PORTRIGHT ENGINE
R050 R099
RE N1= 66.4% NOSE WHEEL REMOVEDBOTH ENGINES RUNNINGD1-03-12
BOTH ENGINES RUNNINGRE N1= 67.8%D1-04-07
FAIRED NOSE WHEEL
2010 5030 40 60TIME, t [ms]
1.1
0.9
1.0
0.8
1.3
1.2
Fig. 7-2 Selected test conditions of right engine stalls.

REPORT DOCUMENTATION PAGE Form Approved OMB No. 0704-0188
The public reporting burden for this collection of information is estimated to average 1 hour per response, including the time for reviewing instructions, searching existing data sources, gathering and maintaining the data needed, and completing and reviewing the collection of information. Send comments regarding this burden estimate or any other aspect of this collection of information, including suggestions for reducing this burden, to Department of Defense, Washington Headquarters Services, Directorate for Information Operations and Reports (0704-0188), 1215 Jefferson Davis Highway, Suite 1204, Arlington, VA 22202-4302. Respondents should be aware that notwithstanding any other provision of law, no person shall be subject to any penalty for failing to comply with a collection of information if it does not display a currently valid OMB control number. PLEASE DO NOT RETURN YOUR FORM TO THE ABOVE ADDRESS. 1. REPORT DATE (DD-MM-YYYY) 01-06-2008
2. REPORT TYPE Final Contractor Report
3. DATES COVERED (From - To)
4. TITLE AND SUBTITLE Investigation of Flow Instabilities in the Inlet Ducts of DP-1C VTOL Aircraft
5a. CONTRACT NUMBER
5b. GRANT NUMBER NNCO6BA07B
5c. PROGRAM ELEMENT NUMBER
6. AUTHOR(S) Lepicovsky, Jan
5d. PROJECT NUMBER
5e. TASK NUMBER
5f. WORK UNIT NUMBER WBS 561581.02.08.03.11.01
7. PERFORMING ORGANIZATION NAME(S) AND ADDRESS(ES) ASRC Aerospace Corporation Cleveland, Ohio 44135
8. PERFORMING ORGANIZATION REPORT NUMBER E-16504
9. SPONSORING/MONITORING AGENCY NAME(S) AND ADDRESS(ES) National Aeronautics and Space Administration Washington, DC 20546-0001
10. SPONSORING/MONITORS ACRONYM(S) NASA
11. SPONSORING/MONITORING REPORT NUMBER NASA/CR-2008-215216
12. DISTRIBUTION/AVAILABILITY STATEMENT Unclassified-Unlimited Subject Category: 07 Available electronically at http://gltrs.grc.nasa.gov This publication is available from the NASA Center for AeroSpace Information, 301-621-0390
13. SUPPLEMENTARY NOTES
14. ABSTRACT An investigation of flow instabilities in the inlet ducts of a two-engine vertical takeoff and landing aircraft DP-1C is described in this report. Recent tests revealed that the engines stall during run ups while the aircraft is operating on the ground. These pop stalls occurred at relatively low power levels, sometimes as low as 60 percent of the engine full speed. Inability to run the engines up to the full speed level is attributed to in-ground effects associated with hot gas ingestion. Such pop stalls were never experienced when the aircraft was tested on a elevated grid platform, which ensured that the aircraft was operating in out-of-the-ground-effect conditions. Based on available information on problems experienced with other vertical takeoff and landing aircraft designs, it was assumed that the engine stalls were caused by partial ingestion of hot gases streaming forward from the main exit nozzle under the aircraft inlets, which are very close to the ground. It was also suggested that the nose wheel undercarriage, located between the inlets, may generate vortices or an unstable wake causing intense mixing of hot exit gases with incoming inlet flow, which would enhance the hot gas ingestion. After running a short three-day series of tests with fully instrumented engine inlets, it is now believed the most probable reason for engine pop stalls are random ingestions of a vortex generated between the two streams moving in opposite directions: outbound hot gas stream from the main nozzle close to the ground and inbound inlet flow above. Originally, the vortex is in a horizontal plane. However, at a certain velocity ratio of these two streams, the vortex attaches either to the ground or the aircraft surface at one end and the other end is swallowed by one of the aircraft inlets. Once the vortex enters the inlet duct, a puff of hot air can be sucked through the vortex core into the engine, which causes a serious inlet flow field distortion followed by an engine stall. Once the engine stalls, the outflow from the inlet pushes the vortex away and the engine resumes normal operation. This hypothesis needs to be verified experimentally; e.g., by extensive smoke flow visualization ahead of the aircraft inlets. 15. SUBJECT TERMS Propulsion system performance instability engine test
16. SECURITY CLASSIFICATION OF: 17. LIMITATION OF ABSTRACT UU
18. NUMBER OF PAGES
49
19a. NAME OF RESPONSIBLE PERSON STI Help Desk (email:[email protected])
a. REPORT U
b. ABSTRACT U
c. THIS PAGE U
19b. TELEPHONE NUMBER (include area code) 301-621-0390
Standard Form 298 (Rev. 8-98)Prescribed by ANSI Std. Z39-18

