geophysical investigations of suyien earthdam in maralal, samburu county, kenya
TRANSCRIPT

Africa Journal of Physical Sciences Vol.2 No.1 2015
1
GEOPHYSICAL INVESTIGATIONS OF SUYIEN EARTHDAM IN MARALAL,
SAMBURU COUNTY, KENYA
George Okoye Krhoda1,a
, Meshack Amimo2 and Isaiah A. Nyandega
1
1Department of Geography and Environmental Studies, University of Nairobi, P.O. Box 30197-00100,
Nairobi, Kenya.
2.Northern Water Service Board, P.O. Box,495-7011 Garissa.
Abstract: The Current economic and population growth has increased the water supply gap in
Maralal, Samburu County. Water sources include boreholes, pans and the Suyien dam. Despite the
high rainfall in the area, Suyien dam has never filled since its construction in March 2010. This
study investigated the geological factors hindering the dam‟s impoundment of water. The aim was
to determine the characteristics of the subsurface compromising this process. A desk survey of
existing geological and hydrological reports as well as topographic and geological maps was
undertaken. Analysis of laboratory tests, aerial photographs, electrical resistivity and trial pits was
done. Results showed that the topography, dotted with several sinusoidal hills comprises
Mozambiquan rocks, igneous intrusives, and Paleogene-Quaternary volcanics and sediments.
NeoProterozoic and volcanic formations had surface joints and fractures implying secondary
porosity and permeability. Hydrogeological information showed boreholes sited near rivers or
laggas, yield about 1.4-2.5 m3/hour and about 4 m
3/hour in volcanic rocks. Geophysical
investigations showed subsurface rock sequences were fractured allowing groundwater leakage.
Sediment deposition and vegetation growth at the dam's entrance also block water drainage into the
dam. Suggested mitigation include, unblocking the dam‟s entrance to allow in surface runoff and
the sealing of fractures with waterproof cement.
Keywords: water supply, geohydrology, electrical resistivity, laggas.
Water supply to Maralal Town
The present study in Maralal town, Samburu
County, was prompted by the scarcity of
water and the limited sources of water
available for a growing population and
economic fortune. The population of Maralal
Town currently is estimated at 40,193 people
and is set to increase at 5.8% per annum [1]
with projected population of 53,282, 93,634
and 164,548 people for the years 2016, 2026
and 2036 respectively. There is an existing
borehole at Nundoto (01002‟45.9” N and
06040‟ 25.7" E, 1901m a.s.l) which
contributes to Maralal water supply. There are
two other boreholes located in a valley in
Loikas Forest, Kirisia Division of Samburu
District about 13km North of Maralal Town.
Further, Nundoto borehole with an average
discharge of 4m3/hr serves Elkorot
community of about 400 people. The
combined yield for the current sources located
at Nundoto Dam and the boreholes is 663
m3/day against a demand of 4,500m
3/day
rising to 13,451 m3/day in year 2036. Water is
pumped from Nundoto Dam (with a capacity
of 230,000 m3
and safe yield of 681 m3/day)
to a full conventional treatment plant (with

Africa Journal of Physical Sciences Vol.2 No.1 2015
2
capacity of about 836 m3/day) through a 4 km
UPVC Class E 6” rising main where it
undergoes full treatment and stored in an 840
m3 R.C [2]. The water is distributed through a
10 km network comprising 4” diameter
UPVC and GI pipes to consumers.
The Suyien Dam, located on Loidongo
stream, was constructed in March 2010 at an
elevation of 2040m a.s.l and 300m upstream
of a water pan. The catchment area of Suyien
dam is 4.3 km2 with a slope of 8%. The
design area of the reservoir is 22,800 m2. The
maximum height of the dam is 9 m. The
estimated annual runoff is 430,000 m3 while
the design storage is 270,000 m3. The
estimated evaporation loses is 41,040 m3. The
dead storage is 107,500m3. The gross storage
is 418,540 m3 with a crest width of 7m and a
bottom width of 49.5 m. The embankment
length is 100 m. There have been allegations
that the use of porous soils, bad design of
intake tower, inadequate catchment, that it
was constructed on fault line and no grouting
was done to seal it.
The county-wide water coverage is estimated
at about 19.4% only. However, the majority
of people in Maralal Town depend on existing
Maralal Water Supply with an estimated
coverage of 45.1%.This is supplemented by
boreholes, traditional water sources and
vendors concentrated in a 6km2
area against
the town area of about 150 km2. Several
options for water augmentation included
construction of Suyien dam but the results
have been very poor as a result of the dam not
filling over the period. The present study
investigates the geological factors hindering
maximum impoundment of water into the
Suyien dam. The present study will address
causes of water losses from the dam and
enhance water supply in Maralal town.
The present study involved a desk survey of
existing geological and hydrological reports,
papers together with topographical and
geological maps and aerial photographs of the
area. After a field reconnaissance, electrical
soundings were taken using terrameter, trial
pit, and laboratory testing was carried out.
The geophysical investigation was done in
November 2012 to complement reports and
interviews from expert water officers.
Climate
Samburu County falls within arid to semi arid
region with annual mean rainfall of 200mm to
250mm. The relatively higher altitude of
Maralal town raises the mean annual rainfall
to 700 mm to 1000 mm which occurs in two
rainy seasons and in 49 rainy days[3]. The
long rains occur in March to May while the
short rains occur from October to December.
The rainfall distribution shows spatiotemporal
variation with altitude and may be up to about
1500mm per annum. The lowest rainfall is
observed in the eastern part of Maralal Town
while the highest rainfall occurs at elevated
areas such as Lpartuk Forest and in the
forested highland area.
The mean temperatures range from 25oC
during the coldest month (June-July) and
350C during the hottest months of January to
March. Mean annual temperatures are 300 to
340 C. High temperatures also raise
evapotranspiration rates to range from 1800
mm to 3000 mm per annum. Over the
hills,evapotranspiration rates of 1800mm per
annum has been recorded [3].
Geology of the Samburu County
The undulating topography dotted with
several sinusoidal hills reflect the general
geology of Samburu County. The area stands
at an average altitude of 2051m a.s.l. within a
steep-dipping terrain punctuated with several
ant hills and flood plains both on the south

Africa Journal of Physical Sciences Vol.2 No.1 2015
3
eastern and north western flanks. The County
lies on the eastern shoulder of the Rift Valley
and can be subdivided into two major
geological divisions. The eastern side covered
mainly by the Mozambiquan rocks
interspersed with occasional igneous outliers
which occupies roughly two thirds of the
county. The western side constituting one-
third of the county, on the other hand, is
covered by basic lava of Paleogene-Neogene
volcanics of the rift valley (Fig. 1).
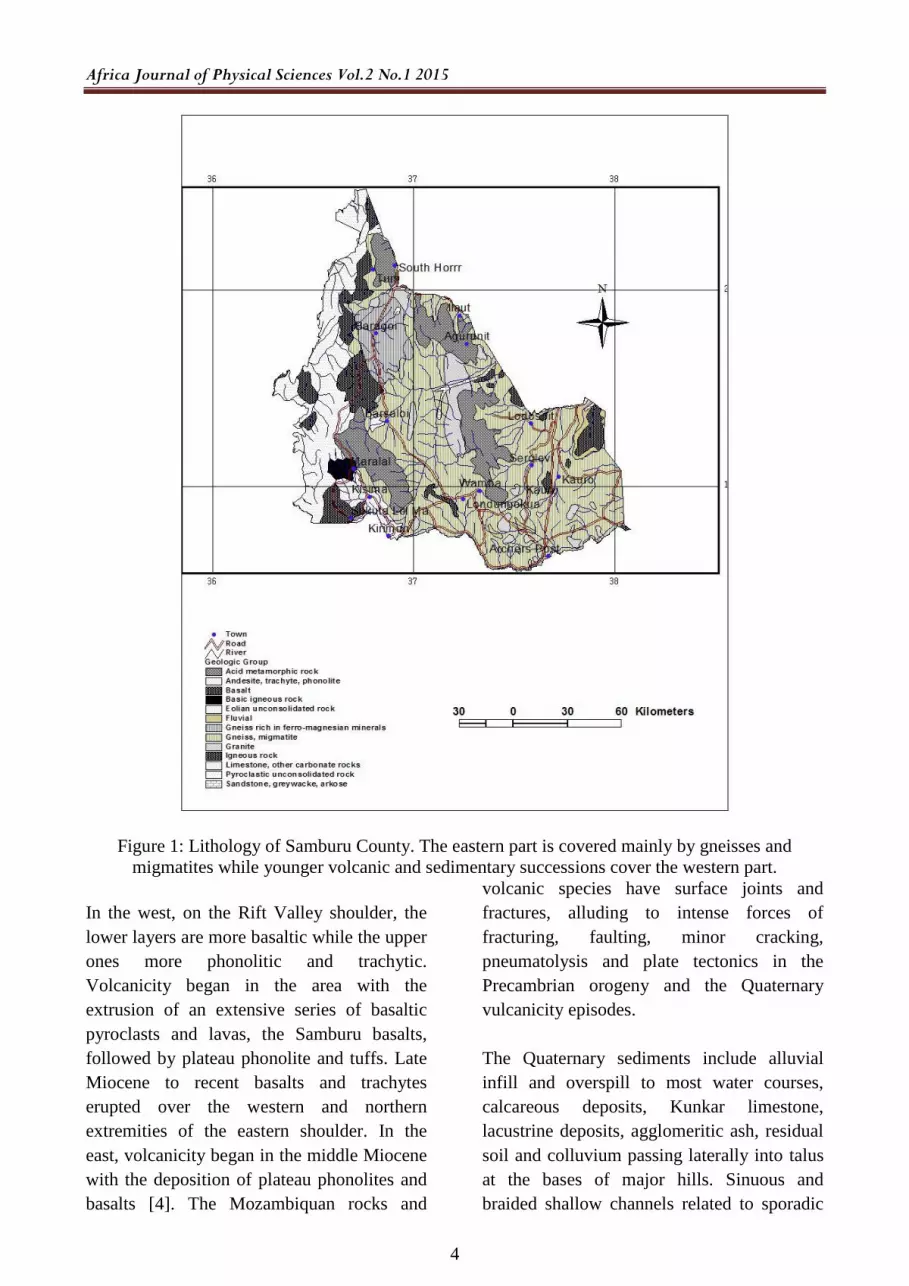
The lithology may be classified into four
major groups, namely, metamorphic rocks of
the NeoProterozoic Mozambique Belt,
igneous intrusives, Paleogene-Neogene
volcanics and Quaternary volcanic and
sediments. The sediment deposits were altered
by tectonothermal events to form gneisses,
schists, quarzites and marbles with large areas
underlain by migmatites. These events were
followed by successive stages of uplift and
erosion, lasting until the Paleogene when
lavas flooded Mozambiquan rocks, producing
basalts in the early stages and phonolites and
trachytes in later stages (Fig. 1). Recent
deposits which consist of alluvium and
colluvium, calcareous and lacustrine
sediments, agglometric ash and residual soils
have formed from weathering of the
Mozambiquan rocks and the Paleogene
volcanics with subsequent deposition on the
lower regions and river valleys.
The igneous rocks are mainly granodiorites
and granites but also include relatively small
outcrops of pegmatites, quartz reefs, aplites
and diorites. Only the major outcrops consists
of foliated granites which often form
inselbergs and hills, and granodiorites outcrop
east of the Mathews Range. Locally,
underneath the volcanics, subvolcanic
deposits of probably Lower Miocene age
consisting of well rounded pebbles are fluvial
erosion products of the Mozambiquan rocks.
Africa Journal of Physical Sciences Vol.2 No.1 2015
4
Figure 1: Lithology of Samburu County. The eastern part is covered mainly by gneisses and
migmatites while younger volcanic and sedimentary successions cover the western part.
In the west, on the Rift Valley shoulder, the
lower layers are more basaltic while the upper
ones more phonolitic and trachytic.
Volcanicity began in the area with the
extrusion of an extensive series of basaltic
pyroclasts and lavas, the Samburu basalts,
followed by plateau phonolite and tuffs. Late
Miocene to recent basalts and trachytes
erupted over the western and northern
extremities of the eastern shoulder. In the
east, volcanicity began in the middle Miocene
with the deposition of plateau phonolites and
basalts [4]. The Mozambiquan rocks and
volcanic species have surface joints and
fractures, alluding to intense forces of
fracturing, faulting, minor cracking,
pneumatolysis and plate tectonics in the
Precambrian orogeny and the Quaternary
vulcanicity episodes.
The Quaternary sediments include alluvial
infill and overspill to most water courses,
calcareous deposits, Kunkar limestone,
lacustrine deposits, agglomeritic ash, residual
soil and colluvium passing laterally into talus
at the bases of major hills. Sinuous and
braided shallow channels related to sporadic

Africa Journal of Physical Sciences Vol.2 No.1 2015
5
flow after the last heavy rains are marked by
medium grained sands with gravel bars which
top the alluvium.
Relief Features
The relief of the county has a north-south
ridge on the flanks of the Rift Valley running
from Mount Nyiro Ndoto (2752 m.) through
Baragoi, Maralal (2531 m.) and Suguta and
another ridge on the east running from Aguru,
Mathews Range and Wamba (2688 m.).The
ridges form the major drainage divide (Fig.
2).
Figure 2:Major Relief Features of Samburu County. Note the drainage divide indicated by easterly
and westerly flowing rivers. The central and western parts of the area are the highest (>1700m).
Soils
The soils vary with altitude and steepness of
the terrain. Thick humus-rich topsoil occur
over deeply weathered rock and are common
at higher altitudes with forest cover. The
mountains and hills are surrounded by long
straight, sedimentary foot slopes, deep, well
drained sandy loam soils in the upslope parts,

Africa Journal of Physical Sciences Vol.2 No.1 2015
6
merging towards sandy-clay textures
downslope. Foot slopes are subject to
widespread gully erosion, often of dramatic
dimensions. This is due to the pastoralist‟s
preference to establish manyatta’s at the
upslope side of foot slopes. Residual soils are
rarely more than 2m thick and are mostly red-
brown sandy loams with local variations
related to underlying bed-rock. The area
possesses soils with medium permeability,
comprising of sands, gravels, clays and/or
sandy loams. This low permeability enhances
its ability to withstand soaking via capillarity
effects. All colluvium is a crudely stratified,
poorly sorted mixture of lithiclasts, sand, silt
and clay which is thickest around peripheries
of major hills. Calcareous deposits are found
to occupy river valleys.
Surface and groundwater occurrence
Surface water is available in small quantities
from River Ewaso Ngiro, the only major
perennial river, at the southern border. High
rainfall of about 700-1000 mm/year in the
mountain ranges recharges springs in the
lowlands. Most rivers in Samburu flow for
short periods after rain. Dams and pans are
common but their storage capacities have
been reduced by siltation. The chemical
quality of the surface water is generally good,
however, bacterial contamination is common.
The river channel that would discharge into
the Suyien dam has been colonized by
vegetation while the forested arm of the river
blocks flow into the dam. The river channels
and laggas (dry river valleys) are fracture-
controlled as is manifested by sudden angular
changes in the channel courses (Fig. 3). Major
lineaments trending roughly north-south were
observed from both the aerial photographs
and LandSat imageries. A large Quaternary
alluvial patch has formed south of Maralal
town along the convergence of major laggas.
These alluvial sediments are generally
shallow and of limited extent to allow
groundwater occurrence in significant
quantities [5]. Additionally, groundwater
fluctuates due to short recharge periods and
prolonged droughts. Although groundwater
quality in laggas sediments is usually good, it
is perceptible to bacteriological contamination
especially in unprotected dug wells with some
indication of salinity (>500TDS) (Table 2).
The Mozambiquan rocks and the young
volcanics are fairly fractured and hold
groundwater in fractures, faults, as well as the
contact zones between the volcanics and the
metamorphic rocks or in the weathered zones.
However, fractures and faults are of limited
extent and therefore groundwater quantities
are low. The groundwater in the upper
sediments receives an annual rainfall recharge
through direct infiltration while the deep-
seated zones may be recharged via regional
flow aided by the faulted channels [6]. In
order to attain the maximum yield for
optimum recharge of the groundwater,
boreholes are sited near rivers or laggas where
the yield is on average 1.4-2.5 m3 /hr (Table
2).
Paleogene-Neogene volcanics occur generally
over large relatively continuous areas and
have relatively high infiltration capacity and
hydraulically interconnected fissures.
Lineaments within the volcanics are more
easily discerned on the basaltic rocks, while
the ones on the phonolites are covered by red
and loamy soils formed from weathered rocks
[6]. The recharge potential in this terrane is
generally good with boreholes yielding on
average 4 m3 /hr. The water strike level is
80m (Table 2).

Africa Journal of Physical Sciences Vol.2 No.1 2015
7
Table 1: Summary of the present yield from the boreholes
.
Borehole Name Yield [m3/day]
1. L Partuk 1080
2. Nontoto 90
3. Shabaa 38.4
4. Ledero 120
5. Nundoto 96
6. Loikas 60
7. Kirisia 1092.6
8. Total 3,483.6
Table 2: A summary of groundwater characteristics in Samburu County
Groundwater Description Tested Yield Water Level Quality
Mean
(m3/hr)
Struck
(m)
Rest (m)
Medium to
High
Alluvial
deposits
along main
laggas
0.5 - 3.0 0 - 2 0 - 2 Good
Medium Contact
zones
intrusives
9 11 6 Fair
Plateau
phonolites
4 80 50 Good
(TDS=500mg/l)
though high fluoride
Low to
medium
Pelitic
basement
25 40 30 Variable but mostly
bad
(TDS=3000mg/l)
Undivided
basement
Granitic
basement
1.4 24 16 (but
30% dry)
TDS=300 -
1800mg/l
Magmatic
basement
Low Western
strip,
volcanics
No data Very deep Deep No data but
probably acceptable
Very low Mountain
Ranges
Very low Very low Very
deep
Good
Inselbergs Very low Very low Very
deep
-
Small plateau
basalt areas
No data Very low Very
deep
-
Vertical Electrical Soundings A total of 7 vertical electrical soundings
(VES) were undertaken using an ABEM SAS

Africa Journal of Physical Sciences Vol.2 No.1 2015
8
4000B Terrameter. The sites for VES were
selected based on suitability of the terrain,
accessibility and security considerations.
Most of the dam area was dry at the time of
measurements. The resistance, R, of a certain
material is directly proportional to its length,
L, and cross sectional area, A, expressed as:
.
(1)
where ρis the specific resistivity,
characteristic of the material and independent
of its shape or size. With Ohm's Law:
.
(2)
where V is the potential difference across the
resistor and I is the electric current through
the resistor. The specific resistivity was
determined by the expression:
.
(3)
Figure 3: Schlumberger and Wenner Configurations for Resistivity Measurements (AB = current
electrodes and MN = potential electrodes).
The measuring setup consists of a resistivity
instrument (usually placed in the middle of
the array), connected to two current electrodes
(AB), and two potential electrodes (MN)
towards the center (Fig. 3). When carrying out
a resistivity sounding, an electrical current (I)
is passed into the ground through two metal
pins, the copper electrodes.
The calculated apparent resistivity is plotted
against current electrode half separation on a
bi-logarithmic graph paper to constitute a
sounding curve. The curve depicts a layered
earth model composed of individual layers of
specific thickness and resistivity. A computer-
aided curve fitting procedure based on a
mathematical convolution method [8] was
used. In general, the number of possible
solutions is reduced by mutual correlation of
several sounding curves, knowledge of the
local geology and drilling data. The layered
earth model is a simplification of the many
different layers that may be present.
A measure of subsurface variations in
electrical conductivity is obtained in terms of
the voltage drop (V) between a second pair of
metal stakes. The ratio (V/I) provides a direct
measurement of the ground resistance and the
electrode spacing and the apparent resistivity
(ρa) of the ground is calculated.
A standard Gewin Modeling software was
selected for use for 1D VES graphs. The
electrical resistivity data generated were
analyzed using the Schlumberger
configurations. The current electrode spreads
of up to 250m against potential spreads of
between 5m and 25m were employed to
conduct the surveys. Copper electrodes were
a) Schlumberger Array: AM = NB > MN
A 80 M 20 N 80 B
| | | |
b) Wenner Array: AM = MN = NB
A 60 M 60 N 60 B
| | | |

Africa Journal of Physical Sciences Vol.2 No.1 2015
9
used for the potentials while steel iron
electrodes were used for the currents since the
terrameter had an induced polarization (IP)
capability.
Geoelectrical sounding data were calculated
and analyzed digitally by using IP2 WIN
Software that has a capability to analyze
induced polarization data with some electrode
configuration like Wenner‐Schlumberger,
Wenner Alpha, Wenner Beta, etc. Using IP2
WIN entails some steps. The first step
involves data input directly from field data
(sounding data consist of AB/2, V, I, and K)
or indirect field data (sounding data consist of
AB/2 and (ρa). The second step is data error
correction, the third step is adding data point,
and the fourth and final step is cross section
creation. Observations along the dam banks
showed that there were thin layers of laterites
at the top of weathered gneisses. The VES for
each site was computed and are shown in Fig.
8 to 14.
Output of sounding data analyzed using IP2
WIN software includes resistivity layer, log
resistivity graph, resistivity‐depth table, and
pseudo cross section.
Figure 4: Vertical Electrical Soundings for Site 001/2012. the red and blue curves depict relation of
AB/2 and the apparent resistivity with the blue curve showing resistivity variation. A comparison
with computer generated curves and the goodness of fit is as shown.

Africa Journal of Physical Sciences Vol.2 No.1 2015
10
Figure 5: Vertical Electrical Soundings Site 2 002/2012
Figure 6: Vertical Electrical Soundings Site 003/2012
Africa Journal of Physical Sciences Vol.2 No.1 2015
11
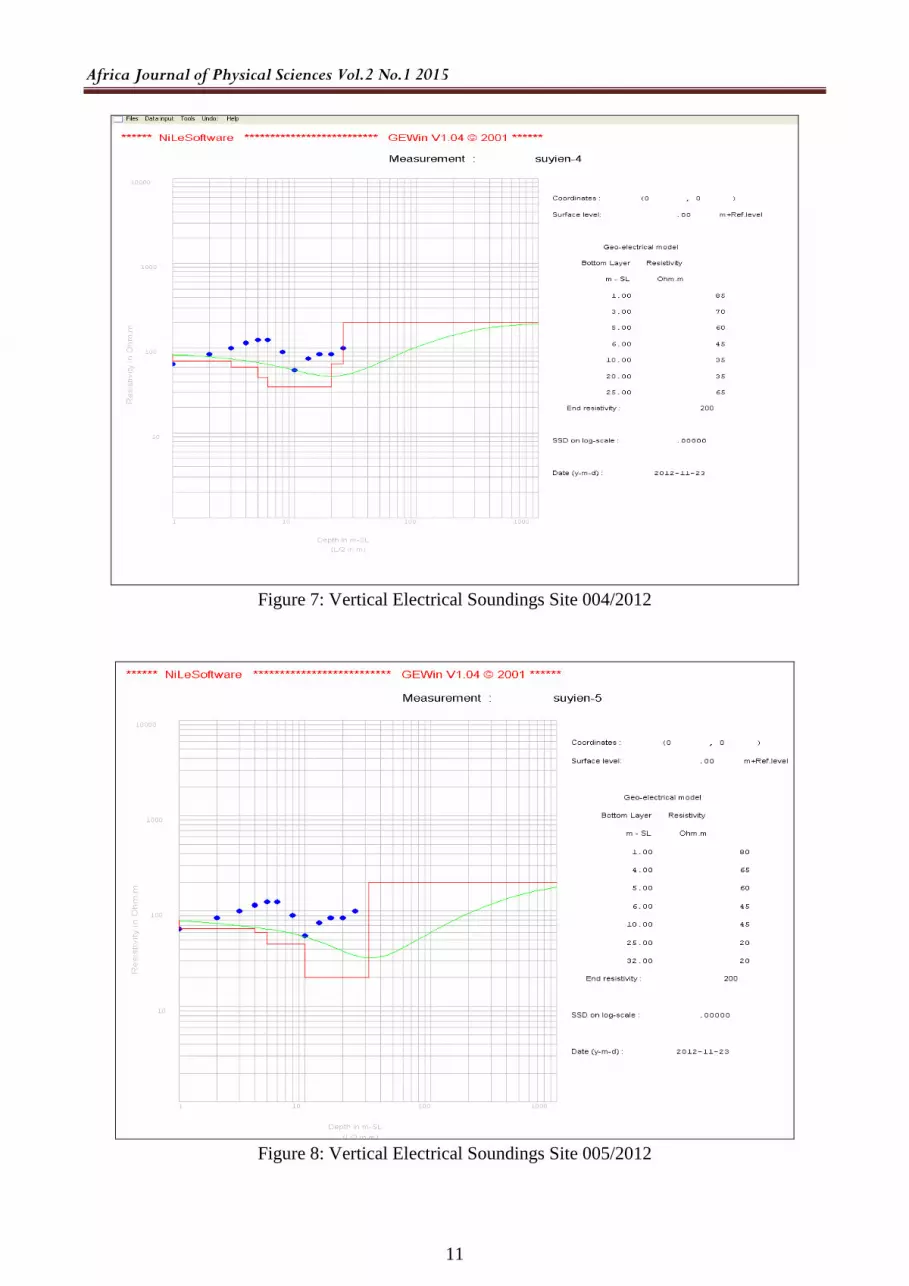
Figure 7: Vertical Electrical Soundings Site 004/2012
Figure 8: Vertical Electrical Soundings Site 005/2012

Africa Journal of Physical Sciences Vol.2 No.1 2015
12
Figure 9: Vertical Electrical Soundings Site 006/2012
The geological sequence and hydrogeology of
the area were used to interpret the resistivity
measurements. The crystalline rocks and
volcanics are heavily fractured and lineaments
could be detected on the surface. The laggas
also follow fractures implying high water
infiltration. Table 2 shows that groundwater
in Mozambiquan rocks was reached after
drilling between 24 m and 40 m while in
Paleogene-Neogene rich aquifers were
reached at 80 m. The areas of colluvium,
alluvium and lacustrine sediments formed
high groundwater at less than 2m. The types
of rock formation in Table 3 has been based
on field evidence along dam banks and eroded
gullies, geological and geohydrological
information.

Africa Journal of Physical Sciences Vol.2 No.1 2015
13
Figure 10: Vertical Electrical Soundings Site 007/2012
Table 3 shows the resistivity measurements
for all the seven sites considered. The
expected geological formation is dependent
on whether the resistivity curve is rising or
falling and may not be represented adequately
by the absolute resistivity value. The rising
limb of the resistivity curve points to fresh
gneisses while the falling limb of the
resistivity curve points to fractured or
weathered geological formation.
Table 3: Resistivity measurements along specific sites in the dam
Resistivity
Curve No.
Formation Depth
Interval (m)
Resistivity
(ohm.m)
Expected Geological Formation
001 0-1
1-3
3-5
5-6
6-10
10-20
20-25
Over 25.0
65
100
150
150
25
85
100
infinity
Top soils/loams
Laterites
Weathered/fractured gneisses/laterites
Weathered gneisses
Fractured gneisses/highly weathered gneisses
Weathered gneisses
Weathered gneisses/ weathered gneisses
Weathered gneisses/slightly weathered gneisses
002 0-1
1-3
3-5
5-6
85
90
145
145
Top soils/loams
Laterites
Weathered/fractured gneisses/laterites
Weathered gneisses

Africa Journal of Physical Sciences Vol.2 No.1 2015
14
6-10
10-20
20-25
Over 25.0
30
65
85
infinity
Fractured gneisses/highly weathered gneisses
Weathered gneisses
Weathered gneisses
Weathered gneisses/slightly weathered gneisses
003 0-1
1-3
3-5
5-6
6-10
10-20
20-25
Over 25.0
75
60
50
35
25
25
55
infinity
Top soils/loams
Laterites
Weathered/fractured Gneisses/laterites
Weathered gneisses
Fractured gneisses/highly weathered gneisses
Weathered gneisses
Weathered gneisses/ weathered gneisses
Weathered gneisses/slightly weathered Gneisses
004 0-1
1-3
3-5
5-6
6-10
10-20
20-25
Over 20.0
85
70
60
45
35
35
65
infinity
Top soils/loams
Laterites
Weathered/fractured gneisses/laterites
Weathered gneisses
Fractured gneisses/highly weathered gneisses
Weathered gneisses
Weathered gneisses/ weathered gneisses
Weathered gneisses/slightly weathered gneisses
005 0-1
1-3
3-5
5-6
6-10
10-20
20-25
Over 20.0
80
65
60
45
45
20
20
Infinity
Top soils/loams
Laterites
Weathered/fractured gneisses/laterites
Weathered gneisses
Fractured gneisses/highly weathered gneisses
Weathered gneisses
Weathered gneisses/ weathered gneisses
Weathered gneisses/slightly weathered gneisses
006 0-1
1-6
6-8
8-10
10-13
13-25
25-32
Over 32
69
15
15
20
20
55
20
infinity
Top soils/loams
Laterites
Weathered/fractured gneisses/laterites
Weathered gneisses
Fractured gneisses/highly weathered gneisses
Weathered gneisses
Weathered gneisses/ weathered gneisses
Weathered gneisses/slightly weathered gneisses
007 0-1
1-4
4-16
16-20
20-32
Over 32.0
75
10
32
32
15
infinity
Top soils/loams
Laterites
Weathered/fractured gneisses/laterites
Weathered gneisses
Fractured gneisses/highly weathered Gneisses
Fresh gneisses/ weathered gneisses
Weathered gneisses/slightly weathered gneisses
Tomographic Imaging of Stratigraphic Units

Africa Journal of Physical Sciences Vol.2 No.1 2015
15
The VES data generated was then modeled
using Tomographic Imaging software,
IP2WIN [9] determine the lateral and vertical
extents of the fractures picked in the electrical
resistivity curves during electro-soundings.
Tomography involves relationships between
different rock layers existing at different VES
points in a straight line. VES were used to
generate tomographic images (TI). The TIs
provide a 2D (depth-horizontal)
comprehensive picture than 1D probes and are
shown for sites marked TMGR-01 to TMGR-
07. The structures at the floor of the dam
demonstrate water seepage from dam floor
(Fig. 11).
Figure 11: Tomographic image of the bottom of the Suyien dam Site TMGR-01
Tomography (2D) distinguishes all sub-layers
of rocks such as wet sands, dry sands, clayey
sands etc, which 1D resistivity curve lumps
together as one layer. Where VES may have
given 3 layers, tomographic image may give 5
or more layers. The tomographic image
provides for weathered gneisses, slightly
weathered gneisses, and highly weathered
gneisses, while VES may refer to all of these
gneisses as weathered gneisses. The color
coding and color scale in a tomographic
model facilitates interpretation of the layers.
Colorful layers are a representation of
resistivity value distribution from seven
interpolated VES data. From the above
tomographic profile (Fig. 11), it is readily
noted that there is a fractured/weathered zone
comprising the brownish laterites at the floor
of the dam which channels the water to the
bluish cross section comprising
weathered/fractured zone. The water
consequently seeps away from a depth of 3 m
at site TMGR- 7 to the depth of 35.9m bgl at
site TMGR- 5. Under the circumstances, there
needs to be a water proofing material on the
dam floor without further delay.
At zone VES TMGR-3 site in (Fig. 12) the
brownish zone showing a fracture occurs in
varying depths. The fractured zone begins
from 0.1m to 3.0m of depth, meaning that the
fracture has a thickness of 2.9m. extending to
7.74 m as the arrow points out. High
resistivity values indicates that water seeps
through the fractured zone.

Africa Journal of Physical Sciences Vol.2 No.1 2015
16
Figure 12: Tomographic image of the bottom of the Suyien dam Site TMGR-03
At zone VES TMGR- 5 sites (Fig.13), the
fractured zone begins from 0.1 m to 3.9m,
meaning that the seepage fracture at this point
on the dam floor has a thickness of 3.8m bgl.
Figure 13: Tomographic image at Site- TMGR-05
The bluish zone, occurring in varying depths,
and which is probably weathered gneisses, is
where the seeping water flows into. At zone
VES TMGR-7 site (Fig.14), the „reservoir‟
zone occurs in two distinct portions, namely
from depths 3 to 13m below ground level
(bgl) and as from 21 to 35m bgl, giving the
respective seepage ‟reservoir‟ thicknesses at
these two points on the dam floor as 10m and
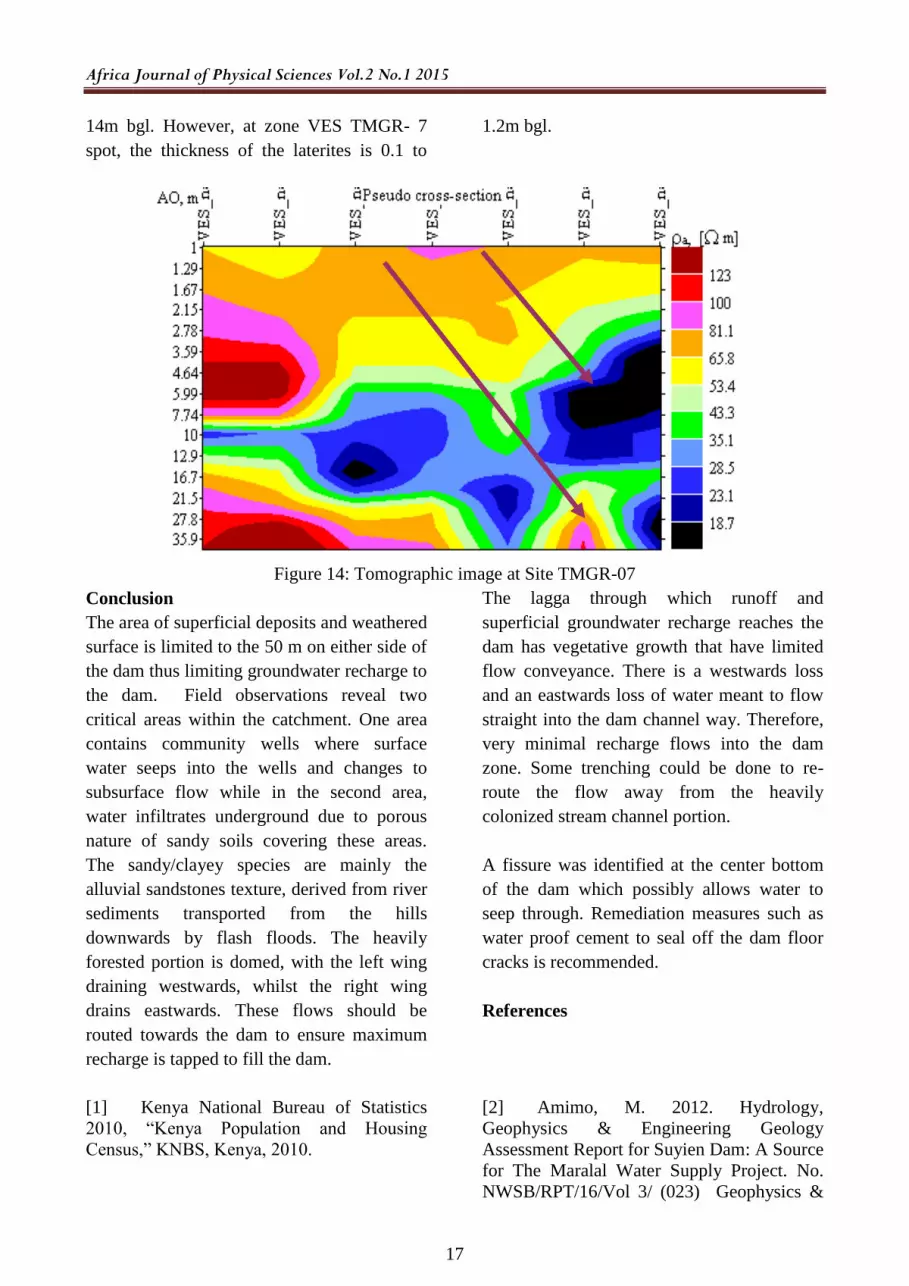
Africa Journal of Physical Sciences Vol.2 No.1 2015
17
14m bgl. However, at zone VES TMGR- 7
spot, the thickness of the laterites is 0.1 to
1.2m bgl.
Figure 14: Tomographic image at Site TMGR-07
Conclusion
The area of superficial deposits and weathered
surface is limited to the 50 m on either side of
the dam thus limiting groundwater recharge to
the dam. Field observations reveal two
critical areas within the catchment. One area
contains community wells where surface
water seeps into the wells and changes to
subsurface flow while in the second area,
water infiltrates underground due to porous
nature of sandy soils covering these areas.
The sandy/clayey species are mainly the
alluvial sandstones texture, derived from river
sediments transported from the hills
downwards by flash floods. The heavily
forested portion is domed, with the left wing
draining westwards, whilst the right wing
drains eastwards. These flows should be
routed towards the dam to ensure maximum
recharge is tapped to fill the dam.
The lagga through which runoff and
superficial groundwater recharge reaches the
dam has vegetative growth that have limited
flow conveyance. There is a westwards loss
and an eastwards loss of water meant to flow
straight into the dam channel way. Therefore,
very minimal recharge flows into the dam
zone. Some trenching could be done to re-
route the flow away from the heavily
colonized stream channel portion.
A fissure was identified at the center bottom
of the dam which possibly allows water to
seep through. Remediation measures such as
water proof cement to seal off the dam floor
cracks is recommended.
References
[1] Kenya National Bureau of Statistics
2010, “Kenya Population and Housing
Census,” KNBS, Kenya, 2010.
[2] Amimo, M. 2012. Hydrology,
Geophysics & Engineering Geology
Assessment Report for Suyien Dam: A Source
for The Maralal Water Supply Project. No.
NWSB/RPT/16/Vol 3/ (023) Geophysics &

Africa Journal of Physical Sciences Vol.2 No.1 2015
18
Engineering Geology Survey Report Northern
Water Services Board, Garissa, Kenya
[3] H. Schmidt, R. Swoboda, R. Jätzold,
and K. F. M. Section, Farm Management
Handbook of Kenya: Natural conditions and
farm management information. Ministry of
Agriculture, Farm Management Section,
1983.
[4] R. M. Key, “The Geology of the
Maralal Area,” Rep. Mines & Geol. Dept.
Kenya, Kenya, Geological Survey 105, 1987.
[5] Krhoda, George Okoye. “Groundwater
Assessment in Sedimentary Basins of Eastern
Kenya, Africa.” In Regional Characterization
of Water Quality; Baltimore Symposium.
Baltimore: IAHS Publ, 1989
http://iahs.info/redbooks/a182/iahs_182_0111
[6]Fetter C.W.2007 Applied Hydrogeology.
[7] Charsley T. J. 1987. The Geology of the
Laisamis area (Degree sheet 28). Rep Mines
& Geol. Dept. Kenya, No. 106
[8] Ghosh, D. P. “Inverse Filter
Coefficients for the Computation of Apparent
Resistivity Standard Curves for a Horizontally
Stratified Earth*,” Geophys. Prospect., vol.
19, no. 4, pp. 769–775, Dec. 1971.
[9] A. Kurniawan, “Basic IP2WIN
Tutorial: Basic Principles in Using IP2Win
Software.,” 2009.