geophysical and geomechanical investigations applied to the rock mass characterisation for distinct...
TRANSCRIPT
Rock Mech. Rock Engng. (2007) 40 (6), 603–622
DOI 10.1007/s00603-006-0092-9
Printed in The Netherlands
Geophysical and Geomechanical InvestigationsApplied to the Rock Mass Characterisation
for Distinct Element Modelling
By
A. M. Ferrero1, A. Godio2, L. Sambuelli2, and I. H. Voyat3
1 University of Parma, Parma, Italy2 Dipartimento di Ingegneria del Territorio, dell’Ambiente e delle Geotecnologie,
Politecnico di Torino, Torino, Italy3 Dipartimento di Geotecnica e Ingegneria Strutturale, Politecnico di Torino, Torino, Italy
Received February 11, 2004; accepted March 7, 2006Published online May 22, 2006 # Springer-Verlag 2006
Summary
The paper describes the experience gathered in an underground quarry of crystalline marble wherethe rock mass structure has been characterised by a joint approach using geomechanical mappingand geophysical investigations with a high resolution radar system. Standard geomechanical sur-veys have been coupled and integrated by radar acquisition performed on a selected pillar of thequarry to improve the rock mass description. The fracture pattern has been computed on the basisof the deterministic model on the rock faces of the pillar and taking into account both thestatistical approach to describe the extent within the rock mass and the fracture pattern describedby radar survey.
Keywords: Discrete rock mass modelling, geophysical measurements.
1. Introduction
The evaluation of the stability conditions of an underground excavation requires a tool
that is able to forecast the stress and deformation response of the rock mass. For this
purpose the medium can be represented by different mathematical models to analyse
the geomechanical behaviour of the rock mass (Barla et al., 2001; Jing, 2003). For a
rock mass characterised by a low fracturing degree, such as those required for orna-
mental stone exploitation, the best modelling approach is often based on a discontin-
uous scheme that is able to consider the rock mass as a blocky system. The modelling
procedure is performed in two phases: geometric modelling, to reconstruct the blocky
system, and mechanical modelling, to reproduce the stress strain behaviour of the
interacting blocks.
The reliability of a simulation of the mechanical behaviour of a blocky system is
affected by the precision in the definition of the geometry of the rock mass. The joint
sets can be generated simply by using the mean orientation and spacing. These models
do not necessarily reproduce the structure of the outcropping rock mass in a particular
situation but determine an equivalent configuration that is given by a statistic distribu-
tion of the discontinuities.
Consequently, the local rock block geometry might not correspond to the existing
configuration discovered during the excavation. For a punctual reconstruction of an
existing fractured rock mass, deterministic models, that are able to consider the real
position of the discontinuities detected on the site, have to be developed. The dis-
continuity locations can be determined by measuring their traces on an excavation
surface, even though the persistence within the rock mass is more difficult to deter-
mine. However, fully persistent discontinuities are often assumed in a cautelative way,
although in cases this may be not realistic.
Detailed geophysical investigations allow the discontinuity conditions within the
rock mass to be estimated and further information to be supplied for the rock mass
reconstruction in the modelling phase.
In order to show this, an experiment was carried out with the following main
objectives: to detect the fracture patterns of a marble pillar; to perform the stability
analysis of the rock mass using deterministic and statistic models; to evaluate the
reliability of high resolution radar imaging of the fractures as a useful tool to integrate
the results of the structural survey; to obtain information toward a rational planning of
the exploitation activity of the quarry.
2. The Experimental Site
The quarry is located in Stazzema (Lucca), Italy, where dimensioned blocks for
ornamental stone are exploited. The quarry is exploited with the room and pillar
method. The experimental stope is excavated in virgin areas where the influence of
the existing voids is limited. Four rooms are excavated perpendicularly to each other
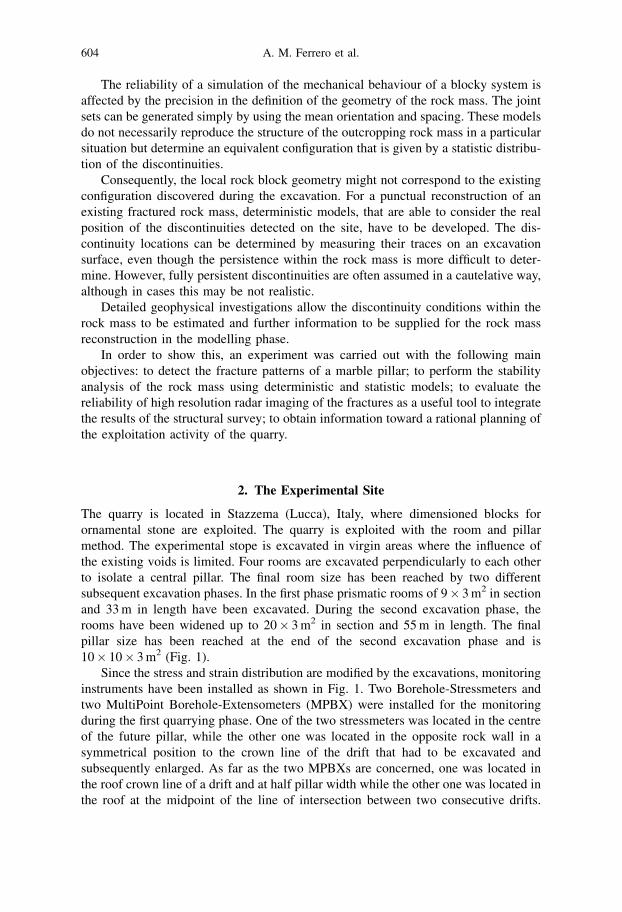
to isolate a central pillar. The final room size has been reached by two different
subsequent excavation phases. In the first phase prismatic rooms of 9� 3 m2 in section
and 33 m in length have been excavated. During the second excavation phase, the
rooms have been widened up to 20� 3 m2 in section and 55 m in length. The final
pillar size has been reached at the end of the second excavation phase and is
10� 10� 3 m2 (Fig. 1).
Since the stress and strain distribution are modified by the excavations, monitoring
instruments have been installed as shown in Fig. 1. Two Borehole-Stressmeters and
two MultiPoint Borehole-Extensometers (MPBX) were installed for the monitoring
during the first quarrying phase. One of the two stressmeters was located in the centre
of the future pillar, while the other one was located in the opposite rock wall in a
symmetrical position to the crown line of the drift that had to be excavated and
subsequently enlarged. As far as the two MPBXs are concerned, one was located in
the roof crown line of a drift and at half pillar width while the other one was located in
the roof at the midpoint of the line of intersection between two consecutive drifts.
604 A. M. Ferrero et al.
When the second phase was started, which involves the widening of the drifts around
the pillar, the number of measuring devices was increased by two MPBXs in each
monitoring station (Cravero et al., 2001; Deangeli et al., 1999).
2.1 Rock Mass Characterisation
The rock mass characterisation in the investigated quarry included both in situ mea-
surements and laboratory testing.
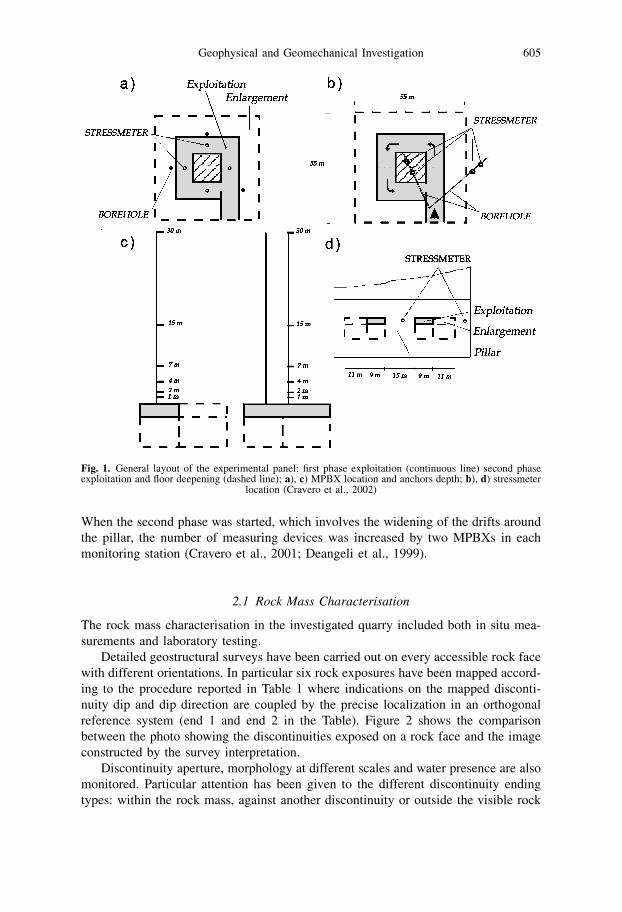
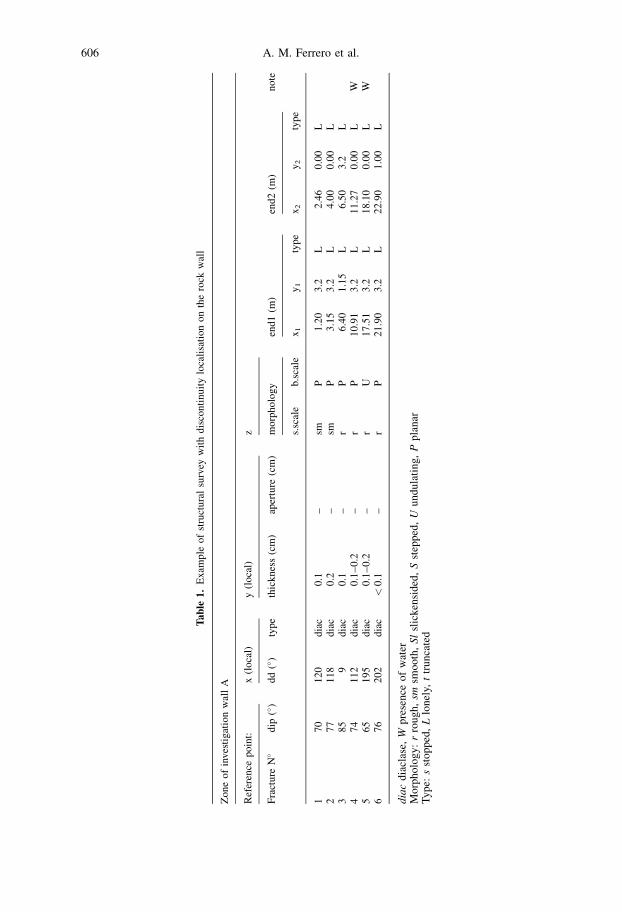
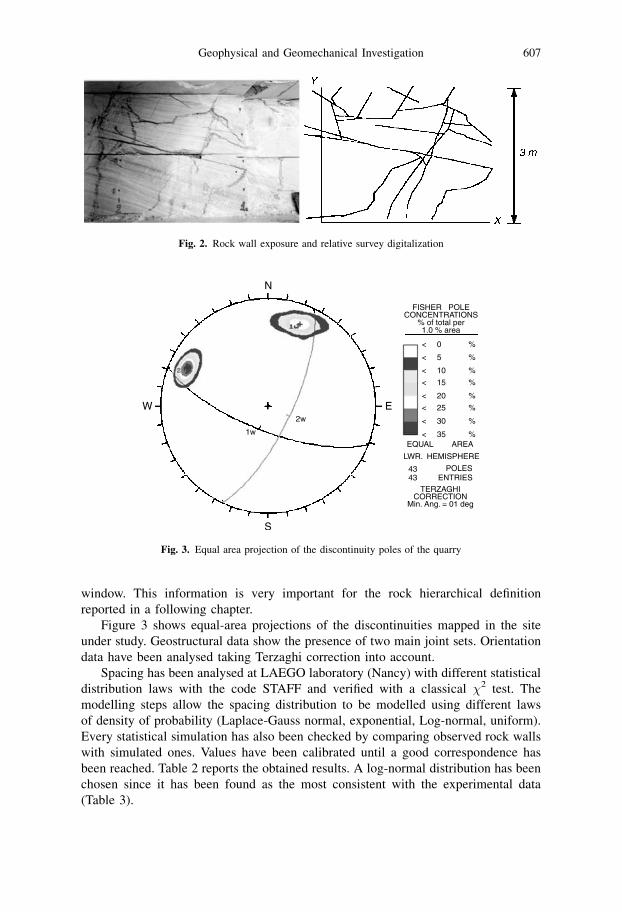
Detailed geostructural surveys have been carried out on every accessible rock face
with different orientations. In particular six rock exposures have been mapped accord-
ing to the procedure reported in Table 1 where indications on the mapped disconti-
nuity dip and dip direction are coupled by the precise localization in an orthogonal
reference system (end 1 and end 2 in the Table). Figure 2 shows the comparison
between the photo showing the discontinuities exposed on a rock face and the image
constructed by the survey interpretation.
Discontinuity aperture, morphology at different scales and water presence are also
monitored. Particular attention has been given to the different discontinuity ending
types: within the rock mass, against another discontinuity or outside the visible rock
Fig. 1. General layout of the experimental panel: first phase exploitation (continuous line) second phaseexploitation and floor deepening (dashed line); a), c) MPBX location and anchors depth; b), d) stressmeter
location (Cravero et al., 2002)
Geophysical and Geomechanical Investigation 605
Table
1.
Ex
amp
leo
fst
ruct
ura
lsu
rvey
wit
hd
isco
nti
nu
ity
loca
lisa
tio
no
nth
ero
ckw
all
Zo
ne
of
inves
tig
atio
nw
all
A
Ref
eren
cep
oin
t:x
(lo
cal)
y(l
oca
l)z
Fra
ctu
reN
�d
ip(�
)d
d(�
)ty
pe
thic
kn
ess
(cm
)ap
ertu
re(c
m)
mo
rph
olo
gy
end
1(m
)en
d2
(m)
no
te
s.sc
ale
b.s
cale
x1
y1
type
x2
y2
type
17
01
20
dia
c0
.1–
smP
1.2
03
.2L
2.4
60
.00
L2
77
11
8d
iac
0.2
–sm
P3
.15
3.2
L4
.00
0.0
0L
38
59
dia
c0
.1–
rP
6.4
01
.15
L6
.50
3.2
L4
74
11
2d
iac
0.1
–0
.2–
rP
10
.91
3.2
L1
1.2
70
.00
LW
56
51
95
dia
c0
.1–
0.2
–r
U1
7.5
13
.2L
18
.10
0.0
0L
W6
76
20
2d
iac
<0
.1–
rP
21
.90
3.2
L2
2.9
01
.00
L
diac
dia
clas
e,W
pre
sen
ceo
fw
ater
Mo
rph
olo
gy
:r
rou
gh
,sm
smo
oth
,Sl
slic
ken
sid
ed,S
step
ped
,U
un
du
lati
ng
,P
pla
nar
Ty
pe:
sst
op
ped
,L
lon
ely,
ttr
un
cate
d
606 A. M. Ferrero et al.
window. This information is very important for the rock hierarchical definition
reported in a following chapter.
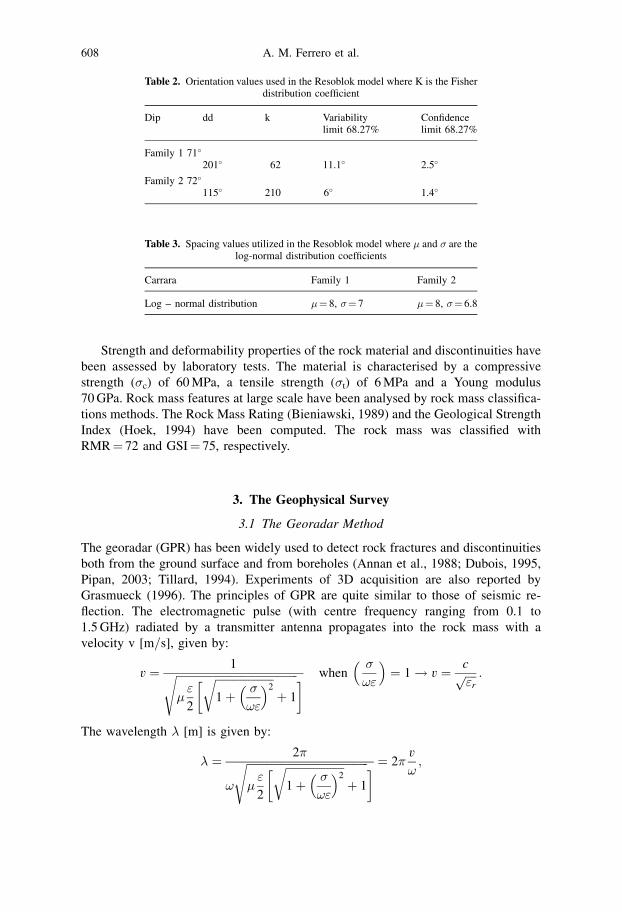
Figure 3 shows equal-area projections of the discontinuities mapped in the site
under study. Geostructural data show the presence of two main joint sets. Orientation
data have been analysed taking Terzaghi correction into account.
Spacing has been analysed at LAEGO laboratory (Nancy) with different statistical
distribution laws with the code STAFF and verified with a classical �2 test. The
modelling steps allow the spacing distribution to be modelled using different laws
of density of probability (Laplace-Gauss normal, exponential, Log-normal, uniform).
Every statistical simulation has also been checked by comparing observed rock walls
with simulated ones. Values have been calibrated until a good correspondence has
been reached. Table 2 reports the obtained results. A log-normal distribution has been
chosen since it has been found as the most consistent with the experimental data
(Table 3).
Fig. 3. Equal area projection of the discontinuity poles of the quarry
Fig. 2. Rock wall exposure and relative survey digitalization
Geophysical and Geomechanical Investigation 607
Strength and deformability properties of the rock material and discontinuities have
been assessed by laboratory tests. The material is characterised by a compressive
strength (�c) of 60 MPa, a tensile strength (�t) of 6 MPa and a Young modulus
70 GPa. Rock mass features at large scale have been analysed by rock mass classifica-
tions methods. The Rock Mass Rating (Bieniawski, 1989) and the Geological Strength
Index (Hoek, 1994) have been computed. The rock mass was classified with
RMR¼ 72 and GSI¼ 75, respectively.
3. The Geophysical Survey
3.1 The Georadar Method
The georadar (GPR) has been widely used to detect rock fractures and discontinuities
both from the ground surface and from boreholes (Annan et al., 1988; Dubois, 1995,
Pipan, 2003; Tillard, 1994). Experiments of 3D acquisition are also reported by
Grasmueck (1996). The principles of GPR are quite similar to those of seismic re-
flection. The electromagnetic pulse (with centre frequency ranging from 0.1 to
1.5 GHz) radiated by a transmitter antenna propagates into the rock mass with a
velocity v [m=s], given by:
v ¼ 1ffiffiffiffiffiffiffiffiffiffiffiffiffiffiffiffiffiffiffiffiffiffiffiffiffiffiffiffiffiffiffiffiffiffiffiffiffiffiffiffiffiffiffiffi�"
2
� ffiffiffiffiffiffiffiffiffiffiffiffiffiffiffiffiffiffiffiffiffi1 þ �
!"
� �2r
þ 1
s � when� �
!"
�¼ 1 ! v ¼ cffiffiffiffi
"rp :
The wavelength � [m] is given by:
� ¼ 2�
!
ffiffiffiffiffiffiffiffiffiffiffiffiffiffiffiffiffiffiffiffiffiffiffiffiffiffiffiffiffiffiffiffiffiffiffiffiffiffiffiffiffiffiffiffi�"
2
� ffiffiffiffiffiffiffiffiffiffiffiffiffiffiffiffiffiffiffiffiffi1 þ �
!"
� �2r
þ 1
s � ¼ 2�v
!;
Table 2. Orientation values used in the Resoblok model where K is the Fisherdistribution coefficient
Dip dd k Variabilitylimit 68.27%
Confidencelimit 68.27%
Family 1 71�
201� 62 11.1� 2.5�
Family 2 72�
115� 210 6� 1.4�
Table 3. Spacing values utilized in the Resoblok model where � and � are thelog-normal distribution coefficients
Carrara Family 1 Family 2
Log – normal distribution �¼ 8, �¼ 7 �¼ 8, �¼ 6.8
608 A. M. Ferrero et al.
with:
� ¼ �0�r [H=m], the magnetic permeability of the rock mass, where �0 ¼ 4��10�7 [H=m] is the vacuum magnetic permeability and �r½�� is the relative magnetic
permeability of the rock;
" ¼ "0"r [F=m], the electric permittivity of the rock mass, where "0 ¼ 10�9=36�[F=m] is the vacuum electric permittivity and "r½�� is the relative electric permittivity
of the rock;
c ¼ 1=ffiffiffiffiffiffiffiffiffi"0�0
p[m=s], the velocity of the electromagnetic pulse in vacuum;
� [S=m] is the conductivity of the rock;
! ¼ 2�f [rad=s] is the angular frequency.
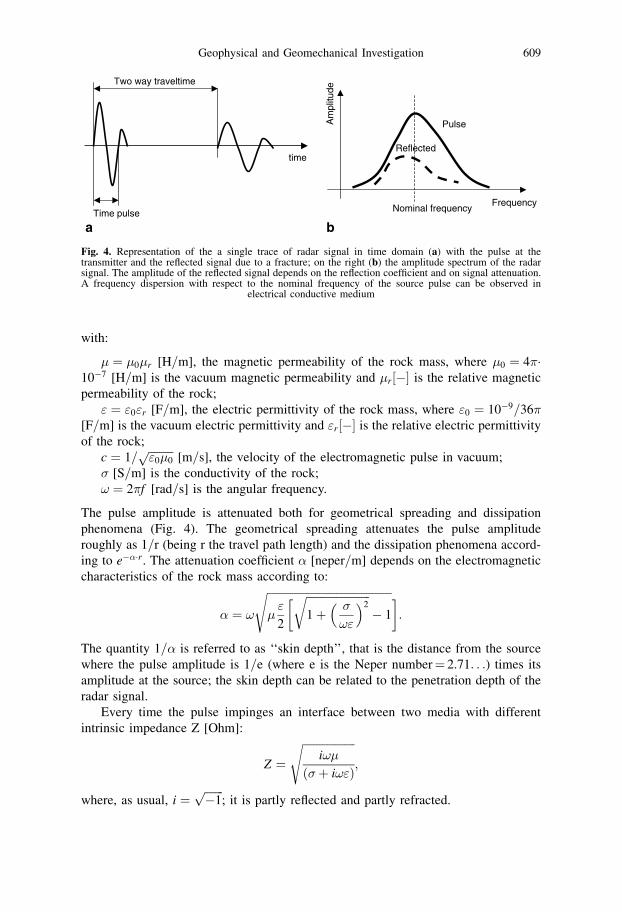
The pulse amplitude is attenuated both for geometrical spreading and dissipation
phenomena (Fig. 4). The geometrical spreading attenuates the pulse amplitude
roughly as 1=r (being r the travel path length) and the dissipation phenomena accord-
ing to e���r. The attenuation coefficient � [neper=m] depends on the electromagnetic
characteristics of the rock mass according to:
� ¼ !
ffiffiffiffiffiffiffiffiffiffiffiffiffiffiffiffiffiffiffiffiffiffiffiffiffiffiffiffiffiffiffiffiffiffiffiffiffiffiffiffiffiffiffiffiffi�"
2
� ffiffiffiffiffiffiffiffiffiffiffiffiffiffiffiffiffiffiffiffiffiffiffi1 þ
� �
!"
�2r
� 1
s �:
The quantity 1=� is referred to as ‘‘skin depth’’, that is the distance from the source
where the pulse amplitude is 1=e (where e is the Neper number¼ 2.71. . .) times its
amplitude at the source; the skin depth can be related to the penetration depth of the
radar signal.
Every time the pulse impinges an interface between two media with different
intrinsic impedance Z [Ohm]:
Z ¼ffiffiffiffiffiffiffiffiffiffiffiffiffiffiffiffiffiffiffi
i!�
ð�þ i!"Þ
s;
where, as usual, i ¼ffiffiffiffiffiffiffi�1
p; it is partly reflected and partly refracted.
Fig. 4. Representation of the a single trace of radar signal in time domain (a) with the pulse at thetransmitter and the reflected signal due to a fracture; on the right (b) the amplitude spectrum of the radarsignal. The amplitude of the reflected signal depends on the reflection coefficient and on signal attenuation.A frequency dispersion with respect to the nominal frequency of the source pulse can be observed in
electrical conductive medium
Geophysical and Geomechanical Investigation 609
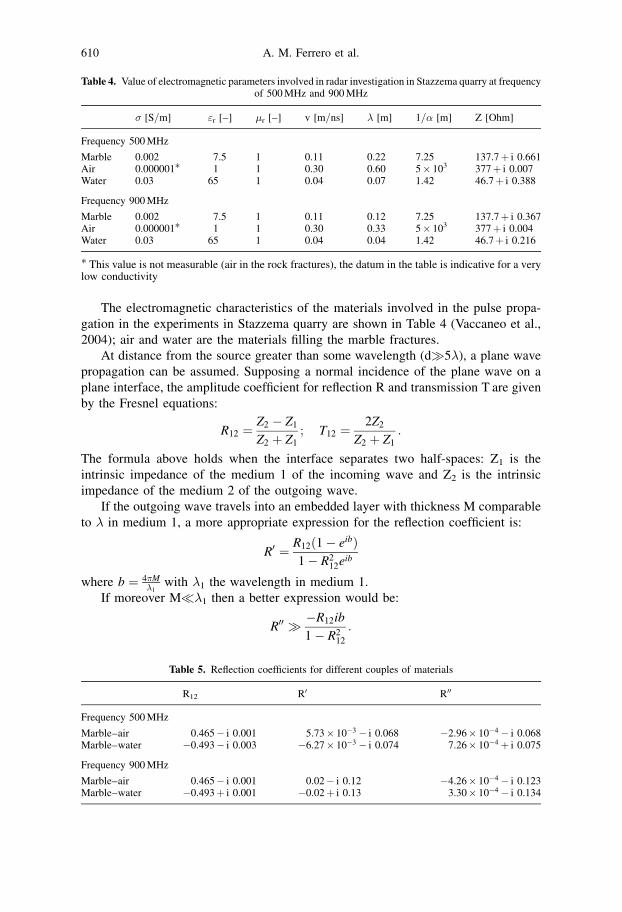
The electromagnetic characteristics of the materials involved in the pulse propa-
gation in the experiments in Stazzema quarry are shown in Table 4 (Vaccaneo et al.,
2004); air and water are the materials filling the marble fractures.
At distance from the source greater than some wavelength (d�5�), a plane wave
propagation can be assumed. Supposing a normal incidence of the plane wave on a
plane interface, the amplitude coefficient for reflection R and transmission T are given
by the Fresnel equations:
R12 ¼ Z2 � Z1
Z2 þ Z1
; T12 ¼ 2Z2
Z2 þ Z1
:
The formula above holds when the interface separates two half-spaces: Z1 is the
intrinsic impedance of the medium 1 of the incoming wave and Z2 is the intrinsic
impedance of the medium 2 of the outgoing wave.
If the outgoing wave travels into an embedded layer with thickness M comparable
to � in medium 1, a more appropriate expression for the reflection coefficient is:
R0 ¼ R12ð1 � eibÞ1 � R2
12eib
where b ¼ 4�M�1
with �1 the wavelength in medium 1.
If moreover M��1 then a better expression would be:
R00 � �R12ib
1 � R212
:
Table 4. Value of electromagnetic parameters involved in radar investigation in Stazzema quarry at frequencyof 500 MHz and 900 MHz
� [S=m] "r [–] �r [–] v [m=ns] � [m] 1=� [m] Z [Ohm]
Frequency 500 MHz
Marble 0.002 7.5 1 0.11 0.22 7.25 137.7þ i 0.661Air 0.000001� 1 1 0.30 0.60 5� 103 377þ i 0.007Water 0.03 65 1 0.04 0.07 1.42 46.7þ i 0.388
Frequency 900 MHz
Marble 0.002 7.5 1 0.11 0.12 7.25 137.7þ i 0.367Air 0.000001� 1 1 0.30 0.33 5� 103 377þ i 0.004Water 0.03 65 1 0.04 0.04 1.42 46.7þ i 0.216
� This value is not measurable (air in the rock fractures), the datum in the table is indicative for a verylow conductivity
Table 5. Reflection coefficients for different couples of materials
R12 R0 R00
Frequency 500 MHz
Marble–air 0.465� i 0.001 5.73� 10�3 � i 0.068 �2.96� 10�4 � i 0.068Marble–water �0.493� i 0.003 �6.27� 10�3 � i 0.074 7.26� 10�4 þ i 0.075
Frequency 900 MHz
Marble–air 0.465� i 0.001 0.02� i 0.12 �4.26� 10�4 � i 0.123Marble–water �0.493þ i 0.001 �0.02þ i 0.13 3.30� 10�4 � i 0.134
610 A. M. Ferrero et al.
The R0 coefficient would then be suitable when there are ‘‘thin layers’’, the R00 co-
efficient would be suitable when the layers ‘‘close’’ to fractures. In Table 5 the values
of the reflection coefficients are given as calculated from the electromagnetic param-
eters of the materials encountered by the radar pulse in the pillar.
At least theoretically, according to the radar performances, there is the chance of
getting a signal back even from a fracture as open as 2 mm (see Table 5) filled by
water; commercial radar systems have performance of approximately 100 dB, that
means a capability of detecting signal of 1 mV for a pulse amplitude of 100 V, with
a ratio between incident and reflected amplitude of 10�5.
The values of R00 also ensure that a high percent of energy passes through the
fracture and is disposable to detect a following fracture on the pulse path. However, as
far as the possibility of detecting two parallel fractures separated by a distance d, the
‘‘vertical resolution’’ (i.e. the resolution along the propagation direction) of the geo-
radar must be defined. The most common approximation of the vertical resolution r is
in the range from 1=4 to 1=2 of the wavelength �, mainly depending on the noise level.
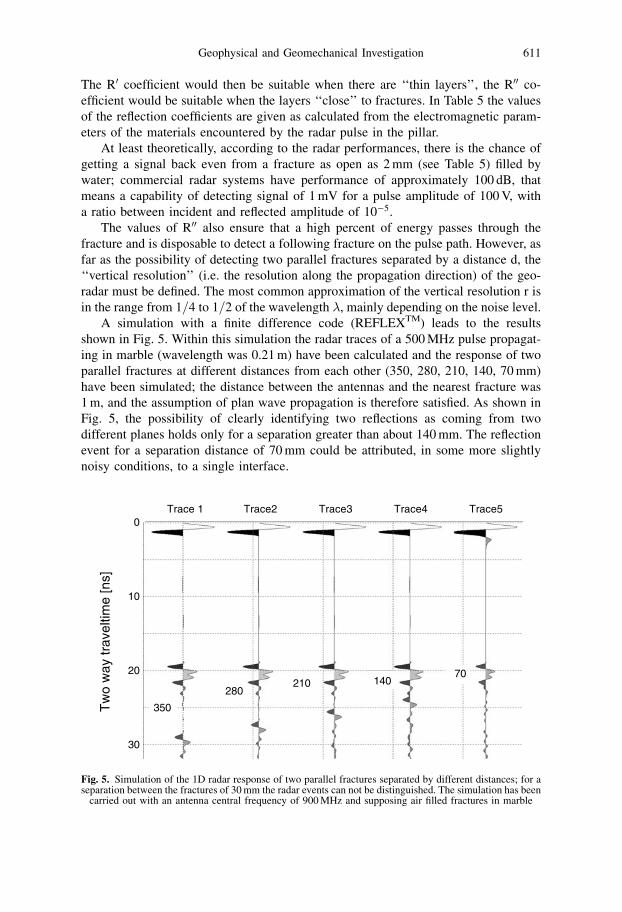
A simulation with a finite difference code (REFLEXTM) leads to the results
shown in Fig. 5. Within this simulation the radar traces of a 500 MHz pulse propagat-
ing in marble (wavelength was 0.21 m) have been calculated and the response of two
parallel fractures at different distances from each other (350, 280, 210, 140, 70 mm)
have been simulated; the distance between the antennas and the nearest fracture was
1 m, and the assumption of plan wave propagation is therefore satisfied. As shown in
Fig. 5, the possibility of clearly identifying two reflections as coming from two
different planes holds only for a separation greater than about 140 mm. The reflection
event for a separation distance of 70 mm could be attributed, in some more slightly
noisy conditions, to a single interface.
Fig. 5. Simulation of the 1D radar response of two parallel fractures separated by different distances; for aseparation between the fractures of 30 mm the radar events can not be distinguished. The simulation has been
carried out with an antenna central frequency of 900 MHz and supposing air filled fractures in marble
Geophysical and Geomechanical Investigation 611
The radar theory and the numerical simulations allow then to proceed with the
field test and to help in data interpretation.
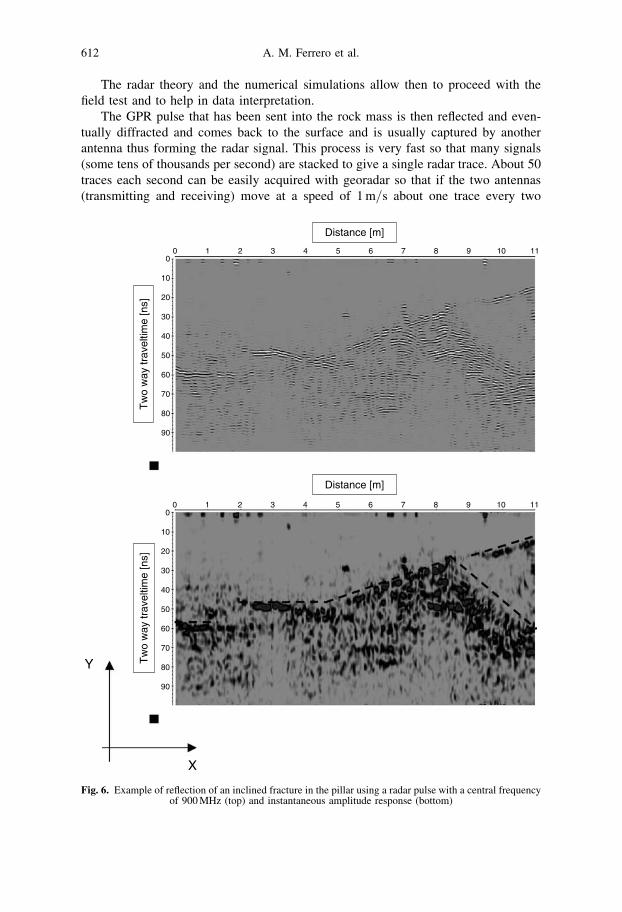
The GPR pulse that has been sent into the rock mass is then reflected and even-
tually diffracted and comes back to the surface and is usually captured by another
antenna thus forming the radar signal. This process is very fast so that many signals
(some tens of thousands per second) are stacked to give a single radar trace. About 50
traces each second can be easily acquired with georadar so that if the two antennas
(transmitting and receiving) move at a speed of 1 m=s about one trace every two
Fig. 6. Example of reflection of an inclined fracture in the pillar using a radar pulse with a central frequencyof 900 MHz (top) and instantaneous amplitude response (bottom)
612 A. M. Ferrero et al.
centimetres can be acquired. The traces, plotted together, form the raw radargram
(Fig. 6) that can be referred to the diffractions and reflections of the electromagnetic
pulse within the rock mass.
3.2 Georadar Measurements and Processing
Radar data acquisition was performed using a SIR2TM GSSI radar with 500 MHz and
900 MHz antennas on the four sides of the pillar along horizontal profiles at different
elevation. The data processing, performed with REFLEXTM package, involved hor-
izontal normalisation, bandpass filtering, migration and attribute computation (Godio
et al., 2003). The horizontal normalisation regularises the separation distance between
two adjacent radar traces adjusting for the non uniform speed of the antenna along the
profile (it is an horizontal interpolation of the whole data set of radar traces). The band
pass filtering decreases the amplitude of certain unwanted frequencies in the reflected
signal. Usually unwanted low frequencies are associated with the system noise while
high frequencies can be associated to the background electromagnetic noise. Migra-
tion is a procedure that permits to reduce the effect of wavefield artefacts (diffraction
hyperbolas), collapsing all the energy in a single point.
3.3 Geophysical Results
The results of the georadar survey are described taking into account the penetration
depth and the resolution obtained at different frequencies, moreover they are com-
pared with the preliminary reconstruction obtained by the geomechanical mapping.
The acquisition on the pillar at low frequency (Fig. 7) permitted a penetration
depth of more than 10 meters with a very low degradation of information also in
presence of several reflection events. Intense diffraction effects were evident in each
acquisition when the 500 MHz antennas were used. The main diffraction patterns were
caused by discontinuities on the pillar faces (steps on the wall surface, remains of
cutting trace on the pillar). While it was expected that the diffraction pattern would
have disappeared after few meters, considering that in theory the antenna has a rather
narrow radiation beam, with a maximum radiated power centred to an angle of 20�
from the normal to the dipole, the experiment evidenced strong diffracted signals for
angles wider than 45�.In such a context the migration procedures were used for filtering the radar image
and reduce the effect of diffraction hyperbolas, representing in a more realistic image
the ‘‘true’’ position of the reflectors (steep layers). A simple time migration (diffrac-
tion stack) of the radar zero-offset profiles using a constant velocity was performed.
The diffraction stack was performed in the x–t range. A selected example of the
reliability of the diffraction stacks is depicted in Fig. 7.
The acquisition using high frequency antenna therefore confirmed the capability of
the system to detect the main (close) fractures up to a distance of 4–5 meters from the
wall of the pillar. The resolving power degrades more because of attenuation due to
reflection and diffraction events and because of geometrical spreading than because of
dissipation phenomena.
Geophysical and Geomechanical Investigation 613
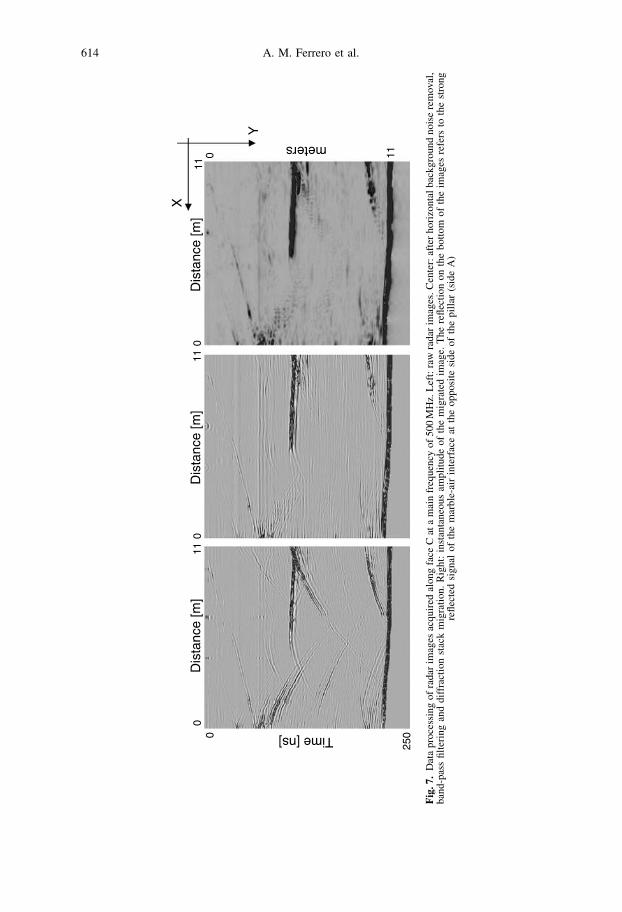
Fig.7.
Dat
ap
roce
ssin
go
fra
dar
imag
esac
qu
ired
alo
ng
face
Cat
am
ain
freq
uen
cyo
f5
00
MH
z.L
eft:
raw
rad
arim
ages
.C
ente
r:af
ter
ho
rizo
nta
lb
ack
gro
un
dn
ois
ere
moval
,b
and
-pas
sfi
lter
ing
and
dif
frac
tio
nst
ack
mig
rati
on
.R
igh
t:in
stan
tan
eou
sam
pli
tud
eo
fth
em
igra
ted
imag
e.T
he
refl
ecti
on
on
the
bo
tto
mo
fth
eim
ages
refe
rsto
the
stro
ng
refl
ecte
dsi
gnal
of
the
mar
ble
-air
inte
rfac
eat
the
opposi
tesi
de
of
the
pil
lar
(sid
eA
)
614 A. M. Ferrero et al.
The investigation limited to a single face of the pillar shows that the system is well
able to detect discontinuities and fractures parallel or gently inclined with respect to
the pillar face where the antennas move. On the contrary, the discontinuities perpen-
dicular to the plane of the antennas could be resolved only under favourable condi-
tions, where the tortuosity of the fracture planes determine localised diffraction
hyperbolas.
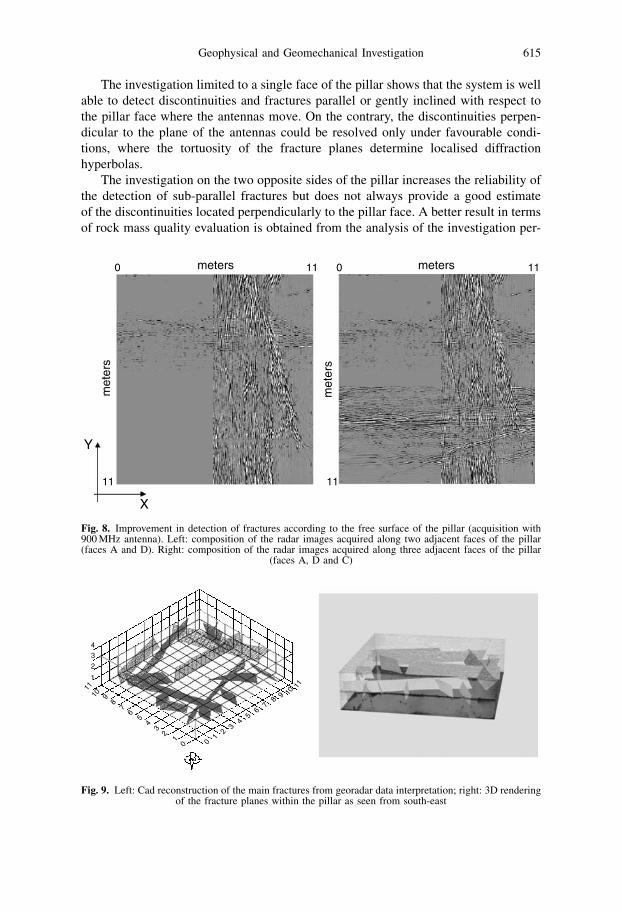
The investigation on the two opposite sides of the pillar increases the reliability of
the detection of sub-parallel fractures but does not always provide a good estimate
of the discontinuities located perpendicularly to the pillar face. A better result in terms
of rock mass quality evaluation is obtained from the analysis of the investigation per-
Fig. 8. Improvement in detection of fractures according to the free surface of the pillar (acquisition with900 MHz antenna). Left: composition of the radar images acquired along two adjacent faces of the pillar(faces A and D). Right: composition of the radar images acquired along three adjacent faces of the pillar
(faces A, D and C)
Fig. 9. Left: Cad reconstruction of the main fractures from georadar data interpretation; right: 3D renderingof the fracture planes within the pillar as seen from south-east
Geophysical and Geomechanical Investigation 615

formed on two pillar faces perpendicular to each other (Fig. 8). This condition is a
realistic approximation of many cases that can be encountered during the exploitation
activities. The optimum results can be achieved when three different walls of the pillar
are accessible for the radar survey, as pointed out in Fig. 8.
A 3D reconstruction of the persistence of the main fractures can be obtained by
interpolating the reflections events acquired at different levels along the pillar face
(Fig. 9). The comparison of the (partial) reconstruction of the geometry and persis-
tence of the main joints and fractures with the preliminary computed structural model
shows the limitations of this model in modelling the fracture pattern within the pillar
and the need to compute a new model starting form the information obtained by the
georadar survey.
4. Rock Mass Modelling
Rock engineering design for the assessment of the stability condition of an under-
ground excavation needs a tool able to forecast the stress and deformation responses of
the rock mass. Fractured rock masses are often geometrically complex and can be
regarded as an assemblage of many individual polyhedral blocks. When such a rock
mass is subjected to mechanical disturbance, through, for example, the excavation of
an underground opening, the blocks of the rock mass will displace and rotate.
Displacements and rotations can be very large, and the contacts between the
individual blocks may change as the blocks move. Consequently, the mechanical
response of a rock mass can be properly determined through the use of computational
methods that are designed to account for large block displacements and rotations, and
block detachment and re-attachment (Bray, 1975). The modelling of the rock mass
considered as a blocky system is performed in two phases: the geometrical modelling
and the mechanical modelling
4.1 Geometrical Modelling
The geometrical discretisation of a rock mass into blocks is based on an ideal,
perfect discontinuous medium. In order to describe a rock mass as a blocky system,
it is necessary to consider the relationships between the joint sets. These relation-
ships can be ruled by the interruption of some joints in correspondence to joints that
belong to another set or by relative displacements between blocks. The relationships
between the joint sets are the results of successive failures. The natural state of
fracture of a rock mass is the result of its geological and structural history. Its history
is made up of a succession of events each with different stress states. The early
events generally generate one or two joint sets. The later events usually affect pre-
existing fractures. The chronology of the various events determines the hierarchy of
the fractures.
The software code utilised in this work is Resoblok (Heliot, 1988a, b) which has
been implemented to follow the tectonic history of the formation; a continuous medi-
um is transformed into a blocky system. Joints can be introduced in a deterministic
way, as in the case of faults or major discontinuities directly detected on site; the joint
616 A. M. Ferrero et al.
sets are automatically generated in a statistic way on the basis of the surveyed dis-
continuities, by means of statistical distribution.
The deterministic analysis is based on the orientation, position and persistence of
the fractures; a single discontinuity can be considered either completely persistent,
and therefore crossing the overall model, or not completely persistent. The joint sets
(derived from statistic analysis) are represented on the basis of the principal orienta-
tion, mean spacing and persistence.
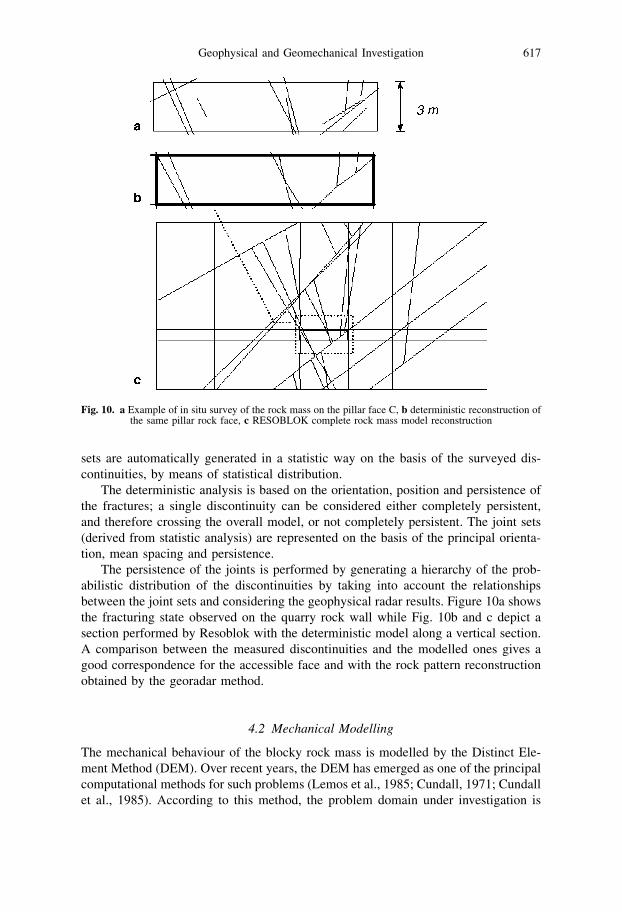
The persistence of the joints is performed by generating a hierarchy of the prob-
abilistic distribution of the discontinuities by taking into account the relationships
between the joint sets and considering the geophysical radar results. Figure 10a shows
the fracturing state observed on the quarry rock wall while Fig. 10b and c depict a
section performed by Resoblok with the deterministic model along a vertical section.
A comparison between the measured discontinuities and the modelled ones gives a
good correspondence for the accessible face and with the rock pattern reconstruction
obtained by the georadar method.
4.2 Mechanical Modelling
The mechanical behaviour of the blocky rock mass is modelled by the Distinct Ele-
ment Method (DEM). Over recent years, the DEM has emerged as one of the principal
computational methods for such problems (Lemos et al., 1985; Cundall, 1971; Cundall
et al., 1985). According to this method, the problem domain under investigation is
Fig. 10. a Example of in situ survey of the rock mass on the pillar face C, b deterministic reconstruction ofthe same pillar rock face, c RESOBLOK complete rock mass model reconstruction
Geophysical and Geomechanical Investigation 617
regarded as a discontinuous medium, composed of an assembly of discrete blocks (the
distinct elements), which may be rigid or deformable, and which interact with one
another through deformable boundaries of definable stiffness. In the DEM, the contact
between two elements results in the generation of inter-element forces. Since an
element may simultaneously be in contact with a number of adjacent elements, there
is usually a number of these forces applied to each element.
According to DEM, a block geometry is defined using the spacing, orientation and
the persistence of the joint sets which characterise the rock mass under study. Large
displacements and rotation, detachment and re-attachment are allowed for a single
block, each of which may be assumed as a rigid or deformable body. The stress and
strain in the blocks can also be computed and the response of a discontinuous medium
(jointed rock mass) subject to either static or dynamic loading can be simulated.
The method can be applied to compute the mechanical behaviour of a blocky
system and the stability condition of the excavation since the blocks that can fall or
slide from the roof of the room or within the pillar can be determined, and the induced
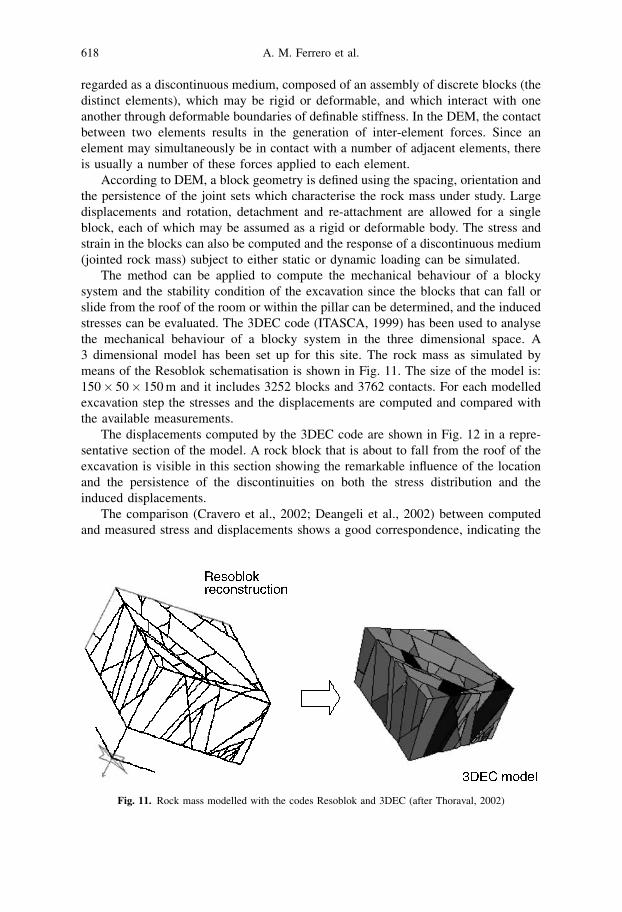
stresses can be evaluated. The 3DEC code (ITASCA, 1999) has been used to analyse
the mechanical behaviour of a blocky system in the three dimensional space. A
3 dimensional model has been set up for this site. The rock mass as simulated by
means of the Resoblok schematisation is shown in Fig. 11. The size of the model is:
150� 50� 150 m and it includes 3252 blocks and 3762 contacts. For each modelled
excavation step the stresses and the displacements are computed and compared with
the available measurements.
The displacements computed by the 3DEC code are shown in Fig. 12 in a repre-
sentative section of the model. A rock block that is about to fall from the roof of the
excavation is visible in this section showing the remarkable influence of the location
and the persistence of the discontinuities on both the stress distribution and the
induced displacements.
The comparison (Cravero et al., 2002; Deangeli et al., 2002) between computed
and measured stress and displacements shows a good correspondence, indicating the
Fig. 11. Rock mass modelled with the codes Resoblok and 3DEC (after Thoraval, 2002)
618 A. M. Ferrero et al.
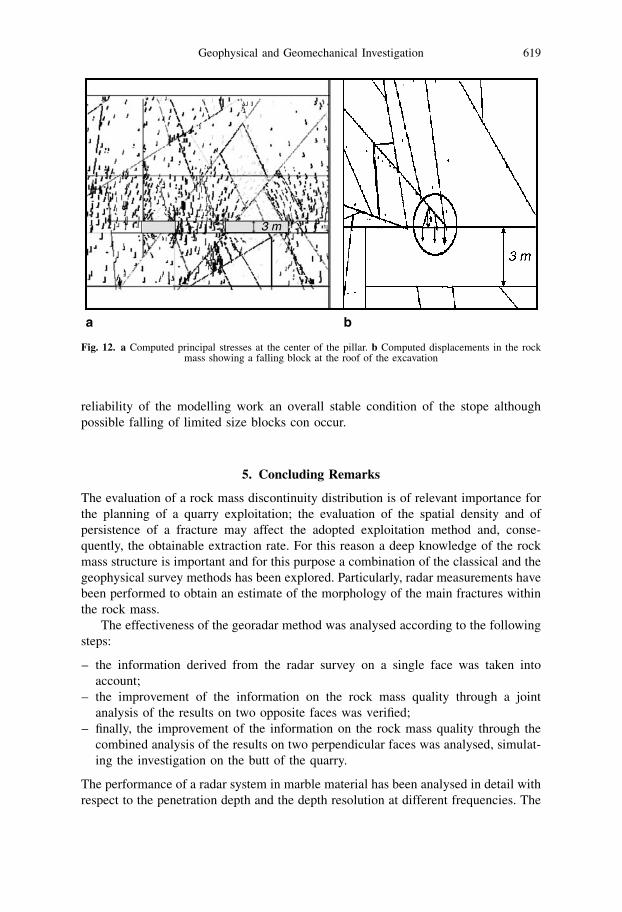
reliability of the modelling work an overall stable condition of the stope although
possible falling of limited size blocks con occur.
5. Concluding Remarks
The evaluation of a rock mass discontinuity distribution is of relevant importance for
the planning of a quarry exploitation; the evaluation of the spatial density and of
persistence of a fracture may affect the adopted exploitation method and, conse-
quently, the obtainable extraction rate. For this reason a deep knowledge of the rock
mass structure is important and for this purpose a combination of the classical and the
geophysical survey methods has been explored. Particularly, radar measurements have
been performed to obtain an estimate of the morphology of the main fractures within
the rock mass.
The effectiveness of the georadar method was analysed according to the following
steps:
– the information derived from the radar survey on a single face was taken into
account;
– the improvement of the information on the rock mass quality through a joint
analysis of the results on two opposite faces was verified;
– finally, the improvement of the information on the rock mass quality through the
combined analysis of the results on two perpendicular faces was analysed, simulat-
ing the investigation on the butt of the quarry.
The performance of a radar system in marble material has been analysed in detail with
respect to the penetration depth and the depth resolution at different frequencies. The
Fig. 12. a Computed principal stresses at the center of the pillar. b Computed displacements in the rockmass showing a falling block at the roof of the excavation
Geophysical and Geomechanical Investigation 619
reconstruction of 2D and 3D images of the main fractures allows the information of
the geostructural survey to be integrated.
The accuracy and the reliability of the georadar interpretation has been confirmed
through a comparison between the results and the traces of the joints and fractures that
are visible on the different pillar walls. The shortcomings of the radar investigation
have been outlined considering the penetration depth and the vertical and horizontal
resolving capabilities. These drawbacks pointed out the importance of performing an
investigation along two adjacent walls of the quarry in order to obtain a more accurate
reconstruction of the persistence and geometry of the fractures.
Determining the density of the discontinuities is a difficult task in areas of high
density with inter-spacing between the fractures of less than 0.2–0.3 metres. The
feasibility of operating along profiles at different elevations on the faces permits a
realistic visualisation of the main fractures using 3D rendering techniques. In the
selected case the presence of vertical discontinuity planes makes the rendering easy
and reliable. The 2D and 3D reconstruction of the fractures permits a more accurate
deterministic evaluation of the 3D structural model.
The final comparison between the radar images and the reconstruction performed
by the Resoblok code allowed to verify the pitfalls of the deterministic reconstruc-
tion based only on the analysis of the visible traces of joints and fractures on the
pillar faces, allowing the optimising of the reconstruction of the pillar fracturing
system. Finally, the geophysical results have been integrated in the study of the
mechanical behaviour of the marble rock mass and the mechanical behaviour has
been analysed using both probabilistic and deterministic geometrical models of the
rock mass.
As far as the radar acquisition and data processing are concerned the low costs of
single fold data acquisition (near zero offset) and the good quality of the results
justified the validity of the simplified approach. Technical improvements in horizontal
resolution could be obtained using more sophisticated acquisition schemes (optimum
offset and CMP acquisition). Borehole investigations would increase the effectiveness
of the radar survey, permitting accurate investigation surveys in complex logistical
conditions of the quarry; in many cases the number and the position of boreholes
have to be well planned in order to avoid damage to the integer zone of the quarry.
On the other hand, an increase in the unitary costs of the survey using a more
complicated approach could make an extensive investigation during the mining activ-
ity unrealistic.
The methodology is particularly interesting for a low degree fractured rock mass
where the discontinuities rule the mechanical behaviour of the rock mass and where
the proposed geophysical techniques can be more reliable.
Ackowledgement
This work has been funded by the European Union with project ‘‘Development of an inte-grated computed aided design and planning methodology for underground marble quarries’’CAD-PUMA BE97-5005 Brite Euram III and by the Italian Minister of Research, COFIN2001 ‘‘Mechanised excavation of tunnels’’. In situ measurements and laboratory tests have beencarried out by CNR-FIRGET Torino.
620 A. M. Ferrero et al.
References
Annan, A. P., Davis, J. L., Gebdzwill, D. (1988): Radar sounding in potash mines. Saskatchewan,Canada. Geophysics 55(12), 1556–1564.
Barla, G., Barla, M. (2001): Continuo e discontinuo nella modellazione numerica dello scavo digallerie. Gallerie e grandi opere sotterranee n.61.
Bieniawski, Z. T. (1989): Engineering rock mass classification. John Wiley & Sons, New York,251pp.
Bray, J. W. (1975): Methods of analysing discontinua, in situations where slip and separation mayproduce significant displacements. Rock Mechanics Technical Note No. 1, InterdepartmentalRock Mechanics Project, Imperial College, London.
Cravero, M., Ferrero, A. M., Iabichino, G. (2001): First results from an experimental study ofthe static behavior of underground marble quarries. MPES, Int. Symp. Mine Planning andEquipment Selection – IJSM & Universite Lavall, New Delhi, November, 19–21.
Cravero, M., Ferrero, A. M., Gulli’, D., Iabichino, G. (2002): Behaviour of experimental panelsfor underground marble exploitation by means of in situ monitoring and computation.Toronto Ont. Canada, NARMS-TAC 2002, 5th N. Am. Rock Mechanics Symposium Canada,1, 713–720.
Cundall, P. A. (1971): A computer model for simulating progressive large scale movements inblocky rock systems. In: Proc., Symposium of the International Society of Rock Mechanics,Nancy, France, 1, Paper No. II–8.
Cundall, P. A., Hart, R. D. (1985): Development of generalised 2-D and 3-D distinct programsfor modelling jointed rocks. Misc. Paper SL-85-1. US Army Corps of Engineers, ItascaConsulting Group.
Deangeli, C., Ferrero, A. M., Cravero, M., Iabichino, G. (1999): Monitoring of undergroundexcavations: Measurement system design by numerical modelling. In: Proc., of 5th Int. Symp.on Field Measurements in Geomechanics – FMGM99=Singapore, 441–446.
Deangeli, C., Ferrero, A. M. (2002): Development of an integrated computer aided design andplanning methodology for underground marble quarries. Brite euram III Project – BE-5005Research activity Final Report, 24–25.
Dubois, J.-C. (1995): Borehole radar experiment in limestone: analysis and data processing. FirstBreak 13, 57–67.
Godio, A., Sambuelli, L., Ferrero, A. M. (2003): Geophysical investigation to optimise ex-cavation of an underground marble quarry in Stazzema – Italy. The Leading Edge 22,574–579.
Grasmueck, M. (1996): 3-D ground-penetrating radar applied to fracture imaging in gneiss.Geophysics 61, 1050–1064.
H�eeliot, D. (1988a): Conception et R�eealisation d’un Outil Int�eegr�ee de Mod�eelisation des massifsRocheux Fractur�ees en Blocs. PhD Thesis, Institut National Polytechnique de Lorraine.
H�eeliot, D. (1988b): Generating a Blocky Rock Mass. Int. J. Rock Mech. Sci. Geomech. Abstr. 25,127–138.
Hoek, E. (1994): Strength of rock and rock masses. ISRM N. J. 2(2), 4–16.
ITASCA (1999): 3DEC User’s Manual. Itasca Consulting Group, Inc., Minnesota.
Jing, L. (2003): A review of techniques, advances and outstanding issues in numericalmodelling for rock mechanics and rock engineering, Int. J. Rock Mech. Min. Sci. 40,283–353.
Geophysical and Geomechanical Investigation 621

Lemos, J. V., Hart, R. D., Cundall, P. A. (1985): A generalized distinct element program formodelling jointed rock mass. In: Proc., Int. Symp. Fundamental of Rock Joints, Bj€oorkliden,335–343.
Pipan, M., Forte, E., Guangyou, F., Finetti, I. (2003): High resolution GPR imaging and jointcharacterization in limestone. Near Surface Geophysics 1, 39–55.
Tillard, S. (1994): Radar experiments in isotropic and anisotropic geological formations (graniteand schists). Geophys. Prosp. 42, 615–636.
Thoraval, A. (2002): Development of an integrated computer aided design and planningmethodology for underground marble quarries. Brite Euram III project – BE-5005 Researchactivity Final Report, 19–21.
Vaccaneo, D., Sambuelli, L., Marini, P., Tascone, R., Orta, R. (2004): Measurement system ofcomplex permittivity of ornamental rocks in L frequency band. IEEE Trans. Geosci. RemoteSens. 42, 2490–2498.
Authors’ address: Dr. A. M. Ferrero, Dipartimento di Ingegneria Civile, Universita di Parma,Parco delle Scienze 1, 43 100 Parma, Italy; e-mail: [email protected]
622 A. M. Ferrero et al.: Geophysical and Geomechanical Investigation