geological and geophysical characterisation of the paganica - san gregorio area after the april 6,...
TRANSCRIPT

491
Geological and geophysical characterisation of the Paganica - San Gregorio area after the April 6, 2009 L’Aquila earthquake (Mw 6.3, central Italy):implications for site response
P. BONCIO1a, A. PIZZI1b, G. CAVUOTO2, M. MANCINI2, T. PIACENTINI1b, E. MICCADEI1b, G.P. CAVINATO2, S. PISCITELLI3, A. GIOCOLI3, G. FERRETTI4, R. DE FERRARI4, M.R. GALLIPOLI3, M. MUCCIARELLI5, V. DI FIORE6, A. FRANCESCHINI7, F. PERGALANI8, G. NASO9 and WORKINGGROUP MACROAREA3
WORKING GROUP MACROAREA3: B. GIACCIO2, M. MOSCATELLI2, M. SPADONI2, G. ROMANO3, D. SPALLAROSSA4,M. PASTA4, M. PAVAN4, D. SCAFIDI4, S. BARANI4, C. EVA4, M. COMPAGNONI8, T. CAMPEA10, G.R. DI BERARDINO10, T. MANCINI10, A. MARINO 10, R. MONTEFALCONE10, F. MOSCA10
1 Dipartimento di Scienze (a) / DiGAT (b) - Università di Chieti-Pescara, Chieti Scalo, Italy2 CNR, Istituto di Geologia Ambientale e Geoingegneria, Roma, Italy3 CNR, Istituto di Metodologie per l’Analisi Ambientale, Potenza, Italy4 Dip.Te.Ris., Università di Genova, Italy5 DiSGG, Università della Basilicata, Potenza, Italy6 CNR, Istituto dell’Ambiente Marino e Costiero, Napoli, Italy7 Provincia Autonoma di Trento, Servizio Geologico, Trento, Italy8 Dipartimento di Ingegneria Strutturale, Politecnico di Milano, Italy9 Dipartimento della Protezione Civile, Roma, Italy10 Professional geologist, Ordine dei Geologi della Regione Abruzzo, Italy
(Received: May 6, 2010; accepted: September 24, 2010)
ABSTRACT We present the results of a geological and geophysical investigation, aimed at theseismic microzonation for post-earthquake reconstruction, of the Paganica-SanGregorio area damaged by the April 6, 2009 L’Aquila earthquake. The area ischaracterised by a thick pile of lacustrine and alluvial deposits (up to 190 m thick ormore) accumulated syntectonically within a NW-SE extensional tectonic basin andcovering a morphologically and structurally articulated carbonate bedrock. Theextensive cover of continental deposits justifies the widespread local stratigraphicamplifications of the ground motion measured by passive seismology (weak motionand noise), with some apparently contradicting results such as the absence ofsignificant amplification peaks within the large Paganica alluvial fan. In general, wefound an excellent agreement between the results from the spectral ratio analysis ofthe ground motion and the structural-stratigraphic setting obtained by independentgeological (surface and well data) and geophysical (ERT) constraints. Besides the 1Damplification effects, spectral ratio analyses revealed significant amplifications over abroad frequency range along both the horizontal and vertical components suggestingthat 2D (or possibly 3D) site effects are related to the architecture of the buriedbedrock.
Key words: L’Aquila earthquake, geophysical measurements, soil mechanical properties, site amplificationcentral Italy.
Bollettino di Geofisica Teorica ed Applicata Vol. 52, n. 3, pp. 491-512; September 2011
DOI 10.4430/bgta0014
© 2011 – OGS

492
Boll. Geof. Teor. Appl., 52, 491-512 Boncio et al.
1. Introduction
Soon after the April 6, 2009 normal faulting L’Aquila earthquake (Mw 6.3), the ItalianNational Department of Civil Protection (DPC) promoted and coordinated intensive geologicaland geophysical investigations aimed at the seismic microzonation of the mesoseismal area(MCS intensity ≥ VII) for post-earthquake reconstruction applications. The mesoseismal area wasdivided into 12 macroareas (see www.protezionecivile.it under “Microzonazione Sismicadell’area aquilana”) with the aim of zoning these areas following the Guidelines and Criteriaproposed by the Gruppo di Lavoro MS (2008).
We present part of the results pertaining to macroareas 3 and 5. In particular, we show theresults from the area including the Paganica, Tempera, Bazzano (industrial area), Onna and SanGregorio localities, all belonging to the municipality of L’Aquila (Fig. 1). These localities aresituated 6 to 10 km east of the April 6 epicentre and suffered damages of up to IX-X on the MCSscale [Paganica VIII, Tempera IX, Bazzano VIII, San Gregorio IX and Onna IX-X; Galli et al.(2009)].
The surface geology has been constrained by detailed (1:5,000 scale) geological surveys andhas been integrated with pre-existing and newly-acquired well data. The pre-existing data consistsmostly of stratigraphic reports of water wells linked to the Italian National Law n. 464/1984(made available by ISPRA, the Italian Institute for Environmental Protection and Research) andseveral geognostic wells made available by independent professionals. We drilled six newgeognostic wells for stratigraphic and mechanical characterisation of the continental coverdeposits. We also acquired a number of geophysical data to characterise the sub-surfacestratigraphy and the related shear wave velocities, as well as the local seismic response. Thegeophysical analyses included electric resistivity tomographies, multichannel analyses of seismicwaves, refraction microtremor analyses, down-hole experiments and seismic recordings of both
Fig. 1 - Geological map of the Paganica - Tempera - Onna - San Gregorio area with synthesis of the results from theweak motion (squares) and ambient seismic noise (circles) measurements; the stations with significant amplificationof the vertical component are highlighted by an asterisk (number in brackets indicates the frequency in Hz of theamplification peak along the vertical component). Labelled boreholes are reported in the sections of Figs. 2 and 6 (ww= water well; D = pre-existing geognostic well; DH = newly-drilled geognostic well with down-hole). PQB) Pre-Quaternary carbonate bedrock (Early Cretaceous - Miocene); Lac-s) stratified, very stiff-to-cemented white carbonatesilt and sandy-silt of lacustrine environment (Early Pleistocene); Lac-g) clino-stratified, medium-to-coarse, very densegravel and conglomerate with rounded grains in a white-greyish silty (lacustrine) matrix (Early-Middle(?) Pleistocene);Br) slope-derived, massive, coarse-to-very coarse breccia, partially etheropic with Lac-g (Middle(?) Pleistocene);Fan1) coarsely stratified, medium-to-coarse conglomerate or very dense gravel and sandy gravel with rounded/sub-rounded grains of alluvial fan environment containing paleosols and tephra horizons (Middle Pleistocene, lower part);Fan2) coarsely stratified, medium-to-coarse, dense gravel, locally cemented, with rounded/sub-rounded grains in asandy-silty matrix of alluvial fan environment containing silty paleosols with volcaniclastic material (upper part ofMiddle Pleistocene - Late Pleistocene(?)); All2) Terraced fluvial deposits made up of dense gravel/conglomerate anddense sand (Middle Pleistocene); Fan3) medium-to-coarse, dense gravel, locally poorly cemented, with rounded/sub-rounded grains in sandy-silty matrix of alluvial fan environment (Late Pleistocene); All3) Terraced fluvial depositsmade up of alternating, coarsely stratified, medium dense gravel and sand (Late Pleistocene); Db) slope-derived, poorlydense or loose angular gravel in silty-clayey matrix (Late Pleistocene - Holocene); Coll) eluvium-colluvium made upof soft silt and clay with scattered gravel grains (gravel increasing toward the slope foot) (Latest Pleistocene -Holocene); Fan4) fine-to-coarse, poorly dense or loose gravel with sub-angular grains in a silty-sandy matrix, withinterlayers of poorly dense sand (Holocene); All4) modern and recent fluvial deposits made up of poorly dense or loosegravel, sandy gravel, sand and silty sand (Holocene); Bf) human backfill and waste material (present).

493
Soil characterisation of the Paganica - San Gregorio area Boll. Geof. Teor. Appl., 52, 491-512

494
Boll. Geof. Teor. Appl., 52, 491-512 Boncio et al.
ambient noise and earthquakes.In this note, we deal with the geological aspects of the seismic microzonation (i.e., the
geological model), and we discuss the implications, in terms of site response, based on noise andearthquake recordings. The results from this study might have implications for both: a) themethodological approach to the seismic microzonation in areas of comparable geological settingand elsewhere and b) the post-earthquake reconstruction and future land-use planning of theinvestigated area. In fact, the geological model, such as that presented here, is the first, basic stepfor any subsequent quantitative estimates of the site response to ground shaking, which in turnis a useful tool for:
i) defining priorities in the reconstruction phase; ii) deciding the best typology of construction during the repair/reconstruction phase; iii) identifying areas with the highest amplifications that should be excluded from new
urbanisation, and iv) urban planning in general. Examples of quantitative site response studies in the form of
maps of amplification factors and acceleration response spectra for the L’Aquila area aregiven in Gruppo di Lavoro MS-AQ (2011) [for the macroarea 3, also Compagnoni et al.(2011)].
During the seismic microzonation, we also mapped a number of zones affected by localhazard due to coseismic surface faulting/fracturing along the Paganica and San Gregorio normalfaults that were reactivated during the April 6 earthquake. Though this is an important aspect ofthe seismic microzonation, it will not be discussed here. In fact, this topic requires an adequatedescription/discussion, and we will deal with it in a separate note.
2. Surface geology
The Paganica - San Gregorio area is located within the Middle Aterno intramountain basin.This is a tectonic basin elongated in the NW-SE direction, which was formed during theQuaternary extensional tectonics and is bordered by normal faults (Bosi and Bertini, 1970;Bagnaia et al., 1992; Bertini and Bosi, 1993; Vezzani and Ghisetti, 1998; APAT, 2005). Thenormal master fault, bordering the basin to the NE, is the SW-dipping Paganica normal fault,which belongs to the Mt. Stabiata - Paganica - San Demetrio fault system (Bagnaia et al., 1992;Bertini and Bosi, 1993; Boncio et al., 2010). This is the westernmost fault of a set of normalfaults offsetting and lowering the Meso-Cenozoic carbonate units of the Gran Sasso Rangetowards L’Aquila (SW). Antithetic normal faults (NE-dipping) delimit the basin to the SW.
Several geological, seismological and geodetic data clearly indicate that the Mt. Stabiata -Paganica - San Demetrio fault system is the seismogenic master fault of the April 6, 2009earthquake (Anzidei et al., 2009; Atzori et al., 2009; Chiarabba et al., 2009; Cirella et al., 2009;Falcucci et al., 2009; Galli et al., 2009; Pondrelli et al., 2009; Walters et al., 2009; Boncio et al.,2010). Coseismic surface faulting occurred along the central-northern portion of the system,particularly along the Paganica segment (see Fig. 1), where the ground surface was offset withdip-slip displacements up to nearly 10 cm (EMERGEO Working Group, 2009; Falcucci et al.,2009; Galli et al., 2009; Boncio et al., 2010; ISPRA at www.apat.gov.it). Coseismic fracturingwas also observed along the San Gregorio normal fault. This fault was interpreted as a major
495
Soil characterisation of the Paganica - San Gregorio area Boll. Geof. Teor. Appl., 52, 491-512
synthetic splay of the Mt. Stabiata - Paganica - San Demetrio system that was reactivated tonearly the ground surface during the April 6 main shock [Fig. 1; Boncio et al. (2010)].
The basin at the hanging wall of the Paganica fault system is filled with Quaternarycontinental deposits. The interior of the basin is articulated by a number of NW-SE-elongatedridges formed by pre-Quaternary carbonate rocks and emerging from the continental deposits(Fig. 1). East of Paganica, the pre-Quaternary bedrock is formed by Lower Cretaceous massivelimestones passing upwards to Upper Cretaceous - Oligocene stratified limestones, marlylimestones and marls and then to Miocene marly limestones. Between San Gregorio andPaganica, the bedrock is composed of Eocene - Oligocene stratified limestones passing upwardsto Miocene marly limestones, marls and clayey marls (APAT, 2005).
The continental deposits of the basin infill are formed by several sedimentary units of EarlyPleistocene-to-Holocene age. The oldest continental deposits (Early Pleistocene) crop out east ofSan Gregorio and can be referred to as the “Poggio Picenze” and “Vall’Orsa” sedimentary cyclesaccording to Bertini and Bosi (1993). They are formed by very stiff or cemented white andgreyish lacustrine carbonate silt with sand interbeds [Lac-s unit in Fig. 1; “Limi di San Nicandro”of the Poggio Picenze cycle, Bertini and Bosi (1993)], capped by clino-stratified, grain-supported,very dense gravels and conglomerates in a white silty matrix [Lac-g unit; Vall’Orsa cycle, Bertiniand Bosi (1993)]. They represent the infilling of a wide tectonic lake of Early Pleistocene age thatwas closed upwards by coarse-grained fan deposits that prograded within the lake in thepredominant ENE-WSW direction (Bosi and Bertini, 1970; Bagnaia et al., 1992; Bertini andBosi, 1993). The most widespread continental deposits are younger alluvial fan and fluvialsediments which piled syntectonically during Middle and Late Quaternary times and whichcovered the above-mentioned older lacustrine deposits. The prevailing texture is gravel andsandy-silty gravel, with increasing percentages and interlayers of fine-grained sediments (sandand silt) towards the Aterno River, where alluvial fan and fluvial deposits become interfingered.
We distinguished 3 fan units, cropping out between Paganica and the Aterno River. The oldestfan unit (Fan1) is tectonically uplifted at the footwall of the Paganica normal fault and isinternally offset by normal faults, that originated tectonic terraces. This unit covers the carbonatebedrock and is formed by coarsely stratified conglomerates or very dense gravels and sandygravels with interlayers of paleosols and tephra horizons of Middle Pleistocene age (Messina etal., 2009). A younger fan unit (Fan2), tentatively referred to as the upper part of the MiddlePleistocene - Late Pleistocene age, crops out at the hanging wall of the Paganica normal fault andrepresents the unit where the largest part of the Paganica village is founded. It consists of densesandy-silty gravels that are locally cemented and coarsely stratified. This unit is probably coevalwith the terraced alluvial gravels, conglomerates and sands cropping out NW of San Gregorio(All2 unit). The widest outcropping unit, of Late Pleistocene age, corresponds to the large alluvialfan developing between the mouth of the Raiale gorge and the alluvial plain of the Aterno River(Fan3). The unit shows typical fan morphology with the upper depositional surface gently sloping(2-4%) towards the Aterno River. A number of outcrops along quarry walls show that theprevailing lithology consists of medium-to-very dense or slightly cemented gravels and sandy-silty gravels that contain thin, laterally discontinuous interlayers of yellowish sands. Theoutcropping thickness of the unit is ≥ 15 m. The available water well stratigraphies suggest thatthe unit is up to 30-35 m thick; it passes downwards to older gravels, probably correlated to the

496
Boll. Geof. Teor. Appl., 52, 491-512 Boncio et al.
fan units cropping out near Paganica (Fig. 2). Close to the Aterno River, the Fan3 gravels arecovered by fluvial deposits of Holocene age (mostly sand and silt, All4 unit). These fluvialdeposits pass downwards to older fluvial units of the paleo-Aterno River that are in lateralcontinuity with the fan deposits (sand and silt with gravel interbeds; Flu-Lac of Figs. 2 and 3,observed only in geognostic wells). Other recent fluvial deposits (mapped as All4 unit in Fig. 1)made up of gravels, sandy gravels and sand crop out along the Vera River and between theCaticchio and Mt. Bazzano ridges. Coarse-grained bodies of loose-to-variously dense, slope-derived gravels in a silty-clayey matrix (Db unit) or fine-grained eluvial-colluvial covers (Collunit; silt and clay, with subordinate gravel) crop out at the foot of the topographic ridges. Recentalluvial fans (Fan4 unit) are located at the outlet of small valleys in the Paganica area and localcovers of backfill and waste material are widespread within villages and industrial areas (Bf unit).
3. Geognostic and geophysical investigations
To characterise the sub-surface geology with particular attention to the continental deposits,we performed a number of geophysical and geognostic investigations. The choice of type, numberand location of the investigations was conditioned by three main factors:
1) the identification of sites/transects considered key areas for the reconstruction of the sub-surface geological model;
2) the location of sites considered strategic for the post-earthquake construction/reconstructionstrategies; and
3) the budget. We acquired 7 electric resistivity tomographies (ERT in Fig. 1), 3 multichannel analyses of
seismic waves (MASW) and 13 experiments of refraction microtremors and drilled six newgeognostic wells (DH in Fig. 1). The geognostic drillings were planned in order to perform thefollowing tasks:
1) integrate the available well data (often characterised by poor stratigraphic reports) withdetailed stratigraphic logs;
2) measure the Vs and Vp variations by means of down-hole experiments; 3) calibrate the ERT profiles; and 4) collect samples of fine-grained materials for laboratory analyses. Below, we synthesise the results from the investigations that provided the most constraining
data, which are the DH, ERT and MASW analyses.
3.1. Geognostic well data and shear wave measurements
In Fig. 3, we report the synthetic stratigraphic logs of the six newly-drilled geognostic wellsand the velocity profiles obtained by down-hole experiments (see Fig. 1 for location).
The DH5 (30 m deep) and DH6 (38 m) wells are particularly important for the sub-surfacecharacterisation of the area. In fact, they reveal the presence of a thick sedimentary unit of likelyfluvial-lacustrine environment not exposed at the surface and probably related to the sedimentaryhistory of the paleo-Aterno River valley (Flu-Lac unit). This unit is mostly composed of brownsilty sand and clayey silt containing volcaniclastic material with gravel interbeds and with ageneral fining-upward arrangement. Along the DH6 well, the Flu-Lac unit is ~28 m thick and is

497
Soil characterisation of the Paganica - San Gregorio area Boll. Geof. Teor. Appl., 52, 491-512
covered by ~9 m of alluvial fan gravels (Fan3 unit). Downwards, it changes sharply to densegravels in an abundant whitish silty matrix that can be correlated to the Lac-g unit cropping outeast of San Gregorio (see Fig. 1). The DH6 well was used to calibrate the ERT1 profile (see Figs.1 and 6). Along the DH5 well, the Flu-Lac unit is ~17 m thick and is covered by ~9 m of recentalluvial fan deposits (mostly sands and gravels; Fan3-4 units). The transition to the Lac-g unit wasdrilled at an ~26 m depth.
The DH4 well (24 m deep) was drilled at the footwall of the San Gregorio normal fault, closeto the trace of the ERT2 profile. The well penetrated ~10 m of alluvial fan gravels (Fan3 unit)overlaying a ~10 m-thick interlayering of gravels and fine sediments (clay, silt and sand) thatprobably represent the interfingering between a coarse-grained fluvial unit (All2, see Fig. 1) andthe fluvial-lacustrine deposits of the Flu-Lac unit. At depths of 20.5 m, the well penetrated thetop of the pre-Quaternary bedrock (Oligocene-Miocene stratified limestone). This wellconfirmed that the bedrock at the footwall of the San Gregorio normal fault is relatively shallow.
The DH2 (42 m deep) and DH3 (51 m) wells were drilled at the northern and eastern
Fig. 2 - Geological sections across the Aterno River - Paganica (A-A’, B-B’) and San Gregorio-Onna (C-C’) areas withexamples of HVSR measurements from ambient seismic noise or weak motion (location in Fig. 1). Note that thevertical scale of the A-A’ section is exaggerated 5 times.

498
Boll. Geof. Teor. Appl., 52, 491-512 Boncio et al.
terminations of the Paganica alluvial fan, respectively. The DH2 well probably crossed the 3alluvial fan units recognised in outcrops near Paganica (Fan1, Fan2 and Fan3 units). The Fan3-Fan2 boundary, marked by a thin red pedogenic horizon, was drilled at an ~5 m depth. The Fan2-Fan1 boundary, at an ~35 m depth, was interpreted as corresponding to a sandy horizon, rich involcaniclastic material. Below this depth, very dense gravels and conglomerates were drilled(Fan1 unit). The DH3 well revealed a few meters of colluvial deposits and then a 42 m-thick pileof dense gravels and sandy-silty gravels. We interpreted these deposits as belonging to the Fan3and Fan2 units, but a stratigraphic boundary between the two units was not recognised. The wellended within brown sandy-silty sediments that probably represent an interlayer of fine-graineddeposits in the coarse-grained alluvial fan succession (possibly correlated to the Flu-Lac unit; seesection A in Fig. 2).
The DH1 well (40 m deep) was drilled west of the Tempera village and penetrated astratigraphy significantly different from that of the DH2 and DH3 wells. Colluvial deposits, ~5m thick, cover an 11-12-m thick sedimentary unit composed of brown fine-grained sediments,containing volcaniclastic material, likely of a fluvial-lacustrine environment that we tentativelycorrelate to the Flu-Lac unit. This unit covers an ~8 m-thick body of well cemented breccia in apink matrix that can be correlated to the outcropping Br unit (Fig. 1). Then, the well crossed morethan 15 m of dense gravels, in an abundant whitish silty matrix that is lithologically similar to theLac-g unit seen in outcrops near San Gregorio and recovered from the bottom of the DH5 andDH6 wells.
The Vs and Vp curves, shown in Fig. 3, were obtained by means of down-hole experiments.The errors were determined by taking into account that the measurements were executed from thetop to the bottom of the borehole and in the opposite direction (from bottom to top) using 4 minterval spacing. The down-hole survey time errors were always lower than 5% (~0.5 ms), whichcorresponds to the sampling interval.
The Vs values measured along the six wells can be grouped in three classes:1) the first class is characterised by low Vs (<300-350 m/s) and corresponds to the top few
meters of the sedimentary cover or to the Flu-Lac unit; the latter can have Vs values as lowas 100-200 m/s (e.g., DH6). Peaks in the Vs profile within the Flu-Lac unit (up to 500-600m/s at depths >15 m) are related to the presence of gravel beds;
2) the second class corresponds to the upper alluvial fan units (Fan2, Fan3), with Vs increasingprogressively with depth, to values of ~500-600 m/s at depths of > 3-5 m and up to 600-750 m/s for depths of > 10 m (DH2, DH3 and DH4). Variations along the Vs profile andpeaks up to 800 m/s can be related to different degrees of compactness/cementation (e.g.,DH3); and
3) the third class is characterised by high Vs (>750-800 m/s) and corresponds to the pre-Quaternary carbonate bedrock (Vs up to 1150-1200 m/s at depths of 22-24 m; DH4) or tovery dense/cemented continental coarse granular deposits such as the well cementedbreccia (e.g., Br in DH1), the very dense or cemented gavels of the Fan1 unit (e.g., DH2)and the very dense gravels in the white silty matrix of the Lac-g unit (e.g., DH1 and DH5).
The Vp/Vs ratio, that evaluates the porosity and degree of fracturing and lithification of thedeposits is particularly interesting. Based on the assumption that the pore structure influences theVp and the Vs differently, Vp/Vs can be used to extract various rock properties. It is evident that

499
Soil characterisation of the Paganica - San Gregorio area Boll. Geof. Teor. Appl., 52, 491-512
Fig. 3 - Stratigraphic logs for the six newly-drilled, geognostic wells and associated Vs, Vp and Vp/Vs profiles fromdown-hole experiments (location in Fig. 1); abbreviations for geologic units are as in Figs. 1 and 2.
500
Boll. Geof. Teor. Appl., 52, 491-512 Boncio et al.
in the DH1, DH3, DH4 and DH5 profiles, there are several Vp/Vs anomalies. These anomaliescan be characterised by a low Vp/Vs (DH4, 7-11 m depth; DH5, 17-21 m depth) that probablyindicates a low porosity medium under dry conditions or a high Vp/Vs (DH1, 1-5 m depth; DH4,15-17 m depth) that can be ascribed to a high porosity, saturated medium.
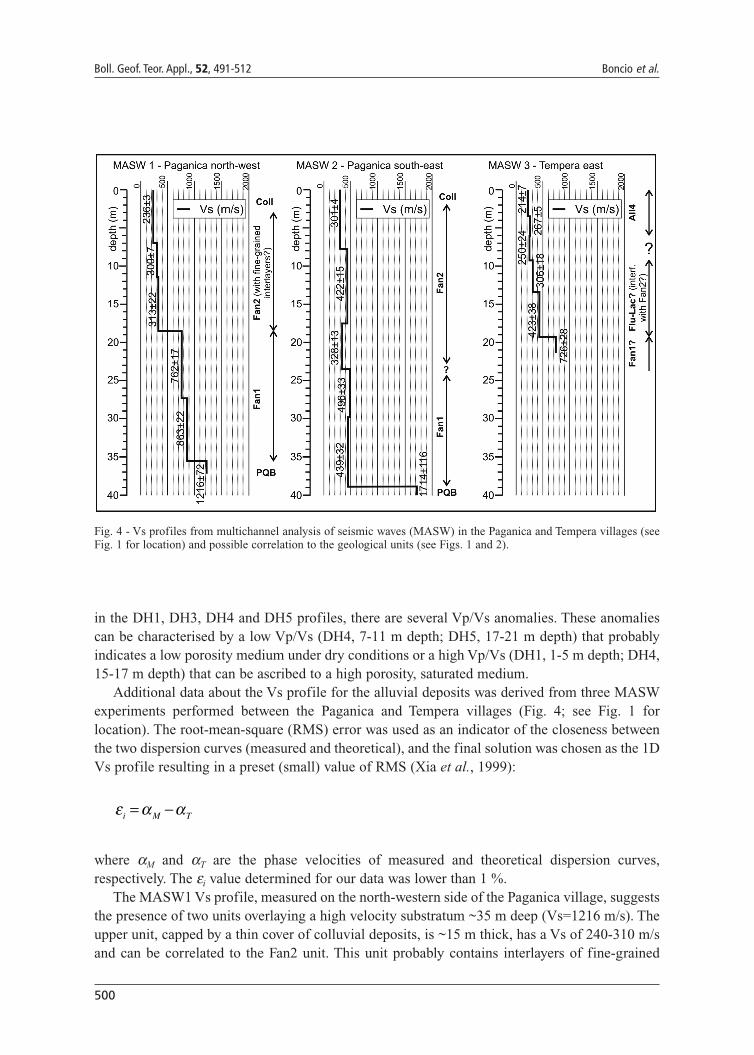
Additional data about the Vs profile for the alluvial deposits was derived from three MASWexperiments performed between the Paganica and Tempera villages (Fig. 4; see Fig. 1 forlocation). The root-mean-square (RMS) error was used as an indicator of the closeness betweenthe two dispersion curves (measured and theoretical), and the final solution was chosen as the 1DVs profile resulting in a preset (small) value of RMS (Xia et al., 1999):
where αM and αT are the phase velocities of measured and theoretical dispersion curves,respectively. The εi value determined for our data was lower than 1 %.
The MASW1 Vs profile, measured on the north-western side of the Paganica village, suggeststhe presence of two units overlaying a high velocity substratum ~35 m deep (Vs=1216 m/s). Theupper unit, capped by a thin cover of colluvial deposits, is ~15 m thick, has a Vs of 240-310 m/sand can be correlated to the Fan2 unit. This unit probably contains interlayers of fine-grained
ε α αi M T= −
Fig. 4 - Vs profiles from multichannel analysis of seismic waves (MASW) in the Paganica and Tempera villages (seeFig. 1 for location) and possible correlation to the geological units (see Figs. 1 and 2).

501
Soil characterisation of the Paganica - San Gregorio area Boll. Geof. Teor. Appl., 52, 491-512
sediments (sand, silt), which reduce the overall average Vs compared to prevailing gravels (e.g.,MASW2). The lower unit is ~17 m thick with a Vs of 760-860 m/s and is probably correlated tothe Fan1 unit.
The MASW2 Vs profile, measured on the south-eastern side of the Paganica village, suggeststhe presence of continental cover deposits overlaying a high velocity substratum ~39 m deep(Vs=1714 m/s). This substratum depth is fairly consistent with the depth of the carbonate bedrockas reported by the stratigrafic log of the ww1 water well (carbonate bedrock at 33 m depths; seesection B in Fig. 2). There are no sharp Vs variations within the cover deposits and the correlationto the Fan2 and Fan1 units can only be inferred. The first 23 m, that are possibly correlated to theFan2 unit, are characterised by a Vs of 320-420 m/s. The underlying 15 m of cover deposits havea higher Vs (440-500 m/s) and can be tentatively correlated with the Fan1 unit, even if the Vsvalues obtained seem significantly lower than those measured along both the MASW1 Vs profile(> 750 m/s at depths > 18 m) and the DH2 down-hole profile (> 900 m/s at depths > 33 m).
The MASW3 Vs profile was measured east of the Tempera village, on the fluvial deposits ofthe All4 unit. The first 6-9 m can be interpreted as the All4 unit, with a Vs of 210-270 m/s. Belowa 9 m depth, the Vs increases to 300-420 m/s and then, at a 19 m depth, to 725 m/s. The availablewells suggest that the sediments between a 6-9 and 19 m depth are correlated with the Flu-Lacunit drilled by the DH1 well and may be interfingered with the gravels of the Fan2 unit. Thesediments below a 19 m depth could be correlated with the Fan1 unit.
3.2. Electrical resistivity tomographies
The electrical resistivity tomography (ERT) is an active geoelectrical method widely appliedto obtain 2D and 3D high-resolution images of the resistivity sub-surface patterns in areas ofcomplex geology (Griffiths and Barker, 1993; Dahlin, 1996). It has been proved useful tocharacterise the geological and structural setting of sedimentary basins in seismogenic areas(Giano et al., 2000; Suzuki et al., 2000; Caputo et al., 2003; Galli et al., 2006; Giocoli et al., 2008).In this work, seven ERT surveys were carried out to characterise the sub-surface stratigraphy. Below,we describe three ERT profiles, acquired between the San Gregorio and Onna villages, that areconsidered the most representative profiles for the reconstruction of the sub-surface geologicalmodel of the area (ERT1, ERT2 and ERT4, see Fig.1 for location). The ERT1 was calibrated withthe DH6 well. The ERT2 and ERT4 were calibrated by the DH4 well and by a number of pre-existing water well stratigraphies and geognostic drillings located a few hundred meters away fromthe ERT profiles (see Fig. 1). ERT2 and ERT4 were used to build the C-C’ geological section,whereas the ERT1 was used for the D-D’ geological section (see next section and Figs. 2 and 6).
Apparent resistivity data were collected with two different arrays (Wenner-Schlumberger andDipole-Dipole) using a Syscal Pro (Iris instruments) Earth resistivity meter coupled with amultielectrode system (48 electrodes). An electrode spacing range from 5 to 10 m was used andresulted in an investigation depth of approximately 40 and 80 m, respectively. The RES2DINVresistivity inversion software (Loke and Barker, 1996) was used to automatically invert theapparent resistivity data. In all cases, the number of iterations was three with RMS errors ≤ 5%.
Fig. 5 shows the interpreted inverse model resistivity sections related to the 3 ERT profiles.Overall, the electrical images show a relatively low resistivity range, from 50 to over 566 Ω⋅m,and a resistivity pattern characterised by relatively strong lateral and vertical gradients (especially

502
Boll. Geof. Teor. Appl., 52, 491-512 Boncio et al.
in ERT1). On the basis of geological and geognostic data, low electrical resistivity values (from50 to 140-170 Ω⋅m) can be associated with sandy-silty fluvial-lacustrine deposits (Flu-Lac unit)and/or colluvial-alluvial deposits (Coll, All4 units), and relatively high electrical resistivity values(> 170 Ω⋅m) can be related to gravel deposits (Fan3, All2 units) and/or pre-Quaternary carbonatebedrock (PBQ). Finally, the occurrence of strong lateral discontinuities in the resistivitydistribution in ERT1 and ERT2 could be due to the presence of the SW-dipping San Gregorionormal fault.
4. Sub-surface geological model
The sub-surface geological and geophysical data allowed us to assess the geometry of thesedimentary bodies filling the basin and their relations with the pre-Quaternary bedrock. Thesub-surface geology of the area is synthesised along three geologic sections (Fig. 2). Sections A
Fig. 5 - Interpreted electrical images across the San Gregorio (ERT1 and ERT2) and Onna (ERT4) areas (see Fig. 1 forlocation).

503
Soil characterisation of the Paganica - San Gregorio area Boll. Geof. Teor. Appl., 52, 491-512
and B, cross the fan units longitudinally from the Aterno Valley to the town of Paganica. SectionC, crosses the flat alluvial plain near Onna, the lateral termination of the Paganica fan and thewestern border of the San Gregorio carbonate ridge. An additional section (section D, Fig. 6)shows details across the San Gregorio normal fault.
The Quaternary continental deposits, progressively thicken from NNE to SSW, mostly due tothe tectonic setting. At the footwall of the Paganica normal fault (section B), the Fan1 unit has anestimated thickness of ~20 m close to the normal fault and thins progressively to the NE. At thehanging wall of the normal fault, a water well (ww1 in Figs. 1 and 2) penetrated the carbonatebedrock at a depth of 33 m, below a cover of fan gravels (Fan1 and Fan2 units). Moving to theSW, synthetic normal faults down-fault the bedrock (see Fig. 1) to the SW, determining aprogressive step-like thickening of the continental deposits. Close to the south-western side of thetown of Paganica, near the apex of the Paganica fan (section A), the top of the bedrock(limestone) was drilled by a water well to a depth of 78 m (ww2 in Figs. 1 and 2) at the hangingwall of a synthetic splay of the Paganica normal fault (see Fig. 1). Along the central-southern partof section A (industrial area), the water wells show a deepening of the top of the bedrock to depthsexceeding 120-130 m. The borehole stratigraphies also show an increase of fine-grainedsediments (mostly sandy silt and clayey silt), toward the SSW, that form interlayers within the fangravel deposits up to >10 m thick. This overall increase of fine-grained sediments towards the
Fig. 6 - Geological section across the San Gregorio normal fault constrained by surface geology, newly-acquiredgeognostic well with down-hole experiment (DH6) and electrical tomography (ERT1) (see Fig. 1 for location). R12 toR14 indicate HVSR curves from seismic noise measurements; the gray curve indicates the synthetic HVSR obtainedfrom the inversion method by Castellaro and Mulargia (2009) (string on the left side indicates the inverted bedrockdepth and average Vs of the sedimentary cover).

504
Boll. Geof. Teor. Appl., 52, 491-512 Boncio et al.
Aterno River suggests a transition from coarse-grained proximal fan facies to distal fan facies orfluvial facies.
The sub-surface geology between Onna and San Gregorio is more articulated because of theSW-dipping San Gregorio normal fault (section C). The fault borders the San Gregorio carbonateridge to the SW. At the footwall of the fault, the carbonate bedrock is outcropping or buried by athin cover of alluvial, colluvial and slope-derived deposits. Along section C, the carbonatebedrock is ~20 m deep at borehole DH4 (Figs. 2 and 3) and is progressively shallower towardsthe NE. Along the ERT1 profile, the bedrock at the footwall of the fault is estimated to be as deepas ~5 m (Figs. 5 and 6). At the hanging wall of the fault, the continental deposits sharply thicken.Water well stratigraphies indicate a maximum depth of the carbonate bedrock of ~190 m (wellww5 in section C). More specifically, the stratigraphy of the continental deposits at the hangingwall of the fault, constrained by both pre-existing and newly-drilled wells, is characterised by:
1) a shallow unit made up of gravels (Fan3 unit, 10-20 m thick) that become progressivelythinner towards the South and SE. Along the ERT profiles, these deposits are characterisedby high resistivity values (>170 Ω⋅m, Fig. 5);
2) below the Fan3 unit, there are fine-grained deposits of fluvial-lacustrine environmentcomposed of sand and silt containing abundant volcaniclastic material with interbeds ofgravels (Flu-Lac unit). Along the ERT profiles, these deposits are characterised byrelatively low resistivity values (from 50 to 140 Ω⋅m, Fig. 5). Moving from section C to theNW, halfway between sections C and A, the unit Flu-Lac probably starts to be heteropicwith the fan gravels of the Fan2 unit;
3) below the Flu-Lac unit, there is a unit made up of gravels in an abundant white silty matrix,drilled by the DH5 and DH6 wells (Figs. 2 and 3) that can be correlated to the gravels andconglomerates of the Vall’Orsa cycle, cropping out near San Gregorio [Bertini and Bosi(1993); Lac-g unit in Fig. 1]. According to the well ww5, the total thickness of the unit is~30 m; and
4) considering both the stratigraphy of the well ww5 and the overall stratigraphic setting of theMiddle Aterno basin (Bosi and Bertini, 1970; Bertini and Bosi, 1993), it is reasonable tobelieve that the Lac-g unit is followed downwards by the Lac-s unit [Limi di San Nicandroof Bertini and Bosi (1993); Fig. 1]. Interpreting the stratigraphy of the ww5 well, theestimated thickness of the Lac-s unit is ~100 m, resulting in a total thickness of thecontinental succession at the hanging wall of the San Gregorio normal fault of ~190 m.
Between the trace of section D and San Gregorio village, the estimated dip-slip offset of thetop of the Lac-g unit across the San Gregorio normal fault is ~60 m.
Beneath the village of Onna and westwards, the absence of detailed stratigraphic logs fromdeep wells prevents reliable reconstructions of the sub-surface. The interpretation proposed insection C is mostly based on the extrapolation of the stratigraphy constrained along the easternpart of the section, with the help of the ERT profiles.
5. Weak motion and ambient seismic noise measurements
To estimate the seismic response of the Paganica-San Gregorio area, we carried out anextensive campaign of weak motion and ambient seismic noise measurements (see Fig. 1 for

505
Soil characterisation of the Paganica - San Gregorio area Boll. Geof. Teor. Appl., 52, 491-512
location of measuring points).Three temporary networks of velocimetric stations were installed to collect weak motion
measurements. Each station consisted of a Lennartz LE-3D/5s enlarged-band seismometerconnected to either a MarsLite datalogger with 20 bits of dynamic range and a sampling rate of125 Hz or a Taurus Nanometrics datalogger with 24 bits of dynamic range and a sampling rate of100 Hz. Between April 20 and 27, 2009 and between June 8 and 23, 2009, 17 seismic stationswere installed in the Paganica-Tempera areas. During this period, more than 550 earthquakeswere recorded. 329 of them with a local magnitude (ML) between 1.6 and 4.0 and a signal-to-noise ratio (S/N) greater than 15 dB were selected for analysis. To estimate the seismic responseof the area between the eastern side of L’Aquila and the industrial area of Bazzano, a temporarynetwork of nine velocimetric stations was installed from June 23, 2009 to July 2, 2009 thatrecorded more than 290 earthquakes. Of these earthquakes, 105 events with ML between 1.8 and3.9 and S/N > 15 dB were selected for analysis. Finally, five stations were installed in the SanGregorio area from June 9 to 24, 2009, and these stations recorded 92 seismic events with S/N >15 dB.
The weak motion data were analyzed using standard spectral ratio methods including“reference” and “non-reference” site techniques. The Reference Site Method (RSM) evaluatessite amplification as the ratio of Fourier spectral ordinates of the motions recorded on soil to themotions recorded by a reference seismic station at the bedrock. Non-reference site methods, alsocalled HVSR (Horizontal-to-Vertical Spectral Ratio) techniques, consist of calculating thehorizontal-to-vertical Fourier spectral ratio, or H/V, of earthquake and/or microtremor (noise)recordings. Local earthquake recordings were processed by filtering the signals between 0.2 Hzand 20 Hz and computing the smoothed (applying both a Hanning and a Konno-Ohmachifunction) Fourier spectra for signal windows including the S-phase arrival and the majority of thephase energy. Finally, for each site, the H/V ratios and the RSM curves (or H/HREF curves) werederived as the average of all spectral ratios. For each temporary network, a reference station,installed on bedrock outcrop (e.g., limestone), was carefully selected and checked (i.e., flat H/Vcurve).
The errors associated with the H/V and H/HREF curves and, therefore, with the fundamentalfrequency and relative amplitude level values, are defined in terms of standard deviation asderived by averaging the spectral ratios. In Fig. 2, in the panels showing the HVSRmeasurements, the mean values of the H/V curves and the ± 1 standard deviation are indicated.The reliable H/V and H/HREF peak frequencies (F0) are generally characterised by a standarddeviation lower than a factor of 2 (e.g., for a frequency greater than 0.5 Hz) over a frequencyrange between 0.5 F0 and 2 F0.
The results summarised in Fig. 1 point out that significant site effects can be recognised forthe Paganica-Tempera and San Gregorio areas and that the value of the fundamental frequency(F0), as derived from both the H/V and the H/HREF curves, spans between 1.5 and 3.0 Hz forPaganica West and Tempera South, between 2.5 and 3.0 for San Gregorio East and between 2.0and 3.0 Hz for San Gregorio West. The resonant peak is shifted towards a higher frequency (4.5-8.0 Hz) at sites close to the foot of carbonate ridges and close to the Aterno River. Incorrespondence with the central body of the Paganica fan, almost negligible site amplificationphenomena can be identified at only ~2 Hz. However, the H/HREF curves reveal that most of the

506
Boll. Geof. Teor. Appl., 52, 491-512 Boncio et al.
sites, for which the H/V curves indicate a significant amplification effect at the fundamentalfrequency, have a broad amplification band rather than a single well defined resonant peak.Generally, the H/HREF curves show significant amplification (up to around 5) from thefundamental frequency to frequencies greater than 4 Hz (up to about 9 Hz). Moreover, besidesthe amplification affecting the horizontal component of motion, the reference site method appliedto the weak motion recordings allowed us to discover significant amplification effects along thevertical component (stations denoted by asterisk in Fig. 1) as well. For almost all of the sitescharacterised by significant site effect, the amplification curves for the vertical componentassume values greater than unity over a broad frequency range, which starts from a frequencygreater than F0 and has maximum amplifications between 4.0 and 6.0 Hz.
The ambient seismic noise was measured on 58 sites for an acquisition time of at least 15minutes with a digital tri-directional tromometer, a high-resolution seismometer whose 24-bitdynamics targets the very low amplitude range, starting from the Brownian motion of the sensor.The HVSR curves were calculated by averaging the HVSR obtained by dividing the signal intonon-overlapping windows of 20 s. Each window was detrended, tapered, padded, FF-transformedand smoothed with triangular windows with a width equal to 5% of the central frequency. Theaverage was used to combine E-W and N-S components in the single horizontal (H) spectrum.Average single component spectra were obtained using the same procedure. For each HVSRcurve, the relative ± 2 confidence interval is given. Therefore, the errors associated with thefundamental frequency and relative amplitude level values are defined in terms of the standarddeviation as derived by averaging the spectral ratios. Moreover, to assess the reliability of themeasures, we compared our data not only to the SESAME Project (2004) criteria, but also to themore rigid criteria proposed by Albarello et al. (2011). These other comparative criteria includethe total duration of the recordings, the temporal stationarity of the spectral ratios, the isotropy ofthe signal in terms of spectral ratios, the absence of electromagnetic noise, and the overall trendof the HVSR curve.
In the investigated area, the results can be grouped in three main categories (see Figs. 1, 2 and6):
1) the bedrock outcrops showed flat HVSR curves, as expected, or had limited amplificationin the high frequency range (e.g., San Gregorio village);
2) the continental deposits covering the carbonate bedrock had clear peaks at decreasingfrequency with increasing sediment thickness; and
3) the central body of the Paganica alluvial fan did not have statistically significant peaks, inagreement with weak motion measurements.
More detailed analyses along the geological sections revealed how the frequency changes areclosely connected to the thickness variation of the sedimentary cover (Figs. 2 and 6). Whereindependent information was available (e.g., along ERT sections), we performed constrainedinversions of HVSR following the approach proposed by Castellaro and Mulargia (2009). Thevelocity estimated using this approach was in agreement with those later retrieved from the down-hole measurements. This indicates that the average velocities so obtained can be used to estimatethe sediment thickness when only HVSR measurements are available. Fig. 6 shows an exampleof such a procedure for a geological section crossing the San Gregorio normal fault andconstrained by the DH6 geognostic well and ERT1 profile.

507
Soil characterisation of the Paganica - San Gregorio area Boll. Geof. Teor. Appl., 52, 491-512
6. Discussion
The Paganica - San Gregorio area is characterised by extensive covers of continental depositsthat justify the widespread local stratigraphic amplifications measured by passive seismology.The lithology of the near-surface, cover deposits is certainly dominated by coarse-grained,alluvial sediments (gravels). Nevertheless, in spite of this relatively homogeneous texturalcharacteristic, we observed significant lateral variations of the site response that can bereasonably explained only if we adequately consider:
1) the different degrees of cementation/compactness of granular materials, and mostimportantly;
2) the sub-surface structural-stratigraphic setting, such as the 3D geometry of the sedimentarybodies, their reciprocal lateral correlations/heteropies and their relations with thearchitecture of the underlaying carbonate bedrock.
The fan gravels cropping out between the town of Paganica and the Aterno River havedifferent site responses. The oldest fan unit (Fan1), uplifted at the footwall of the Paganica normalfault, has no site amplification because of the high degree of cementation that makes this unitequivalent to seismic bedrock. In contrast, the adjacent Fan2 unit is characterised by significantsite amplifications (2 < A0 ≤ 3.5) at frequencies (F0) ranging mostly between 1.5 and 3 Hz,depending on the depth of the bedrock (20 to 40 m). In the central body of the wide Paganica fan(Fan3 unit), the spectral ratio analyses do not show statistically significant amplification peaks.This unexpected result might be explained by both the nearly-constant lithology with depth(grain-supported gravels) and the large sediment thickness (> 75 m) that together determine alack of significant impedance contrasts with depth. In fact, under these conditions, the spectralratio methods might be unable to point out the possible expected effects of site amplification.Significant site amplifications were instead pointed out by spectral ratio analyses on the lateralterminations of the fan, where the presence of finer material imbedded within the gravels (distalfan facies) probably determines the more pronounced contrasts of impedance with depth.
Prominent peaks at high frequency (4.5-11 Hz, 3 < A0 < 5) are characteristics of the thinsedimentary bodies (≤10 m thick) of colluvial, fine-grained alluvial and slope-derived depositswhich may cover both the carbonate bedrock and the alluvial units. Examples are the AternoRiver plain west of Onna (soft sandy fluvial deposits covering the alluvial gravels) and the easternborder of the Paganica fan (soft clayey-silty colluvia covering the fan gravels).
Significant variations of the site response occur across the San Gregorio normal fault, due tothe variations of both the depth of the carbonate bedrock and the stratigraphy of the continentaldeposits. At the footwall of the fault, the thin covers of alluvial gravels and colluvial deposits (upto a maximum of 20-25 m) produce amplification peaks at frequency ≥ 3.5 Hz (A0 >3). At thehanging wall of the fault, the carbonate bedrock is much deeper (~190 m). Nevertheless, theseismic bedrock seems not to be represented by the carbonate bedrock, but by the verydense/cemented gravels of the Lac-g unit that is intercepted by the geognostic wells at thehanging wall of the San Gregorio normal fault at depths of 30 to 60 m below the ground surfaceand deepening north-westwards. The behaviour of the Lac-g unit as a seismic bedrock issupported by both the textural features observed in the outcrop (very dense gravels and

508
Boll. Geof. Teor. Appl., 52, 491-512 Boncio et al.
conglomerates) and the geophysical data from the down-hole experiments (DH5 and DH1, Vs >800 m/s). The frequency of the amplification peaks at the hanging wall of the San Gregorionormal fault (2.5-3 Hz, 2.5 < A0 < 6.5) is systematically lower than those measured at the footwallof the fault, which is in agreement with a deeper seismic bedrock.
A further deepening of the seismic bedrock (the top of the Lac-g unit) to depths ≥ 60 m,probably due to a SW-dipping normal fault (dashed fault in section C of Fig. 2), might explainthe sharp variation in the vibration frequency observed across the Onna village (from 3.0-3.3 to~2.2 Hz moving from east to west; Fig. 1).
The Lag-g unit is followed downwards, by lacustrine silt that might have thicknesses of up to100 m (Lac-s unit; see Fig. 2). In the outcrop, the Lac-s unit is characterised by stratified, verystiff/cemented carbonate silt, suggesting a possible behaviour as seismic bedrock. However,direct mechanical characterisations of the Lac-s unit at various depths are lacking, and future siteresponse studies should plan deep geognostic drillings to intercept and characterise this unit (i.e.,depths > 60-70 m between San Gregorio and Onna).
It is worth noting that, mainly in the areas towards the north-western border of the Paganicafan and across the San Gregorio normal fault, while the HVSR method applied to earthquakes ormicrotremors identifies the site’s fundamental frequency, the reference site method revealsamplifications within a broader frequency range and indicates the presence of probable multi-dimensional (2D or possibly 3D) site effects. Moreover, as derived from RSM curves, such areasshow a significant amplification of the seismic motion along the horizontal components and alsoalong the vertical one (amplifications between 4 Hz and 6 Hz). While 1D amplification effectscan be related to the seismic impedance contrast between the bedrock and the overlying alluvialdeposits and, in some cases, also to the response of the soil layered system, 2D effects may beattributed to the buried morphology of the study area that is clearly related to the Quaternarysynsedimentary activity of the SW-dipping normal faults (i.e., Paganica and San Gregorio faults).
7. Summary and conclusions
From the geological-geophysical investigation of the Paganica-San Gregorio area, we candraw a number of conclusions that are of both local and general interest.
The local conclusions are strictly related to the geological setting of the investigated area andin particular to the basic surface and sub-surface geological model to be used for numericalquantifications of the site response (e.g., amplification factors, acceleration response spectra).These have evident implications in terms of future land-use planning and post-earthquakereconstruction (e.g., definition of priorities and best typology of construction during therepair/reconstruction phase; identification of areas with high amplifications that should beexcluded from new urbanisation).
- The geology of the Paganica-San Gregorio area is characterised by a thick pile of Quaternarydeposits syntectonically accumulated within an extensional basin and covering pre-Quaternarycarbonate bedrock, the top of which is rather articulated due to normal faulting. The normal faultsdip mostly to the SW (e.g., Paganica and San Gregorio fault) and determine a general step-likethickening of the continental succession moving from NNE to SSW (i.e., towards the AternoRiver), from a few meters to about 190 m or more.

509
Soil characterisation of the Paganica - San Gregorio area Boll. Geof. Teor. Appl., 52, 491-512
- The continental stratigraphy can be synthetically divided into: 1) old (Early Pleistocene)fine-grained lacustrine deposits (Lac-s) capped by gravels and conglomerates (Lac-g); 2) aMiddle-Upper Pleistocene sequence of coarse-grained alluvial fan (Fan1, Fan2 and Fan3), fluvial(All2 and All3) and slope-derived (Br) deposits and fine-grained, fluvial-lacustrine (Flu-Lac)deposits; and 3) thin covers of Upper Pleistocene-Holocene fine-to-coarse-grained alluvium(All4), coarse-grained slope-derived debris (Db), fine-grained, eluvial-colluvial accumulations(Coll) and human backfill and waste material (Bf).
- The seismic bedrock (Vs ≥ 800 m/s) is represented not only by the pre-Quaternary carbonaterocks, but also by the old (Early-Middle Pleistocene) coarse-grained, very dense/cementedcontinental alluvial deposits (Br, Fan1 and Lac-g units), provided that their original degree ofcompactness/cementation is preserved from significant weathering/fracturing. The mappeddistribution of these units and their depths below the younger continental units, as well as theirlateral continuity, are important targets in planning site response studies. Future site responsestudies should also plan deep geognostic drillings (> 60-70 m) to intercept and characterise theold lacustrine unit (Lac-s), which represents the lower unit of the continental basin infill and thatmight have thicknesses up to 100 m or more.
- The mechanical properties of the young fan units (Fan2 and Fan3) are typical of densegravels, with Vs increasing progressively with depth from 200-300 m/s in the near surface to 500-600 m/s at depths > 3-5 m and up to 600-750 m/s at depths >10 m. The mechanical properties ofthe fluvial-lacustrine deposits (Flu-Lac) are rather poor, with average Vs generally< 300 m/s andwith higher velocities (up to 500-600 m/s at depths >15 m) only corresponding to gravelinterbeds.
- The widespread site amplifications highlighted by spectral ratio analyses of both weakmotion and noise are mostly due to the stratigraphy of the continental deposits, especially thestratigraphy of the upper part of the continental succession (above the Lac-g and Fan1 units), withsome exceptions.
- The negligible amplifications recorded by the spectral ratio analyses in situations that fromsurface geology alone might be considered preferential sites for local amplifications, such as thecentral body of the large Paganica alluvial fan, may be explained in the context of largethicknesses (> 75 m) of relatively homogeneous gravelly textures that determine a lack of markedcontrasts of impedance with depth.
- The most significant amplification peaks (between 2 and 3 Hz) mostly occur: 1) where fine-grained fluvial-lacustrine sediments (Flu-Lac) prevail in the shallow sub-surface stratigraphy(within the first 15-30 m; e.g., San Gregorio at the hanging wall of the normal fault; TemperaWest) or where this unit represents a thick interlayer (≥20 m) within the alluvial gravels (e.g.,between San Gregorio and Onna); 2) along the marginal parts of the Paganica fan, whereinterlayers of fine-grained sediments within the alluvial gravels become an important percentageof the lithology (distal alluvial fan facies); and 3) where the dominant lithology is coarse-grainedfan gravels but the bedrock is shallower than 20-40 m (e.g., Fan2 unit at Paganica).
- The weak motion analyses, using the reference site method, revealed significantamplification effects over a broad frequency range along both the horizontal and verticalcomponents. This suggests that multi-dimensional (2D or 3D) site effects are related to thegeometry of the buried carbonate bedrock, which in turn is related to the synsedimentary activity

510
Boll. Geof. Teor. Appl., 52, 491-512 Boncio et al.
of Quaternary normal faults.General conclusions concern the successful methodological approach to the seismic
microzonation of the area, which might represent an additional example as to how site responsestudies should be pursued in comparable geological settings and elsewhere [see also BianchiFasani et al. (2008), Cardarelli et al. (2008), Pace et al. (2008) and Pergalani et al. (2008) for anexample of multidisciplinary seismic microzonation under ordinary conditions, i.e., non post-earthquake emergency].
- The extensive covers of continental deposits justify the widespread local stratigraphicamplifications measured by passive seismology. Nevertheless, if we look at the dominantlithology cropping out near the surface (alluvial gravels), the observed lateral variations in bothfrequency and amplitude of the amplification peaks revealed by weak motion and ambientseismic noise measurements might seem poorly correlated with the geological map. Thisapparent contradiction can be solved by considering two basic aspects that must be addressedduring geologic investigations for seismic microzonation:
1) only careful and very detailed field surveys (e.g., 1:5,000/2,000 scale) may provide anadequate characterisation of the lithology (e.g., texture, degree of cementation/compactnessof granular materials, degree of weathering/fracturing); and
2) the 3D reconstruction of the sedimentary bodies and their lateral correlations/heteropies isfundamental. This implies an integrated analysis of surface and sub-surface geological dataover areas of significant lateral extent (e.g., at least as wide as the lateral extent of thedepositional environment/sedimentary bodies).
- The use of rapid, non-invasive and relatively low-cost geophysical analyses such as ERTproved to be a powerful tool, especially in defining the geometry of the sedimentary bodies andthe presence of lateral lithologic (electric) contrasts due to sub-surface faults. The use of theseanalyses, in conjunction with structural-stratigraphic data, was fundamental for planninggeognostic drillings.
- Once a geologically reasonable sub-surface model is built, one can realize that there is anexcellent fit between the results from the spectral ratio analysis of the ground motion and thestructural-stratigraphic setting obtained by independent geological data. This suggests that thewidespread use of weak motion and ambient seismic noise measurements, in conjunction withstructural-stratigraphic data, are powerful tools for seismic microzonation.
Acknowledgments. This work was funded by the Department of Civil Protection, Rome. We acknowledgetwo referees of the BGTA for revision of this manuscript. The manuscript benefited from discussions withR. De Nardis. We also thank all the Working Group involved in the seismic microzonation of L’Aquila forthe discussions during the advancement of the work (www.protezionecivile.it under “MicrozonazioneSismica dell’area aquilana”).
REFERENCESAlbarello D., Cesi C., Eulilli V., Guerrini F., Lunedei E., Paolucci E., Pileggi D. and Puzzilli L.M.; 2011: The
contribution of the ambient vibration prospecting in seismic microzoning: an example from the area damaged bythe April 26, 2009 l’Aquila (Italy) earthquake. Boll. Geof. Teor. Appl., 52, 513-538.
Anzidei M., Boschi E., Cannelli V., Devoti R., Esposito A., Galvani A., Melini D., Pietrantonio G., Riguzzi F., Sepe V.and Serpelloni E.; 2009: Coseismic deformation of the destructive April 6, 2009 L’Aquila earthquake (central Italy)from GPS data. Geophys. Res. Lett., 36, L17307, doi: 10.1029/2009GL039145.

511
Soil characterisation of the Paganica - San Gregorio area Boll. Geof. Teor. Appl., 52, 491-512
APAT; 2005: Carta Geologica d’Italia, F.o 359 L’Aquila, scale 1:50,000. APAT (Servizio Geologico d’Italia) andRegione Abruzzo, S.EL.CA, Firenze.
Atzori S., Hunstad I., Chini M., Salvi S., Tolomei C., Bignami C., Stramondo S., Trasatti E., Antonioli A. and BoschiE.; 2009: Finite fault inversion of DInSAR coseismic displacement of the 2009 L’Aquila earthquake (central Italy).Geophys. Res. Lett., 36, L15305, doi: 10.1029/2009GL039293.
Bagnaia R., D’Epifanio A. and Sylos Labini S.; 1992: Aquila and Subequan basins: an example of Quaternaryevolution in central Apennines, Italy. Quaternaria Nova, II, 187-209.
Bertini T. and Bosi C.; 1993: La tettonica quaternaria della conca di Fossa (L’Aquila). Il Quaternario, 6, 293–314.
Bianchi Fasani G., Cavinato G.P., Petitta M., Scarascia Mugnozza G. and Voltaggio M.; 2008: The geological model ofCelano town area for seismic microzonation activities. Soil Dyn. Earthq. Eng., 28, 978-985, doi:10.1016/j.soildyn.2008.05.006.
Boncio P., Pizzi A., Brozzetti F., Pomposo G., Lavecchia G., Di Naccio D. and Ferrarini F.; 2010: Coseismic grounddeformation of the April 6th 2009 L’Aquila earthquake (central Italy, Mw 6.3). Geophys. Res. Lett., 37, L06308,doi: 10.1029/2010GL042807.
Bosi C. and Bertini T.; 1970: Geologia della media valle dell’Aterno. Mem. Soc. Geol. It., 9, 719–777.
Caputo R., Piscitelli S., Oliveto A., Rizzo E. and Lapenna V.; 2003: The use of electrical resistivity tomographies inactive tectonics: examples from the Tyrnavos Basin, Greece. J. of Dynamics, 36, 19-35.
Cardarelli E., Cercato M., de Nardis R., Di Filippo G. and Milana G.; 2008: Geophysical investigations for seismiczonation in municipal areas with complex geology: The case study of Celano, Italy. Soil Dyn. Earthq. Eng., 28,950-963, doi: 10.1016/j.soildyn.2008.05.003.
Castellaro S. and Mulargia F.; 2009: Vs30 estimates using constrained H/V measurements. Bull. Seism. Soc. Am., 99,761-773.
Chiarabba C., Amato A., Anselmi M., Baccheschi P., Bianchi I., Cattaneo M., Cecere G., Chiaraluce L., Ciaccio M.G.,De Gori P., De Luca G., Di Bona M., Di Stefano R., Faenza L., Govoni A., Improta L., Lucente F.P., Marchetti A.,Margheriti L., Mele F., Michelini A., Monachesi G., Moretti M., Pastori M., Piana Agostinetti N., Piccinini D.,Roselli P., Seccia D. and Valoroso L.; 2009: The 2009 L’Aquila (central Italy) MW6.3 earthquake: main shock andaftershocks. Geophys. Res. Lett., 36, L18308, doi: 10.1029/2009GL039627.
Cirella A., Piatanesi A., Cocco M., Tinti E., Scognamiglio L., Michelini A., Lomax A. and Boschi E.; 2009: Rupturehistory of the 2009 L’Aquila (Italy) earthquake from non-linear joint inversion of strong motion and GPS data.Geophys. Res. Lett., 36, L19304, doi: 10.1029/2009GL039795.
Compagnoni M., Pergalani F. and Boncio P.; 2011: Microzonation study in the Paganica-San Gregorio area affectedby the April 6, 2009 L’Aquila earthquake (central Italy) and implications for the reconstruction. Earthq. Eng., 9,181-198, doi: 10.1007/s10518-010-9226-2.
Dahlin T.; 1996: 2D resistivity surveying for environmental and engineering applications. First Break, 14, 275-283.
EMERGEO Working Group; 2009: Evidence for surface rupture associated with the Mw 6.3 L’Aquila earthquakesequence of April 2009 (central Italy). Terra Nova, 22, 43-51, doi: 10.1111/j.1365-3121.2009.00915.x.
Falcucci E., Gori S., Peronace E., Fubelli G., Moro M., Saroli M., Giaccio B., Messina P., Naso G., Scardia G., SposatoA., Voltaggio M., Galli P. and Galadini F.; 2009: The Paganica fault and surface coseismic ruptures due to the April6, 2009 earthquake (L’Aquila, Central Italy). Seism. Res. Lett., 80, 940-950, doi: 10.1785/gssrl.80.6.940.
Galli P., Bosi V., Piscitelli S., Giocoli A. and Scionti V.; 2006: Late Holocene earthquakes in southern Apennines:paleoseismology of the Caggiano fault. Int. J. Earth Sci., 95, 855-870, doi: 10.1007/s00531-005-0066-2.
Galli P., Camassi R., Azzaro R., Bernardini F., Castenetto S., Molin D., Peronace E., Rossi A., Vecchi M. and TertullianiA.; 2009: Il terremoto aquilano del 6 aprile 2009: rilievo macrosismico, effetti di superificie ed implicazionisismotettoniche. Il Quaternario, 22, 235-246.
Giano S.I., Lapenna V., Piscitelli S. and Schiattarella M.; 2000: Electrical imaging and self-potential surveys to studythe geological setting of the Quaternary slope deposits in the Agri high valley (Southern Italy). Annali di Geofisica,43, 409-419.
Giocoli A., Magrì C., Vannoli P., Piscitelli S., Rizzo E., Siniscalchi A., Burrato P., Basso C. and Di Nocera S.; 2008:Electrical Resistivity Tomography investigations in the Ufita Valley (Southern Italy). Annals of Geophysics, 51,213-223.
Griffiths D.H. and Barker R.D.; 1993: Two-dimensional resistivity imaging and modelling in areas of complex geology.J. Appl. Geophys., 29, 211-226.

512
Boll. Geof. Teor. Appl., 52, 491-512 Boncio et al.
Gruppo di Lavoro MS; 2008: Indirizzi e Criteri per la Microzonazione Sismica. Conferenza delle Regioni e delleProvincie autonome, Dipartimento della Protezione Civile, Roma, 3 vol. and Cd-rom.
Gruppo di Lavoro MS-AQ; 2011: Microzonazione sismica per la ricostruzione dell’area aquilana. Regione Abruzzo -Gruppo di lavoro coordinato dal Dipartimento della protezione civile, L’Aquila, 3 vol. and Cd-rom, in press.
Loke M.H. and Barker R.D.; 1996: Rapid least-squares inversion of apparent resistivity pseudosections by a quasi-newton method. Geophysical Prospecting, 44, 131-152.
Messina P., Galli P., Giaccio B. and Peronace E.; 2009: Quaternary tectonic evolution of the area affected by thePaganica fault (2009 L’Aquila earthquake). In: GNGTS, 28° Convegno nazionale, Stella Arti Grafiche, Trieste,Riassunti estesi delle comunicazioni, pp. 47-50.
Pace B., Boncio P., Brozzetti F., Lavecchia G. and Visini F; 2008: From regional seismic hazard to “scenarioearthquakes” for seismic microzoning: a new methodological tool for the Celano project. Soil Dyn. Earthq. Eng.,28, 866-874, doi: 10.1016/j.soildyn.2007.11.001.
Pergalani F., Compagnoni M. and Petrini V.; 2008: Evaluation of site effects using numerical analyses in Celano (Italy)finalized to seismic risk assessment. Soil Dyn. Earthq. Eng., 28, 964-977, doi: 10.1016/j.soildyn.2008.05.004.
Pondrelli S., Salimbeni S., Morelli A., Ekstrom G., Olivieri M. and Boschi E.; 2009: Seismic moment tensors of theApril 2009, L’Aquila (Central Italy), earthquake sequence. Geophys. J. Int., 180, 238-242, doi: 10.1111/j.1365-246X.2009.04418.x
SESAME Project; 2004: Guidelines for the implementation of the H/V spectral ratio technique on ambient vibrations.Measurements, processing and interpretation. WP12, deliverable D23.12, http://sesame-fp5.obs.ujf-grenoble.fr/Papers/HV_User_Guidelines.pdf (last accessed July 2010).
Suzuki K., Toda S., Kusunoki K., Fujimitsu Y., Mogi T. and Jomori A.; 2000: Case studies of electrical andelectromagnetic methods applied to mapping active faults beneath the thick quaternary. Engineering Geology, 56,29-45.
Vezzani L. and Ghisetti F.; 1998: Carta Geologica dell’Abruzzo, 1:100.000 scale. S.EL.CA, Firenze.
Walters R.J., Elliott J.R., D’Agostino N., England P.C., Hunstad I., Jackson J.A., Parsons B., Phillips R.J. and RobertsG.; 2009: The 2009 L’Aquila earthquake (central Italy): A source mechanism and implications for seismic hazard.Geophys. Res. Lett., 36, L17312, doi: 10.1029/2009GL039337.
Xia J., Miller R.D. and Park C.B.; 1999: Estimation of near-surface shear-wave velocity by inversion of Rayleigh wave.Geophysics, 64, 691-700.
Corresponding author: Paolo Boncio Dipartimento di Scienze, Università "G. D'Annunzio"Campus Universitario di Madonna delle Piane, 66013 Chieti Scalo, ItalyPhone: +39 0871 3556456; fax: +39 0871 3556454; e-mail: [email protected]