the m w 6.3, 2009 l���aquila earthquake: source, path and site effects from spectral analysis...
TRANSCRIPT
For Peer Review
The Mw 6.3, 2009 L’Aquila earthquake: source, path and
site effects from spectral analysis of strong motion data
Journal: Geophysical Journal International
Manuscript ID: GJI-09-0397
Manuscript Type: Fast Track Paper
Date Submitted by the
Author: 29-Jul-2009
Complete List of Authors: Bindi, Dino; INGV, Sezione Milano-Pavia Pacor, Francesca; INGV, Sezione Milano-Pavia Luzi, Lucia; INGV, Sezione Milano-Pavia Massa, Marco; INGV, Sezione Milano-Pavia Ameri, Gabriele; INGV, Sezione Milano-Pavia
Keywords:
Earthquake ground motions < SEISMOLOGY, Earthquake source observations < SEISMOLOGY, Site effects < SEISMOLOGY, Seismic attenuation < SEISMOLOGY, Fourier analysis < GEOPHYSICAL METHODS
Geophysical Journal International

For Peer Review
1
The Mw 6.3, 2009 L’Aquila earthquake: source, path and site effects from spectral
analysis of strong motion data
D. Bindi1, F. Pacor
1, L. Luzi
1, M. Massa
1 and G. Ameri
1
1Istituto Nazionale di Geofisica e Vulcanologia, Via Bassini 15, 20133 Milano, Italy
Summary
The strong motion data of April 6, 2009 L’Aquila (Central Italy) earthquake (Mw=6.3)
and of 12 aftershocks (4.1≤Mw≤5.6) recorded by 56 stations of the Italian strong motion
network are spectrally analyzed to estimate the source parameters, the seismic
attenuation, and the site amplification effects. The obtained source spectra for S-wave
have stress drop values ranging from 2.4 to 16.8 MPa, being the stress drop of the main
shock equal to 9.2MPa. The spectral curves describing the attenuation with distance show
the presence of shoulders and bumps, mainly around 50 and 150km, as consequence of
significant reflected and refracted arrivals from crustal interfaces. The attenuation in the
first 50 km is well described by a quality factor equal to 6.048)( ffQ = and a geometrical
spreading exponent equal to 0.75. Finally, the horizontal-to-vertical spectral ratio
provides unreliable estimates of local site effects for those stations showing large
amplifications over the vertical component of motion.
Page 1 of 31 Geophysical Journal International
123456789101112131415161718192021222324252627282930313233343536373839404142434445464748495051525354555657585960
For Peer Review
2
Introduction
On April 6th
, 2009 at 01:32:39 GMT a magnitude Mw=6.3 [Global Centroid Moment
Tensor Project, www.globalcmt.org] earthquake struck the Abruzzo region (Central
Italy). The epicentral area corresponds to the upper and middle Aterno valley which is
characterised by a complex tectonic evolution reflected by the high variability of the
geologic and geomorphologic patterns. The valley is superimposed on a Quaternary
lacustrine basin of tectonic origin. The depth of the Quaternary deposits is variable, from
about 60m in the upper Aterno valley to more than 200m in the middle Aterno valley
(Bosi & Bertini, 1970). The L’Aquila town, located at about 6 km northeast to the
mainshock epicenter, as well as several villages located nearby, suffered heavy damages
and the casualties were nearly 300. Accordingly to the normative for the Italian territory,
the area struck by the L’Aquila earthquake is classified as a zone characterized by high
level of seismic hazard (Gruppo di Lavoro MPS, 2004). In terms of probabilistic hazard
assessment, the maximum peak ground acceleration having the probability of 10% of
being exceeded in 50 years is 2.55 m/s2.
The mainshock was followed, within the first week, by seven aftershocks with moment
magnitude greater than or equal to 5, the two strongest ones occurred on April 7th
(Mw=5.6) and April 9th
(Mw=5.4). The rapid dissemination through the online ITACA
database (http://itaca.mi.ingv.it) of the strong motion recordings relevant to the 13
strongest earthquakes of the sequence, allows us to investigate the contribution of
different terms to the observed ground shaking. In this study, the acceleration spectra are
jointly analyzed to estimate the source parameters, the seismic attenuation, and the local
site amplification effects.
Page 2 of 31Geophysical Journal International
123456789101112131415161718192021222324252627282930313233343536373839404142434445464748495051525354555657585960
For Peer Review
3
Strong-motion data set
For this work, we analyzed 264 recordings from 56 strong-motion stations triggered by
the April 6, 2009, L’Aquila earthquake and 12 aftershocks (Ameri et al., 2009). These
stations belong to the Italian Strong Motion Network (RAN), managed by the Italian
Department of Civil Protection (DPC). They are equipped with three-component sensors
set to 1 or 2 g full-scale, coupled with 24-bit digitizers with a sampling rate of 200
samples per second. Data from 13 earthquakes (Table 1) with 4.1≤Mw≤6.3 and recorded
at distances smaller than 200 km are downloaded from the ITACA database (Luzi et al.,
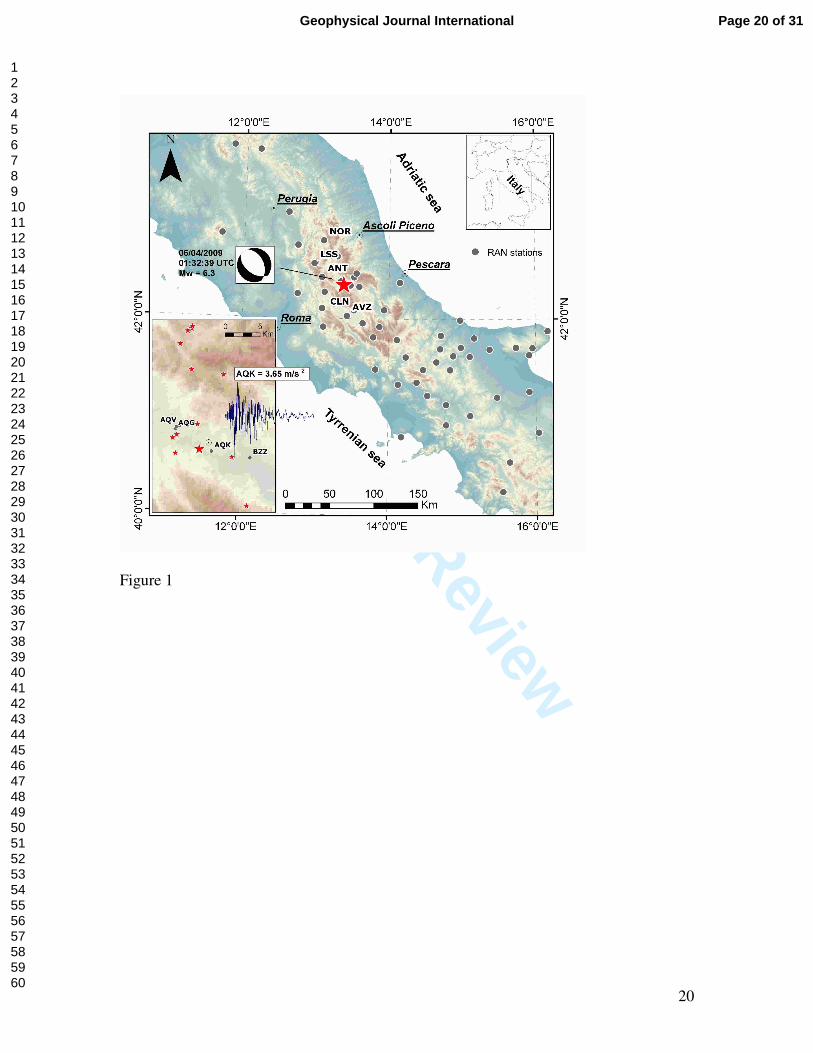
2008). Figure 1 shows the location of the epicenters and recording stations, as well as the
mainshock recorded by a station (AQK) installed in the town of L’Aquila.
The recorded waveforms are processed following the standard ITACA procedure (Massa
et al., 2009), The Fourier spectra have been calculated for windows starting about 1 s
before the S-wave onset and ending when 90% of the total energy after the S-wave onset
has been released. The minimum and maximum durations were constrained to 5 and 30 s
respectively. Recordings at distances smaller than 10 km have been visually inspected,
selecting a window encompassing the whole strong motion phase. The acceleration
Fourier spectra were smoothed using the Konno & Ohmachi (1998) algorithm, fixing the
smoothing parameter b to 40. The spectral amplitudes are analyzed in the frequency
range from 0.3 to 25 Hz.
Page 3 of 31 Geophysical Journal International
123456789101112131415161718192021222324252627282930313233343536373839404142434445464748495051525354555657585960
For Peer Review
4
Method
We apply a two-step non-parametric approach (GIT) (e.g. Castro et al., 1990) to describe
the observed spectral amplitudes D(f,r) in terms of source S(f), attenuation A(f,r) and site
Z(f) contributions:
(2) fSfZrfR
(1) fSrfArfD
jiij
jijij
)(log)(log),(log
)(log),(log),(log
101010
~
101010
+=
+=
where r is the hypocentral distance, f the frequency, i=1…Nsta spans the set of available
stations, j=1…Neve spans the set of considered earthquakes )(~
fS j is a scalar which
depends on the size of the j-th source and R(f,rij) represents the observed spectral values
corrected for attenuation A(f,rij). Considering the whole set of available recordings,
equations (1) and (2) define two linear systems that we solved in a least-squares sense. In
the first step, the attenuation-with-distance curves A(f,r) are obtained by solving the linear
system (1) in a least-square sense. The inversion is performed for each frequency and the
distance range is discretized into M bins ∆r km wide.In the second step, the residuals
R(f,rij) are used to determine the source spectra Si(f) and the site amplification functions
Zj(f) by solving system (2) in a least-square sense, without assuming any a-priori
functional form to describe the source spectra. A standard source model (Brune, 1970) is
later fit to the non-parametric solutions to determine the source parameters. To fix one
unresolved degree of freedom affecting solutions of system (1), the attenuation curves
A(f,r) are constrained to 1 at a reference distance r=rref, irrespective of frequency.
Moreover, the A(f,r) curves are constrained to be smooth functions of distance (Castro et
al., 1990). In the second step, the trade-off between the spectral source amplitude and site
Page 4 of 31Geophysical Journal International
123456789101112131415161718192021222324252627282930313233343536373839404142434445464748495051525354555657585960

For Peer Review
5
amplifications is resolved by assuming a reference site Zref whose site amplification
factors are constrained to values a-priori selected.
Page 5 of 31 Geophysical Journal International
123456789101112131415161718192021222324252627282930313233343536373839404142434445464748495051525354555657585960
For Peer Review
6
Spectral attenuation with distance
The first step of the inversion allows us to determine the spectral attenuation curves A(f,r)
as function of distance. The distance range from 6 to 201 km is divided into 40 bins 5 km
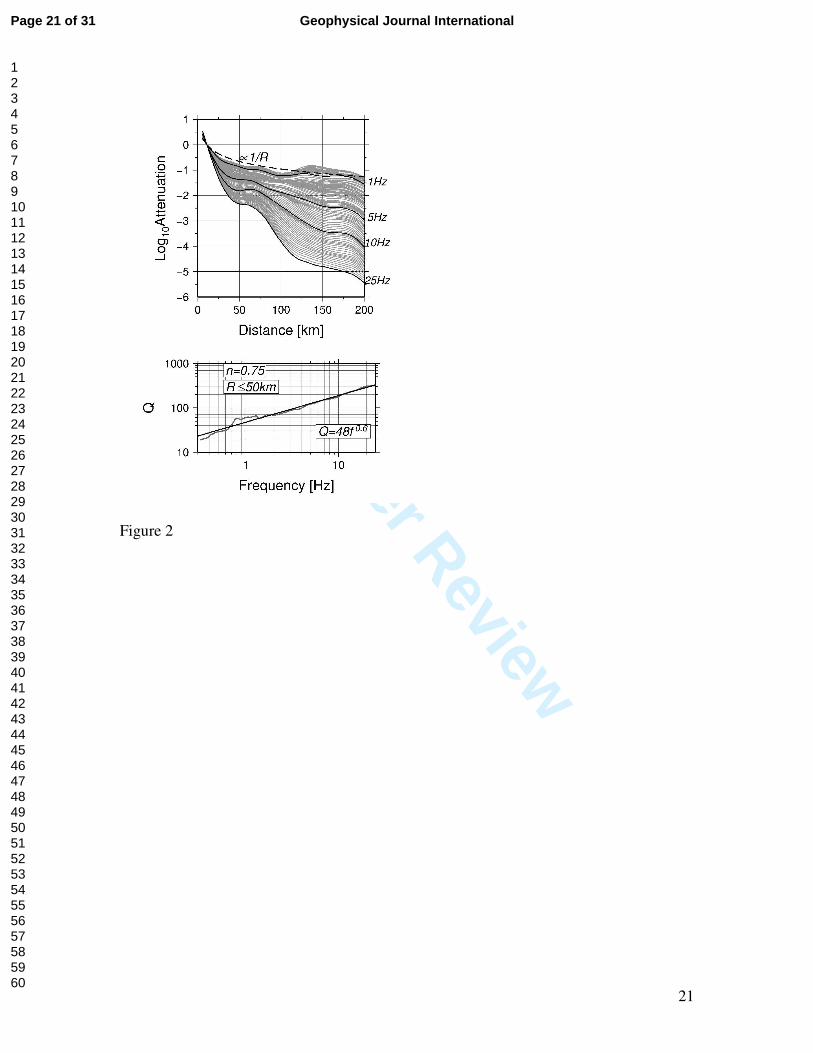
wide. The A(f,r) is constrained to 1 at rref =11km, irrespective of frequency. Figure 2 (top
panel) shows the A(f,r) curves obtained by vectorially summing the two horizontal
components (i.e., 22EWNS + ). The unit covariance matrix computed for the first step
(see Figure CM2 in the complementary materials) shows that the source-to-station
geometry well constrains the attenuation for the selected spatial resolution, especially for
distances up to 70 km. The quite narrow spread observed around the diagonal elements
means that the error propagation among unknowns is restricted to attenuation values for
close distance bins. Finally, the covariance matrix confirms that the trade-off between the
attenuation and source blocks is reduced.
The rate of attenuation with distance varies over the analyzed distance range. In
particular, the curves decay fast in the first 50 km, then they flat or slope upward
depending on the frequency value. For distances larger than about 70 km the curves
generally decay with distance less rapidly than in the first 50 km, but the frequency
dependence increases. Finally, for distances from 100 to 150 km and frequency smaller
than 2Hz, the spectral attenuation curves have small bumps. The features showed by
A(f,r) are in agreement with several observations made worldwide. Previous studies
demonstrate that the boundary between the fall-off of the direct waves and the emergency
of lower crustal or Moho reflections can lead to fairly constant amplitudes on distance
ranges that depend on several factors, such focal depth, crustal thickness, crustal-velocity
gradient, among others (e.g. Burger et al., 1987; Sommerville & Yoshimura, 1990;
Page 6 of 31Geophysical Journal International
123456789101112131415161718192021222324252627282930313233343536373839404142434445464748495051525354555657585960
For Peer Review
7
Atkinson & Mereu, 1992; Mori & Helmberger, 1996). The behavior of the spectral
attenuation curves shown in Figure 2 (top panel) suggests that reflections and refractions
from crustal interfaces are significant in the investigated area for distances between 50
and 70 km and around 150 km, in agreement with previous results obtained in central
Apennines (Ponziani et al., 1995; Bindi et al., 2004). Since an estimate of the quality
factor Q for S-waves is important for many seismological investigations, we repeat the
inversion (1) but selecting only recordings at distances in the range 5-50 km, where a
monotonic attenuation with distance occurs (Figure 2). In order to improve the spatial
resolution, we set ∆r = 2.5 km, and the spectral attenuation is constrained to 1 at rref =8.5
km. The covariance matrix for the selected settings is shown in Figure CM3 of the
complementary materials.
The attenuation curves are described in terms of geometrical and anelastic attenuation,
considering the following model:
(3)
)5.8( exp
5.8),(
−−
=Q
rf
rrfA
n
βπ
where n is the geometrical spreading coefficient, β = 3.2 km/s is the selected mean shear
wave velocity, and Q is the frequency-dependent quality factor. The parameters n and
Q(f) are determined in a least-squares sense by fitting model (3) to the set of spectral
attenuation curves obtained solving system (1). The obtained solution corresponds to
n=0.75 and to Q(f) values shown in Figure 2 (bottom). By fitting a power function to
Q(f), the best least-squares solution is 6.048)( ffQ = .
Page 7 of 31 Geophysical Journal International
123456789101112131415161718192021222324252627282930313233343536373839404142434445464748495051525354555657585960
For Peer Review
8
Site amplifications and sources
In the second step, the observed spectral amplitudes, corrected for attenuation, are
inverted to separate the source contribution from the site amplification effects System (2)
is solved constraining to zero the logarithm sum of the site amplification functions Z(f) of
two rock sites, namely Celano (CLN) and Leonessa (LSS), whose locations are shown
inFigure 1. The inversion is performed considering each component of motion separately.
Site effects
The unit covariance matrix relevant to the second step (see Figure CM4 in the
complementary material) confirms that the trade-off between source and site is well
resolved and the propagation of error among different unknowns is negligible. The
diagonal elements show that the amplification factor for the error propagation from data
to solution is generally smaller than 0.5 except for site terms relevant to stations that
recorded only one earthquake. In the following, we discuss the results only for stations
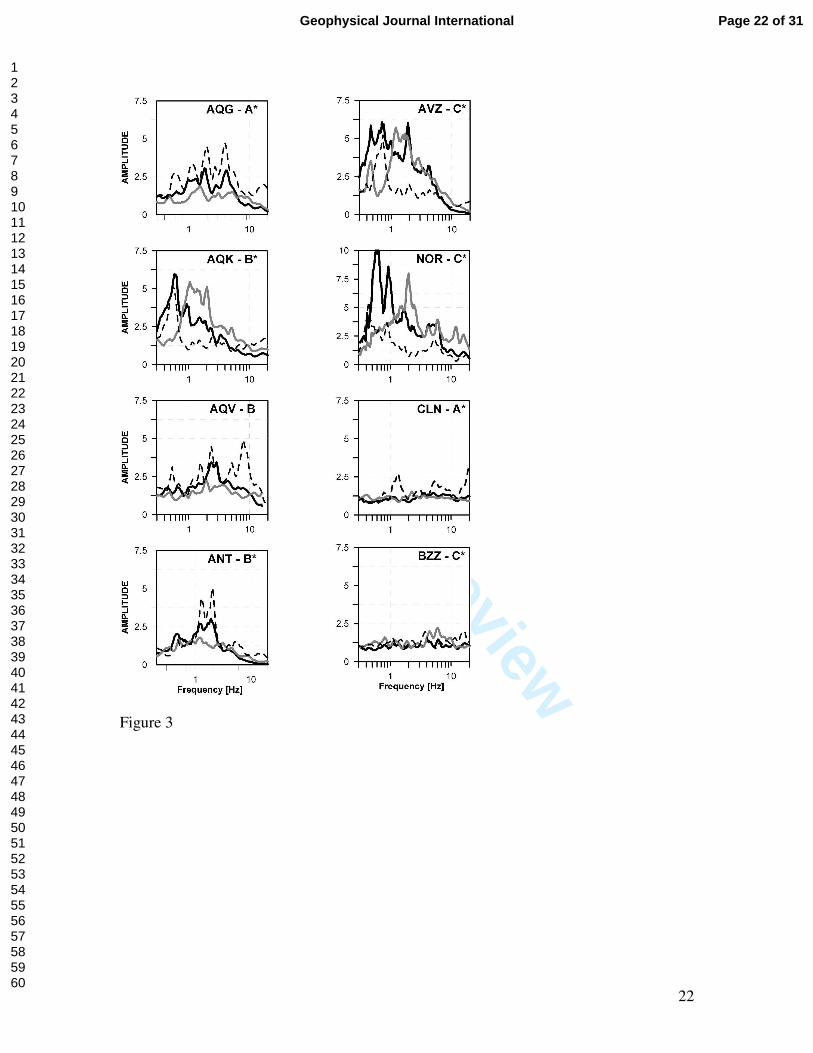
with at least 3 records and located within 60 km from the mainshock epicenter. In Figure
3, the GIT site amplifications obtained for the NS and vertical component of some
stations are compared to the north-south (NS) horizontal to vertical (H/V) spectral ratio
(Lermo & Chavez-Garcia, 1993). The comparisons for the other stations and for the east-
west (EW) component are shown in the complementary materials. In Figure 3, stations
AQG and AQV are two out of 6 stations composing a strong-motion array installed by
DPC in 2001 across the upper Aterno Valley to detect the variation of the ground motion
for different geological conditions. These stations are located within the surface
projection of the L'Aquila mainshock fault and are at distances less than 5 km from the
mainshock epicenter. Station AQG is installed on outcropping bedrock but both the GIT
Page 8 of 31Geophysical Journal International
123456789101112131415161718192021222324252627282930313233343536373839404142434445464748495051525354555657585960
For Peer Review
9
and the H/V show amplifications over the range 1-6 Hz, probably due to rock fracturing
and/or weathering, as observed in the field. Although the two techniques provide a
similar trend for the site amplifications, some differences are observed in the results, such
as the peak at 0.6 Hz, which is detected only in the H/V ratio. Station AQK is installed
close to L'Aquila downtown. The GIT results for the NS component detects the
fundamental frequency of resonance at 0.6 Hz, but significant amplifications are also
observed over the range 1 – 2 Hz, whereas the vertical component is strongly amplified
between 1 and 3Hz. The H/V curve well depicts the amplification at 0.6 Hz but misses
the pattern of amplification between 1 and 3 Hz. For station AQV, the GIT and H/V
peaks at about 2.5 Hz are in good agreement with the fundamental frequency of
resonance estimated from the available shear wave velocity profile
(http://itaca.mi.ingv.it).
Station Antrodoco (ANT) is installed over slope debris. The GIT results show significant
amplification only for the horizontal component, in good agreement with the H/V. For
sites located on deep alluvial deposits, as Avezzano (AVZ) and Norcia ( NOR), the GIT
results show remarkable amplifications for both the horizontal and vertical components,
causing significant differences with respect to the H/V. Station Celano (CLN) is installed
on a rock site and it has been selected as one of the two reference sites in the GIT
inversion. It shows an almost flat H/V curve, with the presence of a small peak between 1
and 2 Hz. The large uncertainty affecting the amplitude of this peak (see Auxiliary
materials), as well as the absence of any peak in the H/V computed considering ambient
noise measurements (http://esse4.mi.ingv.it), suggest that its origin might not be related
to local site effects.
Page 9 of 31 Geophysical Journal International
123456789101112131415161718192021222324252627282930313233343536373839404142434445464748495051525354555657585960
For Peer Review
10
Both the GIT and H/V results for Bazzano (BZZ) do not identify any amplification peak.
This result deserve further investigations since Onna, a settlement distant less than 2 km
from BZZ and located on a similar geological setting, suffered very heavy damage by the
mainshock. Differently from BZZ, the H/V at Onna, computed considering the strong-
motion data recorded by a temporary station (http://rais.mi.ingv.it/statiche/ABRUZZO-
2009/main.html), shows a peak of amplification at about 2.5 Hz (Marzorati, personal
communication, 2009), consistent with the shear wave velocity profile estimated from
array noise measurements (Picozzi and Parolai, personal communication, 2009).
Although the role of the building vulnerability should be taken into account, the
differences in the local site conditions seem to have played an important role in
determining the observed damage pattern.
Source functions
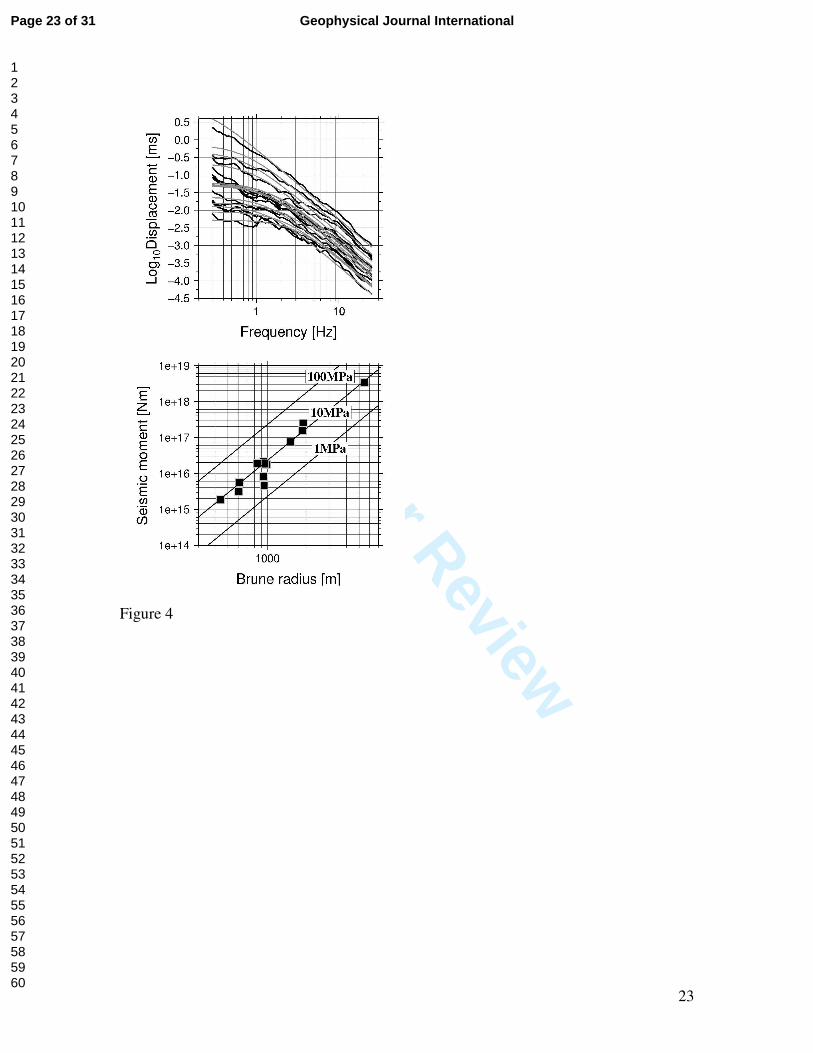
The source functions obtained for each component are composed into a single source
spectrum for each earthquake (i.e. 222ZEWNS ++ ) to determine the S-wave source
parameters. The source parameters are computed describing the obtained spectra in terms
of a standard model (Brune, 1970). To avoid biases in the estimation of the source
parameters due to the limitation in low frequency range (f >0.3 Hz), the seismic moments
of the four strongest earthquakes (Mw ≥5.3) are constrained to the values provided by
Harvard-CMT (Table 1). The results are shown in Figure 4 and the obtained source
parameters are listed in Table 1. The seismic moment M0 and the corner frequency fc are
used to determine the stress drop ∆σ and the source radius R0 using standard relationships
(Keilis-Borok, 1959; Brune, 1970).
Page 10 of 31Geophysical Journal International
123456789101112131415161718192021222324252627282930313233343536373839404142434445464748495051525354555657585960
For Peer Review
11
(5) 16
7
(4) 2
34.2
3
0
0
0
R
M
fR
c
=∆
=
σ
πβ
The differences between the Mw of RCMT-INGV [http://www.bo.ingv.it/RCMT/]catalog
and the one computed by applying the Hanks & Kanamori (1979) relation to the seismic
moments estimated in this study, do not exceed 0.3 magnitude units (Table 1), suggesting
that the limitation in the bandwidth did not seriously biased the estimates of the seismic
moment. The estimated corner frequency for the main shock is 0.24 Hz, corresponding to
a Brune radius of 5.46 km and a stress drop of 9.2 MPa. The stress drop of the 13
considered earthquakes varies between 2.4 to 16.8 MPa. Table 1 also lists the root-mean-
square stress drop (∆σRMS) computed following Hanks & McGuire (1981). The general
agreement between the Brune stress drop and ∆σRMS confirms the reliability of the high
frequency level of the acceleration source spectra estimated considering the Brune model.
Finally, the results on the source parameters are summarized in Figure 4 (bottom panel), .
The distribution of seismic moment versus source dimension parameters is well
approximated by a constant stress drop scaling, considering the average stress drop of 9.4
MPa.
Page 11 of 31 Geophysical Journal International
123456789101112131415161718192021222324252627282930313233343536373839404142434445464748495051525354555657585960
For Peer Review
12
Conclusions
The strong motion recordings of 13 earthquakes of the April 2009 L’Aquila sequence
have been spectrally analyzed to determine the source parameters, the spectral attenuation
and the site amplification functions. The stress drop of the main shock (Mw=6.3) and of
the three largest aftershocks (5.3≤Mw≤5.6), computed constraining the seismic moment
to the values provided by Harvard-CMT, varies between 9.2 and 16.8 MPa. The average
stress drop for the 13 earthquakes is 9.4 MPa, in good agreement with the average ∆σRMS
(11.4MPa). These values are larger than the average stress drop of 1.9 MPa estimated by
applying the same technique to the 1997-98 Umbria-Marche sequence (Bindi et al.,
2004), but within the variability observed in Central and Southern Apennines (e.g.
Rovelli et al., 1988]) The attenuation with distance curves show shoulders and bumps,
mainly around 50 and 150 km, suggesting the presence of significant reflected and
refracted arrivals from crustal interfaces and Moho. The shear-wave quality factor Q for
distances smaller than 50 km is well described by 6.048)( ffQ = , with a geometrical
spreading exponent n equal to 0.75.
The site amplifications are significant for several stations. In particular, the amplification
over the vertical component observed for several stations, limits the applicability of
horizontal-to-vertical spectral ratio (H/V) for detecting the site amplification effects.
Moreover, the large variability affecting the H/V spectral ratios for stations located in the
epicentral area suggests that these ratios are probably influenced by source-related
effects.
In conclusion, source, path and site parameters found in this study are useful to
characterize the ground motion observed during the L’Aquila seismic sequence and can
Page 12 of 31Geophysical Journal International
123456789101112131415161718192021222324252627282930313233343536373839404142434445464748495051525354555657585960

For Peer Review
13
be important elements for future studies spanning from source-related studies to strong-
motion modeling to hazard assessments.
Page 13 of 31 Geophysical Journal International
123456789101112131415161718192021222324252627282930313233343536373839404142434445464748495051525354555657585960

For Peer Review
14
Acknowledgments
We used the records made available by Monitoraggio del Territorio e gestione banche
dati of the DPC - Ufficio Valutazione, Prevenzione e Mitigazione del Rischio Sismico
(SISM). This work has been carried out within the DPC-INGV S4 (2007-2009) project.
Dino Bindi conducted this work during a one-year visiting period at GFZ.
Page 14 of 31Geophysical Journal International
123456789101112131415161718192021222324252627282930313233343536373839404142434445464748495051525354555657585960

For Peer Review
15
References
Ameri, G., Massa, M., Bindi, D., D’Alema, E., Gorini, A., Luzi, L., Marzorati,
S., Pacor, F., Paolucci,R., Puglia R. & Smerzini, C., 2009. The 6 April 2009, Mw 6.3,
L’Aquila (Central Italy) earthquake: strong-motion observations, submitted to Seism.
Res. Letter Atkinson, G.M. & Mereu, R., 1992. The shape of ground motion attenuation
curves in southeastern Canada, Bull. Seismol. Soc. Am., 82, 2014–2031.Bindi, D.,
Castro, R. R., Franceschina, G., Luzi, L., & Pacor, F., 2004. The 1997–1998 Umbria–
Marche sequence (Central Italy): source, path and site effects estimated from strong
motion data recorded in the epicentral area, J. Geophys. Res. 109, B04312,
doi:10.1029/2003JB002857.
Bosi C., & Bertini, T., 1970. Geologia della media valle dell’Aterno, Mem. Soc.
Geol. It., IX, 719-777.
Brune, J.N., 1970. Tectonic stress and the spectra of seismic shear waves from
earthquakes. J. Geophys. Res. 75, 4997–5009.
Burger, R.W., Somerville, P.G., Barker, J.S.,. Herrmann, R.B & Helmberger,
D.V., 1987. The effect of crustal structure on strong ground motion attenuation relations
in eastern North America, Bull. Seismol. Soc. Am., 77, 420–439.
Castro, R. R., Anderson, J. G.&. Singh, S.K., 1990. Site response attenuation and
source spectra of S waves along the Guerrero, Mexico, subduction zone, Bull. Seism.
Soc. Am. 80, 1481–1503.
CEN (2004). Eurocode 8: Design of structures for earthquake resistance - Part 1:
General rules, seismic actions and rules for buildings, Comité Européen de Normalisation
Brussels, May.
Page 15 of 31 Geophysical Journal International
123456789101112131415161718192021222324252627282930313233343536373839404142434445464748495051525354555657585960
For Peer Review
16
Gruppo di Lavoro MPS, (2004). Redazione della mappa di pericolosità sismica
prevista dall'Ordinanza PCM del 20 marzo 2003. Rapporto Conclusivo per il
Dipartimento dellaProtezione Civile, INGV, Milano-Roma, aprile 2004, 65 pp. + 5
appendixes.
Hanks, T. C. & Kanamori, H., 1979. A moment magnitude scale, J. Geophys. Res.
84, 2348–2350.
Hanks, T. & McGuire, T., 1981. The character of high-frequency strong ground
motion. Bull. Seism. Soc. Am. 71, 2071–2095
Keilis-Borok, V., 1959. On the estimation of the displacement in an earthquake
source and of source dimension, Ann. Geofis., 12, 205– 214.
Konno, K. & Ohmachi, T., 1998. Ground-motion characteristic estimated from
spectral ratio between horizontal and vertical components of microtremor, Bull. Seism.
Soc. Am. 88, 228–241.
Lermo, J. & Chavez-Garcia, F.C., (1993). Site effect evaluation using spectral
ratios with only one station. Bull. Seism. Soc. Am. 83, 1574–1594.
Luzi L., Hailemikael S., Bindi D., Pacor, F. & F. Mele (2008). ITACA (ITalian
ACcelerometric Archive): a web portal for the dissemination of Italian strong motion
data. Seism ResLett. doi:10.1785/gssrl.79.5
Massa, M., Pacor, F., Luzi, L., Bindi, D., Milana, G., Sabetta, F., Gorini, A. &
Marcucci,S., 2009. The Italian Accelerometric Archive: data set and data processing,
submitted to Bull. Earth. Eng.
Mori, J., & Helmberger, D., 1996. Large-amplitude Moho reflections (SmS) from
Landers aftershocks, southern California, Bull. Seism. Soc. Am. 86, 1845–1852.Ponziani,
Page 16 of 31Geophysical Journal International
123456789101112131415161718192021222324252627282930313233343536373839404142434445464748495051525354555657585960
For Peer Review
17
F., R. De Franco, Minelli, G., Biella, G., Federico, c. & Pialli, G., 1995. Crustal
shortening and duplication of the Moho in the Northern Appennines: A view from
seismic refraction data, Tectonophysics, 252, 391–418.
Rovelli, A., Bonamassa, O., Cocco, M., Di Bona, M. & Mazza, S., 1988. Scaling
laws and spectral parameters of the ground motions in active extensional areas in Italy,
Bull. Seismol. Soc. Am., 78, 530–560.
Sommerville, P. & Yoshimura, J., 1990. The influence of critical Moho
reflections on strong ground motions recorded in San Francisco and Oakland during the
1989 Loma Prieta earthquake, Geophys. Res. Lett., 17, 1203– 1206.
Page 17 of 31 Geophysical Journal International
123456789101112131415161718192021222324252627282930313233343536373839404142434445464748495051525354555657585960
For Peer Review
18
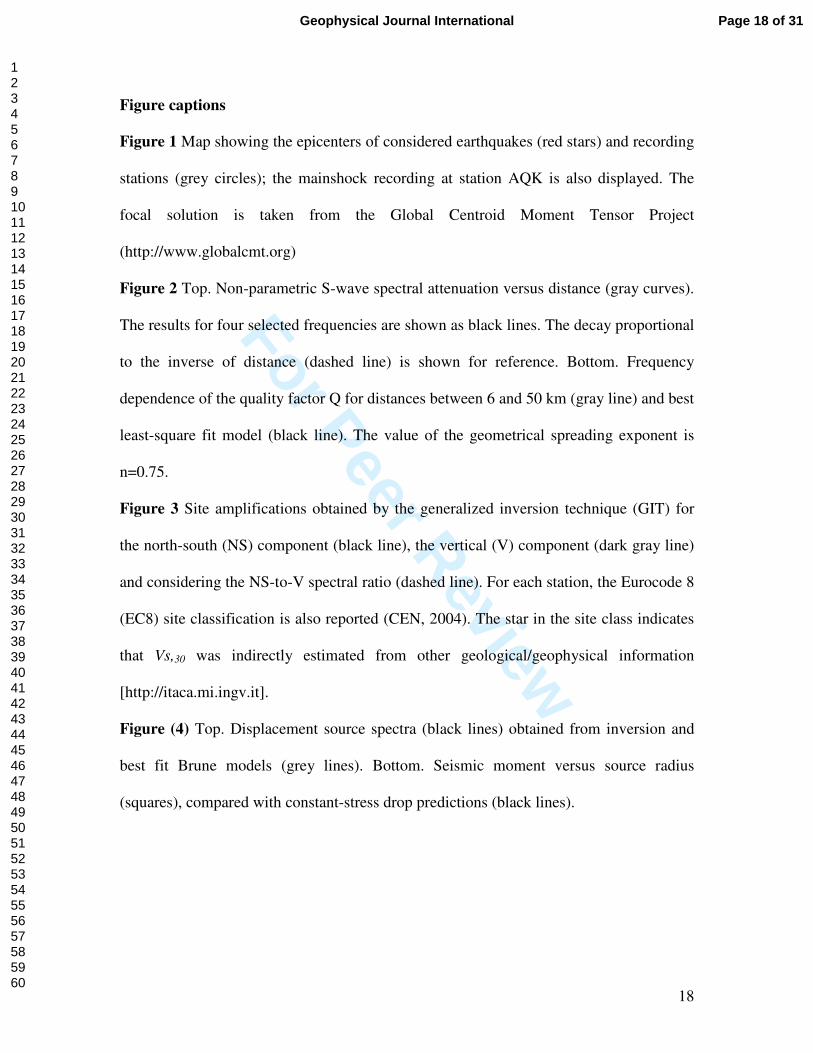
Figure captions
Figure 1 Map showing the epicenters of considered earthquakes (red stars) and recording
stations (grey circles); the mainshock recording at station AQK is also displayed. The
focal solution is taken from the Global Centroid Moment Tensor Project
(http://www.globalcmt.org)
Figure 2 Top. Non-parametric S-wave spectral attenuation versus distance (gray curves).
The results for four selected frequencies are shown as black lines. The decay proportional
to the inverse of distance (dashed line) is shown for reference. Bottom. Frequency
dependence of the quality factor Q for distances between 6 and 50 km (gray line) and best
least-square fit model (black line). The value of the geometrical spreading exponent is
n=0.75.
Figure 3 Site amplifications obtained by the generalized inversion technique (GIT) for
the north-south (NS) component (black line), the vertical (V) component (dark gray line)
and considering the NS-to-V spectral ratio (dashed line). For each station, the Eurocode 8
(EC8) site classification is also reported (CEN, 2004). The star in the site class indicates
that Vs,30 was indirectly estimated from other geological/geophysical information
[http://itaca.mi.ingv.it].
Figure (4) Top. Displacement source spectra (black lines) obtained from inversion and
best fit Brune models (grey lines). Bottom. Seismic moment versus source radius
(squares), compared with constant-stress drop predictions (black lines).
Page 18 of 31Geophysical Journal International
123456789101112131415161718192021222324252627282930313233343536373839404142434445464748495051525354555657585960
For Peer Review
19
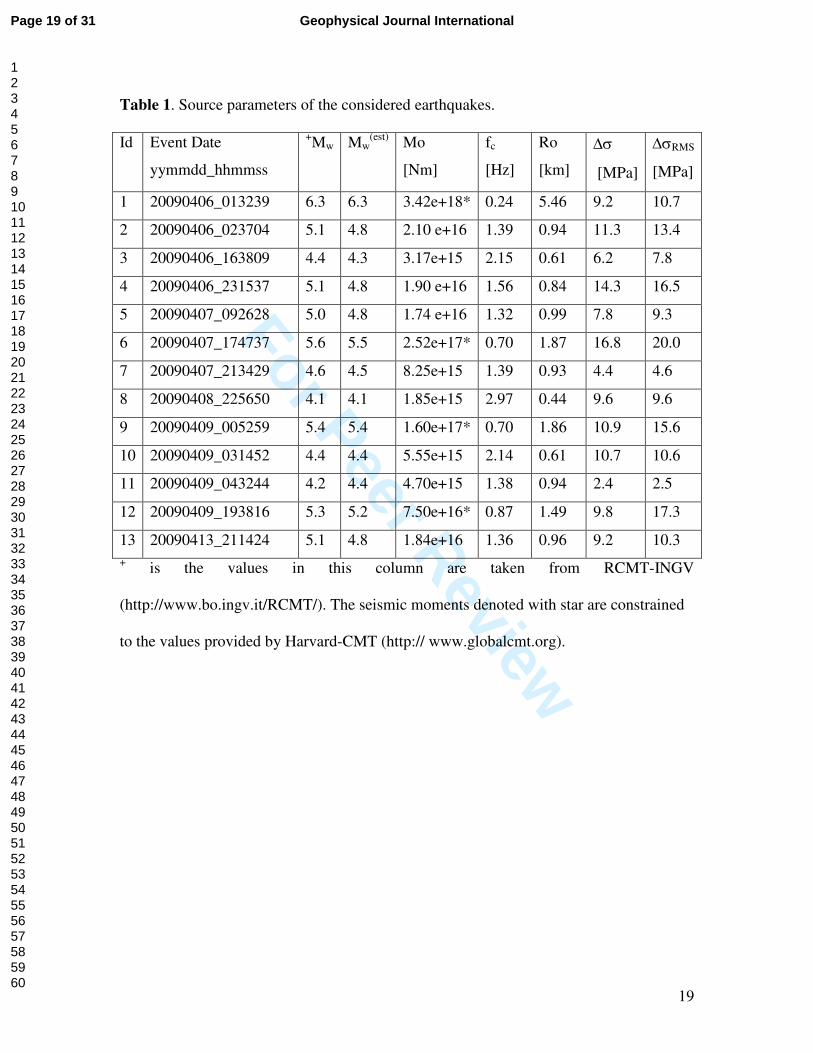
Table 1. Source parameters of the considered earthquakes.
Id Event Date
yymmdd_hhmmss
+Mw Mw
(est) Mo
[Nm]
fc
[Hz]
Ro
[km]
∆σ
[MPa]
∆σRMS
[MPa]
1 20090406_013239 6.3 6.3 3.42e+18* 0.24 5.46 9.2 10.7
2 20090406_023704 5.1 4.8 2.10 e+16 1.39 0.94 11.3 13.4
3 20090406_163809 4.4 4.3 3.17e+15 2.15 0.61 6.2 7.8
4 20090406_231537 5.1 4.8 1.90 e+16 1.56 0.84 14.3 16.5
5 20090407_092628 5.0 4.8 1.74 e+16 1.32 0.99 7.8 9.3
6 20090407_174737 5.6 5.5 2.52e+17* 0.70 1.87 16.8 20.0
7 20090407_213429 4.6 4.5 8.25e+15 1.39 0.93 4.4 4.6
8 20090408_225650 4.1 4.1 1.85e+15 2.97 0.44 9.6 9.6
9 20090409_005259 5.4 5.4 1.60e+17* 0.70 1.86 10.9 15.6
10 20090409_031452 4.4 4.4 5.55e+15 2.14 0.61 10.7 10.6
11 20090409_043244 4.2 4.4 4.70e+15 1.38 0.94 2.4 2.5
12 20090409_193816 5.3 5.2 7.50e+16* 0.87 1.49 9.8 17.3
13 20090413_211424 5.1 4.8 1.84e+16 1.36 0.96 9.2 10.3
+ is the values in this column are taken from RCMT-INGV
(http://www.bo.ingv.it/RCMT/). The seismic moments denoted with star are constrained
to the values provided by Harvard-CMT (http:// www.globalcmt.org).
Page 19 of 31 Geophysical Journal International
123456789101112131415161718192021222324252627282930313233343536373839404142434445464748495051525354555657585960
For Peer Review
20
Figure 1
Page 20 of 31Geophysical Journal International
123456789101112131415161718192021222324252627282930313233343536373839404142434445464748495051525354555657585960
For Peer Review
21
Figure 2
Page 21 of 31 Geophysical Journal International
123456789101112131415161718192021222324252627282930313233343536373839404142434445464748495051525354555657585960
For Peer Review
22
Figure 3
Page 22 of 31Geophysical Journal International
123456789101112131415161718192021222324252627282930313233343536373839404142434445464748495051525354555657585960
For Peer Review
23
Figure 4
Page 23 of 31 Geophysical Journal International
123456789101112131415161718192021222324252627282930313233343536373839404142434445464748495051525354555657585960
For Peer Review
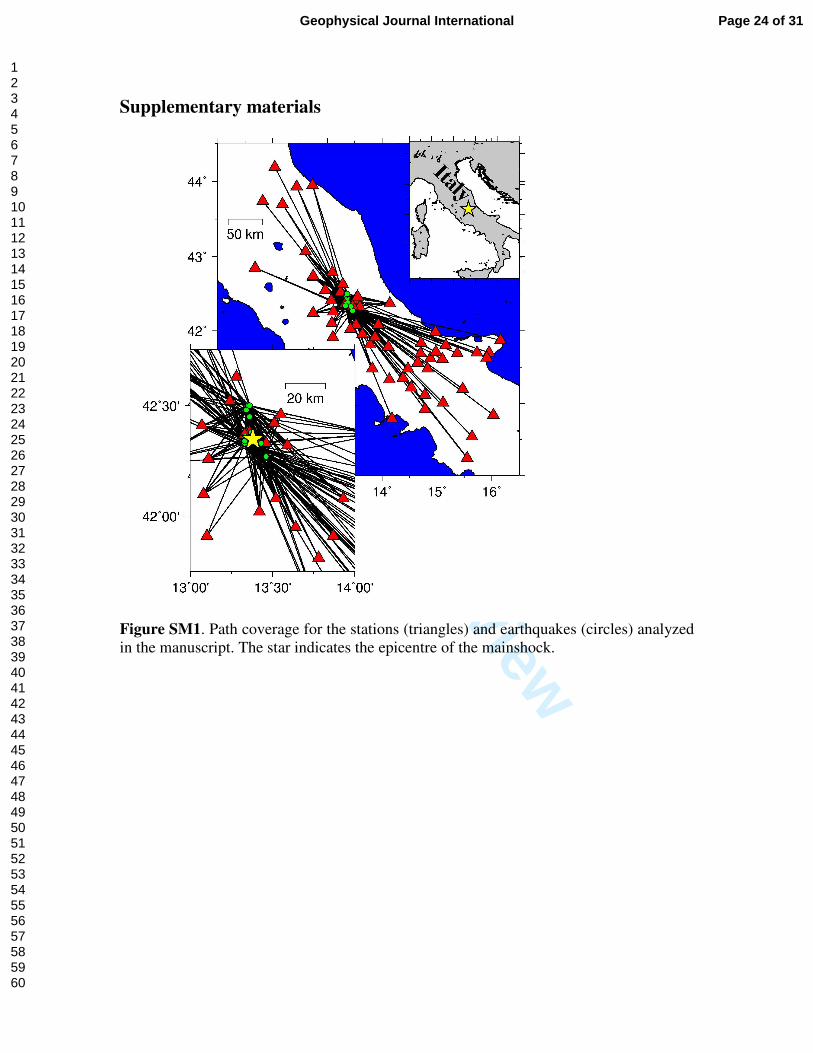
Supplementary materials
Figure SM1. Path coverage for the stations (triangles) and earthquakes (circles) analyzed
in the manuscript. The star indicates the epicentre of the mainshock.
Page 24 of 31Geophysical Journal International
123456789101112131415161718192021222324252627282930313233343536373839404142434445464748495051525354555657585960
For Peer Review
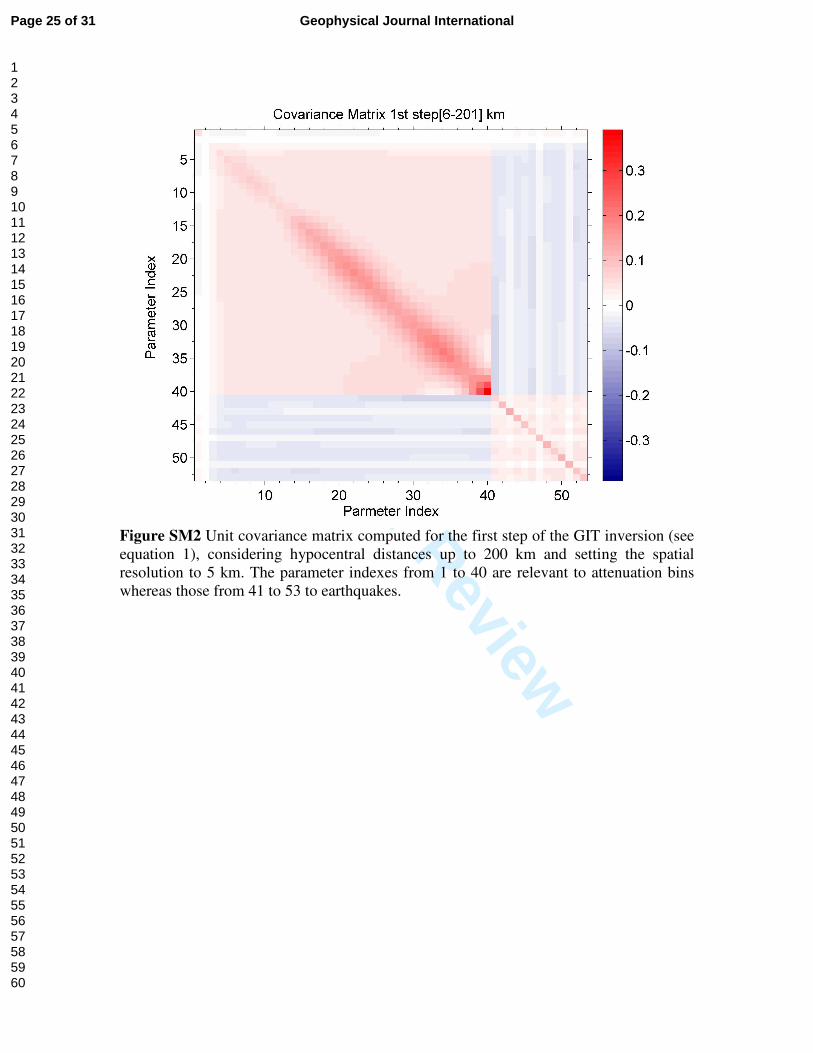
Figure SM2 Unit covariance matrix computed for the first step of the GIT inversion (see
equation 1), considering hypocentral distances up to 200 km and setting the spatial
resolution to 5 km. The parameter indexes from 1 to 40 are relevant to attenuation bins
whereas those from 41 to 53 to earthquakes.
Page 25 of 31 Geophysical Journal International
123456789101112131415161718192021222324252627282930313233343536373839404142434445464748495051525354555657585960
For Peer Review
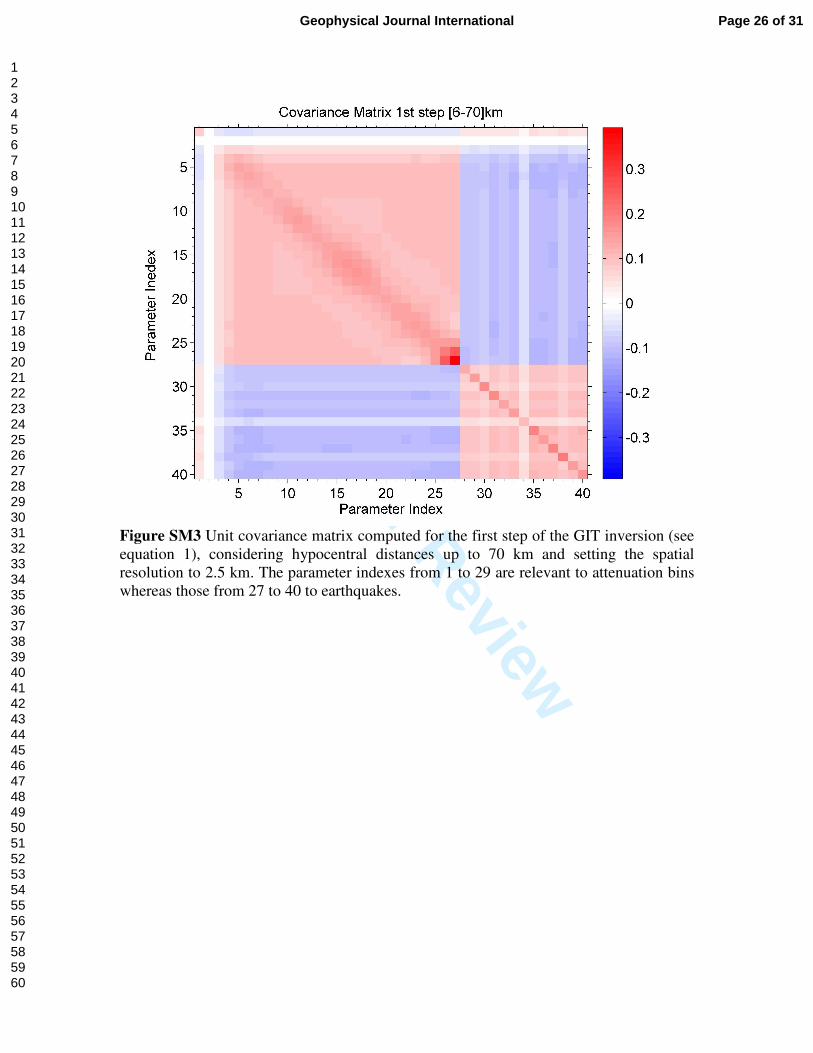
Figure SM3 Unit covariance matrix computed for the first step of the GIT inversion (see
equation 1), considering hypocentral distances up to 70 km and setting the spatial
resolution to 2.5 km. The parameter indexes from 1 to 29 are relevant to attenuation bins
whereas those from 27 to 40 to earthquakes.
Page 26 of 31Geophysical Journal International
123456789101112131415161718192021222324252627282930313233343536373839404142434445464748495051525354555657585960
For Peer Review
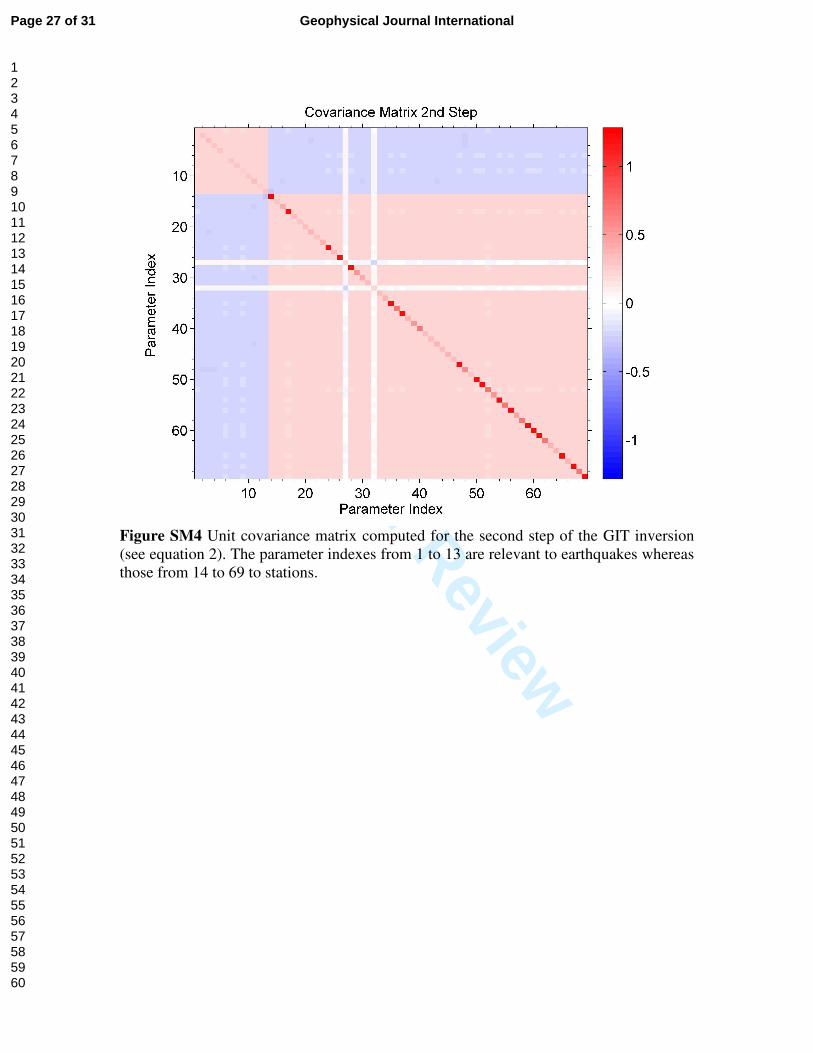
Figure SM4 Unit covariance matrix computed for the second step of the GIT inversion
(see equation 2). The parameter indexes from 1 to 13 are relevant to earthquakes whereas
those from 14 to 69 to stations.
Page 27 of 31 Geophysical Journal International
123456789101112131415161718192021222324252627282930313233343536373839404142434445464748495051525354555657585960
For Peer Review
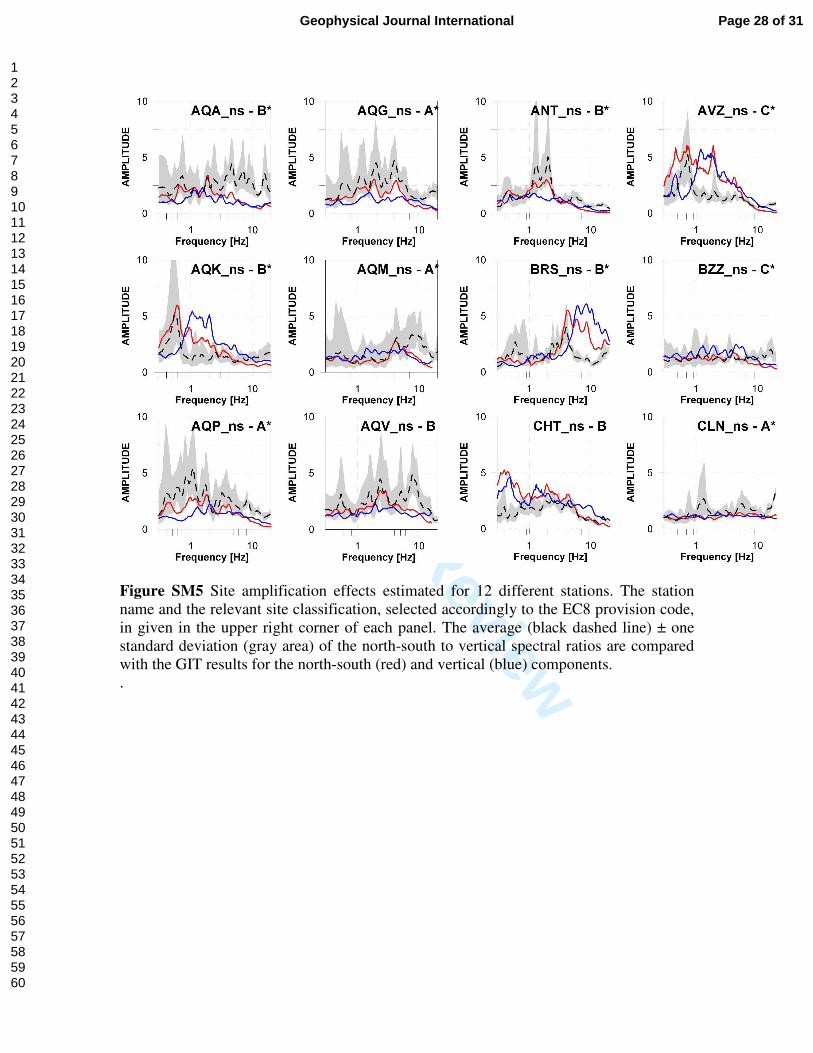
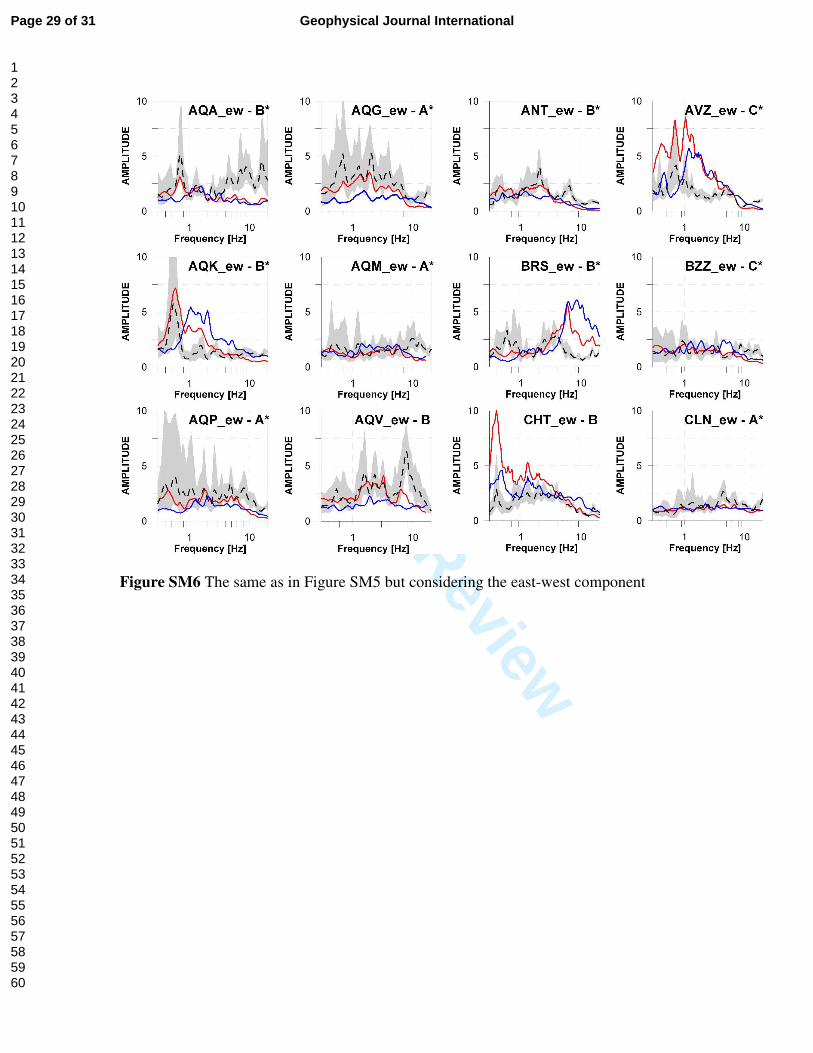
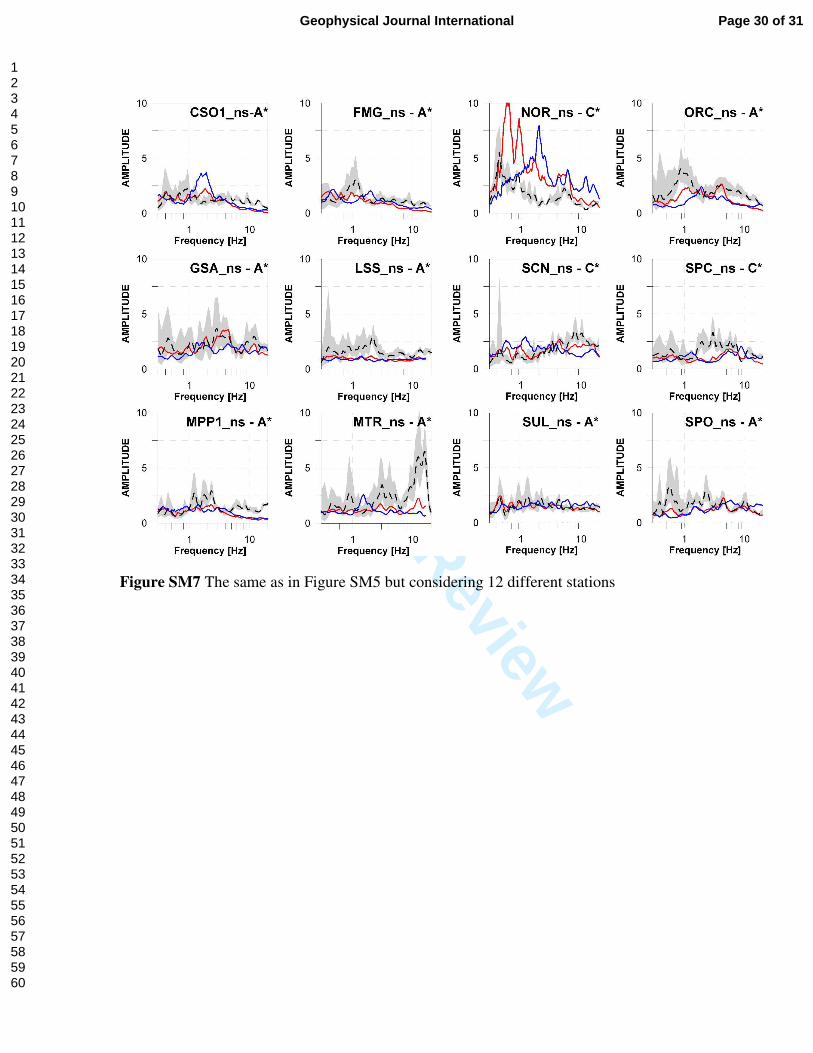
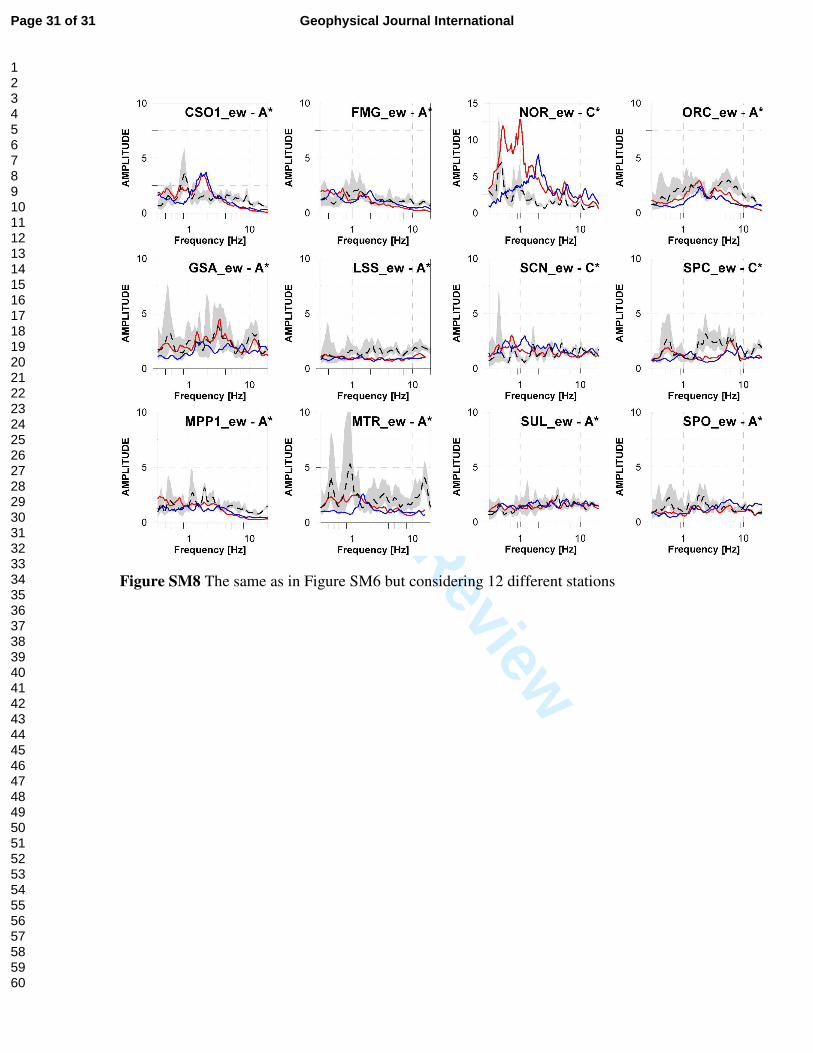
Figure SM5 Site amplification effects estimated for 12 different stations. The station
name and the relevant site classification, selected accordingly to the EC8 provision code,
in given in the upper right corner of each panel. The average (black dashed line) ± one
standard deviation (gray area) of the north-south to vertical spectral ratios are compared
with the GIT results for the north-south (red) and vertical (blue) components.
.
Page 28 of 31Geophysical Journal International
123456789101112131415161718192021222324252627282930313233343536373839404142434445464748495051525354555657585960
For Peer Review
Figure SM6 The same as in Figure SM5 but considering the east-west component
Page 29 of 31 Geophysical Journal International
123456789101112131415161718192021222324252627282930313233343536373839404142434445464748495051525354555657585960
For Peer Review
Figure SM7 The same as in Figure SM5 but considering 12 different stations
Page 30 of 31Geophysical Journal International
123456789101112131415161718192021222324252627282930313233343536373839404142434445464748495051525354555657585960
For Peer Review
Figure SM8 The same as in Figure SM6 but considering 12 different stations
Page 31 of 31 Geophysical Journal International
123456789101112131415161718192021222324252627282930313233343536373839404142434445464748495051525354555657585960