bnp paribas strong solvency & funding
TRANSCRIPT
Fixed Income Presentation March 2021
BNP PARIBASStrong Solvency & Funding
Disclaimer
The figures included in this presentation are unaudited.
This presentation includes forward-looking statements based on current beliefs and expectations about future events. Forward-lookingstatements include financial projections and estimates and their underlying assumptions, statements regarding plans, objectives andexpectations with respect to future events, operations, products and services, and statements regarding future performance and synergies.Forward-looking statements are not guarantees of future performance and are subject to inherent risks, uncertainties and assumptions aboutBNP Paribas and its subsidiaries and investments, developments of BNP Paribas and its subsidiaries, banking industry trends, future capitalexpenditures and acquisitions, changes in economic conditions globally, in particular in the context of the Covid-19 pandemic, or in BNPParibas’ principal local markets, the competitive market and regulatory factors. Those events are uncertain; their outcome may differ fromcurrent expectations which may in turn significantly affect expected results. Actual results may differ materially from those projected or impliedin these forward looking statements. Any forward-looking statement contained in this presentation speaks as of the date of this presentation.BNP Paribas undertakes no obligation to publicly revise or update any forward-looking statements in light of new information or future events. Itshould be recalled in this regard that the Supervisory Review and Evaluation Process is carried out each year by the European Central Bank,which can modify each year its capital adequacy ratio requirements for BNP Paribas.
The information contained in this presentation as it relates to parties other than BNP Paribas or derived from external sources has not beenindependently verified and no representation or warranty expressed or implied is made as to, and no reliance should be placed on, thefairness, accuracy, completeness or correctness of the information or opinions contained herein. None of BNP Paribas or its representativesshall have any liability whatsoever in negligence or otherwise for any loss however arising from any use of this presentation or its contents orotherwise arising in connection with this presentation or any other information or material discussed.
The sum of values contained in the tables and analyses may differ slightly from the total reported due to rounding.
Photo credits (cover page): Adobe Stock © Yakobchuk Olena, Adobe Stock © Maria Savenko , © 2020 BNP Paribas / Sébastien Millier, Adobe Stock © zhu difeng
2Fixed Income Presentation - March 2021
2020 RESULTS
Strong Solvency & Capital Generation Capacity
APPENDIX
3Fixed Income Presentation - March 2021
FOCUS ON FUNDING
34%
19%
15%12%
10%
5% 5%
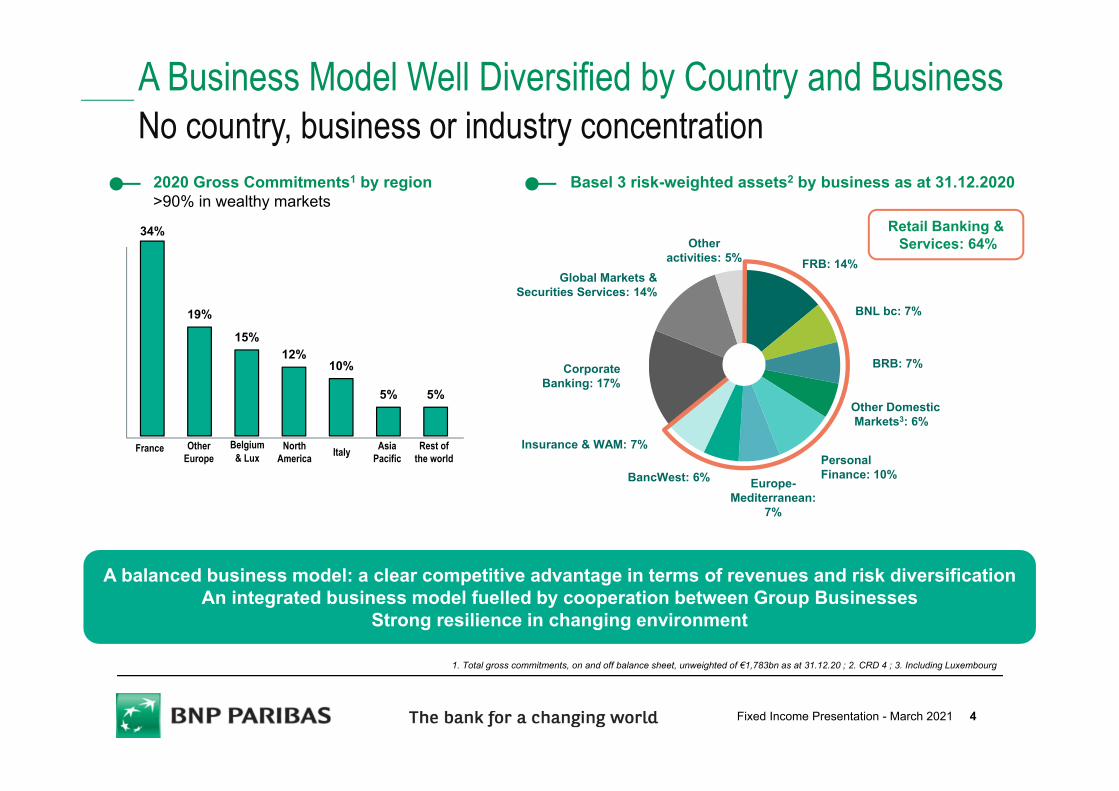
A Business Model Well Diversified by Country and BusinessNo country, business or industry concentration
1. Total gross commitments, on and off balance sheet, unweighted of €1,783bn as at 31.12.20 ; 2. CRD 4 ; 3. Including Luxembourg
2020 Gross Commitments1 by region>90% in wealthy markets
France OtherEurope
NorthAmerica
Belgium& Lux Italy Asia
PacificRest of
the world
Basel 3 risk-weighted assets2 by business as at 31.12.2020
Other DomesticMarkets3: 6%
BNL bc: 7%
PersonalFinance: 10%BancWest: 6%
BRB: 7%
Europe-Mediterranean:
7%
FRB: 14%
Insurance & WAM: 7%
CorporateBanking: 17%
Otheractivities: 5%
Global Markets & Securities Services: 14%
Retail Banking &Services: 64%
A balanced business model: a clear competitive advantage in terms of revenues and risk diversificationAn integrated business model fuelled by cooperation between Group Businesses
Strong resilience in changing environment
4Fixed Income Presentation - March 2021
A very solid financial structure Increase in CET1 ratio
31.12.19 31.12.20
CET1 ratio
12.1%12.8%
309
432
31.12.19 31.12.20
Liquidity reserve (€bn)3
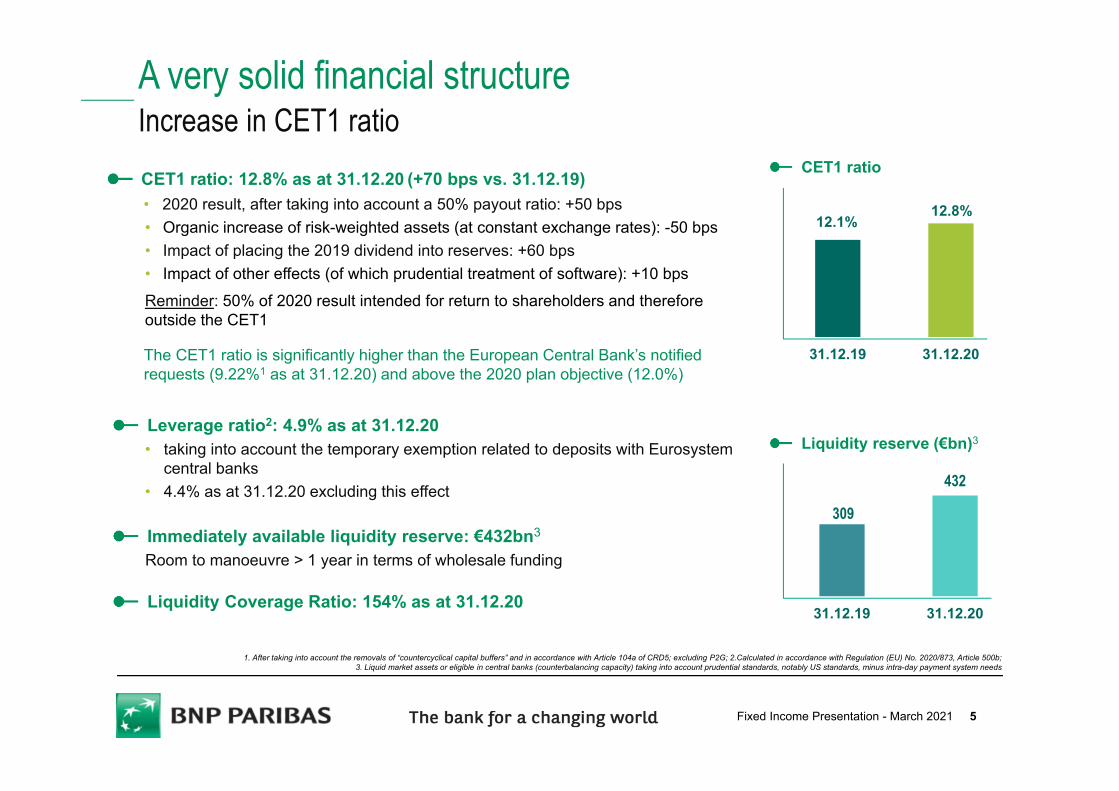
CET1 ratio: 12.8% as at 31.12.20 (+70 bps vs. 31.12.19)• 2020 result, after taking into account a 50% payout ratio: +50 bps• Organic increase of risk-weighted assets (at constant exchange rates): -50 bps• Impact of placing the 2019 dividend into reserves: +60 bps• Impact of other effects (of which prudential treatment of software): +10 bpsReminder: 50% of 2020 result intended for return to shareholders and therefore outside the CET1
The CET1 ratio is significantly higher than the European Central Bank’s notified requests (9.22%1 as at 31.12.20) and above the 2020 plan objective (12.0%)
1. After taking into account the removals of “countercyclical capital buffers” and in accordance with Article 104a of CRD5; excluding P2G; 2.Calculated in accordance with Regulation (EU) No. 2020/873, Article 500b; 3. Liquid market assets or eligible in central banks (counterbalancing capacity) taking into account prudential standards, notably US standards, minus intra-day payment system needs
Leverage ratio2: 4.9% as at 31.12.20• taking into account the temporary exemption related to deposits with Eurosystem
central banks • 4.4% as at 31.12.20 excluding this effect
Immediately available liquidity reserve: €432bn3
Room to manoeuvre > 1 year in terms of wholesale funding
Liquidity Coverage Ratio: 154% as at 31.12.20
5Fixed Income Presentation - March 2021
Distribution policy and capital management
1. “[…] until 30 September 2021 […] the ECB expects dividends and share buy-backs to remain below 15 per cent of the cumulated profit for 2019-20 and not higher than 20 basis points of the Common Equity Tier 1 (CET1) ratio”; 2. Subject to the approval of the Annual General Meeting of 18 May 2021, detached on 24 May 2021 and paid out on 26 May 2021; 3. Subject to ECB approval; 4. Subject to ECB and AGM approval
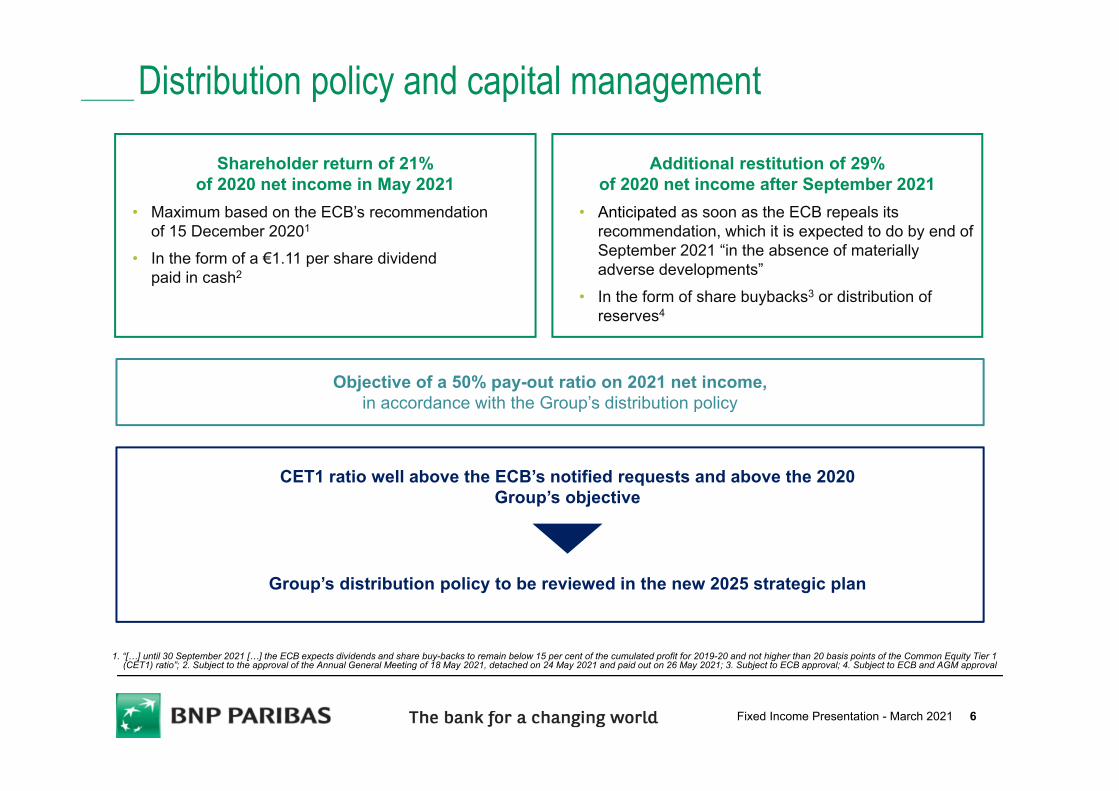
Shareholder return of 21% of 2020 net income in May 2021
• Maximum based on the ECB’s recommendation of 15 December 20201
• In the form of a €1.11 per share dividend paid in cash2
Additional restitution of 29% of 2020 net income after September 2021
• Anticipated as soon as the ECB repeals its recommendation, which it is expected to do by end of September 2021 “in the absence of materially adverse developments”
• In the form of share buybacks3 or distribution of reserves4
Objective of a 50% pay-out ratio on 2021 net income, in accordance with the Group’s distribution policy
CET1 ratio well above the ECB’s notified requests and above the 2020 Group’s objective
Group’s distribution policy to be reviewed in the new 2025 strategic plan
6Fixed Income Presentation - March 2021
4.50%
12.8%
0.70%
2.50%
1.50%
12.8%
9.22%
2020 Supervisory Review and Evaluation Process (SREP) CET1 ratio well above requirement
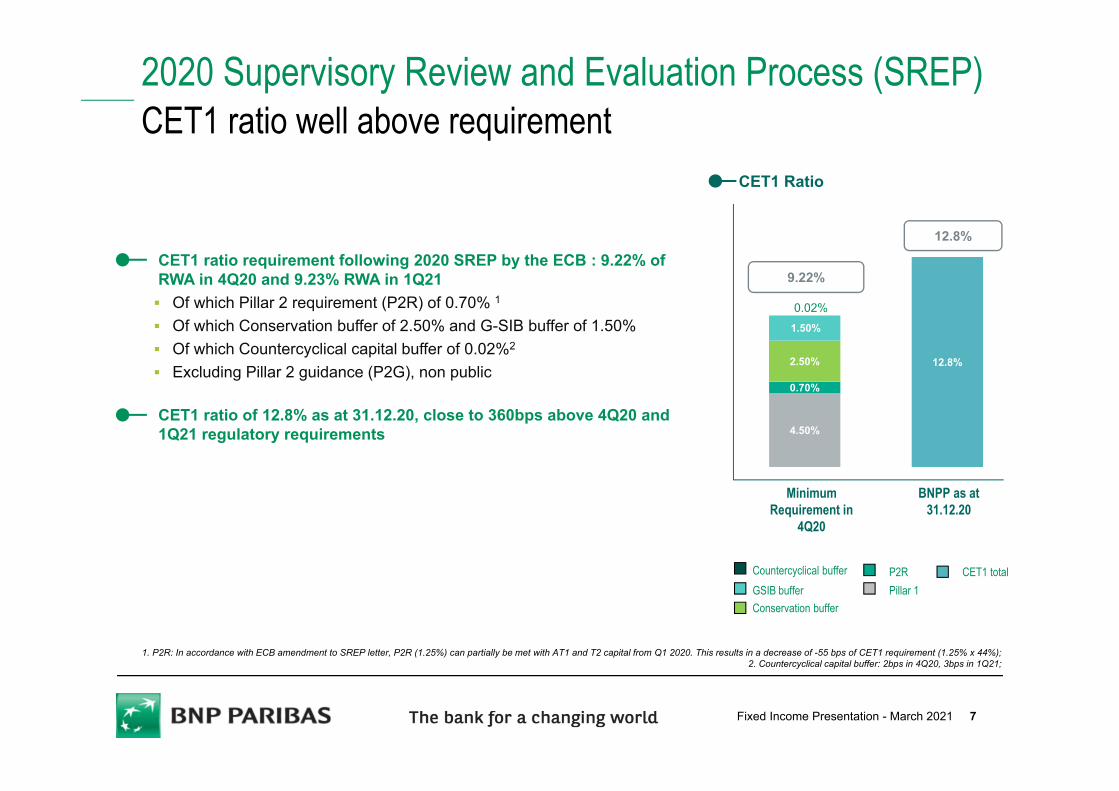
CET1 ratio requirement following 2020 SREP by the ECB : 9.22% of RWA in 4Q20 and 9.23% RWA in 1Q21 Of which Pillar 2 requirement (P2R) of 0.70% 1
Of which Conservation buffer of 2.50% and G-SIB buffer of 1.50% Of which Countercyclical capital buffer of 0.02%2
Excluding Pillar 2 guidance (P2G), non public
CET1 ratio of 12.8% as at 31.12.20, close to 360bps above 4Q20 and 1Q21 regulatory requirements
1. P2R: In accordance with ECB amendment to SREP letter, P2R (1.25%) can partially be met with AT1 and T2 capital from Q1 2020. This results in a decrease of -55 bps of CET1 requirement (1.25% x 44%); 2. Countercyclical capital buffer: 2bps in 4Q20, 3bps in 1Q21;
Conservation bufferPillar 1GSIB bufferP2R CET1 totalCountercyclical buffer
CET1 Ratio
Minimum Requirement in
4Q20
BNPP as at 31.12.20
0.02%
7Fixed Income Presentation - March 2021
2020 Supervisory Review and Evaluation Process (SREP) Total Capital ratio well above requirement
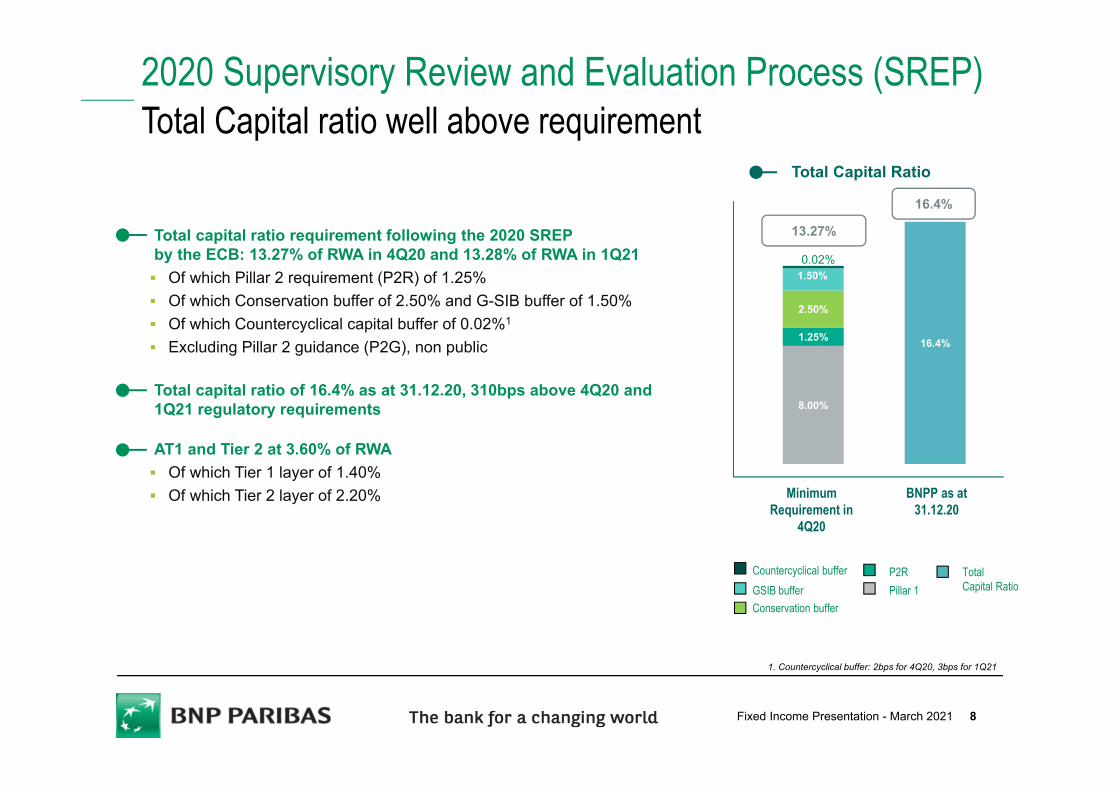
Total capital ratio requirement following the 2020 SREPby the ECB: 13.27% of RWA in 4Q20 and 13.28% of RWA in 1Q21 Of which Pillar 2 requirement (P2R) of 1.25% Of which Conservation buffer of 2.50% and G-SIB buffer of 1.50% Of which Countercyclical capital buffer of 0.02%1
Excluding Pillar 2 guidance (P2G), non public
Total capital ratio of 16.4% as at 31.12.20, 310bps above 4Q20 and 1Q21 regulatory requirements
AT1 and Tier 2 at 3.60% of RWA Of which Tier 1 layer of 1.40% Of which Tier 2 layer of 2.20%
8.00%
16.4%1.25%
2.50%
1.50%
16.4%
13.27%
Conservation bufferPillar 1GSIB bufferP2R Total
Capital RatioCountercyclical buffer
Total Capital Ratio
1. Countercyclical buffer: 2bps for 4Q20, 3bps for 1Q21
Minimum Requirement in
4Q20
BNPP as at 31.12.20
0.02%
8Fixed Income Presentation - March 2021

Prudential Total Capital
12.8%
1.4%
2.2%
Tier 2Additional Tier 1CET 1
Prudential Total Capital as at 31.12.20
16.4%
€15.0bn
€10.0bn
€88.8bn
€113.8bn
Close to €114bn of prudential Total Capital as at 31.12.20
9Fixed Income Presentation - March 2021
2020 RESULTS
STRONG SOLVENCY & CAPITAL GENERATION CAPACITY
APPENDIX
10Fixed Income Presentation - March 2021
FOCUS ON FUNDING
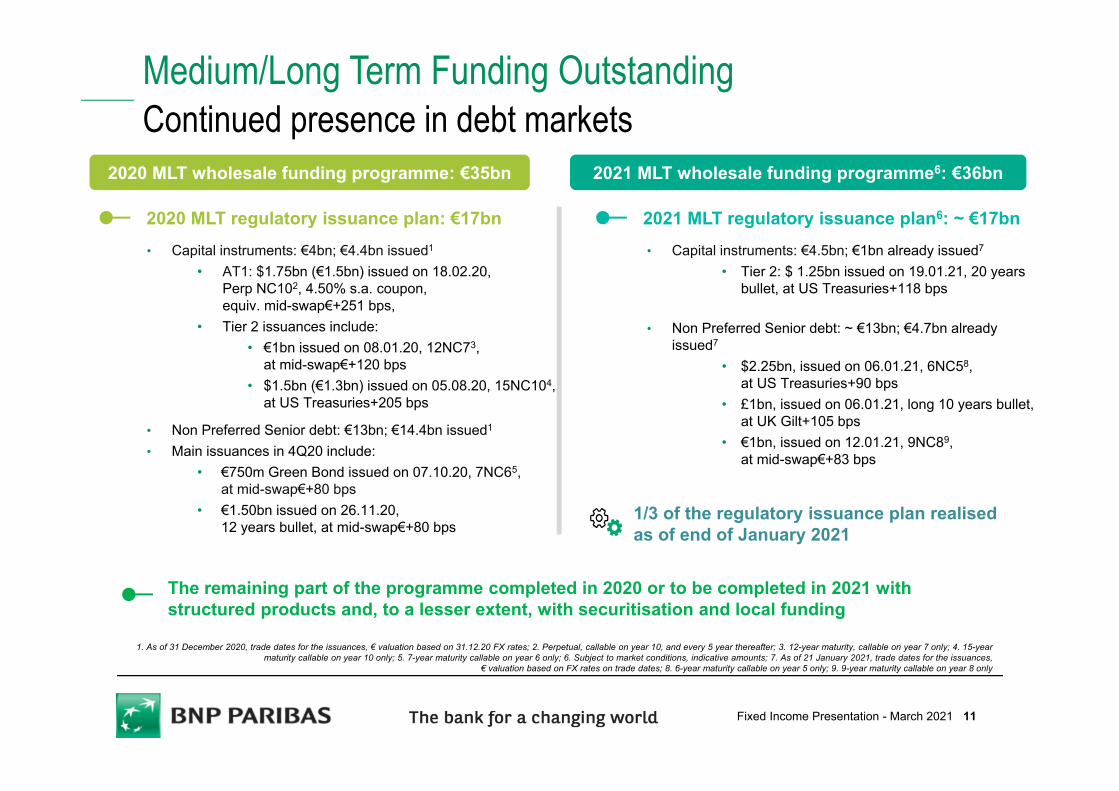
Medium/Long Term Funding OutstandingContinued presence in debt markets
2020 MLT regulatory issuance plan: €17bn• Capital instruments: €4bn; €4.4bn issued1
• AT1: $1.75bn (€1.5bn) issued on 18.02.20, Perp NC102, 4.50% s.a. coupon, equiv. mid-swap€+251 bps,
• Tier 2 issuances include:• €1bn issued on 08.01.20, 12NC73,
at mid-swap€+120 bps• $1.5bn (€1.3bn) issued on 05.08.20, 15NC104,
at US Treasuries+205 bps
• Non Preferred Senior debt: €13bn; €14.4bn issued1
• Main issuances in 4Q20 include:• €750m Green Bond issued on 07.10.20, 7NC65,
at mid-swap€+80 bps• €1.50bn issued on 26.11.20,
12 years bullet, at mid-swap€+80 bps
1. As of 31 December 2020, trade dates for the issuances, € valuation based on 31.12.20 FX rates; 2. Perpetual, callable on year 10, and every 5 year thereafter; 3. 12-year maturity, callable on year 7 only; 4. 15-year maturity callable on year 10 only; 5. 7-year maturity callable on year 6 only; 6. Subject to market conditions, indicative amounts; 7. As of 21 January 2021, trade dates for the issuances,
€ valuation based on FX rates on trade dates; 8. 6-year maturity callable on year 5 only; 9. 9-year maturity callable on year 8 only
2020 MLT wholesale funding programme: €35bn
2021 MLT regulatory issuance plan6: ~ €17bn• Capital instruments: €4.5bn; €1bn already issued7
• Tier 2: $ 1.25bn issued on 19.01.21, 20 years bullet, at US Treasuries+118 bps
•
• Non Preferred Senior debt: ~ €13bn; €4.7bn already issued7
• $2.25bn, issued on 06.01.21, 6NC58, at US Treasuries+90 bps
• £1bn, issued on 06.01.21, long 10 years bullet, at UK Gilt+105 bps
• €1bn, issued on 12.01.21, 9NC89, at mid-swap€+83 bps
2021 MLT wholesale funding programme6: €36bn
The remaining part of the programme completed in 2020 or to be completed in 2021 with structured products and, to a lesser extent, with securitisation and local funding
1/3 of the regulatory issuance plan realised as of end of January 2021
11Fixed Income Presentation - March 2021
57%
5%
32%
1%4%
1%
2018
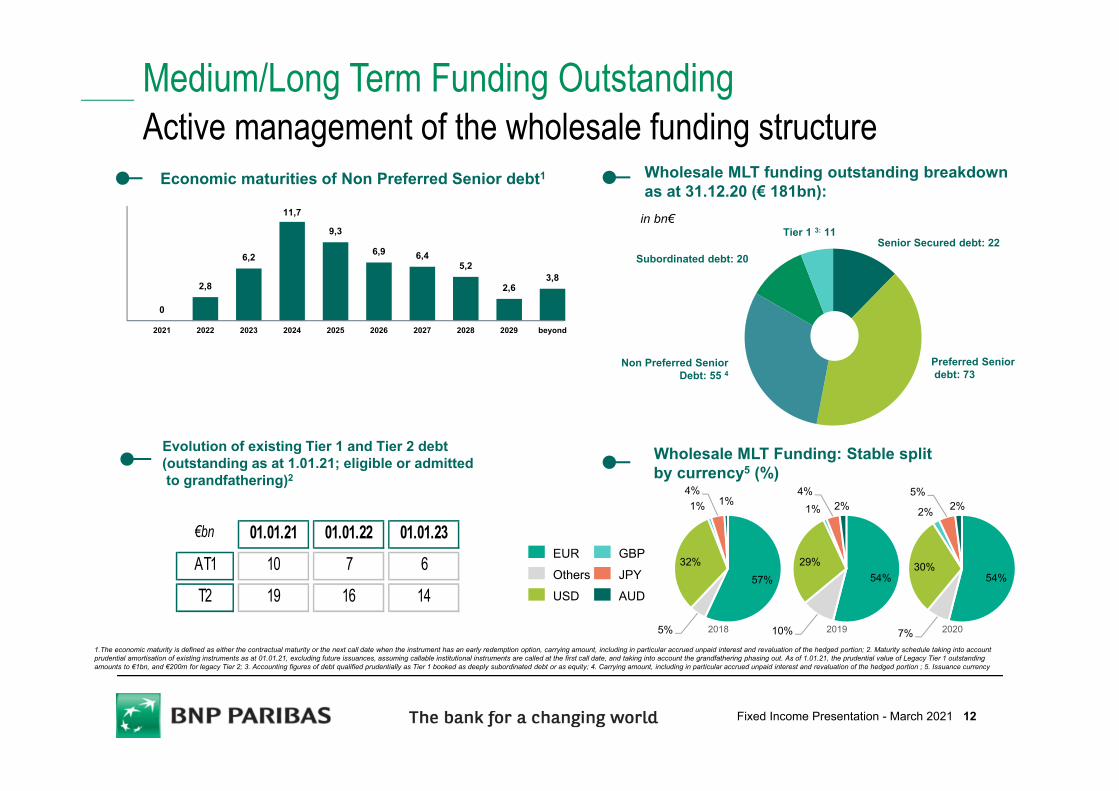
Medium/Long Term Funding OutstandingActive management of the wholesale funding structure
Wholesale MLT Funding: Stable split by currency5 (%)
EUR
Senior Secured debt: 22
Preferred Seniordebt: 73
Non Preferred SeniorDebt: 55 4
Subordinated debt: 20
Tier 1 3: 11in bn€
Wholesale MLT funding outstanding breakdown as at 31.12.20 (€ 181bn):
54%
7%
30%
2%
5%2%
2020
0
2,8
6,2
11,7
9,3
6,9 6,45,2
2,63,8
2021 2022 2023 2024 2025 2026 2027 2028 2029 beyond
Economic maturities of Non Preferred Senior debt1
Evolution of existing Tier 1 and Tier 2 debt (outstanding as at 1.01.21; eligible or admittedto grandfathering)2
€bn 01.01.21 01.01.22 01.01.23AT1 10 7 6
T2 19 16 14
1.The economic maturity is defined as either the contractual maturity or the next call date when the instrument has an early redemption option, carrying amount, including in particular accrued unpaid interest and revaluation of the hedged portion; 2. Maturity schedule taking into account prudential amortisation of existing instruments as at 01.01.21, excluding future issuances, assuming callable institutional instruments are called at the first call date, and taking into account the grandfathering phasing out. As of 1.01.21, the prudential value of Legacy Tier 1 outstandingamounts to €1bn, and €200m for legacy Tier 2; 3. Accounting figures of debt qualified prudentially as Tier 1 booked as deeply subordinated debt or as equity; 4. Carrying amount, including in particular accrued unpaid interest and revaluation of the hedged portion ; 5. Issuance currency
Others
USD
GBP
JPY
AUD54%
10%
29%
1%4%
2%
2019
12Fixed Income Presentation - March 2021
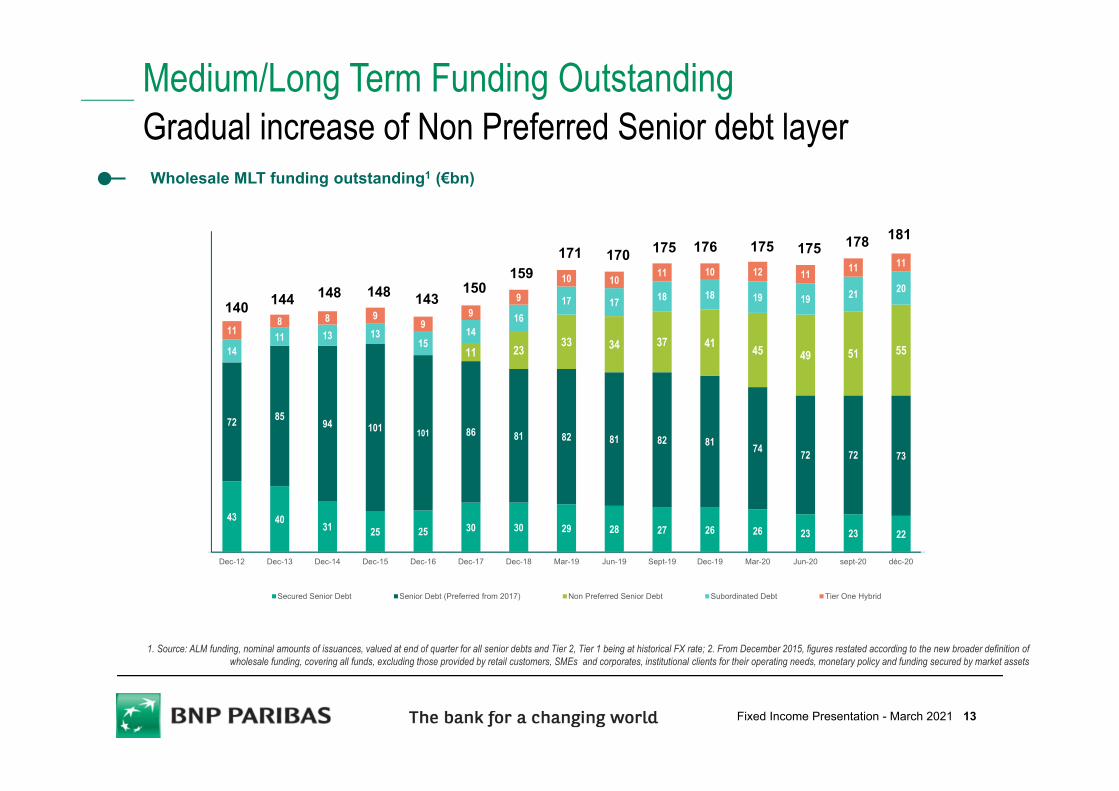
Medium/Long Term Funding OutstandingGradual increase of Non Preferred Senior debt layer
1. Source: ALM funding, nominal amounts of issuances, valued at end of quarter for all senior debts and Tier 2, Tier 1 being at historical FX rate; 2. From December 2015, figures restated according to the new broader definition of wholesale funding, covering all funds, excluding those provided by retail customers, SMEs and corporates, institutional clients for their operating needs, monetary policy and funding secured by market assets
Wholesale MLT funding outstanding1 (€bn)
43 40 31 25 25 30 30 29 28 27 26 26 23 23 22
72 85 94 101 101 86 81 82 81 82 81 74 72 72 73
11 23 33 34 37 41 45 49 51 551411 13 13
1514
1617 17 18 18 19 19 21 20
118 8 9
99
9
10 10 11 10 12 11 11 11
Dec-12 Dec-13 Dec-14 Dec-15 Dec-16 Dec-17 Dec-18 Mar-19 Jun-19 Sept-19 Dec-19 Mar-20 Jun-20 sept-20 déc-20
Secured Senior Debt Senior Debt (Preferred from 2017) Non Preferred Senior Debt Subordinated Debt Tier One Hybrid
140 144 148 148 143150
159171 170 175 176 175 175 178 181
13Fixed Income Presentation - March 2021
16.00% 16.4%
2.50%
7.7%1.50%0.02%
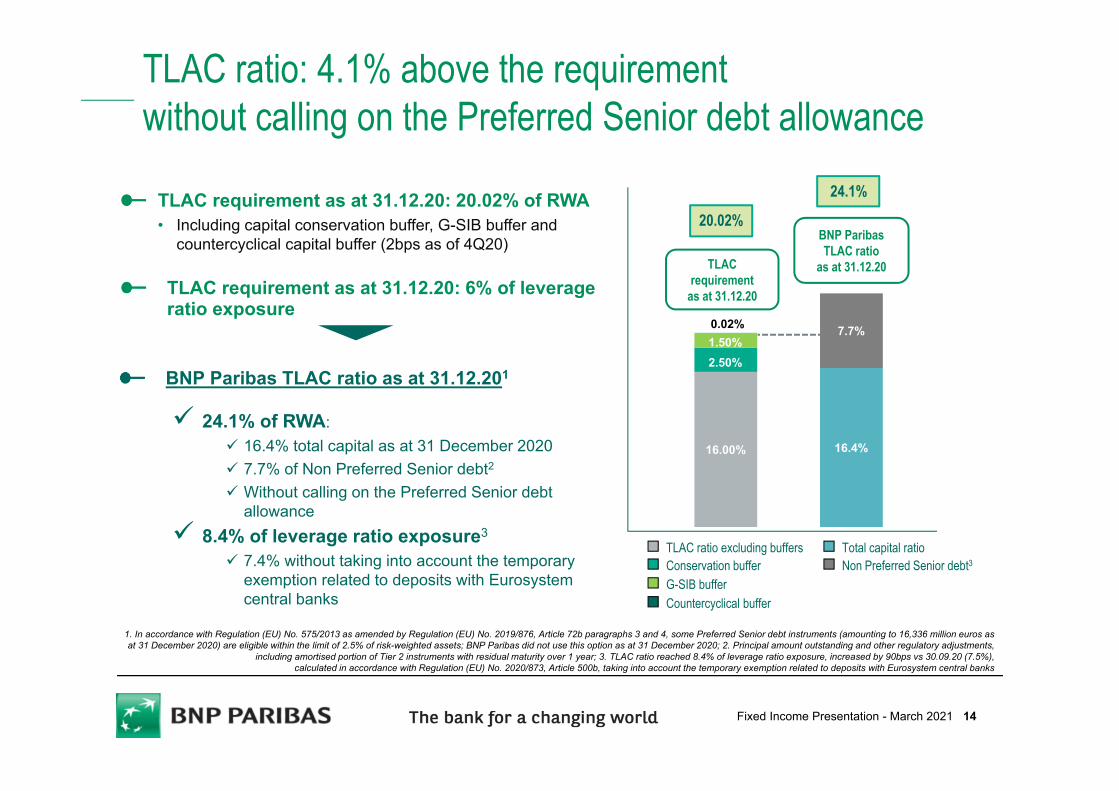
TLAC ratio: 4.1% above the requirement without calling on the Preferred Senior debt allowance
TLAC requirement as at 31.12.20: 20.02% of RWA • Including capital conservation buffer, G-SIB buffer and
countercyclical capital buffer (2bps as of 4Q20)
TLAC requirement as at 31.12.20: 6% of leverage ratio exposure
TLAC requirement
as at 31.12.20
TLAC ratio excluding buffersConservation bufferG-SIB bufferCountercyclical buffer
Total capital ratioNon Preferred Senior debt3
BNP Paribas TLAC ratio
as at 31.12.20
BNP Paribas TLAC ratio as at 31.12.201
24.1% of RWA: 16.4% total capital as at 31 December 2020 7.7% of Non Preferred Senior debt2
Without calling on the Preferred Senior debt allowance
8.4% of leverage ratio exposure3
7.4% without taking into account the temporary exemption related to deposits with Eurosystemcentral banks
20.02%
24.1%
1. In accordance with Regulation (EU) No. 575/2013 as amended by Regulation (EU) No. 2019/876, Article 72b paragraphs 3 and 4, some Preferred Senior debt instruments (amounting to 16,336 million euros asat 31 December 2020) are eligible within the limit of 2.5% of risk-weighted assets; BNP Paribas did not use this option as at 31 December 2020; 2. Principal amount outstanding and other regulatory adjustments,
including amortised portion of Tier 2 instruments with residual maturity over 1 year; 3. TLAC ratio reached 8.4% of leverage ratio exposure, increased by 90bps vs 30.09.20 (7.5%), calculated in accordance with Regulation (EU) No. 2020/873, Article 500b, taking into account the temporary exemption related to deposits with Eurosystem central banks
14Fixed Income Presentation - March 2021
4.50%6.00%
8.00%0.70%
0.94%
1.25%
2.50%
2.50%
2.50%
1.50%
1.50%
1.50%9.22%
10.96%
13.27%
G-SIB bufferP2RCountercyclical buffer
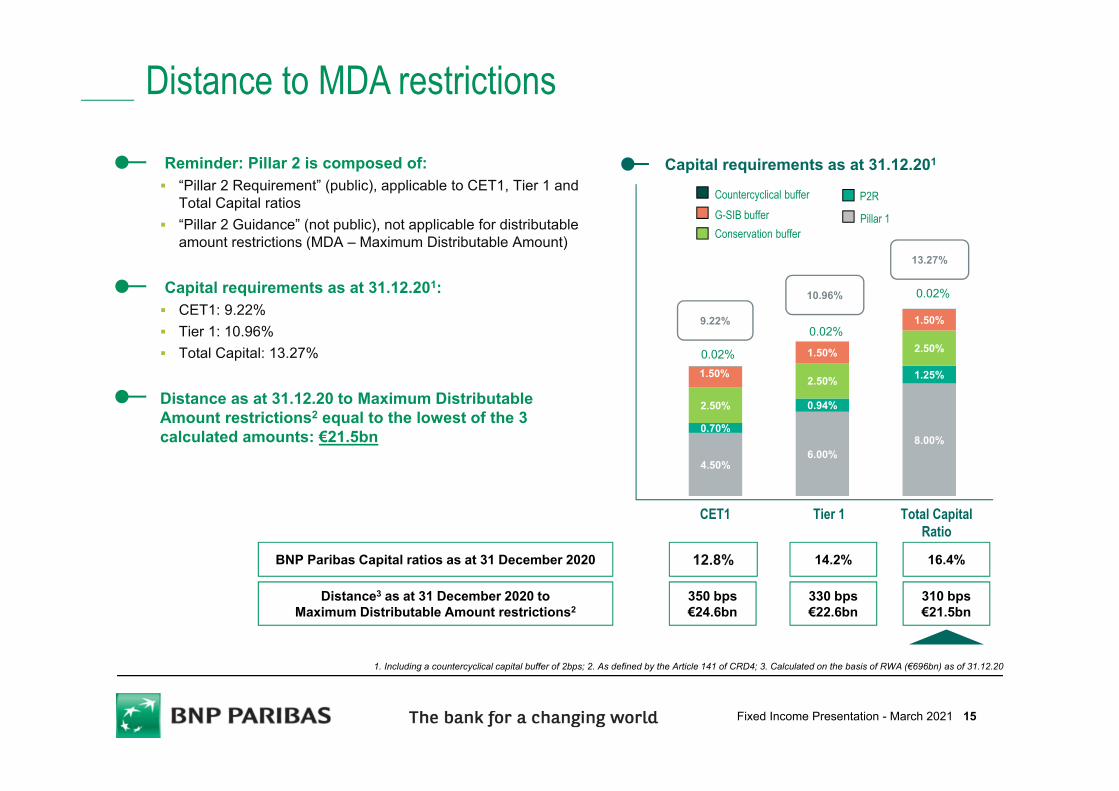
Distance to MDA restrictions
Reminder: Pillar 2 is composed of: “Pillar 2 Requirement” (public), applicable to CET1, Tier 1 and
Total Capital ratios “Pillar 2 Guidance” (not public), not applicable for distributable
amount restrictions (MDA – Maximum Distributable Amount)
Capital requirements as at 31.12.201: CET1: 9.22% Tier 1: 10.96% Total Capital: 13.27%
Distance as at 31.12.20 to Maximum Distributable Amount restrictions2 equal to the lowest of the 3 calculated amounts: €21.5bn
Conservation bufferPillar 1
Capital requirements as at 31.12.201
Tier 1 Total Capital Ratio
CET1
0.02%
0.02%
0.02%
16.4%
310 bps€21.5bn
14.2%
330 bps€22.6bn
12.8%
350 bps€24.6bn
BNP Paribas Capital ratios as at 31 December 2020
Distance3 as at 31 December 2020 to Maximum Distributable Amount restrictions2
1. Including a countercyclical capital buffer of 2bps; 2. As defined by the Article 141 of CRD4; 3. Calculated on the basis of RWA (€696bn) as of 31.12.20
15Fixed Income Presentation - March 2021
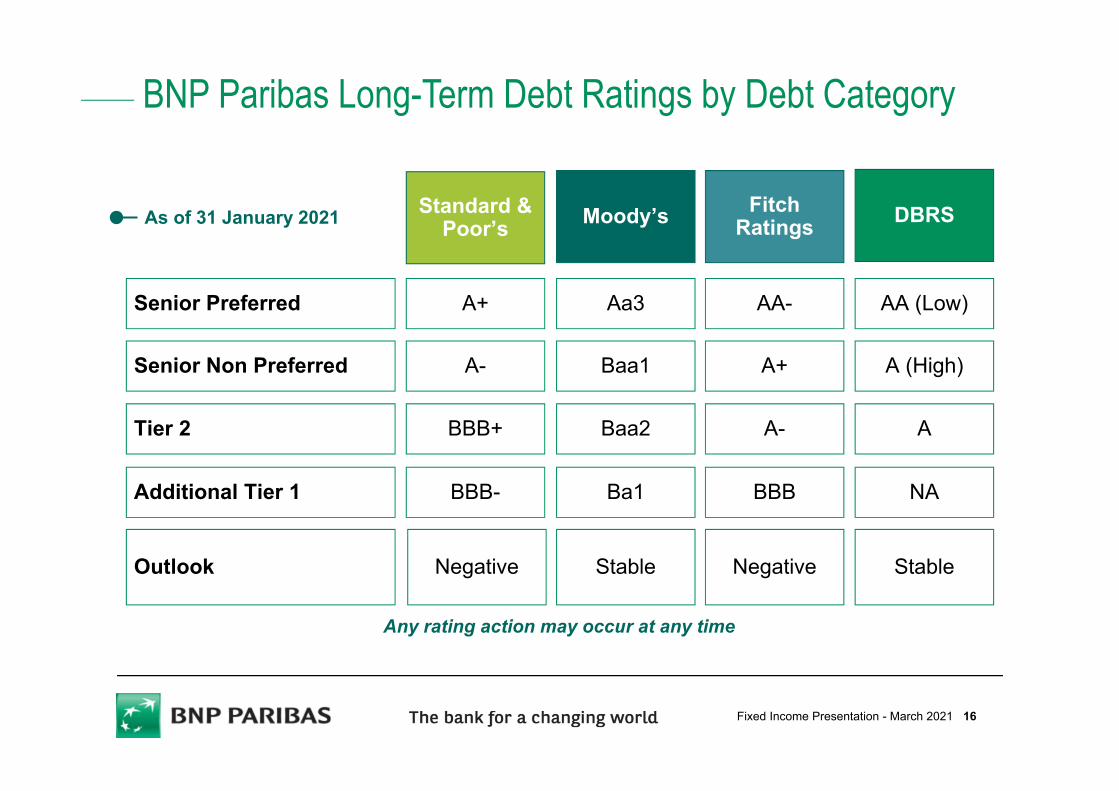
BNP Paribas Long-Term Debt Ratings by Debt Category
Any rating action may occur at any time
Senior Preferred
Senior Non Preferred
Tier 2
Additional Tier 1
Outlook Stable
Aa3 AA-
Standard & Poor’s
A+
Moody’s DBRSFitch Ratings
AA (Low)
Baa1 A+A- A (High)
A-BBB+ A
Ba1 BBBBBB- NA
Baa2
Stable NegativeNegative
As of 31 January 2021
16Fixed Income Presentation - March 2021
2020 RESULTS
STRONG SOLVENCY & CAPITAL GENERATION CAPACITY
APPENDIX
17Fixed Income Presentation - March 2021
FOCUS ON FUNDING
1.Granted by the retail networks as of 31.12.20; 2 Source: Dealogic as of 31.12.20, bookrunner, proportional amount; 3. Cost of risk / Customer loans at the beginning of the period (in bps); 4. Group share; 5. See slide 5
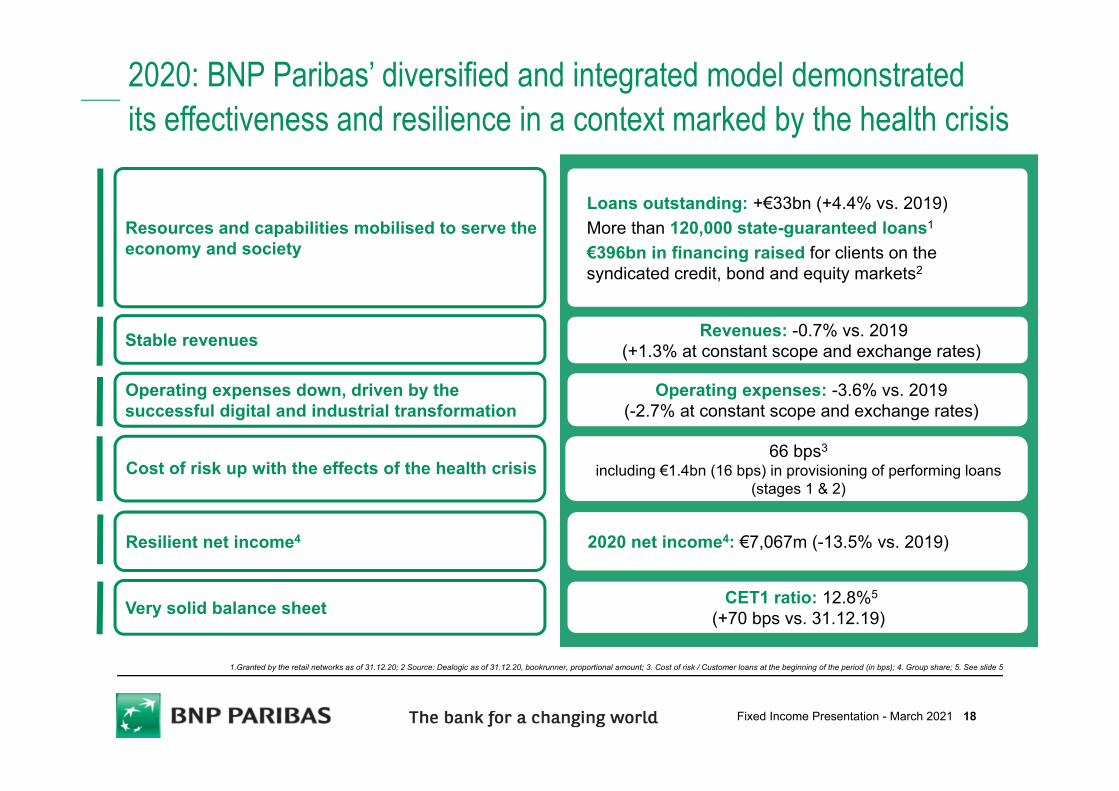
2020: BNP Paribas’ diversified and integrated model demonstrated its effectiveness and resilience in a context marked by the health crisis
Very solid balance sheet
Resilient net income4
Cost of risk up with the effects of the health crisis
Operating expenses down, driven by the successful digital and industrial transformation
Stable revenues Revenues: -0.7% vs. 2019(+1.3% at constant scope and exchange rates)
Operating expenses: -3.6% vs. 2019(-2.7% at constant scope and exchange rates)
66 bps3
including €1.4bn (16 bps) in provisioning of performing loans (stages 1 & 2)
2020 net income4: €7,067m (-13.5% vs. 2019)
CET1 ratio: 12.8%5
(+70 bps vs. 31.12.19))
Resources and capabilities mobilised to serve the economy and society
Loans outstanding: +€33bn (+4.4% vs. 2019)More than 120,000 state-guaranteed loans1
€396bn in financing raised for clients on the syndicated credit, bond and equity markets2
18Fixed Income Presentation - March 2021
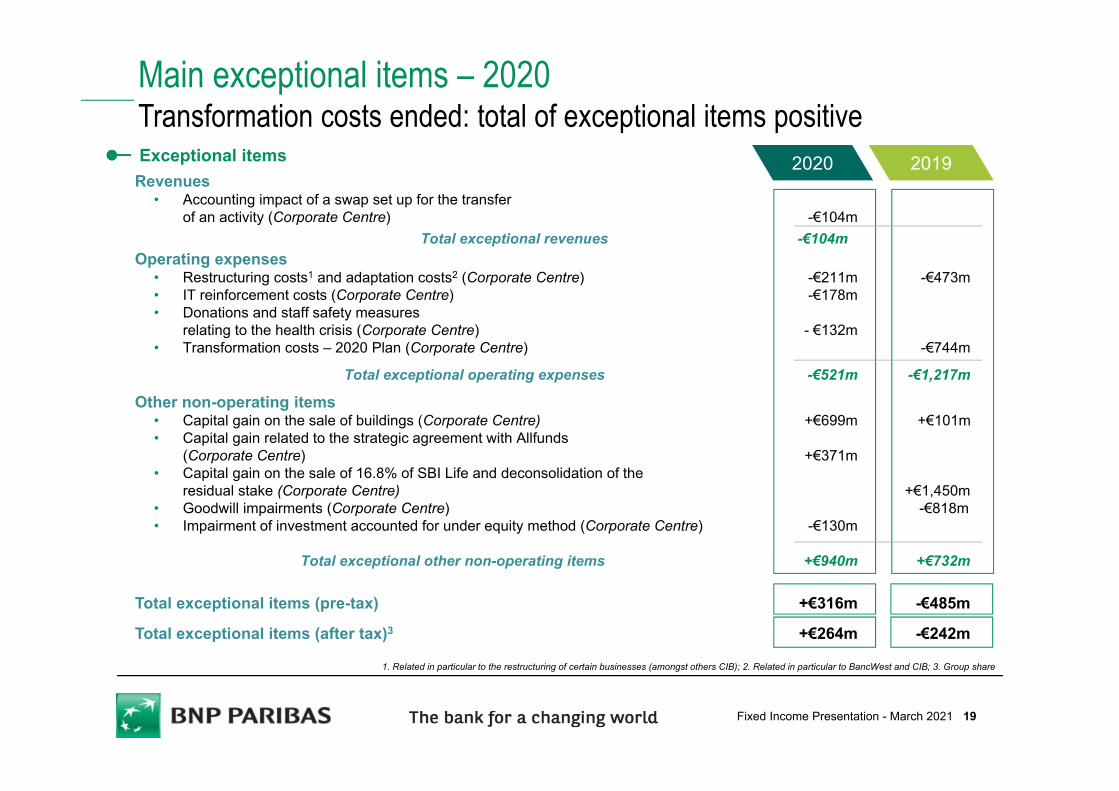
Revenues• Accounting impact of a swap set up for the transfer
of an activity (Corporate Centre) -€104mTotal exceptional revenues -€104m
Operating expenses • Restructuring costs1 and adaptation costs2 (Corporate Centre) -€211m -€473m• IT reinforcement costs (Corporate Centre) -€178m• Donations and staff safety measures
relating to the health crisis (Corporate Centre) - €132m• Transformation costs – 2020 Plan (Corporate Centre) -€744m
Total exceptional operating expenses -€521m -€1,217m
Other non-operating items• Capital gain on the sale of buildings (Corporate Centre) +€699m +€101m• Capital gain related to the strategic agreement with Allfunds
(Corporate Centre) +€371m• Capital gain on the sale of 16.8% of SBI Life and deconsolidation of the
residual stake (Corporate Centre) +€1,450m• Goodwill impairments (Corporate Centre) -€818m• Impairment of investment accounted for under equity method (Corporate Centre) -€130m
Total exceptional other non-operating items +€940m +€732m
Total exceptional items (pre-tax) +€316m -€485m
Total exceptional items (after tax)3 +€264m -€242m
20192020Exceptional items
Main exceptional items – 2020Transformation costs ended: total of exceptional items positive
1. Related in particular to the restructuring of certain businesses (amongst others CIB); 2. Related in particular to BancWest and CIB; 3. Group share
19Fixed Income Presentation - March 2021
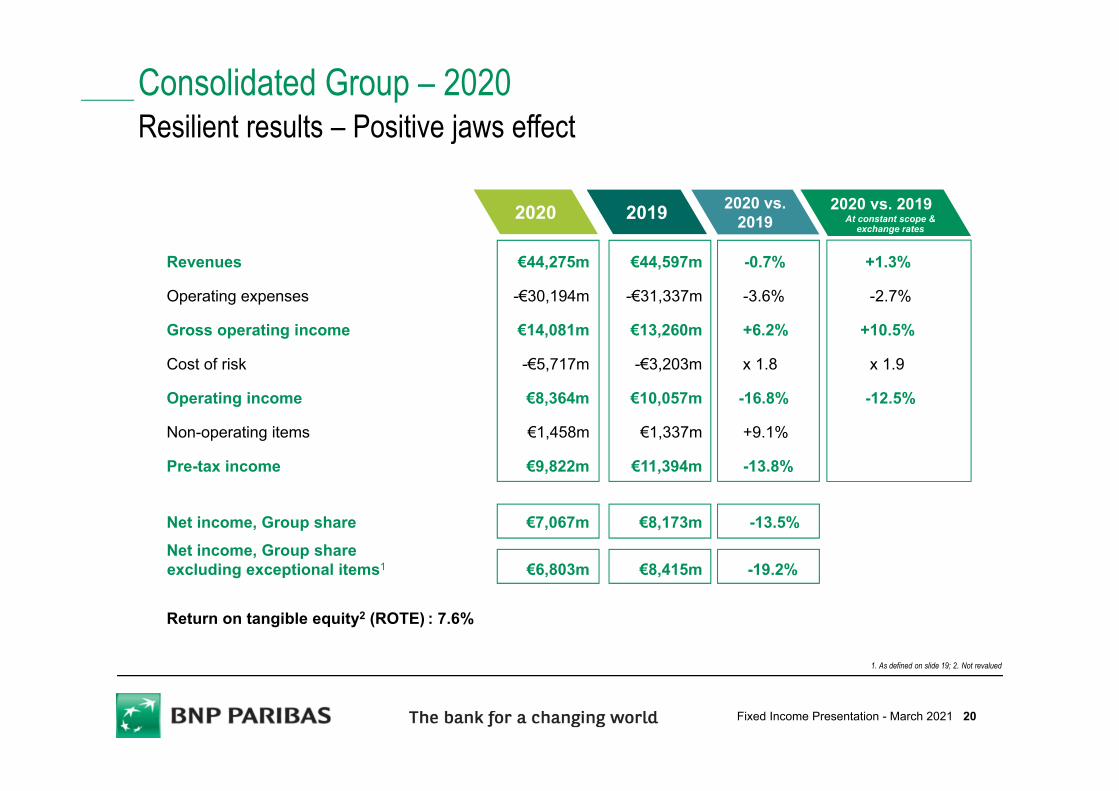
2020 2019 2020 vs.2019
Revenues €44,275m €44,597m -0.7% +1.3%
Operating expenses -€30,194m -€31,337m -3.6% -2.7%
Gross operating income €14,081m €13,260m +6.2% +10.5%
Cost of risk -€5,717m -€3,203m x 1.8 x 1.9
Operating income €8,364m €10,057m -16.8% -12.5%
Non-operating items €1,458m €1,337m +9.1%
Pre-tax income €9,822m €11,394m -13.8%
Net income, Group share €7,067m €8,173m -13.5%Net income, Group shareexcluding exceptional items1 €6,803m €8,415m -19.2%
Return on tangible equity2 (ROTE) : 7.6%
1. As defined on slide 19; 2. Not revalued
Consolidated Group – 2020Resilient results – Positive jaws effect
2020 vs. 2019At constant scope &
exchange rates
20Fixed Income Presentation - March 2021
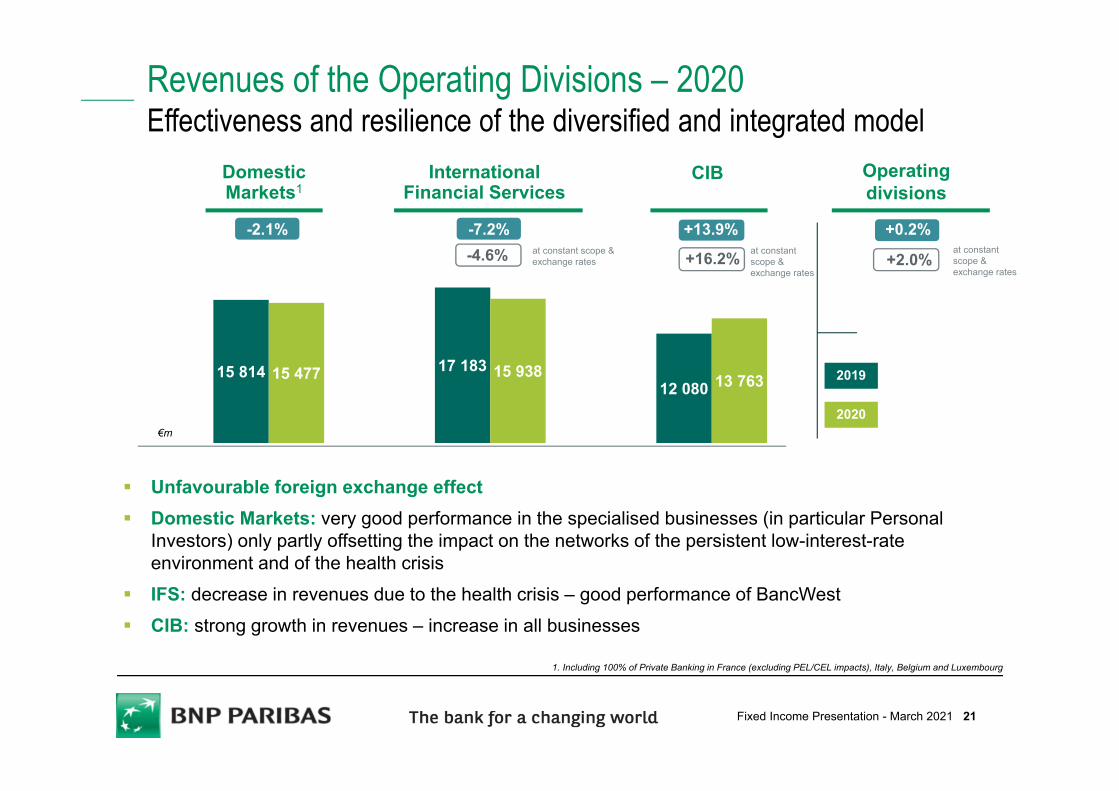
-2.1% +13.9%-7.2% +0.2%
15 814 15 477 17 183 15 93812 080 13 763
Revenues of the Operating Divisions – 2020Effectiveness and resilience of the diversified and integrated model
€m
Unfavourable foreign exchange effect Domestic Markets: very good performance in the specialised businesses (in particular Personal
Investors) only partly offsetting the impact on the networks of the persistent low-interest-rate environment and of the health crisis
IFS: decrease in revenues due to the health crisis – good performance of BancWest CIB: strong growth in revenues – increase in all businesses
DomesticMarkets1
International Financial Services
CIB Operating divisions
2020
2019
-4.6% at constant scope & exchange rates +2.0%+16.2% at constant
scope & exchange rates
at constant scope & exchange rates
1. Including 100% of Private Banking in France (excluding PEL/CEL impacts), Italy, Belgium and Luxembourg
21Fixed Income Presentation - March 2021
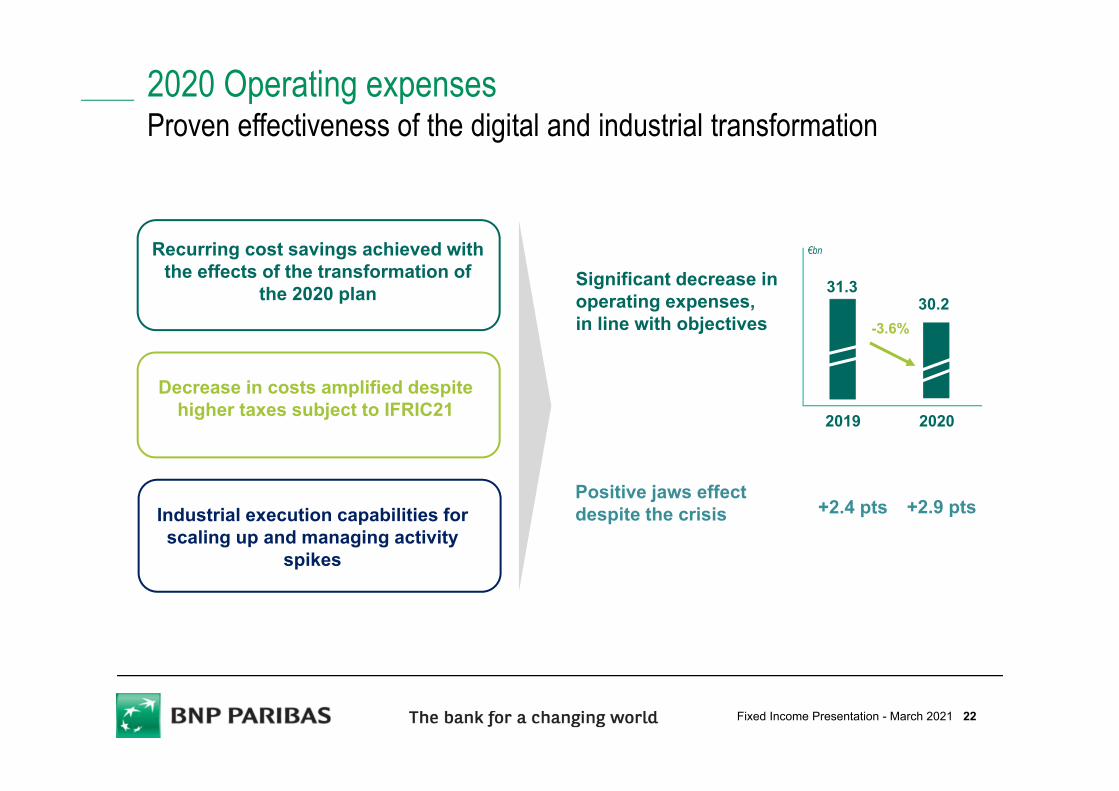
2020 Operating expenses Proven effectiveness of the digital and industrial transformation
Recurring cost savings achieved with the effects of the transformation of
the 2020 plan
Industrial execution capabilities for scaling up and managing activity
spikes
Significant decrease in operating expenses, in line with objectives
Decrease in costs amplified despite higher taxes subject to IFRIC21
+2.4 ptsPositive jaws effect despite the crisis
31.3
2019
-3.6%
2020
€bn
30.2
+2.9 pts
22Fixed Income Presentation - March 2021

-1.0%
10 741 10 568 10 507 10 117 8 663 8 920
Operating expenses of the Operating Divisions – 2020Effect of cost-saving measures
€m
Positive jaws effect in the operating divisions as a whole Domestic Markets: decrease in operating expenses – positive jaws effect in the specialised
businesses (+4.3 pts) and significant decrease in the networks (-2.7%)2
IFS: significant decrease in operating expenses – intensified cost-saving measures with thehealth crisis
CIB: increase in operating expenses in connection with business growth, contained due to cost-saving measures – very positive jaws effect
Operating divisions
2020
2019
DomesticMarkets1
InternationalFinancial Services CIB
-1.6% -3.7% +3.0%-1.6% at constant
scope & exchange rates
-0.1%at constant scope & exchange rates
+3.7%at constant scope & exchange rates
1. Including 100% of Private Banking in France (excluding PEL/CEL effects), Italy, Belgium and Luxembourg; 2. FRB, BNL bc and BRB
23Fixed Income Presentation - March 2021
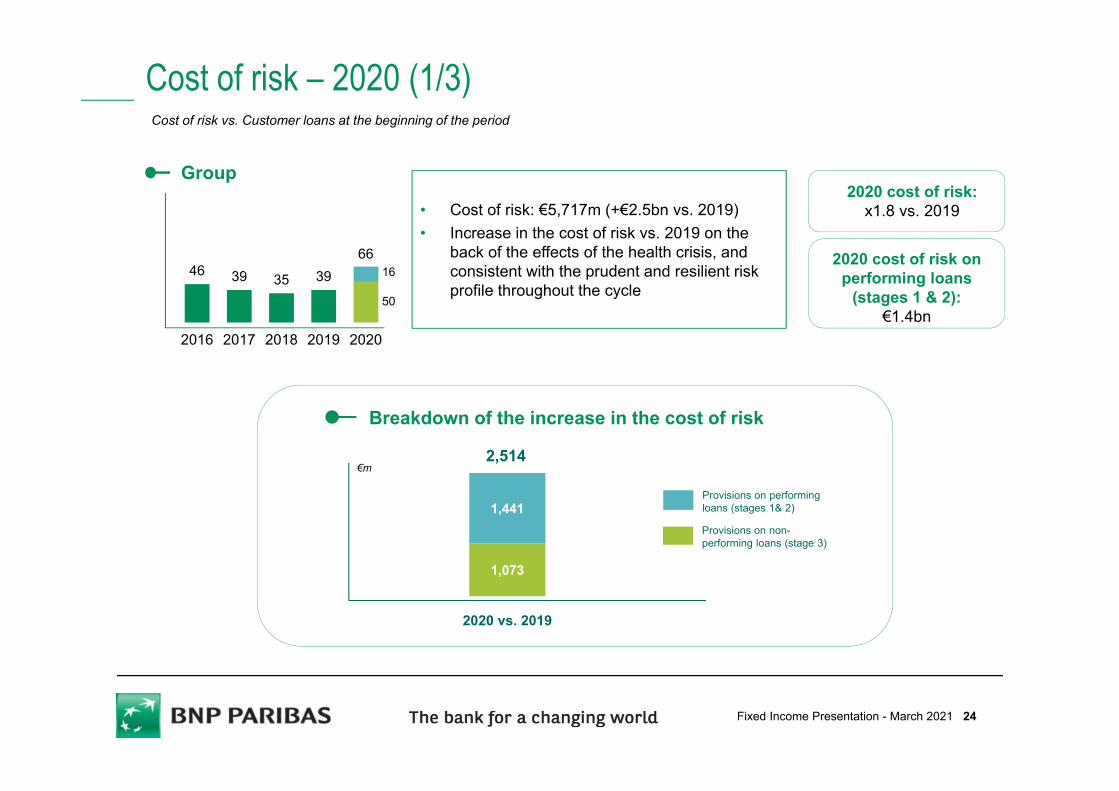
Cost of risk – 2020 (1/3)
• Cost of risk: €5,717m (+€2.5bn vs. 2019)• Increase in the cost of risk vs. 2019 on the
back of the effects of the health crisis, and consistent with the prudent and resilient risk profile throughout the cycle
46 39 35 3966
2016 2017 2018 2019 2020
Group
2020 cost of risk on performing loans
(stages 1 & 2): €1.4bn
2020 cost of risk: x1.8 vs. 2019
Cost of risk vs. Customer loans at the beginning of the period
2,514
Breakdown of the increase in the cost of risk
Provisions on performing loans (stages 1& 2)
Provisions on non-performing loans (stage 3)
1,073
1,441
2020 vs. 2019
€m
50
16
24Fixed Income Presentation - March 2021
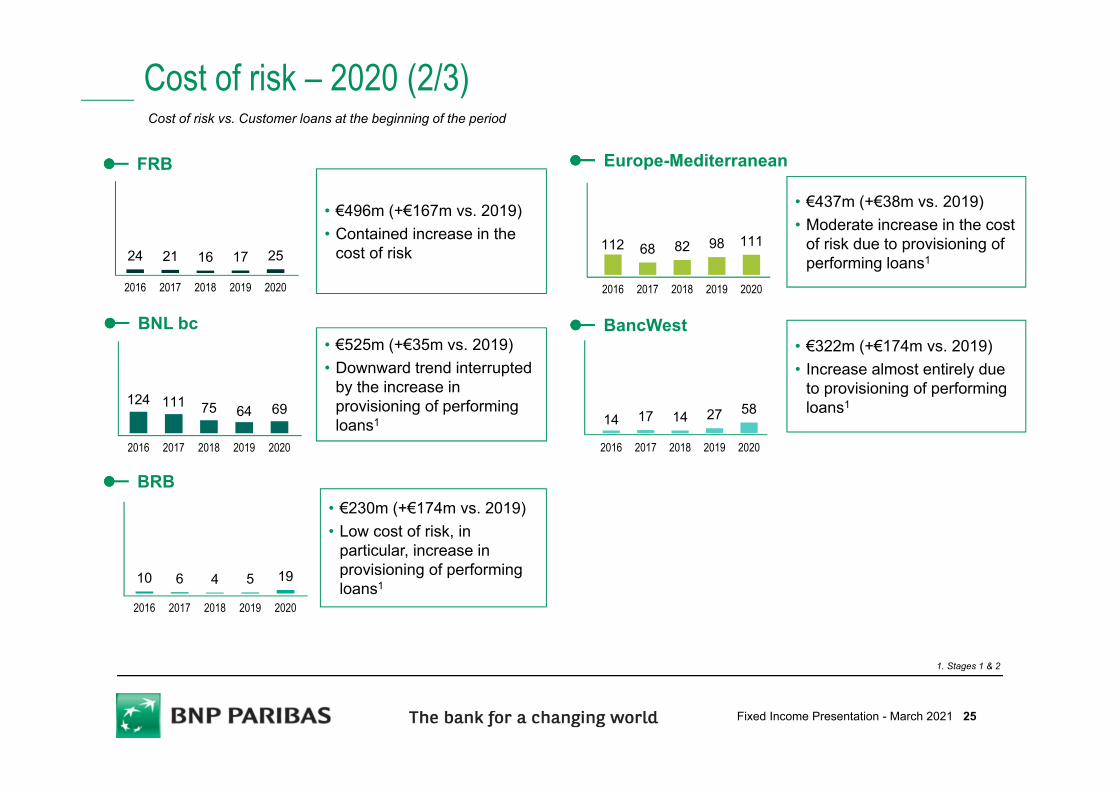
Cost of risk – 2020 (2/3)
• €496m (+€167m vs. 2019)• Contained increase in the
cost of risk24 21 16 17 25
2016 2017 2018 2019 2020
FRB
• €525m (+€35m vs. 2019)• Downward trend interrupted
by the increase in provisioning of performing loans1
124 111 75 64 69
2016 2017 2018 2019 2020
• €230m (+€174m vs. 2019)• Low cost of risk, in
particular, increase in provisioning of performing loans110 6 4 5 19
2016 2017 2018 2019 2020
112 68 82 98 111
2016 2017 2018 2019 2020
• €437m (+€38m vs. 2019)• Moderate increase in the cost
of risk due to provisioning of performing loans1
• €322m (+€174m vs. 2019)• Increase almost entirely due
to provisioning of performing loans1
14 17 14 27 58
2016 2017 2018 2019 2020
BNL bc
BRB
Europe-Mediterranean
BancWest
1. Stages 1 & 2
Cost of risk vs. Customer loans at the beginning of the period
25Fixed Income Presentation - March 2021
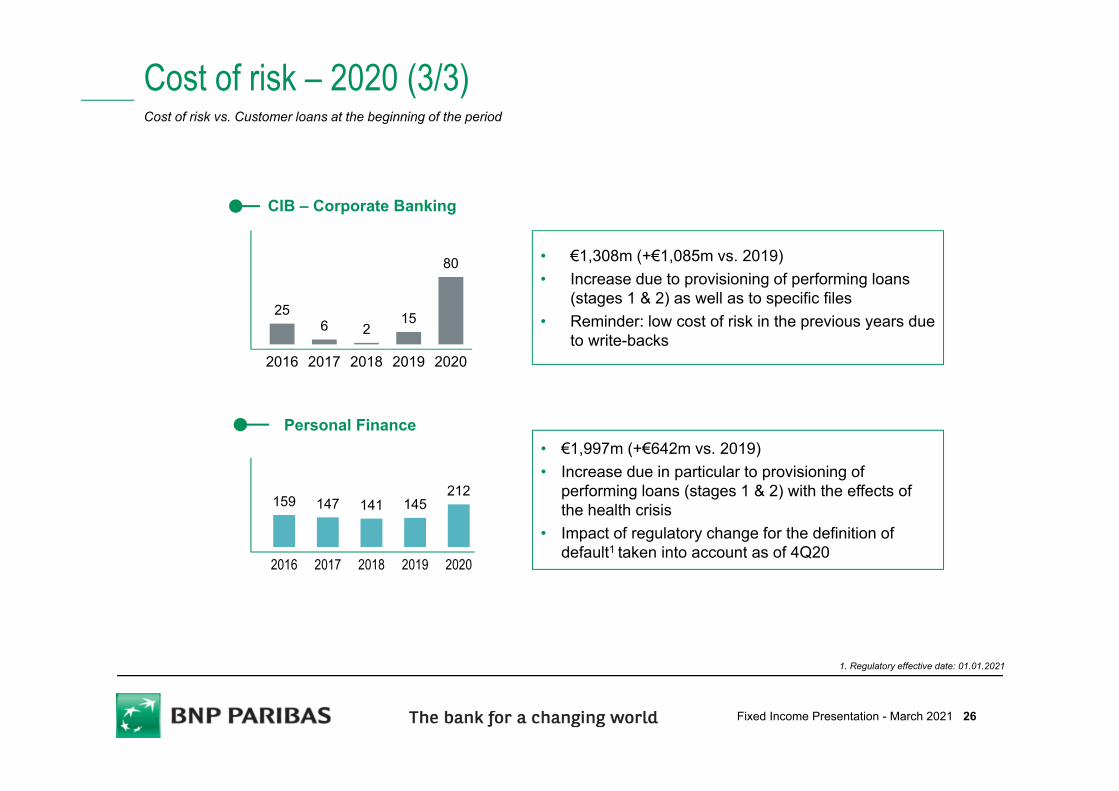
Cost of risk – 2020 (3/3)
159 147 141 145212
2016 2017 2018 2019 2020
Personal Finance
256 2
15
80
2016 2017 2018 2019 2020
CIB – Corporate Banking
• €1,997m (+€642m vs. 2019)• Increase due in particular to provisioning of
performing loans (stages 1 & 2) with the effects of the health crisis
• Impact of regulatory change for the definition of default1 taken into account as of 4Q20
• €1,308m (+€1,085m vs. 2019) • Increase due to provisioning of performing loans
(stages 1 & 2) as well as to specific files• Reminder: low cost of risk in the previous years due
to write-backs
Cost of risk vs. Customer loans at the beginning of the period
1. Regulatory effective date: 01.01.2021
26Fixed Income Presentation - March 2021
A diversified modelA prudent risk profile with no sector concentration
Highly diversified by sector: no sector represents more than 5% of the total portfolio
High selectivity at origination
Limited exposures to sectors considered as sensitive
Aircraft: 0.7% of total gross commitments1
• More than 40% of counterparties rated Investment Grade2
• 3.3% of outstandings classified as doubtful• Activities collateralised to almost 70%• Benefiting from the amplified “Originate & distribute”
strategy
Hotels, Tourism and Leisure: 0.7% of total gross commitments1
• 35% of counterparties rated Investment Grade2
• 3.4% of outstandings classified as doubtful
Non-food retail (excl. e-commerce): 0.6% of total gross commitments1
• Almost 60% of counterparties rated Investment Grade2
• 3.9% of outstandings classified as doubtful
Transport and storage (excluding shipping): 2.8% of total gross commitments1
• Almost 80% of counterparties rated Investment Grade2
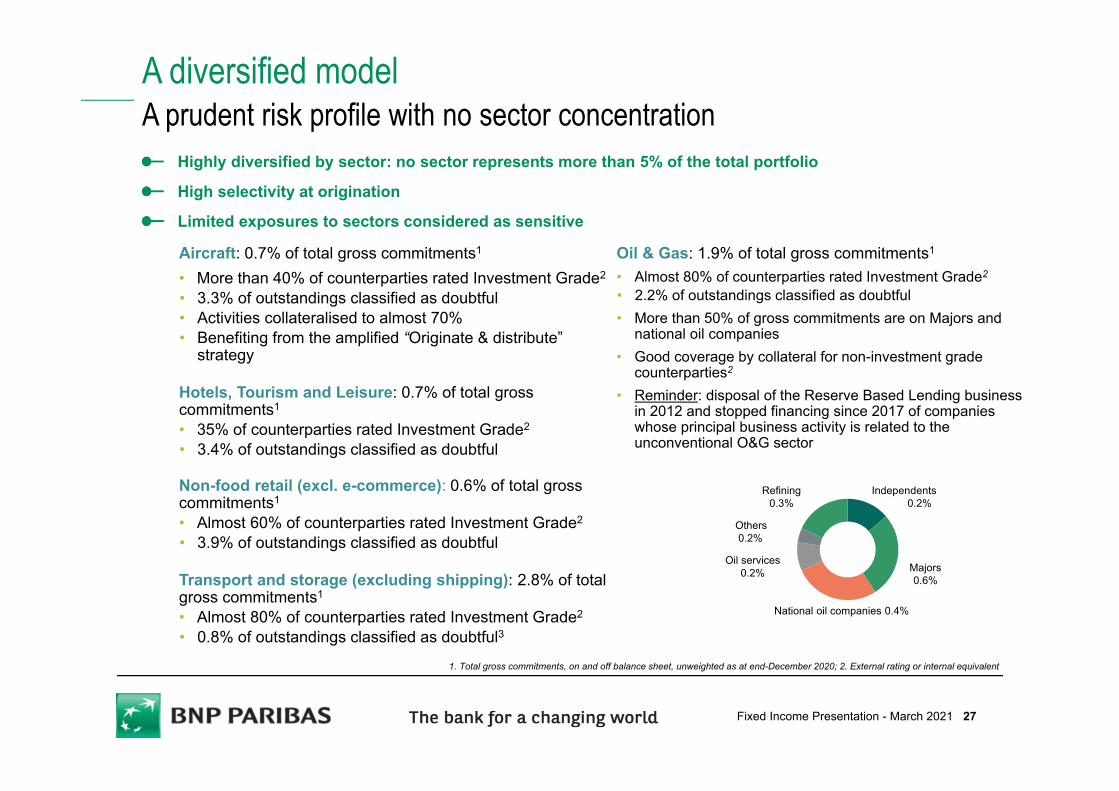
• 0.8% of outstandings classified as doubtful3National oil companies 0.4%
Refining 0.3%
Others0.2%
Independents0.2%
Majors0.6%
Oil services 0.2%
Oil & Gas: 1.9% of total gross commitments1
• Almost 80% of counterparties rated Investment Grade2
• 2.2% of outstandings classified as doubtful • More than 50% of gross commitments are on Majors and
national oil companies• Good coverage by collateral for non-investment grade
counterparties2
• Reminder: disposal of the Reserve Based Lending business in 2012 and stopped financing since 2017 of companies whose principal business activity is related to the unconventional O&G sector
1. Total gross commitments, on and off balance sheet, unweighted as at end-December 2020; 2. External rating or internal equivalent
27Fixed Income Presentation - March 2021
An ambitious policy in sustainable financeLeadership ambitions: strategic positioning
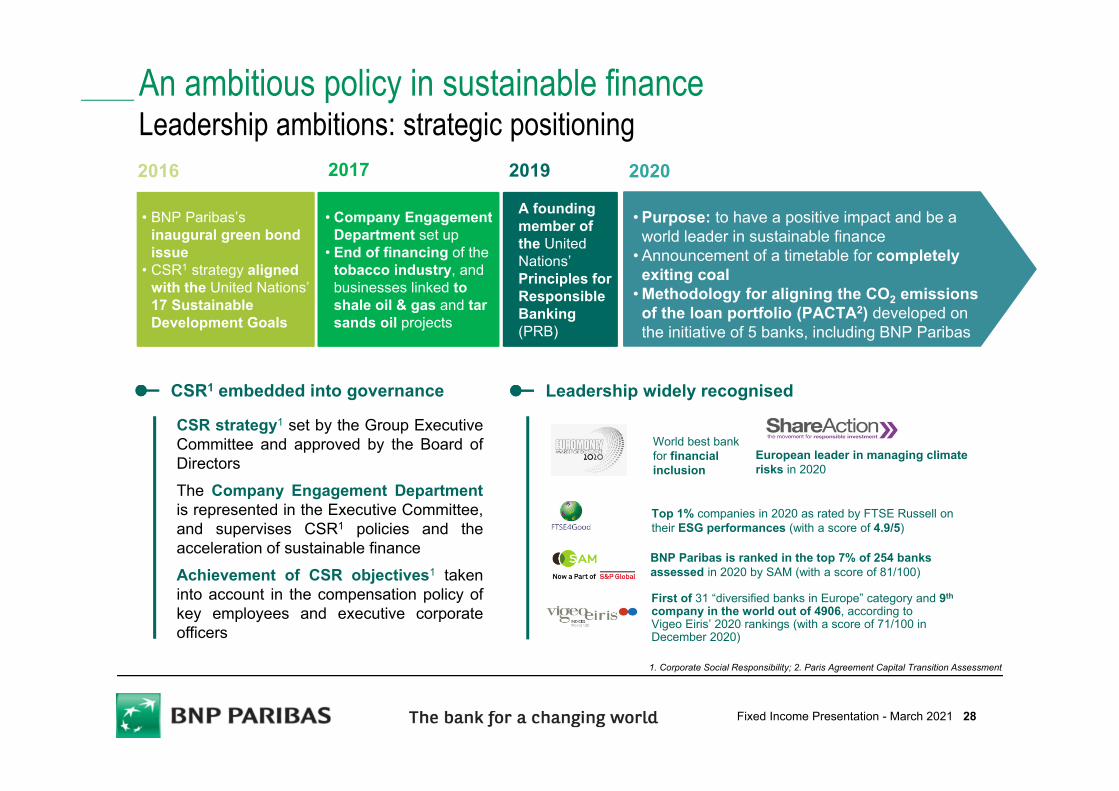
CSR strategy1 set by the Group ExecutiveCommittee and approved by the Board ofDirectorsThe Company Engagement Departmentis represented in the Executive Committee,and supervises CSR1 policies and theacceleration of sustainable financeAchievement of CSR objectives1 takeninto account in the compensation policy ofkey employees and executive corporateofficers
BNP Paribas is ranked in the top 7% of 254 banks assessed in 2020 by SAM (with a score of 81/100)
First of 31 “diversified banks in Europe” category and 9th
company in the world out of 4906, according to Vigeo Eiris’ 2020 rankings (with a score of 71/100 in December 2020)
European leader in managing climate risks in 2020
A founding member of the United Nations’ Principles for Responsible Banking (PRB)
• BNP Paribas’s inaugural green bond issue
• CSR1 strategy aligned with the United Nations’ 17 Sustainable Development Goals
• Company Engagement Department set up
• End of financing of the tobacco industry, andbusinesses linked to shale oil & gas and tar sands oil projects
Top 1% companies in 2020 as rated by FTSE Russell on their ESG performances (with a score of 4.9/5)
World best bank for financial inclusion
2016 2017 2019 2020
CSR1 embedded into governance Leadership widely recognised
• Purpose: to have a positive impact and be a world leader in sustainable finance
• Announcement of a timetable for completely exiting coal
• Methodology for aligning the CO2 emissions of the loan portfolio (PACTA2) developed on the initiative of 5 banks, including BNP Paribas
1. Corporate Social Responsibility; 2. Paris Agreement Capital Transition Assessment
28Fixed Income Presentation - March 2021
An ambitious policy in sustainable financeStrong and tangible achievements in sustainable finance
1. Corporate Social Responsibility; 2. Source: Bloomberg; 3. Sources: Bloomberg, Global Pandemic Bonds as at 31.12.2020; 4. Shareaction’s « Point of No returns » ranking , March 2020
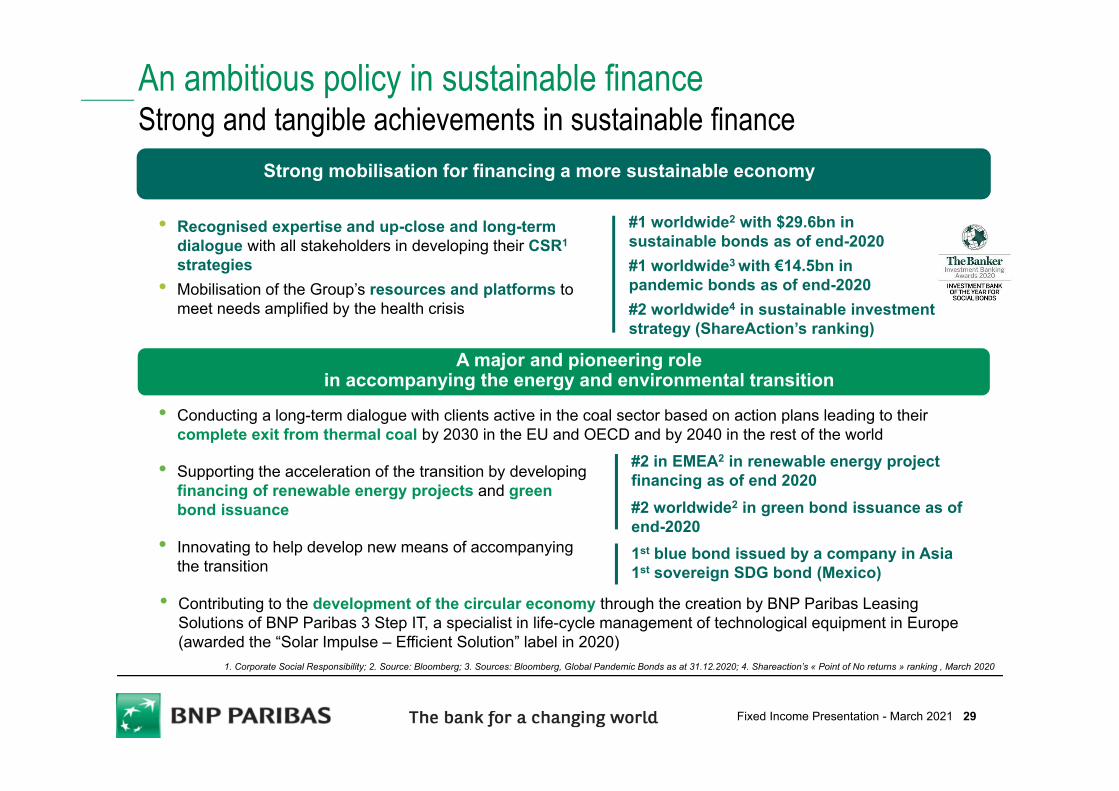
• Recognised expertise and up-close and long-term dialogue with all stakeholders in developing their CSR1
strategies• Mobilisation of the Group’s resources and platforms to
meet needs amplified by the health crisis
• Conducting a long-term dialogue with clients active in the coal sector based on action plans leading to their complete exit from thermal coal by 2030 in the EU and OECD and by 2040 in the rest of the world
#1 worldwide2 with $29.6bn in sustainable bonds as of end-2020 #1 worldwide3 with €14.5bn in pandemic bonds as of end-2020#2 worldwide4 in sustainable investment strategy (ShareAction’s ranking)
A major and pioneering role in accompanying the energy and environmental transition
• Supporting the acceleration of the transition by developing financing of renewable energy projects and green bond issuance
• Innovating to help develop new means of accompanying the transition
#2 in EMEA2 in renewable energy project financing as of end 2020 #2 worldwide2 in green bond issuance as of end-20201st blue bond issued by a company in Asia 1st sovereign SDG bond (Mexico)
• Contributing to the development of the circular economy through the creation by BNP Paribas Leasing Solutions of BNP Paribas 3 Step IT, a specialist in life-cycle management of technological equipment in Europe (awarded the “Solar Impulse – Efficient Solution” label in 2020)
Strong mobilisation for financing a more sustainable economy
29Fixed Income Presentation - March 2021
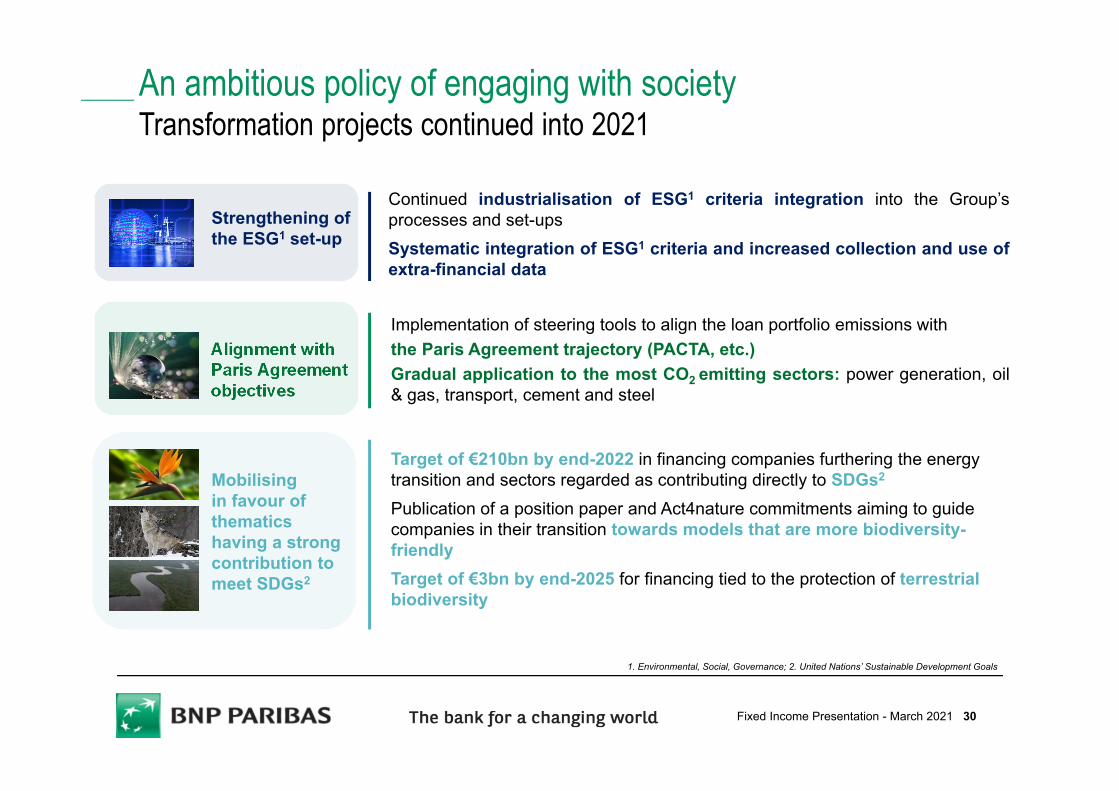
Alignment with Paris Agreement objectives
Mobilising in favour of thematicshaving a strong contribution to meet SDGs2
Strengthening of the ESG1 set-up
Continued industrialisation of ESG1 criteria integration into the Group’sprocesses and set-upsSystematic integration of ESG1 criteria and increased collection and use ofextra-financial data
An ambitious policy of engaging with societyTransformation projects continued into 2021
Target of €210bn by end-2022 in financing companies furthering the energy transition and sectors regarded as contributing directly to SDGs2
Publication of a position paper and Act4nature commitments aiming to guide companies in their transition towards models that are more biodiversity-friendly Target of €3bn by end-2025 for financing tied to the protection of terrestrial biodiversity
Implementation of steering tools to align the loan portfolio emissions withthe Paris Agreement trajectory (PACTA, etc.)Gradual application to the most CO2 emitting sectors: power generation, oil& gas, transport, cement and steel
1. Environmental, Social, Governance; 2. United Nations’ Sustainable Development Goals
30Fixed Income Presentation - March 2021

Revenues2: €15,477m (-2.1% vs. 2019)
• Good resilience in the networks despite the impact of low interest rates, which was partly offset by higher loan volumes
• Very sharp increase at Personal Investors (+36% vs. 2019), in particular at Consorsbank in Germany
1. Customers with at least one connection to the mobile app per month (on average in 4Q20) - scope: individual, small business and private banking customers of DM networks or digital banks (including Germany, Austria and Nickel); 2. Including 100% of Private Banking, excluding PEL/CEL effects; 3. Including 100% of Private Banking, excluding PEL/CEL effects; 4. FRB, BRB, BNL bc and including 100% of Private Banking
Increased activity• Loans: +5.4% vs. 2019, increase in all business lines, growth in corporate loans on
the back of the support for the economy, and good momentum in particular inmortgage loans
• Deposits: +11.6% vs. 2019, increase driven by the effects of the health crisis• Private Banking: solid net asset inflows (€6.1bn, including €4.9bn in external inflows)
Mobilisation at the service of the economy, with in particular the implementationof state-guaranteed loans, notably in France and Italy
Continued acceleration in the use of digital tools• >6.1 million active customers on the mobile apps1 (+20.1% vs. 4Q19)• Close to 4.6 million daily connections to the mobile apps on average (+41.5% vs.
4Q19)• Strong development of Nickel (+27% in number of accounts opened vs. 31.12.19)
and Lyf Pay (customer numbers up 30% vs. 2019)
Domestic Markets – 2020Strong support for the economy and gains in operating efficiency
174 189
75 76111 11552 54
2019 2020
Other DMs
FRB
BNL bc
Loans€bn
BRB
411 434+5.4%
Pre-tax income3: €3,271m (-13.9% vs. 2019)
• Increase in the cost of risk, due in particular to the effects of the health crisis
Operating expenses2: €10,568m (-1.6% vs. 2019)
• 2.7% decrease in the networks4
• 3.4% increase in the specialised businesses in connection with their growth
-2.7%€m
2019 2020
8,882 8,645
Operating expenses at the retail banking networks4
31Fixed Income Presentation - March 2021
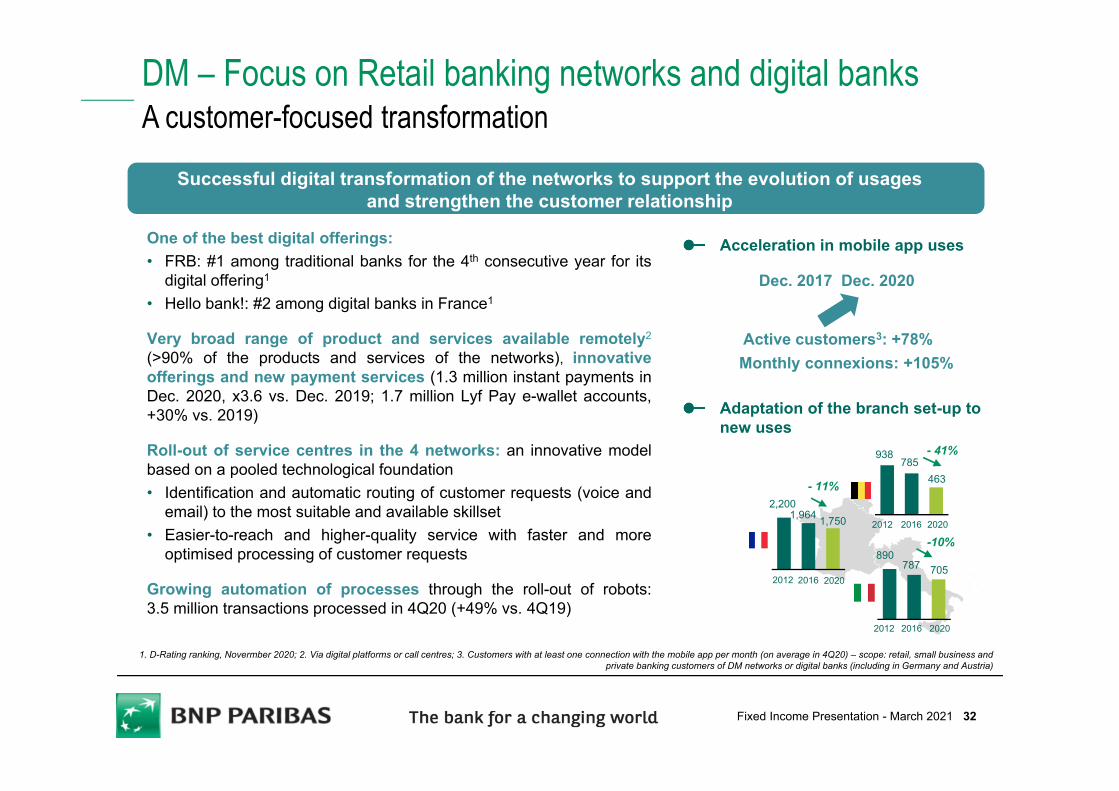
One of the best digital offerings:• FRB: #1 among traditional banks for the 4th consecutive year for its
digital offering1
• Hello bank!: #2 among digital banks in France1
Very broad range of product and services available remotely2
(>90% of the products and services of the networks), innovativeofferings and new payment services (1.3 million instant payments inDec. 2020, x3.6 vs. Dec. 2019; 1.7 million Lyf Pay e-wallet accounts,+30% vs. 2019)
Roll-out of service centres in the 4 networks: an innovative modelbased on a pooled technological foundation• Identification and automatic routing of customer requests (voice and
email) to the most suitable and available skillset• Easier-to-reach and higher-quality service with faster and more
optimised processing of customer requests
Growing automation of processes through the roll-out of robots:3.5 million transactions processed in 4Q20 (+49% vs. 4Q19)
1. D-Rating ranking, Novermber 2020; 2. Via digital platforms or call centres; 3. Customers with at least one connection with the mobile app per month (on average in 4Q20) – scope: retail, small business and private banking customers of DM networks or digital banks (including in Germany and Austria)
Acceleration in mobile app uses
Active customers3: +78%
1,7501,964
- 11%
785463
705
2016 2020
787
-10%
2012
890
2016 20202012
2016 20202012
938
2,200
- 41%
Adaptation of the branch set-up to new uses
Dec. 2017 Dec. 2020
Monthly connexions: +105%
Successful digital transformation of the networks to support the evolution of usages and strengthen the customer relationship
DM – Focus on Retail banking networks and digital banksA customer-focused transformation
32Fixed Income Presentation - March 2021
DM – Focus on Retail banking networks and digital banksA customer-focused transformation
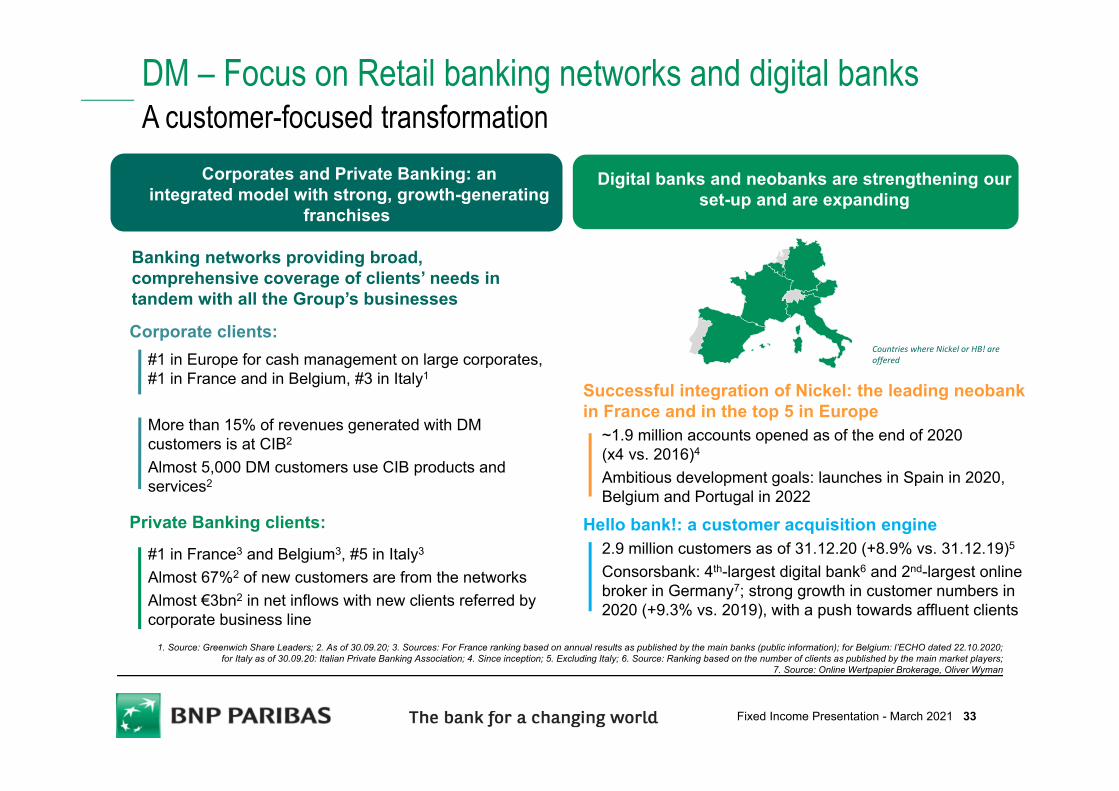
Successful integration of Nickel: the leading neobank in France and in the top 5 in Europe
~1.9 million accounts opened as of the end of 2020 (x4 vs. 2016)4
Ambitious development goals: launches in Spain in 2020, Belgium and Portugal in 2022
Hello bank!: a customer acquisition engine2.9 million customers as of 31.12.20 (+8.9% vs. 31.12.19)5
Consorsbank: 4th-largest digital bank6 and 2nd-largest online broker in Germany7; strong growth in customer numbers in 2020 (+9.3% vs. 2019), with a push towards affluent clients
Banking networks providing broad, comprehensive coverage of clients’ needs in tandem with all the Group’s businesses
1. Source: Greenwich Share Leaders; 2. As of 30.09.20; 3. Sources: For France ranking based on annual results as published by the main banks (public information); for Belgium: l’ECHO dated 22.10.2020; for Italy as of 30.09.20: Italian Private Banking Association; 4. Since inception; 5. Excluding Italy; 6. Source: Ranking based on the number of clients as published by the main market players;
7. Source: Online Wertpapier Brokerage, Oliver Wyman
Countries where Nickel or HB! are offered
Corporates and Private Banking: anintegrated model with strong, growth-generating
franchises
Digital banks and neobanks are strengthening our set-up and are expanding
Corporate clients: #1 in Europe for cash management on large corporates, #1 in France and in Belgium, #3 in Italy1
More than 15% of revenues generated with DM customers is at CIB2
Almost 5,000 DM customers use CIB products and services2
Private Banking clients:
#1 in France3 and Belgium3, #5 in Italy3
Almost 67%2 of new customers are from the networksAlmost €3bn2 in net inflows with new clients referred by corporate business line
33Fixed Income Presentation - March 2021
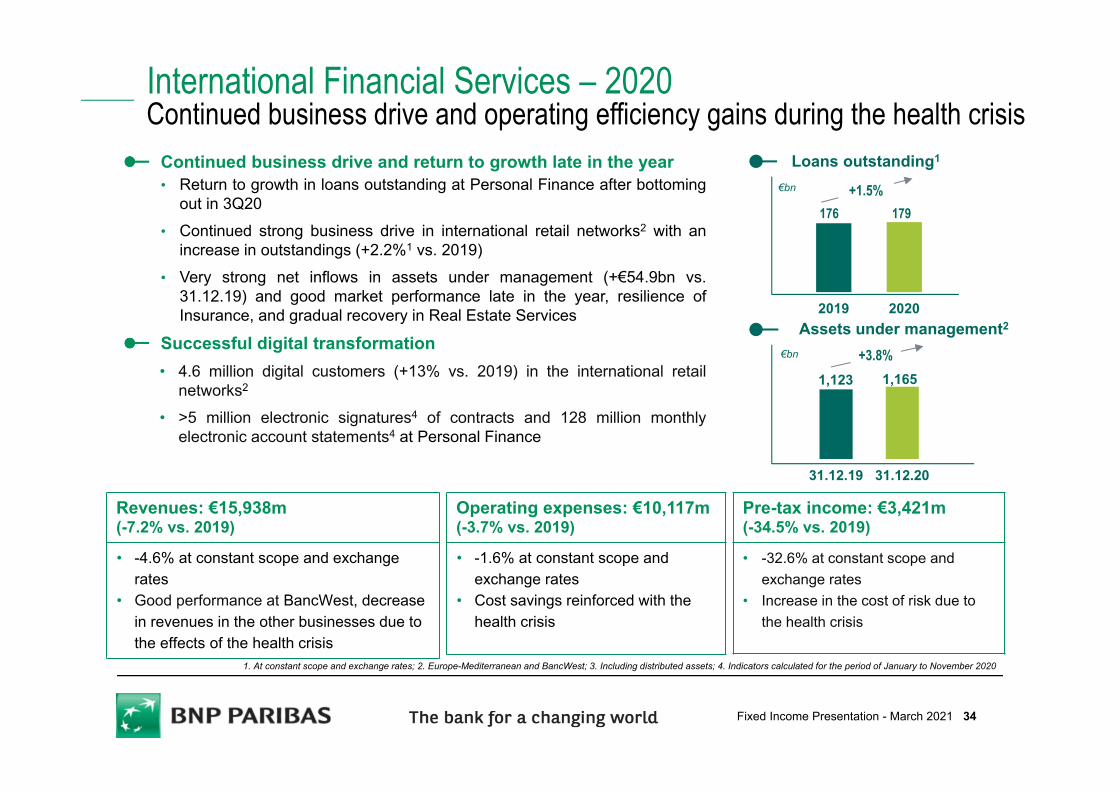
Revenues: €15,938m(-7.2% vs. 2019)
• -4.6% at constant scope and exchange rates
• Good performance at BancWest, decrease in revenues in the other businesses due to the effects of the health crisis
Pre-tax income: €3,421m (-34.5% vs. 2019)
• -32.6% at constant scope and exchange rates
• Increase in the cost of risk due to the health crisis
Operating expenses: €10,117m (-3.7% vs. 2019)
• -1.6% at constant scope and exchange rates
• Cost savings reinforced with the health crisis
Continued business drive and return to growth late in the year• Return to growth in loans outstanding at Personal Finance after bottoming
out in 3Q20• Continued strong business drive in international retail networks2 with an
increase in outstandings (+2.2%1 vs. 2019)• Very strong net inflows in assets under management (+€54.9bn vs.
31.12.19) and good market performance late in the year, resilience ofInsurance, and gradual recovery in Real Estate Services
Successful digital transformation• 4.6 million digital customers (+13% vs. 2019) in the international retail
networks2
• >5 million electronic signatures4 of contracts and 128 million monthlyelectronic account statements4 at Personal Finance
International Financial Services – 2020Continued business drive and operating efficiency gains during the health crisis
2019 2020
Loans outstanding1
€bn +1.5%
31.12.19 31.12.20
1,1651,123
Assets under management2
€bn +3.8%
179176
1. At constant scope and exchange rates; 2. Europe-Mediterranean and BancWest; 3. Including distributed assets; 4. Indicators calculated for the period of January to November 2020
34Fixed Income Presentation - March 2021
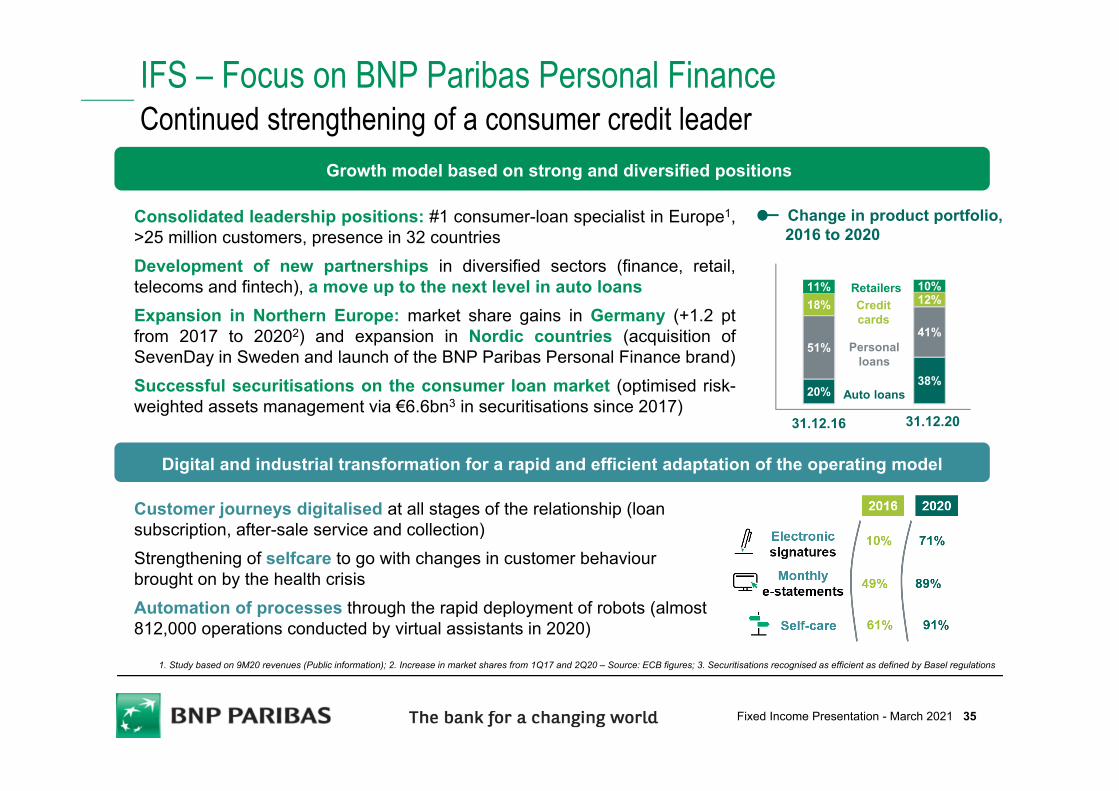
20%38%
51%41%
18% 12%11% 10%Retailers
IFS – Focus on BNP Paribas Personal FinanceContinued strengthening of a consumer credit leader
Consolidated leadership positions: #1 consumer-loan specialist in Europe1,>25 million customers, presence in 32 countriesDevelopment of new partnerships in diversified sectors (finance, retail,telecoms and fintech), a move up to the next level in auto loansExpansion in Northern Europe: market share gains in Germany (+1.2 ptfrom 2017 to 20202) and expansion in Nordic countries (acquisition ofSevenDay in Sweden and launch of the BNP Paribas Personal Finance brand)Successful securitisations on the consumer loan market (optimised risk-weighted assets management via €6.6bn3 in securitisations since 2017)
Customer journeys digitalised at all stages of the relationship (loan subscription, after-sale service and collection)Strengthening of selfcare to go with changes in customer behaviour brought on by the health crisisAutomation of processes through the rapid deployment of robots (almost 812,000 operations conducted by virtual assistants in 2020)
Change in product portfolio, 2016 to 2020
10%Credit cards
Personal loans
Auto loans
31.12.16 31.12.20
1. Study based on 9M20 revenues (Public information); 2. Increase in market shares from 1Q17 and 2Q20 – Source: ECB figures; 3. Securitisations recognised as efficient as defined by Basel regulations
Growth model based on strong and diversified positions
Digital and industrial transformation for a rapid and efficient adaptation of the operating model
35Fixed Income Presentation - March 2021
Leadership in socially responsible investment
Strong improvement in performances
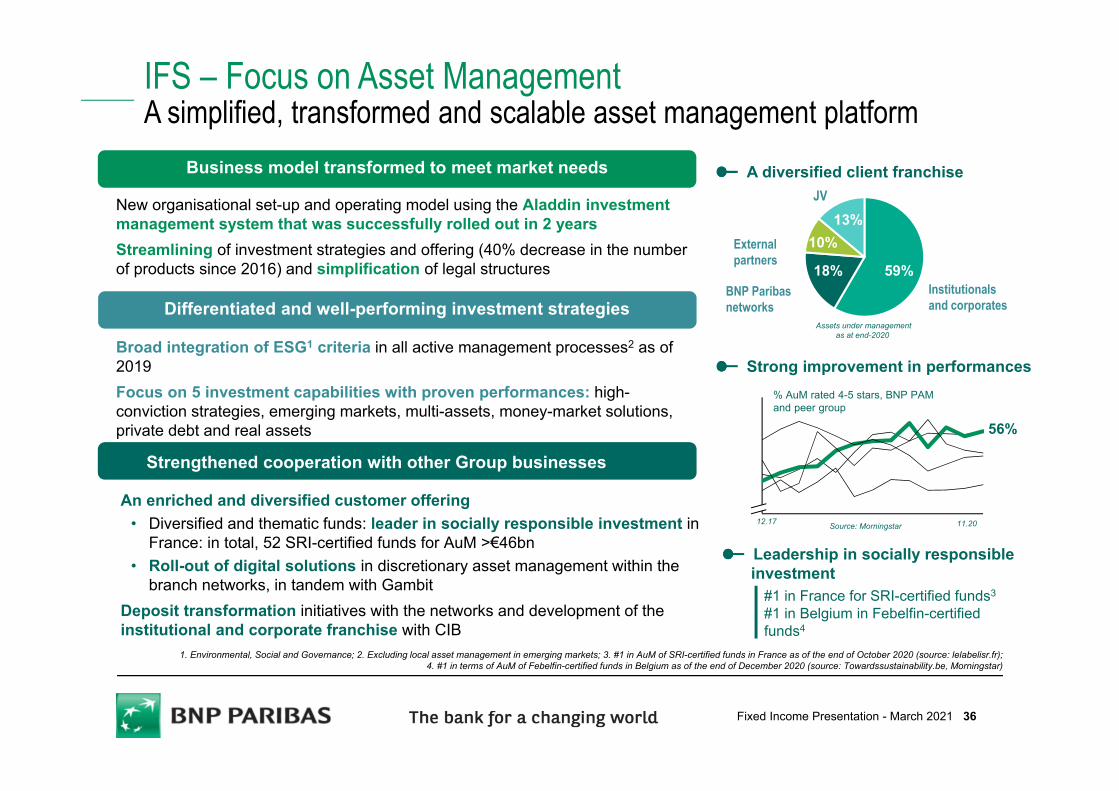
New organisational set-up and operating model using the Aladdin investment management system that was successfully rolled out in 2 yearsStreamlining of investment strategies and offering (40% decrease in the number of products since 2016) and simplification of legal structures
An enriched and diversified customer offering • Diversified and thematic funds: leader in socially responsible investment in
France: in total, 52 SRI-certified funds for AuM >€46bn • Roll-out of digital solutions in discretionary asset management within the
branch networks, in tandem with Gambit Deposit transformation initiatives with the networks and development of the institutional and corporate franchise with CIB
IFS – Focus on Asset ManagementA simplified, transformed and scalable asset management platform
A diversified client franchise
59%18%
10%13%
Institutionalsand corporates
BNP Paribas networks
External partners
JV
% AuM rated 4-5 stars, BNP PAM and peer group
Source: Morningstar
1. Environmental, Social and Governance; 2. Excluding local asset management in emerging markets; 3. #1 in AuM of SRI-certified funds in France as of the end of October 2020 (source: lelabelisr.fr); 4. #1 in terms of AuM of Febelfin-certified funds in Belgium as of the end of December 2020 (source: Towardssustainability.be, Morningstar)
Assets under management as at end-2020
Broad integration of ESG1 criteria in all active management processes2 as of 2019Focus on 5 investment capabilities with proven performances: high-conviction strategies, emerging markets, multi-assets, money-market solutions, private debt and real assets
Strengthened cooperation with other Group businesses
Differentiated and well-performing investment strategies
Business model transformed to meet market needs
#1 in France for SRI-certified funds3
#1 in Belgium in Febelfin-certifiedfunds4
56%
12.17 11.20
36Fixed Income Presentation - March 2021
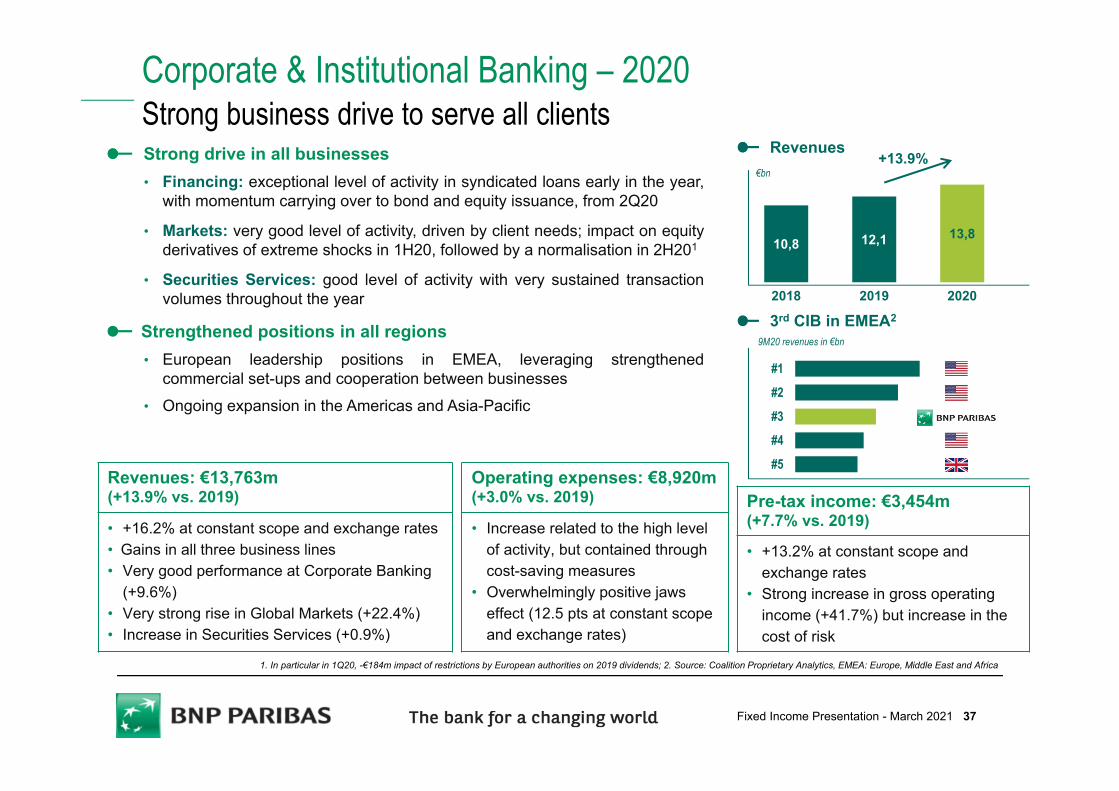
Pre-tax income: €3,454m (+7.7% vs. 2019)
• +13.2% at constant scope and exchange rates
• Strong increase in gross operating income (+41.7%) but increase in the cost of risk
Strong drive in all businesses• Financing: exceptional level of activity in syndicated loans early in the year,
with momentum carrying over to bond and equity issuance, from 2Q20
• Markets: very good level of activity, driven by client needs; impact on equityderivatives of extreme shocks in 1H20, followed by a normalisation in 2H201
• Securities Services: good level of activity with very sustained transactionvolumes throughout the year
Strengthened positions in all regions• European leadership positions in EMEA, leveraging strengthened
commercial set-ups and cooperation between businesses• Ongoing expansion in the Americas and Asia-Pacific
1. In particular in 1Q20, -€184m impact of restrictions by European authorities on 2019 dividends; 2. Source: Coalition Proprietary Analytics, EMEA: Europe, Middle East and Africa
Corporate & Institutional Banking – 2020Strong business drive to serve all clients
10,8 12,1 13,8
2018 2019 2020
Revenues€bn
+13.9%
Revenues: €13,763m (+13.9% vs. 2019)
• +16.2% at constant scope and exchange rates• Gains in all three business lines• Very good performance at Corporate Banking
(+9.6%)• Very strong rise in Global Markets (+22.4%) • Increase in Securities Services (+0.9%)
Operating expenses: €8,920m (+3.0% vs. 2019)
• Increase related to the high level of activity, but contained through cost-saving measures
• Overwhelmingly positive jaws effect (12.5 pts at constant scope and exchange rates)
#5
#4
#3
#2
#1
9M20 revenues in €bn
3rd CIB in EMEA2
37Fixed Income Presentation - March 2021
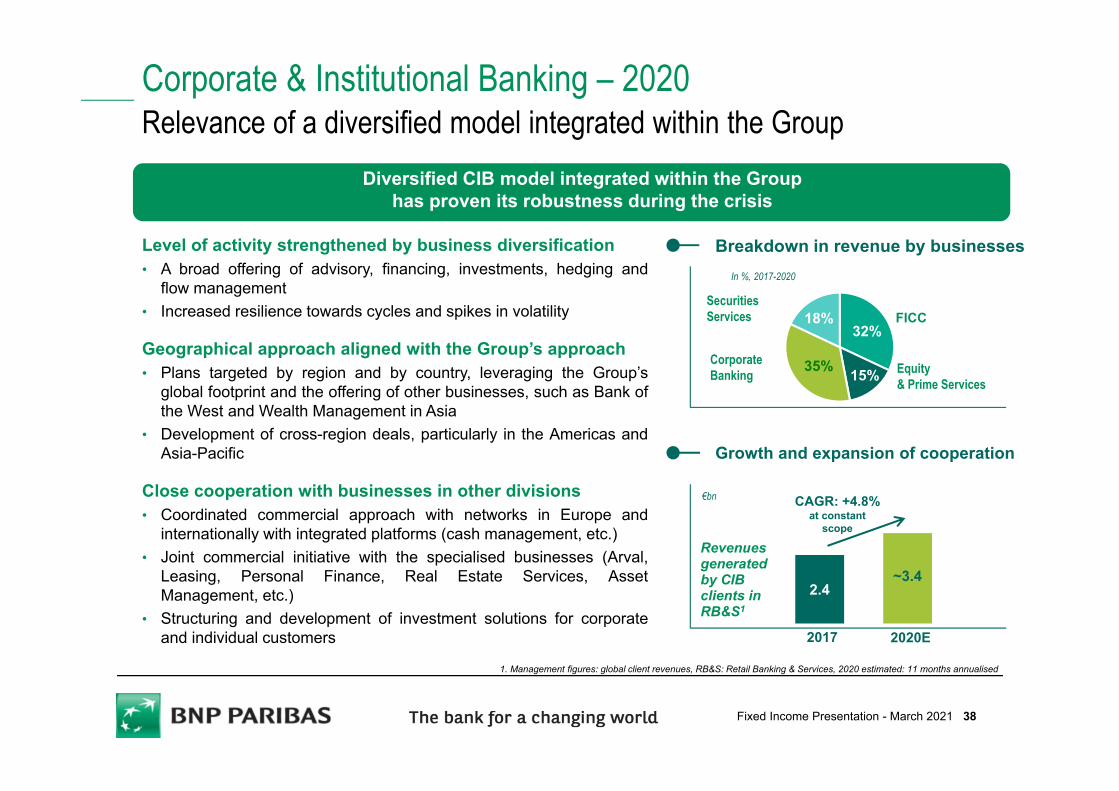
2.4~3.4
Corporate & Institutional Banking – 2020Relevance of a diversified model integrated within the Group
Level of activity strengthened by business diversification• A broad offering of advisory, financing, investments, hedging and
flow management• Increased resilience towards cycles and spikes in volatility
Geographical approach aligned with the Group’s approach• Plans targeted by region and by country, leveraging the Group’s
global footprint and the offering of other businesses, such as Bank ofthe West and Wealth Management in Asia
• Development of cross-region deals, particularly in the Americas andAsia-Pacific
Close cooperation with businesses in other divisions• Coordinated commercial approach with networks in Europe and
internationally with integrated platforms (cash management, etc.)• Joint commercial initiative with the specialised businesses (Arval,
Leasing, Personal Finance, Real Estate Services, AssetManagement, etc.)
• Structuring and development of investment solutions for corporateand individual customers
Growth and expansion of cooperation
2017 2020E
Revenues generated by CIB clients in RB&S1
32%
15%35%
18%
Corporate Banking Equity
& Prime Services
SecuritiesServices FICC
Breakdown in revenue by businessesIn %, 2017-2020
1. Management figures: global client revenues, RB&S: Retail Banking & Services, 2020 estimated: 11 months annualised
€bn CAGR: +4.8% at constant
scope
Diversified CIB model integrated within the Grouphas proven its robustness during the crisis
38Fixed Income Presentation - March 2021
15
20
25
January December
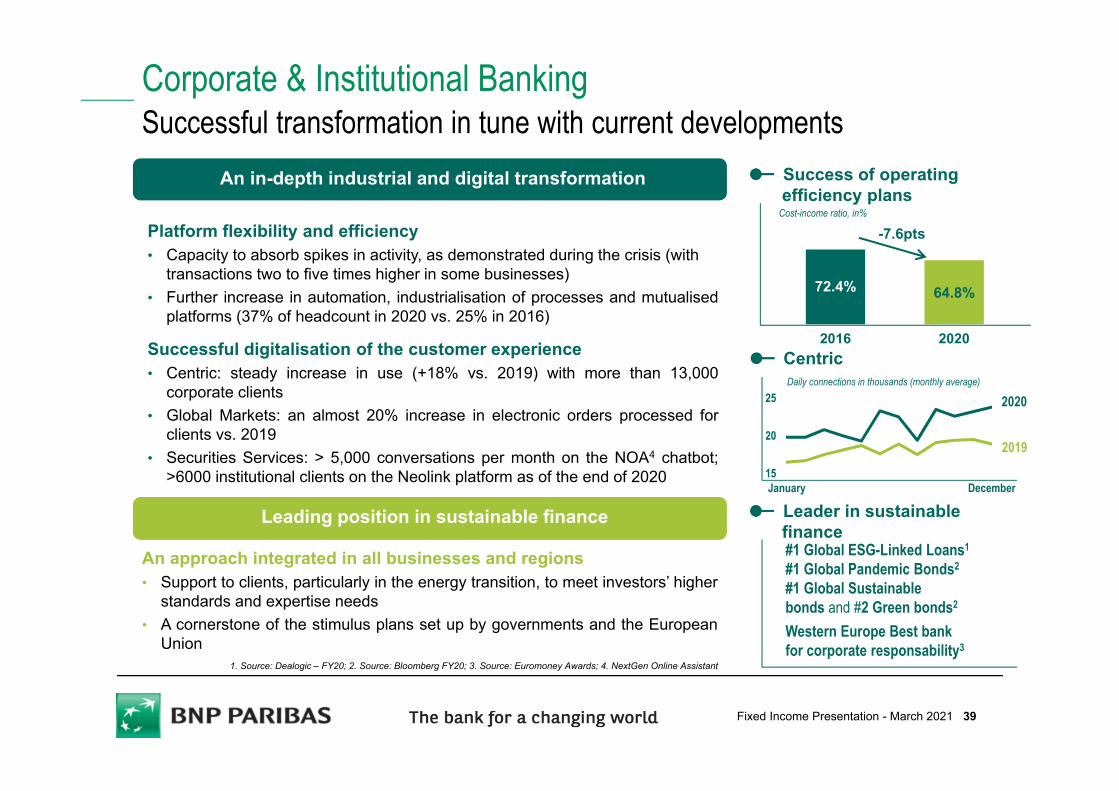
Platform flexibility and efficiency• Capacity to absorb spikes in activity, as demonstrated during the crisis (with
transactions two to five times higher in some businesses)• Further increase in automation, industrialisation of processes and mutualised
platforms (37% of headcount in 2020 vs. 25% in 2016)
Successful digitalisation of the customer experience• Centric: steady increase in use (+18% vs. 2019) with more than 13,000
corporate clients• Global Markets: an almost 20% increase in electronic orders processed for
clients vs. 2019• Securities Services: > 5,000 conversations per month on the NOA4 chatbot;
>6000 institutional clients on the Neolink platform as of the end of 2020
Corporate & Institutional BankingSuccessful transformation in tune with current developments
An approach integrated in all businesses and regions• Support to clients, particularly in the energy transition, to meet investors’ higher
standards and expertise needs• A cornerstone of the stimulus plans set up by governments and the European
Union
2020
2019
Daily connections in thousands (monthly average)
72.4% 64.8%
2016 2020
Success of operating efficiency plans
Cost-income ratio, in%
-7.6pts
Centric
1. Source: Dealogic – FY20; 2. Source: Bloomberg FY20; 3. Source: Euromoney Awards; 4. NextGen Online Assistant
Leader in sustainable finance#1 Global ESG-Linked Loans1
#1 Global Pandemic Bonds2
#1 Global Sustainablebonds and #2 Green bonds2
Western Europe Best bank for corporate responsability3
An in-depth industrial and digital transformation
Leading position in sustainable finance
39Fixed Income Presentation - March 2021
Conclusion
Resilience confirmed 2020 net income1: €7,067m (-13.5% vs. 2019)
Reinforced and recognised leadership in sustainable finance Ambitious policy of commitment towards society
Strong mobilisation to serve the economy and society
Key contribution from digital and industrial transformation
1. Group share
Preparation of a new strategic plan for 2022-2025
Diversified and integrated model to support business dynamic in all phases of the crisis
Employee commitment and quick operational adjustment to the health crisis
40Fixed Income Presentation - March 2021
2020 RESULTS
STRONG SOLVENCY & CAPITAL GENERATION CAPACITY
APPENDIX
41Fixed Income Presentation - March 2021
FOCUS ON FUNDING
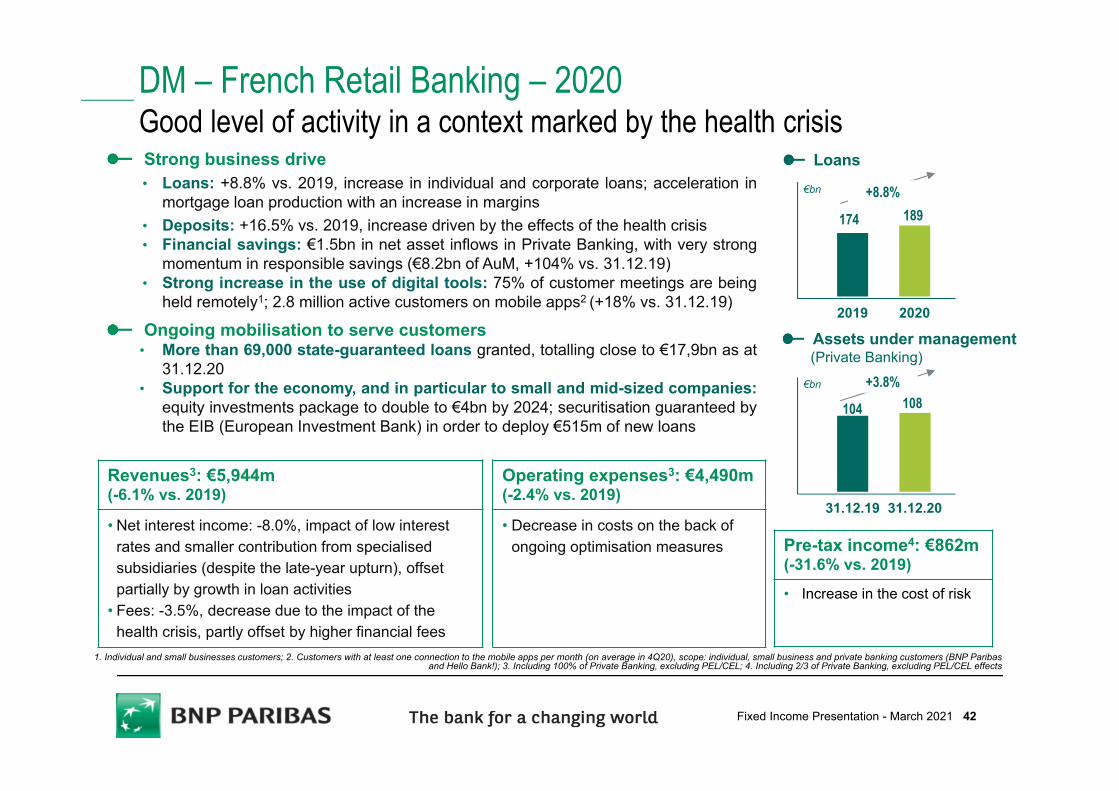
Revenues3: €5,944m(-6.1% vs. 2019)
• Net interest income: -8.0%, impact of low interest rates and smaller contribution from specialised subsidiaries (despite the late-year upturn), offset partially by growth in loan activities
• Fees: -3.5%, decrease due to the impact of the health crisis, partly offset by higher financial fees
2019 2020
DM – French Retail Banking – 2020Good level of activity in a context marked by the health crisisStrong business drive• Loans: +8.8% vs. 2019, increase in individual and corporate loans; acceleration in
mortgage loan production with an increase in margins• Deposits: +16.5% vs. 2019, increase driven by the effects of the health crisis• Financial savings: €1.5bn in net asset inflows in Private Banking, with very strong
momentum in responsible savings (€8.2bn of AuM, +104% vs. 31.12.19)• Strong increase in the use of digital tools: 75% of customer meetings are being
held remotely1; 2.8 million active customers on mobile apps2 (+18% vs. 31.12.19)
Ongoing mobilisation to serve customers• More than 69,000 state-guaranteed loans granted, totalling close to €17,9bn as at
31.12.20• Support for the economy, and in particular to small and mid-sized companies:
equity investments package to double to €4bn by 2024; securitisation guaranteed bythe EIB (European Investment Bank) in order to deploy €515m of new loans
1. Individual and small businesses customers; 2. Customers with at least one connection to the mobile apps per month (on average in 4Q20), scope: individual, small business and private banking customers (BNP Paribas and Hello Bank!); 3. Including 100% of Private Banking, excluding PEL/CEL; 4. Including 2/3 of Private Banking, excluding PEL/CEL effects
€bn +8.8%
174 189
Assets under management(Private Banking)
Loans
31.12.19 31.12.20
€bn +3.8%
104 108
Pre-tax income4: €862m (-31.6% vs. 2019)
• Increase in the cost of risk
Operating expenses3: €4,490m(-2.4% vs. 2019)
• Decrease in costs on the back of ongoing optimisation measures
42Fixed Income Presentation - March 2021
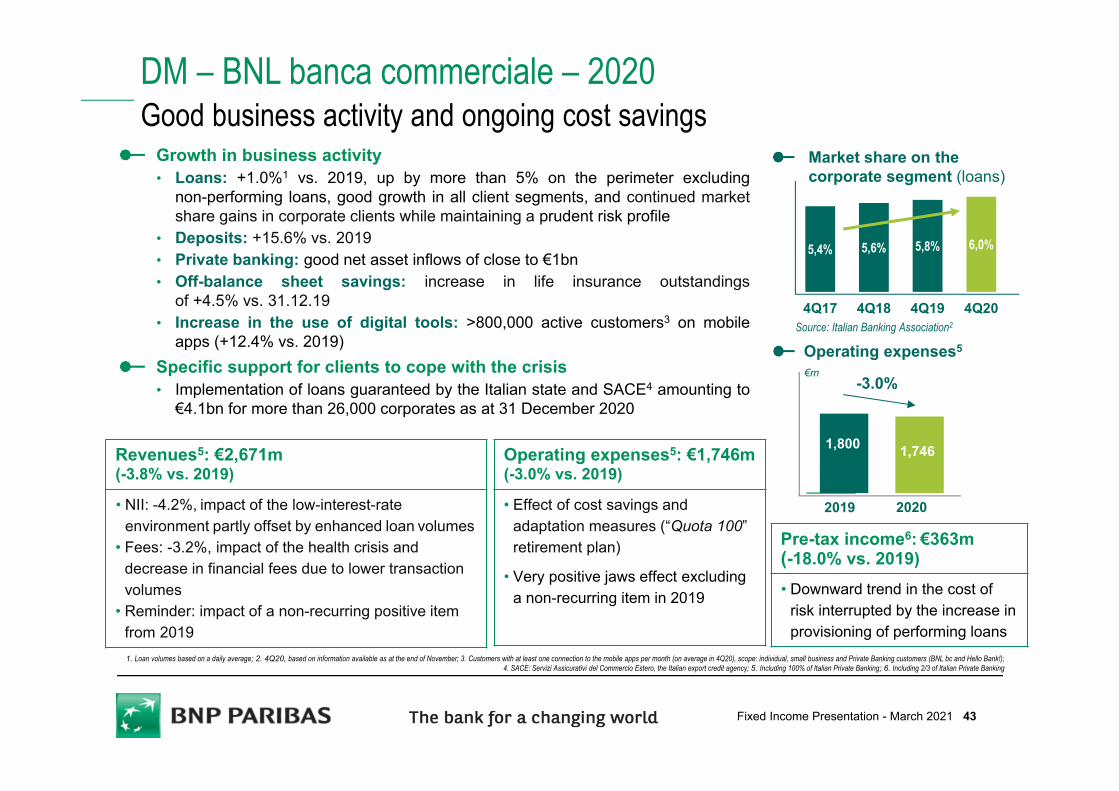
Pre-tax income6: €363m (-18.0% vs. 2019) • Downward trend in the cost of
risk interrupted by the increase in provisioning of performing loans
Operating expenses5: €1,746m (-3.0% vs. 2019)
• Effect of cost savings and adaptation measures (“Quota 100” retirement plan)
• Very positive jaws effect excluding a non-recurring item in 2019
Revenues5: €2,671m (-3.8% vs. 2019)
• NII: -4.2%, impact of the low-interest-rate environment partly offset by enhanced loan volumes
• Fees: -3.2%, impact of the health crisis and decrease in financial fees due to lower transaction volumes
• Reminder: impact of a non-recurring positive item from 2019 1. Loan volumes based on a daily average; 2. 4Q20, based on information available as at the end of November; 3. Customers with at least one connection to the mobile apps per month (on average in 4Q20), scope: individual, small business and Private Banking customers (BNL bc and Hello Bank!);
4. SACE: Servizi Assicurativi del Commercio Estero, the Italian export credit agency; 5. Including 100% of Italian Private Banking; 6. Including 2/3 of Italian Private Banking
DM – BNL banca commerciale – 2020Good business activity and ongoing cost savings
Growth in business activity• Loans: +1.0%1 vs. 2019, up by more than 5% on the perimeter excluding
non-performing loans, good growth in all client segments, and continued marketshare gains in corporate clients while maintaining a prudent risk profile
• Deposits: +15.6% vs. 2019• Private banking: good net asset inflows of close to €1bn• Off-balance sheet savings: increase in life insurance outstandings
of +4.5% vs. 31.12.19• Increase in the use of digital tools: >800,000 active customers3 on mobile
apps (+12.4% vs. 2019)Specific support for clients to cope with the crisis• Implementation of loans guaranteed by the Italian state and SACE4 amounting to
€4.1bn for more than 26,000 corporates as at 31 December 2020
5,4% 5,6% 5,8% 6,0%
4Q17 4Q18 4Q19 4Q20
Market share on the corporate segment (loans)
Source: Italian Banking Association2
-3.0%€m
1,800 1,746
Operating expenses5
2019 2020
43Fixed Income Presentation - March 2021
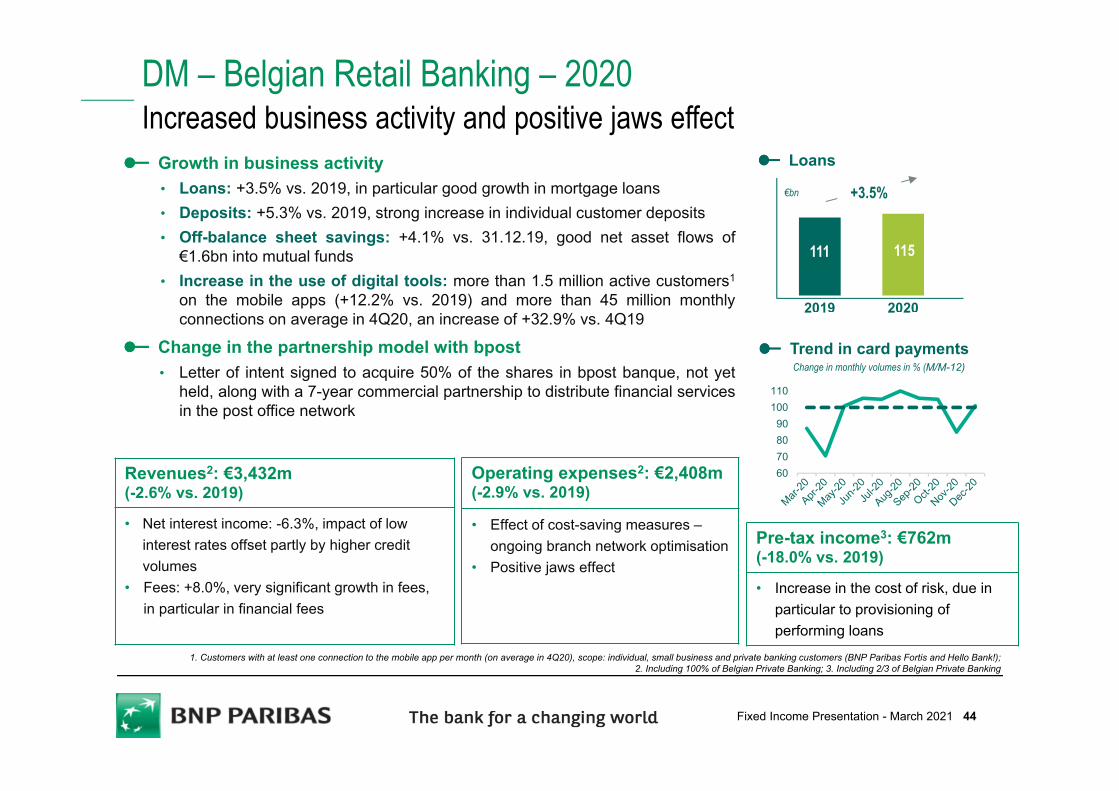
Pre-tax income3: €762m (-18.0% vs. 2019)
• Increase in the cost of risk, due in particular to provisioning of performing loans
Revenues2: €3,432m (-2.6% vs. 2019)
• Net interest income: -6.3%, impact of low interest rates offset partly by higher credit volumes
• Fees: +8.0%, very significant growth in fees, in particular in financial fees
111 115
2019 2020
1. Customers with at least one connection to the mobile app per month (on average in 4Q20), scope: individual, small business and private banking customers (BNP Paribas Fortis and Hello Bank!); 2. Including 100% of Belgian Private Banking; 3. Including 2/3 of Belgian Private Banking
DM – Belgian Retail Banking – 2020Increased business activity and positive jaws effect
Growth in business activity• Loans: +3.5% vs. 2019, in particular good growth in mortgage loans• Deposits: +5.3% vs. 2019, strong increase in individual customer deposits• Off-balance sheet savings: +4.1% vs. 31.12.19, good net asset flows of
€1.6bn into mutual funds• Increase in the use of digital tools: more than 1.5 million active customers1
on the mobile apps (+12.2% vs. 2019) and more than 45 million monthlyconnections on average in 4Q20, an increase of +32.9% vs. 4Q19
Change in the partnership model with bpost• Letter of intent signed to acquire 50% of the shares in bpost banque, not yet
held, along with a 7-year commercial partnership to distribute financial servicesin the post office network
Loans
+3.5%€bn
Operating expenses2: €2,408m (-2.9% vs. 2019)
• Effect of cost-saving measures –ongoing branch network optimisation
• Positive jaws effect
Trend in card payments
60708090
100110
Change in monthly volumes in % (M/M-12)
44Fixed Income Presentation - March 2021
1. Average fleet in thousands of vehicles; 2. At constant scope and exchange rates, excluding the transfer of an internal subsidiary (-1.6% including the transfer); 3. Since inception; 4. Including 100% of Private Banking in Luxembourg; 5. Including 2/3 of Private Banking in Luxembourg
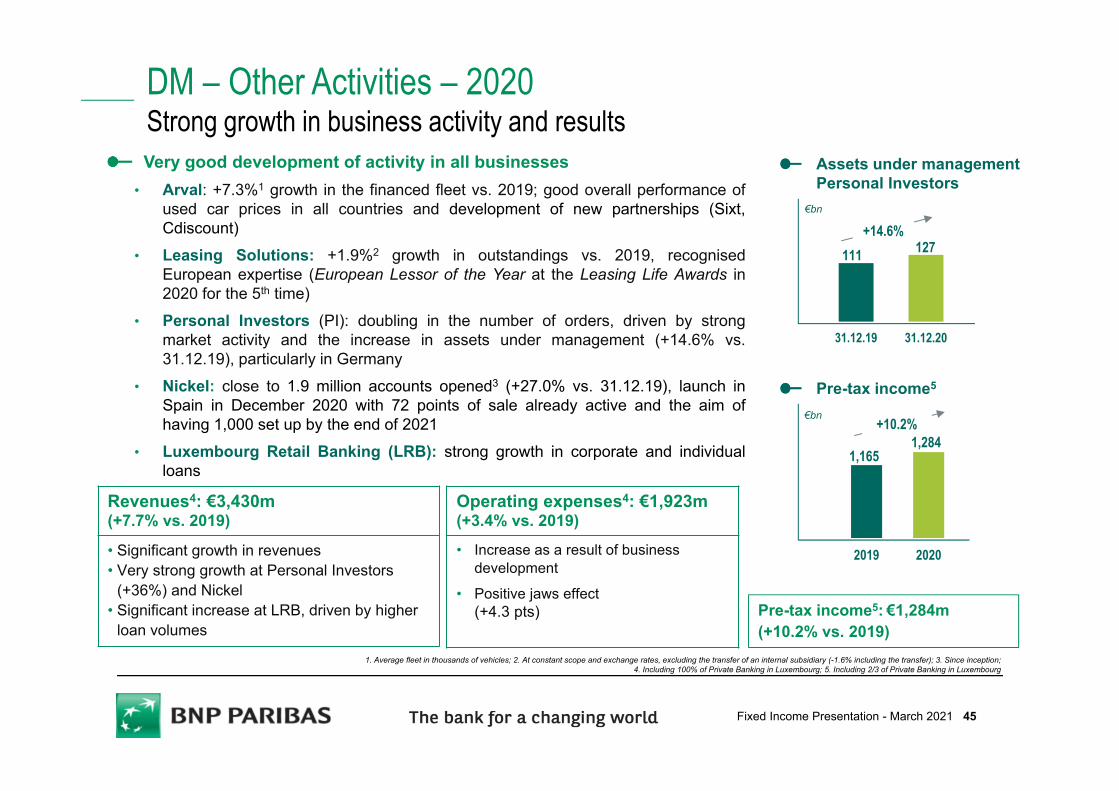
DM – Other Activities – 2020Strong growth in business activity and resultsVery good development of activity in all businesses
• Arval: +7.3%1 growth in the financed fleet vs. 2019; good overall performance ofused car prices in all countries and development of new partnerships (Sixt,Cdiscount)
• Leasing Solutions: +1.9%2 growth in outstandings vs. 2019, recognisedEuropean expertise (European Lessor of the Year at the Leasing Life Awards in2020 for the 5th time)
• Personal Investors (PI): doubling in the number of orders, driven by strongmarket activity and the increase in assets under management (+14.6% vs.31.12.19), particularly in Germany
• Nickel: close to 1.9 million accounts opened3 (+27.0% vs. 31.12.19), launch inSpain in December 2020 with 72 points of sale already active and the aim ofhaving 1,000 set up by the end of 2021
• Luxembourg Retail Banking (LRB): strong growth in corporate and individualloans
Assets under managementPersonal Investors
31.12.19 31.12.20
+14.6%111 127
Revenues4: €3,430m(+7.7% vs. 2019)
• Significant growth in revenues• Very strong growth at Personal Investors
(+36%) and Nickel• Significant increase at LRB, driven by higher
loan volumes
Operating expenses4: €1,923m(+3.4% vs. 2019)
• Increase as a result of business development
• Positive jaws effect (+4.3 pts) Pre-tax income5: €1,284m
(+10.2% vs. 2019)
2019 2020
€bn +10.2%
1,1651,284
Pre-tax income5
€bn
45Fixed Income Presentation - March 2021
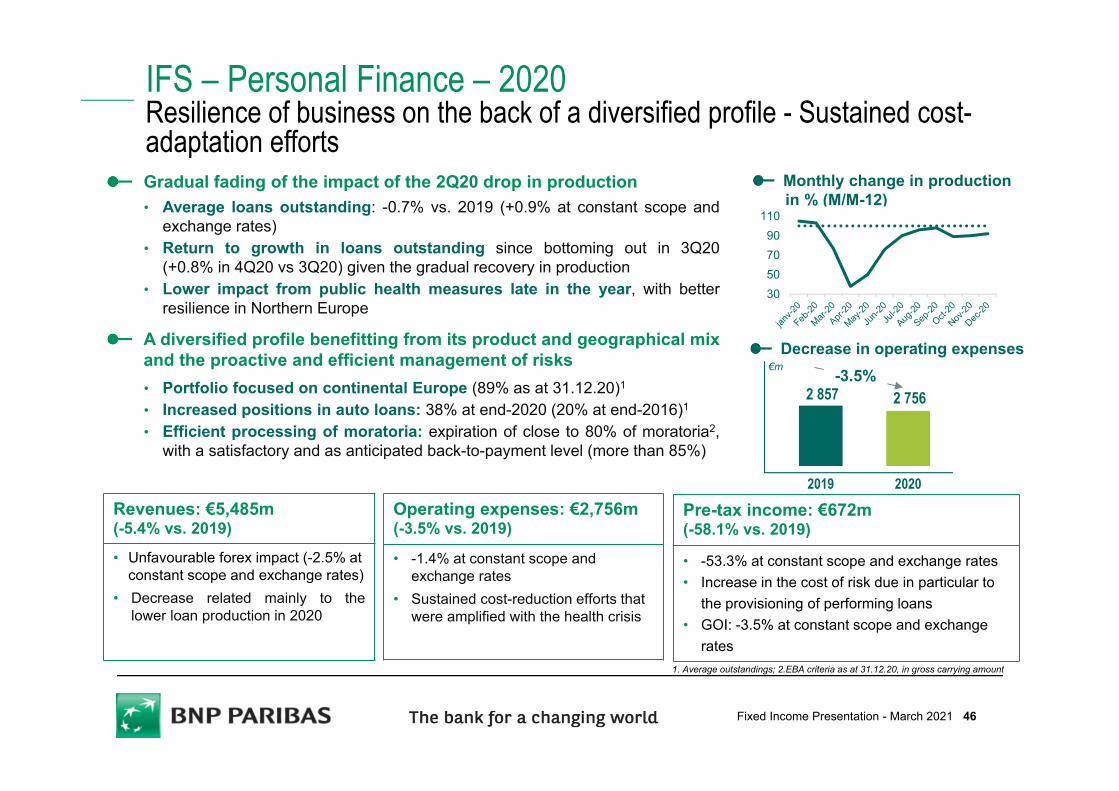
Pre-tax income: €672m (-58.1% vs. 2019)
• -53.3% at constant scope and exchange rates• Increase in the cost of risk due in particular to
the provisioning of performing loans• GOI: -3.5% at constant scope and exchange
rates1. Average outstandings; 2.EBA criteria as at 31.12.20, in gross carrying amount
IFS – Personal Finance – 2020Resilience of business on the back of a diversified profile - Sustained cost-adaptation effortsGradual fading of the impact of the 2Q20 drop in production• Average loans outstanding: -0.7% vs. 2019 (+0.9% at constant scope and
exchange rates)• Return to growth in loans outstanding since bottoming out in 3Q20
(+0.8% in 4Q20 vs 3Q20) given the gradual recovery in production• Lower impact from public health measures late in the year, with better
resilience in Northern Europe
A diversified profile benefitting from its product and geographical mixand the proactive and efficient management of risks• Portfolio focused on continental Europe (89% as at 31.12.20)1
• Increased positions in auto loans: 38% at end-2020 (20% at end-2016)1
• Efficient processing of moratoria: expiration of close to 80% of moratoria2,with a satisfactory and as anticipated back-to-payment level (more than 85%)
Revenues: €5,485m(-5.4% vs. 2019)
• Unfavourable forex impact (-2.5% at constant scope and exchange rates)
• Decrease related mainly to thelower loan production in 2020
Monthly change in productionin % (M/M-12)
Operating expenses: €2,756m (-3.5% vs. 2019)
• -1.4% at constant scope and exchange rates
• Sustained cost-reduction efforts that were amplified with the health crisis
Decrease in operating expenses
2 857 2 756
2019 2020
€m -3.5%
30507090
110
46Fixed Income Presentation - March 2021
Aug. Sep. Oct. Nov. Dec.
2019 production
2020 production
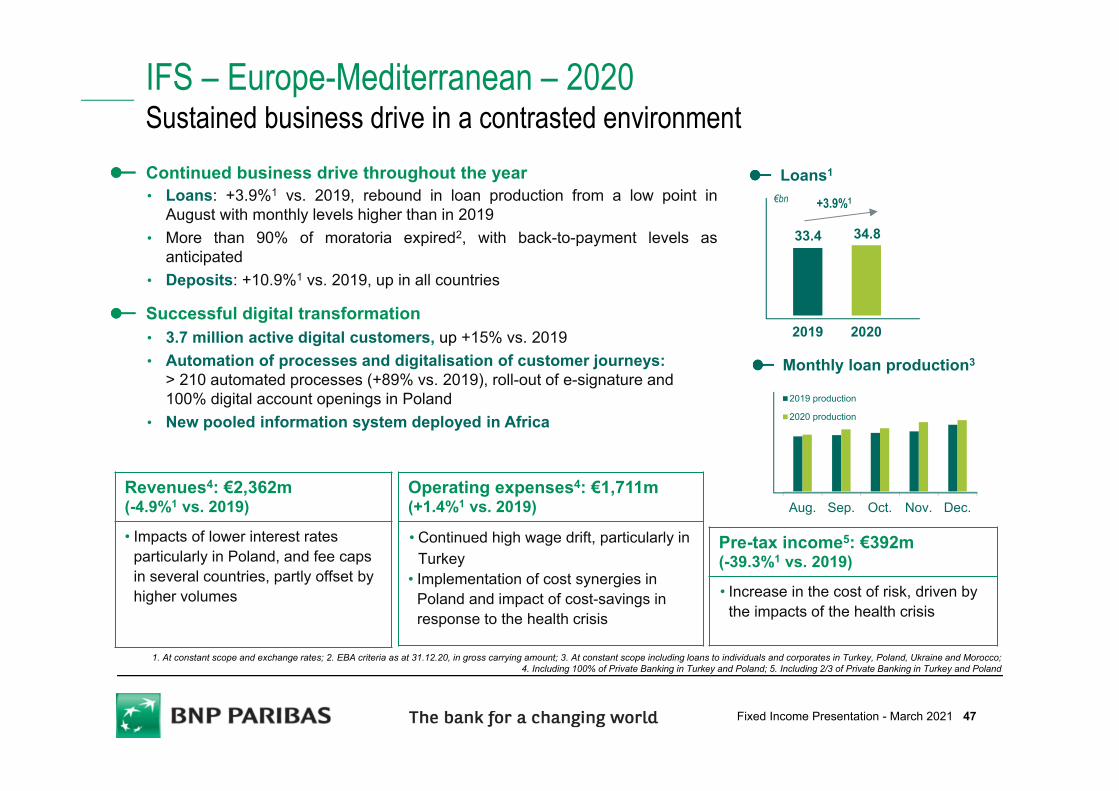
IFS – Europe-Mediterranean – 2020Sustained business drive in a contrasted environmentContinued business drive throughout the year• Loans: +3.9%1 vs. 2019, rebound in loan production from a low point in
August with monthly levels higher than in 2019• More than 90% of moratoria expired2, with back-to-payment levels as
anticipated• Deposits: +10.9%1 vs. 2019, up in all countries
Successful digital transformation• 3.7 million active digital customers, up +15% vs. 2019• Automation of processes and digitalisation of customer journeys:
> 210 automated processes (+89% vs. 2019), roll-out of e-signature and 100% digital account openings in Poland
• New pooled information system deployed in Africa
2019 2020
€bn +3.9%1
33.4 34.8
Loans1
Revenues4: €2,362m(-4.9%1 vs. 2019)
• Impacts of lower interest rates particularly in Poland, and fee caps in several countries, partly offset by higher volumes
Pre-tax income5: €392m (-39.3%1 vs. 2019)
• Increase in the cost of risk, driven by the impacts of the health crisis
Operating expenses4: €1,711m(+1.4%1 vs. 2019)
• Continued high wage drift, particularly in Turkey
• Implementation of cost synergies in Poland and impact of cost-savings in response to the health crisis
Monthly loan production3
1. At constant scope and exchange rates; 2. EBA criteria as at 31.12.20, in gross carrying amount; 3. At constant scope including loans to individuals and corporates in Turkey, Poland, Ukraine and Morocco; 4. Including 100% of Private Banking in Turkey and Poland; 5. Including 2/3 of Private Banking in Turkey and Poland
47Fixed Income Presentation - March 2021
2017 2018 2019 2020
x 2
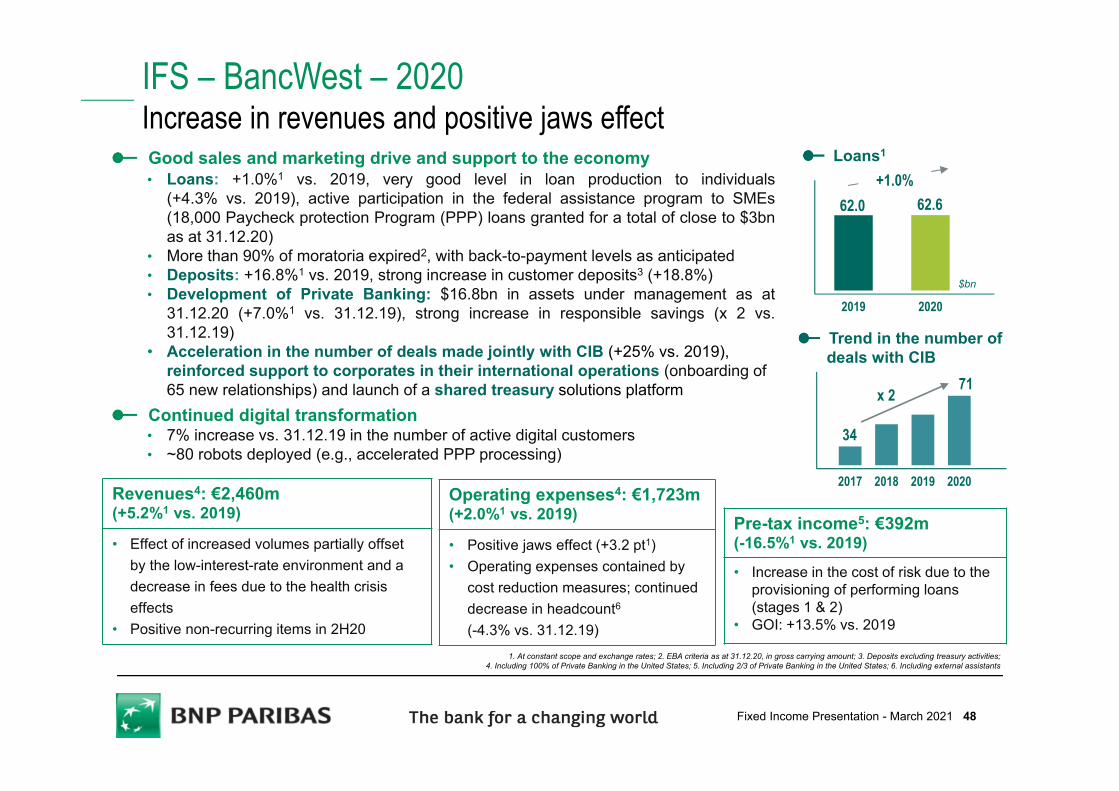
IFS – BancWest – 2020 Increase in revenues and positive jaws effectGood sales and marketing drive and support to the economy• Loans: +1.0%1 vs. 2019, very good level in loan production to individuals
(+4.3% vs. 2019), active participation in the federal assistance program to SMEs(18,000 Paycheck protection Program (PPP) loans granted for a total of close to $3bnas at 31.12.20)
• More than 90% of moratoria expired2, with back-to-payment levels as anticipated• Deposits: +16.8%1 vs. 2019, strong increase in customer deposits3 (+18.8%)• Development of Private Banking: $16.8bn in assets under management as at
31.12.20 (+7.0%1 vs. 31.12.19), strong increase in responsible savings (x 2 vs.31.12.19)
• Acceleration in the number of deals made jointly with CIB (+25% vs. 2019), reinforced support to corporates in their international operations (onboarding of 65 new relationships) and launch of a shared treasury solutions platform
Continued digital transformation • 7% increase vs. 31.12.19 in the number of active digital customers• ~80 robots deployed (e.g., accelerated PPP processing)
Loans1
$bn
2019 2020
+1.0%62.0 62.6
Trend in the number of deals with CIB
Revenues4: €2,460m(+5.2%1 vs. 2019)
• Effect of increased volumes partially offset by the low-interest-rate environment and a decrease in fees due to the health crisis effects
• Positive non-recurring items in 2H20
Pre-tax income5: €392m (-16.5%1 vs. 2019)
• Increase in the cost of risk due to theprovisioning of performing loans (stages 1 & 2)
• GOI: +13.5% vs. 2019
Operating expenses4: €1,723m(+2.0%1 vs. 2019)
• Positive jaws effect (+3.2 pt1)• Operating expenses contained by
cost reduction measures; continued decrease in headcount6
(-4.3% vs. 31.12.19)1. At constant scope and exchange rates; 2. EBA criteria as at 31.12.20, in gross carrying amount; 3. Deposits excluding treasury activities;
4. Including 100% of Private Banking in the United States; 5. Including 2/3 of Private Banking in the United States; 6. Including external assistants
34
71
48Fixed Income Presentation - March 2021
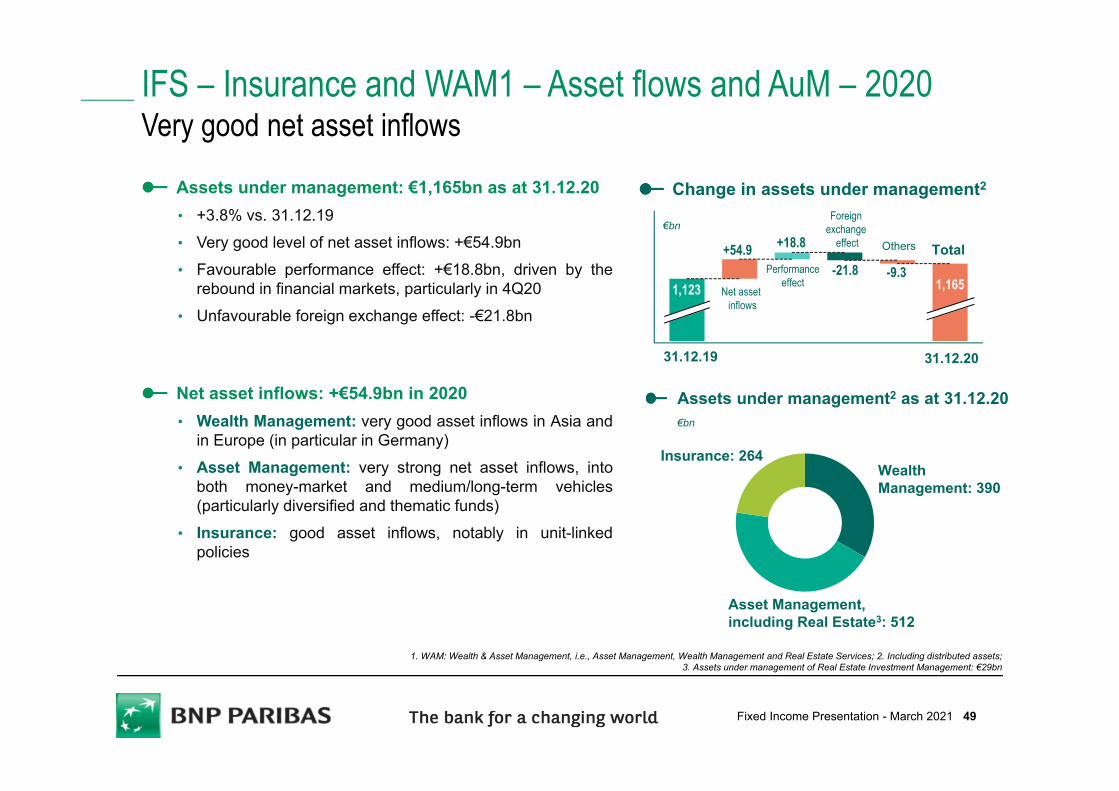
IFS – Insurance and WAM1 – Asset flows and AuM – 2020Very good net asset inflows
Wealth Management: 390
Asset Management, including Real Estate3: 512
Insurance: 264
€bn
€bn
1,165
Total
1,123
Change in assets under management2
Assets under management2 as at 31.12.20
Assets under management: €1,165bn as at 31.12.20• +3.8% vs. 31.12.19• Very good level of net asset inflows: +€54.9bn• Favourable performance effect: +€18.8bn, driven by the
rebound in financial markets, particularly in 4Q20• Unfavourable foreign exchange effect: -€21.8bn
Net asset inflows: +€54.9bn in 2020• Wealth Management: very good asset inflows in Asia and
in Europe (in particular in Germany)• Asset Management: very strong net asset inflows, into
both money-market and medium/long-term vehicles(particularly diversified and thematic funds)
• Insurance: good asset inflows, notably in unit-linkedpolicies
+54.9
Net asset inflows
Performanceeffect
Foreign exchange
effect Others+18.8
-21.8 -9.3
31.12.19 31.12.20
1. WAM: Wealth & Asset Management, i.e., Asset Management, Wealth Management and Real Estate Services; 2. Including distributed assets; 3. Assets under management of Real Estate Investment Management: €29bn
49Fixed Income Presentation - March 2021
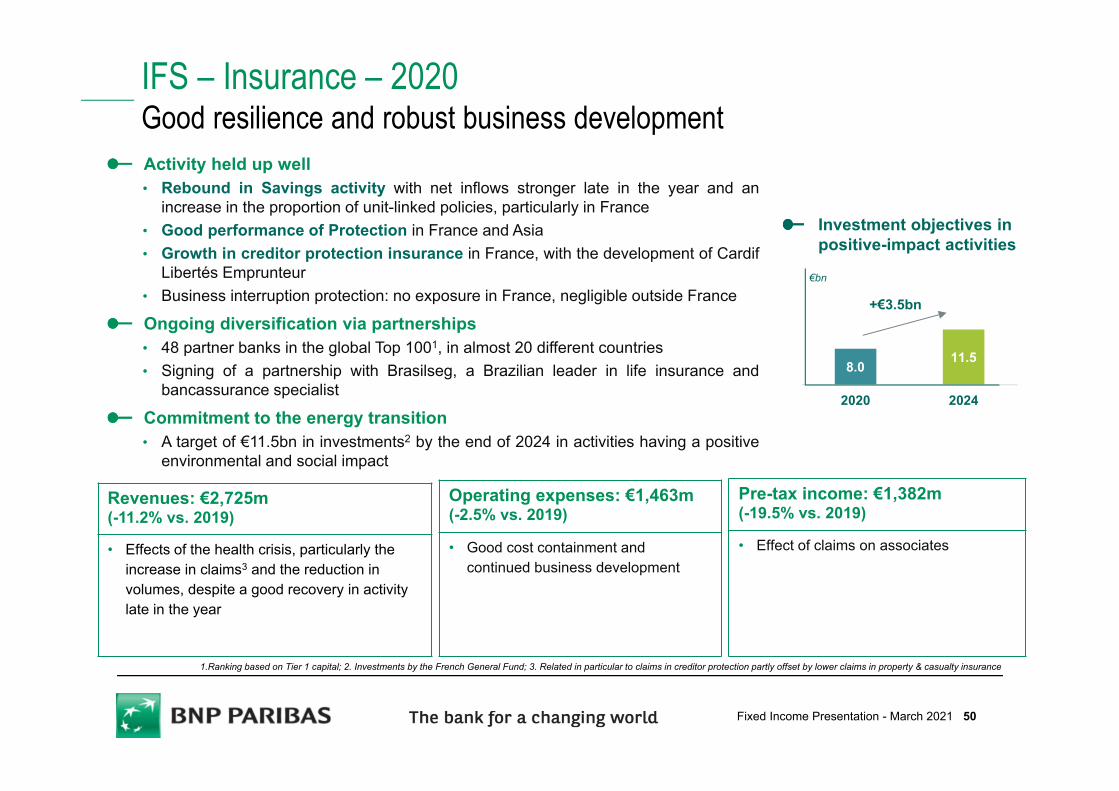
Pre-tax income: €1,382m (-19.5% vs. 2019)
• Effect of claims on associates
IFS – Insurance – 2020Good resilience and robust business developmentActivity held up well• Rebound in Savings activity with net inflows stronger late in the year and an
increase in the proportion of unit-linked policies, particularly in France• Good performance of Protection in France and Asia• Growth in creditor protection insurance in France, with the development of Cardif
Libertés Emprunteur• Business interruption protection: no exposure in France, negligible outside France
Ongoing diversification via partnerships• 48 partner banks in the global Top 1001, in almost 20 different countries• Signing of a partnership with Brasilseg, a Brazilian leader in life insurance and
bancassurance specialist
Commitment to the energy transition• A target of €11.5bn in investments2 by the end of 2024 in activities having a positive
environmental and social impact
1.Ranking based on Tier 1 capital; 2. Investments by the French General Fund; 3. Related in particular to claims in creditor protection partly offset by lower claims in property & casualty insurance
Revenues: €2,725m (-11.2% vs. 2019)
• Effects of the health crisis, particularly the increase in claims3 and the reduction in volumes, despite a good recovery in activity late in the year
Operating expenses: €1,463m (-2.5% vs. 2019)
• Good cost containment and continued business development
€bn
8.011.5
2020 2024
+€3.5bn
Investment objectives in positive-impact activities
50Fixed Income Presentation - March 2021
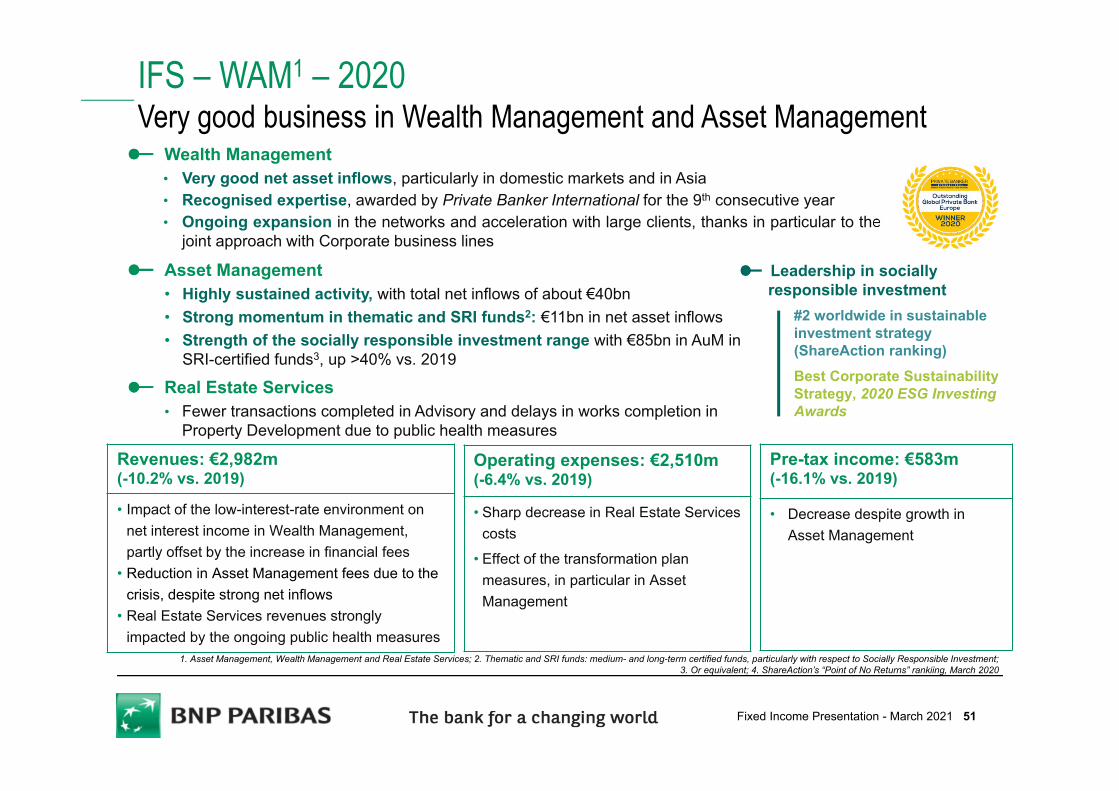
IFS – WAM1 – 2020Very good business in Wealth Management and Asset Management
Wealth Management• Very good net asset inflows, particularly in domestic markets and in Asia• Recognised expertise, awarded by Private Banker International for the 9th consecutive year• Ongoing expansion in the networks and acceleration with large clients, thanks in particular to the
joint approach with Corporate business lines
1. Asset Management, Wealth Management and Real Estate Services; 2. Thematic and SRI funds: medium- and long-term certified funds, particularly with respect to Socially Responsible Investment; 3. Or equivalent; 4. ShareAction’s “Point of No Returns” rankiing, March 2020
Asset Management• Highly sustained activity, with total net inflows of about €40bn• Strong momentum in thematic and SRI funds2: €11bn in net asset inflows • Strength of the socially responsible investment range with €85bn in AuM in
SRI-certified funds3, up >40% vs. 2019
Real Estate Services• Fewer transactions completed in Advisory and delays in works completion in
Property Development due to public health measures
Revenues: €2,982m (-10.2% vs. 2019)
• Impact of the low-interest-rate environment on net interest income in Wealth Management, partly offset by the increase in financial fees
• Reduction in Asset Management fees due to the crisis, despite strong net inflows
• Real Estate Services revenues strongly impacted by the ongoing public health measures
Pre-tax income: €583m (-16.1% vs. 2019)
• Decrease despite growth in Asset Management
Operating expenses: €2,510m(-6.4% vs. 2019)
• Sharp decrease in Real Estate Services costs
• Effect of the transformation plan measures, in particular in Asset Management
#2 worldwide in sustainable investment strategy (ShareAction ranking)Best Corporate Sustainability Strategy, 2020 ESG Investing Awards
Leadership in socially responsible investment
51Fixed Income Presentation - March 2021
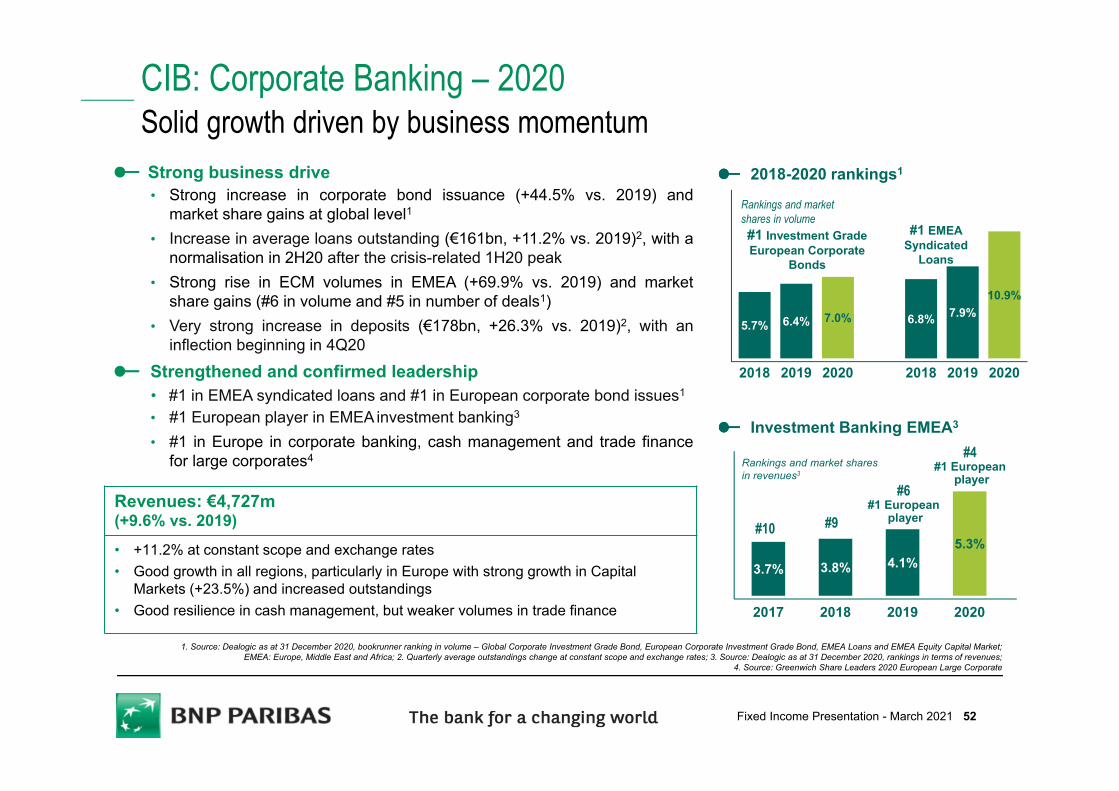
CIB: Corporate Banking – 2020Solid growth driven by business momentumStrong business drive• Strong increase in corporate bond issuance (+44.5% vs. 2019) and
market share gains at global level1
• Increase in average loans outstanding (€161bn, +11.2% vs. 2019)2, with anormalisation in 2H20 after the crisis-related 1H20 peak
• Strong rise in ECM volumes in EMEA (+69.9% vs. 2019) and marketshare gains (#6 in volume and #5 in number of deals1)
• Very strong increase in deposits (€178bn, +26.3% vs. 2019)2, with aninflection beginning in 4Q20
Strengthened and confirmed leadership• #1 in EMEA syndicated loans and #1 in European corporate bond issues1
• #1 European player in EMEAinvestment banking3
• #1 in Europe in corporate banking, cash management and trade financefor large corporates4
5.7% 6.4% 7.0% 6.8% 7.9%10.9%
2018 2019 2020 2018 2019 2020
2018-2020 rankings1
Revenues: €4,727m (+9.6% vs. 2019)
• +11.2% at constant scope and exchange rates • Good growth in all regions, particularly in Europe with strong growth in Capital
Markets (+23.5%) and increased outstandings • Good resilience in cash management, but weaker volumes in trade finance
3.7% 3.8% 4.1%5.3%
2017 2018 2019 2020
#10 #9
Rankings and market shares in revenues3
#6 #1 European
player
#4 #1 European
player
Investment Banking EMEA3
1. Source: Dealogic as at 31 December 2020, bookrunner ranking in volume – Global Corporate Investment Grade Bond, European Corporate Investment Grade Bond, EMEA Loans and EMEA Equity Capital Market; EMEA: Europe, Middle East and Africa; 2. Quarterly average outstandings change at constant scope and exchange rates; 3. Source: Dealogic as at 31 December 2020, rankings in terms of revenues;
4. Source: Greenwich Share Leaders 2020 European Large Corporate
Rankings and market shares in volume#1 Investment Grade European Corporate
Bonds
#1 EMEASyndicated
Loans
52Fixed Income Presentation - March 2021
1 035793 915 820
1 392
2 013
1 2451 002
488615 384 520
97
290
466497
-184 2
1Q19 2Q19 3Q19 4Q19 1Q20 2Q20 3Q20 4Q20
1,306
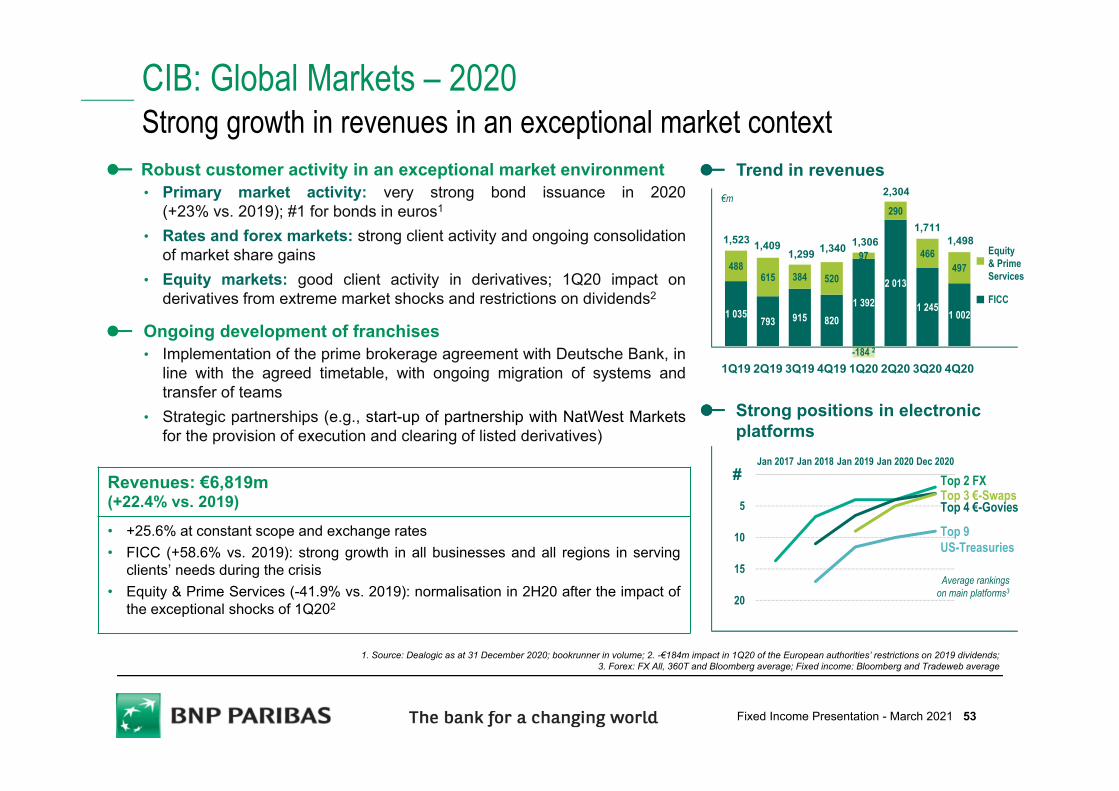
Robust customer activity in an exceptional market environment• Primary market activity: very strong bond issuance in 2020
(+23% vs. 2019); #1 for bonds in euros1
• Rates and forex markets: strong client activity and ongoing consolidationof market share gains
• Equity markets: good client activity in derivatives; 1Q20 impact onderivatives from extreme market shocks and restrictions on dividends2
Ongoing development of franchises• Implementation of the prime brokerage agreement with Deutsche Bank, in
line with the agreed timetable, with ongoing migration of systems andtransfer of teams
• Strategic partnerships (e.g., start-up of partnership with NatWest Marketsfor the provision of execution and clearing of listed derivatives)
CIB: Global Markets – 2020Strong growth in revenues in an exceptional market context
Equity & Prime Services
FICC
1,523 1,4091,299 1,340
€m 2,304
Trend in revenues
1. Source: Dealogic as at 31 December 2020; bookrunner in volume; 2. -€184m impact in 1Q20 of the European authorities’ restrictions on 2019 dividends;3. Forex: FX All, 360T and Bloomberg average; Fixed income: Bloomberg and Tradeweb average
1,711
Strong positions in electronic platforms
Revenues: €6,819m (+22.4% vs. 2019)
• +25.6% at constant scope and exchange rates• FICC (+58.6% vs. 2019): strong growth in all businesses and all regions in serving
clients’ needs during the crisis• Equity & Prime Services (-41.9% vs. 2019): normalisation in 2H20 after the impact of
the exceptional shocks of 1Q202
1,498
0
5
10
15
20
Jan 2017 Jan 2018 Jan 2019 Jan 2020 Dec 2020
Average rankings on main platforms3
Top 3 €-SwapsTop 2 FX
Top 4 €-Govies
#
Top 9 US-Treasuries
53Fixed Income Presentation - March 2021
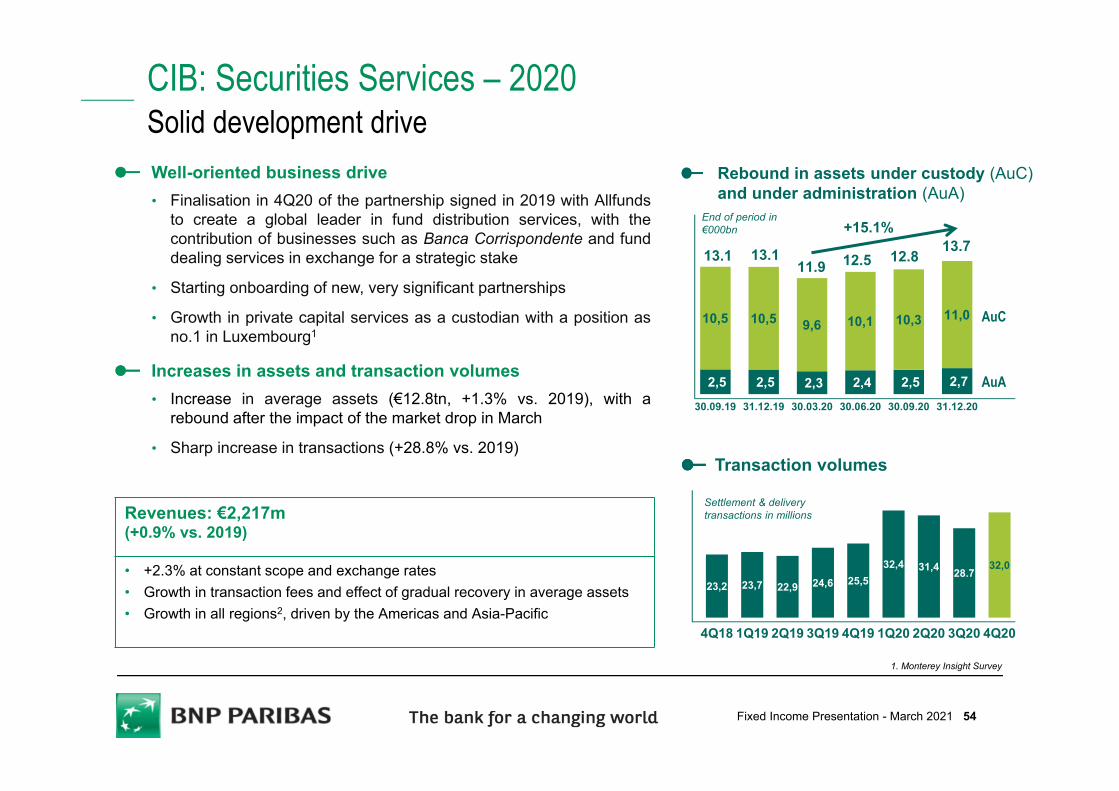
CIB: Securities Services – 2020Solid development driveWell-oriented business drive• Finalisation in 4Q20 of the partnership signed in 2019 with Allfunds
to create a global leader in fund distribution services, with thecontribution of businesses such as Banca Corrispondente and funddealing services in exchange for a strategic stake
• Starting onboarding of new, very significant partnerships
• Growth in private capital services as a custodian with a position asno.1 in Luxembourg1
Increases in assets and transaction volumes• Increase in average assets (€12.8tn, +1.3% vs. 2019), with a
rebound after the impact of the market drop in March
• Sharp increase in transactions (+28.8% vs. 2019)Transaction volumes
23,2 23,7 22,9 24,6 25,532,4 31,4 28.7
32,0
4Q18 1Q19 2Q19 3Q19 4Q19 1Q20 2Q20 3Q20 4Q20
Settlement & delivery transactions in millions
1. Monterey Insight Survey
Rebound in assets under custody (AuC) and under administration (AuA)
2,5 2,5 2,3 2,4 2,5 2,7
10,5 10,5 9,6 10,1 10,3 11,0
30.09.19 31.12.19 30.03.20 30.06.20 30.09.20 31.12.20
End of period in €000bn
AuA
AuC
13.1 13.1
+15.1%
11.9 12.5 12.8
Revenues: €2,217m (+0.9% vs. 2019)
• +2.3% at constant scope and exchange rates• Growth in transaction fees and effect of gradual recovery in average assets• Growth in all regions2, driven by the Americas and Asia-Pacific
13.7
54Fixed Income Presentation - March 2021
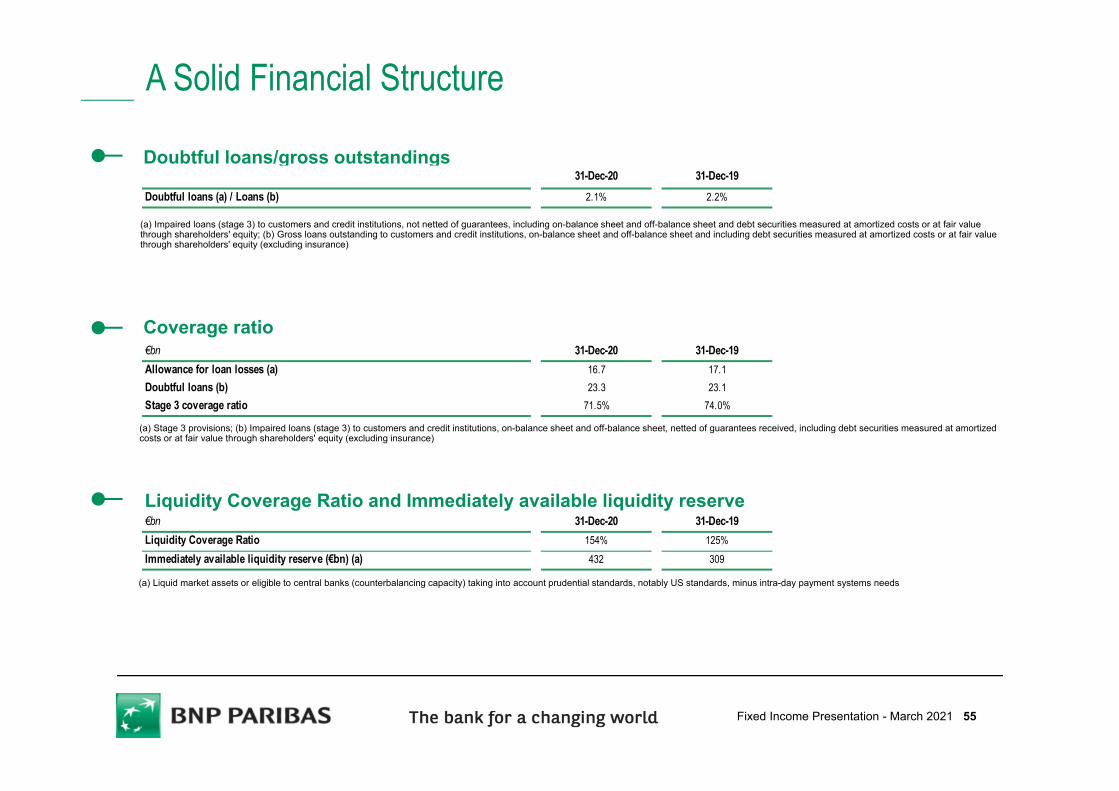
A Solid Financial Structure
Doubtful loans/gross outstandings
Coverage ratio
Liquidity Coverage Ratio and Immediately available liquidity reserve
(a) Stage 3 provisions; (b) Impaired loans (stage 3) to customers and credit institutions, on-balance sheet and off-balance sheet, netted of guarantees received, including debt securities measured at amortized costs or at fair value through shareholders' equity (excluding insurance)
(a) Impaired loans (stage 3) to customers and credit institutions, not netted of guarantees, including on-balance sheet and off-balance sheet and debt securities measured at amortized costs or at fair value through shareholders' equity; (b) Gross loans outstanding to customers and credit institutions, on-balance sheet and off-balance sheet and including debt securities measured at amortized costs or at fair value through shareholders' equity (excluding insurance)
(a) Liquid market assets or eligible to central banks (counterbalancing capacity) taking into account prudential standards, notably US standards, minus intra-day payment systems needs
€bn 31-Dec-20 31-Dec-19Allowance for loan losses (a) 16.7 17.1Doubtful loans (b) 23.3 23.1Stage 3 coverage ratio 71.5% 74.0%
31-Dec-20 31-Dec-19Doubtful loans (a) / Loans (b) 2.1% 2.2%
€bn 31-Dec-20 31-Dec-19Liquidity Coverage Ratio 154% 125%Immediately available liquidity reserve (€bn) (a) 432 309
55Fixed Income Presentation - March 2021
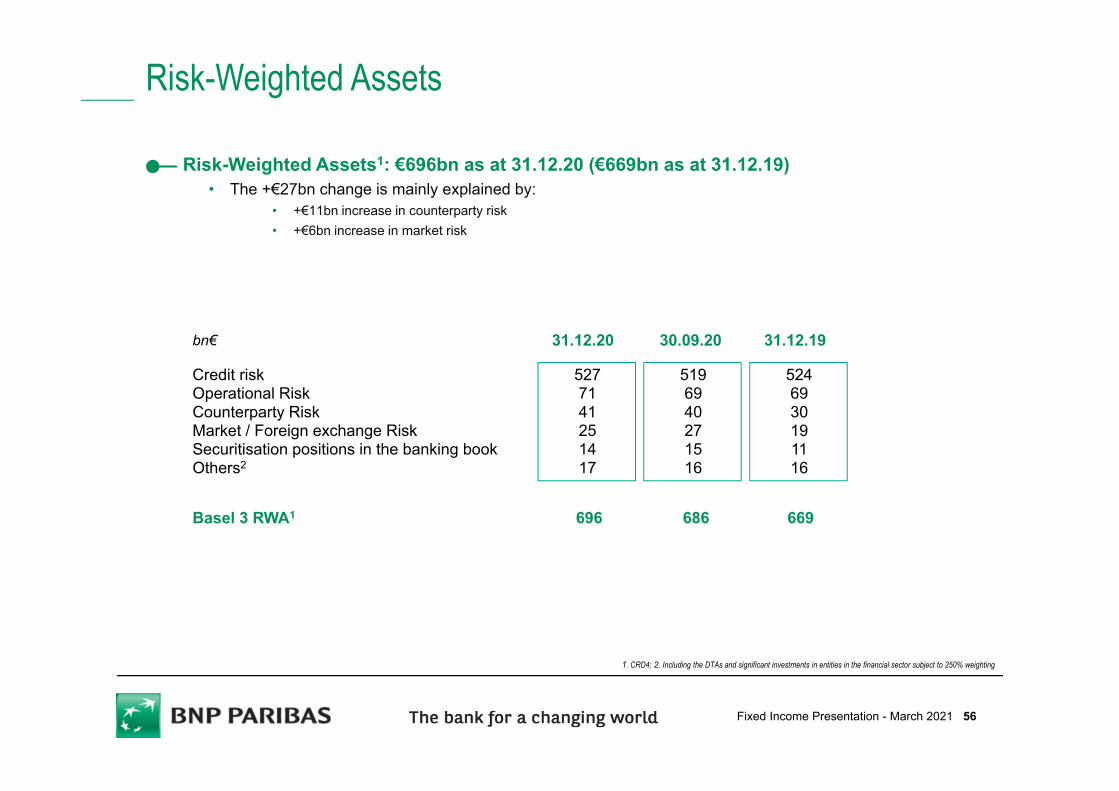
Risk-Weighted Assets
1. CRD4; 2. Including the DTAs and significant investments in entities in the financial sector subject to 250% weighting
Risk-Weighted Assets1: €696bn as at 31.12.20 (€669bn as at 31.12.19)• The +€27bn change is mainly explained by:
• +€11bn increase in counterparty risk• +€6bn increase in market risk
Credit riskOperational RiskCounterparty RiskMarket / Foreign exchange Risk Securitisation positions in the banking bookOthers2
31.12.20 30.09.20bn€
5277141251417
Basel 3 RWA1 696 686
31.12.19
669
5196940271516
5246930191116
56Fixed Income Presentation - March 2021