sprawozdanie zarzĄdu - bank bnp paribas
TRANSCRIPT
MANAGEMENT BOARD’S REPORT
ON THE ACTIVITIES
OF THE CAPITAL GROUP
OF BANK GOSPODARKI ŻYWNOŚCIOWEJ S.A.
FOR THE FIRST HALF OF 2011
Warsaw, 23 August 2011
Page 1 of 38
TABLE OF CONTENTS
1. EXTERNAL CONDITIONS AFFECTING OPERATIONS OF THE CAPITAL GROUP OF BGŻ S.A. 2
1.1. MACROECONOMIC SITUATION _________________________________________________________________ 2 1.2. RESULTS OF THE BANKING SECTOR ____________________________________________________________ 3 1.3. STOCK EXCHANGE AND INVESTMENT TRENDS ___________________________________________________ 4
2. COMPOSITION OF THE CAPITAL GROUP AND METHODS USED FOR CONSOLIDATION OF THE FINANCIAL STATEMENTS 6
3. IMPORTANT EVENTS IN BGŻ S.A. IN THE FIRST HALF OF 2011 6
4. AUTHORITIES OF THE PARENT COMPANY 7
5. EXTERNAL ASSESSMENTS OF THE PARENT COMPANY 7
5.1. RATINGS ____________________________________________________________________________________ 7
6. SHAREHOLDING STRUCTURE OF THE PARENT COMPANY 8
7. FINANCIAL POSITION OF THE BGŻ S.A. CAPITAL GROUP 9
7.1. FINANCIAL POSITION IN THE FIRST HALF OF 2011 COMPARED WITH THE FIRST HALF OF 2010 __________ 9 7.2. FINANCIAL POSITION IN THE SECOND QUARTER OF 2011 COMPARED WITH THE FIRST QUARTER OF 201116
8. ACTIVITIES OF THE PARENT COMPANY IN THE FIRST HALF OF 2011 18
8.1. DISTRIBUTION CHANNELS ____________________________________________________________________ 18 8.2. RETAIL BANKING ____________________________________________________________________________ 20 8.3. BROKERAGE SERVICES AND DISTRIBUTION OF INVESTMENT FUNDS PARTICIPATION UNITS __________ 22 8.4. INSTITUTIONAL BANKING _____________________________________________________________________ 23 8.5. ACTIVITIES ON MONEY AND FOREIGN EXCHANGE MARKETS ______________________________________ 26 8.6. COOPERATION WITH BANKS AND FINANCIAL INSTITUTIONS _______________________________________ 28 8.7. ORGANIZATION AND PERSONNEL ______________________________________________________________ 29 8.8. IT ENVIRONMENT ____________________________________________________________________________ 30
9. ACTIVITIES OF SUBSIDIARIES AND ASSOCIATED COMPANIES OF THE CAPITAL GROUP OF BGŻ S.A. IN THE FIRST HALF OF 2011 30
9.1. Bankowy Fundusz Nieruchomościowy Actus Sp. z o.o. ________________________________________________ 30 9.2. BGŻ Leasing Sp. z o.o. _________________________________________________________________________ 31
10. RISK MANAGEMENT 31
10.1. CREDIT RISK ________________________________________________________________________________ 31 10.2. FINANCIAL RISK _____________________________________________________________________________ 33 10.3. OPERATING RISK ____________________________________________________________________________ 35 10.4. LEGAL RISK _________________________________________________________________________________ 36
11. DEVELOPMENT PROSPECTS OF THE CAPITAL GROUP BGŻ S.A. 37
11.1. STRATEGY FOR THE YEARS 2011-2014 _________________________________________________________ 37
Page 2 of 38
1. EXTERNAL CONDITIONS AFFECTING OPERATIONS OF THE CAPITAL GROUP OF BGŻ S.A.
1.1. MACROECONOMIC SITUATION
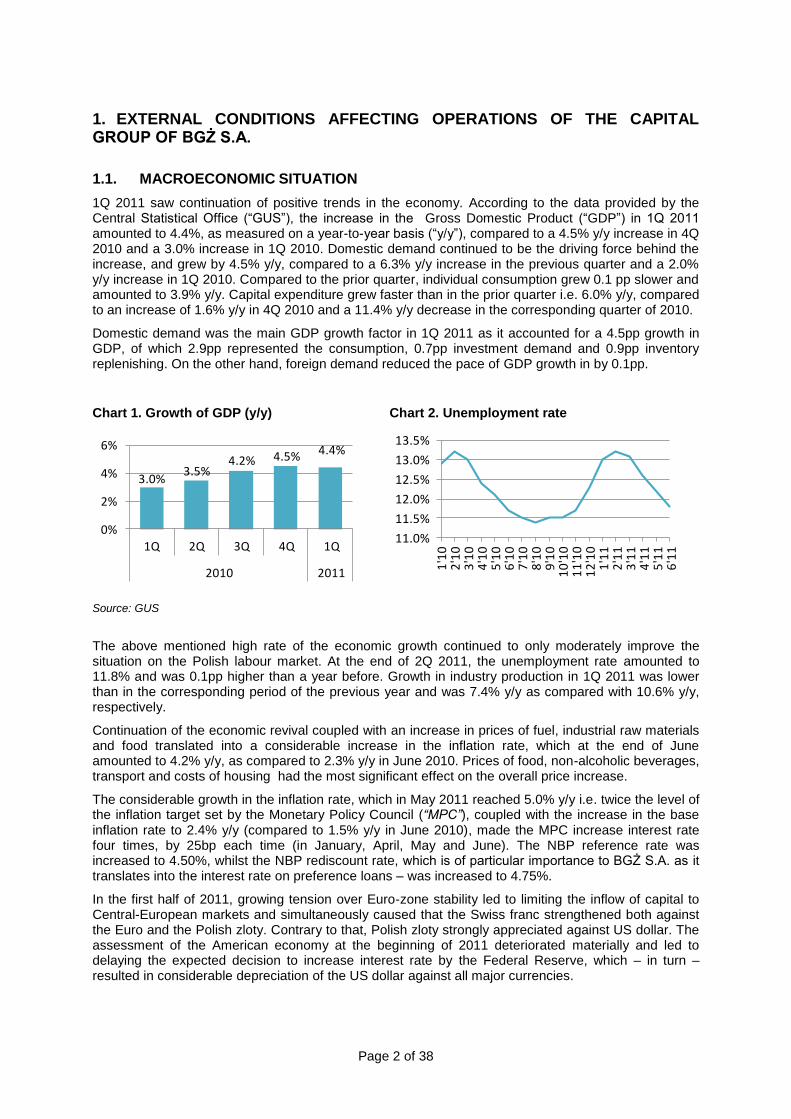
1Q 2011 saw continuation of positive trends in the economy. According to the data provided by the Central Statistical Office (“GUS”), the increase in the Gross Domestic Product (“GDP”) in 1Q 2011 amounted to 4.4%, as measured on a year-to-year basis (“y/y”), compared to a 4.5% y/y increase in 4Q 2010 and a 3.0% increase in 1Q 2010. Domestic demand continued to be the driving force behind the increase, and grew by 4.5% y/y, compared to a 6.3% y/y increase in the previous quarter and a 2.0% y/y increase in 1Q 2010. Compared to the prior quarter, individual consumption grew 0.1 pp slower and amounted to 3.9% y/y. Capital expenditure grew faster than in the prior quarter i.e. 6.0% y/y, compared to an increase of 1.6% y/y in 4Q 2010 and a 11.4% y/y decrease in the corresponding quarter of 2010.
Domestic demand was the main GDP growth factor in 1Q 2011 as it accounted for a 4.5pp growth in GDP, of which 2.9pp represented the consumption, 0.7pp investment demand and 0.9pp inventory replenishing. On the other hand, foreign demand reduced the pace of GDP growth in by 0.1pp.
Chart 1. Growth of GDP (y/y) Chart 2. Unemployment rate
3.0%3.5%
4.2% 4.5% 4.4%
0%
2%
4%
6%
1Q 2Q 3Q 4Q 1Q
2010 2011
11.0%
11.5%
12.0%
12.5%
13.0%
13.5%1
'10
2'1
03
'10
4'1
05
'10
6'1
07
'10
8'1
09
'10
10
'10
11
'10
12
'10
1'1
12
'11
3'1
14
'11
5'1
16
'11
Source: GUS
The above mentioned high rate of the economic growth continued to only moderately improve the situation on the Polish labour market. At the end of 2Q 2011, the unemployment rate amounted to 11.8% and was 0.1pp higher than a year before. Growth in industry production in 1Q 2011 was lower than in the corresponding period of the previous year and was 7.4% y/y as compared with 10.6% y/y, respectively.
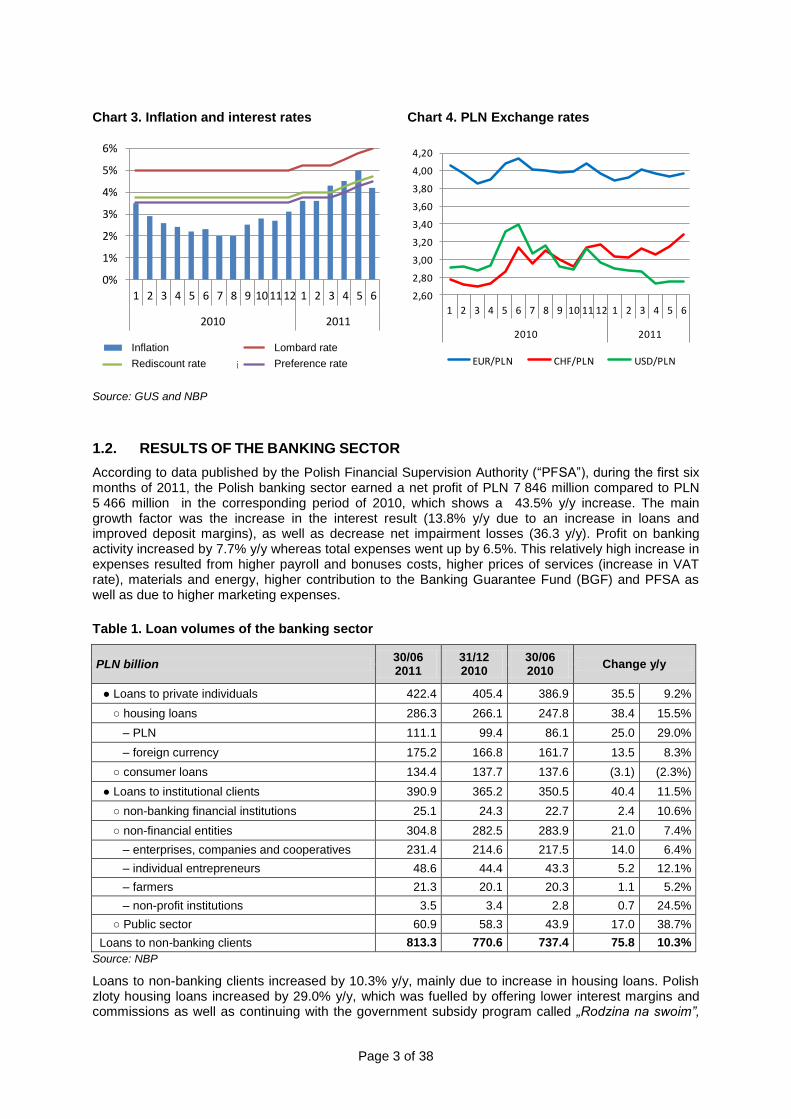
Continuation of the economic revival coupled with an increase in prices of fuel, industrial raw materials and food translated into a considerable increase in the inflation rate, which at the end of June amounted to 4.2% y/y, as compared to 2.3% y/y in June 2010. Prices of food, non-alcoholic beverages, transport and costs of housing had the most significant effect on the overall price increase.
The considerable growth in the inflation rate, which in May 2011 reached 5.0% y/y i.e. twice the level of the inflation target set by the Monetary Policy Council (“MPC”), coupled with the increase in the base inflation rate to 2.4% y/y (compared to 1.5% y/y in June 2010), made the MPC increase interest rate four times, by 25bp each time (in January, April, May and June). The NBP reference rate was increased to 4.50%, whilst the NBP rediscount rate, which is of particular importance to BGŻ S.A. as it translates into the interest rate on preference loans – was increased to 4.75%.
In the first half of 2011, growing tension over Euro-zone stability led to limiting the inflow of capital to Central-European markets and simultaneously caused that the Swiss franc strengthened both against the Euro and the Polish zloty. Contrary to that, Polish zloty strongly appreciated against US dollar. The assessment of the American economy at the beginning of 2011 deteriorated materially and led to delaying the expected decision to increase interest rate by the Federal Reserve, which – in turn – resulted in considerable depreciation of the US dollar against all major currencies.
Page 3 of 38
Chart 3. Inflation and interest rates Chart 4. PLN Exchange rates
0%
1%
2%
3%
4%
5%
6%
1 2 3 4 5 6 7 8 9 10 11 12 1 2 3 4 5 6
2010 2011
Inflacja Stopa lombardowa
Stopa redyskonta weksli Stopa referencyjna
2,60
2,80
3,00
3,20
3,40
3,60
3,80
4,00
4,20
1 2 3 4 5 6 7 8 9 10 11 12 1 2 3 4 5 6
2010 2011
EUR/PLN CHF/PLN USD/PLN
Source: GUS and NBP
1.2. RESULTS OF THE BANKING SECTOR
According to data published by the Polish Financial Supervision Authority (“PFSA”), during the first six months of 2011, the Polish banking sector earned a net profit of PLN 7 846 million compared to PLN 5 466 million in the corresponding period of 2010, which shows a 43.5% y/y increase. The main growth factor was the increase in the interest result (13.8% y/y due to an increase in loans and improved deposit margins), as well as decrease net impairment losses (36.3 y/y). Profit on banking activity increased by 7.7% y/y whereas total expenses went up by 6.5%. This relatively high increase in expenses resulted from higher payroll and bonuses costs, higher prices of services (increase in VAT rate), materials and energy, higher contribution to the Banking Guarantee Fund (BGF) and PFSA as well as due to higher marketing expenses.
Table 1. Loan volumes of the banking sector
PLN billion 30/06 2011
31/12 2010
30/06 2010
Change y/y
● Loans to private individuals 422.4 405.4 386.9 35.5 9.2%
○ housing loans 286.3 266.1 247.8 38.4 15.5%
– PLN 111.1 99.4 86.1 25.0 29.0%
– foreign currency 175.2 166.8 161.7 13.5 8.3%
○ consumer loans 134.4 137.7 137.6 (3.1) (2.3%)
● Loans to institutional clients 390.9 365.2 350.5 40.4 11.5%
○ non-banking financial institutions 25.1 24.3 22.7 2.4 10.6%
○ non-financial entities 304.8 282.5 283.9 21.0 7.4%
– enterprises, companies and cooperatives 231.4 214.6 217.5 14.0 6.4%
– individual entrepreneurs 48.6 44.4 43.3 5.2 12.1%
– farmers 21.3 20.1 20.3 1.1 5.2%
– non-profit institutions 3.5 3.4 2.8 0.7 24.5%
○ Public sector 60.9 58.3 43.9 17.0 38.7%
Loans to non-banking clients 813.3 770.6 737.4 75.8 10.3%
Source: NBP
Loans to non-banking clients increased by 10.3% y/y, mainly due to increase in housing loans. Polish zloty housing loans increased by 29.0% y/y, which was fuelled by offering lower interest margins and commissions as well as continuing with the government subsidy program called „Rodzina na swoim”,
Inflation
Rediscount rate
Lombard rate
Preference rate
Page 4 of 38
which accounted for approx. 1/5 of the total sales. On the other hand, foreign currency housing loans increased by 8.3% and that lower increase was mainly due to weakening of the Polish currency against Swiss franc (by 5.3% y/y). The first half of 2011 saw poor results on the market of consumer loans which recorded a -2.3% y/y decrease, which was attributable to maintaining by the banks tight credit criteria, implementation of the second part of Recommendation “T” of the PFSA and relatively low demand. The decrease affected all types of consumer loan products i.e. cash, instalment, car and credit cards.
After a decrease or stagnation in the second half of 2010, in the first half of 2011 a slight revival was observed on the market of corporate loans (mainly to small and medium-sized enterprises) and to individual entrepreneurs.
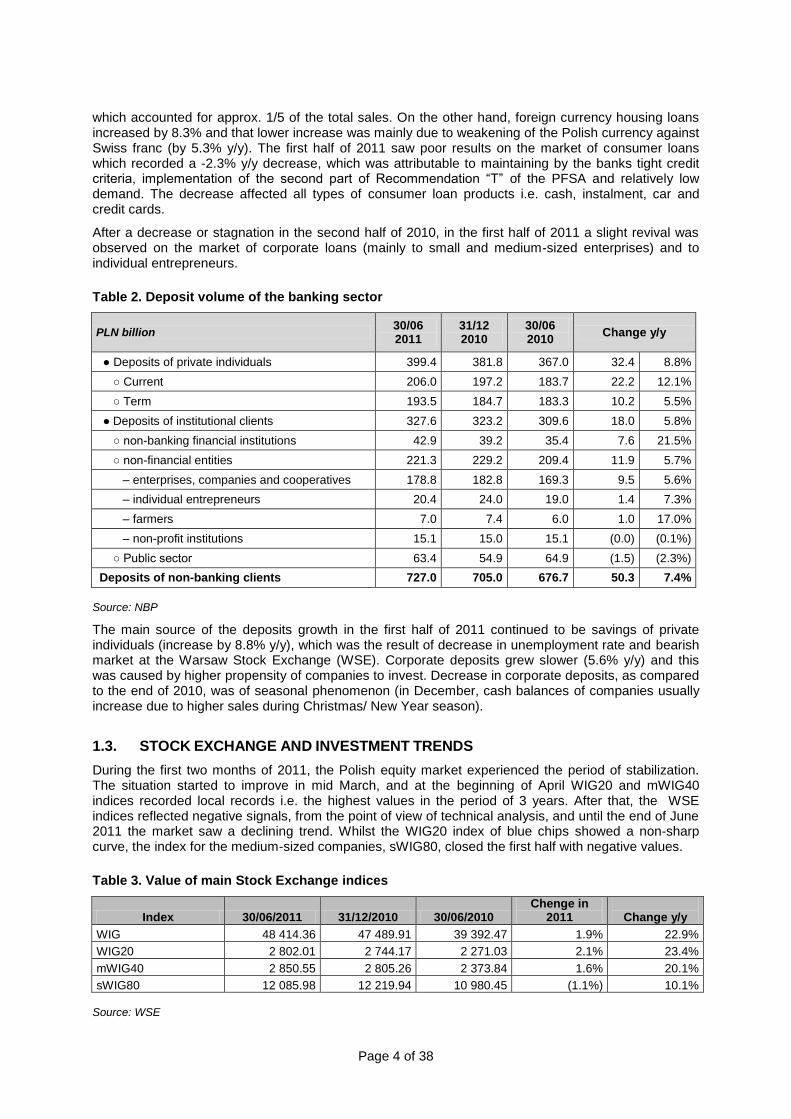
Table 2. Deposit volume of the banking sector
PLN billion 30/06 2011
31/12 2010
30/06 2010
Change y/y
● Deposits of private individuals 399.4 381.8 367.0 32.4 8.8%
○ Current 206.0 197.2 183.7 22.2 12.1%
○ Term 193.5 184.7 183.3 10.2 5.5%
● Deposits of institutional clients 327.6 323.2 309.6 18.0 5.8%
○ non-banking financial institutions 42.9 39.2 35.4 7.6 21.5%
○ non-financial entities 221.3 229.2 209.4 11.9 5.7%
– enterprises, companies and cooperatives 178.8 182.8 169.3 9.5 5.6%
– individual entrepreneurs 20.4 24.0 19.0 1.4 7.3%
– farmers 7.0 7.4 6.0 1.0 17.0%
– non-profit institutions 15.1 15.0 15.1 (0.0) (0.1%)
○ Public sector 63.4 54.9 64.9 (1.5) (2.3%)
Deposits of non-banking clients 727.0 705.0 676.7 50.3 7.4%
Source: NBP
The main source of the deposits growth in the first half of 2011 continued to be savings of private individuals (increase by 8.8% y/y), which was the result of decrease in unemployment rate and bearish market at the Warsaw Stock Exchange (WSE). Corporate deposits grew slower (5.6% y/y) and this was caused by higher propensity of companies to invest. Decrease in corporate deposits, as compared to the end of 2010, was of seasonal phenomenon (in December, cash balances of companies usually increase due to higher sales during Christmas/ New Year season).
1.3. STOCK EXCHANGE AND INVESTMENT TRENDS
During the first two months of 2011, the Polish equity market experienced the period of stabilization. The situation started to improve in mid March, and at the beginning of April WIG20 and mWIG40 indices recorded local records i.e. the highest values in the period of 3 years. After that, the WSE indices reflected negative signals, from the point of view of technical analysis, and until the end of June 2011 the market saw a declining trend. Whilst the WIG20 index of blue chips showed a non-sharp curve, the index for the medium-sized companies, sWIG80, closed the first half with negative values.
Table 3. Value of main Stock Exchange indices
Index 30/06/2011 31/12/2010 30/06/2010 Chenge in
2011
Change y/y
WIG 48 414.36 47 489.91 39 392.47 1.9% 22.9%
WIG20 2 802.01 2 744.17 2 271.03 2.1% 23.4%
mWIG40 2 850.55 2 805.26 2 373.84 1.6% 20.1%
sWIG80 12 085.98 12 219.94 10 980.45 (1.1%) 10.1% Source: WSE
Page 5 of 38
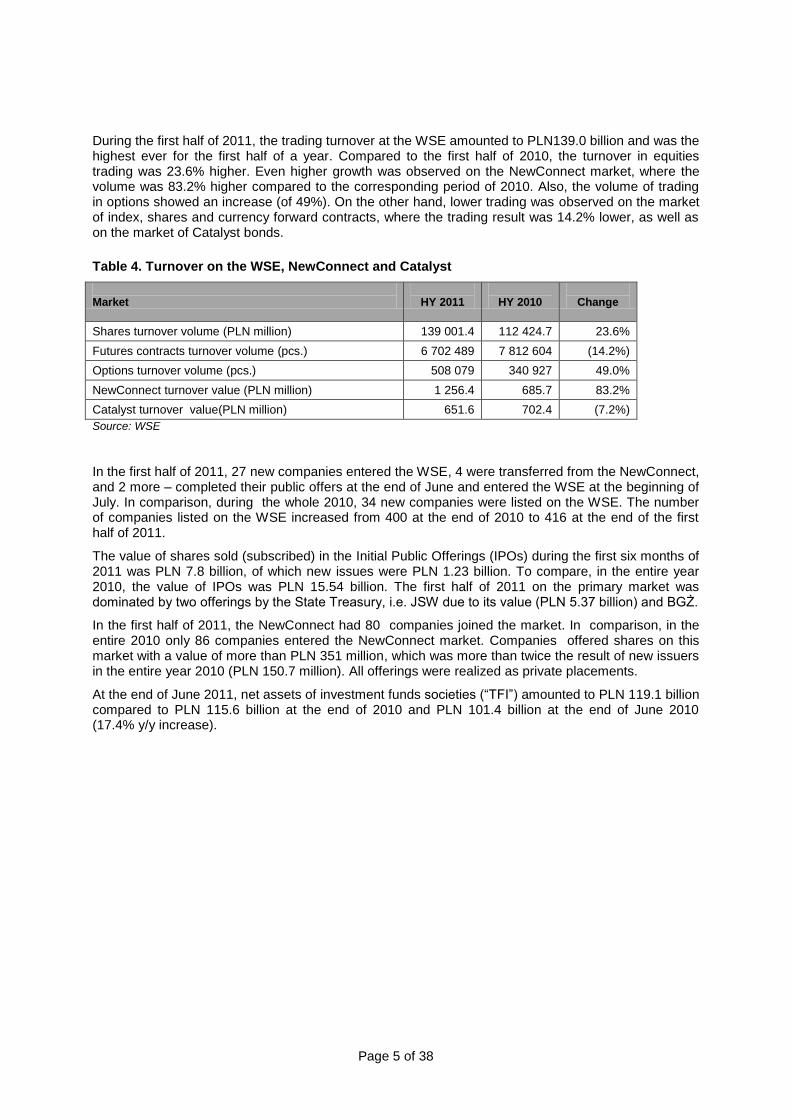
During the first half of 2011, the trading turnover at the WSE amounted to PLN139.0 billion and was the highest ever for the first half of a year. Compared to the first half of 2010, the turnover in equities trading was 23.6% higher. Even higher growth was observed on the NewConnect market, where the volume was 83.2% higher compared to the corresponding period of 2010. Also, the volume of trading in options showed an increase (of 49%). On the other hand, lower trading was observed on the market of index, shares and currency forward contracts, where the trading result was 14.2% lower, as well as on the market of Catalyst bonds.
Table 4. Turnover on the WSE, NewConnect and Catalyst
Market
HY 2011
HY 2010
Change
Shares turnover volume (PLN million) 139 001.4 112 424.7 23.6%
Futures contracts turnover volume (pcs.) 6 702 489 7 812 604 (14.2%)
Options turnover volume (pcs.) 508 079 340 927 49.0%
NewConnect turnover value (PLN million) 1 256.4 685.7 83.2%
Catalyst turnover value(PLN million) 651.6 702.4 (7.2%)
Source: WSE
In the first half of 2011, 27 new companies entered the WSE, 4 were transferred from the NewConnect, and 2 more – completed their public offers at the end of June and entered the WSE at the beginning of July. In comparison, during the whole 2010, 34 new companies were listed on the WSE. The number of companies listed on the WSE increased from 400 at the end of 2010 to 416 at the end of the first half of 2011.
The value of shares sold (subscribed) in the Initial Public Offerings (IPOs) during the first six months of 2011 was PLN 7.8 billion, of which new issues were PLN 1.23 billion. To compare, in the entire year 2010, the value of IPOs was PLN 15.54 billion. The first half of 2011 on the primary market was dominated by two offerings by the State Treasury, i.e. JSW due to its value (PLN 5.37 billion) and BGŻ.
In the first half of 2011, the NewConnect had 80 companies joined the market. In comparison, in the entire 2010 only 86 companies entered the NewConnect market. Companies offered shares on this market with a value of more than PLN 351 million, which was more than twice the result of new issuers in the entire year 2010 (PLN 150.7 million). All offerings were realized as private placements.
At the end of June 2011, net assets of investment funds societies (“TFI”) amounted to PLN 119.1 billion compared to PLN 115.6 billion at the end of 2010 and PLN 101.4 billion at the end of June 2010 (17.4% y/y increase).

Page 6 of 38
2. COMPOSITION OF THE CAPITAL GROUP AND METHODS USED FOR CONSOLIDATION OF THE FINANCIAL STATEMENTS
As of June 30, 2011, the Bank Gospodarki Żywnościowej S.A. Capital Group consisted of Bank Gospodarki Żywnościowej S.A. as the parent company and:
Bankowy Fundusz Nieruchomościowy Actus Sp. z o.o. – subsidiary,
BGŻ Leasing Sp. z o.o. – associated company.
Table 5. Consolidation scope
Entity name
Type of business
activities
Share of BGŻ S.A. in the share capital
Consolidation/val
uation method
Bankowy Fundusz Nieruchomościowy ACTUS Sp. z o.o.
Acquisition and disposal of properties
100.0% Full consolidation
BGŻ Leasing Sp. z o.o. Leasing activities 49.0% Equity method
3. IMPORTANT EVENTS IN BGŻ S.A. IN THE FIRST HALF OF 2011
22.04.2011 The Bank and Rabobank Nederland concluded an agreement under which Rabobank Nederland will provide the Bank with the funds amounting to CHF 1,008 million for the period of 12 years to finance the existing housing loans portfolio denominated in CHF - the credit facility will be made available in 18 tranches starting from April 29, 2011 to September 30, 2011. As of June 30, 2011, the Bank has already drawn 12 tranches of the loan amounting to CHF 756 million.
28.04.2011 The Polish Financial Supervision Authority approved the prospectus prepared by BGŻ S.A. in connection with the public offering of shares series A and D and with the intention to apply for admission to trading with shares series A, B, C, D, E and F on the regulated market. On April 29, the PFSA approved Annex No.1 to the prospectus, which included information about fixing the Maximum Share Price for the subscription of Individual Investors. The price was set at the PLN 90.00 per 1 share. The Prospectus was published on May 4, 2011.
17.05.2011 The State Treasury, in agreement with the Global Coordinators and DM PKO BP Brokerage House (the Co-Offering Agent) set the selling price at PLN 60 per share and the final number of shares to be sold under the offering at 5,200,000 constituting 12.05% of the Bank‟s share capital.
27.05.2011 The first listing of the Bank‟s shares on the Warsaw Stock Exchange took place on May 27, 2011. The debut price was PLN 62.50 per share. The Bank‟s shares are traded in continuous trading system under abbreviated name “BGZ” and marked as “BGZ”.
2.06.2011 The Moody‟s Investors Service rating agency downgraded the Bank‟s long-term deposits rating from A3 to Baa1.
Page 7 of 38
4. AUTHORITIES OF THE PARENT COMPANY
4.1.1. CHANGES IN THE COMPOSITION OF THE SUPERVISORY BOARD
The composition of the Bank‟s Supervisory Board in the period between January 1, and June 30, 2011 was following:
Jan Alexander Pruijs – President of the Supervisory Board,
Agata Rowińska – Vice-President of the Supervisory Board (resignation on May 31, 2011),
Roelof Dekker – Member of the Supervisory Board,
Jarosław Iwanicki - Member of the Supervisory Board,
Harry de Roo - Member of the Supervisory Board,
Andrzej Zdebski - Member of the Supervisory Board,
Waldemar Maj - Member of the Supervisory Board,
Hendrik Adams - Member of the Supervisory Board.
4.1.2. CHANGES IN THE COMPOSITION OF THE MANAGEMENT BOARD
The composition of the Bank‟s Management Board in the period between January 1, and June 30, 2011 was following:
Jacek Bartkiewicz – President of the Management Board,
Hieronymus Nijsen – The first Vice-President of the Management Board (resignation on March 31, 2011),
Gerardus Cornelis Embrechts – The first Vice-President of the Management Board (appointed on April 1, 2011),
Witold Okarma – Vice-President of the Management Board,
Andrzej Sieradz – Vice-President of the Management Board,
Johannes Gerardus Beuming – Vice-President of the Management Board (appointed on May 1, 2011),
Dariusz Odzioba – Vice-President of the Management Board (appointed on May 10, 2011),
Wojciech Sass – Vice-President of the Management Board (appointed on June 15, 2011).
5. EXTERNAL ASSESSMENTS OF THE PARENT COMPANY
5.1. RATINGS
The Bank is rate by the Moody‟s Investors Service rating agency. On 2 June 2011, the Moody's Investors Service downgraded its long-term deposit rating of the Bank to Baa1 from A3, with negative outlook. The Bank's standalone financial strength rating (“BFSR”) of D was not affected and remains on a stable outlook. The short-term bank-deposit rating of Prime-2 remains unchanged. According to Moody‟s the downgrade reflects the change in ownership structure of the Bank following the IPO, and the rating agency‟s view that this results in greater uncertainty regarding the potential for exceptional parental or systemic support in case of need. The long-term deposit rating nonetheless continues to factor in a very high expectation of the parental support and a medium expectation of the systemic support. The negative outlook on the supported long-term deposit rating was influenced by the potential for further disposal of the government‟s remaining stake in the Bank as well as the negative outlook on stand-alone BFSR rating of the Bank‟s majority shareholder.
Page 8 of 38
6. SHAREHOLDING STRUCTURE OF THE PARENT COMPANY
The Initial Public Offering of the Bank’s shares
On October 14, 2010, the Extraordinary General Meeting of Shareholders agreed to apply for admission of the Bank‟s shares for trading on a regulated market and their dematerialization. The subject of the IPO was to be 16,046,596 ordinary shares constituting 37.20% shares held by the State Treasury.
On April 28, 2011, the PFSA approved the prospectus prepared by BGŻ S.A. in connection with the public offering of shares series A and D and with the intention to apply for admission to trading with shares series A, B, C, D, E and F on the regulated market. On April 29, the PFSA approved Annex No.1 to the prospectus, which included information about fixing the Maximum Share Price for subscription of Individual Investors. The price was set at PLN 90.00 per share. The Prospectus was published on May 4, 2011.
On May 17, 2011, the State Treasury, in agreement with the Global Coordinators and DM PKO BP Brokerage House (the Co-Offering Agent) set the Sale Shares selling price at PLN 60 per share and the final number of Sale Shares under the offering to 5,200,000 Sale Shares constituting 12.05% of the Bank‟s share capital
The first listing of the Bank‟s shares on the Warsaw Stock Exchange occurred on May 27, 2011.
As part of the stabilization programme, the State Treasury repurchased 149,935 Bank‟s shares. As of June 30, 2011 the State Treasury owned 25.52% of the Bank‟s share capital.
Free-of-charge distribution to employees of the Bank’s shares owned by the State Treasury
In the first half of 2011 the Bank continued – on behalf of the State Treasury – entering into agreements concerning free-of-charge disposal of shares of BGŻ SA to entitled persons under the Act on functioning of cooperative banks, their joining together and the banks bringing together cooperative banks amended on 16 February 2007 and based on the Decree of the Minister of the State Treasury dated 2 August 2007 amending the decree concerning the manner of distributing to entitled persons 15% of shares in Bank BGŻ S.A. held by the State Treasury. During the first half of 2011, 27 such agreements were signed with respect to 1 492 shares. These transactions caused a slight decrease of the State Treasury share in the Bank‟s share capital.
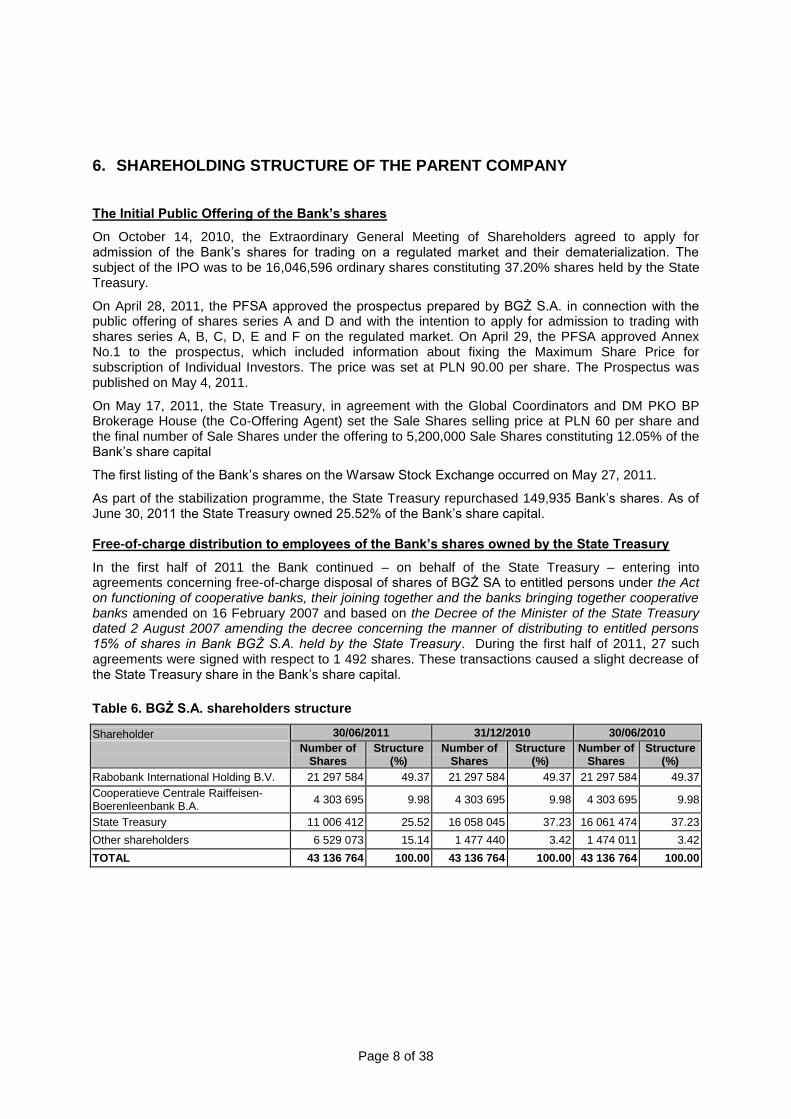
Table 6. BGŻ S.A. shareholders structure
Shareholder 30/06/2011 31/12/2010 30/06/2010
Number of
Shares Structure
(%) Number of
Shares Structure
(%) Number of
Shares Structure
(%)
Rabobank International Holding B.V. 21 297 584 49.37 21 297 584 49.37 21 297 584 49.37
Cooperatieve Centrale Raiffeisen-Boerenleenbank B.A.
4 303 695 9.98 4 303 695 9.98 4 303 695 9.98
State Treasury 11 006 412 25.52 16 058 045 37.23 16 061 474 37.23
Other shareholders 6 529 073 15.14 1 477 440 3.42 1 474 011 3.42
TOTAL 43 136 764 100.00 43 136 764 100.00 43 136 764 100.00
Page 9 of 38
7. FINANCIAL POSITION OF THE BGŻ S.A. CAPITAL GROUP
7.1. FINANCIAL POSITION IN THE FIRST HALF OF 2011 COMPARED WITH THE FIRST
HALF OF 2010
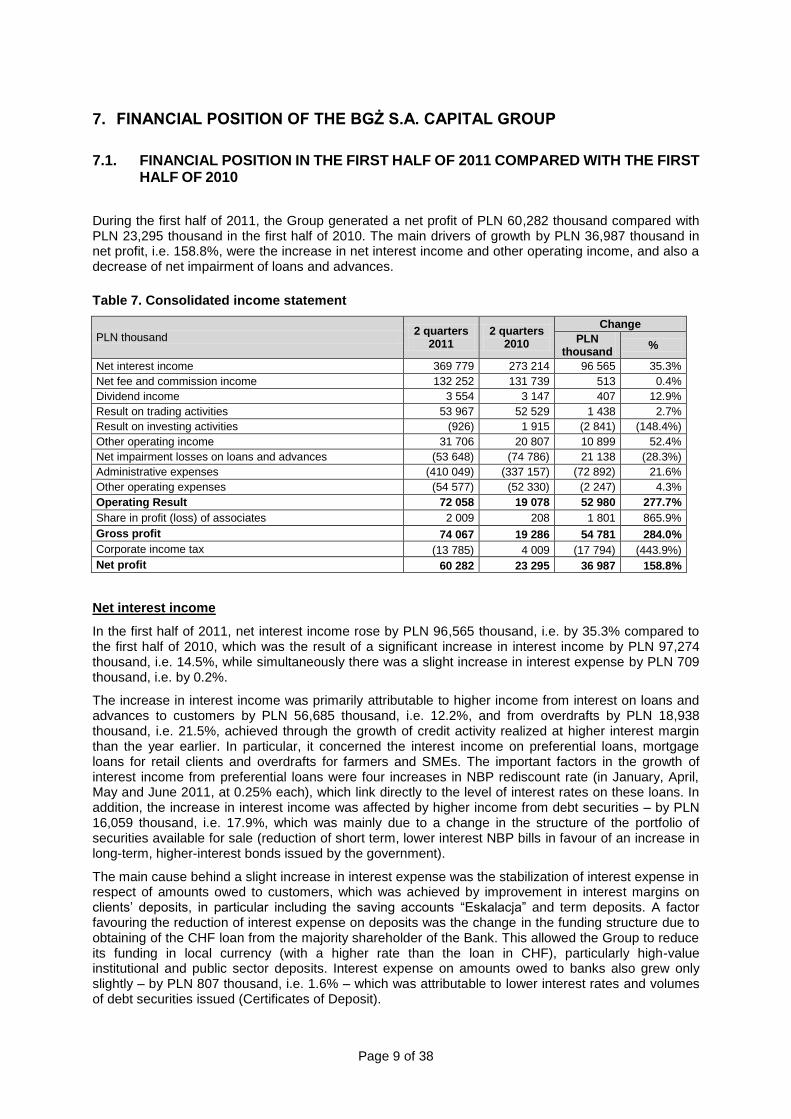
During the first half of 2011, the Group generated a net profit of PLN 60,282 thousand compared with PLN 23,295 thousand in the first half of 2010. The main drivers of growth by PLN 36,987 thousand in net profit, i.e. 158.8%, were the increase in net interest income and other operating income, and also a decrease of net impairment of loans and advances.
Table 7. Consolidated income statement
PLN thousand 2 quarters
2011 2 quarters
2010
Change
PLN thousand
%
Net interest income 369 779 273 214 96 565 35.3%
Net fee and commission income 132 252 131 739 513 0.4%
Dividend income 3 554 3 147 407 12.9%
Result on trading activities 53 967 52 529 1 438 2.7%
Result on investing activities (926) 1 915 (2 841) (148.4%)
Other operating income 31 706 20 807 10 899 52.4%
Net impairment losses on loans and advances (53 648) (74 786) 21 138 (28.3%)
Administrative expenses (410 049) (337 157) (72 892) 21.6%
Other operating expenses (54 577) (52 330) (2 247) 4.3%
Operating Result 72 058 19 078 52 980 277.7%
Share in profit (loss) of associates 2 009 208 1 801 865.9%
Gross profit 74 067 19 286 54 781 284.0%
Corporate income tax (13 785) 4 009 (17 794) (443.9%)
Net profit 60 282 23 295 36 987 158.8%
Net interest income
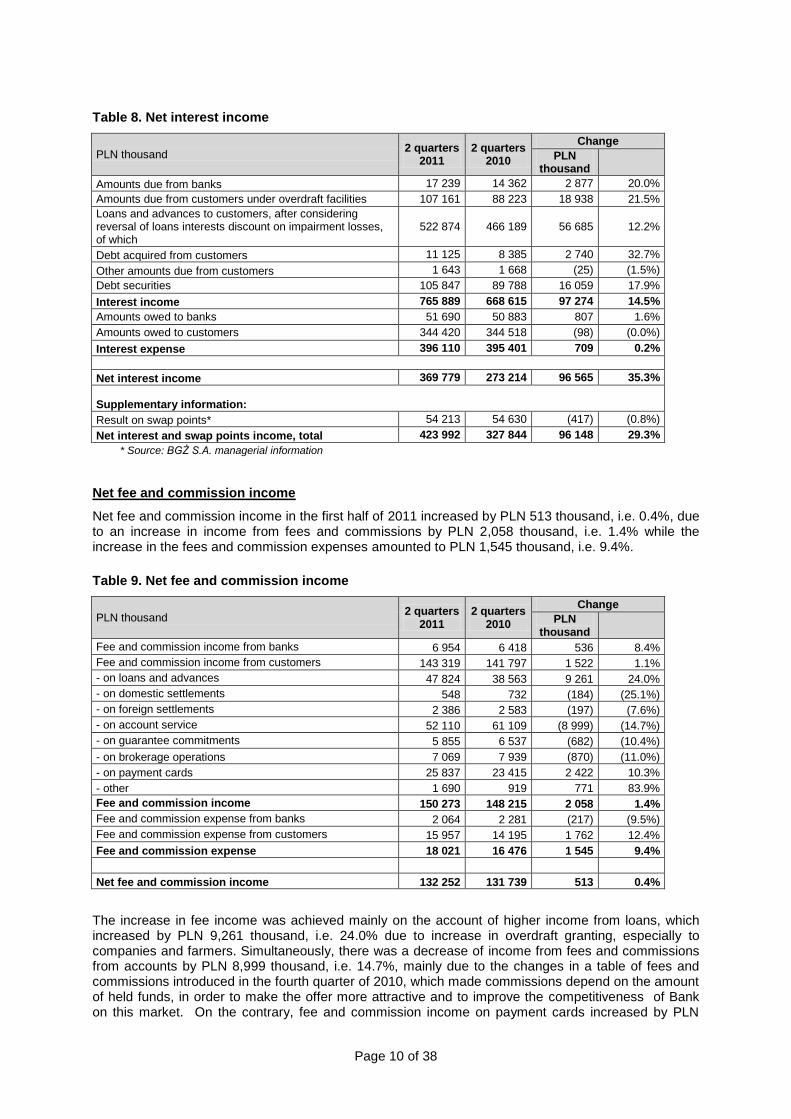
In the first half of 2011, net interest income rose by PLN 96,565 thousand, i.e. by 35.3% compared to the first half of 2010, which was the result of a significant increase in interest income by PLN 97,274 thousand, i.e. 14.5%, while simultaneously there was a slight increase in interest expense by PLN 709 thousand, i.e. by 0.2%.
The increase in interest income was primarily attributable to higher income from interest on loans and advances to customers by PLN 56,685 thousand, i.e. 12.2%, and from overdrafts by PLN 18,938 thousand, i.e. 21.5%, achieved through the growth of credit activity realized at higher interest margin than the year earlier. In particular, it concerned the interest income on preferential loans, mortgage loans for retail clients and overdrafts for farmers and SMEs. The important factors in the growth of interest income from preferential loans were four increases in NBP rediscount rate (in January, April, May and June 2011, at 0.25% each), which link directly to the level of interest rates on these loans. In addition, the increase in interest income was affected by higher income from debt securities – by PLN 16,059 thousand, i.e. 17.9%, which was mainly due to a change in the structure of the portfolio of securities available for sale (reduction of short term, lower interest NBP bills in favour of an increase in long-term, higher-interest bonds issued by the government).
The main cause behind a slight increase in interest expense was the stabilization of interest expense in respect of amounts owed to customers, which was achieved by improvement in interest margins on clients‟ deposits, in particular including the saving accounts “Eskalacja” and term deposits. A factor favouring the reduction of interest expense on deposits was the change in the funding structure due to obtaining of the CHF loan from the majority shareholder of the Bank. This allowed the Group to reduce its funding in local currency (with a higher rate than the loan in CHF), particularly high-value institutional and public sector deposits. Interest expense on amounts owed to banks also grew only slightly – by PLN 807 thousand, i.e. 1.6% – which was attributable to lower interest rates and volumes of debt securities issued (Certificates of Deposit).
Page 10 of 38
Table 8. Net interest income
PLN thousand 2 quarters
2011 2 quarters
2010
Change
PLN thousand
Amounts due from banks 17 239 14 362 2 877 20.0%
Amounts due from customers under overdraft facilities 107 161 88 223 18 938 21.5%
Loans and advances to customers, after considering reversal of loans interests discount on impairment losses, of which
522 874 466 189 56 685 12.2%
Debt acquired from customers 11 125 8 385 2 740 32.7%
Other amounts due from customers 1 643 1 668 (25) (1.5%)
Debt securities 105 847 89 788 16 059 17.9%
Interest income 765 889 668 615 97 274 14.5%
Amounts owed to banks 51 690 50 883 807 1.6%
Amounts owed to customers 344 420 344 518 (98) (0.0%)
Interest expense 396 110 395 401 709 0.2%
Net interest income 369 779 273 214 96 565 35.3%
Supplementary information:
Result on swap points* 54 213 54 630 (417) (0.8%)
Net interest and swap points income, total 423 992 327 844 96 148 29.3%
* Source: BGŻ S.A. managerial information
Net fee and commission income
Net fee and commission income in the first half of 2011 increased by PLN 513 thousand, i.e. 0.4%, due to an increase in income from fees and commissions by PLN 2,058 thousand, i.e. 1.4% while the increase in the fees and commission expenses amounted to PLN 1,545 thousand, i.e. 9.4%.
Table 9. Net fee and commission income
PLN thousand 2 quarters
2011 2 quarters
2010
Change
PLN thousand
Fee and commission income from banks 6 954 6 418 536 8.4%
Fee and commission income from customers 143 319 141 797 1 522 1.1%
- on loans and advances 47 824 38 563 9 261 24.0%
- on domestic settlements 548 732 (184) (25.1%)
- on foreign settlements 2 386 2 583 (197) (7.6%)
- on account service 52 110 61 109 (8 999) (14.7%)
- on guarantee commitments 5 855 6 537 (682) (10.4%)
- on brokerage operations 7 069 7 939 (870) (11.0%)
- on payment cards 25 837 23 415 2 422 10.3%
- other 1 690 919 771 83.9%
Fee and commission income 150 273 148 215 2 058 1.4%
Fee and commission expense from banks 2 064 2 281 (217) (9.5%)
Fee and commission expense from customers 15 957 14 195 1 762 12.4%
Fee and commission expense 18 021 16 476 1 545 9.4%
Net fee and commission income 132 252 131 739 513 0.4%
The increase in fee income was achieved mainly on the account of higher income from loans, which increased by PLN 9,261 thousand, i.e. 24.0% due to increase in overdraft granting, especially to companies and farmers. Simultaneously, there was a decrease of income from fees and commissions from accounts by PLN 8,999 thousand, i.e. 14.7%, mainly due to the changes in a table of fees and commissions introduced in the fourth quarter of 2010, which made commissions depend on the amount of held funds, in order to make the offer more attractive and to improve the competitiveness of Bank on this market. On the contrary, fee and commission income on payment cards increased by PLN
Page 11 of 38
2,422 thousand, i.e. by 10.3% - mainly due to good sales of the new retail account introduced in November 2010 („Konto z Podwyżką”).
Fee and commission expenses increased mainly due to the fact that since November 2010 and throughout the first half of 2011 the Bank bore the additional commission expenses associated with the introduction the new account „Konto z Podwyżką”, where customers are provided with a premium of 1% of inflow on this account, subject to certain conditions.
Dividend income
Dividend income in the first half of 2011 increased by PLN 407 thousand, i.e. 12.9%. It consisted of dividends on shares of the Bank in Krajowa Izba Rozliczeniowa SA – the National Clearing House SA (KIR), Biuro Informacji Kredytowej SA – the Credit Information Bureau SA (BIK) and the Warsaw Stock Exchange (GPW), from the net profits of these companies for 2010, approved by respective General Shareholder Meetings. The growth was mainly attributed to higher dividend from BIK.
Result on trading activities and result on investing activities
Result on trading activities increased slightly, by PLN 1,438 thousand, i.e. 2.7% and consisted mainly of swap points realized from foreign exchange swap transactions.
The growth of result on trading activity was limited by a change of external financing as a result of obtaining the CHF loan (see note 4.8 to financial statements). With direct funding in CHF, the Bank reduced the scale of swap transactions, which hedge the currency risk and interest rate risk of so-called old portfolio of foreign currency mortgage loans to retail customers, granted before April 2009. As a result of limiting the swap portfolio, there was a decrease in the result on swap points, recognized in the result on trading activities, in favour of the growth of net interest income as an effect of replacing higher interest-bearing PLN funding with lower interest-bearing CHF funding.
Result on investing activities in the first half of 2011 decreased by PLN 2,841 thousand and reached a negative value of PLN 926 thousand, compared with a positive result at PLN 1,915 thousand in the first half of 2010. The main component of the result in the first half of 2010 were the proceeds realized from the sale of shares in VISA Inc. amounting to PLN 1,627 thousand, while the loss shown in the first half of 2011 was realized on portfolio of securities available for sale.
Other operating income
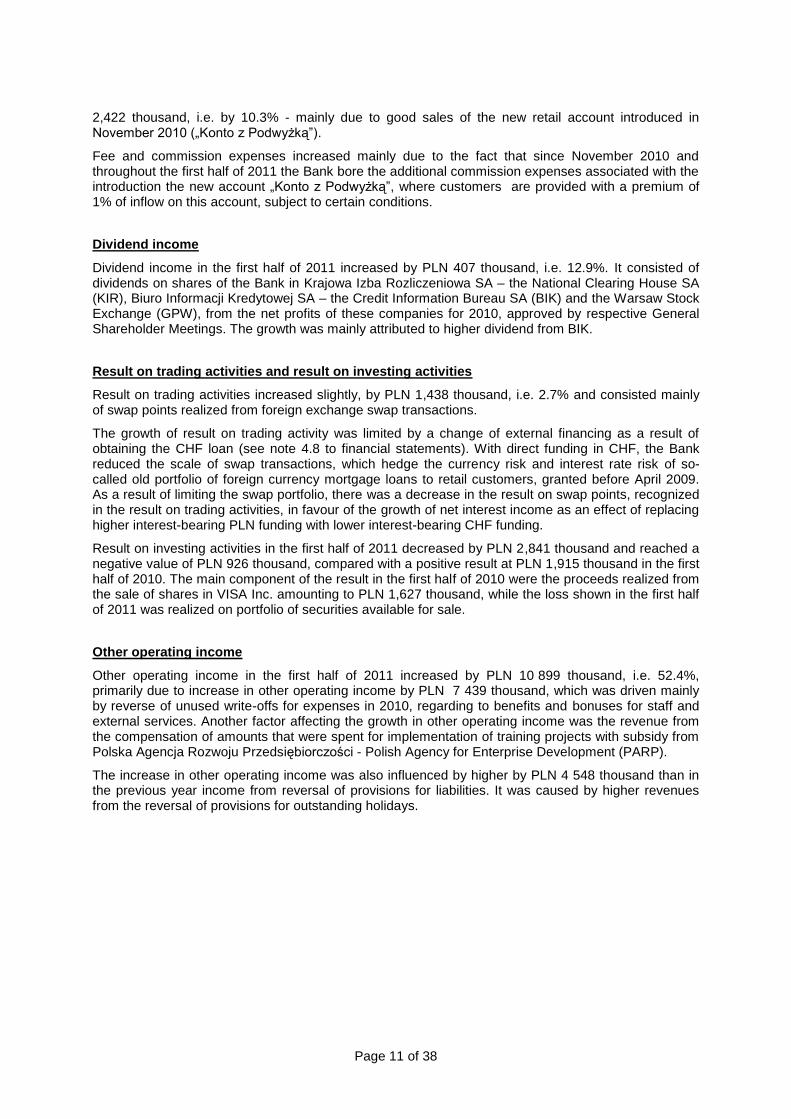
Other operating income in the first half of 2011 increased by PLN 10 899 thousand, i.e. 52.4%, primarily due to increase in other operating income by PLN 7 439 thousand, which was driven mainly by reverse of unused write-offs for expenses in 2010, regarding to benefits and bonuses for staff and external services. Another factor affecting the growth in other operating income was the revenue from the compensation of amounts that were spent for implementation of training projects with subsidy from Polska Agencja Rozwoju Przedsiębiorczości - Polish Agency for Enterprise Development (PARP).
The increase in other operating income was also influenced by higher by PLN 4 548 thousand than in the previous year income from reversal of provisions for liabilities. It was caused by higher revenues from the reversal of provisions for outstanding holidays.
Page 12 of 38
Table 10. Other operating income
PLN thousand 2
quarters 2011
2 quarters
2010
Change
PLN thousand
%
From management of third-party properties 946 519 427 82.3%
From sale or liquidation of property, plant and equipment, intangible assets and assets held-for-sale 1 314 2 134 (820) (38.4%)
From recovered statute –barred receivables, written off or bad debts, repayments of derecognized receivables 2 367 3 463 (1 096) (31.6%)
Sales of goods and services 4 818 4 504 314 7.0%
Reversal of provisions for other receivables (excluding loan receivables) 335 348 (13) (3.7%)
Reversal of impairment allowances for fixed assets - - - -
Reversal of provisions for liabilities 7 255 2 707 4 548 168.0%
From recovery of costs incurred 905 805 100 12.4%
Valuation of investment property - - - -
Other operating income 13 766 6 327 7 439 117.6%
Total other operating income 31 706 20 807 10 899 52.4%
Net impairment losses on loans and advances
Net impairment losses on loans and advances decreased by PLN 21,138 thousand, i.e. 28.3%. It was mainly the result of significantly lower write-offs for cash loans for retail customers and loans to businesses. Impairment losses on mortgage loans in the first half of 2011 reached a level similar to that recorded in the first half of 2010.
As at the end of the first half of 2011 the share of impaired loans in the portfolio of gross loans and advances to customers amounted to 6.3% compared to 6.4% at the end of 2010 and 6.2% at the end of the first half of 2010.
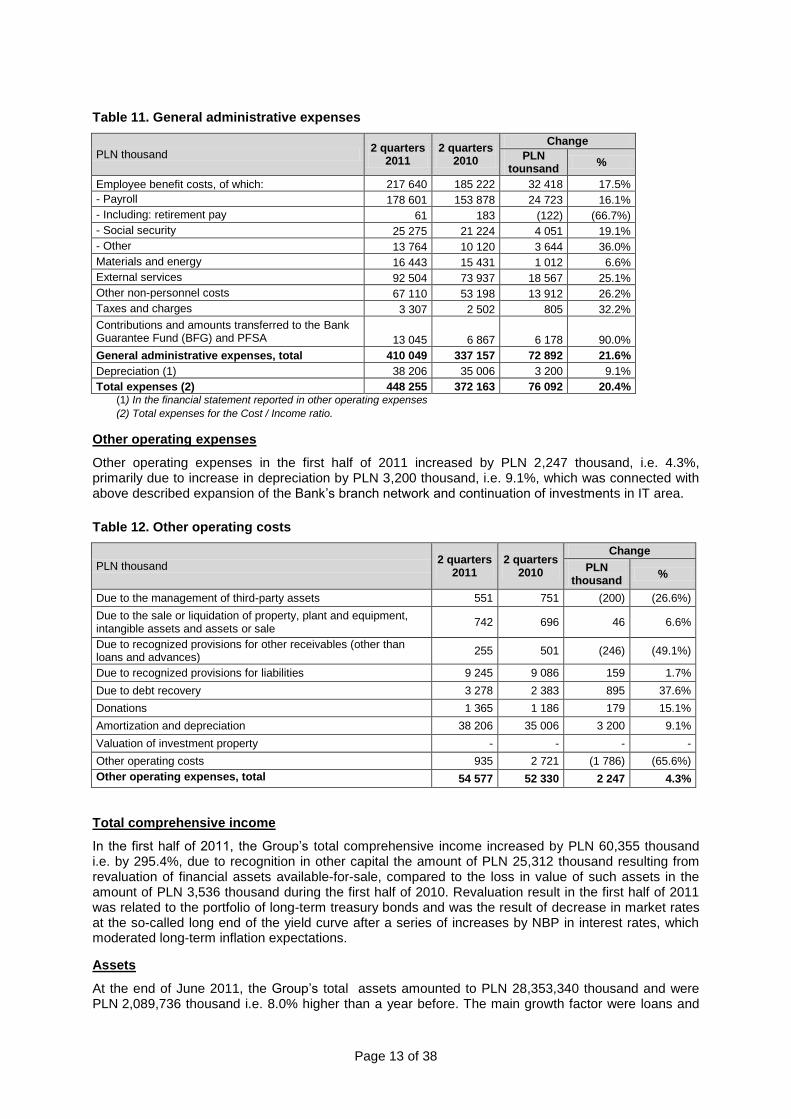
General administrative expenses
General administrative expenses rose by PLN 72,892 thousand, i.e. 21.6%, mainly due to higher staff costs, external services, other material expenses and premiums and contribution to the BFG and the PFSA. The increase in each of the above-mentioned categories of expenses was partly caused by the fact, that about ¾ of 61 new branches opened in 2010 was launched in the second half of the year (and therefore the expenses incurred by those branches almost did not influence Bank‟s expenses during the first half of 2010), additionally in the first half of 2011 the Bank launched next 25 new branches.
The increase in staff expenses by PLN 32,418 thousand, i.e. 17.5% resulted from an increase in accruals for employees bonus (in 2010 the Bank applied the restrictions on employee bonuses introduced back in 2009), employment growth attributable to the continued expansion of the branch network, and the adjustment of the remuneration policy (from 1 April) in response to the increase in competition in the labour market within the banking sector.
The increase in the external services expenses by PLN 18,567 thousand, i.e. 25.1%, was caused by the increase in Bank‟s demand for advisory services related to the preparation for IPO. The total IPO costs included in the first half of 2011 amounted to PLN 12,089 thousand.
The increase in other overhead expenses by PLN 13,912 thousand, i.e. 26.2%, was mainly due to the expansion of the Bank‟s network, which has boosted the cost of renting premises. The increase in costs of premiums and contributions to BFG and the PFSA was due to the more than twofold increase in fees for BFG effective in 2011 compared with the previous year.
In the first half of 2011 the Bank incurred costs connected with scheduled launch of internet direct banking. They amounted to PLN 211 thousand and regarded to advisory and consulting services, marketing research and space rental.
Page 13 of 38
Table 11. General administrative expenses
PLN thousand 2 quarters
2011 2 quarters
2010
Change
PLN tounsand
%
Employee benefit costs, of which: 217 640 185 222 32 418 17.5%
- Payroll 178 601 153 878 24 723 16.1%
- Including: retirement pay 61 183 (122) (66.7%)
- Social security 25 275 21 224 4 051 19.1%
- Other 13 764 10 120 3 644 36.0%
Materials and energy 16 443 15 431 1 012 6.6%
External services 92 504 73 937 18 567 25.1%
Other non-personnel costs 67 110 53 198 13 912 26.2%
Taxes and charges 3 307 2 502 805 32.2%
Contributions and amounts transferred to the Bank Guarantee Fund (BFG) and PFSA 13 045 6 867 6 178 90.0%
General administrative expenses, total 410 049 337 157 72 892 21.6%
Depreciation (1) 38 206 35 006 3 200 9.1%
Total expenses (2) 448 255 372 163 76 092 20.4% (1) In the financial statement reported in other operating expenses
(2) Total expenses for the Cost / Income ratio.
Other operating expenses
Other operating expenses in the first half of 2011 increased by PLN 2,247 thousand, i.e. 4.3%, primarily due to increase in depreciation by PLN 3,200 thousand, i.e. 9.1%, which was connected with above described expansion of the Bank‟s branch network and continuation of investments in IT area.
Table 12. Other operating costs
PLN thousand 2 quarters
2011 2 quarters
2010
Change
PLN thousand
%
Due to the management of third-party assets 551 751 (200) (26.6%)
Due to the sale or liquidation of property, plant and equipment, intangible assets and assets or sale
742 696 46 6.6%
Due to recognized provisions for other receivables (other than loans and advances)
255 501 (246) (49.1%)
Due to recognized provisions for liabilities 9 245 9 086 159 1.7%
Due to debt recovery 3 278 2 383 895 37.6%
Donations 1 365 1 186 179 15.1%
Amortization and depreciation 38 206 35 006 3 200 9.1%
Valuation of investment property - - - -
Other operating costs 935 2 721 (1 786) (65.6%)
Other operating expenses, total 54 577 52 330 2 247 4.3%
Total comprehensive income
In the first half of 2011, the Group‟s total comprehensive income increased by PLN 60,355 thousand i.e. by 295.4%, due to recognition in other capital the amount of PLN 25,312 thousand resulting from revaluation of financial assets available-for-sale, compared to the loss in value of such assets in the amount of PLN 3,536 thousand during the first half of 2010. Revaluation result in the first half of 2011 was related to the portfolio of long-term treasury bonds and was the result of decrease in market rates at the so-called long end of the yield curve after a series of increases by NBP in interest rates, which moderated long-term inflation expectations.
Assets
At the end of June 2011, the Group‟s total assets amounted to PLN 28,353,340 thousand and were PLN 2,089,736 thousand i.e. 8.0% higher than a year before. The main growth factor were loans and

Page 14 of 38
advances granted to customers, which increased by PLN 2,085,104 thousand i.e. 11.0 %, mainly due to increase in overdraft facilities for companies and farmers, investment loans for companies and preference loans for farmers.
Table 13. Assets
PLN thousand 30/06 2011
31/12 2010
30/06 2010
Change y/y
PLN thousand
%
Cash and balances with the Central Bank 1 114 603 1 379 737 788 730 325 873 41.3%
Amounts due from other banks 213 575 280 920 347 087 (133 512) (38.5%)
Receivables arising from reverse repo transactions 255 391 651 706 256 327 (936) (0.4%)
Held-for-trading securities 812 238 1 814 899 1 025 023 (212 785) (20.8%)
Derivative financial instruments 200 599 220 987 428 958 (228 359) (53.2%)
Loans and advances to customers 21 047 493 19 869 177 18 962 389 2 085 104 11.0%
Securities available for sale 3 603 734 3 290 675 3 380 516 223 218 6.6%
Other debt securities 55 700 109 232 161 526 (105 826) (65.5%)
Investment property 63 900 63 900 63 200 700 1.1%
Investments in subsidiaries and associates 33 514 31 542 30 062 3 452 11.5%
Intangible assets 90 081 96 787 88 637 1 444 1.6%
Property, plant and equipment 462 190 464 818 438 958 23 232 5.3%
Deferred tax asset 213 814 232 141 182 867 30 947 16.9%
Current tax asset 44 800 44 800 - 44 800 -
Other assets 141 708 78 278 109 324 32 384 29.6%
TOTAL ASSETS 28 353 340 28 629 599 26 263 604 2 089 736 8.0%
Liabilities and equity
At the end of June 2011, total Group‟s liabilities amounted to PLN 25,777,538 thousand and were PLN 1,920,730 thousand i.e. 7.9% higher than compared to the previous year. The main growth factor were liabilities to other banks, which increased by PLN 2,981,062 thousand, i.e. 299.8%, mainly due to the CHF loan granted to the Bank by the majority shareholder.
Table 14. Liabilities and equity
PLN thousand 30/06 2011
31/12 2010
30/06 2010
Change y/y
PLN thousand
%
Amounts owed to other banks 3 975 562 1 020 419 994 500 2 981 062 299.8%
Liabilities arising from repo transactions - 1 268 921 360 334 (360 334) (100.0%)
Derivative financial instruments and other liabilities held for trading 363 126 732 098 827 933 (464 807) (56.1%)
Amounts owed to customers 19 548 216 21 051 715 19 390 711 157 505 0.8%
Liabilities from issued debt securities 1 434 622 1 745 198 1 886 119 (451 497) (23.9%)
Other liabilities 380 575 241 895 279 008 101 567 36,4%
Deferred tax liability 9 814 9 814 9 681 133 1.4%
Current tax liabilities 17 3 38 379 (38 362) (100.0%)
Provisions 40 494 41 697 43 399 (2 905) (6.7%)
Liabilities arising from employee benefits 25 112 22 822 26 744 (1 632) (6.1%)
TOTAL LIABILITIES 25 777 538 26 134 582 23 856 808 920 730 8,1%
Issued share capital 43 137 43 137 43 137 - -
Reserve capital 2 332 656 2 220 155 2 220 155 112 501 5.1%
Accumulated profit/ (loss) from previous years 8 327 8 487 8 487 (160) (1.9%)
Other reserves 131 400 110 897 111 722 19 678 17.6%
Undistributed profit 60 282 112 341 23 295 36 987 158.8%
EQUITY 2 575 802 2 495 017 2 406 796 169 006 7.0%
LIABILITIES AND EQUITY 28 353 340 28 629 599 26 263 604 2 089 736 8,0%
Page 15 of 38
As regards amounts owed to customers, an important factor was the decrease in the balance of deposits from budget sector by PLN 967,001 thousand as compared with end of June 2010. That was related to coming into force, as of 1 July 2011, of the new law on consolidating of funds of selected state agencies in the state-owned bank, Bank Gospodarstwa Krajowego S.A. (“BGK”). The above change in regulations was concerned with one of the most important deposit clients of the Bank, i.e. a government agency operating in the agricultural sector. At the same time, the outflow of deposits was balanced by an increase in other client deposits, mainly deposits from other financial entities, and to a lesser degree – from individual clients, farmers and enterprises. As a result, total liabilities towards clients increased in the reporting period by PLN 157,505 thousand i.e. by 0.8%. Securing funding from the Bank‟s majority shareholder allowed the Group to limit use of funds from the issuance of certificates of deposits ( CDs), the portfolio of which decreased by PLN 451 497 thousand i.e. by 23.9% compared to the end of June 2010.
At the end of June 2011, total Group‟s equity amounted to PLN 2,575,802 thousand and was PLN 169,006 thousand i.e. 7.0% higher than a year before. The increase was the result of retaining net profit for the year 2010, as well as in the increase in the revaluation reserve for financial assets available-for-sale, with the growth rationale described in the section Total income.
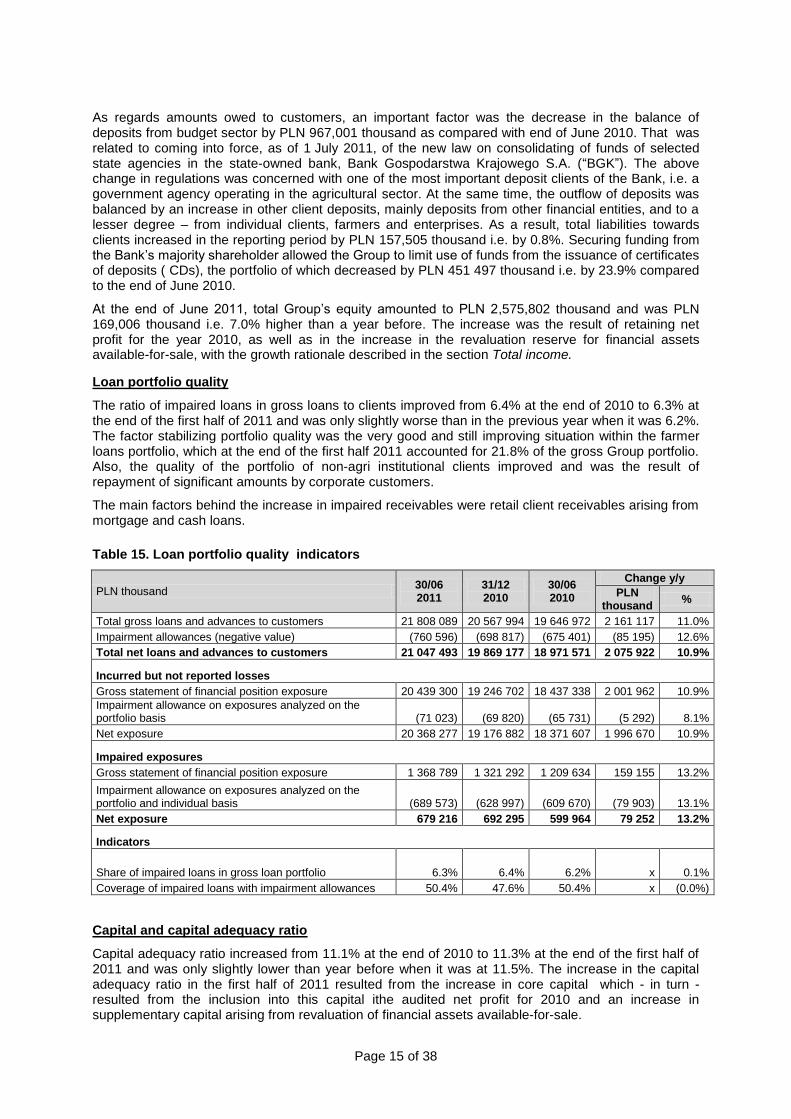
Loan portfolio quality
The ratio of impaired loans in gross loans to clients improved from 6.4% at the end of 2010 to 6.3% at the end of the first half of 2011 and was only slightly worse than in the previous year when it was 6.2%. The factor stabilizing portfolio quality was the very good and still improving situation within the farmer loans portfolio, which at the end of the first half 2011 accounted for 21.8% of the gross Group portfolio. Also, the quality of the portfolio of non-agri institutional clients improved and was the result of repayment of significant amounts by corporate customers.
The main factors behind the increase in impaired receivables were retail client receivables arising from mortgage and cash loans.
Table 15. Loan portfolio quality indicators
PLN thousand 30/06 2011
31/12 2010
30/06 2010
Change y/y
PLN thousand
%
Total gross loans and advances to customers 21 808 089 20 567 994 19 646 972 2 161 117 11.0%
Impairment allowances (negative value) (760 596) (698 817) (675 401) (85 195) 12.6%
Total net loans and advances to customers 21 047 493 19 869 177 18 971 571 2 075 922 10.9%
Incurred but not reported losses Gross statement of financial position exposure 20 439 300 19 246 702 18 437 338 2 001 962 10.9%
Impairment allowance on exposures analyzed on the portfolio basis (71 023) (69 820) (65 731) (5 292) 8.1%
Net exposure 20 368 277 19 176 882 18 371 607 1 996 670 10.9%
Impaired exposures Gross statement of financial position exposure 1 368 789 1 321 292 1 209 634 159 155 13.2%
Impairment allowance on exposures analyzed on the portfolio and individual basis (689 573) (628 997) (609 670) (79 903) 13.1%
Net exposure 679 216 692 295 599 964 79 252 13.2%
Indicators
Share of impaired loans in gross loan portfolio 6.3% 6.4% 6.2% x 0.1%
Coverage of impaired loans with impairment allowances 50.4% 47.6% 50.4% x (0.0%)
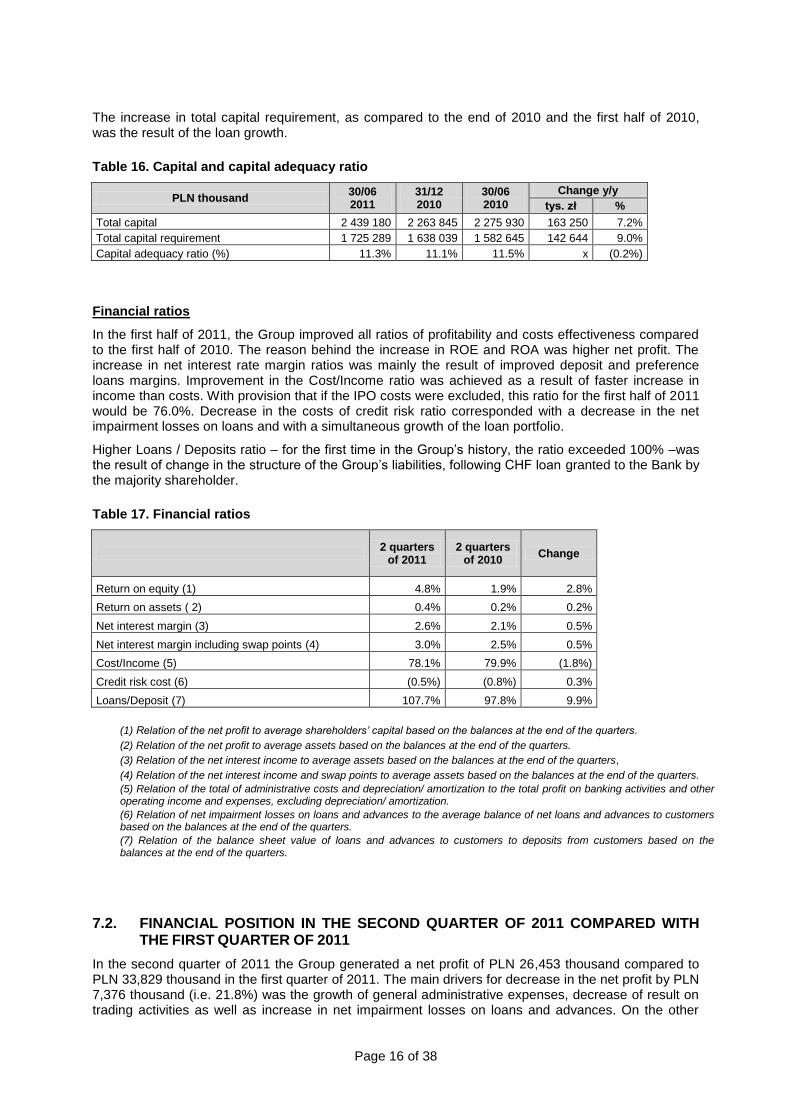
Capital and capital adequacy ratio
Capital adequacy ratio increased from 11.1% at the end of 2010 to 11.3% at the end of the first half of 2011 and was only slightly lower than year before when it was at 11.5%. The increase in the capital adequacy ratio in the first half of 2011 resulted from the increase in core capital which - in turn - resulted from the inclusion into this capital ithe audited net profit for 2010 and an increase in supplementary capital arising from revaluation of financial assets available-for-sale.
Page 16 of 38
The increase in total capital requirement, as compared to the end of 2010 and the first half of 2010, was the result of the loan growth.
Table 16. Capital and capital adequacy ratio
PLN thousand 30/06 2011
31/12 2010
30/06 2010
Change y/y
tys. zł %
Total capital 2 439 180 2 263 845 2 275 930 163 250 7.2%
Total capital requirement 1 725 289 1 638 039 1 582 645 142 644 9.0%
Capital adequacy ratio (%) 11.3% 11.1% 11.5% x (0.2%)
Financial ratios
In the first half of 2011, the Group improved all ratios of profitability and costs effectiveness compared to the first half of 2010. The reason behind the increase in ROE and ROA was higher net profit. The increase in net interest rate margin ratios was mainly the result of improved deposit and preference loans margins. Improvement in the Cost/Income ratio was achieved as a result of faster increase in income than costs. With provision that if the IPO costs were excluded, this ratio for the first half of 2011 would be 76.0%. Decrease in the costs of credit risk ratio corresponded with a decrease in the net impairment losses on loans and with a simultaneous growth of the loan portfolio.
Higher Loans / Deposits ratio – for the first time in the Group‟s history, the ratio exceeded 100% –was the result of change in the structure of the Group‟s liabilities, following CHF loan granted to the Bank by the majority shareholder.
Table 17. Financial ratios
2 quarters
of 2011 2 quarters
of 2010 Change
Return on equity (1) 4.8% 1.9% 2.8%
Return on assets ( 2) 0.4% 0.2% 0.2%
Net interest margin (3) 2.6% 2.1% 0.5%
Net interest margin including swap points (4) 3.0% 2.5% 0.5%
Cost/Income (5) 78.1% 79.9% (1.8%)
Credit risk cost (6) (0.5%) (0.8%) 0.3%
Loans/Deposit (7) 107.7% 97.8% 9.9%
(1) Relation of the net profit to average shareholders’ capital based on the balances at the end of the quarters.
(2) Relation of the net profit to average assets based on the balances at the end of the quarters.
(3) Relation of the net interest income to average assets based on the balances at the end of the quarters,
(4) Relation of the net interest income and swap points to average assets based on the balances at the end of the quarters.
(5) Relation of the total of administrative costs and depreciation/ amortization to the total profit on banking activities and other operating income and expenses, excluding depreciation/ amortization.
(6) Relation of net impairment losses on loans and advances to the average balance of net loans and advances to customers based on the balances at the end of the quarters.
(7) Relation of the balance sheet value of loans and advances to customers to deposits from customers based on the balances at the end of the quarters.
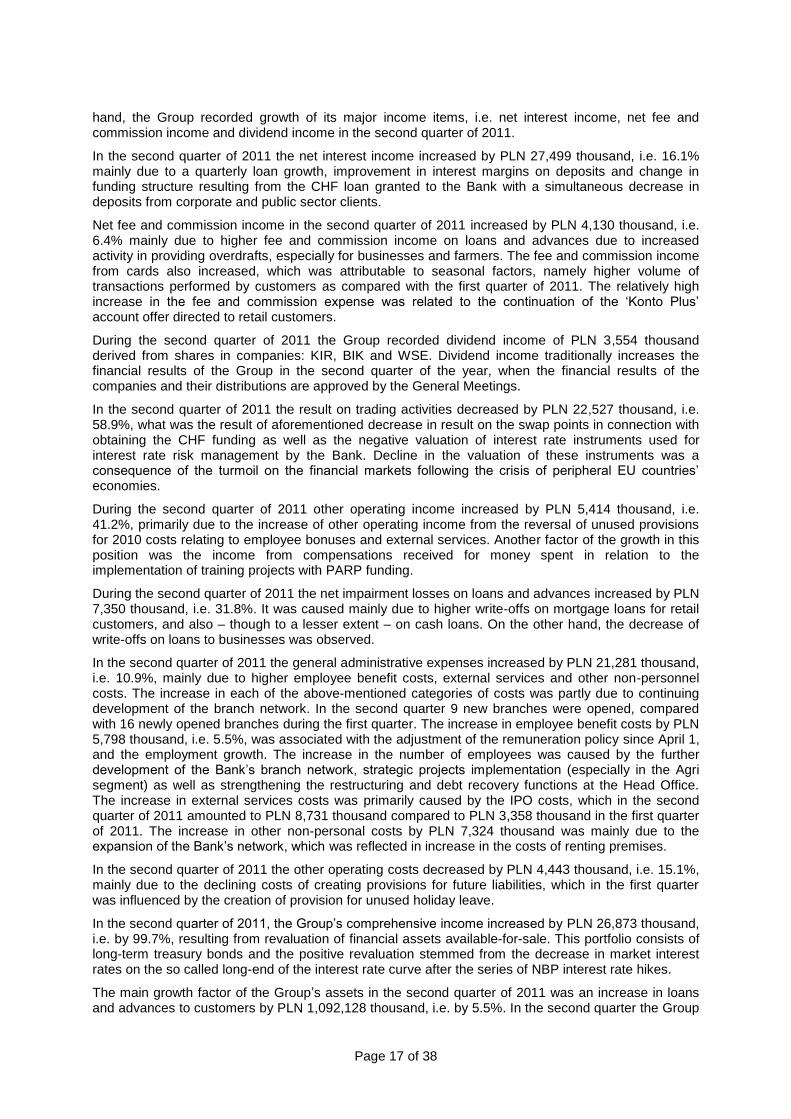
7.2. FINANCIAL POSITION IN THE SECOND QUARTER OF 2011 COMPARED WITH
THE FIRST QUARTER OF 2011
In the second quarter of 2011 the Group generated a net profit of PLN 26,453 thousand compared to PLN 33,829 thousand in the first quarter of 2011. The main drivers for decrease in the net profit by PLN 7,376 thousand (i.e. 21.8%) was the growth of general administrative expenses, decrease of result on trading activities as well as increase in net impairment losses on loans and advances. On the other
Page 17 of 38
hand, the Group recorded growth of its major income items, i.e. net interest income, net fee and commission income and dividend income in the second quarter of 2011.
In the second quarter of 2011 the net interest income increased by PLN 27,499 thousand, i.e. 16.1% mainly due to a quarterly loan growth, improvement in interest margins on deposits and change in funding structure resulting from the CHF loan granted to the Bank with a simultaneous decrease in deposits from corporate and public sector clients.
Net fee and commission income in the second quarter of 2011 increased by PLN 4,130 thousand, i.e. 6.4% mainly due to higher fee and commission income on loans and advances due to increased activity in providing overdrafts, especially for businesses and farmers. The fee and commission income from cards also increased, which was attributable to seasonal factors, namely higher volume of transactions performed by customers as compared with the first quarter of 2011. The relatively high increase in the fee and commission expense was related to the continuation of the „Konto Plus‟ account offer directed to retail customers.
During the second quarter of 2011 the Group recorded dividend income of PLN 3,554 thousand derived from shares in companies: KIR, BIK and WSE. Dividend income traditionally increases the financial results of the Group in the second quarter of the year, when the financial results of the companies and their distributions are approved by the General Meetings.
In the second quarter of 2011 the result on trading activities decreased by PLN 22,527 thousand, i.e. 58.9%, what was the result of aforementioned decrease in result on the swap points in connection with obtaining the CHF funding as well as the negative valuation of interest rate instruments used for interest rate risk management by the Bank. Decline in the valuation of these instruments was a consequence of the turmoil on the financial markets following the crisis of peripheral EU countries‟ economies.
During the second quarter of 2011 other operating income increased by PLN 5,414 thousand, i.e. 41.2%, primarily due to the increase of other operating income from the reversal of unused provisions for 2010 costs relating to employee bonuses and external services. Another factor of the growth in this position was the income from compensations received for money spent in relation to the implementation of training projects with PARP funding.
During the second quarter of 2011 the net impairment losses on loans and advances increased by PLN 7,350 thousand, i.e. 31.8%. It was caused mainly due to higher write-offs on mortgage loans for retail customers, and also – though to a lesser extent – on cash loans. On the other hand, the decrease of write-offs on loans to businesses was observed.
In the second quarter of 2011 the general administrative expenses increased by PLN 21,281 thousand, i.e. 10.9%, mainly due to higher employee benefit costs, external services and other non-personnel costs. The increase in each of the above-mentioned categories of costs was partly due to continuing development of the branch network. In the second quarter 9 new branches were opened, compared with 16 newly opened branches during the first quarter. The increase in employee benefit costs by PLN 5,798 thousand, i.e. 5.5%, was associated with the adjustment of the remuneration policy since April 1, and the employment growth. The increase in the number of employees was caused by the further development of the Bank‟s branch network, strategic projects implementation (especially in the Agri segment) as well as strengthening the restructuring and debt recovery functions at the Head Office. The increase in external services costs was primarily caused by the IPO costs, which in the second quarter of 2011 amounted to PLN 8,731 thousand compared to PLN 3,358 thousand in the first quarter of 2011. The increase in other non-personal costs by PLN 7,324 thousand was mainly due to the expansion of the Bank‟s network, which was reflected in increase in the costs of renting premises.
In the second quarter of 2011 the other operating costs decreased by PLN 4,443 thousand, i.e. 15.1%, mainly due to the declining costs of creating provisions for future liabilities, which in the first quarter was influenced by the creation of provision for unused holiday leave.
In the second quarter of 2011, the Group‟s comprehensive income increased by PLN 26,873 thousand, i.e. by 99.7%, resulting from revaluation of financial assets available-for-sale. This portfolio consists of long-term treasury bonds and the positive revaluation stemmed from the decrease in market interest rates on the so called long-end of the interest rate curve after the series of NBP interest rate hikes.
The main growth factor of the Group‟s assets in the second quarter of 2011 was an increase in loans and advances to customers by PLN 1,092,128 thousand, i.e. by 5.5%. In the second quarter the Group
Page 18 of 38
recorded acceleration in the new loan production as compared with the first quarter, mainly in relation to the overdrafts for companies and farmers, investment loans for companies and preferential loans for farmers. The increase in the loans and advances was financed by the decrease in amounts due from banks by PLN 466,532 thousand, i.e. by 68.6% as well as securities held-for-trading by PLN 894,316 thousand, i.e. by 52.4%.
The most significant change in the Group‟s liabilities in the second quarter of 2011 related to the CHF loan granted to the Bank. It resulted directly in the increase by PLN 2,411,077 thousand ( 154.1%) in the amounts owed to other banks. Other important phenomenon was the the decrease in the balance of amounts owed to customers by PLN 1,747,467 thousand (i.e. by 8.2%), which partly corresponded with the above mentioned obtaining of an additional external funding and partly with the withdrawal of funds by one of the governmental agencies as a result of the introduction of a new regulation concerning consolidation of public finances.
8. ACTIVITIES OF THE PARENT COMPANY IN THE FIRST HALF OF 2011
8.1. DISTRIBUTION CHANNELS
8.1.1. TRADITIONAL CHANNELS
Bank’s branches
In the first half of 2011 the Bank continued to expand its network of branches, a policy started in 2008 in connection with the implementation of a growth strategy on local markets. The main direction of network expansion is in the county (powiaty) towns in which BGŻ has not yet held a branch. New branches are being located in central points of towns, with convenient access for clients and a modern interior standard.
In the first six months of 2011, 25 new subordinate branches were opened. On the basis of an analysis of financial results and location potential, 3 operating branches were relocated and 3 subordinate branches were closed.
As of June 30, 2011, the Bank had 370 branches of which 118 were operational branches and 252 subordinate branches (compared with 112 operational branches and 191 subordinated branches as of June 30, 2010). The network branch was included a Bank Shop (a branch in the Manufaktura shopping centre), 17 external cash desks handling cash transactions and 7 corporate centers for servicing large companies.
ATM network
During the first half of 2011, the network of ATMs available to the Bank‟s customers for commission-free cash withdrawals comprised of ATMs owned by BGŻ S.A. and those of Kredyt Bank, INVEST-BANK S.A., Mazowiecki Bank Regionalny S.A and the Euronet networks. At the end of June 2011, customers could access 3 858 ATMs free of charge, including 494 own ATMs. Customers, who have personal accounts in the ”Plan Aktywny” or “Konto Plus” can access all ATMs in Poland free of charge.
8.1.2. ALTERNATIVE CHANNELS
Internet banking
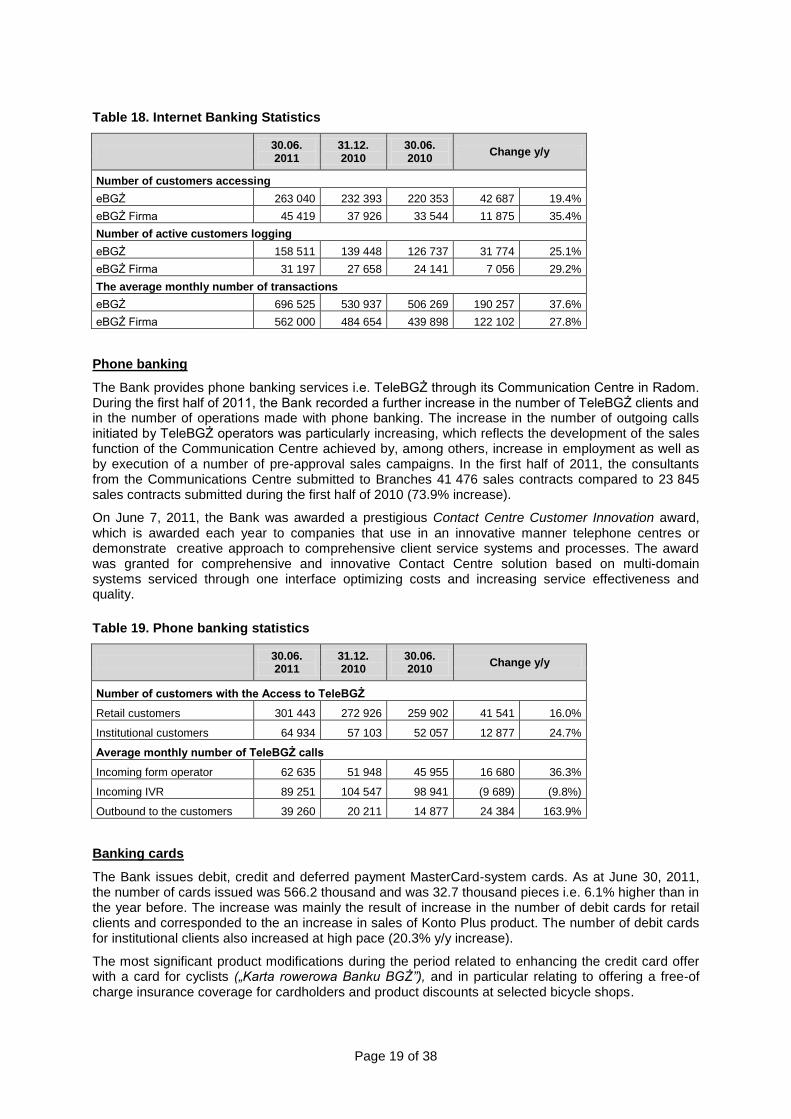
In the first half of 2011, the Bank recorded a dynamic growth in the number of clients using internet banking services i.e. eBGŻ (retail clients) and eBGŻ Firma (institutional clients). The number of operations made using the Internet also grew rapidly.
Page 19 of 38
Table 18. Internet Banking Statistics
30.06. 2011
31.12. 2010
30.06. 2010
Change y/y
Number of customers accessing
eBGŻ 263 040 232 393 220 353 42 687 19.4%
eBGŻ Firma 45 419 37 926 33 544 11 875 35.4%
Number of active customers logging
eBGŻ 158 511 139 448 126 737 31 774 25.1%
eBGŻ Firma 31 197 27 658 24 141 7 056 29.2%
The average monthly number of transactions
eBGŻ 696 525 530 937 506 269 190 257 37.6%
eBGŻ Firma 562 000 484 654 439 898 122 102 27.8%
Phone banking
The Bank provides phone banking services i.e. TeleBGŻ through its Communication Centre in Radom. During the first half of 2011, the Bank recorded a further increase in the number of TeleBGŻ clients and in the number of operations made with phone banking. The increase in the number of outgoing calls initiated by TeleBGŻ operators was particularly increasing, which reflects the development of the sales function of the Communication Centre achieved by, among others, increase in employment as well as by execution of a number of pre-approval sales campaigns. In the first half of 2011, the consultants from the Communications Centre submitted to Branches 41 476 sales contracts compared to 23 845 sales contracts submitted during the first half of 2010 (73.9% increase).
On June 7, 2011, the Bank was awarded a prestigious Contact Centre Customer Innovation award, which is awarded each year to companies that use in an innovative manner telephone centres or demonstrate creative approach to comprehensive client service systems and processes. The award was granted for comprehensive and innovative Contact Centre solution based on multi-domain systems serviced through one interface optimizing costs and increasing service effectiveness and quality.
Table 19. Phone banking statistics
30.06. 2011
31.12. 2010
30.06. 2010
Change y/y
Number of customers with the Access to TeleBGŻ
Retail customers 301 443 272 926 259 902 41 541 16.0%
Institutional customers 64 934 57 103 52 057 12 877 24.7%
Average monthly number of TeleBGŻ calls
Incoming form operator 62 635 51 948 45 955 16 680 36.3%
Incoming IVR 89 251 104 547 98 941 (9 689) (9.8%)
Outbound to the customers 39 260 20 211 14 877 24 384 163.9%
Banking cards
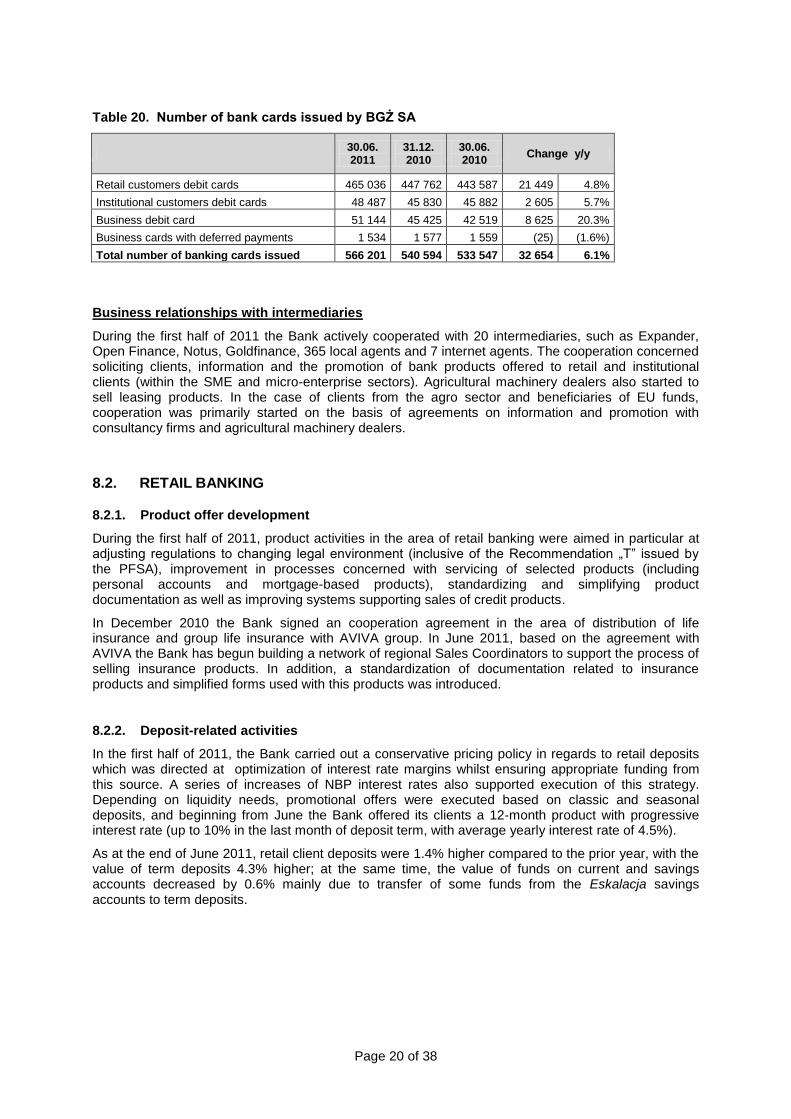
The Bank issues debit, credit and deferred payment MasterCard-system cards. As at June 30, 2011, the number of cards issued was 566.2 thousand and was 32.7 thousand pieces i.e. 6.1% higher than in the year before. The increase was mainly the result of increase in the number of debit cards for retail clients and corresponded to the an increase in sales of Konto Plus product. The number of debit cards for institutional clients also increased at high pace (20.3% y/y increase).
The most significant product modifications during the period related to enhancing the credit card offer with a card for cyclists („Karta rowerowa Banku BGŻ”), and in particular relating to offering a free-of charge insurance coverage for cardholders and product discounts at selected bicycle shops.
Page 20 of 38
Table 20. Number of bank cards issued by BGŻ SA
30.06. 2011
31.12. 2010
30.06. 2010
Change y/y
Retail customers debit cards 465 036 447 762 443 587 21 449 4.8%
Institutional customers debit cards 48 487 45 830 45 882 2 605 5.7%
Business debit card 51 144 45 425 42 519 8 625 20.3%
Business cards with deferred payments 1 534 1 577 1 559 (25) (1.6%)
Total number of banking cards issued 566 201 540 594 533 547 32 654 6.1%
Business relationships with intermediaries
During the first half of 2011 the Bank actively cooperated with 20 intermediaries, such as Expander, Open Finance, Notus, Goldfinance, 365 local agents and 7 internet agents. The cooperation concerned soliciting clients, information and the promotion of bank products offered to retail and institutional clients (within the SME and micro-enterprise sectors). Agricultural machinery dealers also started to sell leasing products. In the case of clients from the agro sector and beneficiaries of EU funds, cooperation was primarily started on the basis of agreements on information and promotion with consultancy firms and agricultural machinery dealers.
8.2. RETAIL BANKING
8.2.1. Product offer development
During the first half of 2011, product activities in the area of retail banking were aimed in particular at adjusting regulations to changing legal environment (inclusive of the Recommendation „T” issued by the PFSA), improvement in processes concerned with servicing of selected products (including personal accounts and mortgage-based products), standardizing and simplifying product documentation as well as improving systems supporting sales of credit products.
In December 2010 the Bank signed an cooperation agreement in the area of distribution of life insurance and group life insurance with AVIVA group. In June 2011, based on the agreement with AVIVA the Bank has begun building a network of regional Sales Coordinators to support the process of selling insurance products. In addition, a standardization of documentation related to insurance products and simplified forms used with this products was introduced.
8.2.2. Deposit-related activities
In the first half of 2011, the Bank carried out a conservative pricing policy in regards to retail deposits which was directed at optimization of interest rate margins whilst ensuring appropriate funding from this source. A series of increases of NBP interest rates also supported execution of this strategy. Depending on liquidity needs, promotional offers were executed based on classic and seasonal deposits, and beginning from June the Bank offered its clients a 12-month product with progressive interest rate (up to 10% in the last month of deposit term, with average yearly interest rate of 4.5%).
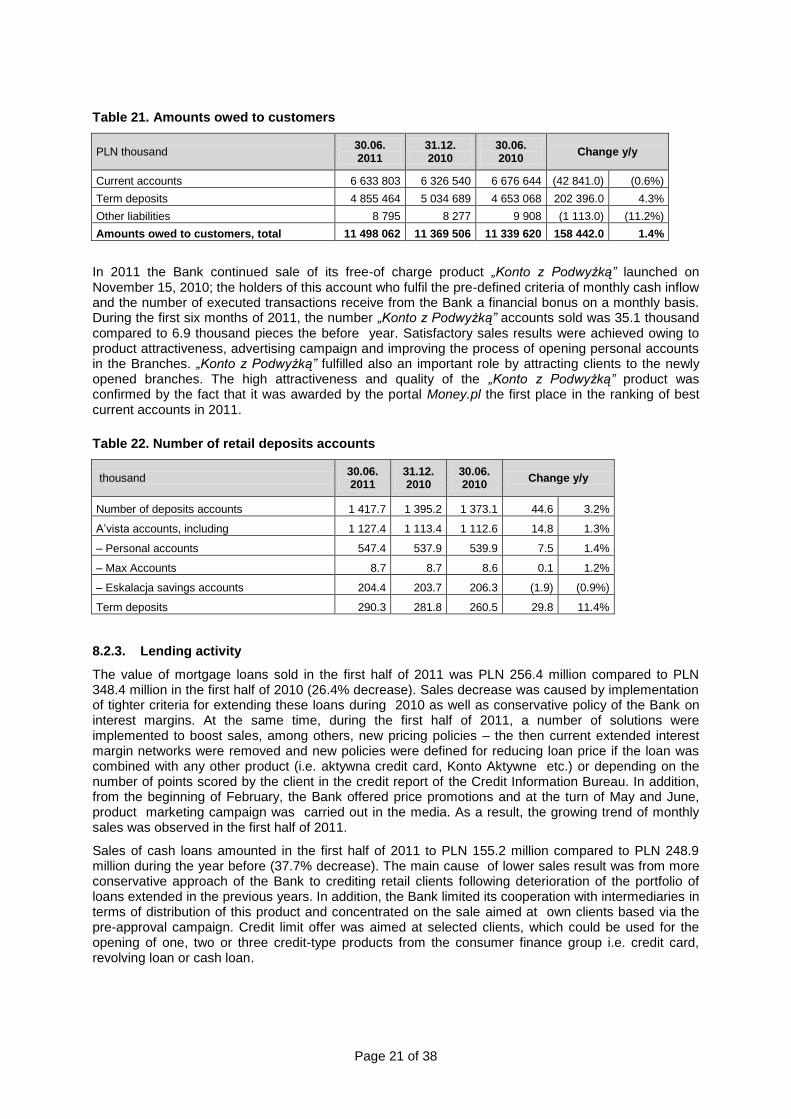
As at the end of June 2011, retail client deposits were 1.4% higher compared to the prior year, with the value of term deposits 4.3% higher; at the same time, the value of funds on current and savings accounts decreased by 0.6% mainly due to transfer of some funds from the Eskalacja savings accounts to term deposits.
Page 21 of 38
Table 21. Amounts owed to customers
PLN thousand 30.06. 2011
31.12. 2010
30.06. 2010
Change y/y
Current accounts 6 633 803 6 326 540 6 676 644 (42 841.0) (0.6%)
Term deposits 4 855 464 5 034 689 4 653 068 202 396.0 4.3%
Other liabilities 8 795 8 277 9 908 (1 113.0) (11.2%)
Amounts owed to customers, total 11 498 062 11 369 506 11 339 620 158 442.0 1.4%
In 2011 the Bank continued sale of its free-of charge product „Konto z Podwyżką” launched on November 15, 2010; the holders of this account who fulfil the pre-defined criteria of monthly cash inflow and the number of executed transactions receive from the Bank a financial bonus on a monthly basis. During the first six months of 2011, the number „Konto z Podwyżką” accounts sold was 35.1 thousand compared to 6.9 thousand pieces the before year. Satisfactory sales results were achieved owing to product attractiveness, advertising campaign and improving the process of opening personal accounts in the Branches. „Konto z Podwyżką” fulfilled also an important role by attracting clients to the newly opened branches. The high attractiveness and quality of the „Konto z Podwyżką” product was confirmed by the fact that it was awarded by the portal Money.pl the first place in the ranking of best current accounts in 2011.
Table 22. Number of retail deposits accounts
thousand 30.06. 2011
31.12. 2010
30.06. 2010
Change y/y
Number of deposits accounts 1 417.7 1 395.2 1 373.1 44.6 3.2%
A‟vista accounts, including 1 127.4 1 113.4 1 112.6 14.8 1.3%
– Personal accounts 547.4 537.9 539.9 7.5 1.4%
– Max Accounts 8.7 8.7 8.6 0.1 1.2%
– Eskalacja savings accounts 204.4 203.7 206.3 (1.9) (0.9%)
Term deposits 290.3 281.8 260.5 29.8 11.4%
8.2.3. Lending activity
The value of mortgage loans sold in the first half of 2011 was PLN 256.4 million compared to PLN 348.4 million in the first half of 2010 (26.4% decrease). Sales decrease was caused by implementation of tighter criteria for extending these loans during 2010 as well as conservative policy of the Bank on interest margins. At the same time, during the first half of 2011, a number of solutions were implemented to boost sales, among others, new pricing policies – the then current extended interest margin networks were removed and new policies were defined for reducing loan price if the loan was combined with any other product (i.e. aktywna credit card, Konto Aktywne etc.) or depending on the number of points scored by the client in the credit report of the Credit Information Bureau. In addition, from the beginning of February, the Bank offered price promotions and at the turn of May and June, product marketing campaign was carried out in the media. As a result, the growing trend of monthly sales was observed in the first half of 2011.
Sales of cash loans amounted in the first half of 2011 to PLN 155.2 million compared to PLN 248.9 million during the year before (37.7% decrease). The main cause of lower sales result was from more conservative approach of the Bank to crediting retail clients following deterioration of the portfolio of loans extended in the previous years. In addition, the Bank limited its cooperation with intermediaries in terms of distribution of this product and concentrated on the sale aimed at own clients based via the pre-approval campaign. Credit limit offer was aimed at selected clients, which could be used for the opening of one, two or three credit-type products from the consumer finance group i.e. credit card, revolving loan or cash loan.
Page 22 of 38
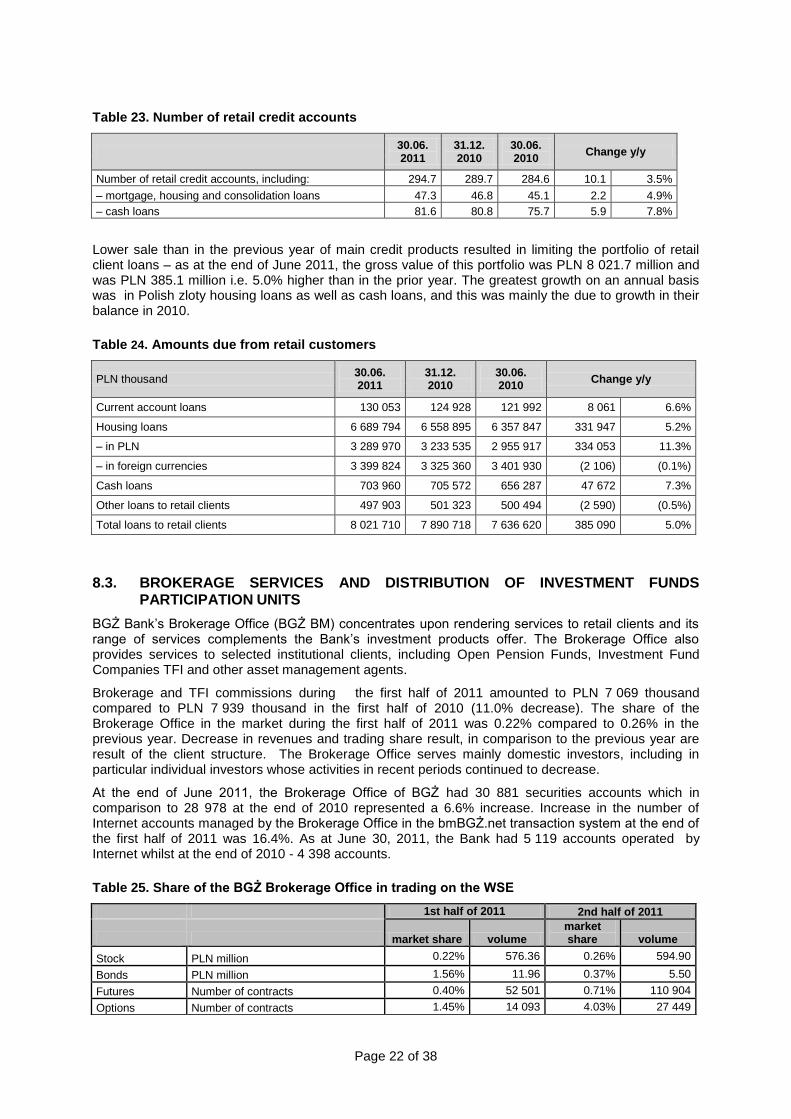
Table 23. Number of retail credit accounts
30.06. 2011
31.12. 2010
30.06. 2010
Change y/y
Number of retail credit accounts, including: 294.7 289.7 284.6 10.1 3.5%
– mortgage, housing and consolidation loans 47.3 46.8 45.1 2.2 4.9%
– cash loans 81.6 80.8 75.7 5.9 7.8%
Lower sale than in the previous year of main credit products resulted in limiting the portfolio of retail client loans – as at the end of June 2011, the gross value of this portfolio was PLN 8 021.7 million and was PLN 385.1 million i.e. 5.0% higher than in the prior year. The greatest growth on an annual basis was in Polish zloty housing loans as well as cash loans, and this was mainly the due to growth in their balance in 2010.
Table 24. Amounts due from retail customers
PLN thousand 30.06. 2011
31.12. 2010
30.06. 2010
Change y/y
Current account loans 130 053 124 928 121 992 8 061 6.6%
Housing loans 6 689 794 6 558 895 6 357 847 331 947 5.2%
– in PLN 3 289 970 3 233 535 2 955 917 334 053 11.3%
– in foreign currencies 3 399 824 3 325 360 3 401 930 (2 106) (0.1%)
Cash loans 703 960 705 572 656 287 47 672 7.3%
Other loans to retail clients 497 903 501 323 500 494 (2 590) (0.5%)
Total loans to retail clients 8 021 710 7 890 718 7 636 620 385 090 5.0%
8.3. BROKERAGE SERVICES AND DISTRIBUTION OF INVESTMENT FUNDS
PARTICIPATION UNITS
BGŻ Bank‟s Brokerage Office (BGŻ BM) concentrates upon rendering services to retail clients and its range of services complements the Bank‟s investment products offer. The Brokerage Office also provides services to selected institutional clients, including Open Pension Funds, Investment Fund Companies TFI and other asset management agents.
Brokerage and TFI commissions during the first half of 2011 amounted to PLN 7 069 thousand compared to PLN 7 939 thousand in the first half of 2010 (11.0% decrease). The share of the Brokerage Office in the market during the first half of 2011 was 0.22% compared to 0.26% in the previous year. Decrease in revenues and trading share result, in comparison to the previous year are result of the client structure. The Brokerage Office serves mainly domestic investors, including in particular individual investors whose activities in recent periods continued to decrease.
At the end of June 2011, the Brokerage Office of BGŻ had 30 881 securities accounts which in comparison to 28 978 at the end of 2010 represented a 6.6% increase. Increase in the number of Internet accounts managed by the Brokerage Office in the bmBGŻ.net transaction system at the end of the first half of 2011 was 16.4%. As at June 30, 2011, the Bank had 5 119 accounts operated by Internet whilst at the end of 2010 - 4 398 accounts.
Table 25. Share of the BGŻ Brokerage Office in trading on the WSE
1st half of 2011 2nd half of 2011
market share volume market share volume
Stock PLN million 0.22% 576.36 0.26% 594.90
Bonds PLN million 1.56% 11.96 0.37% 5.50
Futures Number of contracts 0.40% 52 501 0.71% 110 904
Options Number of contracts 1.45% 14 093 4.03% 27 449
Page 23 of 38
BGŻ Brokerage Office, at the end of June 2011, distributed participation units of 52 funds managed by Investment Fund Companies (Union Investment TFI, Aviva Investors Poland TFI, Skarbiec TFI, Opera TFI).
During the first half of 2011, due to uncertain situation on the financial markets, the clients of the Brokerage Office presented lesser interest in acquisition of investment fund participation units. Due to deteriorating economic conditions on the financial markets and decrease in the number of acquired TFI participation units, a decrease was also recorded in the value of assets gathered by the clients of the Brokerage Office of BGŻ. As at June 30, 2011, the said value of assets was PLN 685.1 million compared to PLN 696.3 million as at December 31, 2010 and PLN 676.8 million as at June 30, 2010.
BGŻ Brokerage Office also takes part in the OTC transactions organized by BondSpot. Since 3 December 2007 BGŻ Brokerage Office has participated in the alternative trading NewConnect. So far, due to small-scale of this market turnover, this market does not play a significant role in the Office‟s revenue. However, with the increasing number of companies listed on NewConnect the scale of Office‟s income from this activity is growing. Additionally, in 2011 on the non-public market, the BGŻ Brokerage Office managed the deposits of Bank BGŻ and two other companies.
By the end of June 2011, the BGŻ Brokerage Office participated in 11 public offerings in the primary market. In case of 9 public offering, the Office served as the bidder and so participated in both the preparation and completion of the offer, as its organizer, at each stage.
8.4. INSTITUTIONAL BANKING
8.4.1. CUSTOMER SEGMANTS
In 2011, the Bank‟s institutional customers were classified into the following segments:
Large Corporate Entities (LC) with annual sales exceeding PLN 60 million,
Small and Medium Enterprises (SME) with annual sales ranging from the PLN equivalent of EUR 1 200 thousand to 60 million,
Micro-companies (Micro) with annual sales below EUR 1 200 thousand,
The above-mentioned segments also contain sub-sector clients from the agro sector farmers, public sector, non-profit organizations and key clients.
8.4.2. PRODUCT PORTFOLIO DEVELOPMENT
Product packages and transaction products
On 21 March 2011, the Bank launched new product packages: Business Leader package for micro-enterprises and Agro Leader package for farmers (described in more detail in the section on agribusiness products). The new product offer replaces that of Firma Plan1 Plan Agro packages. Included in the Business Leader package are: current account, telephone banking, internet banking, MasterCard Business payment card, deposit accounts and progressive deposits. For this package, the Bank does not charge fee for maintaining accounts or payments handling.
As of the date of launch of the offer i.e. as of March 21, 2011 until June 30, 2011, the Bank recorded a significant increase in the number of packages sold and new clients acquired for those packages (for Business Leader package – 2 969 clients and for Agro Leader package – 2 342 clients). In addition, the Bank modified its current offer for the Firma Plan2 and Firma Plan 3 packages by extending it to include the eBGŻ Treasury transaction platform. During the period from January to the end of June 2011, for all product packages the Bank attracted a total of 10 766 new customers. As at June 30, 2011, the total number of active packages was 65 092 items.
In the first half of 2011, a number of enhancements were made to the process of client service such as streamlining the process of agreement signing or simplification of credit documentation.
Page 24 of 38
During the first half of 2011, 25 agreements were signed for rendering by the BGŻ Bank the service of Payer Identification relating to servicing incoming mass payments.
Argo- business products
Product packages
The Agro Plan package offer was replaced by the “Agro Lider” package which covers: current account, phone and Internet banking services, Agro Eskalacja savings account and free of charge cash handling (deposits and cash withdrawals ). In order to facilitate the “Agro Lider” package sale process, a new format of agreement and forms were developed which were adjusted to the special character of Agro client and the requirements of common account.
Lending
On 4 April 2011, the Bank launched a new product, the “Formuła Agro” overdraft facility, which is a modification of the “Agro Linia” facility with two possible credit/ loan balances depending on the amount of basis for determination of credit, i.e. to the amount of PLN 50 thousand based on the declared payments to the account, and to the amount of PLN 250 thousand based on the documented average monthly payments to the account. In both cases, the Bank abandoned from the KRUS (Farmers' Social Security Fund), municipal office (Urząd Gminy) or Tax Office statements – the loan is granted based on the client statement in loan application. Client scoring was introduced for the client assessment procedure. Product sales were supported by marketing campaign that lasted until the end of May.
During the first half of 2011, a number of changes were made in other products for agro-business financing („Rzeczówka” working capital loan, crop loan) with a view to making these loans more attractive to clients.
Insurance
In November 2010, the Bank signed a cooperation agreement with Concordia Polska Towarzystwo Ubezpieczeń Wzajemnych S.A., an expert in the field of agro-business insurances. As part of the cooperation with Concordia Polska TUW, the product offer of the Bank to Agro clients was extended to include insurance products. Insurance packages which included key insurance products were introduced. Under these products farmers may insure crops, agricultural machines and equipment, farm and housing buildings and movables; the package contains private third party liability insurance and insurance for agricultural farm owners. The additional scope of insurance covers accident and illness insurance, legal service insurance at the cost of insurer and assistance-type services (medical assistance, house assistance, home and abroad travel assistance and concierge). The insurance products may also be sold individually, outside the insurance package.
During the period from the launch date to the end of June, 1 200 insurance policies were sold. The record high transaction was insurance of an agricultural farm with an area of 3 000 hectares.
8.4.3. LENDING ACTIVITIES
As at the end of June 2011, the gross value of the credit portfolio for institutional clients amounted to PLN 13 786.4 million and was 14.8% higher than in the year before.
The highest pace of growth was recorded in the segment of overdraft facilities (30.4% y/y), which was possible due to good results on the “Ekspres Linia” product for small and medium-sized enterprises and “Agro Ekspres” product for farmers. As of the beginning of 2011, the Bank implemented a new, more efficient sales process for these products. The high growth was also recorded in the loans to individual entrepreneurs (20.8% y/y increase) and loans to farmers (12.9% y/y increase), in the latter case, mainly due to preference loans. The increase in the portfolio of purchased receivables by 35.0% y/y was the effect of a further development of business in factoring.
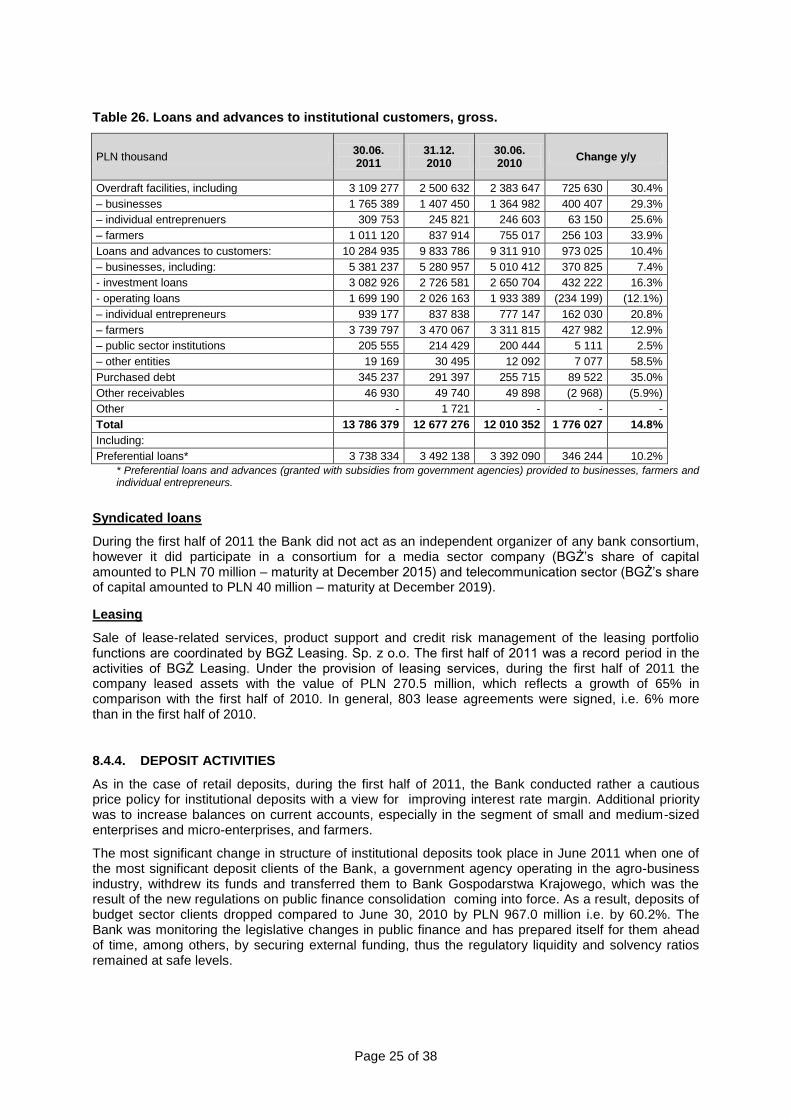
Page 25 of 38
Table 26. Loans and advances to institutional customers, gross.
PLN thousand 30.06. 2011
31.12. 2010
30.06. 2010
Change y/y
Overdraft facilities, including 3 109 277 2 500 632 2 383 647 725 630 30.4%
– businesses 1 765 389 1 407 450 1 364 982 400 407 29.3%
– individual entreprenuers 309 753 245 821 246 603 63 150 25.6%
– farmers 1 011 120 837 914 755 017 256 103 33.9%
Loans and advances to customers: 10 284 935 9 833 786 9 311 910 973 025 10.4%
– businesses, including: 5 381 237 5 280 957 5 010 412 370 825 7.4%
- investment loans 3 082 926 2 726 581 2 650 704 432 222 16.3%
- operating loans 1 699 190 2 026 163 1 933 389 (234 199) (12.1%)
– individual entrepreneurs 939 177 837 838 777 147 162 030 20.8%
– farmers 3 739 797 3 470 067 3 311 815 427 982 12.9%
– public sector institutions 205 555 214 429 200 444 5 111 2.5%
– other entities 19 169 30 495 12 092 7 077 58.5%
Purchased debt 345 237 291 397 255 715 89 522 35.0%
Other receivables 46 930 49 740 49 898 (2 968) (5.9%)
Other - 1 721 - - -
Total 13 786 379 12 677 276 12 010 352 1 776 027 14.8%
Including:
Preferential loans* 3 738 334 3 492 138 3 392 090 346 244 10.2%
* Preferential loans and advances (granted with subsidies from government agencies) provided to businesses, farmers and individual entrepreneurs.
Syndicated loans
During the first half of 2011 the Bank did not act as an independent organizer of any bank consortium, however it did participate in a consortium for a media sector company (BGŻ‟s share of capital amounted to PLN 70 million – maturity at December 2015) and telecommunication sector (BGŻ‟s share of capital amounted to PLN 40 million – maturity at December 2019).
Leasing
Sale of lease-related services, product support and credit risk management of the leasing portfolio functions are coordinated by BGŻ Leasing. Sp. z o.o. The first half of 2011 was a record period in the activities of BGŻ Leasing. Under the provision of leasing services, during the first half of 2011 the company leased assets with the value of PLN 270.5 million, which reflects a growth of 65% in comparison with the first half of 2010. In general, 803 lease agreements were signed, i.e. 6% more than in the first half of 2010.
8.4.4. DEPOSIT ACTIVITIES
As in the case of retail deposits, during the first half of 2011, the Bank conducted rather a cautious price policy for institutional deposits with a view for improving interest rate margin. Additional priority was to increase balances on current accounts, especially in the segment of small and medium-sized enterprises and micro-enterprises, and farmers.
The most significant change in structure of institutional deposits took place in June 2011 when one of the most significant deposit clients of the Bank, a government agency operating in the agro-business industry, withdrew its funds and transferred them to Bank Gospodarstwa Krajowego, which was the result of the new regulations on public finance consolidation coming into force. As a result, deposits of budget sector clients dropped compared to June 30, 2010 by PLN 967.0 million i.e. by 60.2%. The Bank was monitoring the legislative changes in public finance and has prepared itself for them ahead of time, among others, by securing external funding, thus the regulatory liquidity and solvency ratios remained at safe levels.

Page 26 of 38
Table 27. Amounts owed to institutional customers
PLN thousand 30.06. 2011
31.12. 2010
30.06. 2010
Change y/y
Other financial institutions: 1 158 052 1 090 373 430 241 727 811 169.2%
– Current accounts 12 751 15 200 58 451 (45 700) (78.2%)
– Term deposits 1 140 977 1 072 109 365 518 775 459 212.2%
– Other liabilities 4 324 3 064 6 272 (1 948) (31.1%)
Corporate customers: 6 253 020 6 871 791 6 022 372 230 648 3.8%
– Current accounts 3 375 233 3 476 534 2 892 308 482 925 16.7%
– Term deposits 2 786 948 3 321 879 3 052 392 (265 444) (8.7%)
– Other liabilities 90 839 73 378 77 672 13 167 17.0%
Corporate customers, from which farmers: 721 634 686 217 580 919 140 715 24.2%
– Current accounts 686 444 647 779 549 488 136 956 24.9%
– Term deposits 26 884 28 949 19 633 7 251 36.9%
– Other liabilities 8 306 9 489 11 798 (3 492) (29.6%)
Public sector customers: 639 082 1 720 045 1 606 083 (967 001) (60.2%)
– Current accounts 471 758 870 988 842 272 (370 514) (44.0%)
– Term deposits 167 204 848 932 763 684 (596 480) (78.1%)
– Other liabilities 120 125 127 (7) (5.5%)
Total 8 050 154 9 682 209 8 058 696 (8 542) (0.1%)
8.4.5. TRADE FINANCING
As of April 20, 2011, the factoring offer of the Bank was extended to include the following:
reverse factoring which consists of payment by the BGŻ of recipient liabilities to identified suppliers;
administrative factoring which consists in acquisition of outstanding liabilities, collecting payments from business partners and conducting customer soft workout activities without obliging the BGŻ Bank to finance these liabilities;
maturity factoring which consists of paying by the BGŻ an advance payment at the maturity date specified of the invoice.
During the first half of 2011, the Bank acquired outstanding liabilities with a value of PLN 1 123 million compared to PLN 839 million in the corresponding period of the prior year i.e. 33.8% more
8.4.6. ACTIVITIES ON THE MARKET OF DEBT SECURITIES
During the first half of 2011, the Bank serviced 5 programs of issuance of debt securities, including 3 programs of debt securities issuance by local government entities. From January till June 2011, the Bank did not act as arranger of new debt securities issues.
8.5. ACTIVITIES ON MONEY AND FOREIGN EXCHANGE MARKETS
During the first half of 2011, the following factors had significant influenced the activities of the Bank‟s on money and foreign exchange markets:
four hikes in the NBP interest rates in a total of 1.00 percentage point,
uncertainty over the Euro-zone peripheral economies stability was influenced the slow-down of appreciation of Polish zloty against main currency pairs,
continued high demand for national debt securities despite turbulences on foreign markets,
reduced demand for liquidity in the financial sector which results in a slow increase of total deposits, far below the increases in money market and NBP interest rates.
Page 27 of 38
Activities on the Bank’s own account
FX market
During the first half of 2011, the turnover of the Bank BGŻ on the inter-bank market in regard to foreign currency transactions increased by more than 30% compared to the corresponding period of the year before. The increase in turnover balance resulted from both higher volume of foreign currency transactions made by the Bank‟s clients and from active management of the Bank‟s FX position. The most significant turnover as in regards to foreign exchange was recorded for the EUR/PLN currency pair (more than 75% share), and then for the USD/PLN, GBP/PLN and CHF/PLN currency pairs. The increase of the Bank‟s activities on the FX market related to transactions of currency options which continued to meet with low interest from the Bank‟s clients.
Interest rate market
Bank BGŻ has dynamically increased its operations on the inter-bank interest rate market. Turnover on the market of debt instruments increased five-fold, whilst the turnover realised under buy-sell-back and sell-buy-back transactions – 12- times, whilst the turnover on the market of interest rate swaps - by 60% compared to the corresponding period of the prior year. The increase in the Bank‟s activities on the inter-bank market resulted mainly from the increased interest of the Bank‟s clients in the products based around interest rate market (mainly of non-banking financial institutions), as well as in the increase of Bank‟s activities on its own account.
Liquidity management
In terms of liquidity management of the Bank‟s short-term liquidity, limited liquidity on the intra-bank market in the deposit transaction was the reason behind investing short-term liquidity or cash surpluses were NBP money bills. The Bank BGŻ actively managed the risk of short-term interest rate arising from the deposit transactions of the Bank‟s clients through the OIS, FRA, IRS FX Swap transactions. Increases in the NBP interest rates and the prolonging limited demand for liquidity in the banking sector contributed to the decrease in the costs of acquiring current liquidity from the Bank‟s clients.
Assets and liabilities management
In terms of assets and liabilities management, the Bank conducted financial operations with a objective to manage structural exposure of the Bank to the risk of interest rate, FX or liquidity, among others, through managing the surplus of available sources of funding, securing long-term sources of funding and by way of issuance of debt securities and hedging against the associated risks. Particularly , during the first half of 2011, the Bank‟s Assets and Liabilities Management Bureau entered into transactions where treasury bonds were acquired as part of managing the Bank‟s investment portfolio, it also responsible the issuance of certificates of deposit program for financial and corporate investors. It also has finalized a long-term loan agreement w Rabobank in the amount of CHF 1 billion.
CHF loan
On April 29, 2011, the first tranche was disbursed of a long-term loan from Rabobank in the total amount of CHF 1 billion which will be used to fund the Bank‟s current credit liabilities in CHF (retail housing loans) with fixed and foreseeable cost, in contrast to the to date approach, which was based around short-term FX swap transactions. The loan is issued in instalments over the period of 6 months, every two weeks, and its cost is set for half is CHF 3M Libor + margin, whilst for the other half - CHF 6M Libor + margin. The loan is repayable in instalments every 3 and 6 months over the period of 12 years. The margin is fixed for each tranche and is determined 2 days before tranche issue, based on the assessment of current market conditions (internal CHF cost for Rabobank and credit risk assessment for Poland and Holland). As at June 30, 2011, ¾ of the total loan balance was already issued. The loaned funds are used mainly to replace large, expensive deposits of corporate clients and financial institutions, and to a lesser degree – to increase the investment portfolio and loan growth.
Sale of treasury products to customers
During the first half of 2011, the Bank observed an increase in the activities of clients, both in the spot FX transactions and in forward transactions, compared to the corresponding period of 2010. This was due, among others, to the new channel of distribution of financial market products i.e. the e-BGŻ Treasury. Also, a significant interest was recorded in the transactions hedged against fluctuations in FX rates (mainly forward transactions) and against interest rate risk (mainly IRS transactions).
Page 28 of 38
8.6. COOPERATION WITH BANKS AND FINANCIAL INSTITUTIONS
Correspondent banking and remittances
During the first half of 2011, BGŻ maintained correspondence with approx. 680 financial entities, whilst at the end of June 2011 the Bank had 23 open Nostro accounts in 14 main currencies.
As at June 30, 2011, the Bank maintained 40 Loro accounts in 6 currencies for 21 foreign banks, 3 Polish banks and 4 foreign non-banking financial institutions. Loro accounts reported in the books the BGŻ S.A. represented an external source of securing cost-free current assets serving operational needs of the Bank. These accounts are mainly used to service customers and bank-to-bank transfers. Loro accounts within the Bank are subject to periodic profitability analyses and usefulness to Bank and hence this reason their number changes.
In the first half of 2011, the Bank collaborated with four non-banking financial institutions offering low cost and fast electronic money transfers: MoneyGram (USA), Doma International Transfers (USA), Vigo Remittance Corporation (USA) and OneMoneyMail (UK). The scope of cooperation is both cash transfers and transfers to bank accounts. In the case of MoneyGram, the transactions were executed in both directions i.e. to and from Poland. The Bank has also continued cooperation with domestic and foreign financial institutions, including mainly investment funds, insurance companies, pension funds managers, brokers and banks, which facilitated for a wide variety of treasury and deposit transactions.
Financing of foreign trade operations
The Bank‟s product range for financing foreign trade operations included: export and import letters of credit, import and export documentary collections, discounting L/Cs, nostro and loro guarantees, endorsing bills of exchange and granting sureties, factoring, payment orders and cheque operations.
During the first half of 2011 more than 233 thousand transactions were settled via nostro accounts opened in foreign and domestic commercial banks and the National Bank of Poland, which in comparison with the same period of 2010 (more than 176 thousand of transactions) constitutes an increase of 19%. The value of transactions settled through nostro accounts increased in the first half of 2011 by 2.8% in comparison with the first half of 2010, and amounted to PLN 1.47 bn.
In total during the first half of 2011 over 55 thousand transactions were settled via loro accounts (inter-bank and client dispositions). In comparison with the first half of 2010 (more than 51 thousand transactions) this constituted an increase of 7.8% in the volume of transactions.
During the first half of 2011 there was a significant improvement in the number and the value of payment orders to other countries and payment orders from other countries in comparison with the first half of 2010. Number of payments orders to other countries increased by 17.2% up to 62 702 transfers, and the value of import transfers increased by 30.8% and amounted to PLN 4 394 million.
There was a further increase in the share of electronic channels in the overall volume of import transfers from 68% in the first half of 2010 up to 78% in the same period of 2011. The volume of payment orders to other countries (export transfers) increased in relation to the first half of 2010 by 13% (reaching the level of 154 721 transfers during the first half of 2011), the value of export transfers increased by approx. 30.8% in relation to the first half of 2010 and amounted to PLN 7 040 million.
The number and the value of SEPA Credit Transfers, for export and import transfers, doubled in comparison with the same period of 2010 and amounted to: 23 817 import transfers with the value of PLN 1 196 million (11 790 transfers with the value of 425 million in the first half of 2010) and 62 063 export transfers with the value of PLN 1 363 million (36 406 transfers with the value of PLN 742 million in the first half of 2010). The share of SEPA Credit Transfer transfers in the volume of export and import transfers increased in the first half of 2011 by 38% and 40% respectively.
In regard to handling own document operations (letters of credit and bills for collection) and own guarantees, the number of new transactions in the first half of 2011 performed on the instructions of Bank clients increased by 15.6%, i.e. 954 new transactions in comparison to the first half of 21, reaching the value of PLN 634.2 million, which constitutes an increase of 43.6% in the value of transactions. In the first half of 2011 the value of letters of credit and bills for collection issued by the Bank amounted to PLN 119.2 million., which constitutes an increase of 7.3% compared to the same period of 2010. The volume of the Bank‟s own letters of credit and bills for collection remained

Page 29 of 38
comparable in relation to 2010 levels and reached the number of 381 transactions. At the end of June 2011, the aggregate amount of Bank‟s guarantees and promises amounted to PLN 514.9 million, which means an increase of 5.7% in the value of promises and guarantees granted the same period of 2010, with an increase in the number of transactions by 29.6% up to 573 transactions in the first half of 2011.
In regard to external document operations and external guarantees, the value of transactions performed in 2011 for Bank clients was PLN 16.4 million, constituting a fall of 28% in the value of transactions performed in relation to the first half of 2010, with an increase in the number of transactions by 15.8% (88 transactions performed in the first half of 2011).
8.7. ORGANIZATION AND PERSONNEL
8.7.1. ORGANIZATIONAL STRUCTURE
In January 2011, reorganization was carried out in the of Financial Markets area which consisted of establishing a new unit responsible for attracting new non-banking customers and direct sale of financial market products, as well as providing advisory services to non-banking clients in the area of optimization of FX and interest rate risks and development of new financial market products. At the same time, the role of the then operational Treasury Department (currently the Financial Markets Department) was changed to include asset management and managing financial flows of the Bank, conducting operations on domestic and international financial markets to the account of the Bank with the objective to maximize profits as part of the given limits. The function of assets and liabilities management was delegated to a newly created unit in the area of Finance.
In April 2011, the entire IT division was reorganized.
In May 2011, changes were made in the structure of management competence areas in the Head Office in relation to the taking up functions by new Management Board Members. In particular, the following were established: Retail Banking and Management of Distribution Channels Division and Institutional Banking Division. The latter includes also Agro-Business Department and Small and Medium-Sized Enterprises Department. The previous organizational structure covered the Managing Distribution Channels Division and Product Development and Marketing Division.
8.7.2. HUMAN RESOURCES
Employment
At the end of June 2011, BGŻ S.A. had 5 471 employees i.e. 8.3% more than in the year before. Employment level in the Headquarters increased by 4.7% y/y and this resulted mainly from opening new strategic projects, TeleBGŻ development and strengthening the function of risk management. Employment level at the Bank' network increased by 9.9% y/y mainly as a result of new branches.
Table 28. Bank’s employment in employees and FTEs
30/06/2011 30/06/2010 Change Change (%)
Network 3 942 3 587 355 9.9%
Headquarters 1 458 1 392 66 4.7%
Brokerage Office 36 36 0 0.0%
Holiday resorts 31 32 (1) (3.1%)
Trade unions 4 3 1 33.3%
Total (employees) 5 471 5 050 421 8.3%
Network 3 908.3 3 551.9 356.5 10.0%
Headquarters 1 452.7 1 383.6 69.1 5.0%
Brokerage Office 36.0 36.0 0.0 0.0%
Holiday resorts 30.5 31.5 (1.0) (3.2%)
Trade unions 4.0 3.0 1.0 33.3%
Total (FTEs) 5 431.5 5 005.9 425.6 8.5%
Total(FTEs, semi annual average) 5 345.6 4 931.2 414.4 8.4%

Page 30 of 38
Salaries
The 10.2% y/y increase in the Bank‟s main salary level is mainly the result of the increase in the level of employment following dynamic development of new branches. A significant increase in costs of bonuses and awards (by 68.5% y/y) results from the fact that in 2010 bonus regulations were suspended in favour of a limited program of individual bonus and awards to the best employees, whilst in 2011 the Bank returned to the policy of paying employee bonuses.
Table 29. Payroll
PLN thousand Two
quarters of 2011
Two quarters of 2010
Change
PLN thousand
%
Base remuneration 149 936 136 098 13 839 10.2%
Other components of salaries and wages 1 339 1 140 199 17.5%
Awards and bonuses 26 039 15 451 10 588 68.5%
Non-employment contracts 1 203 1 105 98 8.8%
Social insurance 25 266 21 216 4 050 19.1%
Other employment costs 13 518 10 120 3 398 33.6%
Total payroll 217 301 185 130 32 172 17.4%
Awards and bonuses as % of base remuneration 17.4% 11.4% x 6.0%
8.8. IT ENVIRONMENT
In the first half of 2011, IT Department spent PLN 13.95 million on new investments. During this period, the Bank carried out over 40 large projects. Implementation was completed in 8 projects.
Tool for automatic reporting and modelling customer profiles according to the MIFID Directives was implemented.. In the area of security the Bank implemented the Arcsight system which is used for monitoring of events in the IT systems subject to ITGC. Implementation was completed new solutions in the banking cards that allow servicing the extended product offer of payment cards consistent with the EMV standard. Further development of telephone sales channel was developed by the extension of the Contact Centre . New solution provides the adequate customer service standards as well as allows servicing sales contracts or processing credit applications obtained via the Internet l. Another accomplished project is the integration of the e-Trade system dedicated to servicing factoring with the Eurobank central IT system,. This solution increased the competitiveness of the Bank‟s offer and reduced the operating risk. Also, the DEW system was implemented to servicing and distribution of electronic statements and TETA Constellation to manage workflow of documents in the HR area.
The new solutions the implementation of which commenced during the first half of 2011 is interface construction for the DirectBank system and archiving electronic mail at the Bank.
The Bank extended for another three years its share in the agreement Enterprise Agreement with Microsoft for the delivery of license to institutions of the Rabobank Group.
9. ACTIVITIES OF SUBSIDIARIES AND ASSOCIATED COMPANIES OF THE CAPITAL GROUP OF BGŻ S.A. IN THE FIRST HALF OF 2011
BGŻ S.A. Capital Group strategy assumes a consecutive portfolio divestment in capital exposures that are not the part of its core business activities, namely banking and financial services, and concentration on best financial result on specific transactions. In the first half of 2011 supervisory activities undertaken against BFN Actus Sp. z o.o. concentrated on creating conditions for sale of property in Wrocław-Marszowice.
9.1. BANKOWY FUNDUSZ NIERUCHOMOŚCIOWY ACTUS SP. Z O.O.
The company was created in 1999, with main business activities focusing on:
acquisition and disposal of properties and limited property rights,
conducting construction investment projects on own and third party properties,
Page 31 of 38
providing trust services in area of trading in properties and rental of premises,
leases of properties and premises,
rendering services: valuation of properties, property management, property advisory (activities of property servicing agency).
In the first half of 2011, the investment portfolio was composed of one property in Wroclaw. In 2010 the market value of the property was estimated by an external by a certified property appraiser at PLN 63.9 million.
Table 30. Key financial data of Bankowy Fundusz Nieruchomościowy Actus Sp. z o.o.
PLN thousand 30/06 2011
31/12 2010
30/06 2010
Total assets 64 058.0 64 061.7 63 303.6
Long-term investment 63 900.0 63 900.0 63 200.0
Equity 23 356.7 24 358.4 24 757.1
including: net profit (1 122.0) (1 821.6) (1 191.8)
9.2. BGŻ LEASING SP. Z O.O.
The company was created in April 2007 as a subsidiary of De Lage Landen International B.V. (the Rabobank Group). The company provides leasing services focusing on equipment, cars, and other fixed assets it also provides loans.
On July 1st, 2008 BGŻ S.A. purchased a 49% equity stake in the company for PLN 19.6 million. The
co-operation of the Bank with the BGŻ Leasing covers providing leasing services to the Bank‟s customers. BGŻ Leasing provides essential and technical background to support the Bank‟s advisors in the sale of lease products.
The first half of 2011 was a record one in the activities of BGŻ Leasing. Under the provision of leasing services, during the first half of 2011 the company leased assets with the value of PLN 270.47 million, growth of 65% in comparison with the first half of 2010. In general, 80 lease agreements were signed, i.e. 6% more than in the first half of 2010.
Table 31. Key financial data of BGŻ Leasing Sp. z o.o.
PLN thousand 30/06 2011
31/12 2010
30/06 2010
Total assets 786 817.5 676 505.4 498 546.4
Net leasing receivables and advances 700 537.3 584 797.7 418 956.8
Shareholders‟ equity 68 394.6 64 294.3 61 351.9
of which: net financial result 4 100.3 3 366.5 424.1
10. RISK MANAGEMENT
10.1. CREDIT RISK
Credit risk management
Credit risk is defined as the risk that a debtor will fail to meet his financial obligations within a specified period, and in particular the risk of inability to repay debts in accordance with agreed terms, as well as the risk of worsening of the debtor‟s financial condition that in turn will affect the valuation and quality of bank‟s assets.

Page 32 of 38
For the purposes of credit risk management the Management Board has implemented principles that determine the maximum level of credit risk (credit risk appetite statement), which the Bank is prepared to accept, according to the business strategy that the Bank is realizing.
In the process of credit risk management the Bank carries out actions based on the current analysis of macroeconomic environment and internal analysis of loan portfolios. This approach allows to take swift corrective actions in case of disturbing trends in the external environment are indentified as well as in the quality or structure of the loan portfolio.
Active management of credit risk the Bank realizes among other things through:
constant adjustment of lending policy, methods and tools for assessing and measuring risk to changing market conditions;
strict supervision over the existing portfolio of credit exposures.
The major activities carried out by the Bank in the first half of 2011 were:
credit verification process for in order to comply with Recommendation S and preparation to implement further changes that are meant to ensure the Bank‟s compliance with the recommendation‟s requirements,
review and modification of mortgage debt restructuring process,
review of existing and implementation of new methods for assessment of the creditworthiness of retail and institutional customers.
Quality and structure of credit portfolio
During the first half of 2011, the share of impaired loans and credits decreased from 6.4% at the end of 2010 to 6.3% at the end of June 201. This was due to improvement in the quality of portfolio of loans to institutional clients, for which the share dropped from 7.7% to 7.0% – partially due to the nominal decrease in impaired loans following repayments, and partially due to increase in the balance of newly issued loans. However, a deterioration was, observed in the retail customers portfolio, in which the share of impaired loans increased from 4.4% to 5.1% – mainly, as a result of delays in repayment of housing and cash loans.
The Bank has relatively safe structure of its credit portfolio i.e. with high share of comparatively more favourable risk profile i.e. housing loans (30.7% of the gross portfolio at the end of June 2011) and farmer loans (21.8% of gross portfolio). Approximately half of housing loans are foreign currency loans – their share continues to systematically decrease after April 2009 when the Bank ceased to issue them. The share of cash loans with higher credit risk is 3.2%, whilst in the banking sector - 15%.
Table 32. Structure of loan portfolio
PLN thousand
30/06/2011 31/12/2010 30/06/2010
Change y/y PLN thousand
share PLN
thousand share
PLN thousand
share
Loans and advances, gross 21 808 089 100.0% 20 567 994 100.0% 19 646 972 100.0% 2 161 117 11.0%
Real-estate loans 6 689 794 30.7% 6 558 895 31.9% 6 357 847 32.4% 331 947 5.2%
– in PLN 3 289 970 15.1% 3 233 535 15.7% 2 955 917 15.0% 334 053 11.3%
– in foreing currency 3 399 824 15.6% 3 325 360 16.2% 3 401 930 17.3% (2 106) (0.1%)
Cash loans 703 960 3.2% 705 572 3.4% 656 287 3.3% 47 672 7.3%
Other retail loans 627 956 2.9% 626 251 3.0% 622 486 3.2% 5 471 0.9%
Individual entrepreneurs 1 248 930 5.7% 1 083 659 5.3% 1 023 750 5.2% 225 180 22.0%
Farmers 4 750 917 21.8% 4 307 981 20.9% 4 066 832 20.7% 684 085 16.8%
Businesses 7 146 626 32.8% 6 688 407 32.5% 6 375 394 32.4% 771 232 12.1%
Purchased debt 345 237 1.6% 291 397 1.4% 255 715 1.3% 89 522 35.0%
Public sector institutions 213 206 1.0% 215 807 1.0% 205 137 1.0% 8 069 3.9%
Other receivables 81 463 0.4% 90 025 0.4% 83 524 0.4% (2 061) (2.5%)
Page 33 of 38
Restructuring and recovery of high-risk debt
The policy of restructuring and debt recovery conducted in the year 2011 was based on continuation of the main activities in the area of:
identification, negotiation and implementation of activities aimed at maximizing the debt repayment by debtors, or – where possible – implementation and monitoring of debtors corporate recovery proceedings with a view on improving their financial situation and transferring them back to servicing by sales units,
limiting the ratio of share of high risk debt in the Bank‟s portfolio,
active monitoring of bankruptcy and enforcement proceedings,
strengthening the transaction structure by taking out additional collaterals, changes in the repayment schedule, change in the loan drawing schedule, changeextension of contractual provisions or change of transaction type,
optimized execution of the tax strategies,
identification of early warning signs and taking up activities limiting potential losses (where possible, in collaboration with sales units),
further integration and coordination of activities with the function of restructuring and debt recovery of larger transactions at the Rabobank Group (GSAM), as well as with sales units of the Bank for certain specific transactions,
staff employment and training so as to have qualified resources to manage the given Bank portfolio,
organization, procedures and tools enhancement to improve the effectiveness of executed tasks.
The repayment of debt serviced by Bad Debt Department made in the first half of 2011 in the total amount of PLN 300.4 million (equity) was the result of conducted court execution proceedings, bankruptcy proceedings in progress, settlement and composition proceedings with debtors.
10.2. FINANCIAL RISK
10.2.1. Market risk
The activities of the BGŻ Bank are divided into trading and banking books. Changes in market interest rates, exchange rates, prices of securities as well as the implied fluctuations in option-type instruments result in changes in valuation of the present value of these books. The risk of unfavourable changes due to fluctuations in the above factors is recognised by the Bank as market risk and – due to the varied character of the books – is monitored and managed separately for each book.
In addition, it should be note that during the first half of 2011, the Bank did not operate on commodity markets and its activities in the share market that were conducted through the Brokerage Office and thus were practically reduced to zero.
Market risk in the banking book
Included in the scope of the banking book are – transferred for management to the Head Office through the system of Funds Transfer Prices – deposits and credits (loans and borrowings), items of strategic nature (long-term investments, bonds from the conversion of obligatory reserve, own debt instruments issued and loans and borrowings), liquidity-type operations of the financial market (inter-bank placements, liquid debt securities) as well as hedging instruments for this book (derivative financial instruments) and non-interest items (among others, equity, tangible fixed assets, intangible assets, taxes, provisions and current result).
The Bank‟s policy in the area of banking book has continued to be to attain additional revenues in the above product margin without compromising stability of client deposits, equity or financial result. The Bank has met this objective by maintaining or matching natural exposure generated by the main
Page 34 of 38
deposit-lending activities, as part of prevailing risk limits and in accordance with expected mid- and long-term trends of the financial market.
The key measures for market risk used by the Bank in the banking book are:
interest rate gap, life of assets/liabilities, the so-called „duration”;
sensitivity measures – defining sensitivity of financial amount valuation, interest revenues or net economic capital to changes in risk parameters;
IaR (Interest-at-Risk – sensitivity of interest result);
EaR (Equity-at-Risk – sensitivity of the present value of net equity).
The Bank manages the risk of banking book by limiting risk measures and ongoing risk monitoring.
Situation in the first half of 2011
As at the end of the first half of 2011, average value of „duration” i.e. the weighted period to revaluation of interest rate of balance sheet assets was approx. 1.7 months, whilst for balance sheet liabilities – approx. 1.8 months. This effectively means that for 99% of assets and almost 100% of liabilities, interest rate are revaluated within one year for 90% assets and 80% liabilities in 3 months and for 66% of assets and 55% of liabilities during one month. Despite the fact that the above figures are similar to those reported by the Bank in 2010, however it should be noted that in the first half of 2011 certain changes were made in the Bank‟s balance sheet structure. As a result, the gap on assets with revaluation date of up to 1 month decreased, but mainly on assets with revaluation period of 1-3 months.
The positive profile of accumulated interest rate gap resulting from the excess of assets with revaluation period of 1 and 3 months effectively means that – from the point of view of interest rate sensitivity – the Bank‟s risk profile is directed towards increase in interest result: an immediate effect of increase in interest rate by 50bps would cause increase in the Bank‟s interest result within 1 year by approx. PLN 3.99 million, whilst gradual increase in interest rates by 200 bps within 1 year would cause increase in interest result by approx. PLN 2.67 million. The sensitivity of interest result to decrease in interest rates is higher due to existence of liabilities which are not sensitive to fluctuations in interest rates (certain costs do not decrease with decrease in interest rates) and due to the multiplier effect of preference loans. It seems that changes in the structure of banking book materially changed the sensitivity of interest result to fluctuations in interest rates. In December 2010, an immediate increase in interest rate by 50bps would have caused the increase in the Bank‟s interest result in 1 year by approx. PLN 18 million, whilst gradual increase in interest rates of 200bps during 1 year – by approx. PLN 33.2 million.
Market risk in the trading book
Trading activities are complementary and are carried out to support the sales of financial products to corporate finance non-bank customers (direct sales) and retail customers. Opening for this purpose its own positions, the Bank generates income from short-term changes in price parameters (currency rates, interest rates, and prices of securities etc.) while keeping the size of the exposure within predefined limits.
The Bank does not have open position on currency options and for this reason, the market risk in the portfolio of option transactions does not exist.
The key measures for market risk used by the Bank in the trading book are:
Value-at-Risk (VaR) – showing maximum acceptable level of loss on the given item in normal market conditions in a defined time span; can be exceeded with defined probability; BGŻ applies the parametric model with modified variance – covariance matrix and exponential weighting of historical observations; the accepted confidence level is 99%, and the period of position holding for trading book – 1 day;
Scenario analyses and Stress Test – supplement VaR to include statistically predictable market events; historical economic and political crises, expected shortfall analyses (expected loss of value above confidence level) and max-loss (the highest possible loss based on a known history of fluctuations in market-based factors);
Page 35 of 38
BpV (basis point value) – sensitivity of price to parallel shift of profitability curve;
Nominal measures – among others, value of currency position during a day and at day end, securities nominal value;
Non-monetary limitations – among others, allowed types of instruments, currencies and pairs of currencies, maximum maturity dates, minimal credit rating for acquired debt securities;
Stop – loss limits (level of the maximum loss acceptable) – for various time periods (day, month, year) at the portfolio and sub-portfolio level.
In order to limit the market exposure, based on the decisions of the Committee for Risk and Balance Sheet Management, limits are established for IR VaR and FX VaR risk appetite, stress tests, BpV sensitivity and other measures. Utilisation of all limits is monitored and controlled on a daily basis.
Situation in the first half of 2011
In 2011, market risk for the entire trading book measured using the VaR measure remained, on average, at the level equating 45% of the set limit. The maximum VaR amounted to PLN 0.99 million and represented 79% of limit utilisation. No instances of exceeding risk appetite limits were recorded.
The amount of VaR was mainly affected by portfolios of instruments sensitive to fluctuations in interest rate such as debt securities, IRSs, as well as portfolios of instruments sensitive to fluctuations in exchange rates, mainly currency exchange transactions. Other groups of risk factors had relatively low impact on VaR.
The additional market risk measures which supplement the measure of VaR are stress tests which show how a change in the Bank‟s current assessment would look like if one of the assumed market scenarios materialized. The Bank‟s market risk policy describes possible scenarios. Then the value of portfolios and risk measures is calculated for each scenario. In order to load the limit, the most pessimistic scenario is selected.
Loading the ST limit in the first half of 2011 amounted, on average, to PLN 5.8 million whilst the limit was PLN 9 million. In 2010, loading the ST limit amounted to only PLN 2.9 million.
Liquidity risk and evaluation of quality and stability of funding sources
In 2010 and 2011, the Bank maintained safe level of financial liquidity. The financial resources held allowed to timely discharge all liabilities of the Bank. The portfolio of the most liquid securities was kept at a high level thus fully hedging a possible outflow of resources of the largest depositors. The surplus of liquid assets over the minimal limit increased over the year by PLN 0.85 billion. The surplus of liquid assets over the minimal limit amounted to PLN 1.4 billion at the end of first half of 2011.
At the end of June 2011 the surplus of the outside inter-bank market sources of finance over loans balance amounted to PLN 2.3 billion with only PLN 0.2 billion deficit to fully cover the loan portfolio with stable deposits.
During the first half of 2011, the stability of the Bank‟s sources of finance remained high – on average 86.7%, in 2010 on average 85%) – mainly due to low fluctuation of retail deposit balances, increase of balances of resources deposited by the customers form SME and Microcompanies sector (excluding migration between individual products), sediment cash of large enterprises and budget entities, the increasing balance of certificates of deposit, the credit line granted by the EBRD and in the second quarter of 2011 also due to the CHF loan from Rabobank.
10.3. OPERATING RISK
In accordance with the regulations in force, the Bank defines operating risk as a possibility of suffering loss or unjustified costs caused by improper or unreliable internal processes, people, technical systems or influence of external factors. The operating risk scope of the Bank also includes the risk of the non-compliance and legal risks.
The purpose of operating risk management is to limit losses and costs caused by such risk, ensuring that Bank renders services of the highest quality as well as security and operations in compliance with laws and regulations.
Page 36 of 38
Organization
Primary role in the organizational structure responsible for managing organizational risk is fulfilled by the BRMC as well as the Operational Risk and Compliance Subcommittee, which act as the Management Board intermediaries , supervising the operational risk management system and the risk level. The responsibilities of the Operational Risk Management Bureau in the Risk Management Function include but are not limited to the processes and tools related to operating risk management. There is an operational risk coordinator in each organizational unit at the Head Office of the Bank, while in the Regional Centres there are posts for operational risk management.
Procedures
The operating risk management rules implemented by the Bank are consistent with supervisory regulations and market practices in this field . The principles for operating risk management constitute Operating Risk Policy adopted by the Management Board, which is supplemented by Operating Risk Policy for IT systems, Bank Security Policy, Compliance Policy and other detailed regulations.
Risk management
An important element of operating risk management system is early identification of risk, precise evaluation of its size and rules that enable undertaking effective actions against risk. Operating risk identification and reporting system embrace all Bank‟s organizational units which thus ensures completeness and accuracy of data that constitute basis for risk evaluation and decision making that influence the size of the risk borne by the Bank. The Bank‟s employees are trained among others in identification and reporting of operating risk events and threats.
Economic capital and risk evaluation
Bank has a 9-years historical data on losses within the operating risk area. The data concerning operating risk losses and threats collected by the Bank is used to evaluate economic capital required to cover operating risk that strictly corresponds to Bank‟s operating profile. The evaluation of economical capital is based on implemented rules and statistical model. Irrespective of the above, according to the regulations in force, the Bank determines regulating capital to cover operating risk. The basic index method (BIA) is applied to calculate it.
The process of operating risk assessment is supplemented with the operating risk self- assessment method and the Key Operating Risk Indicators Method. The Key Operating Risk Indicators are the tool to monitor operating risk for selected, significant processes within the Bank using the three-grade risk evaluation scale.
10.4. LEGAL RISK
The litigation situation in the first half of 2011 within pecuniary and employment claims was stable and did not generate material legal risk for the Bank.
Table 33. Provisions with an individual value PLN 100 thousand for future liabilities under legal disputes, where the Bank is a party, created or reversed in the first half of 2011
Purpose
Value PLN thousand
Creation date
Reversal date
Court proceedings initiated by the ARiMR 578.9 2010-05-05 2011-06-30
Court proceedings initiated by the customer 217.5 2010-03-18 2011-03-17
Court proceedings initiated by the customer 254.2 2010-03-18 2011-06-08
Court proceedings related to labor law 23.5 2011-03-16 _________
Court proceedings initiated by the ARiMR 1 016.7 2011-03-18 _________
Court proceedings initiated by the customer 120.5 2011-02-21 _________
Court proceedings initiated by the ARiMR 56.0 2011-01-19 _________
Penalties for the ARiMR 1 508.4 2005-09-30 2011-04-06
Court proceedings initiated by the customer 11.9 2011-03-09 2011-04-08
Page 37 of 38
11. DEVELOPMENT PROSPECTS OF THE CAPITAL GROUP BGŻ S.A.
11.1. STRATEGY FOR THE YEARS 2011-2014
The strategy for the years 2011-2014 was accepted by the Bank‟s Supervisory Board on 28 January 2010. At the beginning of 2011 the Bank has revised and updated its strategy.
In accordance with the strategy the Bank shall develop as a universal bank specializing rendering services for the agricultural and food producing industry. From the perspective of the client the Bank wants to be a Bank developing long-term relations, seen as a responsible partner and engaged in local communities.
In accordance with the strategy the Bank shall develop as a universal bank specializing rendering services for the agricultural and food producing industry. From the perspective of the client the Bank wants to be a Bank developing long-term relations, seen as a responsible partner and engaged in local communities.
As regards to universal banking, the strategy assumes strengthening the position of the Bank in the area of retail banking. To this end, further development has been planned of the Bank‟s network on local markets (agricultural areas, medium and small towns), as well as extension of product offer and initiatives to attract middle-class customers in order to secure financing for the main segments of banking business. The Bank will focus on the further development of services to SMEs and to micro enterprises on local markets.
As regards banking for the agricultural – food industry sectors, the Bank intends to strengthen its position based on product offer and service model tailored to the specific needs of these sectors.
The implementation of the strategic assumptions is assisted by a number of internal project and initiatives including inter alia: the development of traditional and virtual distribution channel, optimization of internal processes and the business support functions. Special significance is attached to the development of the Customer Relationship Management (CRM) systems, the improvement of the operating effectiveness and the optimization of the human potential management.
Both the Management Board and the Shareholders of the Bank are confident of the long-term potential of the banking market in Poland and shall continue their engagement into the future development of BGŻ S.A.
................................
Jacek Bartkiewicz President of the Management Board
….................................... Gerardus Cornelis Embrechts
First Vice-President
of the Management Board
.................................. Witold Okarma Vice-President
of the Management Board
................................. Andrzej Sieradz
Vice-President of the Management Board
.................................. Johannes Gerardus Beuming
Vice-President of the Management Board
.................................. Dariusz Odzioba
Vice-President of the Management Board
……….................................. Wojciech Sass Vice-President
of the Management Board
Warsaw, 23 August 2011