solvency and financial condition report - 2020
TRANSCRIPT

Solvency and Financial Condition Report
2020
Generali Česká pojišťovna a.s. ● Solvency and Financial Condit ion Report 2020 2
Index Index .................................................................................................................................................................................. 2
Introduction ..................................................................................................................................................................... 3
Glossary ............................................................................................................................................................................. 4
Summary............................................................................................................................................................................ 6
A. Business and performance................................................................................................................................... 10
A.1. BUSINESS..................................................................................................................................................... 10
A.2. UNDERWRITING PERFORMANCE ................................................................................................................ 16
A.3. INVESTMENT PERFORMANCE ..................................................................................................................... 21
A.4. PERFORMANCE OF OTHER ACTIVITIES ...................................................................................................... 25
A.5. ANY OTHER INFORMATION.......................................................................................................................... 25
B. System of governance ......................................................................................................................................... 26
B.1. GENERAL INFORMATION ON THE SYSTEM OF GOVERNANCE .................................................................. 26
B.2. FIT AND PROPER REQUIREMENTS.............................................................................................................. 29
B.3. RISK MANAGEMENT SYSTEM ...................................................................................................................... 31
B.4. INTERNAL CONTROL SYSTEM..................................................................................................................... 35
B.5. INTERNAL AUDIT FUNCTION........................................................................................................................ 36
B.6. ACTUARIAL FUNCTION ................................................................................................................................ 38
B.7. OUTSOURCING ............................................................................................................................................. 39
B.8. ANY OTHER INFORMATION.......................................................................................................................... 39
C. Risk profile .......................................................................................................................................................... 40
C.1. UNDERWRITING RISK .................................................................................................................................. 40
C.2. MARKET RISK............................................................................................................................................... 45
C.3. CREDIT RISK ................................................................................................................................................ 49
C.4. LIQUIDITY RISK ............................................................................................................................................ 50
C.5. OPERATIONAL RISK..................................................................................................................................... 51
C.6. OTHER MATERIAL RISK ............................................................................................................................... 52
C.7. ANY OTHER INFORMATION.......................................................................................................................... 53
D. Valuation for solvency purposes ........................................................................................................................... 54
D.1. ASSETS......................................................................................................................................................... 54
D.2. TECHNICAL PROVISIONS............................................................................................................................. 60
D.3. OTHER LIABILITIES ...................................................................................................................................... 71
D.4. ALTERNATIVE METHODS FOR VALUATION ................................................................................................ 75
D.5. ANY OTHER INFORMATION.......................................................................................................................... 75
E. Capital management............................................................................................................................................ 76
E.1. OWN FUNDS ................................................................................................................................................. 76
E.2. SOLVENCY CAPITAL REQUIREMENT AND MINIMUM CAPITAL REQUIREMENT ......................................... 79
E.3. USE OF THE DURATION-BASED EQUITY RISK SUB-MODULE IN THE CALCULATION OF THE SOLVENCY CAPITAL REQUIREMENT............................................................................................................................................. 80
E.4. DIFFERENCES BETWEEN THE STANDARD FORMULA AND THE INTERNAL MODEL USED ....................... 80
E.5. NON-COMPLIANCE WITH THE MINIMUM CAPITAL REQUIREMENT AND NON-COMPLIANCE WITH THE
SOLVENCY CAPITAL REQUIREMENT ......................................................................................................................... 82
E.6. OTHER INFORMATION.................................................................................................................................. 82
3
Generali Česká pojišťovna a.s. ● Solvency and Financial Condition Report 2020
Introduction Generali Česká pojišťovna a.s. (the Company), falling under the scope of Solvency II Directive reporting, is required to prepare i ts own Solvency and Financial Condition Report (SFCR). This is in accordance with Directive 2009/138/EC (the Solvency II
Directive) as well as with Delegated Regulation 2015/35/EC (the Delegated Regulation) and the related Guidelines.
Policyholders and beneficiaries are the main SFCR addressees. The SFCR ensures increased market transparency through
support for the application of best practices, and also supports greater market confidence that leads to an improved understanding
of the insurance business.
The SFCR’s specific content is defined by primary legislation and implementing measures, which provide detailed information on
the essential aspects of its business, such as a description of the commercial activity and performance of the undertaking, the
system of governance, its risk profile, an evaluation of assets and liabil ities, and capital management for solvency purposes.
When disclosing the information referred to in this report, figures reflecting monetary amounts will be disclosed in thousands of
Czech crowns (CZK), which is the Company’s functional currency, unless otherwise stated. Negligible differences can arise due to rounding.
This document was approved by the Company’s Boa rd of Directors on 1 April 2021.
Generali Česká pojišťovna a.s. ● Solvency and Financial Condit ion Report 2020 4
Glossary
AFS Available For Sale
AHD Accident, Health and Disability
ALAE Allocated Loss Adjustment Expenses
ALM Asset Liability Management
AMSB Administrative, Management and Supervisory Body
BEL Discounted Best Estimate of Liabilities
Board Board of Directors
BOF Basic Own Funds
BSCR Basic Solvency Capital Ratio
CAT CATastrophic risk
CAT XL CATastrophe eXcess of Loss reinsurance contract
CB Contract Boundaries
CDA Counterparty Default Adjustment
CEE Central and Eastern Europe
CEO Chief Executive Officer
CFO Chief Financial Officer
CIB Czech Insurers' Bureau
CMP Capital Management Plan
CoC Cost of Capital
COR Combined Ratio
CRO Chief Risk Officer
CV Curriculum Vitae
CZK Czech crowns
CNP Czech Nuclear Insurance Pool
D&O Directors and Officers Liability
DFM Development Factor Models
DTA Deferred Tax Asset
DTL Deferred Tax Liability
EC European Community
EIOPA European Insurance and Occupational Pensions
Authority
EPIFP Expected Profit Included in Future Premiums
EU countries Countries of the European Union
EUR Euro
FV Fair Value
FVTPL Fair Value Through Profit or Loss
FX derivates Foreign eXchange derivates
FY Financial Year
GAAP Generally Accepted Accounting Principles
GCC Global Corporate and Commercial
GCRO Group Chief Risk Officer
Generali Assicurazioni Generali S.p.A. - the ultimate parent
company of the Company
GIGP Group Investment Governance Policy
GIRG Group Investment Risk Guidelines
IAS International Accounting Standards
IBNR Incurred But Not Reported
ICS Internal Control System
ID number IDentification number
IFRS International Financial Reporting Standards
IT Information Technology
L Life insurance
LAE Lost Adjustment Expenses
LAF Life Actuarial Function
LDC Loss Data Collection
LoB Line of Business
LTI Long Term Incentive programs
MCR Minimum Capital Requirement
MCZK Millions of Czech crowns
MTPL Motor Third Party Liability
MVBS Market Value Balance Sheet
MVM Market Value Margin
NAT CAT Natural Catastrophic excess of loss reinsurance
contract
NCC New Civil Code
NG Percentage of IFRS Net Outstanding Claims Reserve on
IFRS Gross Outstanding Claims Reserve for each
accident year
NL Non-life Insurance
No Number
OCR Outstanding Claims Reserve
ORSA Own Risk and Solvency Assessment
P&C Property & Casualty, Non-life insurance
P&L Profit and Loss
PDF Probability Distribution Forecast
PIM Partial Internal Model
QRT Quantitative Reporting Template
RA Risk Adjustment
RAF risk appetite framework
RBNS Reported But Not Settled
ResQ Group Reserving Tool
RFF Ring Fenced Funds
RM Risk Margin
RSR Regular Supervisory Report
RUB Russian rouble
SAA Strategic Asset Allocation
SCR Solvency Capital Requirement
SFCR Solvency and Financial Condition Report
SII Solvency II: the set of legislative and regulatory
provisions introduced following the issue of Directive
2009/138/EC of the European Parliament and the
Council of 25 November 2009

5
Generali Česká pojišťovna a.s. ● Solvency and Financial Condition Report 2020
SLT Similar to Life Techniques
SME business Small and Medium-Sized Enterprise business
SPV Special Purpose Vehicle
STI Short Term variable Incentives
TCZK Thousands of Czech crowns
the Bureau Czech Insurers' Bureau
the Company Česká pojišťovna, a.s.
TP Technical Provisions
TPL Third Party Liability
TRCR Technical Reserves Coverage Requirement
UBEL Undiscounted Best Estimate of Liabilities
UL (products) Unit-linked products
ULAE Unallocated Loss Adjustment Expenses
UW Underwriting
VaR
calculation
Value at Risk calculation
XL Excess of Loss reinsurance
YE Year End
Generali Česká pojišťovna a.s. ● Solvency and Financial Condition Report 2020 8
Summary
The objective of the Solvency and Financial Condition Report (SFCR) is to increase transparency in the insurance market by re quiring
insurance and reinsurance undertakings to publicly disclose a report on their solvency and financial condition on an annual basis.
BUSINESS AND PERFORMANCE (SECTION A)
Generali Česká pojišťovna is a composite insurance company providing individual l ife and non-life insurance as well as insurance for
small, medium and large clients covering risks in industry, business and agriculture. On 21 December 2019, as part of the Generali Group
insurance activities concentration process, Generali Česká pojišťovna took over local insurance portfolios from the former Generali
Pojišťovna a.s. and from Česká pojišťovna ZDRAVÍ a.s. On 21 December 2020, the process was finalised and foreign insurance portfolios
and the reinsurance contract portfolio were also transferred.
In mid-December 2020, A.M. Best, an international rating agency specializing in the insurance sector, confirmed an ‘A‘ (Excellent) financial
strength rating for Generali Česká pojišťovna with a stable outlook and an “a+” credit rating with a stable outlook. The rating reflects the
strong balance sheet and stability of the Company. A.M. Best further positively evaluated the operating performance, very favourable
business profile, appropriate risk management and solid capitalization of Generali Česká pojišťovna.
The Company’s rating has a long tradition. The Company received its first rating in 1998 from DCR (Duff and Phelps, today Fitch). In the
years that followed, the Company was evaluated by Moody’s and Standard and Poor’s. In the past three years, the Company has b een
rated by A. M. Best, which specializes in the insurance sector.
After the takeover of these insurance portfolios, Generali Česká pojišťovna managed over eight-and-a-half million insurance policies as
of 31 December 2020.
The Company’s performance in 2020 gave it a market share of 26.7%.
7
Generali Česká pojišťovna a.s. ● Solvency and Financial Condition Report 2020
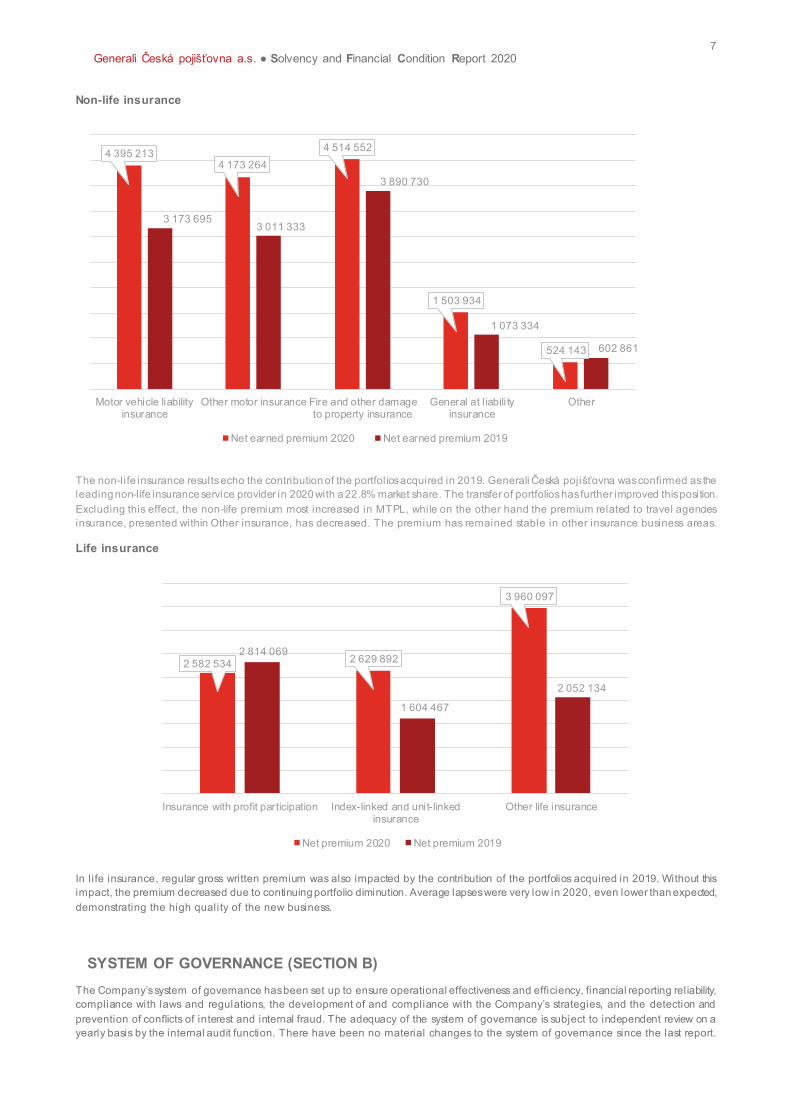
Non-life insurance
The non-life insurance results echo the contribution of the portfolios acquired in 2019. Generali Česká pojišťovna was confirmed as the
leading non-life insurance service provider in 2020 with a 22.8% market share. The transfer of portfolios has further improved this position.
Excluding this effect, the non-life premium most increased in MTPL, while on the other hand the premium related to travel agencies
insurance, presented within Other insurance, has decreased. The premium has remained stable in other insurance business areas.
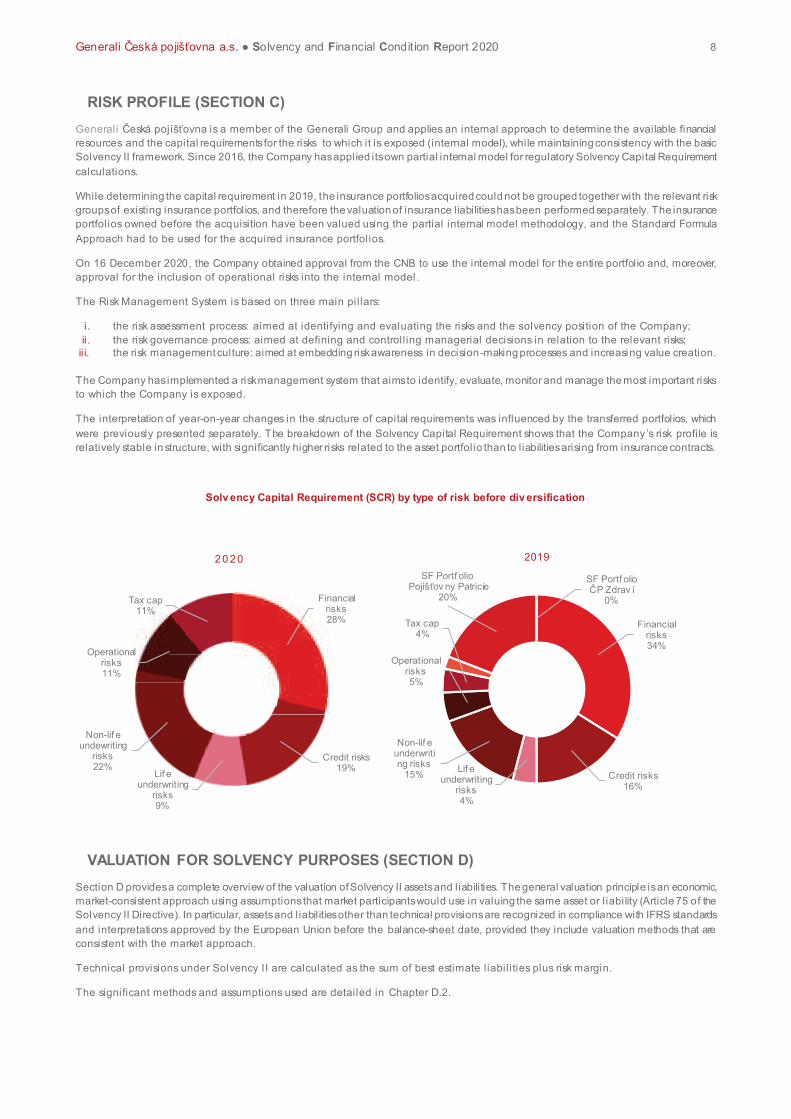
Life insurance
In l ife insurance, regular gross written premium was also impacted by the contribution of the portfolios acquired in 2019. Without this
impact, the premium decreased due to continuing portfolio diminution. Average lapses were very low in 2020, even lower than expected,
demonstrating the high quality of the new business.
SYSTEM OF GOVERNANCE (SECTION B)
The Company’s system of governance has been set up to ensure operational effectiveness and efficiency, financial reporting reliability,
compliance with laws and regulations, the development of and compliance with the Company’s strategies, and the detection and
prevention of conflicts of interest and internal fraud. The adequacy of the system of governance is subject to independent review on a
yearly basis by the internal audit function. There have been no material changes to the system of governance since the last report.
4 395 2134 173 264
4 514 552
1 503 934
524 143
3 173 6953 011 333
3 890 730
1 073 334
602 861
Motor vehicle liabilityinsurance
Other motor insurance Fire and other damageto property insurance
General at l iabili tyinsurance
Other
Net earned premium 2020 Net earned premium 2019
2 582 534 2 629 892
3 960 097
2 814 069
1 604 467
2 052 134
Insurance with profit participation Index-linked and unit-linkedinsurance
Other life insurance
Net premium 2020 Net premium 2019
Generali Česká pojišťovna a.s. ● Solvency and Financial Condit ion Report 2020 8
RISK PROFILE (SECTION C)
Generali Česká pojišťovna is a member of the Generali Group and applies an internal approach to determine the available financial
resources and the capital requirements for the risks to which it is exposed (internal model), while maintaining consistency with the basic
Solvency II framework. Since 2016, the Company has applied its own partial internal model for regulatory Solvency Capital Requirement
calculations.
While determining the capital requirement in 2019, the insurance portfolios acquired could not be grouped together with the relevant risk
groups of existing insurance portfolios, and therefore the valuation of insurance liabilities has been performed separately. The insurance
portfolios owned before the acquisition have been valued using the partial internal model methodology, and the Standard Formula
Approach had to be used for the acquired insurance portfolios.
On 16 December 2020, the Company obtained approval from the CNB to use the internal model for the entire portfolio and, moreover,
approval for the inclusion of operational risks into the internal model.
The Risk Management System is based on three main pil lars:
i. the risk assessment process: aimed at identifying and evaluating the risks and the solvency position of the Company;
ii. the risk governance process: aimed at defining and controll ing managerial decisions in relation to the relevant risks;
ii i. the risk management culture: aimed at embedding risk awareness in decision -making processes and increasing value creation.
The Company has implemented a risk management system that aims to identify, evaluate, monitor and manage the most important risks
to which the Company is exposed.
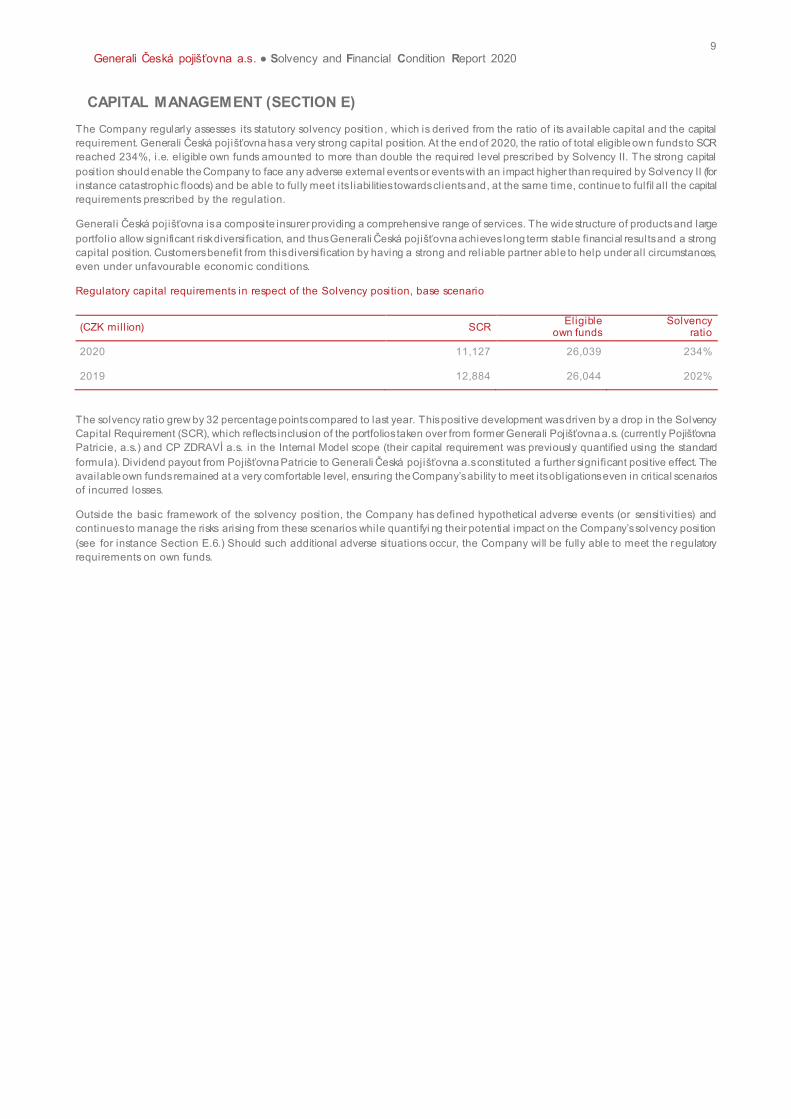
The interpretation of year-on-year changes in the structure of capital requirements was influenced by the transferred portfolios, which
were previously presented separately. The breakdown of the Solvency Capital Requirement shows that the Company ’s risk profile is
relatively stable in structure, with significantly higher risks related to the asset portfolio than to liabilities arising from insurance contracts.
Solv ency Capital Requirement (SCR) by type of risk before div ersification
VALUATION FOR SOLVENCY PURPOSES (SECTION D)
Section D provides a complete overview of the valuation of Solvency II assets and liabilities. The general valuation principle is an economic,
market-consistent approach using assumptions that market participants would use in valuing the same asset or l iability (Article 75 of the
Solvency II Directive). In particular, assets and liabil ities other than technical provisions are recognized in compliance with IFRS standards
and interpretations approved by the European Union before the balance-sheet date, provided they include valuation methods that are
consistent with the market approach.
Technical provisions under Solvency II are calculated as the sum of best estimate liabil ities plus risk margin.
The significant methods and assumptions used are detailed in Chapter D.2.
Financial risks28%
Credit risks19%
Lif e underwriting
risks9%
Non-lif e undewriting
risks22%
Operational risks11%
Tax cap11%
2 0 2 0
Financial risks34%
Credit risks16%
Lif e underwriting
risks4%
Non-lif e underwriting risks
15%
Operational risks5%
Tax cap4%
SF Portf olio Pojišťov ny Patricie
20%
SF Portf olio ČP Zdrav í
0%
2019
9
Generali Česká pojišťovna a.s. ● Solvency and Financial Condition Report 2020
CAPITAL MANAGEMENT (SECTION E)
The Company regularly assesses its statutory solvency position , which is derived from the ratio of its available capital and the capital
requirement. Generali Česká pojišťovna has a very strong capital position. At the end of 2020, the ratio of total eligible own funds to SCR
reached 234%, i.e. eligible own funds amounted to more than double the required level prescribed by Solvency II. The strong capital
position should enable the Company to face any adverse external events or events with an impact higher than required by Solvency II (for
instance catastrophic floods) and be able to fully meet its l iabilities towards clients and, at the same time, continue to fulfil all the capital
requirements prescribed by the regulation.
Generali Česká pojišťovna is a composite insurer providing a comprehensive range of services. The wide structure of products and large
portfolio allow significant risk diversification, and thus Generali Česká pojišťovna achieves long term stable financial results and a strong
capital position. Customers benefit from this diversification by having a strong and reliable partner able to help under all circumstances,
even under unfavourable economic conditions.
Regulatory capital requirements in respect of the Solvency position, base scenario
(CZK mill ion) SCR Eligible
own funds Solvency
ratio
2020 11,127 26,039 234%
2019 12,884 26,044 202%
The solvency ratio grew by 32 percentage points compared to last year. This positive development was driven by a drop in the Solvency
Capital Requirement (SCR), which reflects inclusion of the portfolios taken over from former Generali Pojišťovna a.s. (currently Pojišťovna Patricie, a.s.) and CP ZDRAVÍ a.s. in the Internal Model scope (their capital requirement was previously quantified using the standard
formula). Dividend payout from Pojišťovna Patricie to Generali Česká pojišťovna a.s constituted a further significant positive effect. The
available own funds remained at a very comfortable level, ensuring the Company’s ability to meet its obligations even in critical scenarios
of incurred losses.
Outside the basic framework of the solvency position, the Company has defined hypothetical adverse events (or sensitivities) and
continues to manage the risks arising from these scenarios while quantifyi ng their potential impact on the Company’s solvency position
(see for instance Section E.6.) Should such additional adverse situations occur, the Company will be fully able to meet the regulatory
requirements on own funds.
10
Generali Česká pojišťovna a.s. ● Solvency and Financial Condition Report 2020
A. Business and performance
A.1. BUSINESS
A.1.1. BASIC COMPANY INFORMATION
Company name Generali Česká pojišťovna a.s.
Legal form Joint-stock company
Registered office Spálená 75/16, Nové Město, 110 00, Prague 1
ID number 452 72 956
Tax ID number CZ 4527 2956
Date of establishment 1 May 1992
Legal regulation
The Company was founded pursuant to Section 11(3) of Act No 92/1991, on the
conditions for the transfer of state property to other entities, as amended, by the
National Property Fund of the Czech Republic under a founder’s deed dated 28 April 1992, and was incorporated by registration in the Commercial Register on 1
May 1992.
Incorporation in the Commercial Register
Prague Municipal Court
Section B, fi le number 1464
Date of incorporation in the Commercial
Register 1 May 1992
Share capital CZK 4,000,000,000 Paid up: 100%
11
Generali Česká pojišťovna a.s. ● Solvency and Financial Condition Report 2020
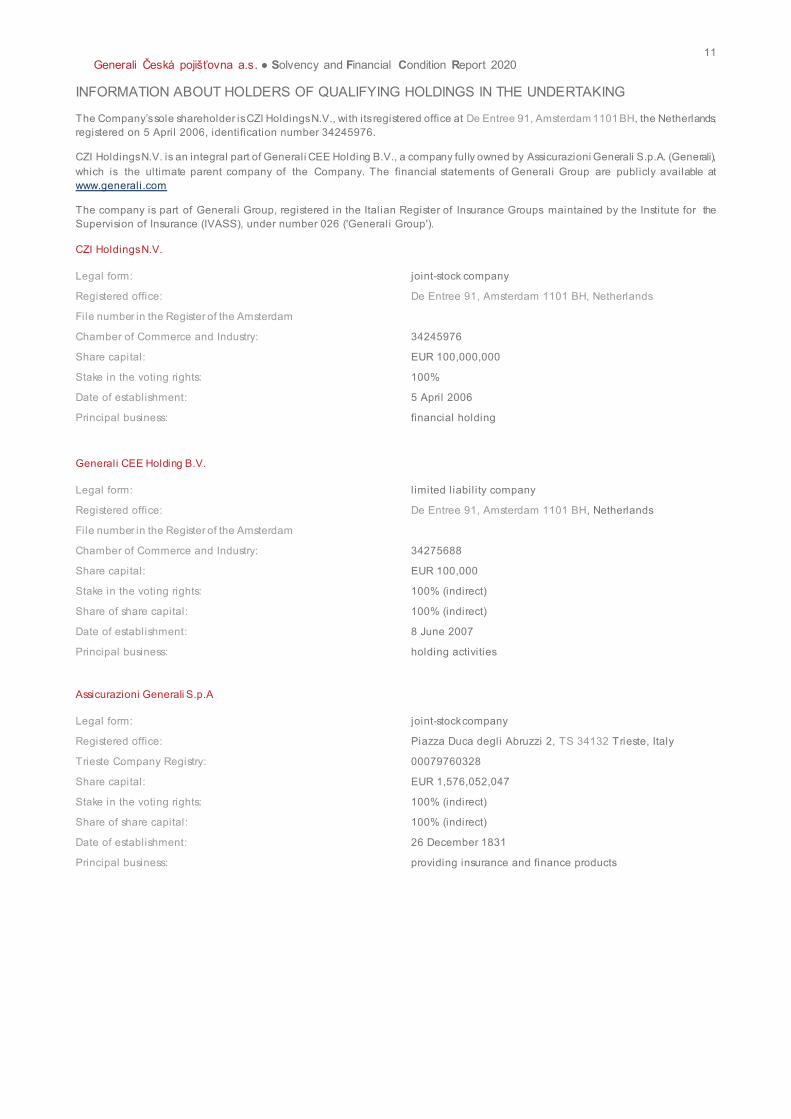
INFORMATION ABOUT HOLDERS OF QUALIFYING HOLDINGS IN THE UNDERTAKING
The Company’s sole shareholder is CZI Holdings N.V., with its registered office at De Entree 91, Amsterdam 1101 BH, the Netherlands;
registered on 5 April 2006, identification number 34245976.
CZI Holdings N.V. is an integral part of Generali CEE Holding B.V., a company fully owned by Assicurazioni Generali S.p.A. (Generali),
which is the ultimate parent company of the Company. The financial statements of Generali Group are publicly available at
www.generali.com
The company is part of Generali Group, registered in the Italian Register of Insurance Groups maintained by the Institute for the
Supervision of Insurance (IVASS), under number 026 ('Generali Group').
CZI Holdings N.V.
Legal form: joint-stock company
Registered office: De Entree 91, Amsterdam 1101 BH, Netherlands
File number in the Register of the Amsterdam
Chamber of Commerce and Industry: 34245976
Share capital: EUR 100,000,000
Stake in the voting rights: 100%
Date of establishment: 5 April 2006
Principal business: financial holding
Generali CEE Holding B.V.
Legal form: l imited liabil ity company
Registered office: De Entree 91, Amsterdam 1101 BH, Netherlands
File number in the Register of the Amsterdam
Chamber of Commerce and Industry: 34275688
Share capital: EUR 100,000
Stake in the voting rights: 100% (indirect)
Share of share capital: 100% (indirect)
Date of establishment: 8 June 2007
Principal business: holding activities
Assicurazioni Generali S.p.A
Legal form: joint-stock company
Registered office: Piazza Duca degli Abruzzi 2, TS 34132 Trieste, Italy
Trieste Company Registry: 00079760328
Share capital: EUR 1,576,052,047
Stake in the voting rights: 100% (indirect)
Share of share capital: 100% (indirect)
Date of establishment: 26 December 1831
Principal business: providing insurance and finance products
12
Generali Česká pojišťovna a.s. ● Solvency and Financial Condition Report 2020
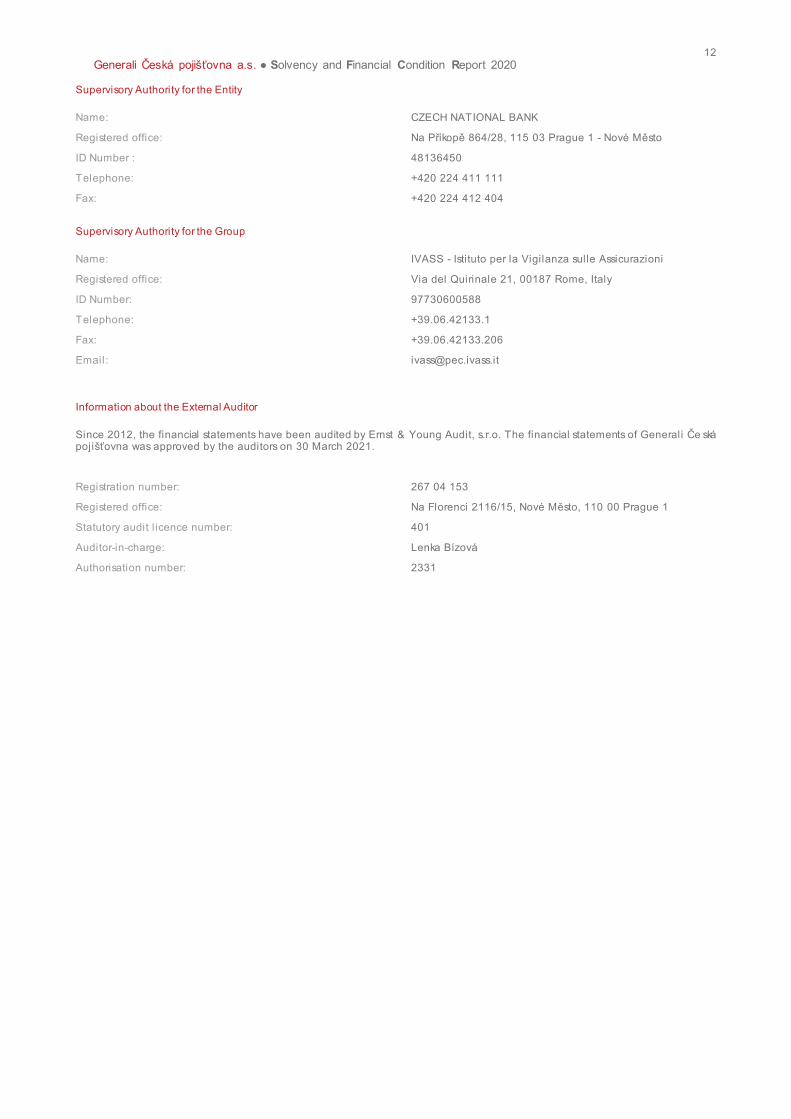
Supervisory Authority for the Entity
Name: CZECH NATIONAL BANK
Registered office: Na Příkopě 864/28, 115 03 Prague 1 - Nové Město
ID Number : 48136450
Telephone: +420 224 411 111
Fax: +420 224 412 404
Supervisory Authority for the Group
Name: IVASS - Istituto per la Vigilanza sulle Assicurazioni
Registered office: Via del Quirinale 21, 00187 Rome, Italy
ID Number: 97730600588
Telephone: +39.06.42133.1
Fax: +39.06.42133.206
Email: [email protected]
Information about the External Auditor
Since 2012, the financial statements have been audited by Ernst & Young Audit, s.r.o. The financial statements of Generali Če ská pojišťovna was approved by the auditors on 30 March 2021.
Registration number: 267 04 153
Registered office: Na Florenci 2116/15, Nové Město, 110 00 Prague 1
Statutory audit l icence number: 401
Auditor-in-charge: Lenka Bízová
Authorisation number: 2331
CP
Stra
teg
ic
Inv
estm
ent
s
N.V
.
NL
102
Ge
nera
li
pen
zijn
í sp
ole
čno
st,
a.s
.
CZ1
02
Čes
ká
poj
išťo
vna
ZDR
AV
Í a.s
.
CZ1
03
PA
LAC
KR
IZIK
a.s
.
CZ0
49
Gre
en P
oin
t
Off
ice
s a.
s.
SK03
0
Pař
ížsk
á 2
6,
s.r.
o.
CZ0
48
Ge
nera
li Č
eská
D
istr
ibu
ce a
.s.
CZ0
32
Acr
edi
té s
.r.o
.
CZ1
09
CZI
Ho
ldin
gs
N.V
.
NL
101
GSL
Ser
vice
s.
s.r.
o.
SK10
2
100%
100%
100%
100%
100%
100
%
100%
100%
100%
Eur
op
Ass
ista
nce
Mag
yaro
rszá
g
Be
fek
teté
si é
s
Tan
ács
ad
ó K
ft.
HU
020
Euró
pai U
tazá
si
Biz
tosí
tó Z
rt.
HU
002
Fu
nd
am
en
ta-L
akás
kass
za
Laká
stak
aré
k-pé
nztá
r Zá
rtkö
rűe
n M
űköd
ő Ré
szvé
nyt
ársa
ság
HU
07
0
Ge
nera
li
Ala
pke
zelő
Zrt
.
HU
073
Ge
ne
rali
-In
gat
lan
Va
gyo
nke
zelő
és
Szo
lgá
lta
tó K
ft.
HU
040
100
%61
%
26%
Ge
nera
li
Biz
tosí
tó Z
rt.
HU
000
GP
Con
sult
ing
Pén
zügy
i Ta
nács
adó
Kft
.
HU
082
100%
14,9
%
74%
(26
% G
CEE
)
Ge
nera
li
Poi
sťov
ňa a
.s.
SK00
0
VU
B G
en
era
li
dô
cho
dko
vá
sprá
vco
vsk
á
spo
ločn
ost’,
a.s
.
SK
070
100%
50%
(50
%
VÚ
B a
.s.)
Ge
nera
li
Insu
ran
ce A
D
BG
002
Ge
ne
rali
Zak
rila
Med
ical
and
De
nta
l
Ce
nte
r E
OO
D
BG
005
99,7
8%
100%
Ge
nera
li
Reo
sigu
ran
je
Srbi
ja a
.d.o
.
CS0
01
Akc
iona
rsko
dru
štvo
za
upr
avlj
anje
dob
rovo
ljni
m
pen
zijs
kim
fond
om
GEN
ERA
LI,
Beo
gra
d
CS00
2
Ge
nera
li
Zav
aro
valn
ica
d.d
.
SI00
0
Ge
nera
li
Osi
gura
nje
Srbi
ja a
.d.o
.
CS0
00
99,9
5%
(0,0
5%
GP
Re)
99,9
9%
(0
,01
%
GP
Re)
100%
100%
100%
100%
100
%
Ge
nert
el
Biz
tosí
tó Z
rt.
HU
074
100%
BRI
TIS
H
CO
RN
ER s
.r.o
.
CZ0
56
100%
Dir
ect
Car
e
s.r.
o.
CZ0
46
100%
Ge
ne
rali
To
wa
rzy
stw
o
Ub
ezp
iecz
en
S.A
.
PL0
01
Ge
ne
rali
Po
wsz
ech
ne
To
wa
rzy
stw
o
Em
ery
taln
e S.A
.
PL0
70
Gen
eral
i Fin
anc
e sp
ólk
a z
ogra
nicz
ona
odp
owie
dzi
alno
scia
PL06
0
100%
Ge
ne
rali
Zyc
ie
To
wa
rzy
stw
o
Ub
ezp
iecz
en
S.A
.
PL0
02
100%
100%
GP
Rei
nsu
ranc
e
EAD
BG
010
100
%
Euro
p
Ass
ista
nce
s.r
.o.
CZ0
20
99,9
9%
(0
,01
%
Ge
nera
li R
om
ania
)
Akc
iona
rsko
dru
štvo
za
osi
gura
nje
GE
NER
ALI
OSI
GU
RAN
JE
MO
NT
ENEG
RO
Podg
oric
a
ME
102
65
,24
% (
26
,82
%
Ge
ner
ali
Osi
gura
nje
Srb
ija,
7,9
3%
Ge
ner
ali
Re
osig
ura
nje
Srb
ija)
Ge
nera
li C
EE
Ho
ldin
g B
.V.
NL
100
Ass
icur
azio
ni G
ener
ali
S.p
.A.
IT00
0
100%
Ge
nera
li In
vest
CEE
Plc
.
IE10
0
10
0%
(G
CE
E h
old
s 1
sh
are
in
tru
st
for
GIC
EE
)
Na
dace
GC
P
CZ1
20
Au
tota
l
Biz
tosí
tási
Sz
olgá
lta
tó K
ft.
HU
083
100%
Solit
air
e R
eal
Esta
te,
a.s
.
CZ1
15
100
%
Ge
nera
li R
eal
Esta
te F
und
CEE
a.s
., in
vest
ičn
í fo
nd
CZ1
13
56,8
8 %
(18
,89
%
GP
Re,
24,2
3%
SM
ALL
GR
EF)
Ge
nera
li Č
eská
p
ojiš
ťovn
a a.
s.
CZ1
01
Ge
nera
li
De
velo
pm
ent
d.o
.o.
Beo
grad
-
No
vi B
eogr
ad
CS0
07
100%
100
%
25 %
(75
% E
URO
P
ASS
ISTA
NC
E
HO
LDIN
G, FR
A)
Roa
r bi
ztos
ítás
i és
pén
zügy
i kö
zvet
ítő
Kft
.
HU
031
50%
(50
% G
REF
)
IDEE
s.r
.o.
CZ0
50
100%
Ge
nera
li
Inv
estm
ent
s
CEE
, in
vest
ičn
í sp
ole
čno
st,
a.s
.
CZ1
05
PL
Inve
stm
ent
Jero
zolim
skie
I
Sp.
Z o
.o.
PL0
81
SIB
SEN
Inv
est
sp.
z o
.o.
PL0
84
100
%10
0%
Ná
měs
tí
Rep
ublik
y 3
a,
s.r.
o.
CZ0
52
100%
SMA
LL G
REF
a.s
.
CZ0
51
21
,21
%(1
8,1
8%
Ge
ner
ali
Biz
tosí
tó H
UN
, 2
0,7
1%
Ge
ner
ali
Pois
ťovň
a S
VK
,
Ge
ner
ali
TUSA
PL
26
,77
%,
Ge
ner
ali
Zyc
ie P
L 1
3,1
3%
)
100%
MU
STEK
PRO
PERT
IES
s.r.
o.
CZ0
53
100%
Off
ice
Cen
ter
Pur
kyň
ova
, a
.s.
CZ0
54
100
%
Cle
ha I
nve
st S
p.
z o
.o.
PL0
83
100%
GW
Bet
a B
.V.
NL
105
100%
Cla
ss A
sha
res
(vo
ting)
, 49
%
Cla
ss B
sha
res
(re
stri
cte
d vo
tin
g)
LEV
REG
ISTR
AC
IJA
D.O
.O.
SI00
2
100%
LLC
Gen
eral
i
Rus
sia
an
d C
IS
RU
105
100%
LLC
Ge
nera
li
Insu
ran
ce B
roke
rs -
Ru
ssia
an
d C
IS
RU
106
PJS
IC
Ing
osst
rak
h
RU
20138
,45
9%
100%
Bez
piec
zny
.pl
Sp z
o.o
.
PL0
50
51%
Co
nco
rdia
Po
lska
To
wa
rzy
stw
o
Ub
ezp
iecz
eń
S.A
.
PL0
05
100%
OVO
CNÝ
TRH
2
s.r.
o.
CZ0
57
100%
Pal
ác
Špor
k, a
.s.
CZ0
60
100%
SC
GE
NE
RA
LI
RO
MA
NIA
ASI
GU
RA
RE
RE
AS
IGU
RA
RE
SA
.
RO
10
1
Ge
nera
li
Osi
gura
nje
d.d
.
HR
003
100%
99,9
711
13%
Ba
nko
wy
Osr
od
ek
Do
rad
ztw
a i
Edu
ka
cji
Sp.
Z o
.o.
PL0
08
25,9
5%
AG
EN
T d
.o.o
.
Izo
la
SI01
071,4
286
%
PRO
SPER
A
d.o
.o.
SI01
1
Ge
ne
rali
Inv
estm
ents
, d
ružb
a
za u
pra
vlja
nje
d.o
.o.
SI00
4
Am
bu
lant
a
ZDR
AV
JE d
.o.o
.
SI01
3
Ge
nera
li
Inv
estm
ent
s
d.o
.o.
HR
005
NA
MA
d.d
.
Ljub
ljan
a
SI01
5
100%
100%
100%
100
%
Ge
nera
li
Inv
estm
ent
s A
D
Sko
pje
MK
00091
,54
%
97,7
7%
Ge
ne
rali
Inv
estm
ents
To
wa
rzy
stw
o
Fun
du
szy
Inw
est
ycyj
nych
S.A
.
PL0
06
100
%
Ido
ru d
.o.o
.
SI01
6
Med
ifit
d.o
.o.
SI01
7
VIZ
d.o
.o.
SI01
2
Ass
ista
nce
Co
ris
d.o
.o.
Ljub
ljan
a
SI00
6
48,5
1%
25%
24,9
9%
37,9
4%
Ge
nera
li
Inv
estm
ent
s G
P
1 d
.o.o
.
SI01
9
Ge
nera
li
Inv
estm
ent
s G
P
2 d
.o.o
.
SI02
0
100%
100%
Gen
eral
i Fon
d d
e
Pens
ii S
oci
etat
e d
e
Adm
inis
trar
e a
Fond
urilo
r de
Pen
sii
Priv
ate
S.A
.
RO
040
Poj
išťo
vna
Pat
rici
e a
.s.
CZ0
00
100
%
Ge
nera
li
Inv
estm
ent
s CP
d.o
.o.
k.d
SI00
5
100%
GSS
- G
ene
rali
Shar
ed
Serv
ice
s
S.c
.a.r
.l.
IT09
599,5
0%
(0,5
0%
)
Ge
nera
li Es
pana
Ho
ldin
g de
Enti
dade
s de
Segu
ros
S.A
.
ES03
1
Ge
nera
li
Espa
na,
S.A
. d
e
Segu
ros
y
Rea
seg
uros
ES00
3
100%
95,2
4%
(4,6
7%
)
Ge
nera
li
Bet
eili
gun
gs
Gm
bH
DE
037
100%
Ge
nera
li
De
utsc
hlan
d
AG
DE
012
Ge
nera
li
De
utsc
hlan
d
Ver
sich
eru
ng
AG
DE
01494
,10
%(5
,90
%)
100%
Ge
nera
li
Bet
eili
gun
gsve
r
wal
tung
Gm
bH
AT
057
Ge
nera
li
Ver
sich
eru
ng
AG
AT
009
75%
(25
%)
67,5
3%
(32
,47
%)
GE
NER
AL
I
OPE
RA
TIO
NS
SER
VIC
E P
LATF
OR
M
S.R
.L.
IT2
04
100%
Ge
nera
li Fr
anc
e
S.A
.
FR03
366,9
2%
(31
,73
%)
Ge
nera
li IA
RD
S.A
.
FR00
1
100
%
Euro
p
Ass
ista
nce
Ho
ldin
g S.A
.
FR03
496,3
6%
(3,6
5%
)
Euro
p
Ass
ista
nce
S.A
.
FR10
9
100%
Ge
nera
li IT
s.r
.o.
SK08
1
100
%
Ge
nera
li It
alia
S.p
.A.
IT30
1
100%
Ge
nera
li R
eal
Esta
te S
.p.A
.
IT08
2
100
%
PCS
Pra
ha
Cen
ter
spo
l. s
r.o
.
CZ0
45
100%
Fond
o D
oni
zett
i
IT19
3
55,1
6%
(44
,83
%)
Ge
nera
li R
eal
Esta
te A
sset
Rep
osit
ion
ing
S.A
.
LU09
338,3
9%
(61
,61
%)
GR
E PA
N-E
U
Jeru
zale
msk
á s.
r.o
.
CZ0
90
PA
N E
U K
otv
a
Pra
gue
a.s
.
CZ0
91
100%
100%
Ge
nera
li Eu
rope
Inco
me
Ho
ldin
g
S.A
.
LU04
4
GR
E PA
N-E
U
Pra
gue
1 s.
r.o
.
CZ0
43
100%
38,1
1%
(61
,89
%)
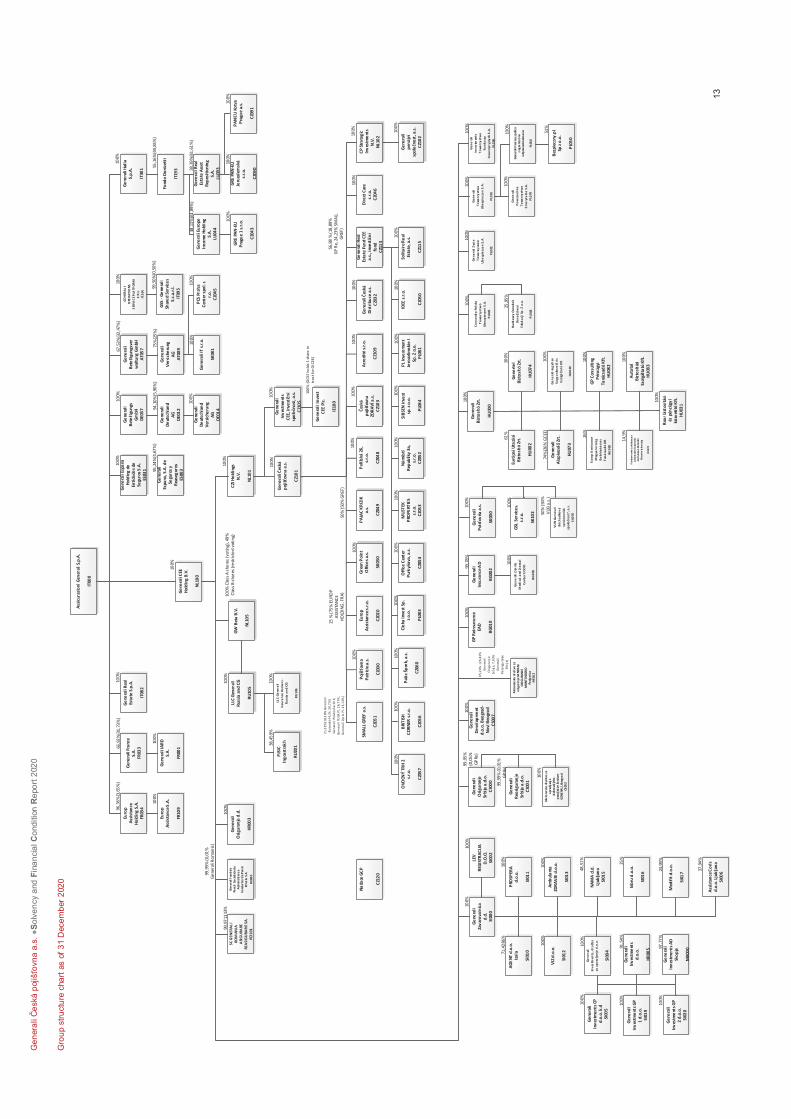
Gro
up s
tru
ctu
re c
ha
rt a
s o
f 3
1 D
ece
mb
er
202
0
13
Ge
ner
ali
Če
ská
poj
išťo
vna
a.s. ●
So
lve
ncy a
nd
Fin
an
cia
l C
ond
itio
n R
epo
rt 2
02
0
14
Generali Česká pojišťovna a.s. ● Solvency and Financial Condition Report 2020
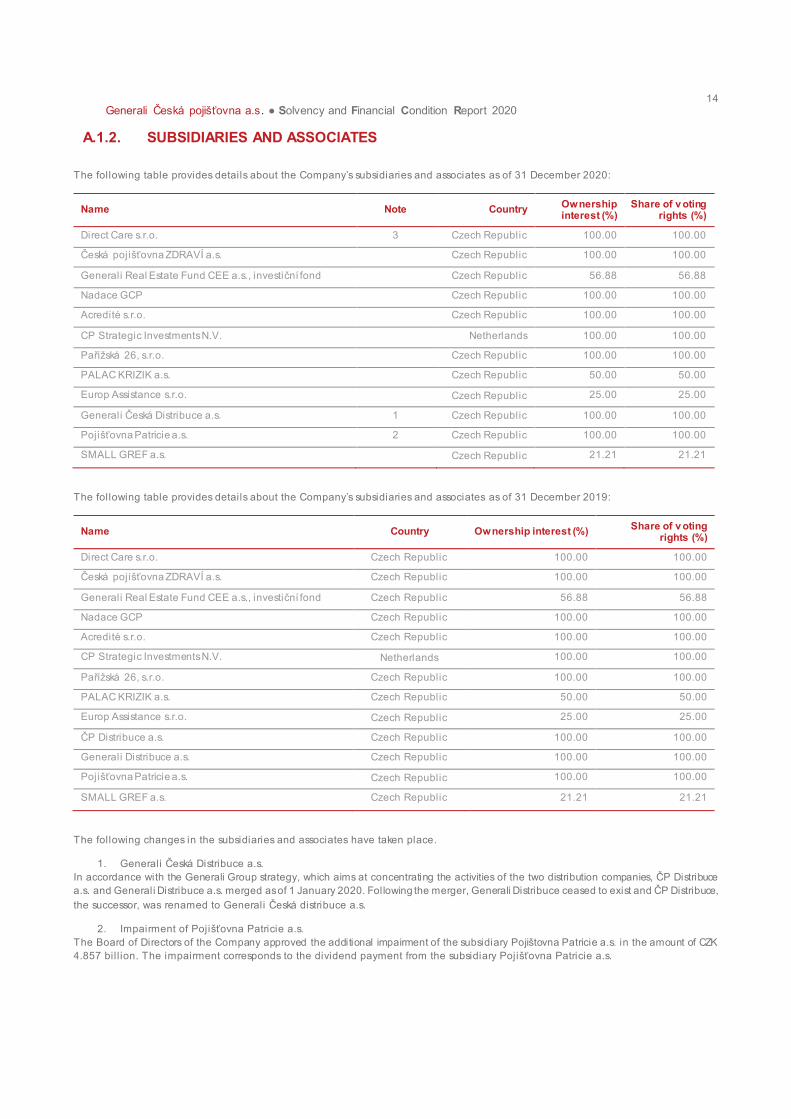
A.1.2. SUBSIDIARIES AND ASSOCIATES
The following table provides details about the Company’s subsidiaries and associates as of 31 December 2020:
Name Note Country Ownership interest (%)
Share of v oting rights (%)
Direct Care s.r.o. 3 Czech Republic 100.00 100.00
Česká pojišťovna ZDRAVÍ a.s. Czech Republic 100.00 100.00
Generali Real Estate Fund CEE a.s., investiční fond Czech Republic 56.88 56.88
Nadace GCP Czech Republic 100.00 100.00
Acredité s.r.o. Czech Republic 100.00 100.00
CP Strategic Investments N.V. Netherlands 100.00 100.00
Pařížská 26, s.r.o. Czech Republic 100.00 100.00
PALAC KRIZIK a.s. Czech Republic 50.00 50.00
Europ Assistance s.r.o. Czech Republic 25.00 25.00
Generali Česká Distribuce a.s. 1 Czech Republic 100.00 100.00
Pojišťovna Patricie a.s. 2 Czech Republic 100.00 100.00
SMALL GREF a.s. Czech Republic 21.21 21.21
The following table provides details about the Company’s subsidiaries and associates as of 31 December 2019:
Name Country Ownership interest (%) Share of v oting
rights (%)
Direct Care s.r.o. Czech Republic 100.00 100.00
Česká pojišťovna ZDRAVÍ a.s. Czech Republic 100.00 100.00
Generali Real Estate Fund CEE a.s., investiční fond Czech Republic 56.88 56.88
Nadace GCP Czech Republic 100.00 100.00
Acredité s.r.o. Czech Republic 100.00 100.00
CP Strategic Investments N.V. Netherlands 100.00 100.00
Pařížská 26, s.r.o. Czech Republic 100.00 100.00
PALAC KRIZIK a.s. Czech Republic 50.00 50.00
Europ Assistance s.r.o. Czech Republic 25.00 25.00
ČP Distribuce a.s. Czech Republic 100.00 100.00
Generali Distribuce a.s. Czech Republic 100.00 100.00
Pojišťovna Patricie a.s. Czech Republic 100.00 100.00
SMALL GREF a.s. Czech Republic 21.21 21.21
The following changes in the subsidiaries and associates have taken place.
1. Generali Česká Distribuce a.s. In accordance with the Generali Group strategy, which aims at concentrating the activities of the two distribution companies, ČP Distribuce a.s. and Generali Distribuce a.s. merged as of 1 January 2020. Following the merger, Generali Distribuce ceased to exist and ČP Distribuce,
the successor, was renamed to Generali Česká distribuce a.s.
2. Impairment of Pojišťovna Patricie a.s. The Board of Directors of the Company approved the additional impairment of the subsidiary Pojištovna Patricie a.s. in the amount of CZK 4.857 bil l ion. The impairment corresponds to the dividend payment from the subsidiary Pojišťovna Patricie a.s.
15
Generali Česká pojišťovna a.s. ● Solvency and Financial Condition Report 2020
3. Impairment of Direct Care s.r.o.
The Board of Directors of the Company approved the impairment of Direct Care s.r.o. The impairment corresponds to the reduction of equity
of the subsidiary.
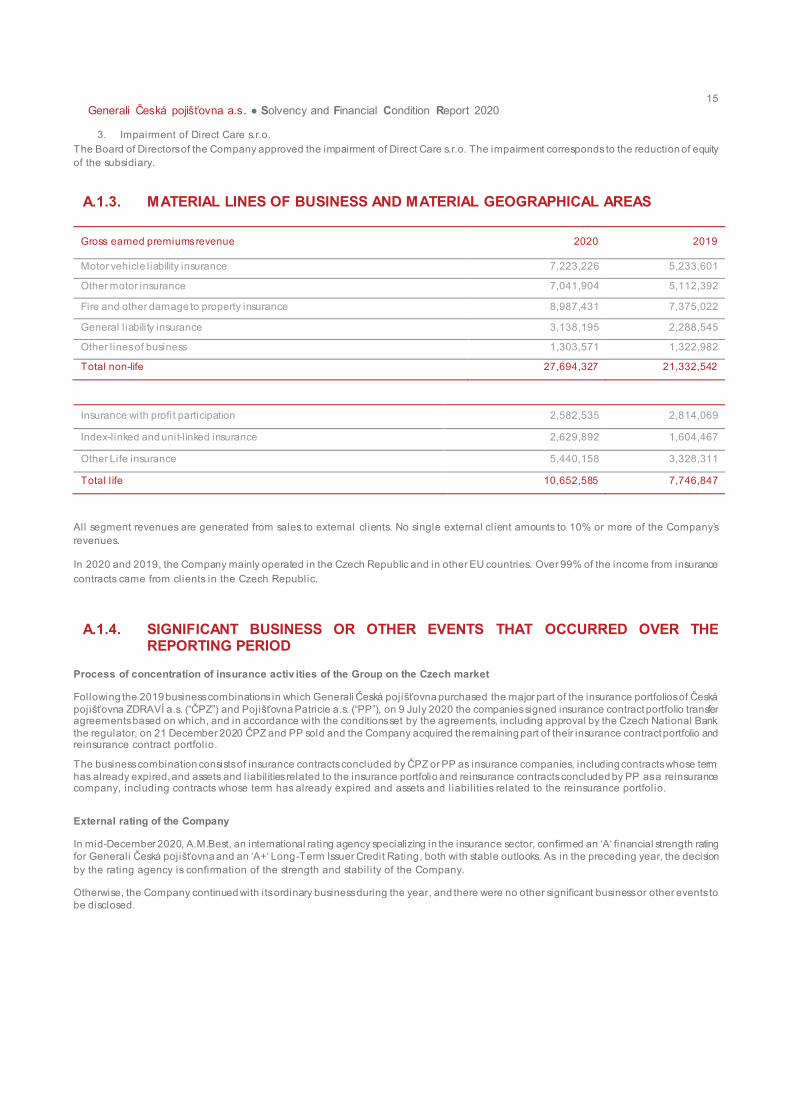
A.1.3. MATERIAL LINES OF BUSINESS AND MATERIAL GEOGRAPHICAL AREAS
Gross earned premiums revenue 2020 2019
Motor vehicle liability insurance 7,223,226 5,233,601
Other motor insurance 7,041,904 5,112,392
Fire and other damage to property insurance 8,987,431 7,375,022
General l iability insurance 3,138,195 2,288,545
Other l ines of business 1,303,571 1,322,982
Total non-life 27,694,327 21,332,542
Insurance with profit participation 2,582,535 2,814,069
Index-linked and unit-l inked insurance 2,629,892 1,604,467
Other Life insurance 5,440,158 3,328,311
Total l ife 10,652,585 7,746,847
All segment revenues are generated from sales to external clients. No single external client amounts to 10% or more of the Company’s revenues.
In 2020 and 2019, the Company mainly operated in the Czech Republic and in other EU countries. Over 99% of the income from insurance
contracts came from clients in the Czech Republic.
A.1.4. SIGNIFICANT BUSINESS OR OTHER EVENTS THAT OCCURRED OVER THE REPORTING PERIOD
Process of concentration of insurance activ ities of the Group on the Czech market
Following the 2019 business combinations in which Generali Česká pojišťovna purchased the major part of the insurance portfolios of Česká pojišťovna ZDRAVÍ a.s. (“ČPZ”) and Pojišťovna Patricie a.s. (“PP”), on 9 July 2020 the companies signed insurance contract portfolio transfer agreements based on which, and in accordance with the conditions set by the agreements, including approval by the Czech National Bank,
the regulator, on 21 December 2020 ČPZ and PP sold and the Company acquired the remaining part of their insurance contract portfolio and reinsurance contract portfolio.
The business combination consists of insurance contracts concluded by ČPZ or PP as insurance companies, including contracts whose term has already expired, and assets and liabil ities related to the insurance portfolio and reinsurance contracts concluded by PP as a reinsurance company, including contracts whose term has already expired and assets and liabil ities related to the reinsurance portfolio.
External rating of the Company
In mid-December 2020, A.M.Best, an international rating agency specializing in the insurance sector, confirmed an ‘A‘ financial strength rating for Generali Česká pojišťovna and an ‘A+‘ Long -Term Issuer Credit Rating, both with stable outlooks. As in the preceding year, the decision
by the rating agency is confirmation of the strength and stability of the Company.
Otherwise, the Company continued with its ordinary business during the year, and there were no other significant business or other events to
be disclosed.
16
Generali Česká pojišťovna a.s. ● Solvency and Financial Condition Report 2020
A.2. UNDERWRITING PERFORMANCE
A.2.1. NON-LIFE
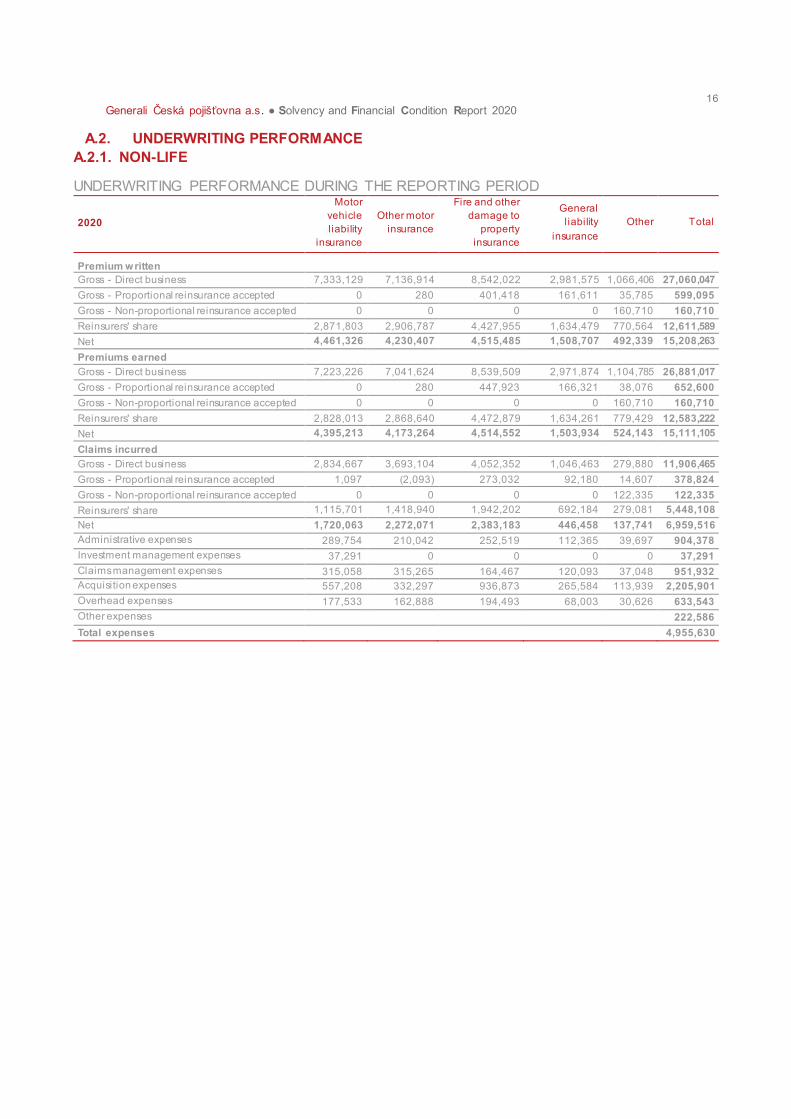
UNDERWRITING PERFORMANCE DURING THE REPORTING PERIOD
2020
Motor
vehicle
l iability
insurance
Other motor
insurance
Fire and other
damage to
property
insurance
General
l iability
insurance
Other Total
Premium written
Gross - Direct business 7,333,129 7,136,914 8,542,022 2,981,575 1,066,406 27,060,047
Gross - Proportional reinsurance accepted 0 280 401,418 161,611 35,785 599,095
Gross - Non-proportional reinsurance accepted 0 0 0 0 160,710 160,710
Reinsurers' share 2,871,803 2,906,787 4,427,955 1,634,479 770,564 12,611,589
Net 4,461,326 4,230,407 4,515,485 1,508,707 492,339 15,208,263
Premiums earned
Gross - Direct business 7,223,226 7,041,624 8,539,509 2,971,874 1,104,785 26,881,017
Gross - Proportional reinsurance accepted 0 280 447,923 166,321 38,076 652,600
Gross - Non-proportional reinsurance accepted 0 0 0 0 160,710 160,710
Reinsurers' share 2,828,013 2,868,640 4,472,879 1,634,261 779,429 12,583,222
Net 4,395,213 4,173,264 4,514,552 1,503,934 524,143 15,111,105
Claims incurred
Gross - Direct business 2,834,667 3,693,104 4,052,352 1,046,463 279,880 11,906,465
Gross - Proportional reinsurance accepted 1,097 (2,093) 273,032 92,180 14,607 378,824
Gross - Non-proportional reinsurance accepted 0 0 0 0 122,335 122,335
Reinsurers' share 1,115,701 1,418,940 1,942,202 692,184 279,081 5,448,108
Net 1,720,063 2,272,071 2,383,183 446,458 137,741 6,959,516
Administrative expenses 289,754 210,042 252,519 112,365 39,697 904,378
Investment management expenses 37,291 0 0 0 0 37,291
Claims management expenses 315,058 315,265 164,467 120,093 37,048 951,932
Acquisition expenses 557,208 332,297 936,873 265,584 113,939 2,205,901
Overhead expenses 177,533 162,888 194,493 68,003 30,626 633,543
Other expenses 222,586
Total expenses 4,955,630
17
Generali Česká pojišťovna a.s. ● Solvency and Financial Condition Report 2020
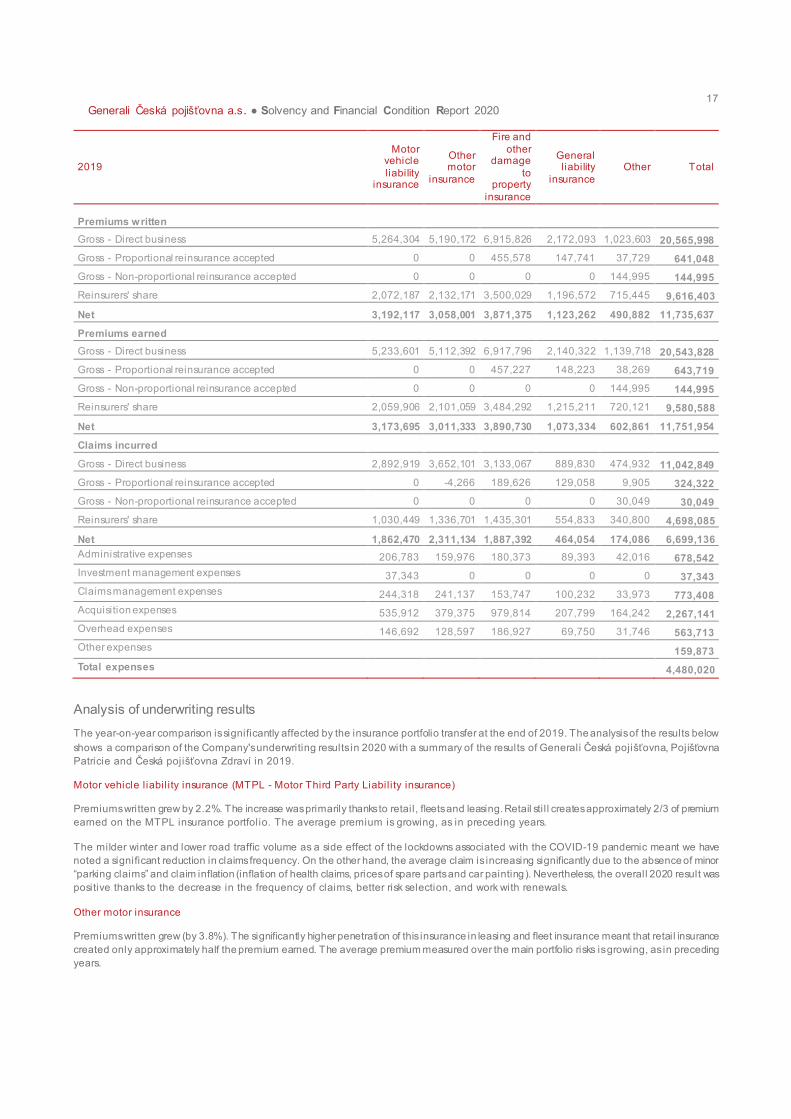
2019
Motor vehicle
liability insurance
Other motor
insurance
Fire and
other damage
to property
insurance
General l iability
insurance
Other Total
Premiums written
Gross - Direct business 5,264,304 5,190,172 6,915,826 2,172,093 1,023,603 20,565,998
Gross - Proportional reinsurance accepted 0 0 455,578 147,741 37,729 641,048
Gross - Non-proportional reinsurance accepted 0 0 0 0 144,995 144,995
Reinsurers' share 2,072,187 2,132,171 3,500,029 1,196,572 715,445 9,616,403
Net 3,192,117 3,058,001 3,871,375 1,123,262 490,882 11,735,637
Premiums earned
Gross - Direct business 5,233,601 5,112,392 6,917,796 2,140,322 1,139,718 20,543,828
Gross - Proportional reinsurance accepted 0 0 457,227 148,223 38,269 643,719
Gross - Non-proportional reinsurance accepted 0 0 0 0 144,995 144,995
Reinsurers' share 2,059,906 2,101,059 3,484,292 1,215,211 720,121 9,580,588
Net 3,173,695 3,011,333 3,890,730 1,073,334 602,861 11,751,954
Claims incurred
Gross - Direct business 2,892,919 3,652,101 3,133,067 889,830 474,932 11,042,849
Gross - Proportional reinsurance accepted 0 -4,266 189,626 129,058 9,905 324,322
Gross - Non-proportional reinsurance accepted 0 0 0 0 30,049 30,049
Reinsurers' share 1,030,449 1,336,701 1,435,301 554,833 340,800 4,698,085
Net 1,862,470 2,311,134 1,887,392 464,054 174,086 6,699,136
Administrative expenses 206,783 159,976 180,373 89,393 42,016 678,542
Investment management expenses 37,343 0 0 0 0 37,343
Claims management expenses 244,318 241,137 153,747 100,232 33,973 773,408
Acquisition expenses 535,912 379,375 979,814 207,799 164,242 2,267,141
Overhead expenses 146,692 128,597 186,927 69,750 31,746 563,713
Other expenses 159,873
Total expenses 4,480,020
Analysis of underwriting results
The year-on-year comparison is significantly affected by the insurance portfolio transfer at the end of 2019. The analysis of the results below
shows a comparison of the Company's underwriting results in 2020 with a summary of the results of Generali Česká pojišťovna, Pojišťovna
Patricie and Česká pojišťovna Zdraví in 2019.
Motor vehicle liabil ity insurance (MTPL - Motor Third Party Liability insurance)
Premiums written grew by 2.2%. The increase was primarily thanks to retail, fleets and leasing. Retail sti l l creates approximately 2/3 of premium
earned on the MTPL insurance portfolio. The average premium is growing, as in preceding years.
The milder winter and lower road traffic volume as a side effect of the lockdowns associated with the COVID-19 pandemic meant we have
noted a significant reduction in claims frequency. On the other hand, the average claim is increasing significantly due to the absence of minor
“parking claims” and claim inflation (inflation of health claims, prices of spare parts and car painting). Nevertheless, the overall 2020 result was
positive thanks to the decrease in the frequency of claims, better risk selection, and work with renewals.
Other motor insurance
Premiums written grew (by 3.8%). The significantly higher penetration of this insurance in leasing and fleet insurance meant that retail insurance
created only approximately half the premium earned. The average premium measured over the main portfolio risks is growing, as in preceding
years.
18
Generali Česká pojišťovna a.s. ● Solvency and Financial Condition Report 2020
Similarly as with the MTPL, the milder winter and lower road traffic volume as a side effect of the lockdowns associated with the COVID-19
pandemic meant we have noted a significant reduction in claims frequency. The average claim remains stable compared to the prior year. The
overall 2020 result was very positive thanks to the decrease in the frequency of claims, better risk selection, and work with renewals.
Fire and other damage to property insurance
Premiums written grew moderately in property insurance, mainly thanks to the area of technical risks, which has reported positive results,
especially in relation to the “Construction” business initiative.
In SME property insurance, the main determinants for the increase in premiums written are new clients and increased insurance coverage for
existing clients (newly acquired asset, new extended coverage insurance, increased company turnover). For the SME segment, the
development of the new “Profiplan” product was the main topic of 2020. A significant relative decrease was recorded in the sale of travel
insurance.
The claims ratio in the GCC segment is at a comparable level as in the preceding year. In the future, the Company will focus on improving it
(e.g. adjustment of participation, etc.). 2020 was primarily affected by medium-sized insurance events and fires, while on the other hand there
were no significant catastrophic events.
The 2020 technical result was affected by smaller calamities totalling CZK 365 million (mainly civil property and SMEs), a significant decrease
compared to the CZK 550 mill ion in 2019.
In 2020, the entire insurance area was affected by the COVID-19 pandemic. The greatest impact was reflected in the insurance of business
interruptions for clients who had agreed to the so-called "úřední zásah” (official intervention). However, the total amount of COVID claims was
not significant, totall ing around CZK 200 mill ion.
General l iabil ity insurance
Liability insurance premiums written were stable, posting a very slight increase. We focus on work with high-risk clients in employee insurance.
2020 ended with a good claims ratio, and there were improvements in both general l iabil ity and professional l iabil ity.
Others
In 2020, financial risks insurance was the most problematic area – specifically bankruptcy insurance for travel agencies. These related to the
effects of the COVID-19 epidemic. The total claims paid in this area in 2020 were in the mill ions of Czech crowns, however a provision of tens
of mill ions of crowns has been created for this area.
Expenses
There was no significant change in expenses. They remained relatively stable in 2020 and were affected by increasing personnel expenses
on the one hand and savings thanks to the impact of COVID-19 on the other.
19
Generali Česká pojišťovna a.s. ● Solvency and Financial Condition Report 2020
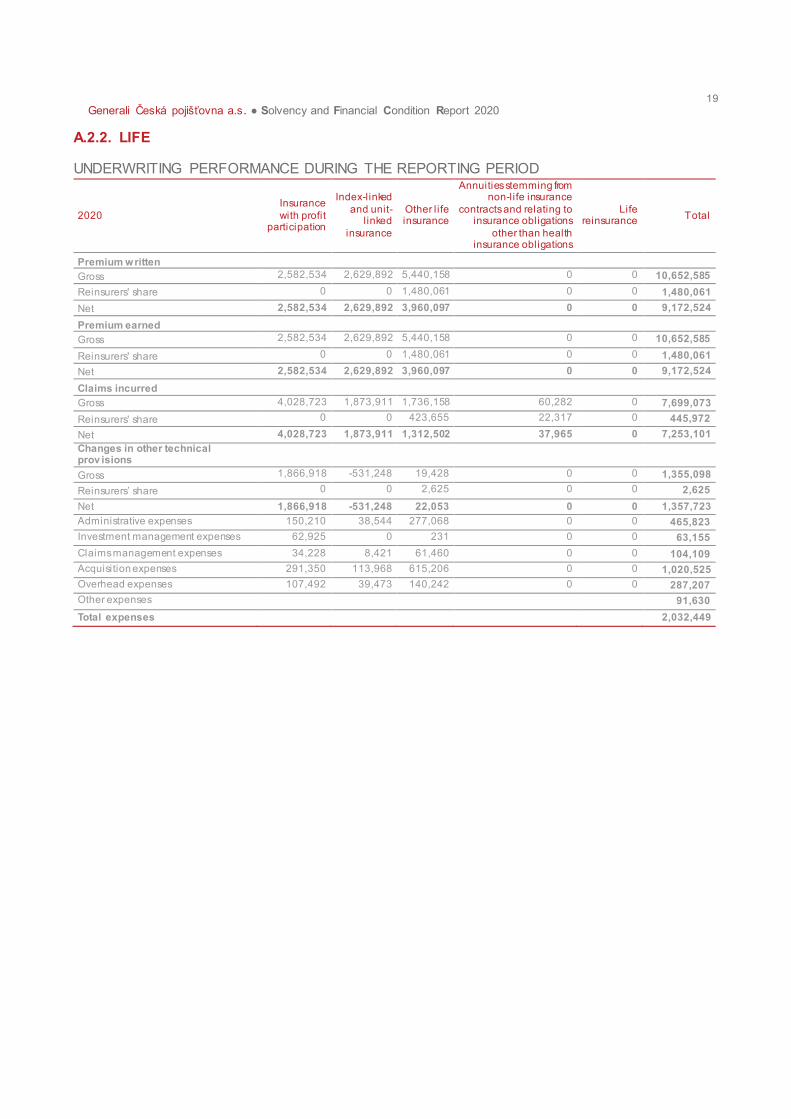
A.2.2. LIFE
UNDERWRITING PERFORMANCE DURING THE REPORTING PERIOD
2020
Insurance
with profit participation
Index-linked
and unit-l inked
insurance
Other l ife insurance
Annuities stemming from non-life insurance
contracts and relating to insurance obligations
other than health insurance obligations
Life reinsurance
Total
Premium written
Gross 2,582,534 2,629,892 5,440,158 0 0 10,652,585
Reinsurers' share 0 0 1,480,061 0 0 1,480,061
Net 2,582,534 2,629,892 3,960,097 0 0 9,172,524
Premium earned
Gross 2,582,534 2,629,892 5,440,158 0 0 10,652,585
Reinsurers' share 0 0 1,480,061 0 0 1,480,061
Net 2,582,534 2,629,892 3,960,097 0 0 9,172,524
Claims incurred
Gross 4,028,723 1,873,911 1,736,158 60,282 0 7,699,073
Reinsurers' share 0 0 423,655 22,317 0 445,972
Net 4,028,723 1,873,911 1,312,502 37,965 0 7,253,101
Changes in other technical prov isions
Gross 1,866,918 -531,248 19,428 0 0 1,355,098
Reinsurers’ share 0 0 2,625 0 0 2,625
Net 1,866,918 -531,248 22,053 0 0 1,357,723
Administrative expenses 150,210 38,544 277,068 0 0 465,823
Investment management expenses 62,925 0 231 0 0 63,155
Claims management expenses 34,228 8,421 61,460 0 0 104,109
Acquisition expenses 291,350 113,968 615,206 0 0 1,020,525
Overhead expenses 107,492 39,473 140,242 0 0 287,207
Other expenses 91,630
Total expenses 2,032,449
20
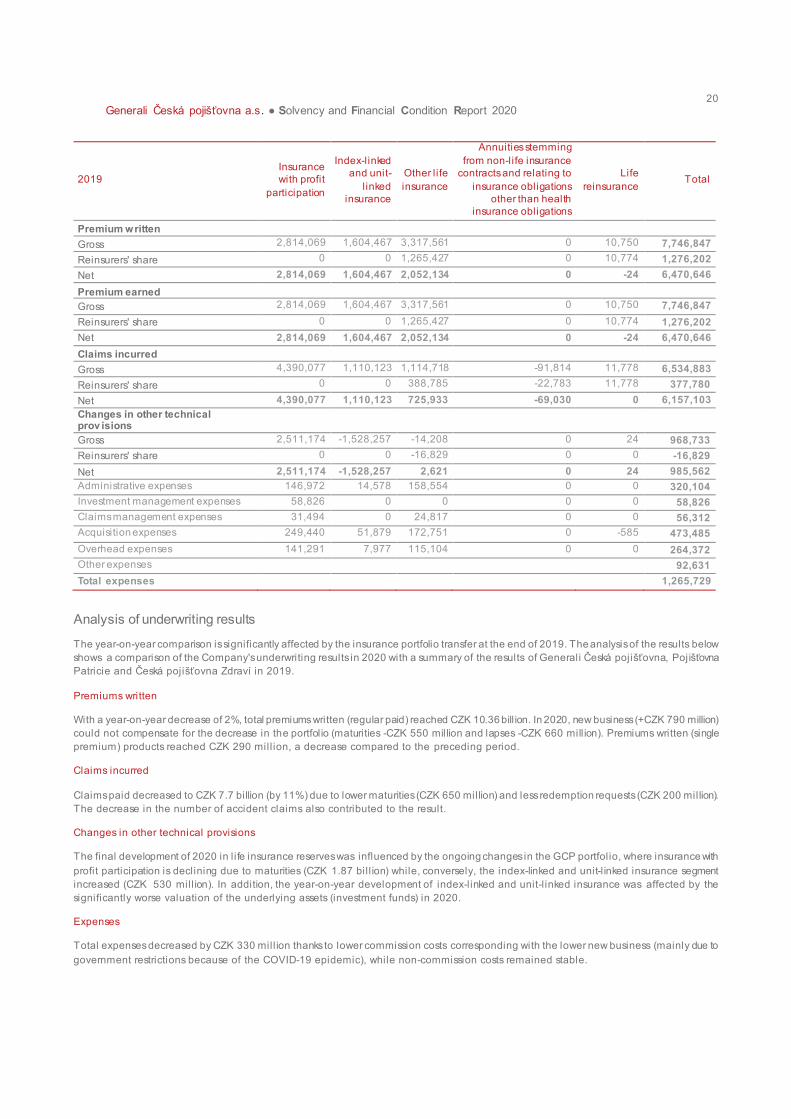
Generali Česká pojišťovna a.s. ● Solvency and Financial Condition Report 2020
2019
Insurance
with profit
participation
Index-linked
and unit-
l inked
insurance
Other l ife
insurance
Annuities stemming
from non-life insurance
contracts and relating to
insurance obligations
other than health
insurance obligations
Life
reinsurance Total
Premium written
Gross 2,814,069 1,604,467 3,317,561 0 10,750 7,746,847
Reinsurers' share 0 0 1,265,427 0 10,774 1,276,202
Net 2,814,069 1,604,467 2,052,134 0 -24 6,470,646
Premium earned
Gross 2,814,069 1,604,467 3,317,561 0 10,750 7,746,847
Reinsurers' share 0 0 1,265,427 0 10,774 1,276,202
Net 2,814,069 1,604,467 2,052,134 0 -24 6,470,646
Claims incurred
Gross 4,390,077 1,110,123 1,114,718 -91,814 11,778 6,534,883
Reinsurers' share 0 0 388,785 -22,783 11,778 377,780
Net 4,390,077 1,110,123 725,933 -69,030 0 6,157,103
Changes in other technical prov isions
Gross 2,511,174 -1,528,257 -14,208 0 24 968,733
Reinsurers' share 0 0 -16,829 0 0 -16,829
Net 2,511,174 -1,528,257 2,621 0 24 985,562
Administrative expenses 146,972 14,578 158,554 0 0 320,104
Investment management expenses 58,826 0 0 0 0 58,826
Claims management expenses 31,494 0 24,817 0 0 56,312
Acquisition expenses 249,440 51,879 172,751 0 -585 473,485
Overhead expenses 141,291 7,977 115,104 0 0 264,372
Other expenses 92,631
Total expenses 1,265,729
Analysis of underwriting results
The year-on-year comparison is significantly affected by the insurance portfolio transfer at the end of 2019. The analysis of the results below
shows a comparison of the Company's underwriting results in 2020 with a summary of the results of Generali Česká pojišťovna, Pojišťovna Patricie and Česká pojišťovna Zdraví in 2019.
Premiums written
With a year-on-year decrease of 2%, total premiums written (regular paid) reached CZK 10.36 bill ion. In 2020, new business (+CZK 790 million)
could not compensate for the decrease in the portfolio (maturities -CZK 550 million and lapses -CZK 660 mill ion). Premiums written (single
premium) products reached CZK 290 mill ion, a decrease compared to the preceding period.
Claims incurred
Claims paid decreased to CZK 7.7 billion (by 11%) due to lower maturities (CZK 650 million) and less redemption requests (CZK 200 million).
The decrease in the number of accident claims also contributed to the result.
Changes in other technical provisions
The final development of 2020 in l ife insurance reserves was influenced by the ongoing changes in the GCP portfolio, where insurance with
profit participation is declining due to maturities (CZK 1.87 bil l ion) while, conversely, the index-linked and unit-l inked insurance segment
increased (CZK 530 mill ion). In addition, the year-on-year development of index-linked and unit-l inked insurance was affected by the
significantly worse valuation of the underlying assets (investment funds) in 2020.
Expenses
Total expenses decreased by CZK 330 mill ion thanks to lower commission costs corresponding with the lower new business (mainly due to
government restrictions because of the COVID-19 epidemic), while non-commission costs remained stable.

21
Generali Česká pojišťovna a.s. ● Solvency and Financial Condition Report 2020
A.3. INVESTMENT PERFORMANCE
Financial investments stand alongside insurance and reinsurance as another important area of operation for the Company, as they contribute
significantly to the Company’s overall assets and are financed primarily from insurance provisions and equity .
The Company’s investment strategy complies with the ‘Prudent Person Principle’ requirements. The objective of the strategy is to establish
appropriate return potential while ensuring the Company can always meet its obligations without undue cost and in accordance with its internal
and external regulatory capital requirements.
There are no investments in securitization.
The Company’s investment portfolio performance in FY 2020 was as follows:
Subsidiaries and associates
2020 2019
Dividends and other income 5,762,460 880,074
Realised gains from disposal - 319,362
Total 5,762,460 1,199,436
Financial instruments at fair value through profit or loss
2020 2019
Financial assets
Interests and other income 176,304 29,859
(a) bonds 543 13
(b) derivatives 116,941 27,412
(c) unit-l inked investments 58,820 2,434
Realised – gains 206,062 148,718
(a) derivatives 5,100 37,669
(b) unit-l inked investments 200,962 111,049
– losses (344,877) (52,165)
(a) bonds - -
(b) derivatives - (17,097)
(c) unit-l inked investments (344,877) (35,068)
Unrealised – gains 809,587 1,025,577
(a) bonds 289 31
(b) derivatives 157,068 55,462
(c) unit-l inked investments 652,230 970,084
– losses (526,530) (119,228)
(a) bonds (5) (5)
(b) derivatives (108,009) (110,595)
(c) unit-l inked investments (418,516) (8,628)
Financial l iabilities
Interest expenses (232,050) (143,319)
Realised – gains 16,623 22,072
– losses (104,602) (151,302)
Unrealised – gains 66,201 153,497
– losses (334,983) (194,908)
Other income 68,046 118,689
Total (200,219) 837,490
The year-on-year decrease in the FVTPL segment was mainly caused by the worse realised and unrealised result of the assets related to unit-
l inked investments due to substantial financial market volatil ity.

22
Generali Česká pojišťovna a.s. ● Solvency and Financial Condition Report 2020
Other financial instruments
Incomes
2020 2019
Interest income 1,226,196 1,572,201
Interest income from loans and receivables 154,990 408,903
Interest income from available-for-sale financial assets 1,064,932 1,147,998
(a) bonds 1,064,932 1,147,998
Interest income from cash and cash equivalents 6,274 15,281
Other interest income - 19
Other income 89,331 134,974
Income from land and buildings (investment properties) - -
Income from equities available-for-sale 36,001 73,577
Other income from investment fund units 53,330 61,397
Interests and other inv estment income 1,315,527 1,707,175
Realised gains 567,839 290,604
Realised gains on land and buildings (investment properties) 2,428 30
Realised gains on loans and receivables 260 2,225
Realised gains on available-for-sale financial assets 565,151 288,349
(a) bonds 407,620 106,371
(b) equities 70,569 83,518
(c) investment fund units 86,961 98,460
Unrealised gains 493,081 255,992
Unrealised gains on hedged instruments 493,081 255,992
Reversal of impairment - 13,631
Reversal of impairment of loans and receivables - 384
Reversal of impairment on other receivables from reinsurers - 12,590
Reversal of impairment of other receivables - 657
Other income from financial instruments and other inv estments 1,060,920 560,227
Total 2,376,447 2,267,402
Interest income from bonds contributes significantly to the Company’s total investment income. The year-on-year decrease was caused by the
decrease in short term interest rates driven by the easing of central banks’ monetary policy.
The year-on-year increase in total income was caused by higher realised gains related to available-for-sale financial assets and higher
unrealised gains on hedged instruments.
23
Generali Česká pojišťovna a.s. ● Solvency and Financial Condition Report 2020
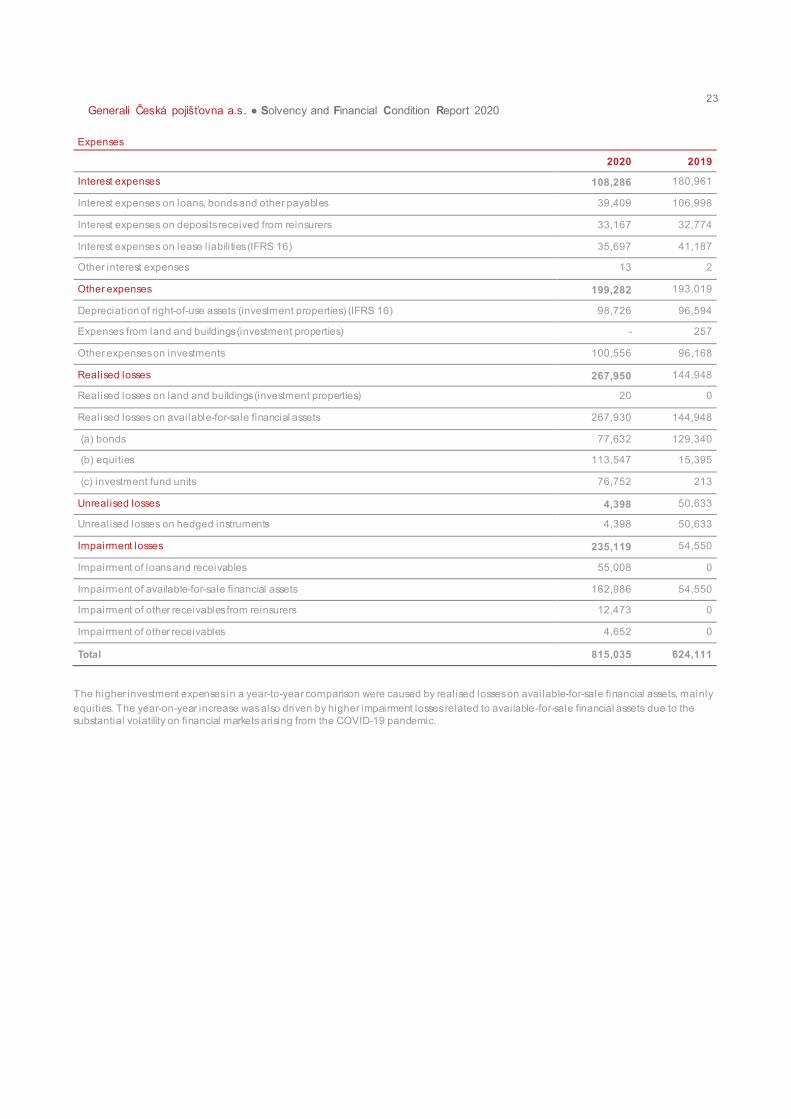
Expenses
2020 2019
Interest expenses 108,286 180,961
Interest expenses on loans, bonds and other payables 39,409 106,998
Interest expenses on deposits received from reinsurers 33,167 32,774
Interest expenses on lease liabilities (IFRS 16) 35,697 41,187
Other interest expenses 13 2
Other expenses 199,282 193,019
Depreciation of right-of-use assets (investment properties) (IFRS 16) 98,726 96,594
Expenses from land and buildings (investment properties) - 257
Other expenses on investments 100,556 96,168
Realised losses 267,950 144,948
Realised losses on land and buildings (investment properties) 20 0
Realised losses on available-for-sale financial assets 267,930 144,948
(a) bonds 77,632 129,340
(b) equities 113,547 15,395
(c) investment fund units 76,752 213
Unrealised losses 4,398 50,633
Unrealised losses on hedged instruments 4,398 50,633
Impairment losses 235,119 54,550
Impairment of loans and receivables 55,008 0
Impairment of available-for-sale financial assets 162,986 54,550
Impairment of other receivables from reinsurers 12,473 0
Impairment of other receivables 4,652 0
Total 815,035 624,111
The higher investment expenses in a year-to-year comparison were caused by realised losses on available-for-sale financial assets, mainly
equities. The year-on-year increase was also driven by higher impairment losses related to available-for-sale financial assets due to the
substantial volatility on financial markets arising from the COVID-19 pandemic.
24
Generali Česká pojišťovna a.s. ● Solvency and Financial Condition Report 2020
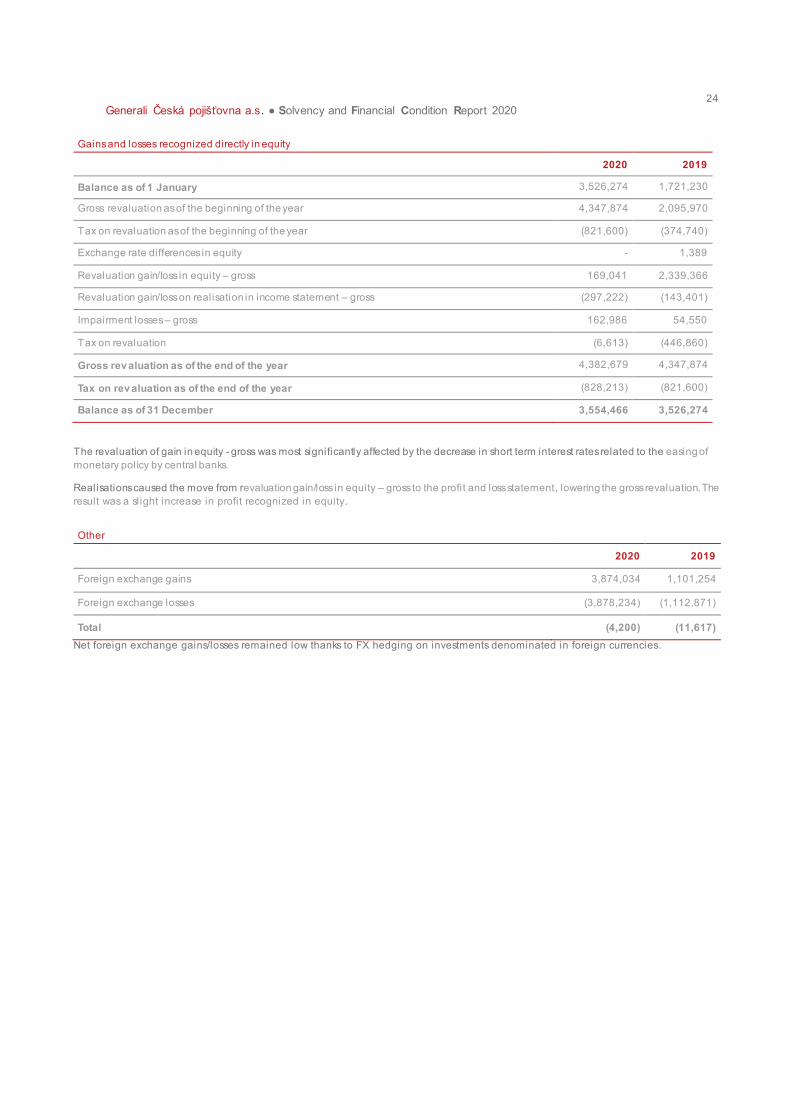
Gains and losses recognized directly in equity
2020 2019
Balance as of 1 January 3,526,274 1,721,230
Gross revaluation as of the beginning of the year 4,347,874 2,095,970
Tax on revaluation as of the beginning of the year (821,600) (374,740)
Exchange rate differences in equity - 1,389
Revaluation gain/loss in equity – gross 169,041 2,339,366
Revaluation gain/loss on realisation in income statement – gross (297,222) (143,401)
Impairment losses – gross 162,986 54,550
Tax on revaluation (6,613) (446,860)
Gross rev aluation as of the end of the year 4,382,679 4,347,874
Tax on rev aluation as of the end of the year (828,213) (821,600)
Balance as of 31 December 3,554,466 3,526,274
The revaluation of gain in equity - gross was most significantly affected by the decrease in short term interest rates related to the easing of
monetary policy by central banks.
Realisations caused the move from revaluation gain/loss in equity – gross to the profit and loss statement, lowering the gross revaluation. The
result was a slight increase in profit recognized in equity.
Other
2020 2019
Foreign exchange gains 3,874,034 1,101,254
Foreign exchange losses (3,878,234) (1,112,871)
Total (4,200) (11,617)
Net foreign exchange gains/losses remained low thanks to FX hedging on investments denominated in foreign currencies.
25
Generali Česká pojišťovna a.s. ● Solvency and Financial Condition Report 2020
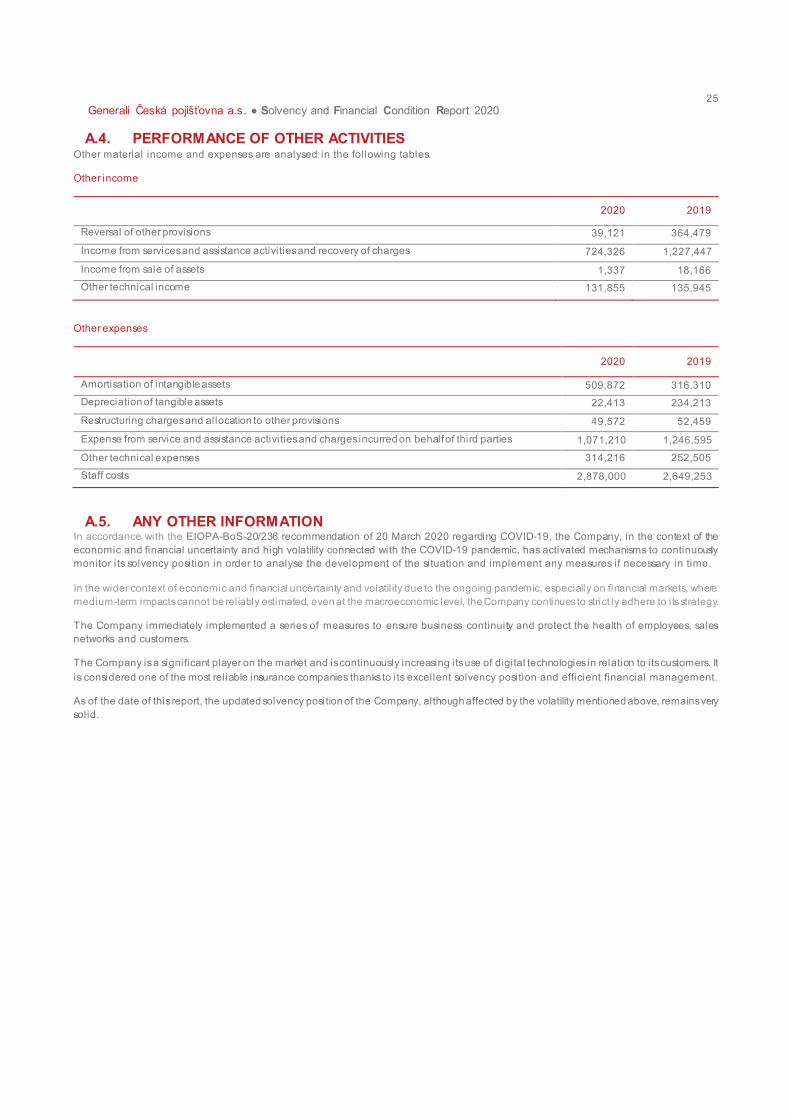
A.4. PERFORMANCE OF OTHER ACTIVITIES Other material income and expenses are analysed in the following tables.
Other income
2020 2019
Reversal of other provisions 39,121 364,479
Income from services and assistance activities and recovery of charges 724,326 1,227,447
Income from sale of assets 1,337 18,166
Other technical income 131,855 135,945
Other expenses
2020 2019
Amortisation of intangible assets 509,872 316,310
Depreciation of tangible assets 22,413 234,213
Restructuring charges and allocation to other provisions 49,572 52,459
Expense from service and assistance activities and charges incurred on behalf of third parties 1,071,210 1,246,595
Other technical expenses 314,216 252,505
Staff costs 2,878,000 2,649,253
A.5. ANY OTHER INFORMATION In accordance with the EIOPA-BoS-20/236 recommendation of 20 March 2020 regarding COVID-19, the Company, in the context of the
economic and financial uncertainty and high volatility connected with the COVID-19 pandemic, has activated mechanisms to continuously
monitor its solvency position in order to analyse the development of the situation and implement any measures if necessary in time.
In the wider context of economic and financial uncertainty and volatil ity due to the ongoing pandemic, especially on financial markets, where
medium-term impacts cannot be reliably estimated, even at the macroeconomic level, the Company continues to strict ly adhere to its strategy.
The Company immediately implemented a series of measures to ensure business continuity and protect the health of employees, sales
networks and customers.
The Company is a significant player on the market and is continuously increasing its use of digital technologies in relation to its customers. It
is considered one of the most reliable insurance companies thanks to its excellent solvency position and efficient financial management.
As of the date of this report, the updated solvency position of the Company, although affected by the volatility mentioned above, remains very
solid.
26
Generali Česká pojišťovna a.s. ● Solvency and Financial Condition Report 2020
B. System of governance B.1. GENERAL INFORMATION ON THE SYSTEM OF GOVERNANCE
The system of governance of the Company is adequate to the nature, scale and complexity of the risks inherent in its business. Details
on the system of governance are provided in the following chapters.
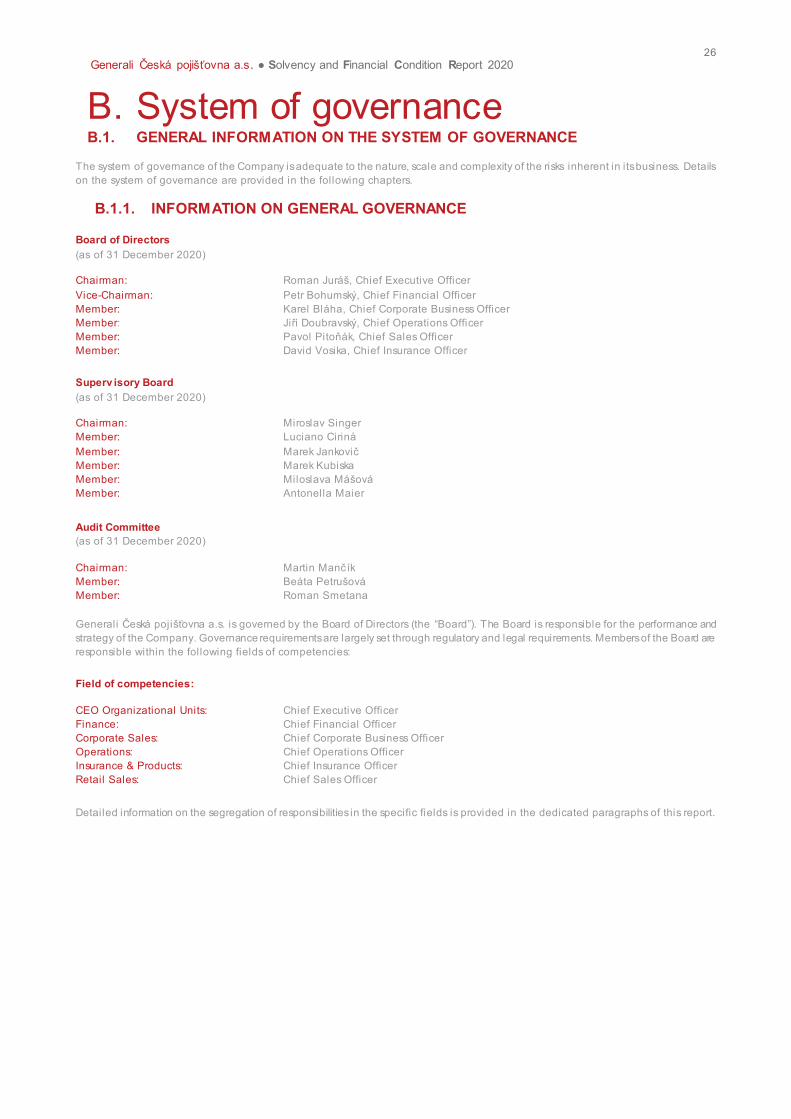
B.1.1. INFORMATION ON GENERAL GOVERNANCE
Board of Directors
(as of 31 December 2020)
Chairman: Roman Juráš, Chief Executive Officer
Vice-Chairman: Petr Bohumský, Chief Financial Officer Member: Karel Bláha, Chief Corporate Business Officer Member: Jiří Doubravský, Chief Operations Officer Member: Pavol Pitoňák, Chief Sales Officer
Member: David Vosika, Chief Insurance Officer
Superv isory Board
(as of 31 December 2020)
Chairman: Miroslav Singer
Member: Luciano Cirinà
Member: Marek Jankovič
Member: Marek Kubiska
Member: Miloslava Mášová
Member: Antonella Maier
Audit Committee
(as of 31 December 2020)
Chairman: Martin Mančík
Member: Beáta Petrušová
Member: Roman Smetana
Generali Česká pojišťovna a.s. is governed by the Board of Directors (the “Board”). The Board is responsible for the performance and
strategy of the Company. Governance requirements are largely set through regulatory and legal requirements. Members of the Board are
responsible within the following fields of competencies:
Field of competencies:
CEO Organizational Units: Chief Executive Officer
Finance: Chief Financial Officer
Corporate Sales: Chief Corporate Business Officer
Operations: Chief Operations Officer
Insurance & Products: Chief Insurance Officer
Retail Sales: Chief Sales Officer
Detailed information on the segregation of responsibilities in the specific fields is provided in the dedicated paragraphs of this report.
27
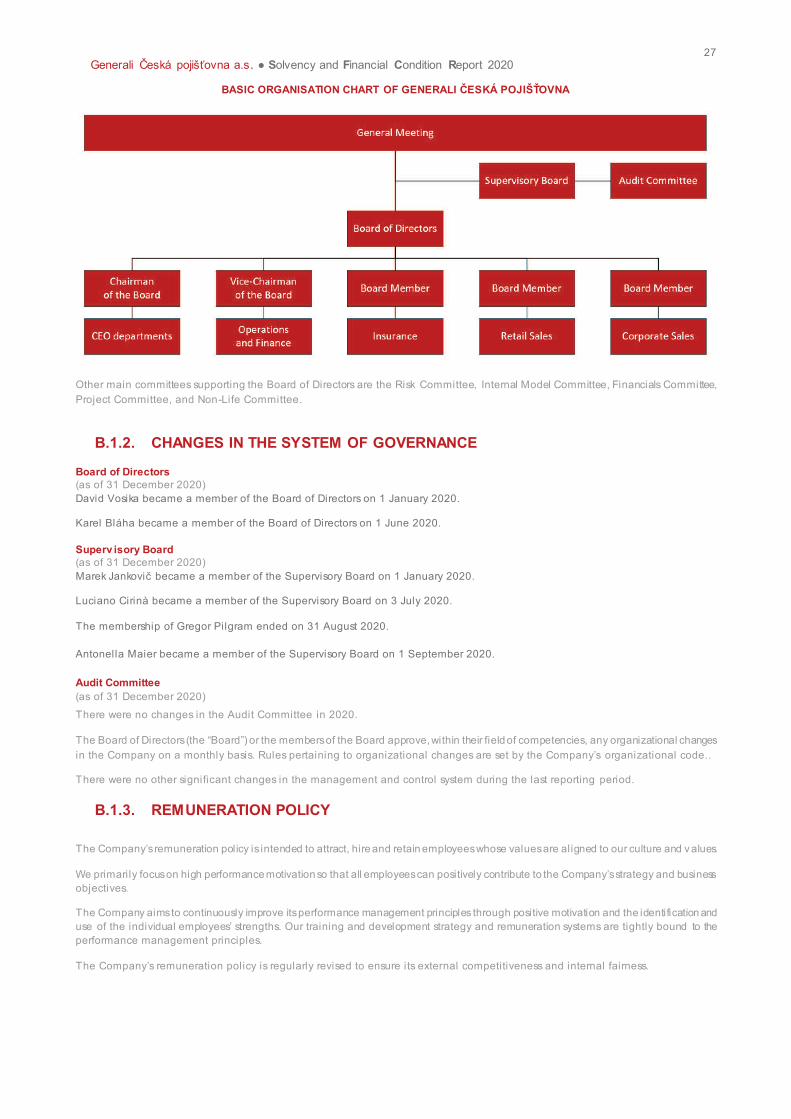
Generali Česká pojišťovna a.s. ● Solvency and Financial Condition Report 2020
BASIC ORGANISATION CHART OF GENERALI ČESKÁ POJIŠŤOVNA
Other main committees supporting the Board of Directors are the Risk Committee, Internal Model Committee, Financials Committee,
Project Committee, and Non-Life Committee.
B.1.2. CHANGES IN THE SYSTEM OF GOVERNANCE
Board of Directors
(as of 31 December 2020)
David Vosika became a member of the Board of Directors on 1 January 2020.
Karel Bláha became a member of the Board of Directors on 1 June 2020.
Superv isory Board
(as of 31 December 2020)
Marek Jankovič became a member of the Supervisory Board on 1 January 2020.
Luciano Cirinà became a member of the Supervisory Board on 3 July 2020.
The membership of Gregor Pilgram ended on 31 August 2020.
Antonella Maier became a member of the Supervisory Board on 1 September 2020.
Audit Committee
(as of 31 December 2020)
There were no changes in the Audit Committee in 2020.
The Board of Directors (the “Board”) or the members of the Board approve, within their field of competencies, any organizational changes
in the Company on a monthly basis. Rules pertaining to organizational changes are set by the Company’s organizational code..
There were no other significant changes in the management and control system during the last reporting period.
B.1.3. REMUNERATION POLICY
The Company’s remuneration policy is intended to attract, hire and retain employees whose values are aligned to our culture and v alues.
We primarily focus on high performance motivation so that all employees can positively contribute to the Company’s strategy and business objectives.
The Company aims to continuously improve its performance management principles through positive motivation and the identification and
use of the individual employees’ strengths. Our training and development strategy and remuneration systems are tightly bound to the
performance management principles.
The Company’s remuneration policy is regularly revised to ensure its external competitiveness and internal fairness.
28
Generali Česká pojišťovna a.s. ● Solvency and Financial Condition Report 2020
Compensation structure
Fixed remuneration
Fixed remuneration is the compensation paid to an employee for performing a specific job.
The foundation of the Company’s remuneration policy is the division of all specific tasks into a structure of related jobs according to their
contribution, difficulty and responsibility, and their allocation into an internal band structure. All jobs are regularly benchmarked against
market data. Each salary band has a minimum level that is defined by the Collective Agreement. The position within a salary band range
takes into account the long-term performance, experience and potential of our employees.
Variable remuneration
Variable remuneration is compensation contingent on performance, discretion and the results achieved. Variable remuneration seeks to
motivate employees to achieve business targets by creating a direct l ink between incentives and quantitative and qualitative goals set at
Company, team and individual level.
Short-term variable incentives (STI)
Short-term variable incentives consist of the yearly bonuses paid to management at all levels and to senior professionals. The total
budget for the payment of bonuses for this group is related to the Company results and amended based on the fulfilment of Company
criteria. Short-term variable incentives depend on the organizational level and the impact of the individual’s role on the business.
For the remaining employees, incentives are paid in an accounting period (month or quarter) or upon an event (achieving an objective,
completing a project etc.)
For the sales force, the Company has commissions in place that are paid in addition to the fixed salary.
Long-term incentive programs (LTI)
The long-term incentive programs for the executive management and key employees are in place to deliver improvements in
performance and align their performance with the long-term strategic goals of the Company.
Members of the Board of Directors (the people who effectively run the Company) are governed by agreements on the performance of
their function. On the basis of their agreement they receive fixed and variable remuneration, meaning a combination of STI and LTI, which
is annually set in the individual agreement. The variable part is based on KPIs set in the balanced scorecard. The balanced scorecard
consists of a balanced proportion of quantitative (e.g. gross written premium) and qualitative criteria. Risk metrics (RORC) are an integral
part of the KPIs. The minimum solvency ratio target is the entry condition for the payout of all variable parts of remuneration. A signif icant
part of variable remuneration is deferred. The payout of the deferred part of remuneration is based on the permanency of the achieved
results and actual solvency ratio.
Members of the Supervisory Board and Audit Committee can only receive fixed remuneration based on their agreement on the
performance of their function.
Key persons with a significant impact on the risk profile and decisions of the Company receive fixed and variable remuneratio n. The
variable part consists of the STI only. The STI is l inked to both qualitative and quantitative KPIs. The KPIs structure consists of a
combination of company and individual criteria evaluated after the end of the current year and then again after 3 years. The variable
remuneration is deferred for a period of 3 years. Risk metrics (RORC) are an integral part of the KPIs. The minimum solvency ratio target
is the entry condition for the payout of all variable parts of remuneration.
Supplementary pensions
The Company has a defined contribution plan in place based on employees’ length of service. Supplementary pension schemes have not
been introduced.
There have been no material changes to this area since the last reporting period.
B.1.4. TRANSACTIONS WITH SHAREHOLDERS, WITH PERSONS WHO EXERCISE A SIGNIFICANT INFLUENCE ON THE UNDERTAKING, AND WITH MEMBERS OF THE ADMINISTRATIVE, MANAGEMENT OR SUPERVISORY BODY
In 2019 the Company granted a loan to CZI Holdings N.V. with maturity in November 2020. The total loan amount with interest (CZK
1.134 bil l ion) was repaid to the Company on 9 November 2020.
29
Generali Česká pojišťovna a.s. ● Solvency and Financial Condition Report 2020
B.1.5. INFORMATION ON RISK MANAGEMENT, INTERNAL AUDIT, COMPLIANCE AND ACTUARIAL FUNCTIONS
The Company has established key control functions as independent departments without any responsibility for operational areas. The
functions are organized as follows:
§ Risk management, compliance and internal audit functions: these report hierarchically to the Chief Executive Officer and
functionally to the Board.
§ In 2020 the actuarial function reported hierarchically to the Chief Executive Officer and functionally to the Board. The hierarchy was changed from the Chief Financial Officer to the Chief Executive Officer in November 2019.
To ensure proper coordination and direction from the Generali Head Office/Generali CEE holding, all control functions also report to the
respective Group/Regional functions.
More details on organization, responsibil ities and resources can be found in the dedicated sections of this report.
B.1.6. INFORMATION ON AUTHORITIES, RESOURCES, PROFESSIONAL QUALIFICATIONS, KNOWLEDGE, EXPERIENCE AND OPERATIONAL INDEPENDENCE OF THE FUNCTIONS AND HOW THEY REPORT TO AND ADVISE THE ADMINISTRATIVE, MANAGEMENT OR SUPERVISORY BODY OF THE INSURANCE OR REINSURANCE UNDERTAKING
Details for the individual control functions can be found in the dedicated sections of this report.
B.2. FIT AND PROPER REQUIREMENTS
B.2.1. DESCRIPTION OF SKILLS, KNOWLEDGE AND EXPERTISE REQUIRED FOR PERSONS WHO EFFECTIVELY RUN THE UNDERTAKING OR HAVE OTHER KEY FUNCTIONS
Professional adequacy of members of the Board of Directors and Superv isory Board:
The Board of Directors and the Supervisory Board of the Company and their members shall collectively possess appropriate experience
and knowledge in the fields indicated below:
§ Market knowledge: this means an awareness and understanding of the wider relevant business, economic and market
environment in which the Company operates, and an awareness of customers’ level of knowledge and needs.
§ Business strategy and business model knowledge: this refers to a thorough understanding of the Company’s business strategy
and model.
§ Knowledge of the system of governance: this means awareness and understanding of the risks that the Company is facing and
i ts ability to manage them. Furthermore, this includes the ability to assess the effectiveness of the Company’s arrangements to
deliver effective governance, oversight and controls in the business and, if necessary, oversee changes in these areas.
§ Actuarial and financial analysis capability: this means the ability to interpret the Company’s actuarial and financial information, identify and assess key issues, and take any necessary measures (including appropriate controls) based on this information.
§ Regulatory framework and requirements: this means an awareness and understanding of the regulatory framework in which the
Company operates, in terms of both the regulatory requirements and expectations, and the capacity to adapt to changes in the
regulatory framework without delay.
Other highly responsible persons:
Other highly responsible persons (also called relevant persons) who are assessed in relation to the jobs they perform according to internal
standards. The Company primarily takes into account their job experience declared in their professional CV, t heir education and current
performance (if this person is already working for the Company).
No formalised minimum qualification requirements have been defined for the persons being assessed. Long-term experience has shown
that formalised criteria are not useful, and so competence – the professional prerequisites of the person being assessed – is always
assessed as a whole and in relation to the particular responsibilities for assigned areas. The assessment is periodically repeated so that
variability of requirements (according to operational needs) for competent /assessed persons can be taken into account.
30
Generali Česká pojišťovna a.s. ● Solvency and Financial Condition Report 2020
Personal credibility:
Both the above-mentioned groups of persons are also assessed from the perspective of their personal credibil ity. The assessment of
whether any person is credible (trustworthy) or not includes an assessment of their honesty based on relevant evidence regarding their
character and personal behaviour.
The prerequisites for credibility pursuant to internal guidelines include:
§ the full legal capacity of the persons being assessed, in accordance with legislation;
§ the credibil ity of the persons being assessed; a person will not be considered a credible (trustworthy) person if such person has
been convicted of a crime committed intentionally, if this crime was committed in connection with business activity or with the
employer’s subject of business, unless this person is considered a non -convicted person (the person shall demonstrate all these
circumstances through an extract from the criminal records); furthermore, a person will not be considered a credible (trustworthy)
person if such person has been convicted of any crime against property, of an economic offense (crime) or of any other crime
committed intentionally, unless such conviction has been expunged from the criminal records or unless such person is considered,
for any other reason, a non-convicted person; an offense under this provision also means any crime according to legislation
governing banking, financial or insurance activities, or related to securities markets or payment instruments, including legal
regulations governing money laundering, market manipulation or usury, as well as insider trading, or crimes of dishonesty suc h as
fraud or financial offenses, as well as any other serious criminal offense under legislation relating to companies, bankruptcy, and
insolvency or consumer protection;
§ whether the person being assessed has committed any serious administrative or disciplinary infringement (delict) in the sphere of
finance, company governance, banking, bankruptcy, and insolvency or consume r protection;
§ whether a legal decision concerning insolvency has been taken in respect of the property of the assessed person;
§ whether the person being assessed was, in the preceding five years, a member of a statutory body or any other body of a legal
entity declared bankrupt, or an insolvency petition for such legal entity was rejected since the assets of that legal entity failed to
cover the costs of the insolvency proceedings, or bankruptcy was cancelled because the assets of such legal entity were
completely inadequate;
§ whether the person being assessed held any comparable office (function) in a legal entity declared bankrupt in the preceding 3
years;
§ whether there has been a judicial decision that would exclude the member of the statutory body of a business corporation from
holding an office (performing a function);
§ whether there is justified suspicion of an existing conflict of interest related to the office held by the person being assessed;
§ whether all the information related to the assessed person was provided through a personal questionnaire requested by the
employer, and whether any false information (provided by the assessed person) was revealed as part of the pre-employment
screening pursuant to the internal guidelines of the employer.
B.2.2. PROCESS FOR ASSESSING THE FITNESS AND THE PROPRIETY OF THE PERSONS
The assessment of the professional fitness/qualification and personal credibility of persons with high responsibil ity in the Company
(including members of the Boards) is essentially based on two internal standards:
§ The Group Fit and Proper Policy implemented worldwide by Generali Group.
§ This policy is complemented by the Company’s interpretational standard policy respecting and implementing particular local
conditions.
Assessment of the relevant persons is first performed before they are appointed to their positions and thereafter periodically. The Company
standard includes seven assessment categories and four assessment systems:
§ Members of the Board of Directors: The Board of Directors as a group assesses the professional fitness/qualification and personal
credibil ity of its members.
§ Members of the Supervisory Board: The Supervisory Board as a group assesses the professional fitness/qualification and the
personal credibil ity of its members.
§ The professional fitness/qualification and the personal credibility of the members of the Audit Committee are assessed by the
Board of Directors.
§ Key employees that manage control functions are assessed by the Board of Directors and the respective Group control functions
in regard to their professional fitness/qualification and personal credibil ity.
§ The professional fitness/qualification and personal credibility of employees with a significant impact on the risk profile of the
Company as defined by Company standards is assessed by the Board of Directors.
§ Other highly responsible persons defined through internal standards (within the scope of the assessed group) are assessed by
the Board of Directors as regards their professional fitness/qualification and personal credibil ity.
There have been no material changes to this area since the last reporting period.
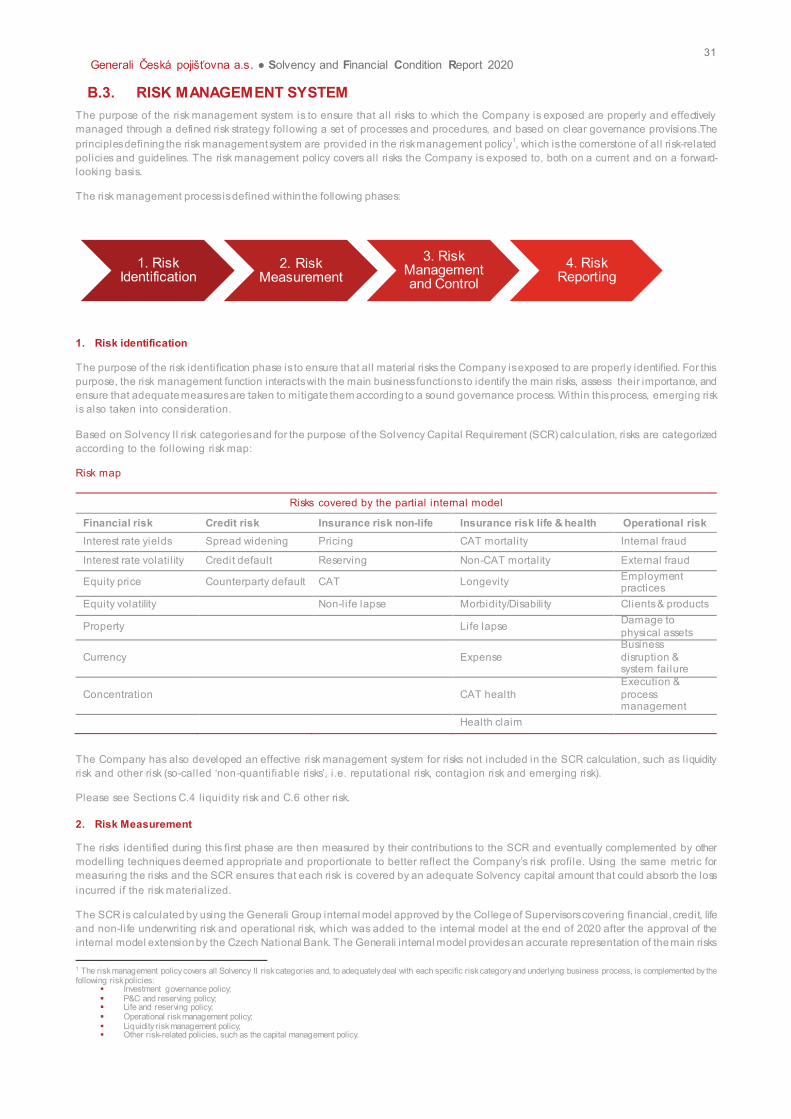
31
Generali Česká pojišťovna a.s. ● Solvency and Financial Condition Report 2020
B.3. RISK MANAGEMENT SYSTEM
The purpose of the risk management system is to ensure that all risks to which the Company is exposed are properly and effectively
managed through a defined risk strategy following a set of processes and procedures, and based on clear governance provisions.The
principles defining the risk management system are provided in the risk management policy1, which is the cornerstone of all risk-related
policies and guidelines. The risk management policy covers all risks the Company is exposed to, both on a current and on a forward-
looking basis.
The risk management process is defined within the following phases:
1. Risk identification
The purpose of the risk identification phase is to ensure that all material risks the Company is exposed to are properly identified. For this
purpose, the risk management function interacts with the main business functions to identify the main risks, assess their importance, and
ensure that adequate measures are taken to mitigate them according to a sound governance process. Within this process, emerging risk
is also taken into consideration.
Based on Solvency II risk categories and for the purpose of the Solvency Capital Requirement (SCR) calculation, risks are categorized
according to the following risk map:
Risk map
Risks covered by the partial internal model
Financial risk Credit risk Insurance risk non-life Insurance risk life & health Operational risk
Interest rate yields Spread widening Pricing CAT mortality Internal fraud
Interest rate volatil ity Credit default Reserving Non-CAT mortality External fraud
Equity price Counterparty default CAT Longevity Employment practices
Equity volatility Non-life lapse Morbidity/Disability Clients & products
Property Life lapse Damage to
physical assets
Currency Expense
Business
disruption & system failure
Concentration CAT health
Execution &
process management
Health claim
The Company has also developed an effective risk management system for risks not included in the SCR calculation, such as l iquidity
risk and other risk (so-called ‘non-quantifiable risks’, i.e. reputational risk, contagion risk and emerging risk).
Please see Sections C.4 liquidity risk and C.6 other risk.
2. Risk Measurement
The risks identified during this first phase are then measured by their contributions to the SCR and eventually complemented by other
modelling techniques deemed appropriate and proportionate to better reflect the Company’s risk profile. Using the same metric for
measuring the risks and the SCR ensures that each risk is covered by an adequate Solvency capital amount that could absorb the loss
incurred if the risk materialized.
The SCR is calculated by using the Generali Group internal model approved by the College of Supervisors covering financial, credit, life
and non-life underwriting risk and operational risk, which was added to the internal model at the end of 2020 after the approval of the
internal model extension by the Czech National Bank. The Generali internal model provides an accurate representation of the main risks
1 The risk management policy covers all Solvency II risk categories and, to adequately deal with each specific risk category and underlying business process, is complemented by the following risk policies:
§ Investment governance policy; § P&C and reserving policy; § Life and reserving policy; § Operational risk management policy; § Liquidity risk management policy; § Other risk-related policies, such as the capital management policy.
1. Risk Identification
2. Risk Measurement
3. Risk Management and Control
4. Risk Reporting
32
Generali Česká pojišťovna a.s. ● Solvency and Financial Condition Report 2020
to which the Company is exposed, measuring not only the impact of each risk taken individually but also their combined impact on the
own funds of the Company.
More details on the partial internal model governance framework are provided in Section B.3.2., while the main differences between the
internal model assumptions and the standard formula are described in Section E.4.
Risks not included in the SCR calculation, such as liquidity risk and other risk, are evaluated based on quantitative and qualitative risk
assessment techniques and models.
3. Risk management and control
As part of Generali Group, the Company operates under a sound risk management system in line with the processes and the strategy set
by Generali Group. To ensure the risks are managed according to the risk strategy, the Company follows the governance defined in the
Group risk appetite framework (RAF) and further specified in the local risk appetite framework. RAF governance provides a framework for
risk management, embedding control mechanisms as well as escalation and reporting processes in day-to-day and extraordinary business
operations.
The purpose of the RAF is to set the desired level of risk (in terms of risk appetite and risk preferences) and limit excessive risk-taking.
Tolerance levels based on capital and liquidity metrics are set accordingly. Should an indicator approach or breach the defined tolerance
levels, escalation mechanisms are activated.
4. Risk reporting
Risk monitoring and reporting is a key risk management process that helps keep business functions, top management, the Board and
also the Supervisory Authority aware and informed of the risk profile development, risk trends and breaches of risk tolerance s.
The own risk and solvency assessment (ORSA) is the main risk reporting process and is coordinated by the risk management function.
Its purpose is to provide an assessment of risks and overall solvency needs on a current and forward -looking basis. The ORSA process
ensures ongoing assessment of the solvency position in l ine with the strategic plan and capital management plan, followed by regular
communication of the ORSA results to the Supervisory Authority after approval by the Board. More details are provided in Section B.3.3.
Risk management function
The risk management function ensures that the risk management process as described in Section B.3. complies with Solvency II and the
principles set in the risk policies, and supports the Board and top management in ensuring the effectiveness of the risk management
system.
The risk management function coordinates the ORSA process and reports the most significant risks it identifies to the Board. The risk
management function is responsible for:
§ assisting the Board of Directors and Supervisory Board and other functions in the effective operation of the risk management
system;
§ monitoring the risk management system and the implementation of the risk management policy;
§ monitoring the general risk profile of the Company and coordinating risk reporting, including reporting any tolerance breaches;
§ advising the Board of Directors and Supervisory Board, and supporting the main business decision -making processes, including
those related to strategic affairs such as corporate strategy, mergers and acquisitions, and major projects and investments.
The risk management function is an independent function within the organizational structure and is not responsible for any operational
area. The Head of Risk Management Function (Chief Risk Officer - CRO) reports hierarchically to the Chief Executive Officer (CEO) and
functionally to the Board. To ensure proper coordination and direction from Head Office, they also report to the Group Chief Risk Officer
(GCRO). In accordance with local laws and regulations, the risk management function has full access to all information, systems and
documentation related to risk management activities. The function is also involved in all key committees of the Company.
The risk management function also chairs the Risk Committee, where the representatives of risk management, key risk owners and control
functions discuss current risk topics and the results of risk assessments, and advise the Board on risk-related matters.
The risk management function has financial and human resources, as well as access to external advisory services and specialized skil ls.
The head of the risk management function has the necessary qualifications, knowledge, experience and professional and personal skills
to carry out the function’s duties effectively. The head has solid relevant experience in the insurance (or financial) industry, in risk
management practices and risk-related regulations. They also have the capacity to relate to the commercial mindset of the business and
develop an overall understanding of the organization from the operational and strategic points of view. They also follow the applicable risk
policies that set out the relevant responsibil ities, goals, processes and reporting procedures to be applied.
All personnel carrying out risk management functions meet the above requirements and characteristics to a degree commensurate to the
complexity of the activities to be carried out. These requirements must be maintained at an appropriate and adequate level at all times.
Compliance with the above requirements is assessed at least on a yearly basis and also during the year in the event of change s in the
staffing of the risk management function.
33
Generali Česká pojišťovna a.s. ● Solvency and Financial Condition Report 2020
There have been the following material changes since the last reporting period:
· Extension of the internal model to operational risk;
The application of the internal model approach to the portfolios transferred to the Company from Generali pojišťovna and ČP Zdraví in December 2020.
B.3.1. INTERNAL MODEL FRAMEWORK: GOVERNANCE, DATA AND VALIDATION
INTERNAL MODEL GOVERNANCE
Processes and procedures
The governance of the internal model is aimed at guaranteeing full compliance of the internal model with a set of principles, while
respecting Articles 120 to 126 of the Solvency II Directive.
The Company, following the Group internal model governance policy, sets the model governance to ensure that models are transparent,
robust and consistent both internally and across Group companies, and that the models are of sufficient quality and reliabil i ty to meet the
needs of the people that use them.
The governance requirements apply to all phases of the model l ifecycle, i.e. both regular use and model change processes.
The main processes contained within each of the above phases include model definition and implementation, model run including
assumption setting and calibration, model validation and model review.
Organizational structure
The Board of Directors is responsible for implementing systems that ensure the Group internal model operates properly and continuously
at Company level. With the support of the Local Risk Committee, the Board of Directors reviews the relevant supporting inform ation
submitted by the Company’s CRO.
The Company CRO must ensure that all models function properly at Company level and, if necessary, escalates model -related issues to
the Board of Directors, supported by the Risk Committee. The Company CRO decides, on the basis of all the Internal Model Committee
proposals, on the appropriate model component methodologies, and signs off on the results of calculations of Company capital
requirements.
The Company Internal Model Committee is in charge of providing proposals on matters related to the internal model before submission
to the Company CRO.
Company model owners are assigned to each component of the model and are responsible for ensuring that the Group internal model
and its outputs meet local needs and conform to the Group internal model governance policy as well as to the group methodology
framework.
MATERIAL CHANGES TO INTERNAL MODEL GOVERNANCE
There were no material changes in internal model governance during the reporting calendar year – the governance framework was only
extended to operational risk.
INTERNAL MODEL DATA
The Company has implemented a data quality framework to ensure that the data used for the SCR calculation and the evaluation of
technical provisions are accurate, complete and appropriate. For this purpose, all data used are recognized, data flows are tracked to the
level of primary systems, and any risks of potential poor data quality are identified and evaluated. Adequate controls are implemented and
their results are monitored and documented.
INTERNAL MODEL VALIDATION
The SCR calculation is subject to annual independent validation, as required by Article 124 of the Solvency II Directive and based on the
principles defined in the group validation policy and the group validation guidelines.
Validation is aimed at gaining independent assurance of the completeness, robustness and reliabil ity of the processes and results which
comprise the internal model, as well as their compliance with the Solvency II regulatory requirements. In particular, the validation output
aims to support the top management and Board of Directors in understanding the internal model appropriateness and areas where the
internal model has weaknesses and limitations, especially with regard to its use in day-to-day decision-making processes.
The scope of validation covers both the quantitative and qualitative aspects of the model, including the data, methodology, assumptions
and expert judgments, governance and processes, calibration of risks, model outputs and results. The scope of validation considers the
materiality of the risk components and is subject to regular challenges from the Internal Model Committee.
Within the validation process, both quantitative tests (including analyses of profit & loss attribution, sensitivity analyses, stress and reverse
stress tests, SCR point estimates) and qualitative analyses (including reviews of documentation, walkthrough analyses and inte rviews)
are performed.
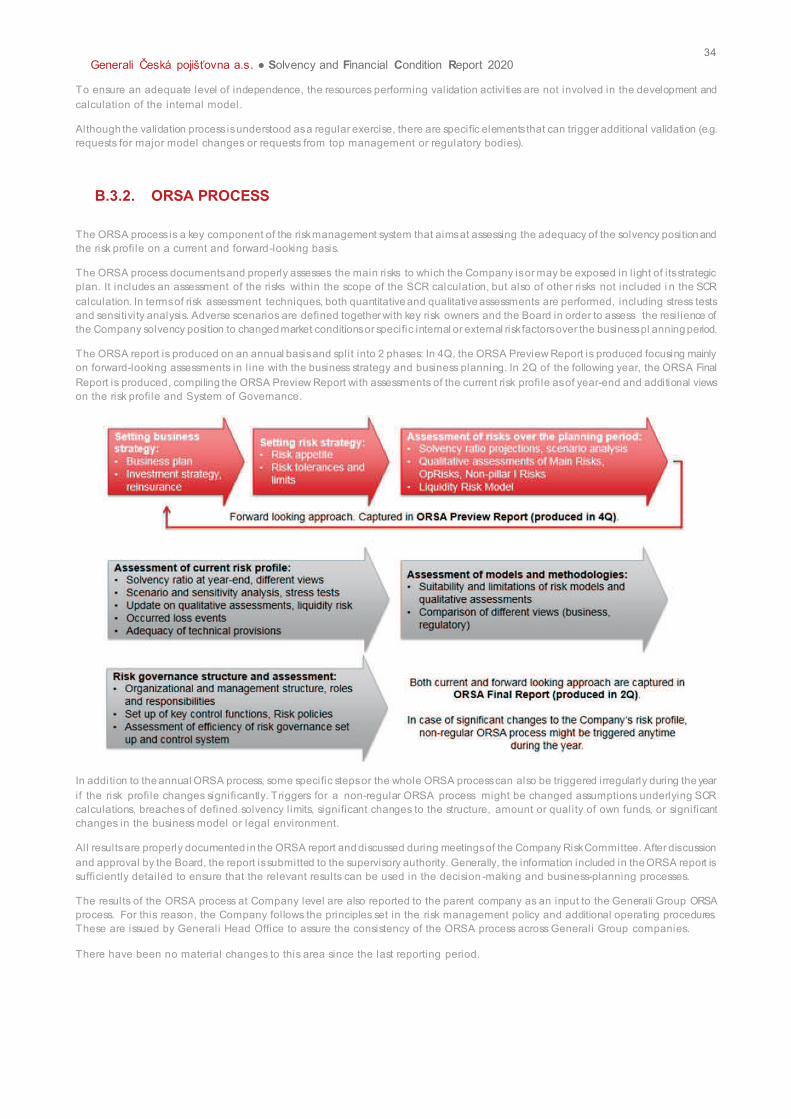
34
Generali Česká pojišťovna a.s. ● Solvency and Financial Condition Report 2020
To ensure an adequate level of independence, the resources performing validation activities are not involved in the development and
calculation of the internal model.
Although the validation process is understood as a regular exercise, there are specific elements that can trigger additional validation (e.g.
requests for major model changes or requests from top management or regulatory bodies).
B.3.2. ORSA PROCESS
The ORSA process is a key component of the risk management system that aims at assessing the adequacy of the solvency position and
the risk profile on a current and forward-looking basis.
The ORSA process documents and properly assesses the main risks to which the Company is or may be exposed in l ight of its strategic
plan. It includes an assessment of the risks within the scope of the SCR calculation, but also of other risks not included i n the SCR
calculation. In terms of risk assessment techniques, both quantitative and qualitative assessments are performed, including stress tests
and sensitivity analysis. Adverse scenarios are defined together with key risk owners and the Board in order to assess the resil ience of
the Company solvency position to changed market conditions or specific internal or external risk factors over the business pl anning period.
The ORSA report is produced on an annual basis and split into 2 phases: In 4Q, the ORSA Preview Report is produced focusing mainly
on forward-looking assessments in l ine with the business strategy and business planning. In 2Q of the following year, the ORSA Final
Report is produced, compiling the ORSA Preview Report with assessments of the current risk profile as of year-end and additional views
on the risk profile and System of Governance.
In addition to the annual ORSA process, some specific steps or the whole ORSA process can also be triggered irregularly during the year
if the risk profile changes significantly. Triggers for a non-regular ORSA process might be changed assumptions underlying SCR
calculations, breaches of defined solvency limits, significant changes to the structure, amount or quality of own funds, or significant
changes in the business model or legal environment.
All results are properly documented in the ORSA report and discussed during meetings of the Company Risk Committee. After discussion
and approval by the Board, the report is submitted to the supervisory authority. Generally, the information included in the ORSA report is
sufficiently detailed to ensure that the relevant results can be used in the decision -making and business-planning processes.
The results of the ORSA process at Company level are also reported to the parent company as an input to the Generali Group ORSA
process. For this reason, the Company follows the principles set in the risk management policy and additional operating procedures.
These are issued by Generali Head Office to assure the consistency of the ORSA process across Generali Group companies.
There have been no material changes to this area since the last reporting period.
35
Generali Česká pojišťovna a.s. ● Solvency and Financial Condition Report 2020
B.3.3. RISK EMBEDDING IN THE CAPITAL MANAGEMENT PROCESS
Capital management and risk management are strongly integrated processes. This integration is deemed essential to ensure proper
alignment between the business and risk strategies.
By means of the ORSA process, the projection of the capital position and the forward-looking risk profile assessment contribute to the
strategic planning and capital management processes.
The ORSA report also relies on the capital management plan for verification of the adequacy and quality of the eligible own funds to cover
the overall solvency needs based on the plan’s assumptions.
To ensure ongoing alignment of the risk and business strategies, risk management actively supports the strategic planning process.
There have been no material changes to this area since the last reporting period.
B.4. INTERNAL CONTROL SYSTEM
The Company has fully adopted the Group Directives on the internal control and risk management system. these directives included the
key elements of the internal control system and risk management framework, in particular their activities, roles and responsibil ities.
accordingly, the company has set up an organizational and operational structure aimed at supporting its strategic objectives, operations
and internal control and risk management systems.
the internal control environment includes personnel development in terms of integrity, ethical va lues and competence, the management
philosophy and operating style, the way roles and responsibil ities are assigned, how the organization is set up, and governance.
the internal control system ensures compliance with applicable laws, regulations and admini strative provisions and the effectiveness and
efficiency of the operations in l ight of objectives. It also ensures the availability and reliability of financial and non -financial information.
The internal control and risk management system is founded on the establishment of three lines of defence:
i. The operating functions (the risk owners) represent the first l ine of defence and have ultimate responsibil ity for risks relating to
their area of expertise;
ii. The actuarial, compliance and risk management functions represent the second line of defence;
iii. The internal audit function represents the third line of defence and, together with the actuarial, compliance and risk management
functions, represents the control functions.
Monitoring and reporting mechanisms within the internal control system and the control functions are established to provide top
management and the Board of Directors with relevant information essential for their decision -making processes.
There have been no material changes to this area since the last reporting period.
B.4.1. COMPLIANCE FUNCTION
INFORMATION ON THE COMPLIANCE FUNCTION: ORGANIZATIONAL STRUCTURE AND THE DECISION MAKING PROCESSES OF THE UNDERTAKING. STATUS AND RESOURCES OF THE COMPLIANCE FUNCTION WITHIN THE UNDERTAKING
The Company established the compliance function as an independent department and part of the internal control system and its second
line of defence. The Head of Compliance reports to the Board of Directors.
The Company has fully adopted the Group Compliance Policy approved by the Board of Directors of Assicurazioni Generali S.p.A, and
which is periodically reviewed. The Compliance department follows the policy, while its roles and responsibilities are specif ied by the
Internal Compliance Statute of Compliance.
The resources of the compliance department include financial and human resources, as well as access to external advisory services and
specialized skil ls, the organizational infrastructure, contemporary reference material on compliance management and legal obligations,
professional development, and technology.
The reporting process aims to ensure that appropriate information on the performance of the compliance function and the compliance
management system, its continuing adequacy and all relevant instances of non-compliance, is provided to top management and the Board
of Directors as well as to the Group compliance function.
The compliance department submits the Annual Plan of Activities together wi th the Annual Budget of the Compliance Function to the
Board of Directors for approval. The Annual Plan is drafted taking into account the results of the risk assessment activities. At least twice
a year, the compliance department reports to the Board of Directors on the state of realization of the Annual Plan of Activities. The
36
Generali Česká pojišťovna a.s. ● Solvency and Financial Condition Report 2020
compliance department also provides regular updates to the Board of Directors and top management. It informs the Board of Directors of
any material changes in the compliance risk profile of the Company without undue delay.
There have been no material changes to this area since the last reporting period.
INFORMATION ON AUTHORITIES, RESOURCES, PROFESSIONAL QUALIFICATIONS, KNOWLEDGE, EXPERIENCE AND OPERATIONAL INDEPENDENCE OF THE COMPLIANCE FUNCTION
The Company established the compliance function as an independent department and part of the internal control system and its second
line of defence. the head of the compliance department reports to the Board of Directors.
The Company fully adopted the Group compliance policy, approved by the Board of Directors of Assicurazioni Generali S.p.A, and which
is periodically reviewed. The Compliance department follows the policy, while its roles and responsibilities are specified by the Internal
Compliance Statute of Compliance.
The resources of the compliance department include financial and human resources, as well as access to external advisory services and
specialized skil ls, the organizational infrastructure, contemporary reference material on compliance management and legal obl igations,
professional development, and technology.
The reporting process aims to ensure that appropriate information on the performance of the compliance function and the compliance
management system, its continuing adequacy and all relevant instances of non-compliance, is provided to top management and the Board
of Directors as well as to the Group compliance function.
The Compliance department submits the Annual Plan of Activities together with the Annual Budget of the Compliance function to the Board
of Directors for approval. The Annual Plan is drafted taking into account the results of th e risk assessment activities. At least twice a year,
the compliance department reports to the Board of Directors on the state of realization of the Annual Plan of Activities. The compliance
department also provides regular updates to the Board of Directors and top management. It informs the Board of Directors of any material
changes in the compliance risk profile of the Company without undue delay.
There have been no material changes to this area since the last reporting period.
B.5. INTERNAL AUDIT FUNCTION
B.5.1. INFORMATION ON THE INTERNAL AUDIT FUNCTION: ORGANIZATIONAL STRUCTURE, THE DECISION MAKING PROCESSES, STATUS AND RESOURCES OF THE INTERNAL AUDIT FUNCTION
Reference documentation: 2020 Audit Group Policy (version 9) At Generali Česká pojišťovna the internal audit activities are performed by the internal audit function in l ine with the organizational rules
defined in the audit group policy approved by the Board of Directors of Assicurazioni Generali S.p.A. (the ultimate Generali Group parent
company) and in the audit policy approved by the Board of Directors of Generali Česká pojišťovna.
the internal audit function is an independent and objective function established by the Board of Directors to examine and evaluate the
adequacy, effectiveness and efficiency of the internal control system and of all the other elements of the system of governance, through
assurance and advisory activities for the benefit of the Supervisory Board and Board of Directors, the top management and other
stakeholders.
It supports the Supervisory Board and Board of Directors in identifying the strategies and guidelines on internal control and risk
management, ensuring that they are appropriate and valid over time, and provides the Supervisory Board and Board of Directors with
analyses, appraisals, recommendations and information concerning the activities reviewed.
In l ine with the audit group policy and based on a solid l ine reporting model, the head of the internal audit function reports to the Supervisory
Board, Board of Directors and Audit Committee and, ultimately, to the Head of Group Audit, through the Head of Business Unit Audit.
This ensures the autonomy to act and independence from operational management as well as more effective communication flows. It
covers the methodologies to be used, the organizational structure to be adopted (recruiting, appointment, dismissal, remunera tion, sizing
and budget in agreement with the Audit Committee), target setting and the year-end appraisal, the reporting methods, as well as the
proposed audit activities to be included in the internal audit plan to be submitted to the Audit Committee for approval.
The internal audit function is provided with appropriate human, technical and financial resources, and its staff possesses and obtains the
knowledge, skil ls and competencies needed to perform its role and mission, including the technical capabilities to perform audit activities
with the support of data analytics and the knowledge to perform audit activities on digital processes, including robotics and artificial
intell igence.
37
Generali Česká pojišťovna a.s. ● Solvency and Financial Condition Report 2020
The internal audit function has full, free, unrestricted and timely access to any of the organization’s records, physical assets, and personnel
pertinent to carry out any engagement, with strict accountability for confidentiality and safeguarding records and information. The head of
the internal audit function has free and unrestricted access to the Supervisory Board and Board of Directors.
The internal audit function acts in compliance with the guidelines issued by the Institute of Internal Auditors (i.e. the International
Professional Practices Framework – IPPF), including the Core Principles for the Professional Practice of Internal Auditing, the Definition
of Internal Auditing, the Code of Ethics, and the International Standards for the Professional Practice of Internal Auditing.
The head of the internal audit function does not assume any responsibil ity for any other operational function and should have an open,
constructive and cooperative relationship with regulators to support the sharing of information relevant to their respective responsibilities.
All internal audit function personnel comply with specific fit and proper requirements as requested by the fit & proper policy, and avoids,
to the maximum extent possible, activities that could create conflicts of interest or be perceived as such. The internal audi tors of the
internal audit function behave in an impeccable manner at all times, and information coming to their knowledge when carrying out their
tasks is always kept strictly confidential.
The activity of the internal audit function remains free from interference by any element in the organization, including matters of audit
selection, scope, procedures, frequency, timing, or report content, to ensure the necessary independent and objective mental attitude.
Internal Auditors do not have direct operational responsibility or authority over any of the activities audited. Accordingly, they are not
involved in the operational organization of the undertaking or in developing, introducing or implementing organizational or Internal Control
measures. However, the need for impartiality does not exclude the possibility to request an opinion from the internal audit function on
specific matters related to the Internal Control principles to be complied with.
The internal audit function is not a part of, or responsible for, the Risk Management, Compliance, Actuarial or Anti-Money Laundering
Functions. It cooperates with other key functions – including the Anti-Money Laundering Function – and external auditors to continuously
foster the efficiency and effectiveness of the Internal Control System.
At least annually, the Head of Internal Audit Function proposes an internal audit plan for Generali Česká pojišťovna to the Audit Committee for approval.
The internal audit plan is developed based on a prioritization of the audit universe using a risk-based methodology, and takes into account
all the activities, the system of governance, the expected development of activities and innovations, the organization’s strategies, the key business objectives, and inputs from the top management, the Supervisory Board and the Board of Directors. Furthermore, the internal
audit plan takes into account any deficiencies found during the audits already performed , and any new risk detected.
The internal audit plan submitted by the Head of Internal Audit Function for approval by the Audit Committee includes at least the audit
engagements, the criteria for their selection, their timing, the budget and human resources requirements, and any other relevant
information. The Head of Internal Audit Function communicates to the Audit Committee and Board of Directors the impact of any resource
limitations and significant changes that occurred during the year. The Audit Committee discusses and approves the internal audit plan
along with the budget and human resources required to deliver it.
The internal audit plan is reviewed and adjusted on a regular basis during the year by the Head of Internal Audit Function in response to
changes in the organization’s business, risks, operations, programs, systems, controls and audit findings. Any significant dev iation from
the approved internal audit plan is communicated through the periodic reporting process to the Audit Committee and subm itted to it for
approval. If necessary, the internal audit function may carry out audits that are not included in the approved internal audit plan. Such
additions and their results are reported to the Audit Committee and/or Board of Directors at the earliest possible opportunity.
All audit activities are carried out following a consistent Group methodology (detailed in the Group Audit Manual), including the use of the
Group audit IT tool.. The scope of auditing encompasses, but is not l imited to, the examination and evaluation of the adequacy and
effectiveness of the organization’s governance, risk management, and internal control processes in relation to the organization’s defined goals and objectives.
Following the conclusion of each engagement, a written audit report is prepared and issued to the auditee and the auditee’s hierarchy. This report indicates the significance of the issues found and covers any issues regarding the effectiveness, efficiency and suitability of
the internal control system, as well as major shortcomings regarding compliance with internal policies, procedures, processes and the
Company’s objectives. It includes a proposal for remedial actions taken or to be taken concerning the issues identified, and the proposed
deadlines for their implementation.
While the responsibility for addressing issues raised remains with business management, the internal audit function is responsible for
implementing appropriate follow-up activities on issues raised, including checking the effectiveness of the corresponding remedial actions.
Based on its activity and in accordance with Group methodology, the internal audit function is responsible for reporting significant risk
exposures and identified control issues to the Supervisory Board, the Board of Directors and the Audit Committee, including fraud risks,
governance issues and other matters needed or requested by the Supervisory Board , the Board of Directors and the Audit Committee.
The Head of Internal Audit Function provides, on at least a semi-annual basis, the Supervisory Board and the Board of Directors with a
report at local level on the activities performed, their results, the issues identified, the action plans for their resolution, their status and the
timing for their implementation. It also includes the results of the follow-up activities, indication of the persons and/or functions responsible
for the implementation of the action plans, and the timing and effectiveness of the actions implemented to remove the issues initially found.
The Board of Directors determines what actions are to be taken with respect to each issue, and ensures that those actions are carried
38
Generali Česká pojišťovna a.s. ● Solvency and Financial Condition Report 2020
out. However, in the event of any particularly serious situations arising during the normal reporting cycle, the Head of Internal Audit
Function will immediately inform the Supervisory Board, the Board of Directors and the Audit Committee, the local top management, the
Head of Business Unit Audit and the Head of Group Audit.
The internal audit function maintains a quality assurance and improvement program, which includes both internal and external
assessments aimed at covering all audit activity aspects, and a continuous improvement program. These programs include an evaluation
of the audit activity’s conformance with professional standards, the Audit Group Policy, the audit methodology detailed in the Group Audit
Manual, and the Code of Ethics of the Institute of Internal Auditors. The programs also assess the efficiency and effectiveness of the audit
activity and identify opportunities for improvement.
B.5.2. INFORMATION ON AUTHORITIES, RESOURCES, PROFESSIONAL QUALIFICATIONS, KNOWLEDGE, EXPERIENCE AND THE OPERATIONAL INDEPENDENCE OF THE INTERNAL AUDIT FUNCTION
For more information, please refer to Section B.5.1
B.6. ACTUARIAL FUNCTION The actuarial function (AF) at Generali Česká pojišťovna is based on the Group Actuarial Function Policy and has been amended to meet
the supervisory requirements and specifics of the Czech insurance market.
In l ine with the updated Group Actuarial Function Policy:
§ The calculation and control activities are organizationally separated to ensure full independency. At least once a year the
Head of Actuarial Function submits an opinion on technical provisions, the underwriting policy and the reinsurance
arrangements to the Board/AMSB. To support their role, the Head of Actuarial Function is granted, to the extent legally
permitted, unrestricted access to the information necessary to carry out their responsibil ities and also has access to the heads
of the responsible functions and committees.
§ In the event of any fundamental issues in areas of their interest (technical provisions, the underwriting policy and reinsurance
arrangements), the Head of Actuarial Function reports the finding directly to the Board/AMSB, to which they have independent
and direct access.
§ The Head of Actuarial Function is appointed by the local Board/AMSB.
§ The Head of Actuarial Function reports directly to the CEO.
In accordance with the historical set-up and experience, Generali Česká pojišťovna has separated the two actuarial functions for l i fe and
non-life:
§ Head of Actuarial Function Life,
§ Head of Actuarial Function Non-life.
There are regular meetings to ensure full consistency and al ignment as well as the sharing of information between both life and non-life
actuarial functions and between the actuarial function and actuarial calculation departments. The amendments indicated above have been
confirmed by the Head of Group Actuarial Function.
In terms of resources, the actuarial function currently consists of two people using additional resources provided by strong actuarial teams
in the CFO area. The Life and Non-life Heads of Actuarial Function possess an actuarial background with a degree in actuarial sciences,
long-term actuarial experience including appointed actuary positions, and are holders of actuarial certification from the Czech Association
of Actuaries.
The objectiveness of the actuarial function is supported by the Fit & Proper requirements (Group Fit & Proper Policy) and the professional
responsibil ity of the Heads of Actuarial Function (full members of the IAA professional organization).
The actuarial function closely cooperates especially with the life and non-life actuarial department, which reports to the CFO, and is
responsible for the calculation of technical provisions, the capital requirements for l ife and non-life underwriting risks, including the impact
of market risks on insurance liabilities, the value of new business in l ife insurance, the effectivity of the reinsurance program, and reporting
in given areas.
The actuarial function also cooperates with other technical departments of the Company, especially risk management, product
management, controll ing, reinsurance, and ALM departments.
The main responsibilities and roles of the actuarial function, as required by the Solvency II principles (Article 48 of Directive 2009/138/EC),
are the following:
§ control l ing and assessing adequacy, and validating technical provisions,
§ assessing the local technical provisions (TP) data quality process,
§ expressing an opinion on the overall underwriting policy,
§ expressing an opinion on the adequacy of the reinsurance arrangements,
§ contributing to the effective implementation of the risk management system,
as well as tasks not explicitly required by the Solvency II principles:
§ a control role in IFRS technical provisions,
39
Generali Česká pojišťovna a.s. ● Solvency and Financial Condition Report 2020
§ a control role in product development and product profitabil ity,
§ a control role in l ife and non-life underwriting risks modelled by the Internal Model.
.There have been no material changes to this area since the last reporting period
B.7. OUTSOURCING
B.7.1. INFORMATION ON THE OUTSOURCING POLICY
The Company has fully adopted the Group Outsourcing Policy, which sets consistent minimum mandatory outsourcing standards,
assigns the main outsourcing responsibil ities, and ensures that appropriate controls and governance structures are establishe d within any
outsourcing initiative.
This policy introduces a risk-based approach, distinguishing between critical and non-critical outsourcing, the materiality of each
outsourcing agreement, and the extent to which the Company controls the service providers.
The Company has also adopted local outsourcing rules that specify all the rules and obligations for the proper set-up and management
of outsourcing relationships both within and outside the Group, the criteria for the classification of outsourcing significance, roles and
responsibil ities, contract content, internal processes, evidence, and the monitoring of outsourcing. The Company considers the following
functions significant: risk management, compliance function, internal audit and the actuarial function. The Company considers the following
activities important: administration of insurance, claims settlement, investments, calculation of provisions, underwriting, product
development, actuarial.
The outsourcing of functions or activities considered as critical or significant by the Company will not be undertaken in such a way as to
lead to any of the following: materially impairing the quality of the Company’s system of governance, unduly increasing operational risk,
impairing the ability of the supervisory authorities to monitor the compliance of the undertaking with its obligations, or undermining
continuous and satisfactory service to policyholders. The outsourcing agreements for critical and important activities must be submitted
to the Board of Directors for approval.
An outsourcing business officer is appointed for each outsourcing contract. This person is responsible for the overall execution of the
outsourcing lifecycle, from risk assessment to final management. The officer also monitors the service -level agreements defined in the
contracts as well as the quality of the provided services.
The Company has providers of outsourced functions or activities in the Czech Republic, Italy and the Netherlands.
There have been no material changes to this area since the last reporting period.
B.8. ANY OTHER INFORMATION
B.8.1. ASSESSMENT OF THE ADEQUACY OF THE SYSTEM OF GOVERNANCE TO THE NATURE, SCALE AND COMPLEXITY OF THE RISKS INHERENT IN THE BUSINESS
For more information, please refer to Section B.5.1
B.8.2. OTHER MATERIAL INFORMATION REGARDING THE SYSTEM OF GOVERNANCE
There is no other relevant information.
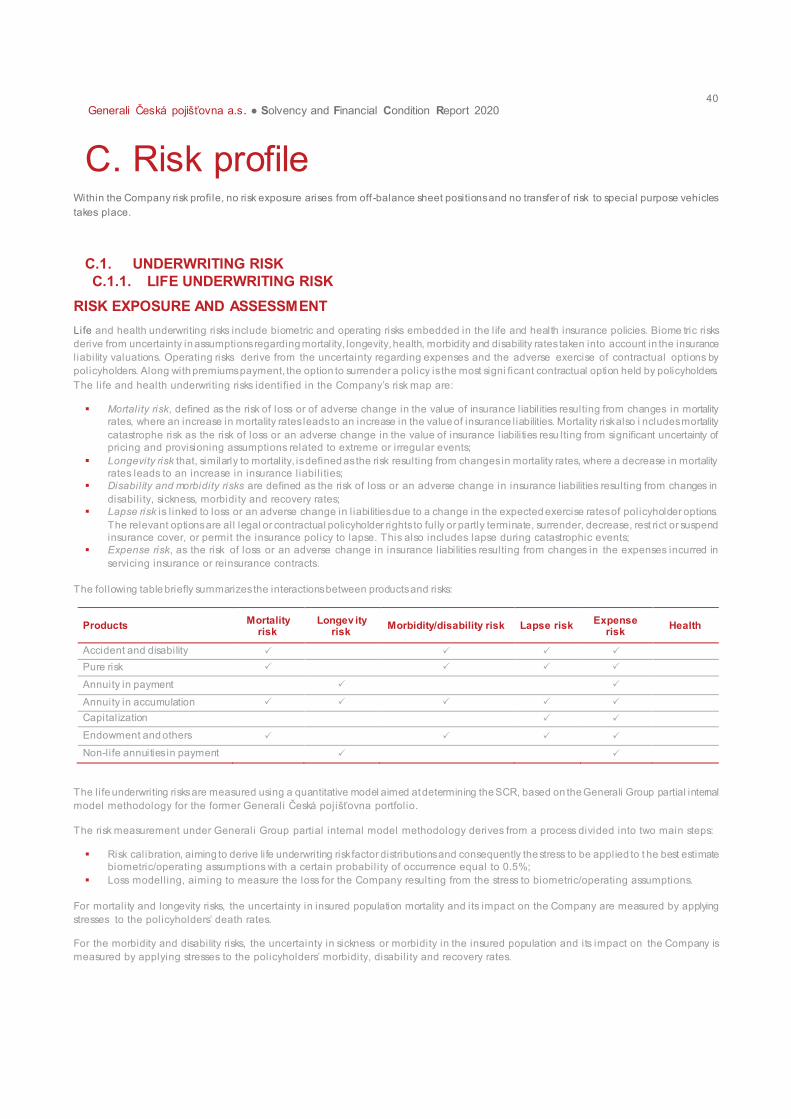
40
Generali Česká pojišťovna a.s. ● Solvency and Financial Condition Report 2020
C. Risk profile Within the Company risk profile, no risk exposure arises from off -balance sheet positions and no transfer of risk to special purpose vehicles
takes place.
C.1. UNDERWRITING RISK
C.1.1. LIFE UNDERWRITING RISK
RISK EXPOSURE AND ASSESSMENT
Life and health underwriting risks include biometric and operating risks embedded in the life and health insurance policies. Biome tric risks
derive from uncertainty in assumptions regarding mortality, longevity, health, morbidity and disability rates taken into account in the insurance
liability valuations. Operating risks derive from the uncertainty regarding expenses and the adverse exercise of contractual options by
policyholders. Along with premiums payment, the option to surrender a policy is the most signi ficant contractual option held by policyholders.
The life and health underwriting risks identified in the Company’s risk map are:
§ Mortality risk, defined as the risk of loss or of adverse change in the value of insurance liabil ities resulting from changes in mortality
rates, where an increase in mortality rates leads to an increase in the value of insurance liabilities. Mortality risk also i ncludes mortality
catastrophe risk as the risk of loss or an adverse change in the value of insurance liabilities resu lting from significant uncertainty of
pricing and provisioning assumptions related to extreme or irregular events;
§ Longevity risk that, similarly to mortality, is defined as the risk resulting from changes in mortality rates, where a decrease in mortality
rates leads to an increase in insurance liabil ities;
§ Disability and morbidity risks are defined as the risk of loss or an adverse change in insurance liabilities resulting from changes in
disability, sickness, morbidity and recovery rates;
§ Lapse risk is l inked to loss or an adverse change in l iabilities due to a change in the expected exercise rates of policyholder options.
The relevant options are all legal or contractual policyholder rights to fully or partly terminate, surrender, decrease, rest rict or suspend
insurance cover, or permit the insurance policy to lapse. This also includes lapse during catastrophic events;
§ Expense risk, as the risk of loss or an adverse change in insurance liabilities resulting from changes in the expenses incurred in
servicing insurance or reinsurance contracts.
The following table briefly summarizes the interactions between products and risks:
Products Mortality
risk Longev ity
risk Morbidity/disability risk Lapse risk
Expense risk
Health
Accident and disability P P P P
Pure risk P P P P
Annuity in payment P P
Annuity in accumulation P P P P P
Capitalization P P
Endowment and others P P P P
Non-life annuities in payment P P
The life underwriting risks are measured using a quantitative model aimed at determining the SCR, based on the Generali Group partial internal
model methodology for the former Generali Česká pojišťovna portfolio.
The risk measurement under Generali Group partial internal model methodology derives from a process divided into two main steps:
§ Risk calibration, aiming to derive life underwriting risk factor distributions and consequently the stress to be applied to t he best estimate
biometric/operating assumptions with a certain probability of occurrence equal to 0.5%;
§ Loss modelling, aiming to measure the loss for the Company resulting from the stress to biometric/operating assumptions.
For mortality and longevity risks, the uncertainty in insured population mortality and its impact on the Company are measured by applying
stresses to the policyholders’ death rates.
For the morbidity and disability risks, the uncertainty in sickness or morbidity in the insured population and its impact on the Company is
measured by applying stresses to the policyholders’ morbidity, disability and recovery rates.
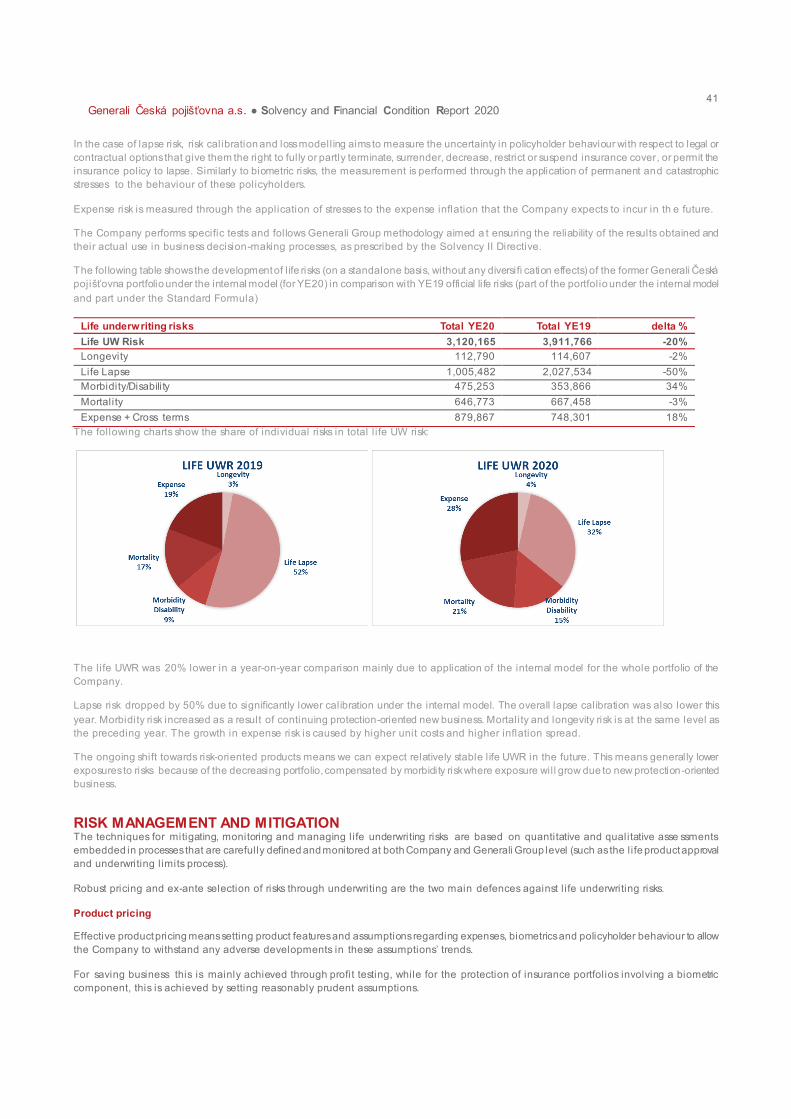
41
Generali Česká pojišťovna a.s. ● Solvency and Financial Condition Report 2020
In the case of lapse risk, risk calibration and loss modelling aims to measure the uncertainty in policyholder behaviour with respect to legal or
contractual options that give them the right to fully or partly terminate, surrender, decrease, restrict or suspend insurance cover, or permit the
insurance policy to lapse. Similarly to biometric risks, the measurement is performed through the application of permanent and catastrophic
stresses to the behaviour of these policyholders.
Expense risk is measured through the application of stresses to the expense inflation that the Company expects to incur in th e future.
The Company performs specific tests and follows Generali Group methodology aimed a t ensuring the reliability of the results obtained and
their actual use in business decision-making processes, as prescribed by the Solvency II Directive.
The following table shows the development of l ife risks (on a standalone basis, without any diversifi cation effects) of the former Generali Česká pojišťovna portfolio under the internal model (for YE20) in comparison with YE19 official life risks (part of the portfolio under the internal model
and part under the Standard Formula)
Life underwriting risks Total YE20 Total YE19 delta %
Life UW Risk 3,120,165 3,911,766 -20%
Longevity 112,790 114,607 -2%
Life Lapse 1,005,482 2,027,534 -50%
Morbidity/Disability 475,253 353,866 34%
Mortality 646,773 667,458 -3%
Expense + Cross terms 879,867 748,301 18%
The following charts show the share of individual risks in total l ife UW risk:
The life UWR was 20% lower in a year-on-year comparison mainly due to application of the internal model for the whole portfolio of the
Company.
Lapse risk dropped by 50% due to significantly lower calibration under the internal model. The overall lapse calibration was also lower this
year. Morbidity risk increased as a result of continuing protection-oriented new business. Mortality and longevity risk is at the same level as
the preceding year. The growth in expense risk is caused by higher unit costs and higher inflation spread.
The ongoing shift towards risk-oriented products means we can expect relatively stable l ife UWR in the future. This means generally lower
exposures to risks because of the decreasing portfolio, compensated by morbidity risk where exposure will grow due to new protection-oriented
business.
RISK MANAGEMENT AND MITIGATION The techniques for mitigating, monitoring and managing life underwriting risks are based on quantitative and qualitative asse ssments
embedded in processes that are carefully defined and monitored at both Company and Generali Group level (such as the life product approval
and underwriting limits process).
Robust pricing and ex-ante selection of risks through underwriting are the two main defences against l ife underwriting risks.
Product pricing
Effective product pricing means setting product features and assumptions regarding expenses, biometrics and policyholder behaviour to allow
the Company to withstand any adverse developments in these assumptions’ trends.
For saving business this is mainly achieved through profit testing, while for the protection of insurance portfolios involving a biometric
component, this is achieved by setting reasonably prudent assumptions.
42
Generali Česká pojišťovna a.s. ● Solvency and Financial Condition Report 2020
For insurance portfolios with a biometric risk component, the mortality tables used in pricing include reasonable prudential margins. For these
portfolios, comprehensive reviews of mortality experience are also performed at Head Office level every year, involving a comparison with the
expected portfolio mortality determined according to the most up-to-date mortality tables available in each market. This analysis allows the
continuous checking of the adequacy of the mortality assumptions used in product pricing, and the addressing of the risk of misestimating for
future underwriting years.
Similarly as for mortality risk, an annual assessment of the adequacy of the mortality tables used in pricing is performed for longevity risk. This
assessment considers both biometric risks and financial risks related to the minimum interest rate guarantee , and any potential mismatch
between liabilities and the corresponding assets. Also in this case, the analysis allows continuous checks of the adequacy of the longevity
assumptions taken into account in product pricing, and the addressing of the risk of misestimating for future underwriting years.
All operating assumptions used in the product pricing phase or for the valuation of new business are derived from the Company’s own experience in l ine with the underwriting policy. They are consistent with the assu mptions used for technical provisions (TP) valuation.
Furthermore, to ensure full alignment with the Company’s strategy on product approval, the process includes on -going monitoring of the
products to be launched by the Company and a biannual update of the profitabil ity review at parent company level.
Underwriting process
The Company follows the underwriting guidelines of Generali Group that determine operating limits and the standard exemption request
process to maintain risk exposure between pre-set l imits and ensure a coherent use of capital.
Particular emphasis is put on the underwriting of new contracts, considering both medical and financial risks. The Company fo llows the clear
underwriting standards issued through manuals, forms, and medical and financial underwriting requirements.
Maximum insurability levels are set by the Company for insurance riders most exposed to moral hazard. To further mitigate these risks, policy
exclusions and financial underwriting rules are also defined.
The Company regularly monitors risk exposures and adherence to operating limits, reports any abnormal situations, and follows an escalation
process proportionate to the nature of the violation to ensure that remedial actions are swiftly undertaken.
Role of risk management in pricing and product approv al processes
The Company’s CRO supports the pricing process as a member of the product and underwriting committees.
The product approval process includes a review by the risk management function to ensure that new products are in l ine with the risk appetite
framework (both quantitative and qualitative dimensions) and that risk capital is considered within the risk-adjusted performance management.
Underwriting risk can also be transferred through reinsurance to another (re)insurance undertaking to reduce the financial im pact of these risks
on the Company. This effectively reduces the SCR needed to be held to cover them.
The life reinsurance function at Group level supports, steers and coordinates the reinsurance activity of the Company by defi ning appropriate
guidelines aimed at ensuring tight risk control, in l ine with the Group and Company risk appetite. The guidelines are also intended to fully take
advantage of all the opportunities reinsurance offers in each market.
The Group acts as the main reinsurer for the Company. Nevertheless, with the parent company’s agreement and when justified by specific
business reasons, the Company can also transact with another reinsurance company on the open reinsurance market.
In subscribing reinsurance contracts with market reinsurers, the Company agrees and relies on the above-mentioned guidelines that also
indicate admissible reinsurance transactions, the relevant maximum cession allowed, and the selection of counterparties on th e basis of their
financial strength.
The reinsurance program is subject to the opinion of the life actuarial function (LAF) regarding adequacy in accordance with the Group actuarial
function policy and related guidelines. The actuarial function should consider whether the reinsurance arrangements are sufficient and
adequate, and ascertain that own retention limits have been adequately set. Companies to whom contracts are ceded usually bel ong to
Generali Group; hence there is minimum risk of potential unavailabil ity of reinsurance cover.
C.1.2. NON-LIFE UNDERWRITING RISK RISK EXPOSURE AND ASSESSMENT
Property and Casualty (P&C) underwriting risk is the risk arising from P&C insurance obligations and relates to the perils covered and the
processes used in the conduct of business. It includes at least the risk of underestimating the frequency and/or severity of claims when defining
pricing and provisions (respectively pricing risk and reserving risk) and the risk of losses arising from extreme or exceptional events
(catastrophe risk).
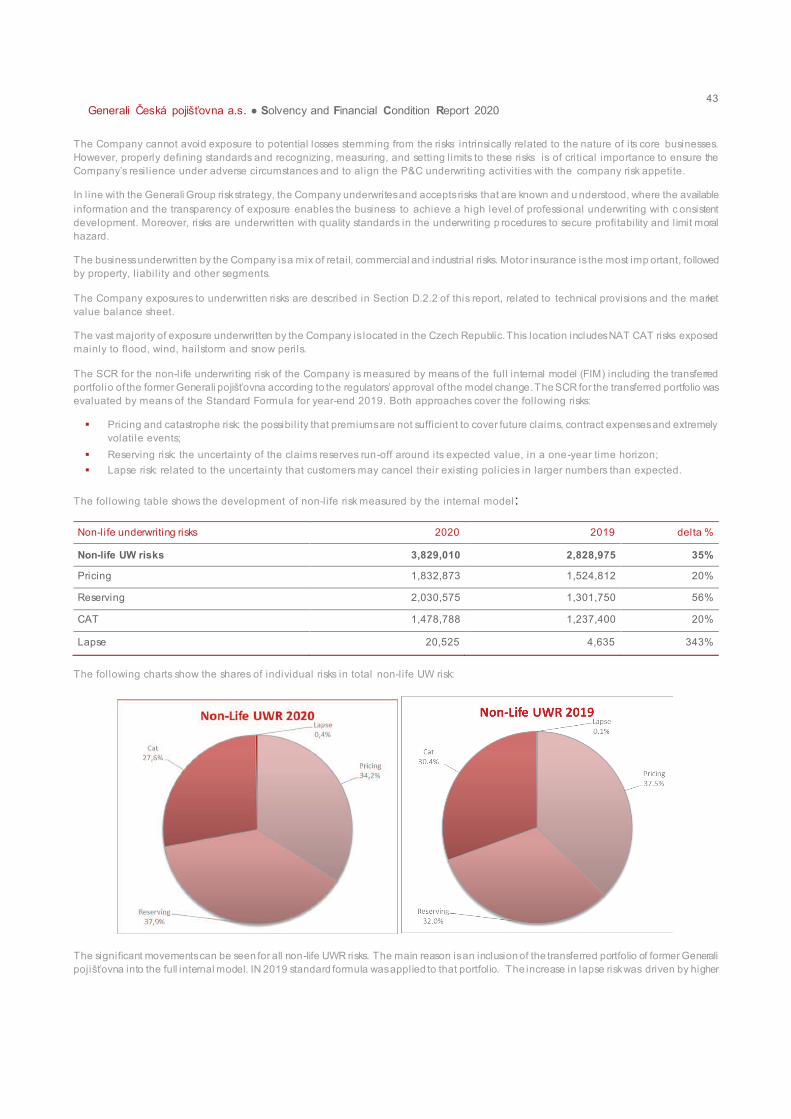
43
Generali Česká pojišťovna a.s. ● Solvency and Financial Condition Report 2020
The Company cannot avoid exposure to potential losses stemming from the risks intrinsically related to the nature of its core businesses.
However, properly defining standards and recognizing, measuring, and setting limits to these risks is of critical importance to ensure the
Company’s resil ience under adverse circumstances and to align the P&C underwriting activities with the company risk appetite.
In l ine with the Generali Group risk strategy, the Company underwrites and accepts risks that are known and u nderstood, where the available
information and the transparency of exposure enables the business to achieve a high level of professional underwriting with c onsistent
development. Moreover, risks are underwritten with quality standards in the underwriting p rocedures to secure profitability and limit moral
hazard.
The business underwritten by the Company is a mix of retail, commercial and industrial risks. Motor insurance is the most imp ortant, followed
by property, l iabil ity and other segments.
The Company exposures to underwritten risks are described in Section D.2.2 of this report, related to technical provisions and the market
value balance sheet.
The vast majority of exposure underwritten by the Company is located in the Czech Republic. This location includes NAT CAT risks exposed
mainly to flood, wind, hailstorm and snow perils.
The SCR for the non-life underwriting risk of the Company is measured by means of the full internal model (FIM) including the transferred
portfolio of the former Generali pojišťovna according to the regulators’ approval of the model change. The SCR for the transferred portfolio was
evaluated by means of the Standard Formula for year-end 2019. Both approaches cover the following risks:
§ Pricing and catastrophe risk: the possibil ity that premiums are not sufficient to cover future claims, contract expenses and extremely
volatile events;
§ Reserving risk: the uncertainty of the claims reserves run-off around its expected value, in a one-year time horizon;
§ Lapse risk: related to the uncertainty that customers may cancel their existing policies in larger numbers than expected.
The following table shows the development of non-life risk measured by the internal model:
Non-life underwriting risks 2020 2019 delta %
Non-life UW risks 3,829,010 2,828,975 35%
Pricing 1,832,873 1,524,812 20%
Reserving 2,030,575 1,301,750 56%
CAT 1,478,788 1,237,400 20%
Lapse 20,525 4,635 343%
The following charts show the shares of individual risks in total non-life UW risk:
The significant movements can be seen for all non-life UWR risks. The main reason is an inclusion of the transferred portfolio of former Generali
pojišťovna into the full internal model. IN 2019 standard formula was applied to that portfolio. The increase in lapse risk was driven by higher
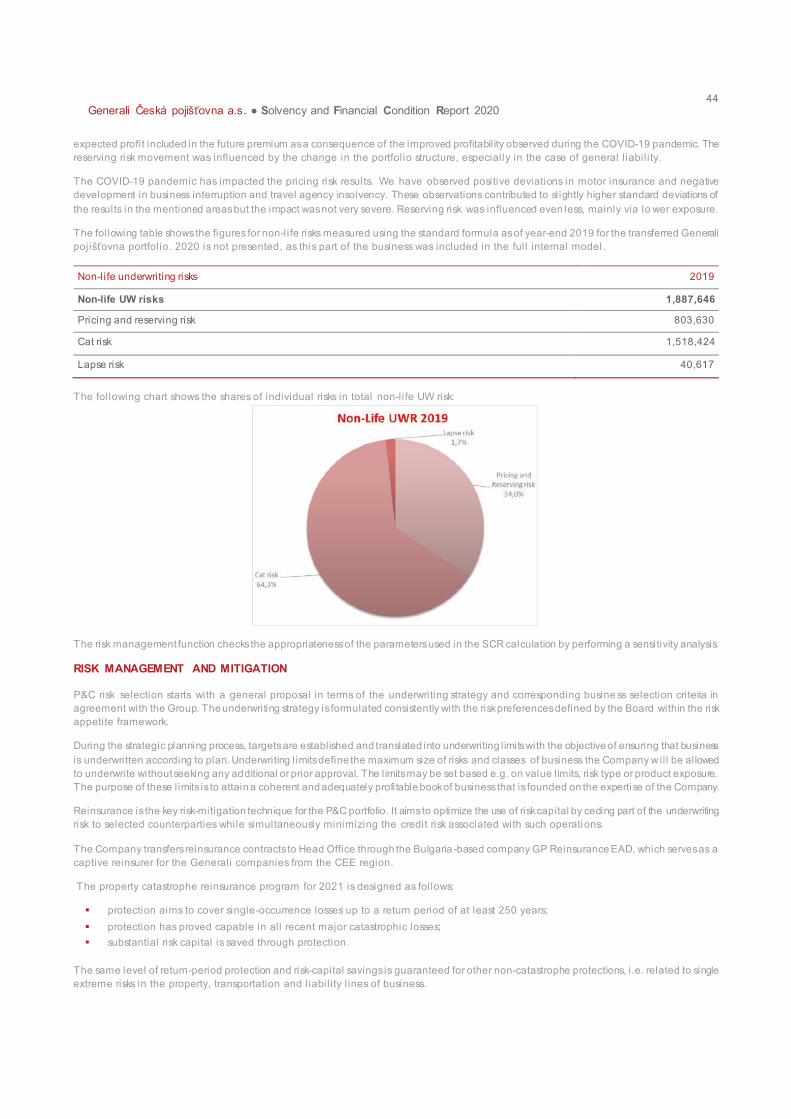
44
Generali Česká pojišťovna a.s. ● Solvency and Financial Condition Report 2020
expected profit included in the future premium as a consequence of the improved profitabil ity observed during the COVID-19 pandemic. The
reserving risk movement was influenced by the change in the portfolio structure, especially in the case of general l iabil ity.
The COVID-19 pandemic has impacted the pricing risk results. We have observed positive deviations in motor insurance and negative
development in business interruption and travel agency insolvency. These observations contributed to slightly higher standard deviations of
the results in the mentioned areas but the impact was not very severe. Reserving risk was influenced even less, mainly via lo wer exposure.
The following table shows the figures for non-life risks measured using the standard formula as of year-end 2019 for the transferred Generali
pojišťovna portfolio. 2020 is not presented, as this part of the business was included in the full internal model .
Non-life underwriting risks 2019
Non-life UW risks 1,887,646
Pricing and reserving risk 803,630
Cat risk 1,518,424
Lapse risk 40,617
The following chart shows the shares of individual risks in total non-life UW risk:
The risk management function checks the appropriateness of the parameters used in the SCR calculation by performing a sensitivity analysis.
RISK MANAGEMENT AND MITIGATION
P&C risk selection starts with a general proposal in terms of the underwriting strategy and corresponding busine ss selection criteria in
agreement with the Group. The underwriting strategy is formulated consistently with the risk preferences defined by the Board within the risk
appetite framework.
During the strategic planning process, targets are established and translated into underwriting limits with the objective of ensuring that business
is underwritten according to plan. Underwriting limits define the maximum size of risks and classes of business the Company w ill be allowed
to underwrite without seeking any additional or prior approval. The limits may be set based e.g. on value limits, risk type or product exposure.
The purpose of these limits is to attain a coherent and adequately profitable book of business that is founded on the expertise of the Company.
Reinsurance is the key risk-mitigation technique for the P&C portfolio. It aims to optimize the use of risk capital by ceding part of the underwriting
risk to selected counterparties while simultaneously minimizing the credit risk associated with such operations.
The Company transfers reinsurance contracts to Head Office through the Bulgaria -based company GP Reinsurance EAD, which serves as a
captive reinsurer for the Generali companies from the CEE region.
The property catastrophe reinsurance program for 2021 is designed as follows:
§ protection aims to cover single-occurrence losses up to a return period of at least 250 years;
§ protection has proved capable in all recent major catastrophic losses;
§ substantial risk capital is saved through protection.
The same level of return-period protection and risk-capital savings is guaranteed for other non-catastrophe protections, i.e. related to single
extreme risks in the property, transportation and liabil ity l ines of business.
45
Generali Česká pojišťovna a.s. ● Solvency and Financial Condition Report 2020
There was no major change in the reinsurance program of the Company. The only relevant adjustment was an increase in the capacity of the
catastrophe excess of loss program. The aim of this adjustment was to increase protection from the most severe catastrophic events.
The Company has historically preferred traditional reinsurance as a tool for mitigating catastrophe risk resulting from its P&C portfolio, and has
shown no appetite for other mitigating techniques.
The risk management function confirms the adequacy of the risk mitigation techniques on an annual basis. An analysis of several alternative
reinsurance programs with a focus on indicators such as solvency ratio, profitability and economic value is provided to test the suitability of the
current setup.
The current reinsurance program has significantly improved the risk position of the Company. The mitigation effect is most significant in the
case of CAT risk, where more than 90% of the SCR is ceded out of the Company. The effect is also favourable in the case of other non-life
underwriting risk – the decrease of 60% in lapse risk, 57% in pricing risk and 42% in reserving risk was driven by the current reinsurance
structure.
C.2. MARKET RISK
As a composite insurer, the Company collects premiums from policyholders in exchange for payment promises contingent on pre -determined
events. The Company invests the collected premiums in a wide variety of financial assets, with the purpose of honouring future promises to
policyholders and generating value for its shareholders.
The Company might then be exposed to the following market & credit risk:
§ Invested assets may not perform as expected because of fall ing or volatile market prices;
§ Cash from maturing bonds may be reinvested under unfavourable market conditions, typically lower interest rates;
§ Invested assets may not perform as expected because of perceived or actual deterioration of the creditworthiness of the issue r;
§ Derivative or reinsurance contracts may not perform as expected because of a perceived or actual deterioration of the creditworthiness
of the counterparty.
Regarding its invested assets, the Company is a long-term liabil ity-driven investor, and holds assets until they are needed to redeem the
promises to policyholders. It is therefore fairly immune to any short -term decrease and fluctuations in their market values.
Nonetheless, the Company is required by the Solvency II Regulation to hold a capital buffer with the purpose of maintaining a sound solvency
position even under adverse market movements. For more information, please refer to Section E.2.
For this purpose, the Company manages its investments in a prudent way according to the prudent person principle, and strives to optimize
the return of its assets while minimizing the negative impact of short-term market fluctuations on its solvency. The company achieves this
optimization by investing only in assets and instruments whose risks can be properly identified, measured, monitored, managed and
appropriately taken into account when assessing solvency needs.
The Company invests the premiums collected in financial instruments ensuring that benefits to policyholders can be paid on ti me. If the value
of the financial investments substantially decreases when claims to policyholders need to be paid, the Company may fail to maintain its
promises to policyholders. Therefore, the Company must ensure that the value of the financial investments backing up the insu rance contracts
does not fall below the value of its obligations.
In the case of its unit-l inked business, the Company typically invests the collected premiums in financial instruments but does not bear any
market or credit risk. However, with respect to its earnings the Company is exposed because fees are the main source of profits for the
Company and are directly l inked to the performance of the underlying assets. Therefore, adverse developments in the markets c ould directly
affect the profitabil ity of the Company should contract fees become insufficient to cover costs.
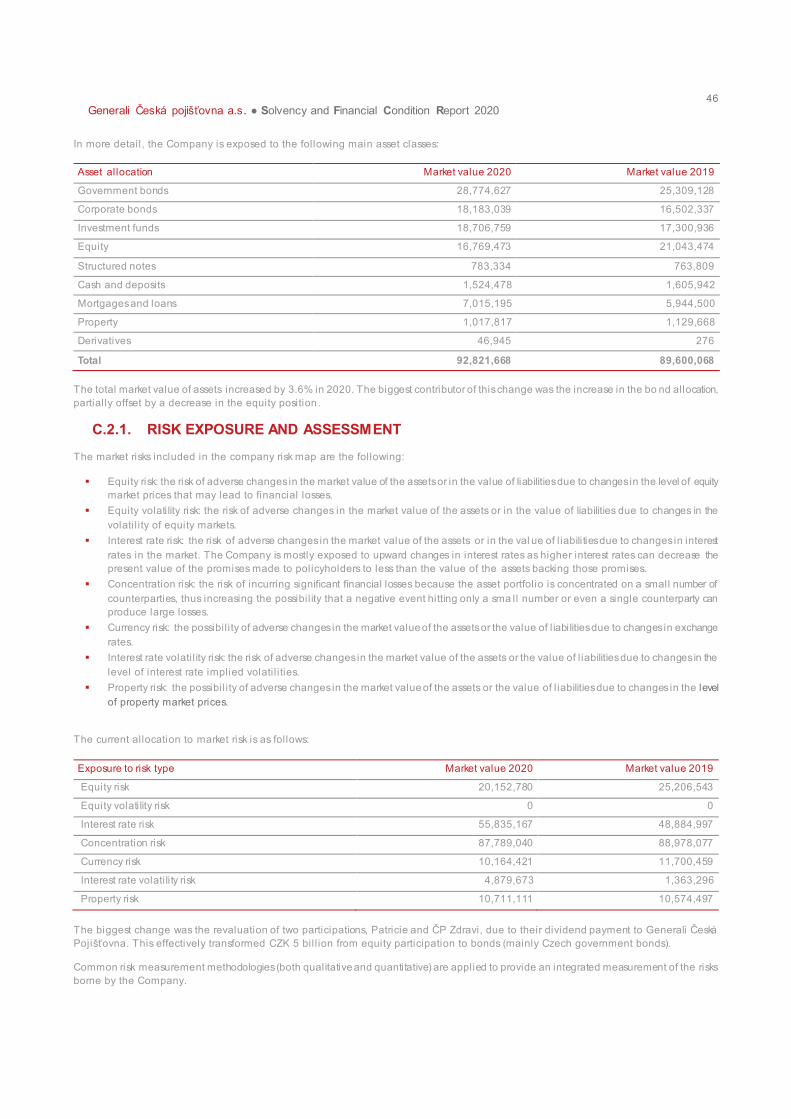
46
Generali Česká pojišťovna a.s. ● Solvency and Financial Condition Report 2020
In more detail, the Company is exposed to the following main asset classes:
Asset allocation Market value 2020 Market value 2019
Government bonds 28,774,627 25,309,128
Corporate bonds 18,183,039 16,502,337
Investment funds 18,706,759 17,300,936
Equity 16,769,473 21,043,474
Structured notes 783,334 763,809
Cash and deposits 1,524,478 1,605,942
Mortgages and loans 7,015,195 5,944,500
Property 1,017,817 1,129,668
Derivatives 46,945 276
Total 92,821,668 89,600,068
The total market value of assets increased by 3.6% in 2020. The biggest contributor of this change was the increase in the bo nd allocation,
partially offset by a decrease in the equity position .
C.2.1. RISK EXPOSURE AND ASSESSMENT
The market risks included in the company risk map are the following:
§ Equity risk: the risk of adverse changes in the market value of the assets or in the value of liabilities due to changes in the level of equity
market prices that may lead to financial losses.
§ Equity volatility risk: the risk of adverse changes in the market value of the assets or in the value of liabilities due to changes in the
volatil ity of equity markets.
§ Interest rate risk: the risk of adverse changes in the market value of the assets or in the val ue of l iabilities due to changes in interest
rates in the market. The Company is mostly exposed to upward changes in interest rates as higher interest rates can decrease the
present value of the promises made to policyholders to less than the value of the assets backing those promises.
§ Concentration risk: the risk of incurring significant financial losses because the asset portfolio is concentrated on a small number of
counterparties, thus increasing the possibil ity that a negative event hitting only a sma ll number or even a single counterparty can
produce large losses.
§ Currency risk: the possibil ity of adverse changes in the market value of the assets or the value of l iabilities due to changes in exchange
rates.
§ Interest rate volatil ity risk: the risk of adverse changes in the market value of the assets or the value of l iabilities due to changes in the
level of interest rate implied volatil ities.
§ Property risk: the possibil ity of adverse changes in the market value of the assets or the value of l iabilities due to changes in the level
of property market prices.
The current allocation to market risk is as follows:
Exposure to risk type Market value 2020 Market value 2019
Equity risk 20,152,780 25,206,543
Equity volatility risk 0 0
Interest rate risk 55,835,167 48,884,997
Concentration risk 87,789,040 88,978,077
Currency risk 10,164,421 11,700,459
Interest rate volatility risk 4,879,673 1,363,296
Property risk 10,711,111 10,574,497
The biggest change was the revaluation of two participations, Patricie and ČP Zdravi, due to their dividend payment to Generali Česká Pojišťovna. This effectively transformed CZK 5 bil l ion from equity participation to bonds (mainly Czech government bonds).
Common risk measurement methodologies (both qualitative and quantitative) are applied to provide an integrated measurement of the risks
borne by the Company.
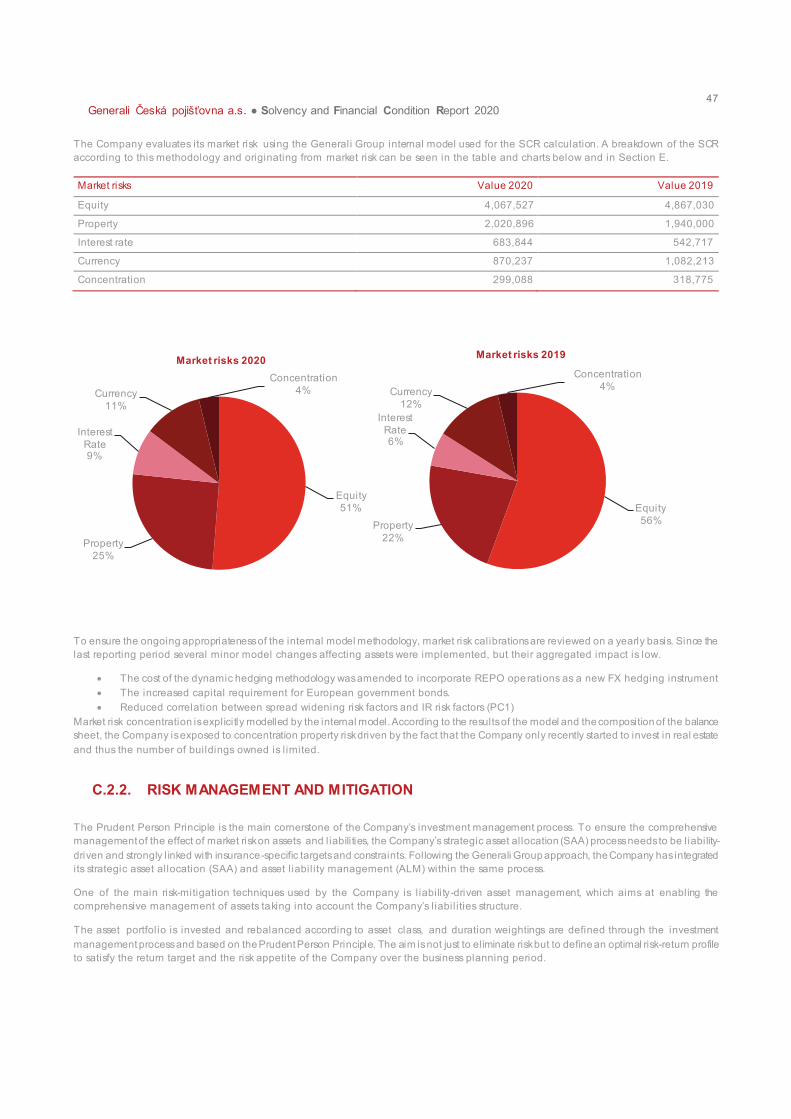
47
Generali Česká pojišťovna a.s. ● Solvency and Financial Condition Report 2020
The Company evaluates its market risk using the Generali Group internal model used for the SCR calculation. A breakdown of the SCR
according to this methodology and originating from market risk can be seen in the table and charts below and in Section E.
Market risks Value 2020 Value 2019
Equity 4,067,527 4,867,030
Property 2,020,896 1,940,000
Interest rate 683,844 542,717
Currency 870,237 1,082,213
Concentration 299,088 318,775
To ensure the ongoing appropriateness of the internal model methodology, market risk calibrations are reviewed on a yearly basis. Since the
last reporting period several minor model changes affecting assets were implemented, but their aggregated impact is low.
· The cost of the dynamic hedging methodology was amended to incorporate REPO operations as a new FX hedging instrument
· The increased capital requirement for European government bonds.
· Reduced correlation between spread widening risk factors and IR risk factors (PC1)
Market risk concentration is explicitly modelled by the internal model. According to the results of the model and the composition of the balance
sheet, the Company is exposed to concentration property risk driven by the fact that the Company only recently started to invest in real estate
and thus the number of buildings owned is l imited.
C.2.2. RISK MANAGEMENT AND MITIGATION
The Prudent Person Principle is the main cornerstone of the Company’s investment management process. To ensure the comprehensive management of the effect of market risk on assets and liabilities, the Company’s strategic asset allocation (SAA) process needs to be liability-
driven and strongly l inked with insurance-specific targets and constraints. Following the Generali Group approach, the Company has integrated
its strategic asset allocation (SAA) and asset l iabil ity management (ALM) within the same process.
One of the main risk-mitigation techniques used by the Company is l iability-driven asset management, which aims at enabling the
comprehensive management of assets taking into account the Company’s liabil ities structure.
The asset portfolio is invested and rebalanced according to asset class, and duration weightings are defined through the investment
management process and based on the Prudent Person Principle. The aim is not just to eliminate risk but to define an optimal risk-return profile
to satisfy the return target and the risk appetite of the Company over the business planning period.
Equity
51%
Property
25%
Interest
Rate9%
Currency
11%
Concentration
4%
Market risks 2020
Equity
56%Property
22%
Interest
Rate6%
Currency
12%
Concentration
4%
Market risks 2019
48
Generali Česká pojišťovna a.s. ● Solvency and Financial Condition Report 2020
The Company also uses derivatives to mitigate the risks present in the asset or/and liability portfolios. The derivatives help the Company
improve the quality, l iquidity and profitabil ity of the portfolio, according to the business planning targets.
ALM and SAA activities aim to ensure that the Company holds sufficient and adequate assets to achieve the defined targets and meet liability
obligations. This implies detailed analyses of asset-liability relationships under a range of market scenarios and expected/stressed investment
conditions.
The ALM and SAA process relies on close interaction between the investment, finance, actuarial, treasury and risk management functions.
The inputs and targets received from these functions guarantee that the ALM and SAA process is consistent with the risk appetite framework,
and the strategic planning and capital allocation processes.
The aim of the strategic asset allocation process is to define the most efficient combination of asset classes that, according to the Prudent
Person Principle and related relevant implementation measures, maximizes the investment contribution to value creation, taking into account
solvency, actuarial and accounting indicators.
The annual SAA proposal:
§ defines target exposure and limits, in terms of minimum and maximum exposure allowed, for each relevant asset class;
§ embeds the deliberate ALM mismatches permitted and potential mitigation actions that can be enabled on the investment side.
The Group has centralized the management and monitoring of specific asset classes (private equity, alternative fixed income, etc.). These
kinds of investments are subject to accurate due diligence aiming at assessing the quality of the investment, the level of ri sk related to the
investment, and its consistency with the approved liabil ity-driven SAA.
In addition to risk tolerance limits set for the Company solvency position defined within the RAF, the current risk monitorin g process of the
Company is also integrated into the system of investment risk limits through the adoption of the Generali Group investments risk guidelines
(GIRG) provided by Head Office. This includes general principles, quantitative risk limits (with a strong focus on credit and market
concentration), authorization processes and prohibitions.
Furthermore, the Company is also actively implementing market risk mitigation strategies:
Currency risk
The Company’s functional currency is the Czech crown (CZK). However, the investment portfolios also contain instruments denom inated in
foreign currencies. According to the general policy, all these instruments are either dynamically hedged into CZK via FX or assigned to foreign
currency technical reserves at a corresponding value. FX hedging is implemented either through FX derivatives (i.e. FX swaps, forward
transactions and cross currency swaps) or through cross-currency REPO operations (used since 2016). The process in place guarantees high
effectiveness of the hedging.
Interest rate risk
The Company concludes derivative trades to manage the interest rate risk position of the asset portfolio as part of this risk management
strategy.
The objective of the investment and hedging strategy is to manage the overall interest rate risk position on a continuous basis. The Company
achieves this objective using a dynamic strategy. The asset manager dynamically adjusts the positions within the fixed income portfolio and
hedging derivatives that are used to adjust and hedge the interest rate sensitivity of the overall portfolio.
The positions of individual instruments within the portfolio, whether the underlying assets or the hedging derivatives, are o pened, adjusted or
terminated even before the maturity date of the instrument, based on the actual state of the Company’s risk capacity or risk appetite, the development of the credit quality of the instrument’s issuer, or a change in the instrument’s l iquidity or in its relative ri sk/return profile. The
asset manager monitors the development of the overall i nterest rate position on an ongoing basis.
The Company implements hedge accounting to reflect its hedging strategy within the financial statements. As part of hedge acc ounting
activities, the effectiveness of hedging is measured as the ratio of gains/losses on hedged items to the profit or loss result of the hedging
instrument. An effectiveness test is regularly performed each month, and compliance with the 80 %-125% rule is verified.
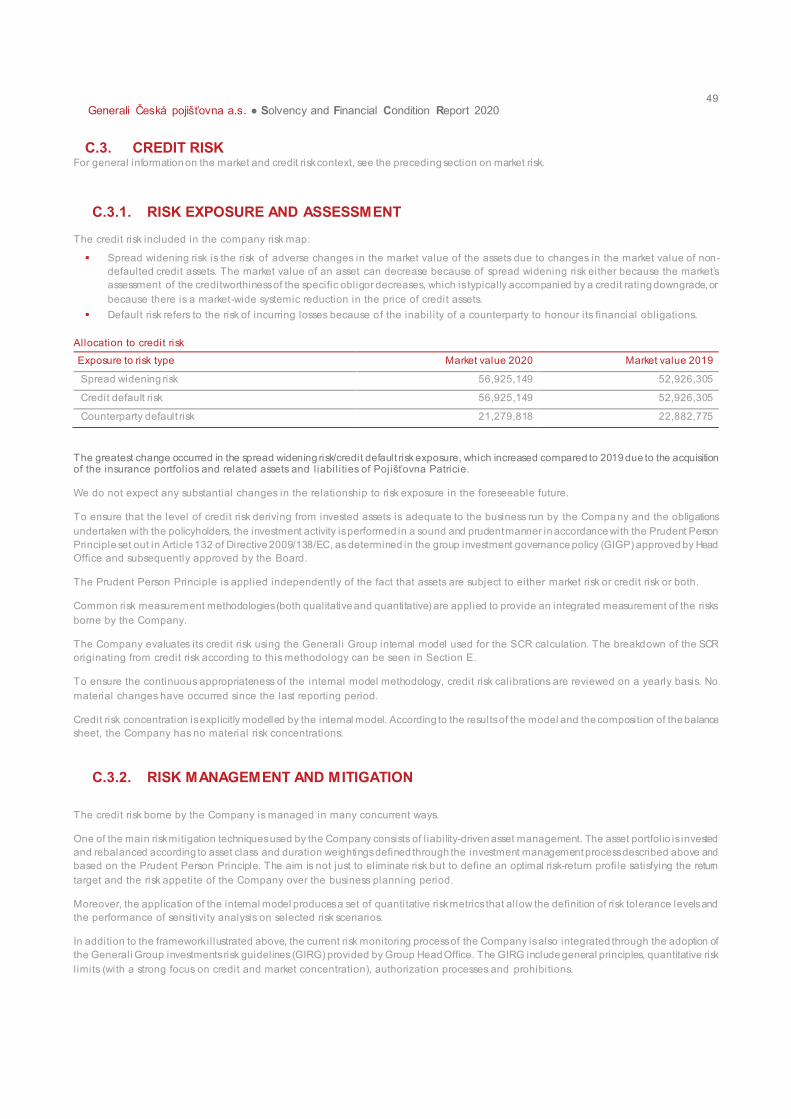
49
Generali Česká pojišťovna a.s. ● Solvency and Financial Condition Report 2020
C.3. CREDIT RISK For general information on the market and credit risk context, see the preceding section on market risk.
C.3.1. RISK EXPOSURE AND ASSESSMENT
The credit risk included in the company risk map:
§ Spread widening risk is the risk of adverse changes in the market value of the assets due to changes in the market value of non-
defaulted credit assets. The market value of an asset can decrease because of spread widening risk either because the market’s assessment of the creditworthiness of the specific obligor decreases, which is typically accompanied by a credit rating downgrade, or
because there is a market-wide systemic reduction in the price of credit assets.
§ Default risk refers to the risk of incurring losses because of the inability of a counterparty to honour its financial obligations.
Allocation to credit risk
Exposure to risk type Market value 2020 Market value 2019
Spread widening risk 56,925,149 52,926,305
Credit default risk 56,925,149 52,926,305
Counterparty default risk 21,279,818 22,882,775
The greatest change occurred in the spread widening risk/credit default risk exposure, which increased compared to 2019 due to the acquisition of the insurance portfolios and related assets and l iabil ities of Pojišťovna Patricie. We do not expect any substantial changes in the relationship to risk exposure in the foreseeable future.
To ensure that the level of credit risk deriving from invested assets is adequate to the business run by the Compa ny and the obligations
undertaken with the policyholders, the investment activity is performed in a sound and prudent manner in accordance with the Prudent Person
Principle set out in Article 132 of Directive 2009/138/EC, as determined in the group investment governance policy (GIGP) approved by Head
Office and subsequently approved by the Board.
The Prudent Person Principle is applied independently of the fact that assets are subject to either market risk or credit risk or both.
Common risk measurement methodologies (both qualitative and quantitative) are applied to provide an integrated measurement of the risks
borne by the Company.
The Company evaluates its credit risk using the Generali Group internal model used for the SCR calculation. The breakdown of the SCR
originating from credit risk according to this methodology can be seen in Section E.
To ensure the continuous appropriateness of the internal model methodology, credit risk calibrations are reviewed on a yearly basis. No
material changes have occurred since the last reporting period.
Credit risk concentration is explicitly modelled by the internal model. According to the results of the model and the composition of the balance
sheet, the Company has no material risk concentrations.
C.3.2. RISK MANAGEMENT AND MITIGATION
The credit risk borne by the Company is managed in many concurrent ways.
One of the main risk mitigation techniques used by the Company consists of l iability-driven asset management. The asset portfolio is invested
and rebalanced according to asset class and duration weightings defined through the investment management process described above and
based on the Prudent Person Principle. The aim is not just to eliminate risk but to define an optimal risk-return profile satisfying the return
target and the risk appetite of the Company over the business planning period.
Moreover, the application of the internal model produces a set of quantitative risk metrics that allow the definition of risk tolerance levels and
the performance of sensitivity analysis on selected risk scenarios.
In addition to the framework il lustrated above, the current risk monitoring process of the Company is also integrated through the adoption of
the Generali Group investments risk guidelines (GIRG) provided by Group Head Office. The GIRG include general principles, quantitative risk
limits (with a strong focus on credit and market concentration), authorization processes and prohibitions.
50
Generali Česká pojišťovna a.s. ● Solvency and Financial Condition Report 2020
C.4. LIQUIDITY RISK
C.4.1. RISK EXPOSURE AND ASSESSMENT
Liquidity risk is defined as the uncertainty arising from business operations, investment or financing activities over the ability of the in surer to
meet its payment obligations in a full and timely manner, in the current or a stressed environment. This could include meeting commitments
only through credit market access under unfavourable conditions or through the sale of financial assets incurring additional costs due to the
il l iquidity of (or difficulties in l iquidating) the assets.
The Company is exposed to l iquidity risk as a result of its insurance operating activity, which depends on the cash-flow profile of expected new
business. Liquidity risk also arises due to potential mismatches between the cash inflows and the cash outflows deriving from the business.
Additional l iquidity risk can also stem from the Company’s investing activity, due to potential l iquidity gaps deriving from the management of the Company’s asset portfolio as well as from a potentially insufficient level of l iquidity (i.e. capacity to be sold a t a fair price in adequate
amounts and within a reasonable timeframe) in the case of disposal. Finally, the Company can be exposed to liquidity outflows related to
issued guarantees, commitments, derivative contract margin calls, or regulatory constraints regarding the coverage ratio of insurance
provisions and its capital position.
The Company’s l iquidity risk assessment relies on projecting cash obligations and available cash resources into the future to ensure that
available liquid resources are always sufficient to cover cash obligations that will come due in the same period.
For this purpose, a set of l iquidity risk metrics has been defined and is used to regularly monitor the l iquidity situation. All such metrics are
forward-looking, i.e. they are calculated at a future date based on projections of cash flows, assets and liabil ities, and an estimat ion of the level
of l iquidity of the asset portfolio.
The metrics are calculated under both the base scenario, in which the values of cash flows, assets and liabilities are consistent with the
strategic plan, and under a set of stress scenarios in which the projected cash inflows and outflows, market price of assets and amount of
technical provisions are recalculated to take into account unlikely but plausible circumstances that would adversely impact the Company’s
l iquidity.
Liquidity risk limits are defined as values for the above-mentioned metrics that may not be exceeded by the Company. The limit framework is
designed to ensure that the Company holds a liquidity buffer in excess of the amount required to withstand the adverse circumstances depicted
in the stress scenarios.
In addition to regularly monitored and reported quantitative liquidity metrics, the Company is supported by qualitative liquidity indications (like
setting limits on business activities, early warning indicators, stress testing) that complement the compreh ensive assessment of l iquidity risk
and provide information on remedial actions when needed.
The liquidity metrics show a stable liquidity position. There have been no material changes to this area which could have resulted in breaches
of stipulated liquidity thresholds since the last reporting period.
Material l iquidity risk concentrations could arise from large exposures to individual counterparties or groups. In fact, in the event of default or
another l iquidity issue of a counterparty where there is a significant risk concentration, this may negatively affect the value or the liquidity of
the Company’s investment portfolio and hence its ability to promptly raise cash by selling the portfolio on the market in case of need. For this
purpose, the Company has a set of investment risk limits that manage concentration risk taking a number of dimensions, including asset class,
counterparty and credit rating, into consideration.
C.4.2. RISK MANAGEMENT AND MITIGATION
The Company manages and mitigates liquidity risk in accordance with the framework set in the Group’s internal regulations. The Company also aims to ensure its capacity to meet its commitments in adverse scenarios, while achieving its profitabil ity and growth o bjectives. To this
end, it manages expected cash inflows and outflows to maintain a sufficient available cash level to meet short - and medium-term needs, and
by investing in instruments that can be quickly and easily converted into cash with minimum capital losses. The Company consi ders its
prospective liquidity situation under plausible market conditions as well as under stress scenarios.
The Company has established clear governance guidelines for l iquidity risk measurement, management, mitigation and reporting in accordance
with Group regulations. This includes the setting of specific l imits and escalation processes should limits be breached or ot her l iquidity issues
arise.
The principles for l iquidity risk management designed in the liquidity risk management policy and the risk appetite framework are fully embedded
in the Company’s strategic planning as well as in business processes, including investments and product development. As far as the investment
process is concerned, the Company has explicitly identified liquidity risk as one of the main risks connected with investments, and has stipulated
that the strategic asset allocation process must rely on indicators strictly related to l iquidity risk, including the mismatch of duration and cash

51
Generali Česká pojišťovna a.s. ● Solvency and Financial Condition Report 2020
flows between assets and liabilities. Investment l imits have been imposed on the Company to ensure that the share of i l l iquid assets is kept
within a level that does not impair the Company’s asset l iquidity. As far as produc t development is concerned, the Company follows the life
and P&C underwriting policies defining the principles to be applied to mitigate the impact on liquidity from lapses and surrenders in respect of
the life business and claims in respect of the non-life business. There were no material changes in this area in the last monitored period.
C.4.3. EXPECTED PROFIT INCLUDED IN FUTURE PREMIUMS
Expected profit included in future premiums (EPIFP) represents the expected present value of future cash flows that result from the inclusion
in technical provisions of premiums relating to existing insurance and reinsurance contracts. These are expected to be receiv ed in the future,
but may not be received for any reason other than because the insured event has occurre d, regardless of the legal or contractual rights of the
policyholder to discontinue the policy.
The EPIFP amount underwritten by the Company has been calculated in accordance with Article 260(2) of the Delegated Act and amounts to
CZK 9.662 bil lion for the life business and CZK 2.157 bil lion for the P&C business at year-end 2020. The increase in non-life profit compared
to the preceding year (CZK 1.800 bil lion) was mainly driven by the lower expectation of losses for the motor business and general liability
insurance segments. The improvement is connected to the COVID-19 pandemic and related restrictions. It can be seen that the EPIFP for the
life business increased. This was primarily due to the increase in profitabil ity caused by the lower lapse assumption.
Expected profit included in future premiums (EPIFP) gross
Expected profit included in future premiums (EPIFP)
31 December 2020 31 December 2019 delta %
Expected profit included in future premiums (EPIFP) – l ife
insurance 9 661 951 9 065 469 7%
Expected profit included in future premiums (EPIFP) – non-life insurance
2 156 564 1 799 884 20%
Expected profit included in future premiums (EPIFP) – total 11 818 515 10 865 353 9%
.
C.5. OPERATIONAL RISK
C.5.1. RISK EXPOSURE AND ASSESSMENT
Operational risk is the risk of loss arising from inadequate or failed internal processes, personnel or systems, or from external events.
Compliance and financial reporting risk falls within this category. The calculation of capital requirement for operational risk is part of internal
model since 2020.
In l ine with industry practices, Generali Group has adopted the following classification categories:
§ Internal fraud concerns losses due to acts of a type intended to defraud, misappropriate property or circumvent regulations, the law or
Company policy, excluding diversity/discrimination events, and which involve at least one internal party.
§ External fraud refers to losses due to acts intended to defraud, misappropriate property or circumvent the law, by a third party.
§ Employment practices and workplace safety, defined as losses arising from acts inconsistent with employment, health and safety laws
or agreements, from the payment of personal injury claims, or from diversity/discrimination events.
§ Clients, products and business practices refers to losses arising from an unintentional or negligent failure to meet a professional
obligation towards specific clients (including fiduciary and suitability requirements), or from the nature or design of a product.
§ Damage to physical assets concerns losses arising from the loss of or damage to physical assets from natural disaster or other events.
§ Business disruption and system failures refers to losses arising from disruption of business or system failures.
§ Execution, delivery and process management involves losses from failed transaction processing or process management, and from
relations with trade counterparties and vendors.
Following best industry practices, the Company’s framework for operational risk management includes its loss data collection (LDC) and risk
assessment and scenario analyses.
Loss data collection is the process of collecting losses from operational risk events, and provides a backward-looking view on the Company’s risk profile in operational risks.
52
Generali Česká pojišťovna a.s. ● Solvency and Financial Condition Report 2020
Risk assessment and scenario analysis provides a forward-looking view of the Company’s risk profile in operational risk, and requires an
analysis of the risks performed jointly with the business owners:
§ Risk assessment provides a qualitative and quantitative evaluation of the forward-looking inherent and residual risk exposure of the
Company. The outcomes of the assessment drive the scenario analysis execution.
§ Scenario analysis is a recurring process that, considering the risk assessment results, provides a detailed evaluation of the Company’s operational risk exposure through the selection and evaluation of specific risk scenarios.
MAIN COMPANY RISKS
For the Company and the industry as a whole, one of the main operational risks arises from the implementation and correct interpretation of
all requirements arising from regulations like IDD, GDPR, the customer protection regulation, or the AML directive. The Company therefore
strictly monitors requirements resulting from regulations, especially as regards customer data privacy and customer protection, and takes the
necessary actions to ensure full compliance with both regulatory requirements and security standards. The Company is also fully aware of the
risk of cyber attacks, which is increasing across the whole industry. The increasing relevance of this risk is related to the steadily increasing
dependence on IT. Furthermore, the Company is aware of the significance of fraud risk, especially client frauds and fraud by intermediaries,
however this risk has been efficiently mitigated thanks to a highly developed and structured detection system. Pandemic-related risk was newly
included in the main risks because of the worldwide events in the past year.
C.5.2. RISK MANAGEMENT AND MITIGATION
To identify, measure, monitor and mitigate operational risk, a dedicated team within the risk management function has been established with
a mandate to steer the operational risk framework. Risks related to non-compliance are monitored by the compliance function.
Furthermore, specific risks such as the financial reporting risk, IT risk, tax risk, fraud risk and corporate security are investigated and managed
jointly with specialized units within the first l ine of defence.
Overall, the operational risk management system is primarily based on the assessment of risks by experts in different fields of Company
operations, and collecting information on losses that have actually occurred. The outputs of these analyses are used to suppo rt investments
in new or modified controls and mitigation actions to keep the level of operational risk within an acceptable range and to achieve better
operational flow efficiency.
From a process perspective, there have been no material changes to this area since the last reporting period . However, the risk profile of the
Company has slightly changed, mainly due to external factors and the mitigation actions performed by the Company. Due to planned activities
in the customer protection area, operational risk decreased in comparison to the preceding period. The Company now faces pandemic risk,
which was not considered significant in past years. Increased risk exposure is also observed in the cyber security area, however this is
accompanied by the parallel development of mitigation measures reducing the residual risk. Other operational risks are stable without relevant
changes.
C.6. OTHER MATERIAL RISK
As part of the qualitative risk management framework, the following risk categories are also considered:
§ Reputational risk refers to potential losses arising from a deterioration in reputation or the negative perception of the Company among
its customers, counterparties and the supervisory authority. The processes in place to manage these risks include communication and
media monitoring activities, corporate and social responsibil ity, customer relations, and distribution management.
§ Emerging risk arises from new trends or risks difficult to perceive and quantify, although typically systemic. These usually include
internal or external environment changes, social trends, regulatory developments, technological achievements, etc.
§ Strategic risk involves external changes and/or internal decisions that may influence the future risk profile of the Company.
§ Contagion risk derives from problems elsewhere within Generali Group that may affect the solvency or economic situation of the
Company.
The above risks are identified and evaluated within the ORSA process, in both current and forward-looking perspectives. These risks are not
subject to the SCR calculation, however their impact on the financial and solvency conditions of the Company is estimated at least on a
qualitative basis.
There have been no material changes to this area since the last reporting period.

53
Generali Česká pojišťovna a.s. ● Solvency and Financial Condition Report 2020
C.7. ANY OTHER INFORMATION
To test the Company’s solvency position and its resil ience to adverse market conditions or shocks, a set of stress test and scen ario analyses
are performed within the ORSA process. These are defined considering unexpected and potentially severe but plausible events across the
risk categories. The examination of the potential effects on the Company’s financial and capital position serves to outline appropriate management actions to take if such events were to materialize.
The Company also performs a sensitivity analysis that considers simple changes in specific risk drivers (e.g. interest rates, equity shock, credit
spreads and interest rate volatil ity). Their main purpose is to measure the variability of the own funds and solvency ratio to variations in specific
risk factors. The set chosen aims to provide an assessment of resil ience to the most significant risks.
The impacts of the sensitivities are reported in Section E.
There have been no material risks in this area since the last reporting period.
54
Generali Česká pojišťovna a.s. ● Solvency and Financial Condition Report 2020
D. Valuation for solvency purposes D.1. ASSETS
D.1.1. GENERAL VALUATION FRAMEWORK
There were no material changes to the general valuation framework in comparison with the preceding reporting period except for the
implementation of IFRS 16.
Solvency II clarifies the relationship between the SII valuation of assets and liabil ities and the international accounting standards (IFRS)
adopted by the European Commission. The primary objective for valuation as set out in the Solvency II regulation requires an economic,
market-consistent approach to the valuation of assets and liabil ities.
According to this approach, assets and liabil ities are valued as follows:
i. Assets should be valued at the amount for which they could be exchanged between knowledgeable and willing parties in an
arm’s length transaction.
ii. Liabilities should be valued at the amount for which they could be transferred, or settled, between knowledgeable and willing
parties in an arm’s length transaction.
When valuing liabilities under point (i i), no adjustment to take account of the own credit standing of the insurance or reinsurance
undertaking is made.
The IFRS accounting bases, such as the definitions of assets and l iabil ities and the recognition and derecognition criteria, are applicable
as the default accounting framework unless otherwise stated. The IFRS also refer to some basic presumptions that are equally applicable:
§ The going concern assumption;
§ The separate valuation of individual assets and liabil ities;
§ The application of materiality, whereby omissions or misstatements of items are material if they could, individually or collec tively,
influence the economic decisions that users make on the basis of the Solve ncy II balance sheet. Materiality depends on the
size and nature of the omission or misstatement judged in the surrounding circumstances. The size or nature of the item, or a
combination of both, could be the determining factor.
Fair value measurement approach
Items will be valued on an economic basis having the IFRS as reference.
On this basis, the following hierarchy of high-level principles for the valuation of assets and liabil ities is used:
Lev el 1 inputs
Level 1 inputs are quoted prices on active markets for identical assets or l iabilities that the entity can access at the measurement date.
A quoted instrument is an instrument negotiated in a regulated market or a multi lateral trading facility. To assess whether a market is
active or not, the Company carefully determines whether the quoted price really reflects the fair value. When the price has not changed
for a long period or the Company has information about an important event that did not cause the price to change accordingly, the market
is considered not active.
An active market for an asset or l iability is a market on which transactions for the asset or l iability occur with sufficient frequency and
volume to provide pricing information on an ongoing basis.
Lev el 2 inputs
Level 2 inputs are inputs other than quoted market prices included within Level 1 that are observable for the asset or l iability, either directly
or indirectly.
They include:
§ Quoted prices for similar assets or l iabil ities in active markets;
§ Quoted prices for identical or similar assets or l iabil ities in markets that are not active;
§ Inputs other than quoted prices that are observable for the asset or l iabil ity, for example:
o Interest rates and yield curves observable at commonly quoted intervals;
o Implied volatil ities;
o Credit spreads;
§ Inputs derived principally from or corroborated by observable market data through correlation or other means (market-
corroborated inputs).
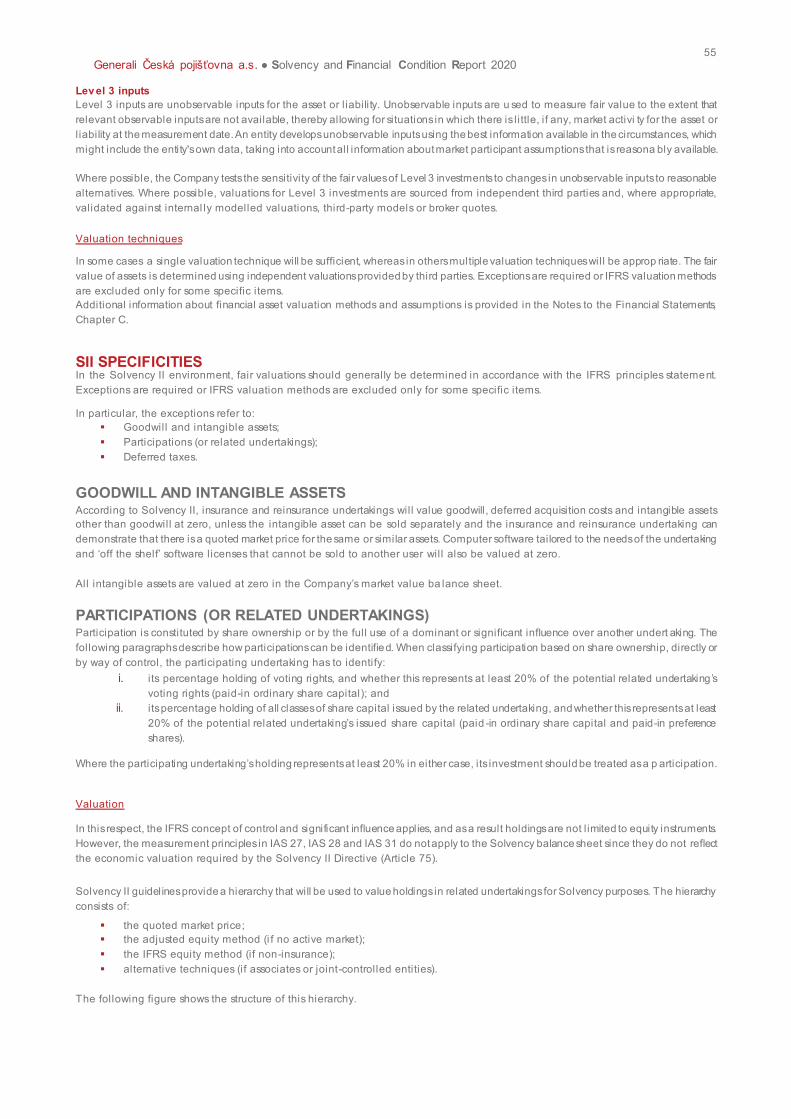
55
Generali Česká pojišťovna a.s. ● Solvency and Financial Condition Report 2020
Lev el 3 inputs
Level 3 inputs are unobservable inputs for the asset or l iability. Unobservable inputs are u sed to measure fair value to the extent that
relevant observable inputs are not available, thereby allowing for situations in which there is l ittle, if any, market activi ty for the asset or
l iability at the measurement date. An entity develops unobservable inputs using the best information available in the circumstances, which
might include the entity's own data, taking into account all information about market participant assumptions that is reasona bly available.
Where possible, the Company tests the sensitivity of the fair values of Level 3 investments to changes in unobservable inputs to reasonable
alternatives. Where possible, valuations for Level 3 investments are sourced from independent third parties and, where appropriate,
validated against internal ly modelled valuations, third-party models or broker quotes.
Valuation techniques
In some cases a single valuation technique will be sufficient, whereas in others multiple valuation techniques will be approp riate. The fair
value of assets is determined using independent valuations provided by third parties. Exceptions are required or IFRS valuation methods
are excluded only for some specific items.
Additional information about financial asset valuation methods and assumptions is provided in the Notes to the Financial Statements,
Chapter C.
SII SPECIFICITIES In the Solvency II environment, fair valuations should generally be determined in accordance with the IFRS principles statement.
Exceptions are required or IFRS valuation methods are excluded only for some specific items.
In particular, the exceptions refer to:
§ Goodwill and intangible assets;
§ Participations (or related undertakings);
§ Deferred taxes.
GOODWILL AND INTANGIBLE ASSETS According to Solvency II, insurance and reinsurance undertakings will value goodwill, deferred acquisition costs and intangible assets
other than goodwill at zero, unless the intangible asset can be sold separately and the insurance and reinsurance undertaking can
demonstrate that there is a quoted market price for the same or similar assets. Computer software tailored to the needs of the undertaking
and ‘off the shelf’ software licenses that cannot be sold to another user will also be valued at zero.
All intangible assets are valued at zero in the Company’s market value ba lance sheet.
PARTICIPATIONS (OR RELATED UNDERTAKINGS) Participation is constituted by share ownership or by the full use of a dominant or significant influence over another undert aking. The
following paragraphs describe how participations can be identified. When classifying participation based on share ownership, directly or
by way of control, the participating undertaking has to identify:
i. i ts percentage holding of voting rights, and whether this represents at least 20% of the potential related undertaking ’s
voting rights (paid-in ordinary share capital); and
ii. i ts percentage holding of all classes of share capital issued by the related undertaking, and whether this represents at least
20% of the potential related undertaking’s issued share capital (paid -in ordinary share capital and paid-in preference
shares).
Where the participating undertaking’s holding represents at least 20% in either case, its investment should be treated as a p articipation.
Valuation
In this respect, the IFRS concept of control and significant influence applies, and as a result holdings are not l imited to equity instruments.
However, the measurement principles in IAS 27, IAS 28 and IAS 31 do not apply to the Solvency balance sheet since they do not reflect
the economic valuation required by the Solvency II Directive (Article 75).
Solvency II guidelines provide a hierarchy that will be used to value holdings in related undertakings for Solvency purposes. The hierarchy
consists of:
§ the quoted market price;
§ the adjusted equity method (i f no active market);
§ the IFRS equity method (if non-insurance);
§ alternative techniques (if associates or joint-controlled entities).
The following figure shows the structure of this hierarchy.
56
Generali Česká pojišťovna a.s. ● Solvency and Financial Condition Report 2020
DEFERRED TAXES In accordance with the IAS 12 statement, deferred tax liabilities are the income tax amounts payable in future periods in respect of taxable
temporary differences, while deferred tax assets are the income tax amounts recoverable in future periods in respect of:
i. deductible temporary differences;
ii. the carry-forward of unused tax losses; and
iii. the carry-forward of unused tax credits.
Valuation
The Solvency II regulatory framework states that deferred tax assets and liabilities will be recognized in the SII balance sheet in accordance
with International Accounting Standards (IAS 12).
In particular, deferred tax assets and liabilities - other than deferred tax assets (DTA) arising from the carry-forward of unused tax credits
and the carry-forward of unused tax losses - should be determined on the basis of the difference between the values ascribed to assets
and liabil ities, and the values ascribed to assets and liabil ities as recognized and valued for tax purposes.
In other words, the deferred tax value has to be based on the difference in the value of th e underlying assets and liabilities assumed in
the valuation consistent with the Solvency II Directive and the value for tax purposes.
While a deferred tax liability (DTL) must be accounted for all temporary taxable differences, the recognition of a DTA i s subject to
conditions.
In particular, IAS 12 provides that the enterprise will recognize a deferred tax asset for all deductible temporary differences to the extent
that it is probable that taxable profit will be available against which the deductible t emporary difference can be util ized.
With reference to taxable temporary differences, IAS 12 provides that the entity will recognize a deferred tax liabil ity for all taxable
temporary differences, with some exceptions.
In particular, with reference to investments in subsidiaries, associated companies, joint ventures and investment vehicles, a nd in
accordance with IAS 12, Section 39, an enterprise will recognize a deferred tax liabil ity for all taxable temporary differences associated
with investments in subsidiaries, branches and associates, and interests in joint ventures, except to the extent that both of the following
conditions are satisfied:
§ The parent, investor or venturer is able to control the timing of the reversal of the temporary difference.
§ It is probable that the temporary difference will not reverse in the anticipatable future.
The table below presents the deferred tax assets and liabil ities recognized by the Company.
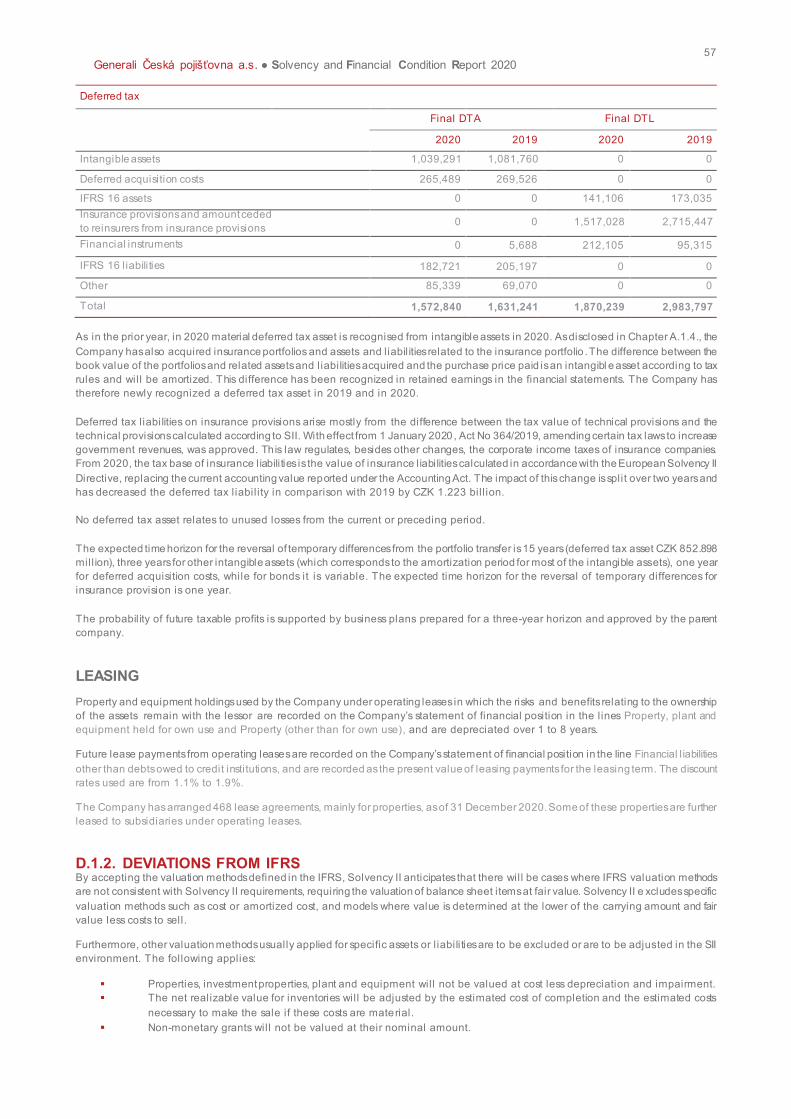
57
Generali Česká pojišťovna a.s. ● Solvency and Financial Condition Report 2020
Deferred tax
Final DTA Final DTL
2020 2019 2020 2019
Intangible assets 1,039,291 1,081,760 0 0
Deferred acquisition costs 265,489 269,526 0 0
IFRS 16 assets 0 0 141,106 173,035
Insurance provisions and amount ceded
to reinsurers from insurance provisions 0 0 1,517,028 2,715,447
Financial instruments 0 5,688 212,105 95,315
IFRS 16 liabilities 182,721 205,197 0 0
Other 85,339 69,070 0 0
Total 1,572,840 1,631,241 1,870,239 2,983,797
As in the prior year, in 2020 material deferred tax asset is recognised from intangible assets in 2020. As disclosed in Chapter A.1.4., the
Company has also acquired insurance portfolios and assets and liabil ities related to the insurance portfolio . The difference between the
book value of the portfolios and related assets and liabilities acquired and the purchase price paid is an intangibl e asset according to tax
rules and will be amortized. This difference has been recognized in retained earnings in the financial statements. The Company has
therefore newly recognized a deferred tax asset in 2019 and in 2020.
Deferred tax liabilities on insurance provisions arise mostly from the difference between the tax value of technical provisions and the
technical provisions calculated according to SII. With effect from 1 January 2020, Act No 364/2019, amending certain tax laws to increase
government revenues, was approved. This law regulates, besides other changes, the corporate income taxes of insurance companies.
From 2020, the tax base of insurance liabilities is the value of insurance liabilities calculated in accordance with the European Solvency II
Directive, replacing the current accounting value reported under the Accounting Act. The impact of this change is split over two years and
has decreased the deferred tax liabil ity in comparison with 2019 by CZK 1.223 bil l ion.
No deferred tax asset relates to unused losses from the current or preceding period.
The expected time horizon for the reversal of temporary differences from the portfolio transfer is 15 years (deferred tax asset CZK 852.898
mill ion), three years for other intangible assets (which corresponds to the amortization period for most of the intangible assets), one year
for deferred acquisition costs, while for bonds it is variable. The expected time horizon for the reversal of temporary differences for
insurance provision is one year.
The probability of future taxable profits is supported by business plans prepared for a three-year horizon and approved by the parent
company.
LEASING
Property and equipment holdings used by the Company under operating leases in which the risks and benefits relating to the ownership
of the assets remain with the lessor are recorded on the Company’s statement of financial position in the lines Property, plant and
equipment held for own use and Property (other than for own use), and are depreciated over 1 to 8 years.
Future lease payments from operating leases are recorded on the Company’s statement of financial position in the line Financial l iabilities
other than debts owed to credit institutions, and are recorded as the present value of leasing payments for the leasing term. The discount
rates used are from 1.1% to 1.9%.
The Company has arranged 468 lease agreements, mainly for properties, as of 31 December 2020. Some of these properties are further
leased to subsidiaries under operating leases.
D.1.2. DEVIATIONS FROM IFRS By accepting the valuation methods defined in the IFRS, Solvency II anticipates that there will be cases where IFRS valuation methods
are not consistent with Solvency II requirements, requiring the valuation of balance sheet items at fair value. Solvency II e xcludes specific
valuation methods such as cost or amortized cost, and models where value is determined at the lower of the carrying amount and fair
value less costs to sell.
Furthermore, other valuation methods usually applied for specific assets or l iabilities are to be excluded or are to be adjusted in the SII
environment. The following applies:
§ Properties, investment properties, plant and equipment will not be valued at cost less depreciation and impairment.
§ The net realizable value for inventories will be adjusted by the estimated cost of completion and the estimated costs
necessary to make the sale if these costs are material.
§ Non-monetary grants will not be valued at their nominal amount.
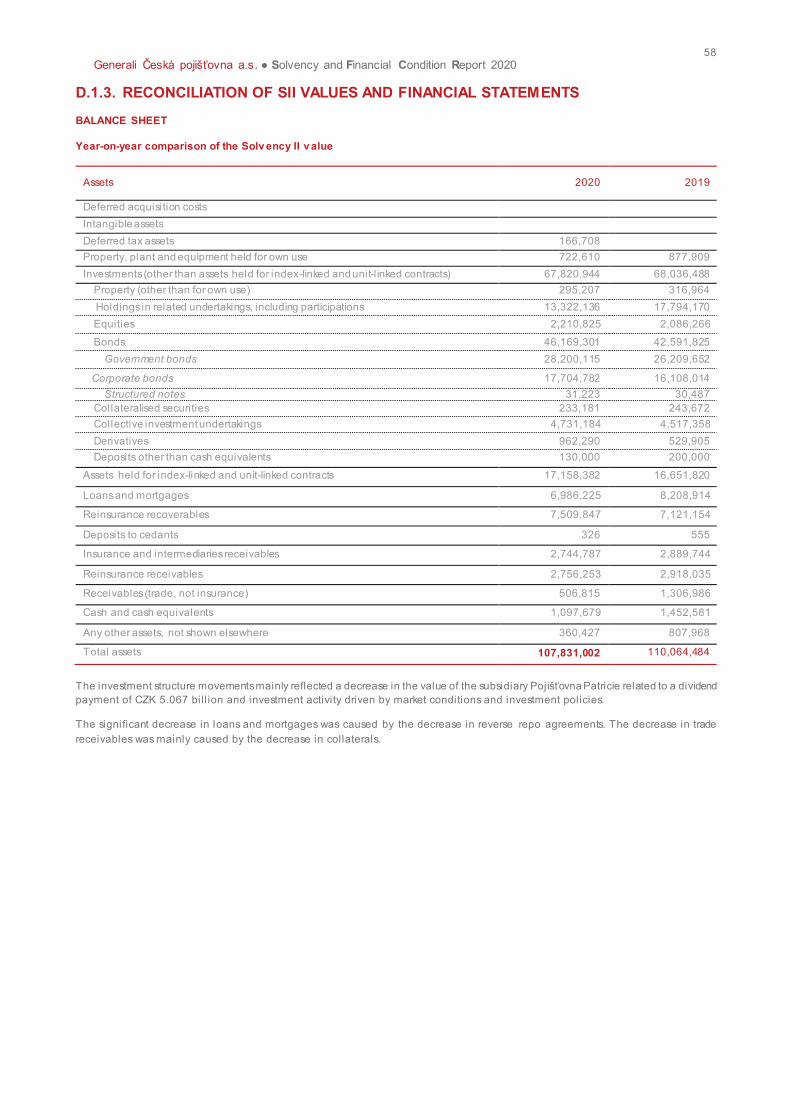
58
Generali Česká pojišťovna a.s. ● Solvency and Financial Condition Report 2020
D.1.3. RECONCILIATION OF SII VALUES AND FINANCIAL STATEMENTS
BALANCE SHEET
Year-on-year comparison of the Solv ency II v alue
Assets 2020 2019
Deferred acquisition costs
Intangible assets
Deferred tax assets 166,708
Property, plant and equipment held for own use 722,610 877,909
Investments (other than assets held for index-linked and unit-l inked contracts) 67,820,944 68,036,488
Property (other than for own use) 295,207 316,964
Holdings in related undertakings, including participations 13,322,136 17,794,170
Equities 2,210,825 2,086,266
Bonds 46,169,301 42,591,825
Government bonds 28,200,115 26,209,652
Corporate bonds 17,704,782 16,108,014
Structured notes 31,223 30,487
Collateralised securities 233,181 243,672
Collective investment undertakings 4,731,184 4,517,358
Derivatives 962,290 529,905
Deposits other than cash equivalents 130,000 200,000
Assets held for index-linked and unit-linked contracts 17,158,382 16,651,820
Loans and mortgages 6,986,225 8,208,914
Reinsurance recoverables 7,509,847 7,121,154
Deposits to cedants 326 555
Insurance and intermediaries receivables 2,744,787 2,889,744
Reinsurance receivables 2,756,253 2,918,035
Receivables (trade, not insurance) 506,815 1,306,986
Cash and cash equivalents 1,097,679 1,452,581
Any other assets, not shown elsewhere 360,427 807,968
Total assets 107,831,002 110,064,484
The investment structure movements mainly reflected a decrease in the value of the subsidiary Pojišťovna Patricie related to a dividend
payment of CZK 5.067 bil l ion and investment activity driven by market conditions and investment policies.
The significant decrease in loans and mortgages was caused by the decrease in reverse repo agreements. The decrease in trade
receivables was mainly caused by the decrease in collaterals.
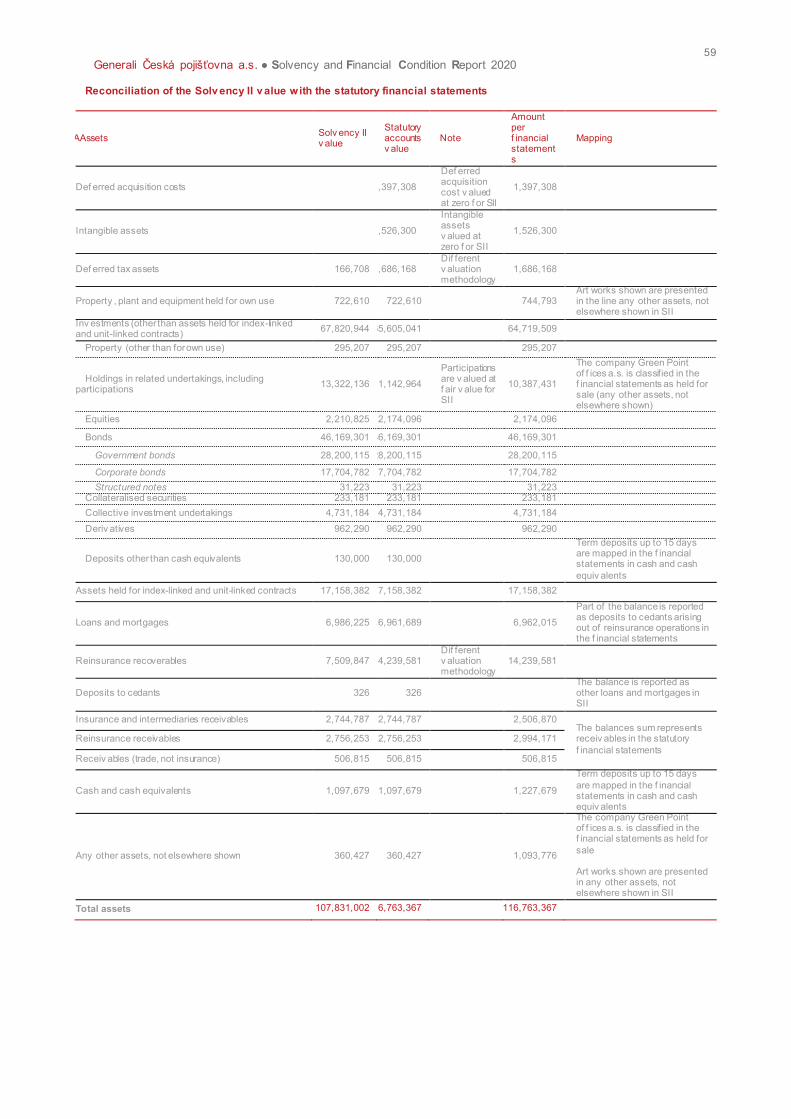
59
Generali Česká pojišťovna a.s. ● Solvency and Financial Condition Report 2020
Reconciliation of the Solv ency II v alue with the statutory financial statements
AssetsAssAAssets Solv ency II v alue
Statutory accounts v alue
Note
Amount per f inancial statements
Mapping
Def erred acquisition costs 1,397,308
Def erred acquisition cost v alued at zero f or SII
1,397,308
Intangible assets 1,526,300
Intangible assets v alued at zero f or SII
1,526,300
Def erred tax assets 166,708 1,686,168 Dif ferent v aluation methodology
1,686,168
Property , plant and equipment held for own use 722,610 722,610 744,793 Art works shown are presented in the line any other assets, not elsewhere shown in SII
Inv estments (other than assets held for index-linked and unit-linked contracts)
67,820,944 65,605,041 64,719,509
Property (other than for own use) 295,207 295,207 295,207
Holdings in related undertakings, including participations
13,322,136 11,142,964
Participations are v alued at f air v alue for SII
10,387,431
The company Green Point of f ices a.s. is classified in the f inancial statements as held for sale (any other assets, not elsewhere shown)
Equities 2,210,825 2,174,096 2,174,096
Bonds 46,169,301 46,169,301 46,169,301
Government bonds 28,200,115 28,200,115 28,200,115
Corporate bonds 17,704,782 17,704,782 17,704,782
Structured notes 31,223 31,223 31,223 Collateralised securities 233,181 233,181 233,181
Collective investment undertakings 4,731,184 4,731,184 4,731,184
Deriv atives 962,290 962,290 962,290
Deposits other than cash equivalents 130,000 130,000
Term deposits up to 15 days are mapped in the f inancial statements in cash and cash
equiv alents
Assets held for index-linked and unit-linked contracts 17,158,382 17,158,382 17,158,382
Loans and mortgages 6,986,225 6,961,689 6,962,015
Part of the balance is reported as deposits to cedants arising out of reinsurance operations in the f inancial statements
Reinsurance recoverables 7,509,847 14,239,581 Dif ferent v aluation methodology
14,239,581
Deposits to cedants 326 326 The balance is reported as other loans and mortgages in SII
Insurance and intermediaries receivables 2,744,787 2,744,787 2,506,870 The balances sum represents receiv ables in the statutory
f inancial statements
Reinsurance receivables 2,756,253 2,756,253 2,994,171
Receiv ables (trade, not insurance) 506,815 506,815 506,815
Cash and cash equivalents 1,097,679 1,097,679 1,227,679
Term deposits up to 15 days
are mapped in the f inancial statements in cash and cash equiv alents
Any other assets, not elsewhere shown 360,427 360,427 1,093,776
The company Green Point of f ices a.s. is classified in the f inancial statements as held for
sale Art works shown are presented in any other assets, not elsewhere shown in SII
Total assets 107,831,002 116,763,367 116,763,367
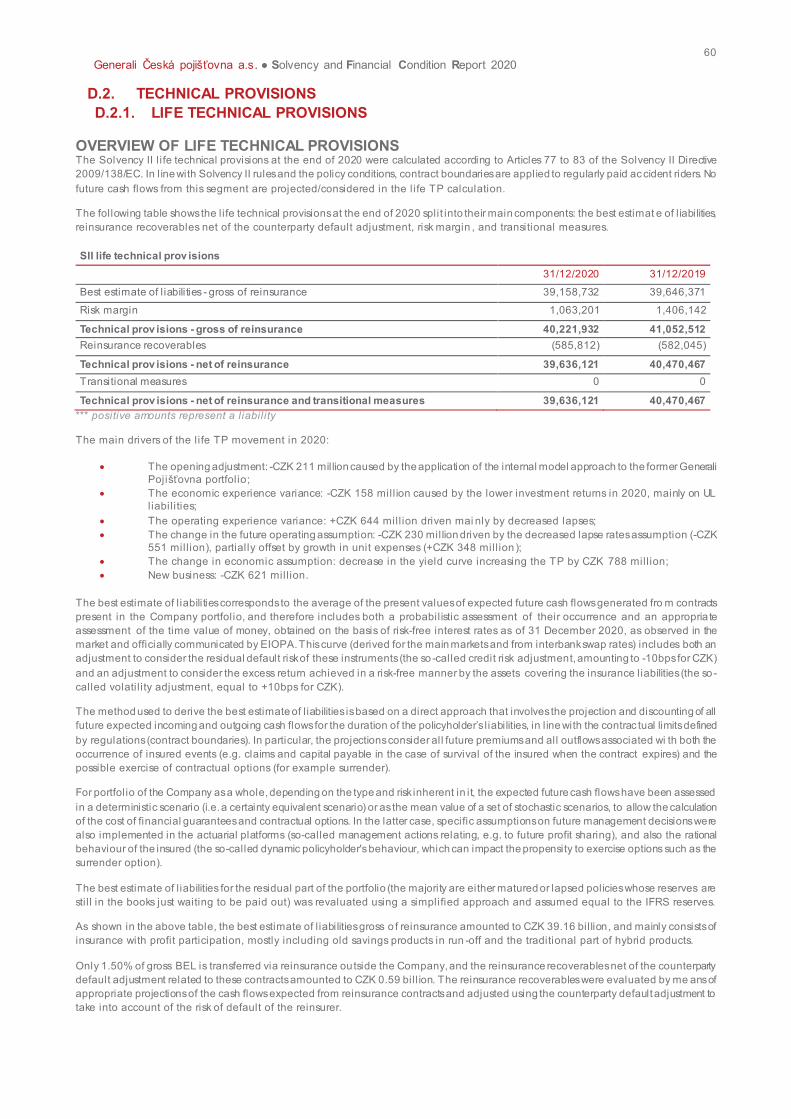
60
Generali Česká pojišťovna a.s. ● Solvency and Financial Condition Report 2020
D.2. TECHNICAL PROVISIONS
D.2.1. LIFE TECHNICAL PROVISIONS
OVERVIEW OF LIFE TECHNICAL PROVISIONS The Solvency II l ife technical provisions at the end of 2020 were calculated according to Articles 77 to 83 of the Solvency II Directive
2009/138/EC. In line with Solvency II rules and the policy conditions, contract boundaries are applied to regularly paid accident riders. No
future cash flows from this segment are projected/considered in the life TP calculation.
The following table shows the life technical provisions at the end of 2020 split into their main components: the best estimat e of l iabilities,
reinsurance recoverables net of the counterparty default adjustment, risk margin , and transitional measures.
SII life technical prov isions
31/12/2020 31/12/2019
Best estimate of l iabilities - gross of reinsurance 39,158,732 39,646,371
Risk margin 1,063,201 1,406,142
Technical prov isions - gross of reinsurance 40,221,932 41,052,512
Reinsurance recoverables (585,812) (582,045)
Technical prov isions - net of reinsurance 39,636,121 40,470,467
Transitional measures 0 0
Technical prov isions - net of reinsurance and transitional measures 39,636,121 40,470,467
*** positive amounts represent a liabil ity
The main drivers of the life TP movement in 2020:
· The opening adjustment: -CZK 211 million caused by the application of the internal model approach to the former Generali
Pojišťovna portfolio;
· The economic experience variance: -CZK 158 mill ion caused by the lower investment returns in 2020, mainly on UL
liabil ities;
· The operating experience variance: +CZK 644 mill ion driven mai nly by decreased lapses;
· The change in the future operating assumption: -CZK 230 million driven by the decreased lapse rates assumption (-CZK
551 mill ion), partially offset by growth in unit expenses (+CZK 348 mill ion );
· The change in economic assumption: decrease in the yield curve increasing the TP by CZK 788 mill ion;
· New business: -CZK 621 mill ion.
The best estimate of l iabilities corresponds to the average of the present values of expected future cash flows generated fro m contracts
present in the Company portfolio, and therefore includes both a probabilistic assessment of their occurrence and an appropria te
assessment of the time value of money, obtained on the basis of risk-free interest rates as of 31 December 2020, as observed in the
market and officially communicated by EIOPA. This curve (derived for the main markets and from interbank swap rates) includes both an
adjustment to consider the residual default risk of these instruments (the so -called credit risk adjustment, amounting to -10bps for CZK)
and an adjustment to consider the excess return achieved in a risk-free manner by the assets covering the insurance liabilities (the so -
called volatil ity adjustment, equal to +10bps for CZK).
The method used to derive the best estimate of l iabilities is based on a direct approach that involves the projection and discounting of all
future expected incoming and outgoing cash flows for the duration of the policyholder’s l iabilities, in l ine with the contrac tual limits defined
by regulations (contract boundaries). In particular, the projections consider all future premiums and all outflows associated wi th both the
occurrence of insured events (e.g. claims and capital payable in the case of survival of the insured when the contract expires) and the
possible exercise of contractual options (for example surrender).
For portfolio of the Company as a whole, depending on the type and risk inherent in it, the expected future cash flows have been assessed
in a deterministic scenario (i.e. a certainty equivalent scenario) or as the mean value of a set of stochastic scenarios, to allow the calculation
of the cost of financial guarantees and contractual options. In the latter case, specific assumptions on future management decisions were
also implemented in the actuarial platforms (so-called management actions relating, e.g. to future profit sharing), and also the rational
behaviour of the insured (the so-called dynamic policyholder's behaviour, which can impact the propensity to exercise options such as the
surrender option).
The best estimate of l iabilities for the residual part of the portfolio (the majority are either matured or lapsed policies whose reserves are
stil l in the books just waiting to be paid out) was revaluated using a simplified approach and assumed equal to the IFRS reserves.
As shown in the above table, the best estimate of l iabilities gross o f reinsurance amounted to CZK 39.16 bil lion, and mainly consists of
insurance with profit participation, mostly including old savings products in run -off and the traditional part of hybrid products.
Only 1.50% of gross BEL is transferred via reinsurance outside the Company, and the reinsurance recoverables net of the counterparty
default adjustment related to these contracts amounted to CZK 0.59 bil l ion. The reinsurance recoverables were evaluated by me ans of
appropriate projections of the cash flows expected from reinsurance contracts and adjusted using the counterparty default adjustment to
take into account of the risk of default of the reinsurer.
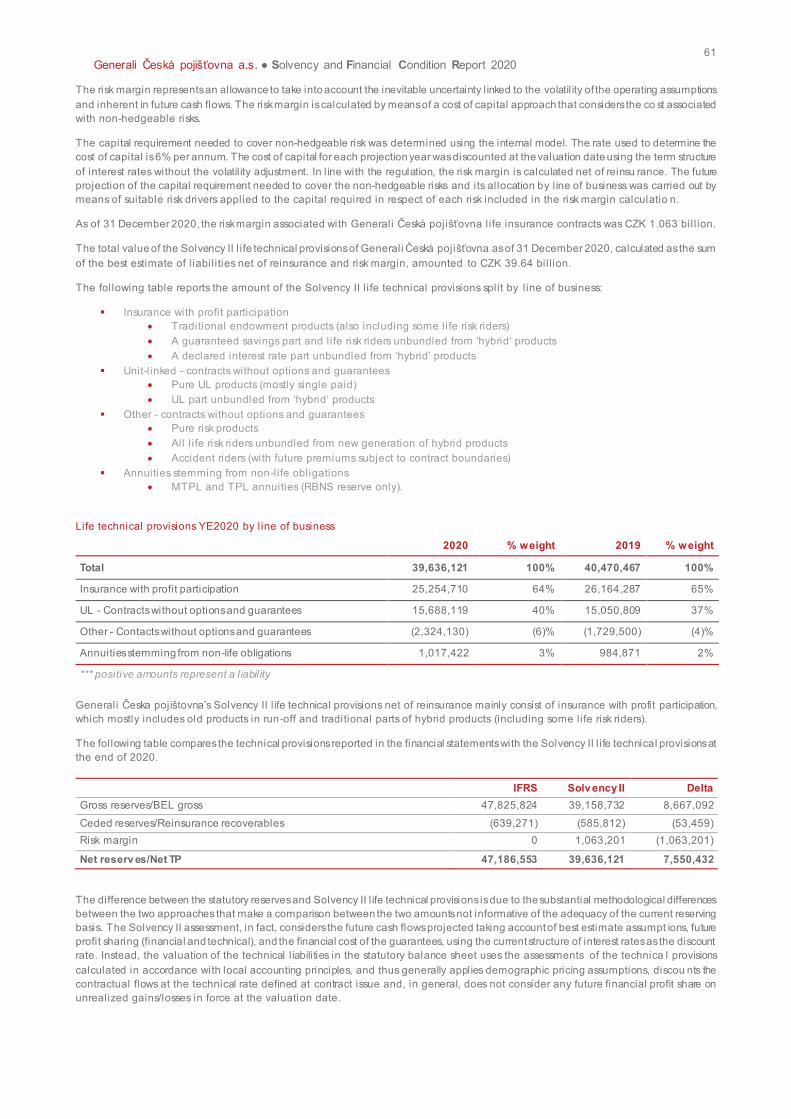
61
Generali Česká pojišťovna a.s. ● Solvency and Financial Condition Report 2020
The risk margin represents an allowance to take into account the inevitable uncertainty l inked to the volatil ity of the operating assumptions
and inherent in future cash flows. The risk margin is calculated by means of a cost of capital approach that considers the co st associated
with non-hedgeable risks.
The capital requirement needed to cover non-hedgeable risk was determined using the internal model. The rate used to determine the
cost of capital is 6% per annum. The cost of capital for each projection year was discounted at the valuation date using the term structure
of interest rates without the volatil ity adjustment. In l ine with the regulation, the risk margin is calculated net of reinsu rance. The future
projection of the capital requirement needed to cover the non-hedgeable risks and its allocation by line of business was carried out by
means of suitable risk drivers applied to the capital required in respect of each risk included in the risk margin calculatio n.
As of 31 December 2020, the risk margin associated with Generali Česká pojišťovna life insurance contracts was CZK 1.063 bil l ion.
The total value of the Solvency II l ife technical provisions of Generali Česká pojišťovna as of 31 December 2020, calculated as the sum
of the best estimate of l iabil ities net of reinsurance and risk margin, amounted to CZK 39.64 bil l ion.
The following table reports the amount of the Solvency II l ife technical provisions split by line of business:
§ Insurance with profit participation
· Traditional endowment products (also including some life risk riders)
· A guaranteed savings part and life risk riders unbundled from ‘hybrid‘ products
· A declared interest rate part unbundled from ‘hybrid’ products
§ Unit-l inked - contracts without options and guarantees
· Pure UL products (mostly single paid)
· UL part unbundled from ‘hybrid‘ products
§ Other - contracts without options and guarantees
· Pure risk products
· All l ife risk riders unbundled from new generation of hybrid products
· Accident riders (with future premiums subject to contract boundaries)
§ Annuities stemming from non-life obligations
· MTPL and TPL annuities (RBNS reserve only).
Life technical provisions YE2020 by line of business
2020 % weight 2019 % weight
Total 39,636,121 100% 40,470,467 100%
Insurance with profit participation 25,254,710 64% 26,164,287 65%
UL - Contracts without options and guarantees 15,688,119 40% 15,050,809 37%
Other - Contacts without options and guarantees (2,324,130) (6)% (1,729,500) (4)%
Annuities stemming from non-life obligations 1,017,422 3% 984,871 2%
*** positive amounts represent a liabil ity
Generali Česka pojištovna’s Solvency II l ife technical provisions net of reinsurance mainly consist of insurance with profit participation,
which mostly includes old products in run-off and traditional parts of hybrid products (including some life risk riders).
The following table compares the technical provisions reported in the financial statements with the Solvency II l ife technical provisions at
the end of 2020.
IFRS Solv ency II Delta
Gross reserves/BEL gross 47,825,824 39,158,732 8,667,092
Ceded reserves/Reinsurance recoverables (639,271) (585,812) (53,459)
Risk margin 0 1,063,201 (1,063,201)
Net reserv es/Net TP 47,186,553 39,636,121 7,550,432
The difference between the statutory reserves and Solvency II l ife technical provisions is due to the substantial methodological differences
between the two approaches that make a comparison between the two amounts not informative of the adequacy of the current reserving
basis. The Solvency II assessment, in fact, considers the future cash flows projected taking account of best estimate assumpt ions, future
profit sharing (financial and technical), and the financial cost of the guarantees, using the current structure of interest rates as the discount
rate. Instead, the valuation of the technical l iabilities in the statutory balance sheet uses the assessments of the technica l provisions
calculated in accordance with local accounting principles, and thus generally applies demographic pricing assumptions, discou nts the
contractual flows at the technical rate defined at contract issue and, in general, does not consider any future financial profit share on
unrealized gains/losses in force at the valuation date.
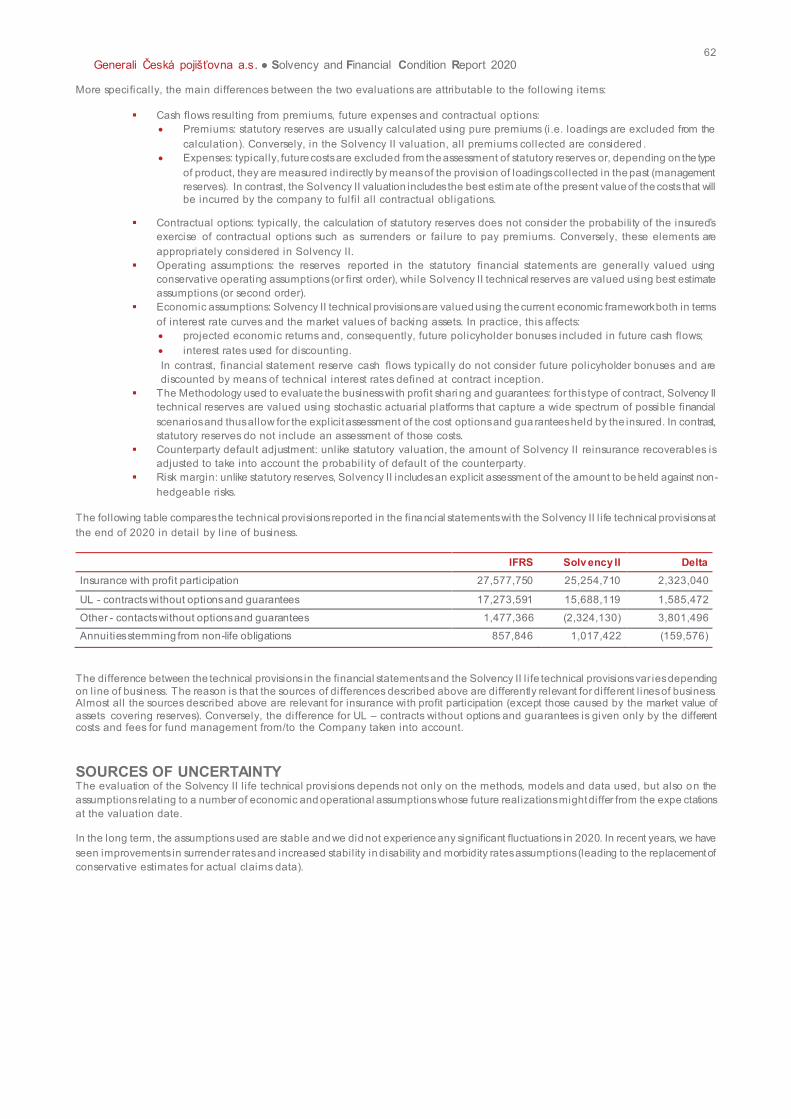
62
Generali Česká pojišťovna a.s. ● Solvency and Financial Condition Report 2020
More specifically, the main differences between the two evaluations are attributable to the following items:
§ Cash flows resulting from premiums, future expenses and contractual options:
· Premiums: statutory reserves are usually calculated using pure premiums (i.e. loadings are excluded from the
calculation). Conversely, in the Solvency II valuation, all premiums collected are considered .
· Expenses: typically, future costs are excluded from the assessment of statutory reserves or, depending on the type
of product, they are measured indirectly by means of the provision of loadings collected in the past (management
reserves). In contrast, the Solvency II valuation includes the best estim ate of the present value of the costs that will
be incurred by the company to fulfi l all contractual obligations.
§ Contractual options: typically, the calculation of statutory reserves does not consider the probability of the insured’s exercise of contractual options such as surrenders or failure to pay premiums. Conversely, these elements are
appropriately considered in Solvency II.
§ Operating assumptions: the reserves reported in the statutory financial statements are generally valued using
conservative operating assumptions (or first order), while Solvency II technical reserves are valued using best estimate
assumptions (or second order).
§ Economic assumptions: Solvency II technical provisions are valued using the current economic framework both in terms
of interest rate curves and the market values of backing assets. In practice, this affects:
· projected economic returns and, consequently, future policyholder bonuses included in future cash flows;
· interest rates used for discounting.
In contrast, financial statement reserve cash flows typically do not consider future policyholder bonuses and are
discounted by means of technical interest rates defined at contract inception.
§ The Methodology used to evaluate the business with profit shari ng and guarantees: for this type of contract, Solvency II
technical reserves are valued using stochastic actuarial platforms that capture a wide spectrum of possible financial
scenarios and thus allow for the explicit assessment of the cost options and gua rantees held by the insured. In contrast,
statutory reserves do not include an assessment of those costs.
§ Counterparty default adjustment: unlike statutory valuation, the amount of Solvency II reinsurance recoverables is
adjusted to take into account the probability of default of the counterparty.
§ Risk margin: unlike statutory reserves, Solvency II includes an explicit assessment of the amount to be held against non-
hedgeable risks.
The following table compares the technical provisions reported in the financial statements with the Solvency II l ife technical provisions at
the end of 2020 in detail by line of business.
IFRS Solv ency II Delta
Insurance with profit participation 27,577,750 25,254,710 2,323,040
UL - contracts without options and guarantees 17,273,591 15,688,119 1,585,472
Other - contacts without options and guarantees 1,477,366 (2,324,130) 3,801,496
Annuities stemming from non-life obligations 857,846 1,017,422 (159,576)
The difference between the technical provisions in the financial statements and the Solvency II l ife technical provisions var ies depending
on line of business. The reason is that the sources of differences described above are differently relevant for different l ines of business. Almost all the sources described above are relevant for insurance with profit participation (except those caused by the market value of
assets covering reserves). Conversely, the difference for UL – contracts without options and guarantees is given only by the different costs and fees for fund management from/to the Company taken into account.
SOURCES OF UNCERTAINTY The evaluation of the Solvency II l ife technical provisions depends not only on the methods, models and data used, but also on the
assumptions relating to a number of economic and operational assumptions whose future realizations might differ from the expe ctations
at the valuation date.
In the long term, the assumptions used are stable and we did not experience any significant fluctuations in 2020. In recent years, we have
seen improvements in surrender rates and increased stability in disability and morbidity rates assumptions (leading to the replacement of
conservative estimates for actual claims data).
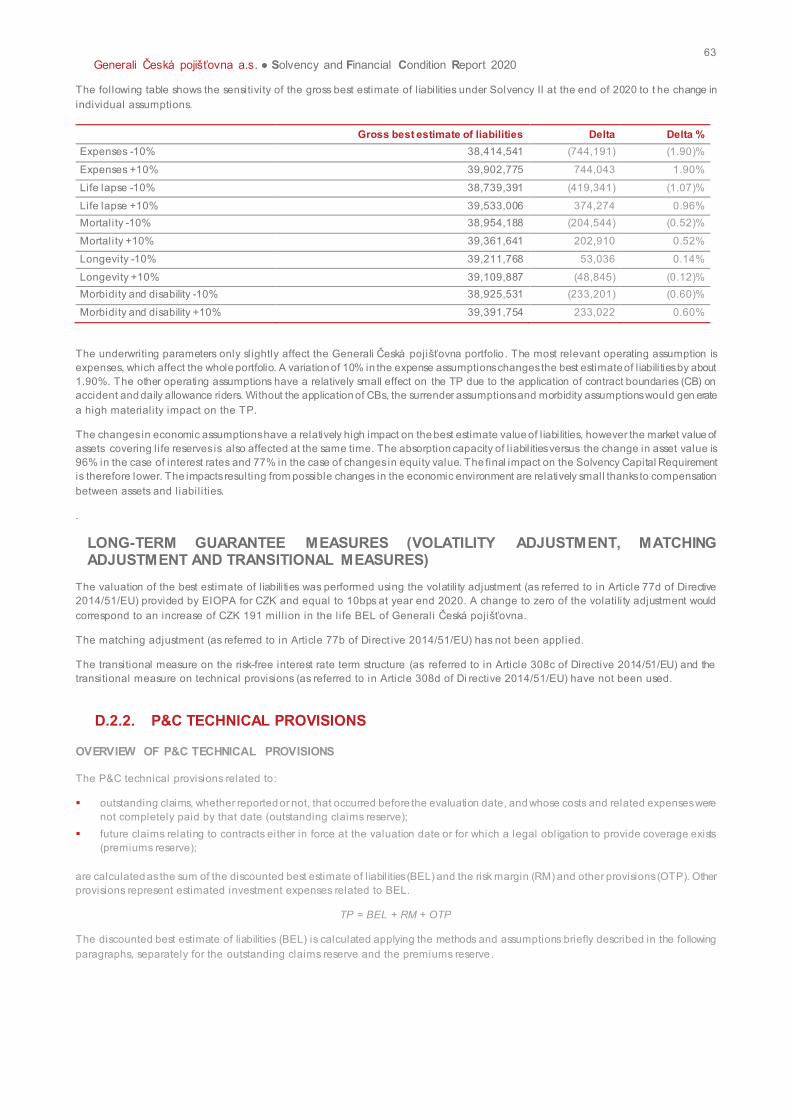
63
Generali Česká pojišťovna a.s. ● Solvency and Financial Condition Report 2020
The following table shows the sensitivity of the gross best estimate of l iabilities under Solvency II at the end of 2020 to t he change in
individual assumptions.
Gross best estimate of liabilities Delta Delta %
Expenses -10% 38,414,541 (744,191) (1.90)%
Expenses +10% 39,902,775 744,043 1.90%
Life lapse -10% 38,739,391 (419,341) (1.07)%
Life lapse +10% 39,533,006 374,274 0.96%
Mortality -10% 38,954,188 (204,544) (0.52)%
Mortality +10% 39,361,641 202,910 0.52%
Longevity -10% 39,211,768 53,036 0.14%
Longevity +10% 39,109,887 (48,845) (0.12)%
Morbidity and disability -10% 38,925,531 (233,201) (0.60)%
Morbidity and disability +10% 39,391,754 233,022 0.60%
The underwriting parameters only slightly affect the Generali Česká pojišťovna portfolio . The most relevant operating assumption is
expenses, which affect the whole portfolio. A variation of 10% in the expense assumptions changes the best estimate of l iabilities by about
1.90%. The other operating assumptions have a relatively small effect on the TP due to the application of contract boundaries (CB) on
accident and daily allowance riders. Without the application of CBs, the surrender assumptions and morbidity assumptions would gen erate
a high materiality impact on the TP.
The changes in economic assumptions have a relatively high impact on the best estimate value of l iabilities, however the market value of
assets covering life reserves is also affected at the same time. The absorption capacity of l iabil ities versus the change in asset value is
96% in the case of interest rates and 77% in the case of changes in equity value. The final impact on the Solvency Capital Requirement
is therefore lower. The impacts resulting from possible changes in the economic environment are relatively small thanks to compensation
between assets and liabil ities.
.
LONG-TERM GUARANTEE MEASURES (VOLATILITY ADJUSTMENT, MATCHING ADJUSTMENT AND TRANSITIONAL MEASURES)
The valuation of the best estimate of l iabilities was performed using the volatility adjustment (as referred to in Article 77d of Directive
2014/51/EU) provided by EIOPA for CZK and equal to 10bps at year end 2020. A change to zero of the volatility adjustment would
correspond to an increase of CZK 191 mill ion in the l ife BEL of Generali Česká pojišťovna.
The matching adjustment (as referred to in Article 77b of Direct ive 2014/51/EU) has not been applied.
The transitional measure on the risk-free interest rate term structure (as referred to in Article 308c of Directive 2014/51/EU) and the
transitional measure on technical provisions (as referred to in Article 308d of Di rective 2014/51/EU) have not been used.
D.2.2. P&C TECHNICAL PROVISIONS
OVERVIEW OF P&C TECHNICAL PROVISIONS
The P&C technical provisions related to:
§ outstanding claims, whether reported or not, that occurred before the evaluation date, and whose costs and related expenses were
not completely paid by that date (outstanding claims reserve);
§ future claims relating to contracts either in force at the valuation date or for which a legal obligation to provide coverage exists
(premiums reserve);
are calculated as the sum of the discounted best estimate of l iabil ities (BEL) and the risk margin (RM) and other provisions (OTP). Other
provisions represent estimated investment expenses related to BEL.
TP = BEL + RM + OTP
The discounted best estimate of liabilities (BEL) is calculated applying the methods and assumptions briefly described in the following
paragraphs, separately for the outstanding claims reserve and the premiums reserve.
64
Generali Česká pojišťovna a.s. ● Solvency and Financial Condition Report 2020
Outstanding claims reserv e
The approach to derive the BEL for the outstanding claims reserve depends on the possibil ity of applying actuarial methods.
§ The BEL of the un-modelled and semi-modelled business (a l ine of business or part of a l ine of business which, for various reasons,
e.g. a lack of adequate, appropriate and complete data, or the inhomogeneity of the business, means it has not been analysed using
actuarial methods) has been calculated using IFRS figures. Un-modelled and semi-modelled business represents approximately
11.4% of IFRS provisions, and mainly contains provisions for bonuses and the accepted reinsurance business.
§ The BEL of the modelled business (business which, thanks to the availability of adequate, appropriate and complete data, has been
analysed in detail using actuarial methods) has been assessed using the following steps:
Claims and grouping
To perform an appropriate actuarial analysis of the technical provisions and to carry out ultimate cost projections, historical claims data
on a paid and incurred basis (gross of contractual and facultative reinsurance) have been taken into account. The development data used
for these purposes meet the appropriate quality attributes of proportionality, materiality and completeness.
Each portfolio is selected to enable the identification of homogeneous groups of risks, types of coverage, and other specificities such as
the length and the variability of the claims run-off. The minimum level of granularity adopted considers the split between types (direct
business, proportional accepted business, non-proportional accepted business), and in each category identifies twelve lines of business
(workers’ compensation; medical expenses; income protection; motor vehicle liability; other motor; marine, aviation and transport; fire and
other damage to property; general l iability; credit and suretyship; legal expenses; assistance; miscellaneous financial loss) . Where
necessary, a more granular segmentation of the portfolio is used, especially in the case of property, l iability and motor insurance. Where
reasonable, claims have been split depending on their size and significance into attritional, large and extremely large claim s, and the
analysis has been done separately for each claim type. Annuity claims are also treated separately.
Starting from 2018, outstanding claims reserves coming from accident riders sold as part of l ife insurance contracts are revaluated in non-
life as part of the Solvency II LoB income protection using the standard non-life actuarial methods described below.
The new portfolios acquired through the business combination transaction last year have been grouped together with similar original
portfolios of the Company. The internal model was used for the risk evaluation of technical reserves arising from the portfolios.
Expenses
The reserve for loss adjustment expenses (LAE) consists of two parts. The reserve for expenses directly arising from a particular
compensation case (allocated loss adjustment expenses (ALAE)) is treated as part of claims costs. The reserve for expenses not directly
arising from a particular compensation case (unallocated loss adjustment expenses (ULAE)) is related to the whole package of services
offered by an insurance company and is not automatically associated with a specific claim. A simplified approach is used to d erive the
ULAE reserve that is assumed to be proportional to the UBEL (undiscounted best estimate of l iabilities) of the line of business
(i.e., !"#$ %&'&%(& = ) ∙ !+$"), where R is estimated based on recent experience. In the case of the newly acquired portfolios, all the
loss adjustment expenses were considered as unallocated in the LAE UBEL calculation.
Inflation
Historical data on claims paid and outstanding include the outcomes of observed inflation, in its two exogenous and endogenous
components. The inflation environment in the Czech Republic is considered stable enough to project UBEL from historical data, which
means that inflation is already embedded in the projections.
Actuarial methods
The actuarial methods used for projecting the experienced history of claims and provisions are the ones implemented in the Group
reserving tool (ResQ) and described in the Generali Group methodology paper. The following methods have been considered for attritional
and large claims in particular:
§ The link ratio method on paid (or development factor models - DFM) is a generalization of the chain ladder method, based on an
analysis of cumulative payments over years. This class of methods is based on the hypothesis that the settlement process is stable
across origin periods.
§ The link ratio method on incurred technically works like the preceding one but is based on incurred developments, i.e. the sum of
cumulative paid and outstanding amounts.
§ The Bornhuetter-Ferguson method on paid or incurred combines the projected ultimate (obtained e.g. by means of a development
factor method) with an alternative (a priori) value using a weighted credibil ity approach .
§ The Cape Cod method on paid or incurred which, similarly to the Bornhuetter-Fergusson method, combines already emerged claims
with expected claims to be paid or reported late, is based on assumptions derived from the emerged proportion of claims.
§ The frequency severity method combines projections of the expected number of claims and expected average claims, where ultimate
claims are the product of these two items.
§ The incremental loss ratio method on paid or incurred, also known as the additive method, expects stable development in the
contribution to the loss ratio across origin periods.
65
Generali Česká pojišťovna a.s. ● Solvency and Financial Condition Report 2020
An analysis using more than one of the methods listed above was performed to confirm the results.
The best estimate assessment for annuities stemming from P&C contracts is performed separately for a nnuities in payment (i.e. RBNS –
reported but not settled - annuities), treated with l ife techniques, and for annuities that could emerge in the future from non-annuity claims
(i.e. IBNR – incurred but not reported – annuities). The BEL for the IBNR annuities is assessed using the frequency/severity approach.
To obtain the final gross UBEL, all excluded or separately evaluated items (e.g. extremely large claims, un -/semi-modelled parts,
expenses) are added to the ultimate claims cost.
Net evaluation
In general, less risky portfolios are covered by a 40% - and more risky portfolios by a 70% - quota share. In addition to this, l ines of
business exposed to the risk of large single claims, such as MTPL or large risk portfolios in property and liability in surance, are covered
by XL treaties. The reinsurance share on IFRS claims provisions is mostly represented by a quota share, hence a feasible simp lification
is used for the net UBEL evaluation. For each homogeneous group of risks, UBEL net of reinsurance i s calculated adopting the following
simplified approach:
!+$",-./0 = !+$"12344
/0 ⋅ %78
where %NG indicates the percentage of the IFRS net outstanding claims reserve to the IFRS gross outstanding claims reserve.
The valuation of the best estimate net of reinsurance is performed taking into account an adjustment for expected losses due to default
of the reinsurance counterparties (counterparty default adjustment).
Premiums reserv e
For contracts with premiums already written, the UBEL of the premium provisions is defined as the sum of the following two co mponents
(considering gross and net inputs to obtain gross and net results):
§ A claims-related component: the amount of the unearned premium provisions derived from IFRS is multiplied by a specific measure
of the current year loss ratio, aiming to remove the effect of the adequacy of the estimated UBEL of the outstanding claims reserve
(OCR).
§ An administration-expenses related component: the amount of the unearned premium provisions derived from IFRS is multiplied by
a specific measure of the administration expense ratio to represent the expected part due to expenses stemming from existing
contracts.
For un-incepted (instalments included) and multi-year contracts, the UBEL of the premium reserve is defined as the sum of the following
cash flows:
§ Cash inflows arising from future premiums;
§ Cash outflows arising from future claims, net of salvage and subrogation, including allocated and unallocated claims adjustment
expenses;
§ Cash outflows arising from administration expenses in respect of claims occurring after the valuation date as well as costs ar ising
from ongoing administration of in-force policies and acquisition costs, insofar as they are related to the considered portfolio.
Similarly to the outstanding claims reserve, the net premiums reserve is also adjusted to take into account the default risk of the
counterparties.
Discounting
The discounted best estimate of l iabilities (BEL), related to both the outstanding claims reserve and premiums reserve, is derived by
discounting the expected future payments of the UBEL by the reference basic risk-free rate curve incorporating volatil ity adjustment.
Other reserv es
Other reserves are created to cover expected investment expenses related to assets covering the BEL.
Risk margin
The risk margin together with the OTP is added to the BEL to derive a market -consistent l iabilities value. This captures the economic
value of non-hedgeable risks (reserving, pricing, catastrophe, counterparty default and operational) to ensure that the technical provisions
value is equivalent to the amount an insurance company would be expected to require to accept and meet insurance obligations. The risk
margin is calculated with a cost of capital (CoC) approach at l ine of business level taking the diversification benefits between risk types
and lines of businesses into account.
Non-hedgeable risks evaluated using the partial internal model related to original portfolios as well as non-hedgeable risks evaluated
through the standard formula related to newly acquired portfolios are used as inputs for the calculation of the risk margin.
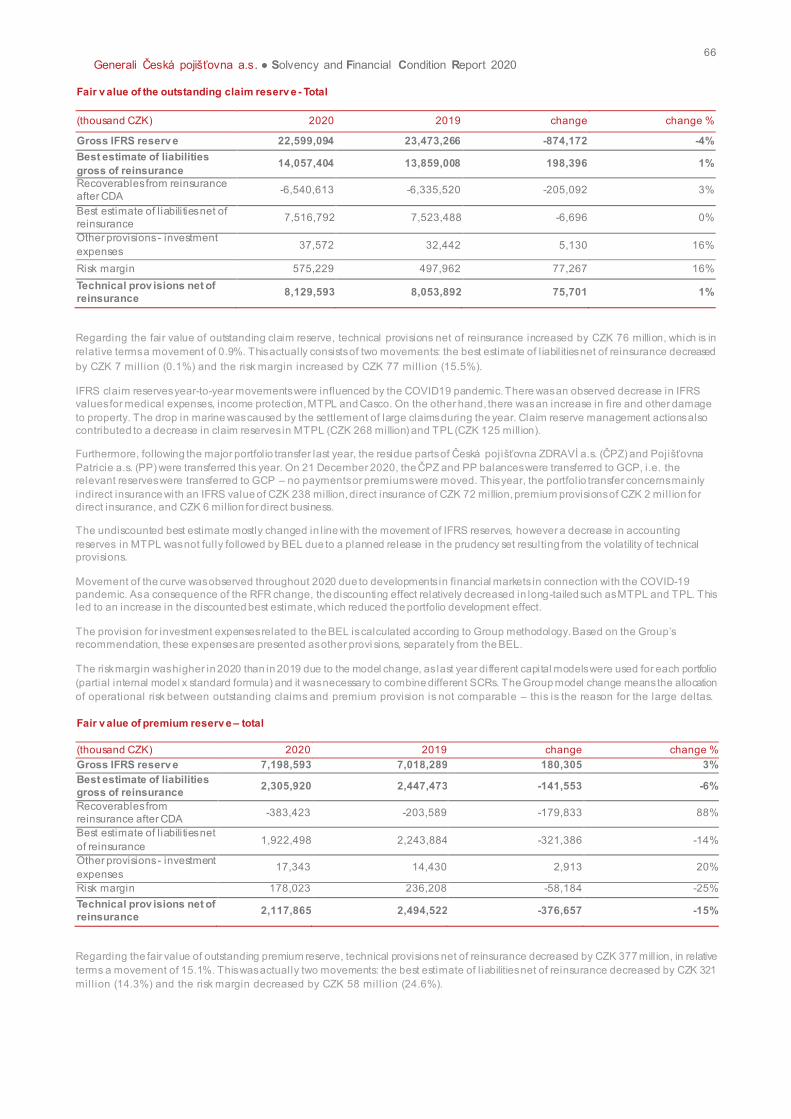
66
Generali Česká pojišťovna a.s. ● Solvency and Financial Condition Report 2020
Fair v alue of the outstanding claim reserv e - Total
(thousand CZK) 2020 2019 change change %
Gross IFRS reserv e 22,599,094 23,473,266 -874,172 -4%
Best estimate of liabilities
gross of reinsurance 14,057,404 13,859,008 198,396 1%
Recoverables from reinsurance
after CDA -6,540,613 -6,335,520 -205,092 3%
Best estimate of l iabilities net of
reinsurance 7,516,792 7,523,488 -6,696 0%
Other provisions - investment
expenses 37,572 32,442 5,130 16%
Risk margin 575,229 497,962 77,267 16%
Technical prov isions net of
reinsurance 8,129,593 8,053,892 75,701 1%
Regarding the fair value of outstanding claim reserve, technical provisions net of reinsurance increased by CZK 76 million, which is in
relative terms a movement of 0.9%. This actually consists of two movements: the best estimate of l iabil ities net of reinsurance decreased
by CZK 7 mill ion (0.1%) and the risk margin increased by CZK 77 mill ion (15.5%).
IFRS claim reserves year-to-year movements were influenced by the COVID19 pandemic. There was an observed decrease in IFRS
values for medical expenses, income protection, MTPL and Casco. On the other hand, there was an increase in fire and other damage
to property. The drop in marine was caused by the settlement of large claims during the year. Claim reserve management actions also
contributed to a decrease in claim reserves in MTPL (CZK 268 million) and TPL (CZK 125 mill ion).
Furthermore, following the major portfolio transfer last year, the residue parts of Česká pojišťovna ZDRAVÍ a.s. (ČPZ) and Pojišťovna Patricie a.s. (PP) were transferred this year. On 21 December 2020, the ČPZ and PP balances were transferred to GCP, i.e. the
relevant reserves were transferred to GCP – no payments or premiums were moved. This year, the portfolio transfer concerns mainly
indirect insurance with an IFRS value of CZK 238 million, direct insurance of CZK 72 million, premium provisions of CZK 2 mill ion for
direct insurance, and CZK 6 million for direct business.
The undiscounted best estimate mostly changed in l ine with the movement of IFRS reserves, however a decrease in accounting
reserves in MTPL was not fully followed by BEL due to a planned release in the prudency set resulting from the volatility of technical
provisions.
Movement of the curve was observed throughout 2020 due to developments in financial markets in connection with the COVID-19
pandemic. As a consequence of the RFR change, the discounting effect relatively decreased in long-tailed such as MTPL and TPL. This
led to an increase in the discounted best estimate, which reduced the portfolio development effect.
The provision for investment expenses related to the BEL is calculated according to Group methodology. Based on the Group’s recommendation, these expenses are presented as other provi sions, separately from the BEL.
The risk margin was higher in 2020 than in 2019 due to the model change, as last year different capital models were used for each portfolio
(partial internal model x standard formula) and it was necessary to combine different SCRs. The Group model change means the allocation
of operational risk between outstanding claims and premium provision is not comparable – this is the reason for the large deltas.
Fair v alue of premium reserv e – total
(thousand CZK) 2020 2019 change change %
Gross IFRS reserv e 7,198,593 7,018,289 180,305 3%
Best estimate of liabilities
gross of reinsurance 2,305,920 2,447,473 -141,553 -6%
Recoverables from
reinsurance after CDA -383,423 -203,589 -179,833 88%
Best estimate of l iabilities net
of reinsurance 1,922,498 2,243,884 -321,386 -14%
Other provisions - investment
expenses 17,343 14,430 2,913 20%
Risk margin 178,023 236,208 -58,184 -25%
Technical prov isions net of
reinsurance 2,117,865 2,494,522 -376,657 -15%
Regarding the fair value of outstanding premium reserve, technical provisions net of reinsurance decreased by CZK 377 mill ion, in relative
terms a movement of 15.1%. This was actually two movements: the best estimate of l iabilities net of reinsurance decreased by CZK 321
mil l ion (14.3%) and the risk margin decreased by CZK 58 mill ion (24.6%).
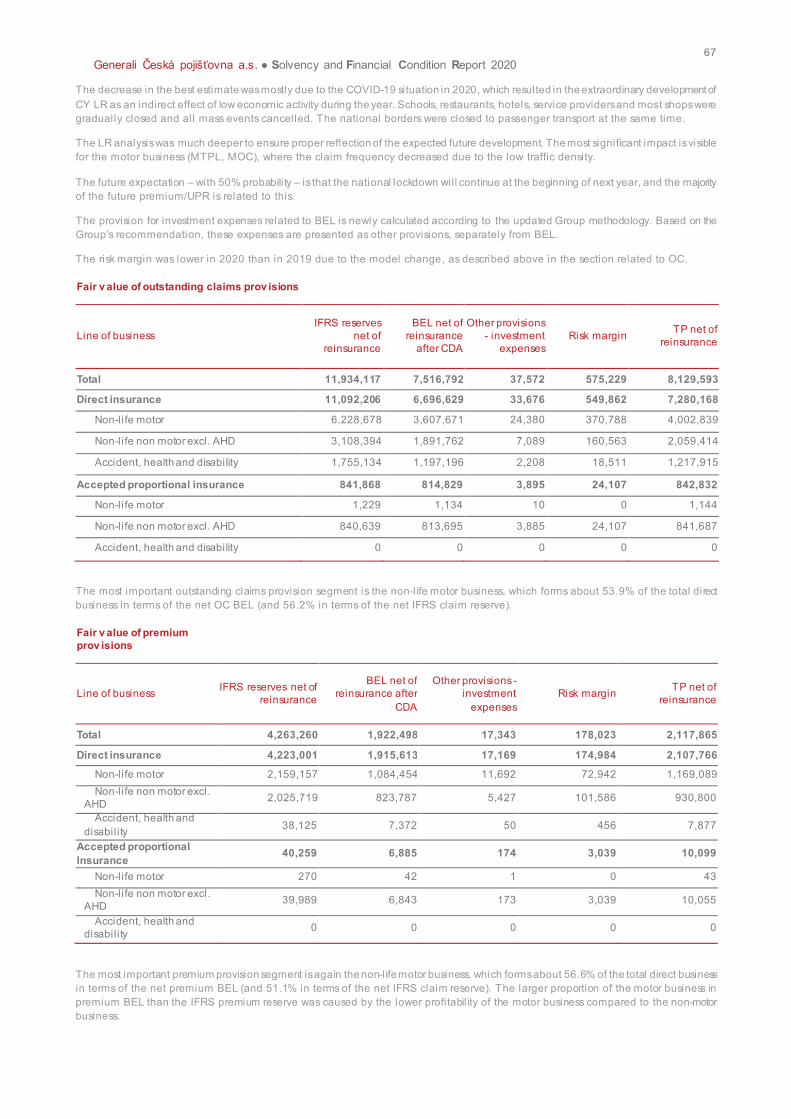
67
Generali Česká pojišťovna a.s. ● Solvency and Financial Condition Report 2020
The decrease in the best estimate was mostly due to the COVID-19 situation in 2020, which resulted in the extraordinary development of
CY LR as an indirect effect of low economic activity during the year. Schools, restaurants, hotels, service providers and most shops were
gradually closed and all mass events cancelled. The national borders were closed to passenger transport at the same time.
The LR analysis was much deeper to ensure proper reflection of the expected future development. The most significant impact is visible
for the motor business (MTPL, MOC), where the claim frequency decreased due to the low traffic density.
The future expectation – with 50% probability – is that the national lockdown will continue at the beginning of next year, and the majority
of the future premium/UPR is related to this.
The provision for investment expenses related to BEL is newly calculated according to the updated Group methodology. Based on the
Group’s recommendation, these expenses are presented as other provisions, separately from BEL.
The risk margin was lower in 2020 than in 2019 due to the model change, as described above in the section related to OC.
Fair v alue of outstanding claims prov isions
Line of business
IFRS reserves
net of
reinsurance
BEL net of
reinsurance
after CDA
Other provisions
- investment
expenses
Risk margin TP net of
reinsurance
Total 11,934,117 7,516,792 37,572 575,229 8,129,593
Direct insurance 11,092,206 6,696,629 33,676 549,862 7,280,168
Non-life motor 6,228,678 3,607,671 24,380 370,788 4,002,839
Non-life non motor excl. AHD 3,108,394 1,891,762 7,089 160,563 2,059,414
Accident, health and disability 1,755,134 1,197,196 2,208 18,511 1,217,915
Accepted proportional insurance 841,868 814,829 3,895 24,107 842,832
Non-life motor 1,229 1,134 10 0 1,144
Non-life non motor excl. AHD 840,639 813,695 3,885 24,107 841,687
Accident, health and disability 0 0 0 0 0
The most important outstanding claims provision segment is the non-life motor business, which forms about 53.9% of the total direct
business in terms of the net OC BEL (and 56.2% in terms of the net IFRS claim reserve).
Fair v alue of premium
prov isions
Line of business IFRS reserves net of
reinsurance
BEL net of
reinsurance after
CDA
Other provisions -
investment
expenses
Risk margin TP net of
reinsurance
Total 4,263,260 1,922,498 17,343 178,023 2,117,865
Direct insurance 4,223,001 1,915,613 17,169 174,984 2,107,766
Non-life motor 2,159,157 1,084,454 11,692 72,942 1,169,089
Non-life non motor excl.
AHD 2,025,719 823,787 5,427 101,586 930,800
Accident, health and
disability 38,125 7,372 50 456 7,877
Accepted proportional
Insurance 40,259 6,885 174 3,039 10,099
Non-life motor 270 42 1 0 43
Non-life non motor excl.
AHD 39,989 6,843 173 3,039 10,055
Accident, health and
disability 0 0 0 0 0
The most important premium provision segment is again the non-life motor business, which forms about 56.6% of the total direct business
in terms of the net premium BEL (and 51.1% in terms of the net IFRS claim reserve). The larger proportion of the motor business in
premium BEL than the IFRS premium reserve was caused by the lower profitabil ity of the motor business compared to the non-motor
business.
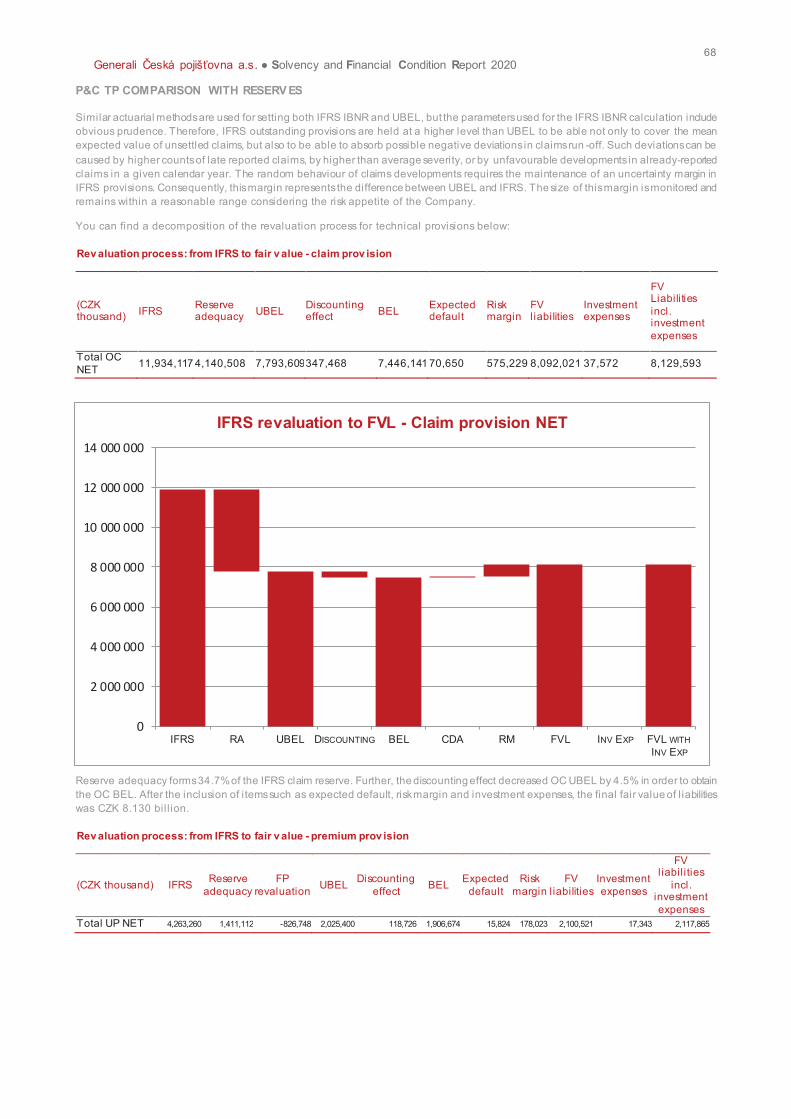
68
Generali Česká pojišťovna a.s. ● Solvency and Financial Condition Report 2020
P&C TP COMPARISON WITH RESERV ES
Similar actuarial methods are used for setting both IFRS IBNR and UBEL, but the parameters used for the IFRS IBNR calculation include
obvious prudence. Therefore, IFRS outstanding provisions are held at a higher level than UBEL to be able not only to cover the mean
expected value of unsettled claims, but also to be able to absorb possible negative deviations in claims run -off. Such deviations can be
caused by higher counts of late reported claims, by higher than average severity, or by unfavourable developments in already-reported
claims in a given calendar year. The random behaviour of claims developments requires the maintenance of an uncertainty margin in
IFRS provisions. Consequently, this margin represents the difference between UBEL and IFRS. The size of this margin is monitored and
remains within a reasonable range considering the risk appetite of the Company.
You can find a decomposition of the revaluation process for technical provisions below:
Rev aluation process: from IFRS to fair v alue - claim prov ision
(CZK thousand)
IFRS Reserve adequacy
UBEL Discounting effect
BEL Expected default
Risk margin
FV l iabilities
Investment expenses
FV Liabilities
incl. investment
expenses
Total OC
NET 11,934,117 4,140,508 7,793,609 347,468 7,446,141 70,650 575,229 8,092,021 37,572 8,129,593
Reserve adequacy forms 34.7% of the IFRS claim reserve. Further, the discounting effect decreased OC UBEL by 4.5% in order to obtain
the OC BEL. After the inclusion of items such as expected default, risk margin and investment expenses, the final fair value of l iabilities
was CZK 8.130 bil l ion.
Rev aluation process: from IFRS to fair v alue - premium prov ision
(CZK thousand) IFRS Reserve
adequacy
FP
revaluation UBEL
Discounting
effect BEL
Expected
default
Risk
margin
FV
l iabilities
Investment
expenses
FV l iabil ities
incl. investment
expenses
Total UP NET 4,263,260 1,411,112 -826,748 2,025,400 118,726 1,906,674 15,824 178,023 2,100,521 17,343 2,117,865
0
2 000 000
4 000 000
6 000 000
8 000 000
10 000 000
12 000 000
14 000 000
IFRS RA UBEL DISCOUNTING BEL CDA RM FVL INV EXP FVL WITH
INV EXP
IFRS revaluation to FVL - Claim provision NET
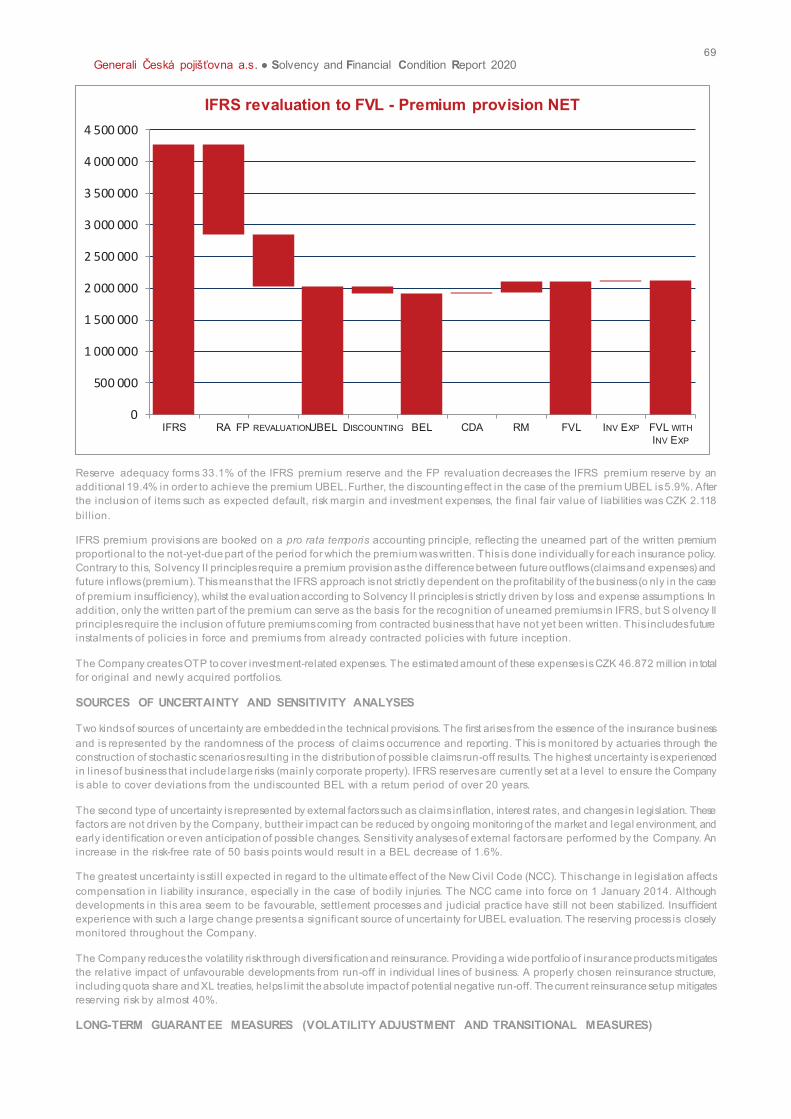
69
Generali Česká pojišťovna a.s. ● Solvency and Financial Condition Report 2020
Reserve adequacy forms 33.1% of the IFRS premium reserve and the FP revaluation decreases the IFRS premium reserve by an
additional 19.4% in order to achieve the premium UBEL. Further, the discounting effect in the case of the premium UBEL is 5.9%. After
the inclusion of items such as expected default, risk margin and investment expenses, the final fair value of l iabilities was CZK 2.118
bil l ion.
IFRS premium provisions are booked on a pro rata temporis accounting principle, reflecting the unearned part of the written premium
proportional to the not-yet-due part of the period for which the premium was written. This is done individually for each insurance policy.
Contrary to this, Solvency II principles require a premium provision as the difference between future outflows (claims and expenses) and
future inflows (premium). This means that the IFRS approach is not strictly dependent on the profitabil ity of the business (o nly in the case
of premium insufficiency), whilst the evaluation according to Solvency II principles is strictly driven by loss and expense assumptions. In
addition, only the written part of the premium can serve as the basis for the recognition of unearned premiums in IFRS, but S olvency II
principles require the inclusion of future premiums coming from contracted business that have not yet been written. This includes future
instalments of policies in force and premiums from already contracted policies with future inception.
The Company creates OTP to cover investment-related expenses. The estimated amount of these expenses is CZK 46.872 mill ion in total
for original and newly acquired portfolios.
SOURCES OF UNCERTAINTY AND SENSITIVITY ANALYSES
Two kinds of sources of uncertainty are embedded in the technical provisions. The first arises from the essence of the insurance business
and is represented by the randomness of the process of claims occurrence and reporting. This is monitored by actuaries through the
construction of stochastic scenarios resulting in the distribution of possible claims run-off results. The highest uncertainty is experienced
in l ines of business that include large risks (mainly corporate property). IFRS reserves are currently set at a level to ensure the Company
is able to cover deviations from the undiscounted BEL with a return period of over 20 years.
The second type of uncertainty is represented by external factors such as claims inflation, interest rates, and changes in legislation. These
factors are not driven by the Company, but their impact can be reduced by ongoing monitoring of the market and legal environment, and
early identification or even anticipation of possible changes. Sensitivity analyses of external factors are performed by the Company. An
increase in the risk-free rate of 50 basis points would result in a BEL decrease of 1.6%.
The greatest uncertainty is sti l l expected in regard to the ultimate effect of the New Civil Code (NCC). This change in legislation affects
compensation in l iability insurance, especially in the case of bodily injuries. The NCC came into force on 1 January 2014. Although
developments in this area seem to be favourable, settlement processes and judicial practice have still not been stabilized. Insufficient
experience with such a large change presents a significant source of uncertainty for UBEL evaluation. The reserving process is closely
monitored throughout the Company.
The Company reduces the volatility risk through diversification and reinsurance. Providing a wide portfolio of insurance products mitigates
the relative impact of unfavourable developments from run-off in individual l ines of business. A properly chosen reinsurance structure,
including quota share and XL treaties, helps limit the absolute impact of potential negative run-off. The current reinsurance setup mitigates
reserving risk by almost 40%.
LONG-TERM GUARANTEE MEASURES (VOLATILITY ADJUSTMENT AND TRANSITIONAL MEASURES)
0
500 000
1 000 000
1 500 000
2 000 000
2 500 000
3 000 000
3 500 000
4 000 000
4 500 000
IFRS RA FP REVALUATIONUBEL DISCOUNTING BEL CDA RM FVL INV EXP FVL WITH
INV EXP
IFRS revaluation to FVL - Premium provision NET
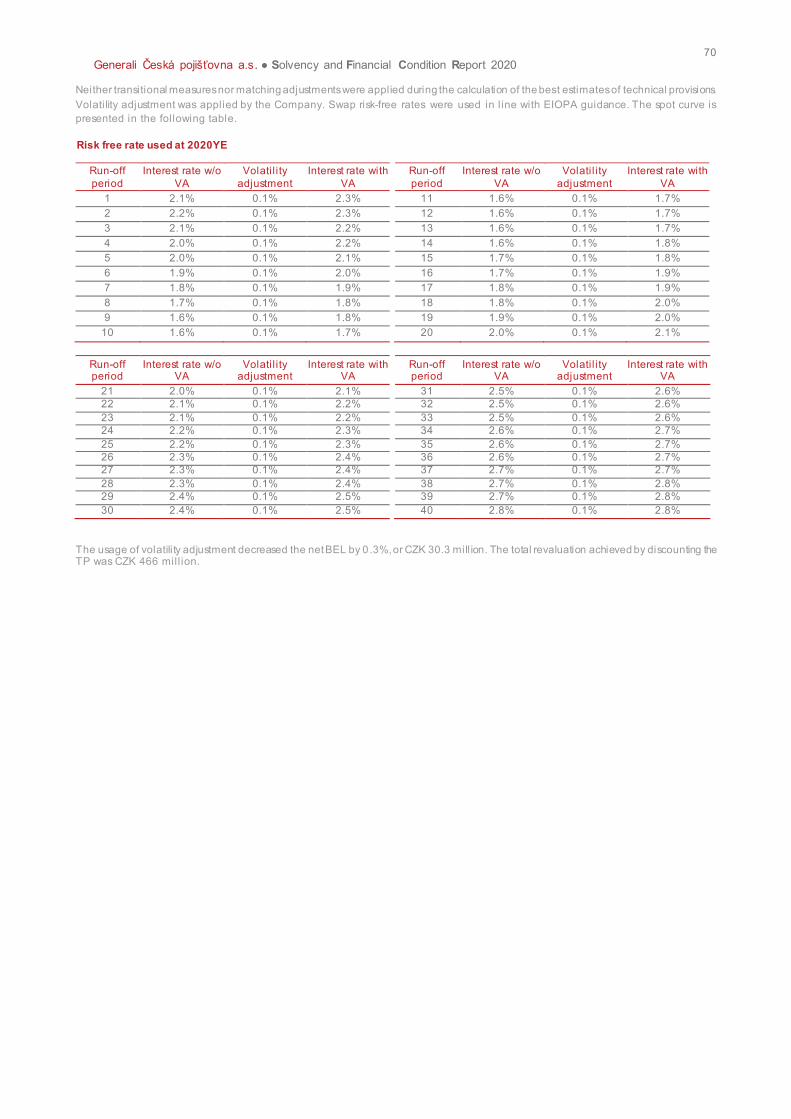
70
Generali Česká pojišťovna a.s. ● Solvency and Financial Condition Report 2020
Neither transitional measures nor matching adjustments were applied during the calculation of the best estimates of technical provisions.
Volatility adjustment was applied by the Company. Swap risk-free rates were used in l ine with EIOPA guidance. The spot curve is
presented in the following table.
Risk free rate used at 2020YE
Run-off
period
Interest rate w/o
VA
Volatil ity
adjustment
Interest rate with
VA
Run-off
period
Interest rate w/o
VA
Volatil ity
adjustment
Interest rate with
VA
1 2.1% 0.1% 2.3% 11 1.6% 0.1% 1.7%
2 2.2% 0.1% 2.3% 12 1.6% 0.1% 1.7%
3 2.1% 0.1% 2.2% 13 1.6% 0.1% 1.7%
4 2.0% 0.1% 2.2% 14 1.6% 0.1% 1.8%
5 2.0% 0.1% 2.1% 15 1.7% 0.1% 1.8%
6 1.9% 0.1% 2.0% 16 1.7% 0.1% 1.9%
7 1.8% 0.1% 1.9% 17 1.8% 0.1% 1.9%
8 1.7% 0.1% 1.8% 18 1.8% 0.1% 2.0%
9 1.6% 0.1% 1.8% 19 1.9% 0.1% 2.0%
10 1.6% 0.1% 1.7% 20 2.0% 0.1% 2.1%
Run-off period
Interest rate w/o VA
Volatil ity adjustment
Interest rate with VA
Run-off period
Interest rate w/o VA
Volatil ity adjustment
Interest rate with VA
21 2.0% 0.1% 2.1% 31 2.5% 0.1% 2.6%
22 2.1% 0.1% 2.2% 32 2.5% 0.1% 2.6%
23 2.1% 0.1% 2.2% 33 2.5% 0.1% 2.6%
24 2.2% 0.1% 2.3% 34 2.6% 0.1% 2.7%
25 2.2% 0.1% 2.3% 35 2.6% 0.1% 2.7%
26 2.3% 0.1% 2.4% 36 2.6% 0.1% 2.7%
27 2.3% 0.1% 2.4% 37 2.7% 0.1% 2.7%
28 2.3% 0.1% 2.4% 38 2.7% 0.1% 2.8%
29 2.4% 0.1% 2.5% 39 2.7% 0.1% 2.8%
30 2.4% 0.1% 2.5% 40 2.8% 0.1% 2.8%
The usage of volatility adjustment decreased the net BEL by 0 .3%, or CZK 30.3 mill ion. The total revaluation achieved by discounting the TP was CZK 466 mill ion.
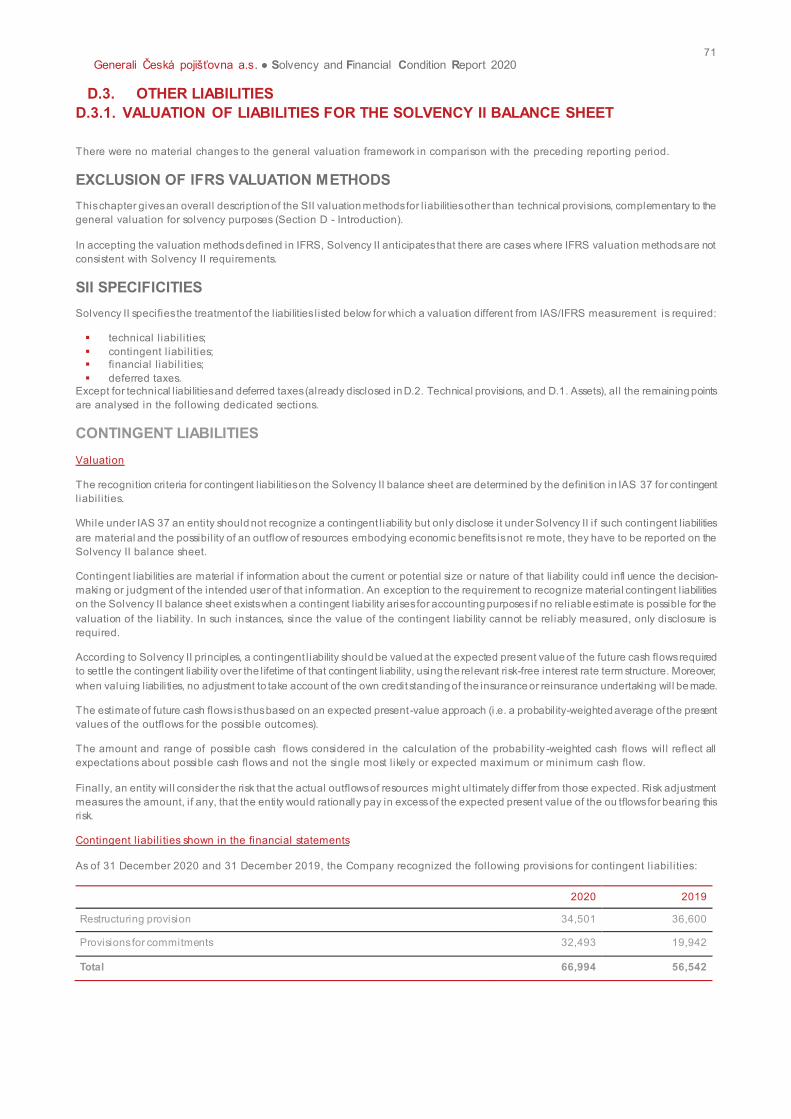
71
Generali Česká pojišťovna a.s. ● Solvency and Financial Condition Report 2020
D.3. OTHER LIABILITIES
D.3.1. VALUATION OF LIABILITIES FOR THE SOLVENCY II BALANCE SHEET
There were no material changes to the general valuation framework in comparison with the preceding reporting period.
EXCLUSION OF IFRS VALUATION METHODS
This chapter gives an overall description of the SII valuation methods for l iabilities other than technical provisions, complementary to the
general valuation for solvency purposes (Section D - Introduction).
In accepting the valuation methods defined in IFRS, Solvency II anticipates that there are cases where IFRS valuation methods are not
consistent with Solvency II requirements.
SII SPECIFICITIES
Solvency II specifies the treatment of the liabilities listed below for which a valuation different from IAS/IFRS measurement is required:
§ technical l iabil ities;
§ contingent l iabil ities;
§ financial l iabil ities;
§ deferred taxes.
Except for technical l iabilities and deferred taxes (already disclosed in D.2. Technical provisions, and D.1. Assets), all the remaining points
are analysed in the following dedicated sections.
CONTINGENT LIABILITIES
Valuation
The recognition criteria for contingent l iabilities on the Solvency II balance sheet are determined by the definition in IAS 37 for contingent
l iabil ities.
While under IAS 37 an entity should not recognize a contingent l iability but only disclose it under Solvency II if such contingent l iabilities
are material and the possibil ity of an outflow of resources embodying economic benefits is not re mote, they have to be reported on the
Solvency II balance sheet.
Contingent l iabilities are material if information about the current or potential size or nature of that liability could infl uence the decision-
making or judgment of the intended user of that information. An exception to the requirement to recognize material contingent l iabilities
on the Solvency II balance sheet exists when a contingent l iability arises for accounting purposes if no reliable estimate is possible for the
valuation of the liabil ity. In such instances, since the value of the contingent l iability cannot be reliably measured, only disclosure is
required.
According to Solvency II principles, a contingent l iability should be valued at the expected present value of the future cash flows required
to settle the contingent liability over the lifetime of that contingent liability, using the relevant risk-free interest rate term structure. Moreover,
when valuing liabilities, no adjustment to take account of the own credit standing of the insurance or reinsurance undertaking will be made.
The estimate of future cash flows is thus based on an expected present-value approach (i.e. a probability-weighted average of the present
values of the outflows for the possible outcomes).
The amount and range of possible cash flows considered in the calculation of the probability -weighted cash flows will reflect all
expectations about possible cash flows and not the single most l ikely or expected maximum or minimum cash flow.
Finally, an entity will consider the risk that the actual outflows of resources might ultimately differ from those expected. Risk adjustment
measures the amount, if any, that the entity would rationally pay in excess of the expected present value of the ou tflows for bearing this
risk.
Contingent l iabil ities shown in the financial statements
As of 31 December 2020 and 31 December 2019, the Company recognized the following provisions for contingent l iabil ities:
2020 2019
Restructuring provision 34,501 36,600
Provisions for commitments 32,493 19,942
Total 66,994 56,542
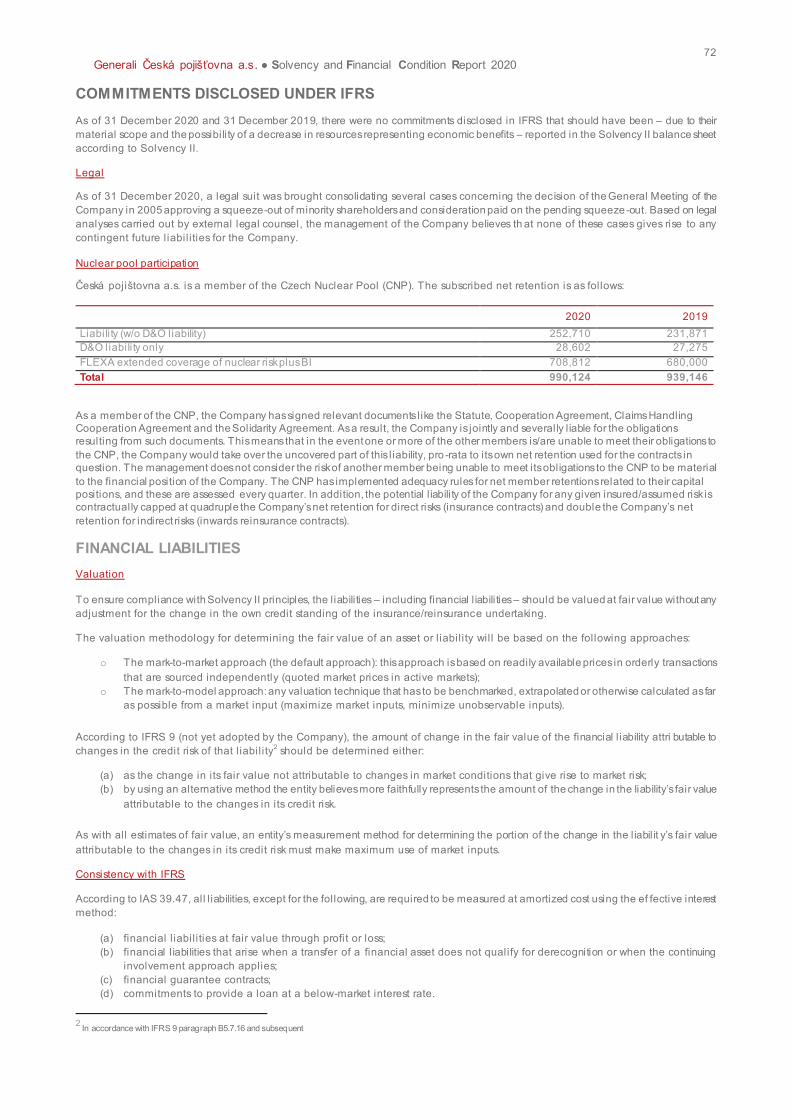
72
Generali Česká pojišťovna a.s. ● Solvency and Financial Condition Report 2020
COMMITMENTS DISCLOSED UNDER IFRS
As of 31 December 2020 and 31 December 2019, there were no commitments disclosed in IFRS that should have been – due to their
material scope and the possibility of a decrease in resources representing economic benefits – reported in the Solvency II balance sheet
according to Solvency II.
Legal
As of 31 December 2020, a legal suit was brought consolidating several cases concerning the decision of the General Meeting of the
Company in 2005 approving a squeeze-out of minority shareholders and consideration paid on the pending squeeze-out. Based on legal
analyses carried out by external legal counsel, the management of the Company believes th at none of these cases gives rise to any
contingent future liabil ities for the Company.
Nuclear pool participation
Česká pojištovna a.s. is a member of the Czech Nuclear Pool (CNP). The subscribed net retention is as follows:
2020 2019
Liability (w/o D&O liability) 252,710 231,871
D&O liability only 28,602 27,275
FLEXA extended coverage of nuclear risk plus BI 708,812 680,000
Total 990,124 939,146
As a member of the CNP, the Company has signed relevant documents like the Statute, Cooperation Agreement, Claims Handling
Cooperation Agreement and the Solidarity Agreement. As a result, the Company is jointly and severally l iable for the obligations
resulting from such documents. This means that in the event one or more of the other members is/are unable to meet their obligations to
the CNP, the Company would take over the uncovered part of this l iability, pro -rata to its own net retention used for the contracts in
question. The management does not consider the risk of another member being unable to meet its obligations to the CNP to be material
to the financial position of the Company. The CNP has implemented adequacy rules for net member retentions related to their capital
positions, and these are assessed every quarter. In addition, the potential l iability of the Company for any given insured/assumed risk is
contractually capped at quadruple the Company’s net retention for direct risks (insurance contracts) and double the Company’s net
retention for indirect risks (inwards reinsurance contracts).
FINANCIAL LIABILITIES
Valuation
To ensure compliance with Solvency II principles, the liabilities – including financial l iabilities – should be valued at fair value without any
adjustment for the change in the own credit standing of the insurance/reinsurance undertaking.
The valuation methodology for determining the fair value of an asset or l iabil ity will be based on the following approaches:
o The mark-to-market approach (the default approach): this approach is based on readily available prices in orderly transactions
that are sourced independently (quoted market prices in active markets);
o The mark-to-model approach: any valuation technique that has to be benchmarked, extrapolated or otherwise calculated as far
as possible from a market input (maximize market inputs, minimize unobservable inputs).
According to IFRS 9 (not yet adopted by the Company), the amount of change in the fair value of the financial l iability attri butable to
changes in the credit risk of that l iabil ity2 should be determined either:
(a) as the change in its fair value not attributable to changes in market conditions that give rise to market risk;
(b) by using an alternative method the entity believes more faithfully represents the amount of the change in the liability’s fair value
attributable to the changes in its credit risk.
As with all estimates of fair value, an entity’s measurement method for determining the portion of the change in the liabil it y’s fair value
attributable to the changes in its credit risk must make maximum use of market inputs.
Consistency with IFRS
According to IAS 39.47, all l iabilities, except for the following, are required to be measured at amortized cost using the ef fective interest
method:
(a) financial l iabil ities at fair value through profit or loss;
(b) financial l iabilities that arise when a transfer of a financial asset does not qualify for derecognition or when the continuing
involvement approach applies;
(c) financial guarantee contracts;
(d) commitments to provide a loan at a below-market interest rate.
2
In accordance with IFRS 9 paragraph B5.7.16 and subsequent
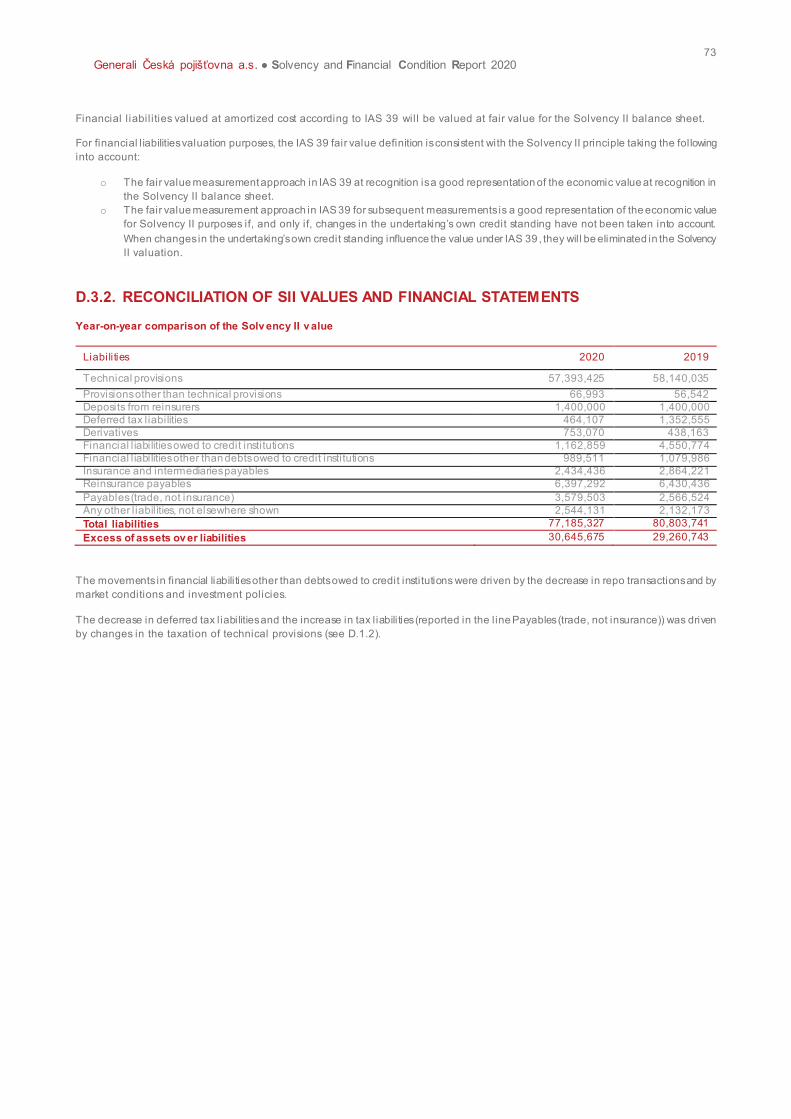
73
Generali Česká pojišťovna a.s. ● Solvency and Financial Condition Report 2020
Financial l iabil ities valued at amortized cost according to IAS 39 will be valued at fair value for the Solvency II balance sheet.
For financial l iabilities valuation purposes, the IAS 39 fair value definition is consistent with the Solvency II principle taking the following
into account:
o The fair value measurement approach in IAS 39 at recognition is a good representation of the economic value at recognition in
the Solvency II balance sheet.
o The fair value measurement approach in IAS 39 for subsequent measurements is a good representation of the economic value
for Solvency II purposes if, and only if, changes in the undertaking’s own credit standing have not been taken into account.
When changes in the undertaking’s own credit standing influence the value under IAS 39 , they will be eliminated in the Solvency
II valuation.
D.3.2. RECONCILIATION OF SII VALUES AND FINANCIAL STATEMENTS
Year-on-year comparison of the Solv ency II v alue
Liabilities 2020 2019
Technical provisions 57,393,425 58,140,035
Provisions other than technical provisions 66,993 56,542
Deposits from reinsurers 1,400,000 1,400,000
Deferred tax liabilities 464,107 1,352,555
Derivatives 753,070 438,163
Financial l iabilities owed to credit institutions 1,162,859 4,550,774
Financial l iabilities other than debts owed to credit institutions 989,511 1,079,986
Insurance and intermediaries payables 2,434,436 2,864,221
Reinsurance payables 6,397,292 6,430,436
Payables (trade, not insurance) 3,579,503 2,566,524
Any other l iabil ities, not elsewhere shown 2,544,131 2,132,173
Total liabilities 77,185,327 80,803,741
Excess of assets ov er liabilities 30,645,675 29,260,743
The movements in financial liabilities other than debts owed to credit institutions were driven by the decrease in repo transactions and by
market conditions and investment policies.
The decrease in deferred tax liabilities and the increase in tax liabilities (reported in the line Payables (trade, not insurance)) was driven
by changes in the taxation of technical provisions (see D.1.2).
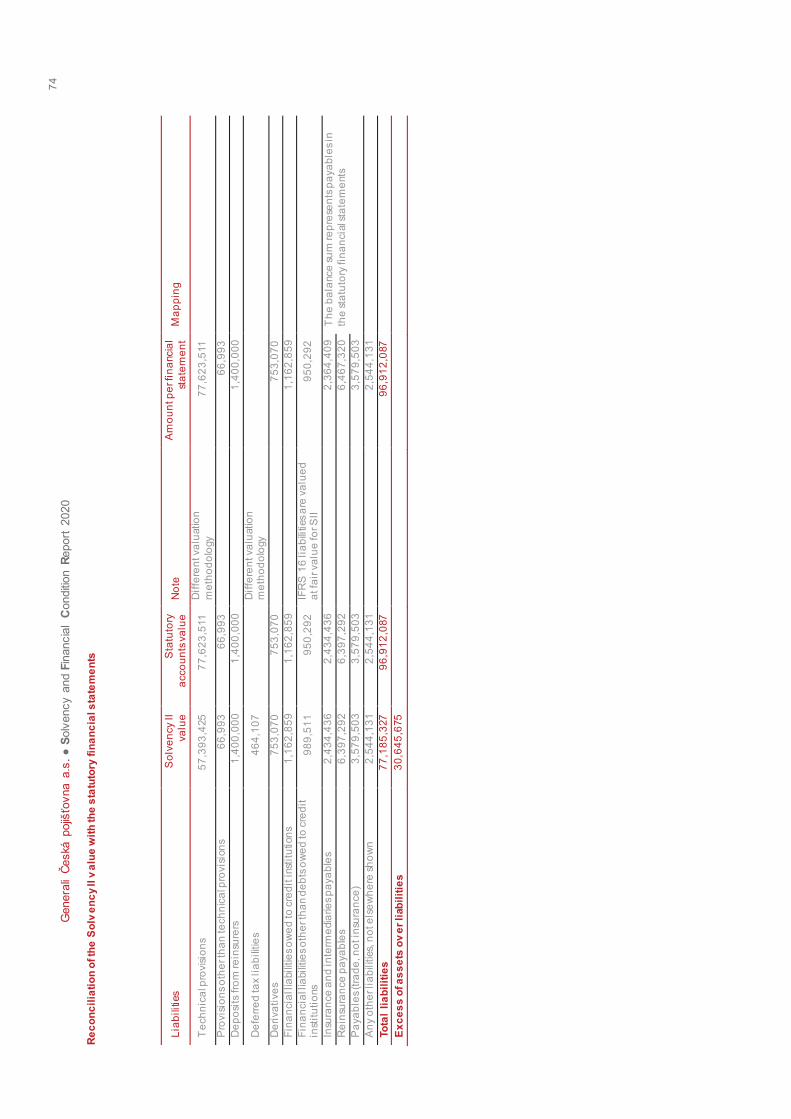
74
G
ener
ali
Čes
ká p
ojiš
ťovn
a a.
s. ●
Solv
ency a
nd F
inancia
l C
onditi
on R
eport
2020
Re
co
nc
ilia
tio
n o
f th
e S
olv
en
cy II v
alu
e w
ith
th
e s
tatu
tory
fin
an
cia
l s
tate
me
nts
Lia
bilitie
s
So
lve
ncy II
va
lue
Sta
tuto
ry
acco
un
ts v
alu
e
No
te
Am
ou
nt p
er fi
na
ncia
l
sta
tem
en
t M
ap
pin
g
Te
ch
nic
al p
rovis
ion
s 5
7,3
93
,425
7
7,6
23
,511
D
iffe
ren
t va
luatio
n
me
tho
do
logy
77
,62
3,5
11
Pro
vis
ion
s o
the
r th
an
te
ch
nic
al p
rovis
ion
s 6
6,9
93
6
6,9
93
66
,99
3
De
po
sits
fro
m re
insu
rers
1
,40
0,0
00
1,4
00
,00
0
1
,40
0,0
00
De
ferr
ed
ta
x lia
bilitie
s 4
64
,10
7
D
iffe
ren
t va
luatio
n
me
tho
do
logy
De
riva
tive
s 7
53
,07
0
75
3,0
70
75
3,0
70
Fin
an
cia
l lia
bilitie
s o
we
d to
cre
dit
inst
itu
tion
s 1
,16
2,8
59
1,1
62
,85
9
1
,16
2,8
59
Fin
an
cia
l lia
bilitie
s o
the
r th
an d
eb
ts o
we
d to
cre
dit
in
stit
uti
ons
98
9,5
11
9
50
,29
2
IFR
S 1
6 lia
bili
ties
are
va
lue
d
at fa
ir v
alu
e fo
r S
II
95
0,2
92
Insu
ran
ce
an
d in
term
edia
rie
s p
aya
ble
s 2
,43
4,4
36
2,4
34
,43
6
2
,36
4,4
09
Th
e b
ala
nce
su
m re
pre
sen
ts p
aya
ble
s in
the
sta
tuto
ry fin
an
cia
l sta
tem
ents
Re
insu
ran
ce
pa
ya
ble
s 6
,39
7,2
92
6,3
97
,29
2
6
,46
7,3
20
Pa
ya
ble
s (t
rad
e, n
ot in
sura
nce
) 3
,57
9,5
03
3,5
79
,50
3
3
,57
9,5
03
An
y o
the
r li
ab
ilitie
s, n
ot e
lse
wh
ere
sh
ow
n
2,5
44
,13
1
2,5
44
,13
1
2
,54
4,1
31
To
tal
lia
bil
itie
s
77
,18
5,3
27
9
6,9
12
,087
96
,91
2,0
87
Ex
ce
ss
of a
ss
ets
ov
er
liab
ilit
ies
30
,64
5,6
75
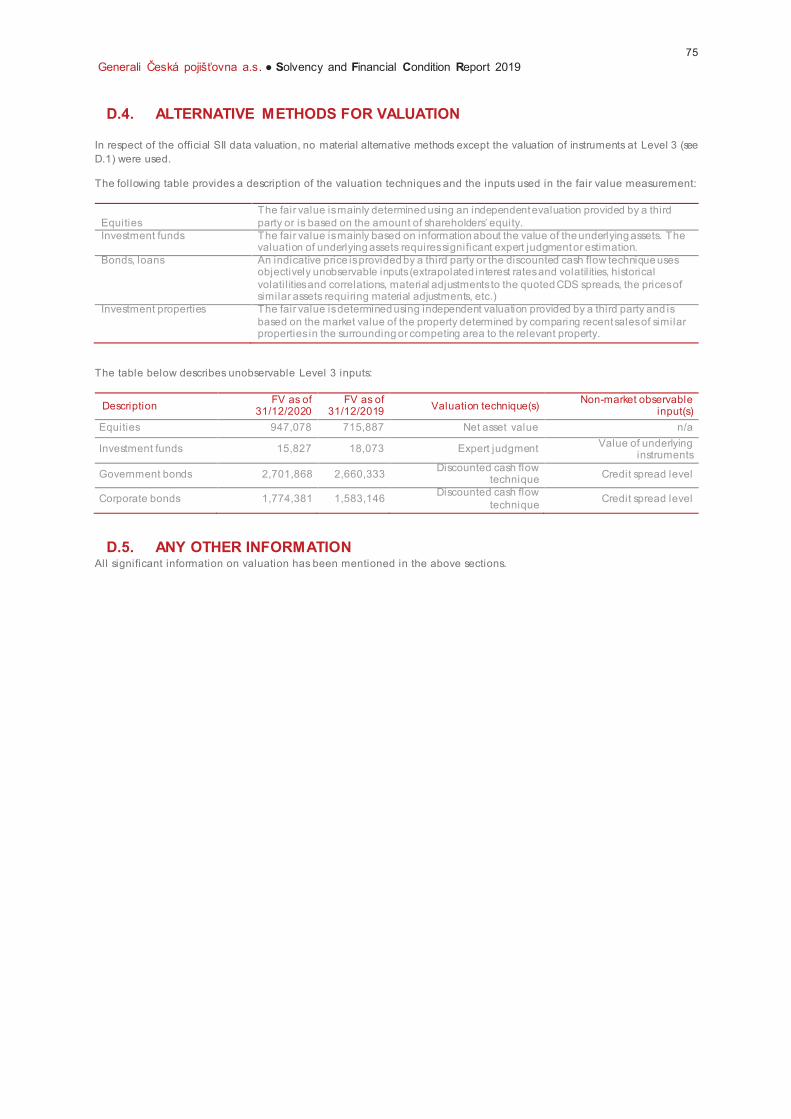
75
Generali Česká pojišťovna a.s. ● Solvency and Financial Condition Report 2019
D.4. ALTERNATIVE METHODS FOR VALUATION
In respect of the official SII data valuation, no material alternative methods except the valuation of instruments at Level 3 (see
D.1) were used.
The following table provides a description of the valuation techniques and the inputs used in the fair value measurement:
Equities
The fair value is mainly determined using an independent evaluation provided by a third
party or is based on the amount of shareholders’ equity. Investment funds The fair value is mainly based on information about the value of the underlying assets. The
valuation of underlying assets requires significant expert judgment or estimation.
Bonds, loans An indicative price is provided by a third party or the discounted cash flow technique uses objectively unobservable inputs (extrapolated interest rates and volatil ities, historical
volatil ities and correlations, material adjustments to the quoted CDS spreads, the prices of similar assets requiring material adjustments, etc.)
Investment properties The fair value is determined using independent valuation provided by a third party and is
based on the market value of the property determined by comparing recent sales of similar properties in the surrounding or competing area to the relevant property.
The table below describes unobservable Level 3 inputs:
Description FV as of
31/12/2020 FV as of
31/12/2019 Valuation technique(s)
Non-market observable input(s)
Equities 947,078 715,887 Net asset value n/a
Investment funds 15,827 18,073 Expert judgment Value of underlying
instruments
Government bonds 2,701,868 2,660,333 Discounted cash flow
technique Credit spread level
Corporate bonds 1,774,381 1,583,146 Discounted cash flow
technique Credit spread level
D.5. ANY OTHER INFORMATION All significant information on valuation has been mentioned in the above sections.
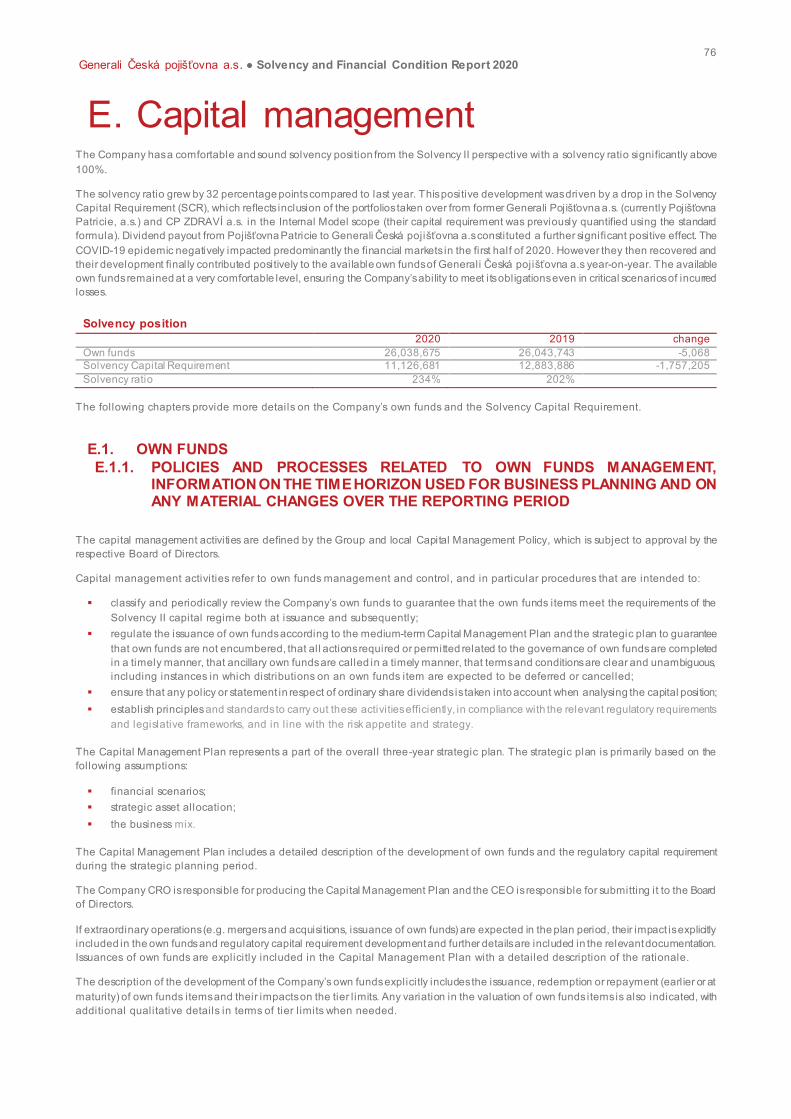
76
Generali Česká pojišťovna a.s. ● Solvency and Financial Condition Report 2020
E. Capital management The Company has a comfortable and sound solvency position from the Solvency II perspective with a solvency ratio significantly above
100%.
The solvency ratio grew by 32 percentage points compared to last year. This positive development was driven by a drop in the Solvency
Capital Requirement (SCR), which reflects inclusion of the portfolios taken over from former Generali Pojišťovna a.s. (currently Pojišťovna Patricie, a.s.) and CP ZDRAVÍ a.s. in the Internal Model scope (their capital requirement was previously quantified using the standard
formula). Dividend payout from Pojišťovna Patricie to Generali Česká pojišťovna a.s constituted a further significant positive effect. The
COVID-19 epidemic negatively impacted predominantly the financial markets in the first half of 2020. However they then recovered and
their development finally contributed positively to the available own funds of Generali Česká pojišťovna a.s year-on-year. The available
own funds remained at a very comfortable level, ensuring the Company’s ability to meet its obligations even in critical scenarios of incurred losses.
Solvency position
2020 2019 change
Own funds 26,038,675 26,043,743 -5,068
Solvency Capital Requirement 11,126,681 12,883,886 -1,757,205
Solvency ratio 234% 202%
The following chapters provide more details on the Company’s own funds and the Solvency Capital Requirement.
E.1. OWN FUNDS
E.1.1. POLICIES AND PROCESSES RELATED TO OWN FUNDS MANAGEMENT, INFORMATION ON THE TIME HORIZON USED FOR BUSINESS PLANNING AND ON ANY MATERIAL CHANGES OVER THE REPORTING PERIOD
The capital management activities are defined by the Group and local Capital Management Policy, which is subject to approval by the
respective Board of Directors.
Capital management activities refer to own funds management and control, and in particular procedures that are intended to:
§ classify and periodically review the Company’s own funds to guarantee that the own funds items meet the requirements of the
Solvency II capital regime both at issuance and subsequently;
§ regulate the issuance of own funds according to the medium-term Capital Management Plan and the strategic plan to guarantee
that own funds are not encumbered, that all actions required or permitted related to the governance of own funds are completed
in a timely manner, that ancillary own funds are called in a timely manner, that terms and conditions are clear and unambiguous,
including instances in which distributions on an own funds item are expected to be deferred or cancelled;
§ ensure that any policy or statement in respect of ordinary share dividends is taken into account when analysing the capital position;
§ establish principles and standards to carry out these activities efficiently, in compliance with the relevant regulatory requirements
and legislative frameworks, and in l ine with the risk appetite and strategy.
The Capital Management Plan represents a part of the overall three-year strategic plan. The strategic plan is primarily based on the
following assumptions:
§ financial scenarios;
§ strategic asset allocation;
§ the business mix.
The Capital Management Plan includes a detailed description of the development of own funds and the regulatory capital requirement
during the strategic planning period.
The Company CRO is responsible for producing the Capital Management Plan and the CEO is responsible for submitting it to the Board
of Directors.
If extraordinary operations (e.g. mergers and acquisitions, issuance of own funds) are expected in the plan period, their impact is explicitly
included in the own funds and regulatory capital requirement development and further details are included in the relevant documentation.
Issuances of own funds are explicitly included in the Capital Management Plan with a detailed description of the rationale.
The description of the development of the Company’s own funds explicitly includes the issuance, redemption or repayment (earlier or at
maturity) of own funds items and their impacts on the tier l imits. Any variation in the valuation of own funds items is also indicated, with
additional qualitative details in terms of tier l imits when needed.
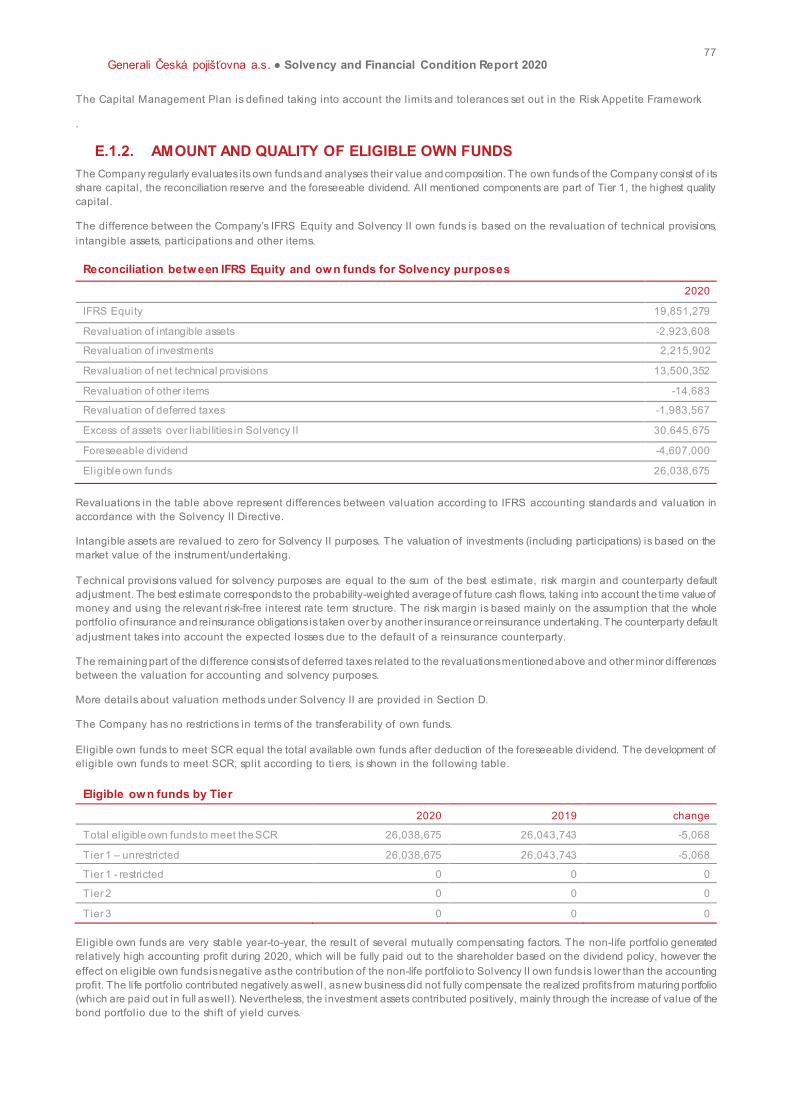
77
Generali Česká pojišťovna a.s. ● Solvency and Financial Condition Report 2020
The Capital Management Plan is defined taking into account the limits and tolerances set out in the Risk Appetite Framework
.
E.1.2. AMOUNT AND QUALITY OF ELIGIBLE OWN FUNDS
The Company regularly evaluates its own funds and analyses their value and composition. The own funds of the Company consist of its
share capital, the reconciliation reserve and the foreseeable dividend. All mentioned components are part of Tier 1, the highest quality
capital.
The difference between the Company’s IFRS Equity and Solvency II own funds is based on the revaluation of technical provisions,
intangible assets, participations and other items.
Reconciliation between IFRS Equity and own funds for Solvency purposes
2020
IFRS Equity 19,851,279
Revaluation of intangible assets -2,923,608
Revaluation of investments 2,215,902
Revaluation of net technical provisions 13,500,352
Revaluation of other items -14,683
Revaluation of deferred taxes -1,983,567
Excess of assets over l iabilities in Solvency II 30,645,675
Foreseeable dividend -4,607,000
Eligible own funds 26,038,675
Revaluations in the table above represent differences between valuation according to IFRS accounting standards and valuation in
accordance with the Solvency II Directive.
Intangible assets are revalued to zero for Solvency II purposes. The valuation of investments (including participations) is based on the
market value of the instrument/undertaking.
Technical provisions valued for solvency purposes are equal to the sum of the best estimate, risk margin and counterparty default
adjustment. The best estimate corresponds to the probability-weighted average of future cash flows, taking into account the time value of
money and using the relevant risk-free interest rate term structure. The risk margin is based mainly on the assumption that the whole
portfolio of insurance and reinsurance obligations is taken over by another insurance or reinsurance undertaking. The counterparty default
adjustment takes into account the expected losses due to the default of a reinsurance counterparty.
The remaining part of the di fference consists of deferred taxes related to the revaluations mentioned above and other minor differences
between the valuation for accounting and solvency purposes.
More details about valuation methods under Solvency II are provided in Section D.
The Company has no restrictions in terms of the transferability of own funds.
Eligible own funds to meet SCR equal the total available own funds after deduction of the foreseeable dividend. The development of
eligible own funds to meet SCR, split according to ti ers, is shown in the following table.
Eligible own funds by Tier
2020 2019 change
Total eligible own funds to meet the SCR 26,038,675 26,043,743 -5,068
Tier 1 – unrestricted 26,038,675 26,043,743 -5,068
Tier 1 - restricted 0 0 0
Tier 2 0 0 0
Tier 3 0 0 0
Eligible own funds are very stable year-to-year, the result of several mutually compensating factors. The non-life portfolio generated
relatively high accounting profit during 2020, which will be fully paid out to the shareholder based on the dividend policy, however the
effect on eligible own funds is negative as the contribution of the non-life portfolio to Solvency II own funds is lower than the accounting
profit. The life portfolio contributed negatively as well, as new business did not fully compensate the realized profits from maturing portfolio
(which are paid out in full as well). Nevertheless, the investment assets contributed positively, mainly through the increase of value of the
bond portfolio due to the shift of yield curves.
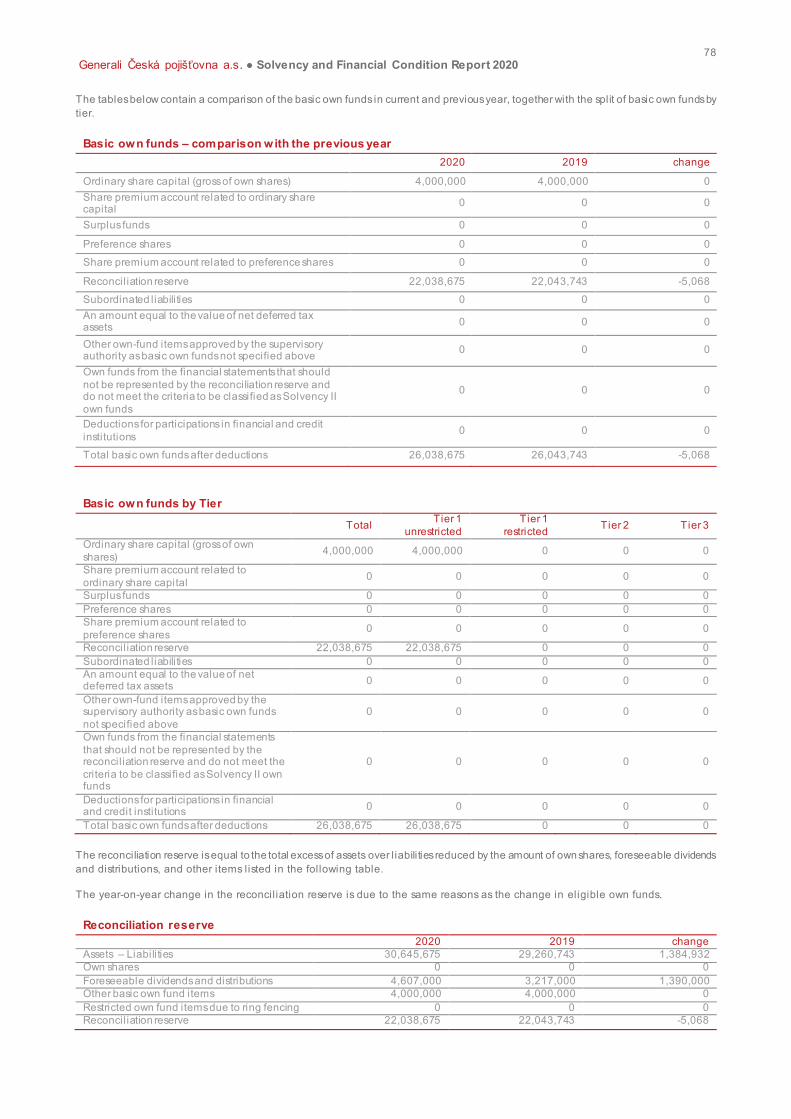
78
Generali Česká pojišťovna a.s. ● Solvency and Financial Condition Report 2020
The tables below contain a comparison of the basic own funds in current and previous year, together with the split of basic own funds by
tier.
Basic own funds – comparison with the previous year
2020 2019 change
Ordinary share capital (gross of own shares) 4,000,000 4,000,000 0
Share premium account related to ordinary share capital
0 0 0
Surplus funds 0 0 0
Preference shares 0 0 0
Share premium account related to preference shares 0 0 0
Reconciliation reserve 22,038,675 22,043,743 -5,068
Subordinated liabilities 0 0 0
An amount equal to the value of net deferred tax assets
0 0 0
Other own-fund items approved by the supervisory authority as basic own funds not specified above
0 0 0
Own funds from the financial statements that should
not be represented by the reconciliation reserve and do not meet the criteria to be classified as Solvency II
own funds
0 0 0
Deductions for participations in financial and credit
institutions 0 0 0
Total basic own funds after deductions 26,038,675 26,043,743 -5,068
Basic own funds by Tier
Total
Tier 1
unrestricted
Tier 1
restricted Tier 2 Tier 3
Ordinary share capital (gross of own
shares) 4,000,000 4,000,000 0 0 0
Share premium account related to
ordinary share capital 0 0 0 0 0
Surplus funds 0 0 0 0 0
Preference shares 0 0 0 0 0
Share premium account related to
preference shares 0 0 0 0 0
Reconciliation reserve 22,038,675 22,038,675 0 0 0
Subordinated liabilities 0 0 0 0 0
An amount equal to the value of net deferred tax assets
0 0 0 0 0
Other own-fund items approved by the supervisory authority as basic own funds
not specified above
0 0 0 0 0
Own funds from the financial statements
that should not be represented by the reconciliation reserve and do not meet the
criteria to be classified as Solvency II own funds
0 0 0 0 0
Deductions for participations in financial and credit institutions
0 0 0 0 0
Total basic own funds after deductions 26,038,675 26,038,675 0 0 0
The reconciliation reserve is equal to the total excess of assets over l iabilities reduced by the amount of own shares, foreseeable dividends
and distributions, and other items listed in the following table.
The year-on-year change in the reconciliation reserve is due to the same reasons as the change in eligible own funds.
Reconciliation reserve
2020 2019 change
Assets – Liabilities 30,645,675 29,260,743 1,384,932
Own shares 0 0 0
Foreseeable dividends and distributions 4,607,000 3,217,000 1,390,000
Other basic own fund items 4,000,000 4,000,000 0
Restricted own fund items due to ring fencing 0 0 0
Reconciliation reserve 22,038,675 22,043,743 -5,068
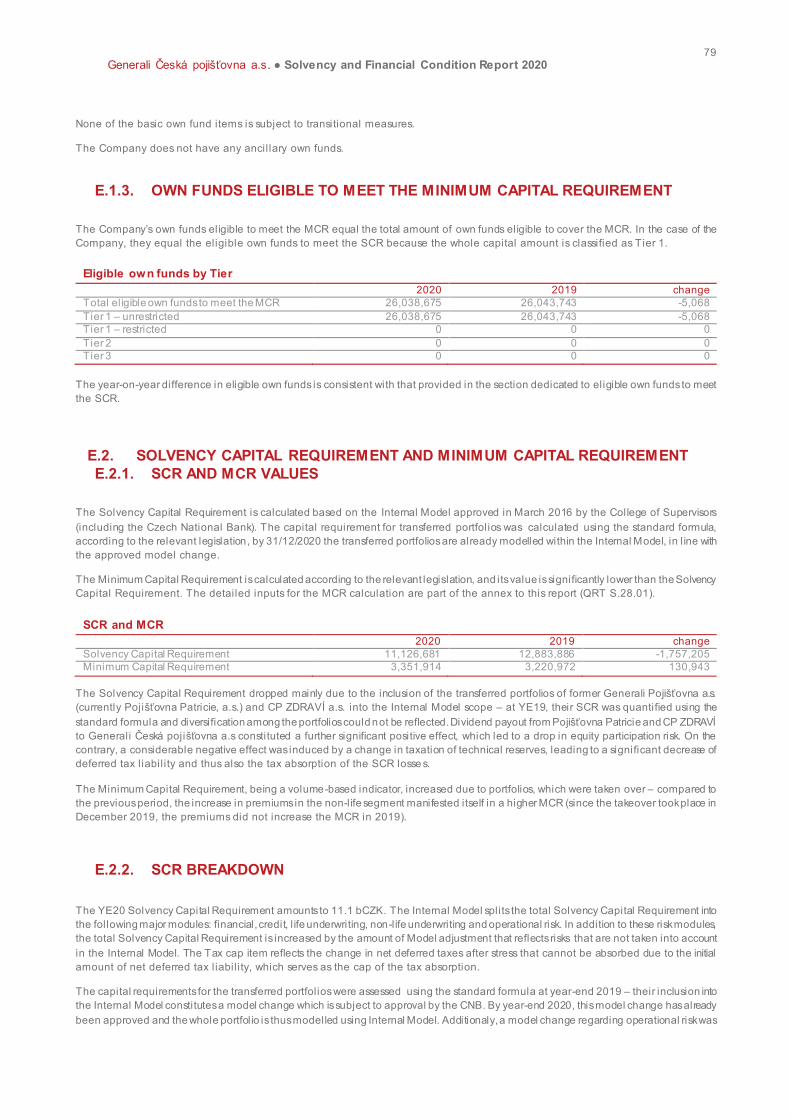
79
Generali Česká pojišťovna a.s. ● Solvency and Financial Condition Report 2020
None of the basic own fund items is subject to transitional measures.
The Company does not have any ancillary own funds.
E.1.3. OWN FUNDS ELIGIBLE TO MEET THE MINIMUM CAPITAL REQUIREMENT
The Company’s own funds eligible to meet the MCR equal the total amount of own funds eligible to cover the MCR. In the case of the
Company, they equal the eligible own funds to meet the SCR because the whole capital amount is classified as Tier 1.
Eligible own funds by Tier
2020 2019 change
Total eligible own funds to meet the MCR 26,038,675 26,043,743 -5,068
Tier 1 – unrestricted 26,038,675 26,043,743 -5,068
Tier 1 – restricted 0 0 0
Tier 2 0 0 0
Tier 3 0 0 0
The year-on-year difference in eligible own funds is consistent with that provided in the section dedicated to eligible own funds to meet
the SCR.
E.2. SOLVENCY CAPITAL REQUIREMENT AND MINIMUM CAPITAL REQUIREMENT
E.2.1. SCR AND MCR VALUES
The Solvency Capital Requirement is calculated based on the Internal Model approved in March 2016 by the College of Supervisors
(including the Czech National Bank). The capital requirement for transferred portfolios was calculated using the standard formula,
according to the relevant legislation, by 31/12/2020 the transferred portfolios are already modelled within the Internal Model, in l ine with
the approved model change.
The Minimum Capital Requirement is calculated according to the relevant legislation, and its value is significantly lower than the Solvency
Capital Requirement. The detailed inputs for the MCR calculation are part of the annex to this report (QRT S.28.01).
SCR and MCR
2020 2019 change
Solvency Capital Requirement 11,126,681 12,883,886 -1,757,205
Minimum Capital Requirement 3,351,914 3,220,972 130,943
The Solvency Capital Requirement dropped mainly due to the inclusion of the transferred portfolios of former Generali Pojišťovna a.s. (currently Pojišťovna Patricie, a.s.) and CP ZDRAVÍ a.s. into the Internal Model scope – at YE19, their SCR was quantified using the
standard formula and diversification among the portfolios could not be reflected. Dividend payout from Pojišťovna Patricie and CP ZDRAVÍ to Generali Česká pojišťovna a.s constituted a further significant positive effect, which led to a drop in equity participation risk. On the
contrary, a considerable negative effect was induced by a change in taxation of technical reserves, leading to a significant decrease of
deferred tax liabil ity and thus also the tax absorption of the SCR losse s.
The Minimum Capital Requirement, being a volume-based indicator, increased due to portfolios, which were taken over – compared to
the previous period, the increase in premiums in the non-life segment manifested itself in a higher MCR (since the takeover took place in
December 2019, the premiums did not increase the MCR in 2019).
E.2.2. SCR BREAKDOWN
The YE20 Solvency Capital Requirement amounts to 11.1 bCZK. The Internal Model splits the total Solvency Capital Requirement into
the following major modules: financial, credit, l ife underwriting, non-life underwriting and operational risk. In addition to these risk modules,
the total Solvency Capital Requirement is increased by the amount of Model adjustment that reflects risks that are not taken into account
in the Internal Model. The Tax cap item reflects the change in net deferred taxes after stress that cannot be absorbed due to the initial
amount of net deferred tax l iabil ity, which serves as the cap of the tax absorption.
The capital requirements for the transferred portfolios were assessed using the standard formula at year-end 2019 – their inclusion into
the Internal Model constitutes a model change which is subject to approval by the CNB. By year-end 2020, this model change has already
been approved and the whole portfolio is thus modelled using Internal Model. Additionaly, a model change regarding operational risk was
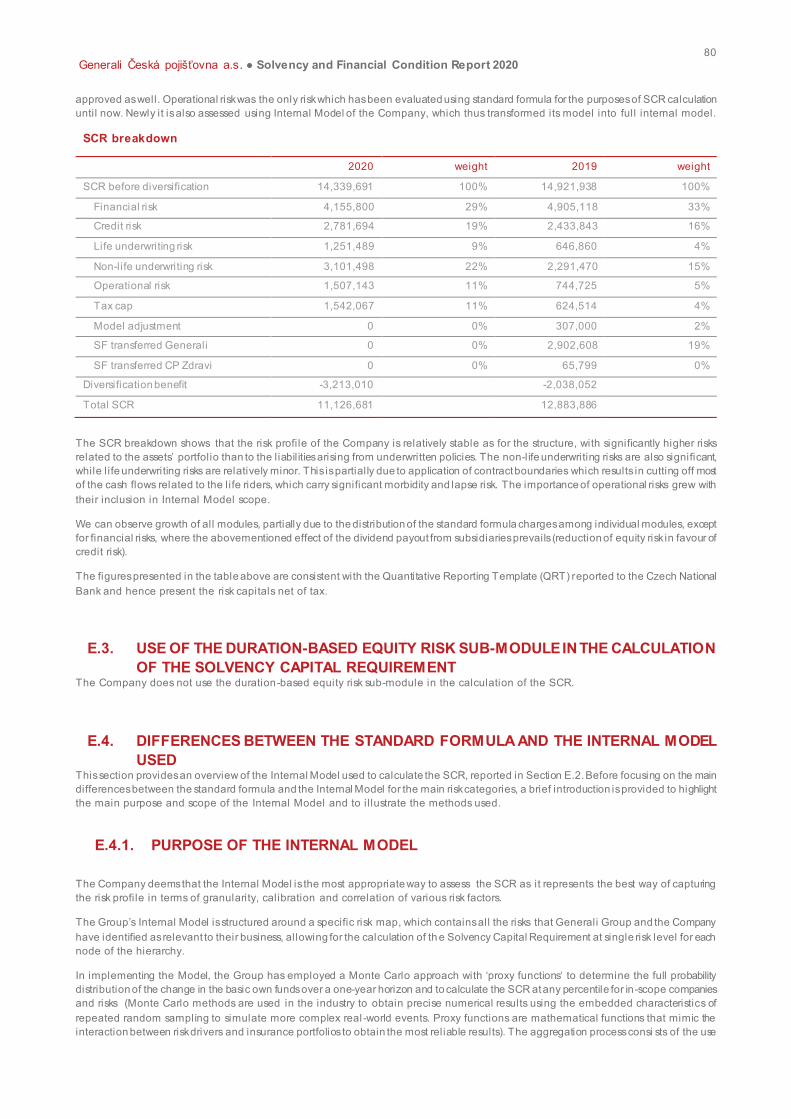
80
Generali Česká pojišťovna a.s. ● Solvency and Financial Condition Report 2020
approved as well. Operational risk was the only risk which has been evaluated using standard formula for the purposes of SCR calculation
until now. Newly it is also assessed using Internal Model of the Company, which thus transformed its model into full internal model.
SCR breakdown
2020 weight 2019 weight
SCR before diversification 14,339,691 100% 14,921,938 100%
Financial risk 4,155,800 29% 4,905,118 33%
Credit risk 2,781,694 19% 2,433,843 16%
Life underwriting risk 1,251,489 9% 646,860 4%
Non-life underwriting risk 3,101,498 22% 2,291,470 15%
Operational risk 1,507,143 11% 744,725 5%
Tax cap 1,542,067 11% 624,514 4%
Model adjustment 0 0% 307,000 2%
SF transferred Generali 0 0% 2,902,608 19%
SF transferred CP Zdravi 0 0% 65,799 0%
Diversification benefit -3,213,010 -2,038,052
Total SCR 11,126,681 12,883,886
The SCR breakdown shows that the risk profile of the Company is relatively stable as for the structure, with significantly higher risks
related to the assets’ portfolio than to the liabil ities arising from underwritten policies. The non-life underwriting risks are also significant,
while l ife underwriting risks are relatively minor. This is partially due to application of contract boundaries which results in cutting off most
of the cash flows related to the life riders, which carry significant morbidity and lapse risk. The importance of operational risks grew with
their inclusion in Internal Model scope.
We can observe growth of all modules, partially due to the distribution of the standard formula charges among individual modules, except
for financial risks, where the abovementioned effect of the dividend payout from subsidiaries prevails (reduction of equity risk in favour of
credit risk).
The figures presented in the table above are consistent with the Quantitative Reporting Template (QRT) reported to the Czech National
Bank and hence present the risk capitals net of tax.
E.3. USE OF THE DURATION-BASED EQUITY RISK SUB-MODULE IN THE CALCULATION
OF THE SOLVENCY CAPITAL REQUIREMENT The Company does not use the duration-based equity risk sub-module in the calculation of the SCR.
E.4. DIFFERENCES BETWEEN THE STANDARD FORMULA AND THE INTERNAL MODEL
USED This section provides an overview of the Internal Model used to calculate the SCR, reported in Section E.2. Before focusing on the main
differences between the standard formula and the Internal Model for the main risk categories, a brief introduction is provided to highlight
the main purpose and scope of the Internal Model and to il lustrate the methods used.
E.4.1. PURPOSE OF THE INTERNAL MODEL
The Company deems that the Internal Model is the most appropriate way to assess the SCR as it represents the best way of capturing
the risk profile in terms of granularity, calibration and correlation of various risk factors.
The Group’s Internal Model is structured around a specific risk map, which contains all the risks that Generali Group and the Company
have identified as relevant to their business, allowing for the calculation of the Solvency Capital Requirement at single risk level for each
node of the hierarchy.
In implementing the Model, the Group has employed a Monte Carlo approach with ‘proxy functions‘ to determine the full probability
distribution of the change in the basic own funds over a one-year horizon and to calculate the SCR at any percentile for in-scope companies
and risks (Monte Carlo methods are used in the industry to obtain precise numerical results using the embedded characteristics of
repeated random sampling to simulate more complex real -world events. Proxy functions are mathematical functions that mimic the
interaction between risk drivers and insurance portfolios to obtain the most reliable results). The aggregation process consi sts of the use
81
Generali Česká pojišťovna a.s. ● Solvency and Financial Condition Report 2020
of advanced aggregation techniques (market best-practice techniques), and the calibration procedure involves quantitative and qualitative
aspects.
E.4.2. SCOPE OF THE INTERNAL MODEL
From the Company’s point of view, the Internal Model covers all the risk categories reported in the Group risk map in Section B.3.1. The
Internal Model covers all l ife underwriting risk, non-life underwriting risk, financial risk, credit risk and operational risk. The Internal Model’s
purpose is to capture the behaviour of individual risks and their impact on the balance sheet, taking into account the diversification between
portfolios, risks and locations.
E.4.3. METHODS USED IN THE INTERNAL MODEL
The Group Internal Model allows for the determination of a full Probability Distribution Forecast (PDF) of the change in basic own funds
(BOF) over a one-year time horizon. From the resulting PDF, the SCR can be calculated at a given confidence level (such a level where
the outcome is deemed to correctly represent events with a low probability of occurrence) by reading the corresponding percentile.
Generali uses a Monte Carlo approach with proxy functions that allows for the simulation of each balance sheet item through the
calculation of the full distribution of gains/losses. Other capital metrics required for internal purposes, such as single risk cap ital charges
(e.g. a change in BOF after a 1-in-10 drop in the level of equity prices) can also be derived from the single risk PDF.
The risk measure used is the Value at Risk (VaR) at a 99.5% quantile of the probability distribution function (corresponding to a 1-in-200
years event), the underlying variable is represented by the change in basic own funds, and the time horizon is one year according to the
calibration principles of the Solvency II Directive.
The main risks of the Company are described in the following paragraphs.
Life underwriting risk
§ The Internal Model stress calibration for l ife underwriting risk is based on Company-specific historical portfolio data, unlike the
standard stress levels provided by the standard formula approach. In particular, the Company calculates the potential deviations
from the best estimate due to adverse events through:
* a combination of market data with local exposures for catastrophe risk calibration (mortality);
* Company historical portfolio data for all other risks.
§ The methodology underlying the life underwriting risk calibration is given by the Group and its adequacy assessed at local level
and also applied at local level.
Non-life underwriting risk
The main differences between the standard formula and the Internal Model for the Solvency Capital Requirement calculation concerning
non-life underwriting risks are as follows:
§ As regards the pricing and reserving risks, the difference refers to the calibration approach, where the standard formula uses a
standard deviation defined by EIOPA, whilst for the Internal Model a bottom-up calculation of the business underwritten is
performed and own data are used.
§ For CAT risk, the difference lies in the calibration approach, where the standard formula is based on exposures to CAT risks in
which geographic risk coefficients are determined by EIOPA. The Internal Model uses advanced models based on market best
practice instead.
§ As regards reinsurance, the standard formula uses a series of simplified approaches, whilst the Internal Model performs precise
modelling of the reinsurance programs (proportional and non -proportional, including facultative).
Financial and credit risk
§ The standard formula approach for market risk is based either on the application of standardized stress factors directly to asset
exposures or, in case of interest rate risk, in the application of a standardized and simplified stress level to the curves used to
discount future cash flows.
§ The Internal Model adopts much more sophisticated state-of-the-art modelling techniques, based on a more granular risk map.
Interest rate volatility and equity volatility risk are, for example, modelled in the Internal Model while they are not modelled in the
standard formula;
§ Furthermore, also within the same risk module, the Internal Model is capable of producing a much more accurate representation
of the risk profile. This is because the higher granularity of the Internal Model risk map allows better reflection of the true
diversification benefit of individual portfolios as well as the peculiarities of individual financial instruments.
82
Generali Česká pojišťovna a.s. ● Solvency and Financial Condition Report 2020
Operational risk
The quantification of operational risk within Internal Model is based on analysis of scenarios, which affect the financial stability of the
Company. It differs from the standard formula mainly in the following aspects:
§ The scenarios subject to analysis cover a wide range of activities and risks arising from these, which jeopardize solvency of the
Company. The material risks entering into the calculation of the capital requirement are individualized and they adequately
represent the true risk profile of the Company. In contrast, the standard formula is simply based on volumes of premiums and
technical provisions, not taking into account the structure of risks of the given company
§ The standard formula does not reflect dependencies among operational risk and other risk modules. The calculation using Internal
Model adequately reflects these dependencies, as well as dependencies among individual scenarios within the operational risk
module
For a description of the nature and appropriateness of the data used in the Internal Model, please refer to Section B.3.2.
E.5. NON-COMPLIANCE WITH THE MINIMUM CAPITAL REQUIREMENT AND NON-
COMPLIANCE WITH THE SOLVENCY CAPITAL REQUIREMENT The Company has a sound solvency position and no issues have been identified in relation to compliance with either the Minimum Capital
Requirement or the Solvency Capital Requirement.
E.6. OTHER INFORMATION
SENSITIVITIES
As anticipated in Section C.7, sensitivity testing analyses the impact of simple changes in specific risk drivers (e.g. interest rates, equity
shock, credit spreads) on the level of own funds, the Solvency Capital Requirement as well as solvency ratio.
The level of eligible own funds and the SCR were recalculated for each sensitivity. Their joint impact on the solvency ratio is presented in
the following table.
Sensitivities
Solvency ratio
Base scenario 234%
Yield curve +50 bps 230%
Yield curve -50 bps 238%
Equity +25% 236%
Equity -25% 232%
Corporate spread +50 bps 232%
No volatility adjustment 221%
Ultimate forward rate -15 bps 234%
It is obvious that none of the sensitivities represents a significant threat to the solvency position of the Company. The most impactful one
among the above presented sensitivities is the scenario without volatility adjustment, however even in this case the solvency ratio remains
well above 190%. Apart from testing of the sensitivities to shifts in individual risk factors the Company evaluates periodically also combined
effect of several changes of the risk factors in stress scenarios as part of the ORSA process.
Solvency and Financial condition report - Public QRTs - as of 31.12.2020
Undertaking name Generali Česká pojišťovna a.s.
Undertaking identification code 31570010000000054609
Type of code of undertaking LEI
Type of undertaking Undertakings pursuing both life and non-life insurance activity
Currency used for reporting CZK
Figures reported in thousands
Accounting standards The undertaking is using IFRS
Method of Calculation of the SCR Full internal model
Basic Information

Index
S.02.01_Balance Sheet
S.05.01_Premiums, claims and expenses by line of business
S.05.02_Premiums, claims and expenses by country
S.12.01_Life and Health SLT Technical Provisions
S.17.01_Non - life Technical Provisions
S.19.01_Non-life Insurance Claims Information
S.22.01_Impact of long term guarantees measures and transitionals
S.23.01_Own funds
S.25.03_Solvency Capital Requirement - for undertakings on Full Internal Models
S.28.02_Minimum capital Requirement - Both life and non-life insurance activity
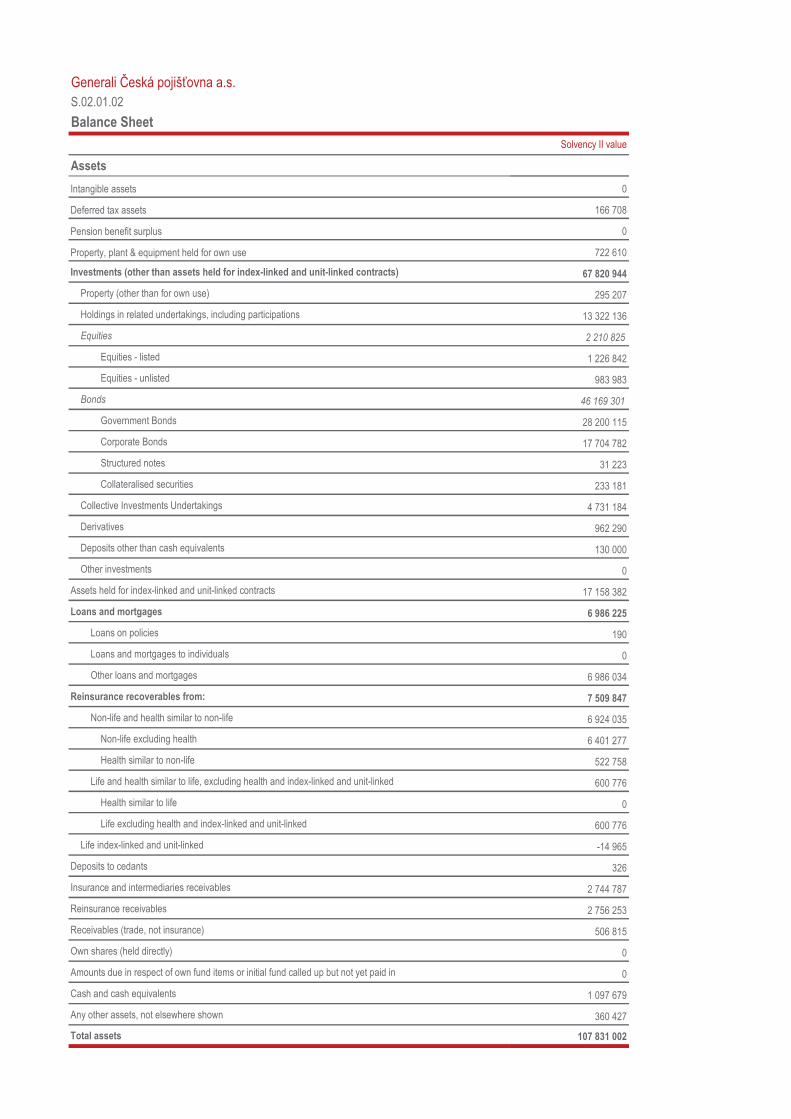
Generali Česká pojišťovna a.s.
Solvency II value
Assets
Intangible assets 0
Deferred tax assets 166 708
Pension benefit surplus 0
Property, plant & equipment held for own use 722 610
Investments (other than assets held for index-linked and unit-linked contracts) 67 820 944
Property (other than for own use) 295 207
Holdings in related undertakings, including participations 13 322 136
Equities 2 210 825
Equities - listed 1 226 842
Equities - unlisted 983 983
Bonds 46 169 301
Government Bonds 28 200 115
Corporate Bonds 17 704 782
Structured notes 31 223
Collateralised securities 233 181
Collective Investments Undertakings 4 731 184
Derivatives 962 290
Deposits other than cash equivalents 130 000
Other investments 0
Assets held for index-linked and unit-linked contracts 17 158 382
Loans and mortgages 6 986 225
Loans on policies 190
Loans and mortgages to individuals 0
Other loans and mortgages 6 986 034
Reinsurance recoverables from: 7 509 847
Non-life and health similar to non-life 6 924 035
Non-life excluding health 6 401 277
Health similar to non-life 522 758
Life and health similar to life, excluding health and index-linked and unit-linked 600 776
Health similar to life 0
Life excluding health and index-linked and unit-linked 600 776
Life index-linked and unit-linked -14 965
Deposits to cedants 326
Insurance and intermediaries receivables 2 744 787
Reinsurance receivables 2 756 253
Receivables (trade, not insurance) 506 815
Own shares (held directly) 0
Amounts due in respect of own fund items or initial fund called up but not yet paid in 0
Cash and cash equivalents 1 097 679
Any other assets, not elsewhere shown 360 427
Total assets 107 831 002
S.02.01.02
Balance Sheet
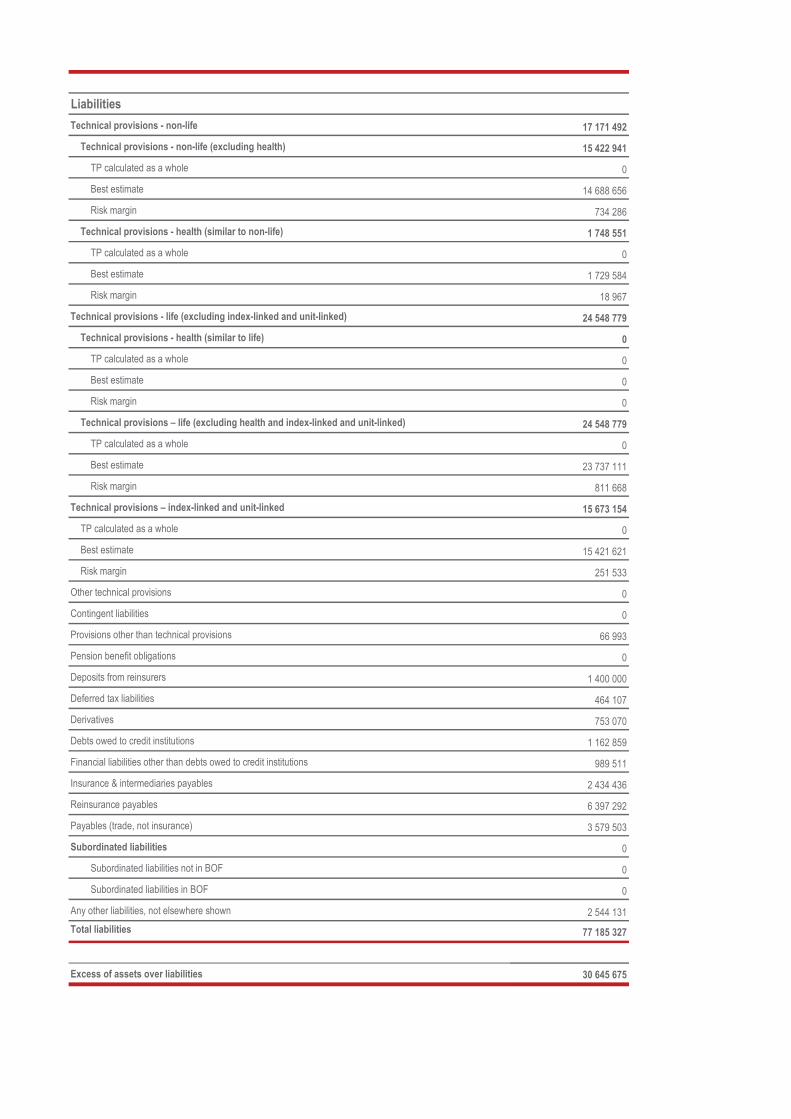
Liabilities
Technical provisions - non-life 17 171 492
Technical provisions - non-life (excluding health) 15 422 941
TP calculated as a whole 0
Best estimate 14 688 656
Risk margin 734 286
Technical provisions - health (similar to non-life) 1 748 551
TP calculated as a whole 0
Best estimate 1 729 584
Risk margin 18 967
Technical provisions - life (excluding index-linked and unit-linked) 24 548 779
Technical provisions - health (similar to life) 0
TP calculated as a whole 0
Best estimate 0
Risk margin 0
Technical provisions – life (excluding health and index-linked and unit-linked) 24 548 779
TP calculated as a whole 0
Best estimate 23 737 111
Risk margin 811 668
Technical provisions – index-linked and unit-linked 15 673 154
TP calculated as a whole 0
Best estimate 15 421 621
Risk margin 251 533
Other technical provisions 0
Contingent liabilities 0
Provisions other than technical provisions 66 993
Pension benefit obligations 0
Deposits from reinsurers 1 400 000
Deferred tax liabilities 464 107
Derivatives 753 070
Debts owed to credit institutions 1 162 859
Financial liabilities other than debts owed to credit institutions 989 511
Insurance & intermediaries payables 2 434 436
Reinsurance payables 6 397 292
Payables (trade, not insurance) 3 579 503
Subordinated liabilities 0
Subordinated liabilities not in BOF 0
Subordinated liabilities in BOF 0
Any other liabilities, not elsewhere shown 2 544 131
Total liabilities 77 185 327
Excess of assets over liabilities 30 645 675
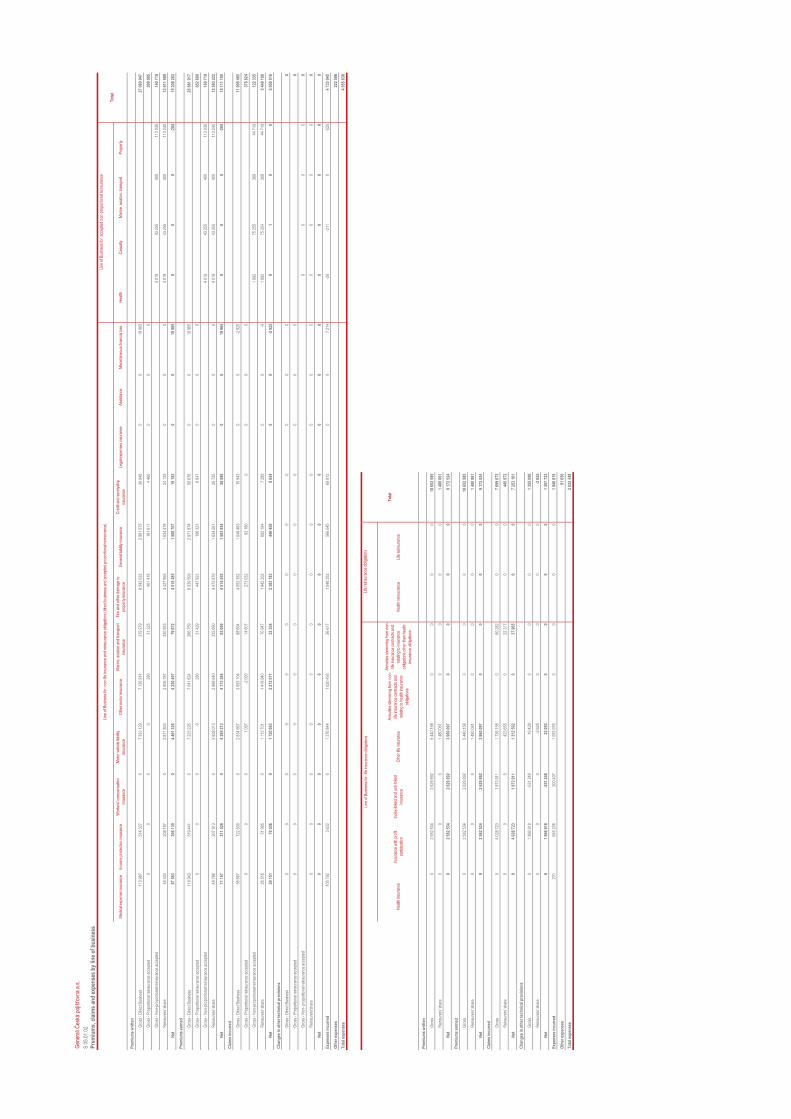
Gen
eral
i Čes
ká p
ojiš
ťovn
a a.
s.
Pre
miu
ms,
cla
ims
and
exp
ense
s b
y li
ne
of
bu
sin
ess
Med
ical
exp
ense
insu
ranc
eIn
com
e pr
otec
tion
insu
ranc
eW
orke
rs' c
ompe
nsat
ion
insu
ranc
e
Mot
or v
ehic
le li
abilit
y
insu
ranc
eO
ther
mot
or in
sura
nce
Mar
ine,
avi
atio
n an
d tr
ansp
ort
insu
ranc
e
Fire
and
oth
er d
amag
e to
prop
erty
insu
ranc
eG
ener
al li
abilit
y in
sura
nce
Cre
dit a
nd s
uret
yshi
p
insu
ranc
eLe
gal e
xpen
ses
insu
ranc
eA
ssis
tanc
eM
isce
llane
ous
finan
cial
loss
Hea
lthC
asua
ltyM
arin
e, a
viat
ion,
tran
spor
tP
rope
rty
Pre
miu
ms
wri
tten
Gro
ss -
Dire
ct B
usin
ess
113
987
514
327
07
333
129
7 13
6 91
437
9 27
98
542
022
2 98
1 57
538
848
00
19 9
6527
060
047
Gro
ss -
Pro
port
iona
l rei
nsur
ance
acc
epte
d 0
00
028
031
325
401
418
161
611
4 46
00
00
599
095
Gro
ss -
Non
-pro
port
iona
l rei
nsur
ance
acc
epte
d 4
019
43 2
5540
011
3 03
616
0 71
0
Rei
nsur
ers'
sha
re46
403
208
187
02
871
803
2 90
6 78
733
0 93
34
427
955
1 63
4 47
924
125
00
04
019
43 2
5540
011
3 24
012
611
589
Net
67 5
8330
6 13
90
4 46
1 32
64
230
407
79 6
724
515
485
1 50
8 70
719
183
00
19 9
650
00
-204
15 2
08 2
63
Pre
miu
ms
earn
ed
Gro
ss -
Dire
ct B
usin
ess
119
943
519
441
07
223
226
7 04
1 62
438
6 75
98
539
509
2 97
1 87
458
676
00
19 9
6526
881
017
Gro
ss -
Pro
port
iona
l rei
nsur
ance
acc
epte
d 0
00
-028
031
429
447
923
166
321
6 64
70
00
652
600
Gro
ss -
Non
-pro
port
iona
l rei
nsur
ance
acc
epte
d 4
019
43 2
5540
011
3 03
616
0 71
0
Rei
nsur
ers'
sha
re48
786
207
913
02
828
013
2 86
8 64
033
5 09
04
472
879
1 63
4 26
126
725
00
04
019
43 2
5540
011
3 24
012
583
222
Net
71 1
5731
1 52
80
4 39
5 21
34
173
264
83 0
994
514
552
1 50
3 93
438
598
00
19 9
650
00
-204
15 1
11 1
05
Cla
ims
incu
rred
Gro
ss -
Dire
ct B
usin
ess
55 6
6712
2 50
00
2 83
4 66
73
693
104
88 6
944
052
352
1 04
6 46
315
943
00
-2 9
2511
906
465
Gro
ss -
Pro
port
iona
l rei
nsur
ance
acc
epte
d 0
00
1 09
7-2
093
14 6
0727
3 03
292
180
00
00
378
824
Gro
ss -
Non
-pro
port
iona
l rei
nsur
ance
acc
epte
d 1
992
75 2
5536
944
719
122
335
Rei
nsur
ers'
sha
re26
516
51 9
950
1 11
5 70
11
418
940
70 9
471
942
202
692
184
7 28
90
0-0
1 99
275
254
369
44 7
195
448
108
Net
29 1
5170
506
01
720
063
2 27
2 07
132
354
2 38
3 18
344
6 45
88
654
00
-2 9
250
10
06
959
516
Ch
ang
es in
oth
er t
ech
nic
al p
rovi
sio
ns
Gro
ss -
Dire
ct B
usin
ess
00
00
00
00
00
00
0
Gro
ss -
Pro
port
iona
l rei
nsur
ance
acc
epte
d0
00
00
00
00
00
00
Gro
ss -
Non
- pr
opor
tiona
l rei
nsur
ance
acc
epte
d0
00
00
Rei
nsur
ers'
shar
e0
00
00
00
00
00
00
00
00
Net
00
00
00
00
00
00
00
00
0
Exp
ense
s in
curr
ed10
5 79
23
632
01
376
844
1 02
0 49
336
617
1 54
8 35
256
6 04
568
812
00
7 21
4-2
0-2
110
-525
4 73
3 04
5
Oth
er e
xpen
ses
222
586
To
tal e
xpen
ses
4 95
5 63
0
Hea
lth in
sura
nce
Insu
ranc
e w
ith p
rofit
part
icip
atio
n
Inde
x-lin
ked
and
unit-
linke
d
insu
ranc
eO
ther
life
insu
ranc
e
Ann
uitie
s st
emm
ing
from
non
-
life
insu
ranc
e co
ntra
cts
and
rela
ting
to h
ealth
insu
ranc
e
oblig
atio
ns
Ann
uitie
s st
emm
ing
from
non
-
life
insu
ranc
e co
ntra
cts
and
rela
ting
to in
sura
nce
oblig
atio
ns o
ther
than
hea
lth
insu
ranc
e ob
ligat
ions
Hea
lth r
eins
uran
ceLi
fe r
eins
uran
ce
Pre
miu
ms
wri
tten
Gro
ss0
2 58
2 53
42
629
892
5 44
0 15
80
00
010
652
585
Rei
nsur
ers'
sha
re0
00
1 48
0 06
10
00
01
480
061
Net
02
582
534
2 62
9 89
23
960
097
00
00
9 17
2 52
4
Pre
miu
ms
earn
ed
Gro
ss0
2 58
2 53
42
629
892
5 44
0 15
80
00
010
652
585
Rei
nsur
ers'
sha
re0
00
1 48
0 06
10
00
01
480
061
Net
02
582
534
2 62
9 89
23
960
097
00
00
9 17
2 52
4
Cla
ims
incu
rred
Gro
ss0
4 02
8 72
31
873
911
1 73
6 15
80
60 2
820
07
699
073
Rei
nsur
ers'
sha
re0
00
423
655
022
317
00
445
972
Net
04
028
723
1 87
3 91
11
312
502
037
965
00
7 25
3 10
1
Ch
ang
es in
oth
er t
ech
nic
al p
rovi
sio
ns
Gro
ss0
1 86
6 91
8-5
31 2
4819
428
00
00
1 35
5 09
8
Rei
nsur
ers'
sha
re0
00
-2 6
250
00
0-2
625
Net
01
866
918
-531
248
22 0
530
00
01
357
723
Exp
ense
s in
curr
ed23
164
6 20
620
0 40
71
093
976
00
00
1 94
0 81
9
Oth
er e
xpen
ses
91 6
30
To
tal e
xpen
ses
2 03
2 44
9
S.0
5.01
.02
Line
of B
usin
ess
for:
non
-life
insu
ranc
e an
d re
insu
ranc
e ob
ligat
ions
(di
rect
bus
ines
s an
d ac
cept
ed p
ropo
rtio
nal r
eins
uran
ce)
Line
of B
usin
ess
for:
acc
epte
d no
n-pr
opor
tiona
l rei
nsur
ance
To
tal
Line
of B
usin
ess
for:
life
insu
ranc
e ob
ligat
ions
Life
rei
nsur
ance
obl
igat
ions
To
tal
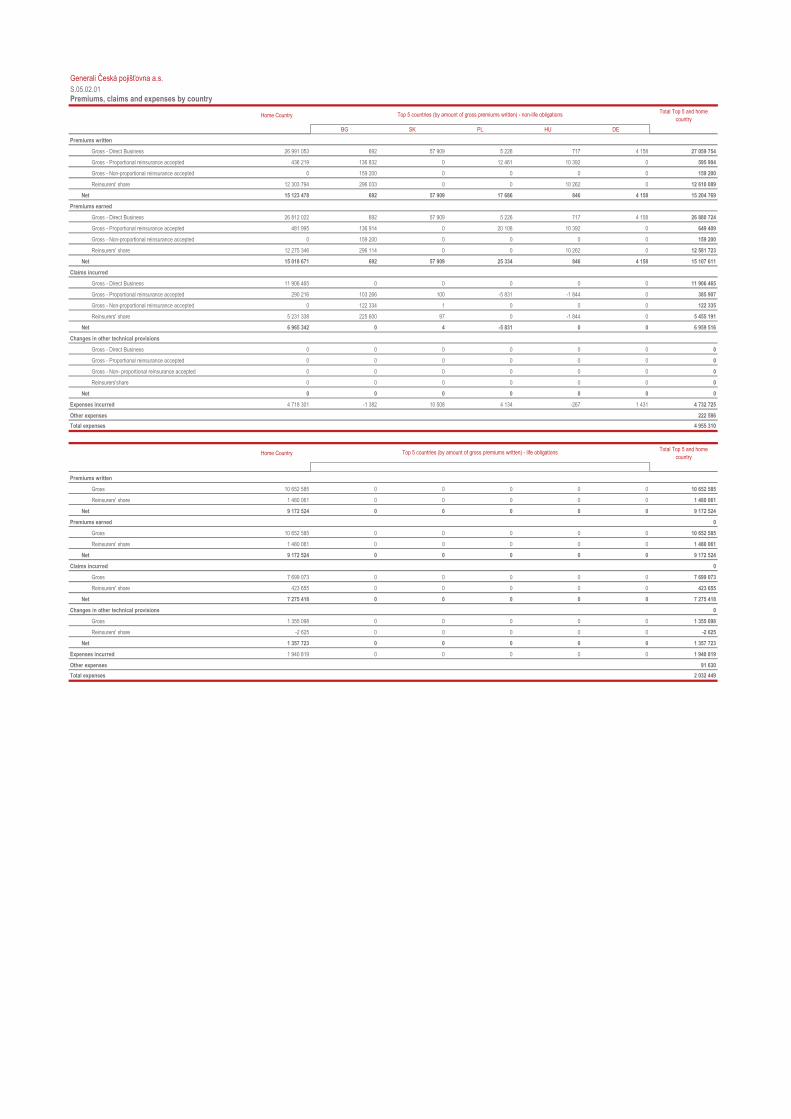
Generali Česká pojišťovna a.s.
Premiums, claims and expenses by country
Home CountryTotal Top 5 and home
country
BG SK PL HU DE
Premiums written
Gross - Direct Business 26 991 053 692 57 909 5 226 717 4 158 27 059 754
Gross - Proportional reinsurance accepted 436 219 136 832 0 12 461 10 392 0 595 904
Gross - Non-proportional reinsurance accepted 0 159 200 0 0 0 0 159 200
Reinsurers' share 12 303 794 296 033 0 0 10 262 0 12 610 089
Net 15 123 478 692 57 909 17 686 846 4 158 15 204 769
Premiums earned
Gross - Direct Business 26 812 022 692 57 909 5 226 717 4 158 26 880 724
Gross - Proportional reinsurance accepted 481 995 136 914 0 20 108 10 392 0 649 409
Gross - Non-proportional reinsurance accepted 0 159 200 0 0 0 0 159 200
Reinsurers' share 12 275 346 296 114 0 0 10 262 0 12 581 723
Net 15 018 671 692 57 909 25 334 846 4 158 15 107 611
Claims incurred
Gross - Direct Business 11 906 465 0 0 0 0 0 11 906 465
Gross - Proportional reinsurance accepted 290 216 103 266 100 -5 831 -1 844 0 385 907
Gross - Non-proportional reinsurance accepted 0 122 334 1 0 0 0 122 335
Reinsurers' share 5 231 338 225 600 97 0 -1 844 0 5 455 191
Net 6 965 342 0 4 -5 831 0 0 6 959 516
Changes in other technical provisions
Gross - Direct Business 0 0 0 0 0 0 0
Gross - Proportional reinsurance accepted 0 0 0 0 0 0 0
Gross - Non- proportional reinsurance accepted 0 0 0 0 0 0 0
Reinsurers'share 0 0 0 0 0 0 0
Net 0 0 0 0 0 0 0
Expenses incurred 4 718 301 -1 382 10 508 4 134 -267 1 431 4 732 725
Other expenses 222 586
Total expenses 4 955 310
Home CountryTotal Top 5 and home
country
Premiums written
Gross 10 652 585 0 0 0 0 0 10 652 585
Reinsurers' share 1 480 061 0 0 0 0 0 1 480 061
Net 9 172 524 0 0 0 0 0 9 172 524
Premiums earned 0
Gross 10 652 585 0 0 0 0 0 10 652 585
Reinsurers' share 1 480 061 0 0 0 0 0 1 480 061
Net 9 172 524 0 0 0 0 0 9 172 524
Claims incurred 0
Gross 7 699 073 0 0 0 0 0 7 699 073
Reinsurers' share 423 655 0 0 0 0 0 423 655
Net 7 275 418 0 0 0 0 0 7 275 418
Changes in other technical provisions 0
Gross 1 355 098 0 0 0 0 0 1 355 098
Reinsurers' share -2 625 0 0 0 0 0 -2 625
Net 1 357 723 0 0 0 0 0 1 357 723
Expenses incurred 1 940 819 0 0 0 0 0 1 940 819
Other expenses 91 630
Total expenses 2 032 449
S.05.02.01
Top 5 countries (by amount of gross premiums written) - non-life obligations
Top 5 countries (by amount of gross premiums written) - life obligations
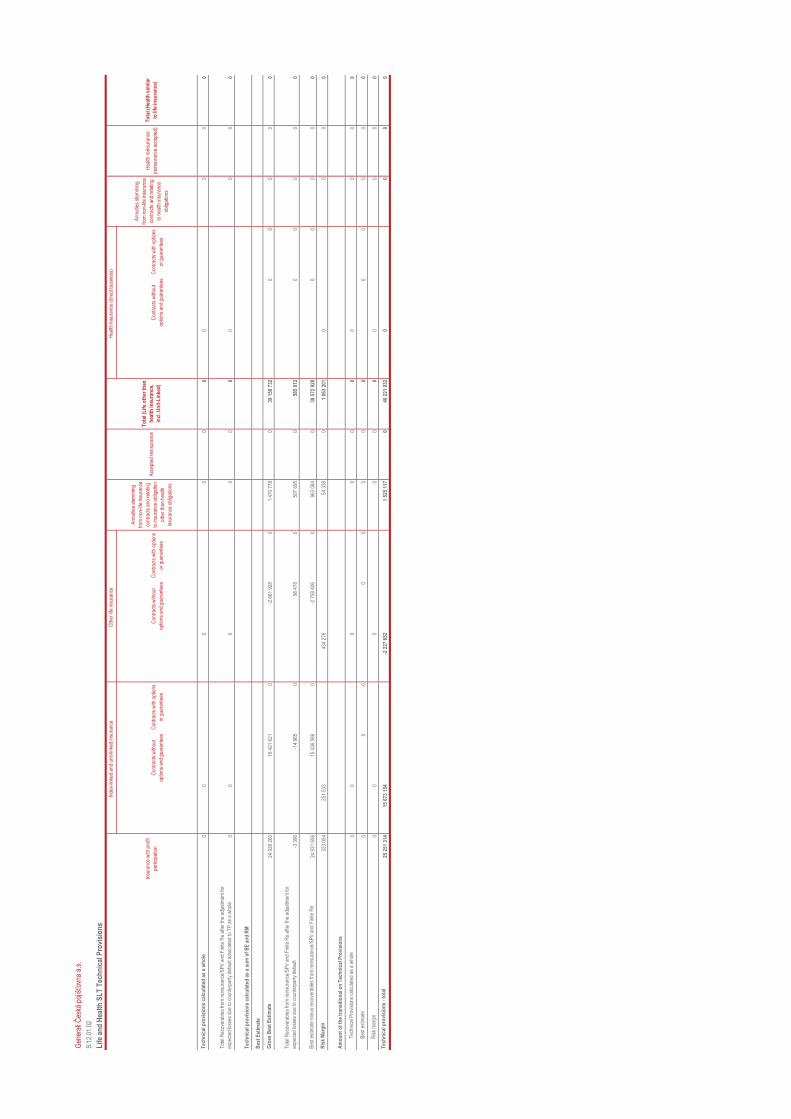
Gen
eral
i Čes
ká p
ojiš
ťovn
a a.
s.
Lif
e an
d H
ealt
h S
LT
Tec
hn
ical
Pro
visi
on
s
Con
trac
ts w
ithou
t
optio
ns a
nd g
uara
ntee
s
Con
trac
ts w
ith o
ptio
ns
or g
uara
ntee
s
Con
trac
ts w
ithou
t
optio
ns a
nd g
uara
ntee
s
Con
trac
ts w
ith o
ptio
ns
or g
uara
ntee
s
Con
trac
ts w
ithou
t
optio
ns a
nd g
uara
ntee
s
Con
trac
ts w
ith o
ptio
ns
or g
uara
ntee
s
Tec
hn
ical
pro
visi
on
s ca
lcu
late
d a
s a
wh
ole
00
00
00
00
00
Tot
al R
ecov
erab
les
from
rei
nsur
ance
/SP
V a
nd F
inite
Re
afte
r th
e ad
just
men
t for
expe
cted
loss
es d
ue to
cou
nter
part
y de
faul
t ass
ocia
ted
to T
P a
s a
who
le0
00
00
00
00
0
Tec
hn
ical
pro
visi
on
s ca
lcu
late
d a
s a
sum
of
BE
an
d R
M��
Bes
t E
stim
ate��
Gro
ss B
est
Est
imat
e24
928
260
15 4
21 6
210
-2 6
61 9
280
1 47
0 77
80
39 1
58 7
320
00
00
Tot
al R
ecov
erab
les
from
rei
nsur
ance
/SP
V a
nd F
inite
Re
afte
r th
e ad
just
men
t for
expe
cted
loss
es d
ue to
cou
nter
part
y de
faul
t-3
396
-14
965
096
478
050
7 69
50
585
812
00
00
0
Bes
t est
imat
e m
inus
rec
over
able
s fr
om r
eins
uran
ce/S
PV
and
Fin
ite R
e24
931
656
15 4
36 5
860
-2 7
58 4
060
963
084
038
572
920
00
00
0
Ris
k M
arg
in32
3 05
425
1 53
343
4 27
654
338
01
063
201
00
00
Am
ou
nt
of
the
tran
siti
on
al o
n T
ech
nic
al P
rovi
sio
ns��
Tec
hnic
al P
rovi
sion
s ca
lcul
ated
as
a w
hole
00
00
00
00
00
Bes
t est
imat
e 0
00
00
00
00
00
00
Ris
k m
argi
n0
00
00
00
00
0
Tec
hn
ical
pro
visi
on
s -
tota
l25
251
314
15 6
73 1
54-2
227
652
1 52
5 11
70
40 2
21 9
320
00
0
Acc
epte
d re
insu
ranc
e
S.1
2.01
.02
Insu
ranc
e w
ith p
rofit
part
icip
atio
n
Inde
x-lin
ked
and
unit-
linke
d in
sura
nce��
Oth
er li
fe in
sura
nce��
Ann
uitie
s st
emm
ing
from
non
-life
insu
ranc
e
cont
ract
s an
d re
latin
g
to in
sura
nce
oblig
atio
n
othe
r th
an h
ealth
insu
ranc
e ob
ligat
ions
To
tal (
Lif
e o
ther
th
an
hea
lth
insu
ran
ce,
incl
. Un
it-L
inke
d)
Hea
lth in
sura
nce
(dire
ct b
usin
ess)
��
Ann
uitie
s st
emm
ing
from
non
-life
insu
ranc
e
cont
ract
s an
d re
latin
g
to h
ealth
insu
ranc
e
oblig
atio
ns
Hea
lth r
eins
uran
ce
(rei
nsur
ance
acc
epte
d)
To
tal (
Hea
lth
sim
ilar
to li
fe in
sura
nce
)
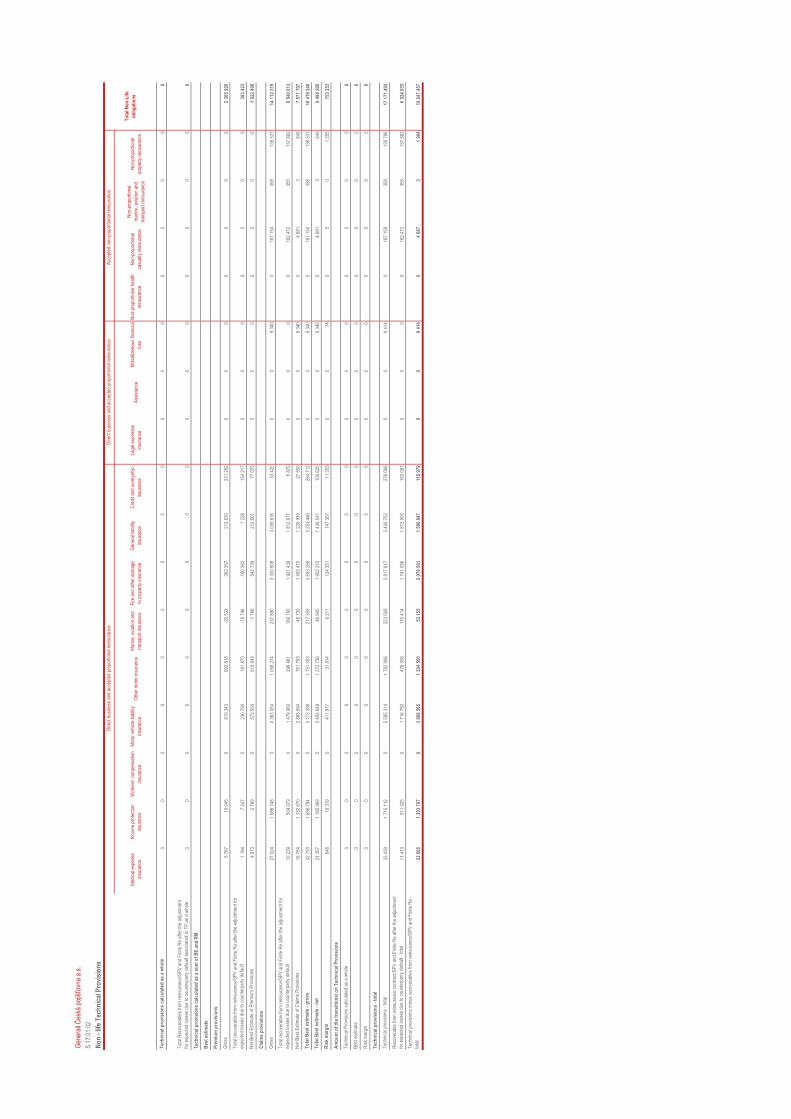
Gen
eral
i Čes
ká p
ojiš
ťovn
a a.
s.
No
n -
life
Tec
hn
ical
Pro
visi
on
s
Med
ical
exp
ense
insu
ranc
e
Inco
me
prot
ectio
n
insu
ranc
e
Wor
kers
' com
pens
atio
n
insu
ranc
e
Mot
or v
ehic
le li
abili
ty
insu
ranc
eO
ther
mot
or in
sura
nce
Mar
ine,
avi
atio
n an
d
tran
spor
t in
sura
nce
Fire
and
oth
er d
amag
e
to p
rope
rty
insu
ranc
e
Gen
eral
liab
ility
insu
ranc
e
Cre
dit
and
sure
tysh
ip
insu
ranc
e
Lega
l exp
ense
s
insu
ranc
eA
ssis
tanc
eM
isce
llane
ous
finan
cial
loss
Non
-pro
port
iona
l hea
lth
rein
sura
nce
Non
-pro
port
iona
l
casu
alty
rei
nsur
ance
Non
-pro
port
iona
l
mar
ine,
avi
atio
n an
d
tran
spor
t re
insu
ranc
e
Non
-pro
port
iona
l
prop
erty
rei
nsur
ance
Tec
hn
ical
pro
visi
on
s ca
lcu
late
d a
s a
wh
ole
00
00
00
00
00
00
00
00
0
Tot
al R
ecov
erab
les
from
rei
nsur
ance
/SP
V a
nd F
inite
Re
afte
r th
e ad
just
men
t
for
expe
cted
loss
es d
ue t
o co
unte
rpar
ty d
efau
lt as
soci
ated
to
TP
as
a w
hole
00
00
00
00
00
00
00
00
0
Tec
hn
ical
pro
visi
on
s ca
lcu
late
d a
s a
sum
of
BE
an
d R
M
Bes
t es
tim
ate
Pre
miu
m p
rovi
sio
ns
Gro
ss5
767
10 0
450
810
343
692
818
-20
532
362
357
213
830
231
292
00
00
00
02
305
920
Tot
al r
ecov
erab
le f
rom
rei
nsur
ance
/SP
V a
nd F
inite
Re
afte
r th
e ad
just
men
t fo
r
expe
cted
loss
es d
ue t
o co
unte
rpar
ty d
efau
lt1
194
7 24
70
236
790
181
875
-18
746
-180
382
1 22
815
4 21
70
00
00
00
383
423
Net
Bes
t E
stim
ate
of P
rem
ium
Pro
visi
ons
4 57
32
799
057
3 55
451
0 94
3-1
786
542
739
212
601
77 0
750
00
00
0-0
1 92
2 49
8
Cla
ims
pro
visi
on
s
Gro
ss27
024
1 68
6 74
80
4 36
3 05
41
058
274
237
890
3 33
0 90
93
039
616
33 4
200
09
340
018
7 15
435
813
8 53
114
112
319
Tot
al r
ecov
erab
le f
rom
rei
nsur
ance
/SP
V a
nd F
inite
Re
afte
r th
e ad
just
men
t fo
r
expe
cted
loss
es d
ue t
o co
unte
rpar
ty d
efau
lt10
239
504
079
01
479
960
296
481
189
160
1 92
1 43
81
812
677
5 87
00
00
018
2 47
235
513
7 88
26
540
613
Net
Bes
t E
stim
ate
of C
laim
s P
rovi
sion
s16
784
1 18
2 67
00
2 88
3 09
476
1 79
348
730
1 40
9 47
01
226
939
27 5
500
09
340
04
681
364
97
571
707
To
tal
Bes
t es
tim
ate
- g
ross
32 7
901
696
794
05
173
398
1 75
1 09
321
7 35
93
693
266
3 25
3 44
626
4 71
20
09
340
018
7 15
435
813
8 53
116
418
240
To
tal
Bes
t es
tim
ate
- n
et21
357
1 18
5 46
90
3 45
6 64
81
272
736
46 9
451
952
210
1 43
9 54
110
4 62
50
09
340
04
681
364
99
494
205
Ris
k m
arg
in64
818
319
041
1 91
731
814
6 21
112
4 35
114
7 30
711
353
00
740
50
1 25
575
3 25
3
Am
ou
nt
of
the
tran
siti
on
al o
n T
ech
nic
al P
rovi
sio
ns
Tec
hnic
al P
rovi
sion
s ca
lcul
ated
as
a w
hole
00
00
00
00
00
00
00
00
0
Bes
t es
timat
e 0
00
00
00
00
00
00
00
00
Ris
k m
argi
n0
00
00
00
00
00
00
00
00
Tec
hn
ical
pro
visi
on
s -
tota
l
Tec
hnic
al p
rovi
sion
s -
tota
l33
439
1 71
5 11
20
5 58
5 31
41
782
906
223
569
3 81
7 61
73
400
752
276
066
00
9 41
40
187
159
358
139
786
17 1
71 4
92
Rec
over
able
fro
m r
eins
uran
ce c
ontr
act/
SP
V a
nd F
inite
Re
afte
r th
e ad
just
men
t
for
expe
cted
loss
es d
ue t
o co
unte
rpar
ty d
efau
lt -
tota
l11
433
511
325
01
716
750
478
356
170
414
1 74
1 05
61
813
905
160
087
00
00
182
472
355
137
882
6 92
4 03
5
Tec
hnic
al p
rovi
sion
s m
inus
rec
over
able
s fr
om r
eins
uran
ce/S
PV
and
Fin
ite R
e -
tota
l22
005
1 20
3 78
70
3 86
8 56
51
304
550
53 1
552
076
561
1 58
6 84
711
5 97
90
09
414
04
687
31
904
10 2
47 4
57
S.1
7.01
.02
Dire
ct b
usin
ess
and
acce
pted
pro
port
iona
l rei
nsur
ance
Dire
ct b
usin
ess
and
acce
pted
pro
port
iona
l rei
nsur
ance
Acc
epte
d no
n-pr
opor
tiona
l rei
nsur
ance
:���
To
tal
No
n-L
ife
ob
lig
atio
ns
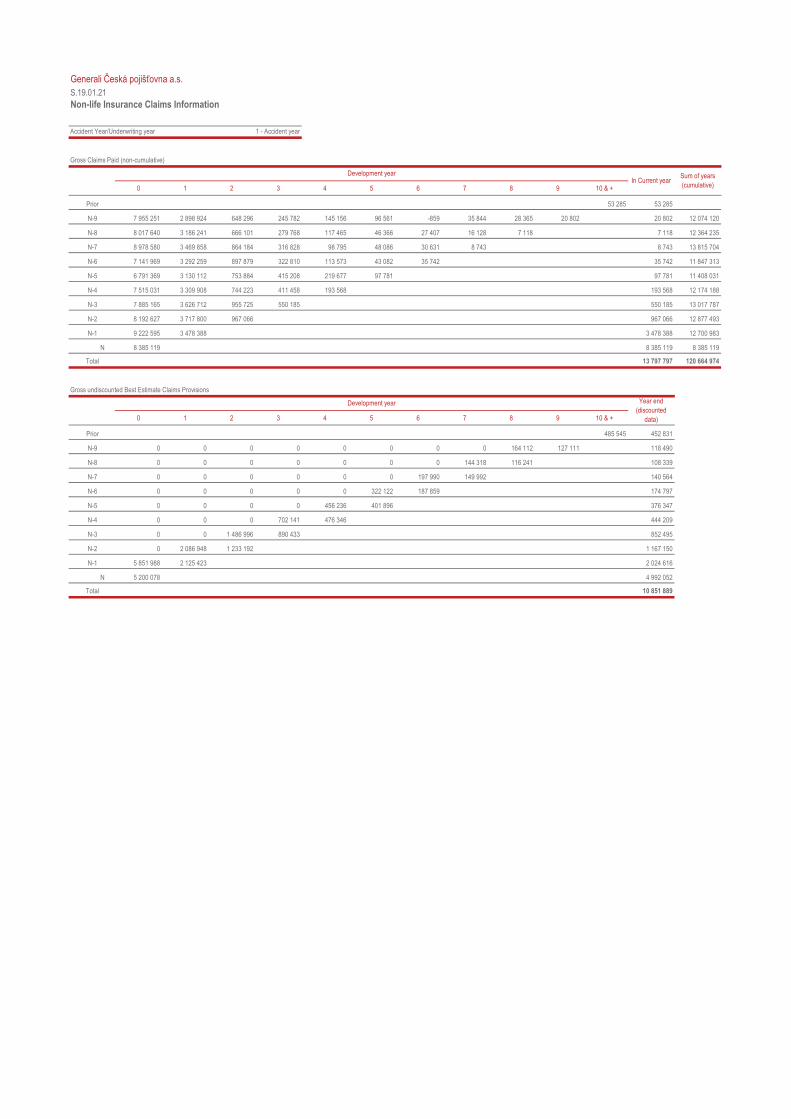
Generali Česká pojišťovna a.s.
Non-life Insurance Claims Information
Accident Year/Underwriting year 1 - Accident year
Gross Claims Paid (non-cumulative)
0 1 2 3 4 5 6 7 8 9 10 & +
Prior 53 285 53 285
N-9 7 955 251 2 898 924 648 296 245 782 145 156 96 561 -859 35 844 28 365 20 802 20 802 12 074 120
N-8 8 017 640 3 186 241 666 101 279 768 117 465 46 366 27 407 16 128 7 118 7 118 12 364 235
N-7 8 978 580 3 469 858 864 184 316 828 98 795 48 086 30 631 8 743 8 743 13 815 704
N-6 7 141 969 3 292 259 897 879 322 810 113 573 43 082 35 742 35 742 11 847 313
N-5 6 791 369 3 130 112 753 884 415 208 219 677 97 781 97 781 11 408 031
N-4 7 515 031 3 309 908 744 223 411 458 193 568 193 568 12 174 188
N-3 7 885 165 3 626 712 955 725 550 185 550 185 13 017 787
N-2 8 192 627 3 717 800 967 066 967 066 12 877 493
N-1 9 222 595 3 478 388 3 478 388 12 700 983
N 8 385 119 8 385 119 8 385 119
Total 13 797 797 120 664 974
Gross undiscounted Best Estimate Claims Provisions
0 1 2 3 4 5 6 7 8 9 10 & +
Prior 485 545 452 831
N-9 0 0 0 0 0 0 0 0 164 112 127 111 118 490
N-8 0 0 0 0 0 0 0 144 318 116 241 108 339
N-7 0 0 0 0 0 0 197 990 149 992 140 564
N-6 0 0 0 0 0 322 122 187 859 174 797
N-5 0 0 0 0 456 236 401 896 376 347
N-4 0 0 0 702 141 476 346 444 209
N-3 0 0 1 486 996 890 433 852 495
N-2 0 2 086 948 1 233 192 1 167 150
N-1 5 851 988 2 125 423 2 024 616
N 5 200 078 4 992 052
Total 10 851 889
S.19.01.21
Development yearIn Current year
Sum of years
(cumulative)
Development year Year end
(discounted
data)
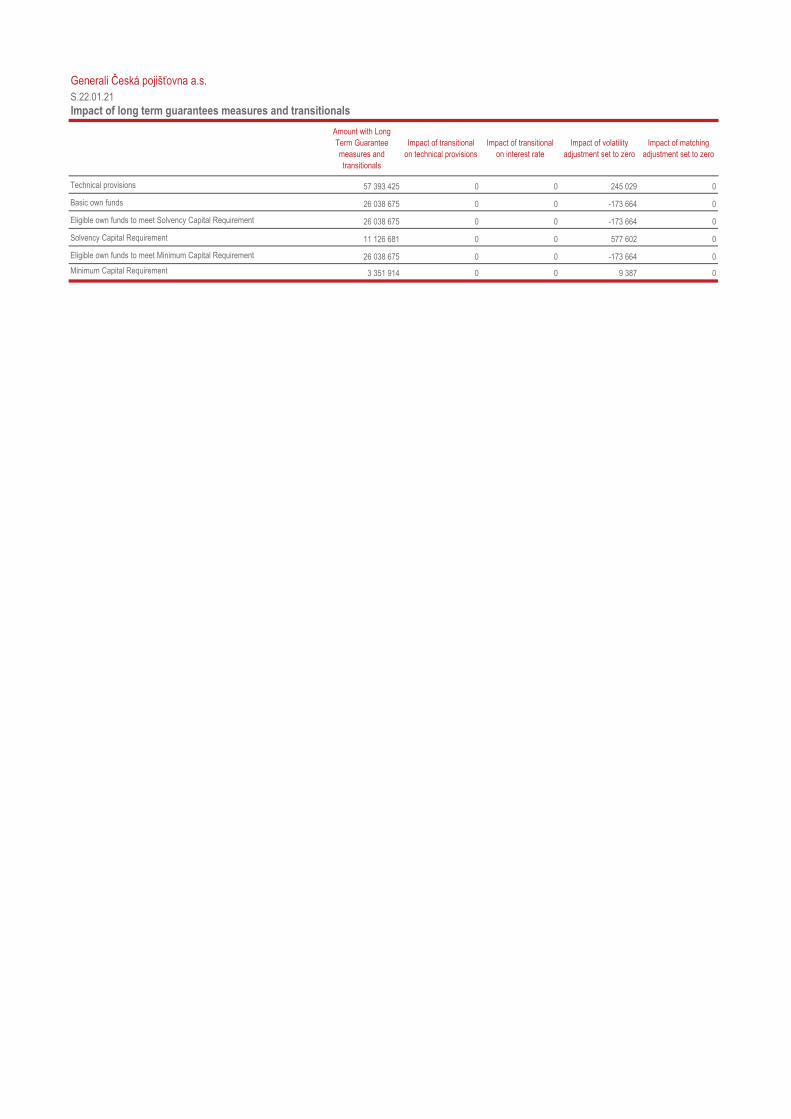
Generali Česká pojišťovna a.s.
Impact of long term guarantees measures and transitionals
Amount with Long
Term Guarantee
measures and
transitionals
Impact of transitional
on technical provisions
Impact of transitional
on interest rate
Impact of volatility
adjustment set to zero
Impact of matching
adjustment set to zero
Technical provisions 57 393 425 0 0 245 029 0
Basic own funds 26 038 675 0 0 -173 664 0
Eligible own funds to meet Solvency Capital Requirement 26 038 675 0 0 -173 664 0
Solvency Capital Requirement 11 126 681 0 0 577 602 0
Eligible own funds to meet Minimum Capital Requirement 26 038 675 0 0 -173 664 0
Minimum Capital Requirement 3 351 914 0 0 9 387 0
S.22.01.21
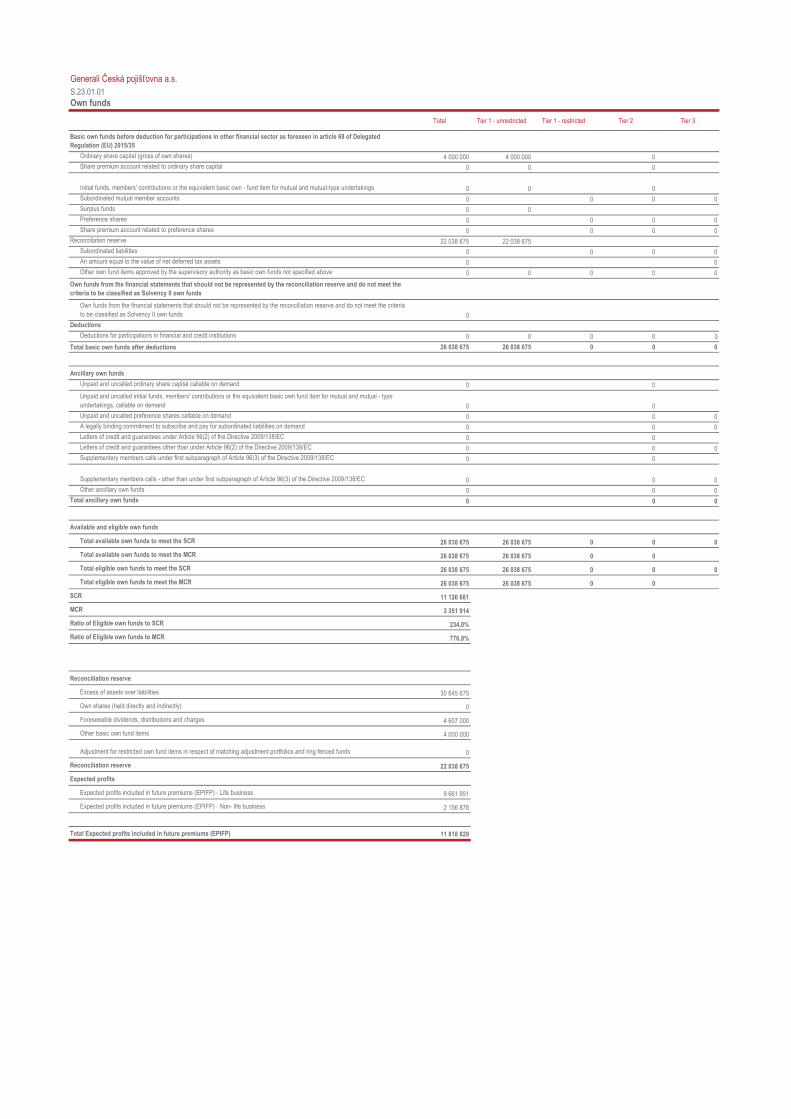
Generali Česká pojišťovna a.s.
Own funds
Total Tier 1 - unrestricted Tier 1 - restricted Tier 2 Tier 3
Basic own funds before deduction for participations in other financial sector as foreseen in article 68 of Delegated
Regulation (EU) 2015/35
Ordinary share capital (gross of own shares) 4 000 000 4 000 000 0
Share premium account related to ordinary share capital 0 0 0
Initial funds, members' contributions or the equivalent basic own - fund item for mutual and mutual-type undertakings 0 0 0
Subordinated mutual member accounts 0 0 0 0
Surplus funds 0 0
Preference shares 0 0 0 0
Share premium account related to preference shares 0 0 0 0
Reconciliation reserve 22 038 675 22 038 675
Subordinated liabilities 0 0 0 0
An amount equal to the value of net deferred tax assets 0 0
Other own fund items approved by the supervisory authority as basic own funds not specified above 0 0 0 0 0
Own funds from the financial statements that should not be represented by the reconciliation reserve and do not meet the
criteria to be classified as Solvency II own funds
Own funds from the financial statements that should not be represented by the reconciliation reserve and do not meet the criteria
to be classified as Solvency II own funds 0
Deductions
Deductions for participations in financial and credit institutions 0 0 0 0 0
Total basic own funds after deductions 26 038 675 26 038 675 0 0 0
Ancillary own funds
Unpaid and uncalled ordinary share capital callable on demand 0 0
Unpaid and uncalled initial funds, members' contributions or the equivalent basic own fund item for mutual and mutual - type
undertakings, callable on demand 0 0
Unpaid and uncalled preference shares callable on demand 0 0 0
A legally binding commitment to subscribe and pay for subordinated liabilities on demand 0 0 0
Letters of credit and guarantees under Article 96(2) of the Directive 2009/138/EC 0 0
Letters of credit and guarantees other than under Article 96(2) of the Directive 2009/138/EC 0 0 0
Supplementary members calls under first subparagraph of Article 96(3) of the Directive 2009/138/EC 0 0
Supplementary members calls - other than under first subparagraph of Article 96(3) of the Directive 2009/138/EC 0 0 0
Other ancillary own funds 0 0 0
Total ancillary own funds 0 0 0
Available and eligible own funds
Total available own funds to meet the SCR 26 038 675 26 038 675 0 0 0
Total available own funds to meet the MCR 26 038 675 26 038 675 0 0
Total eligible own funds to meet the SCR 26 038 675 26 038 675 0 0 0
Total eligible own funds to meet the MCR 26 038 675 26 038 675 0 0
SCR 11 126 681
MCR 3 351 914
Ratio of Eligible own funds to SCR 234,0%
Ratio of Eligible own funds to MCR 776,8%
Reconciliation reserve
Excess of assets over liabilities 30 645 675
Own shares (held directly and indirectly) 0
Foreseeable dividends, distributions and charges 4 607 000
Other basic own fund items 4 000 000
Adjustment for restricted own fund items in respect of matching adjustment portfolios and ring fenced funds 0
Reconciliation reserve 22 038 675
Expected profits
Expected profits included in future premiums (EPIFP) - Life business 9 661 951
Expected profits included in future premiums (EPIFP) - Non- life business 2 156 878
Total Expected profits included in future premiums (EPIFP) 11 818 829
S.23.01.01
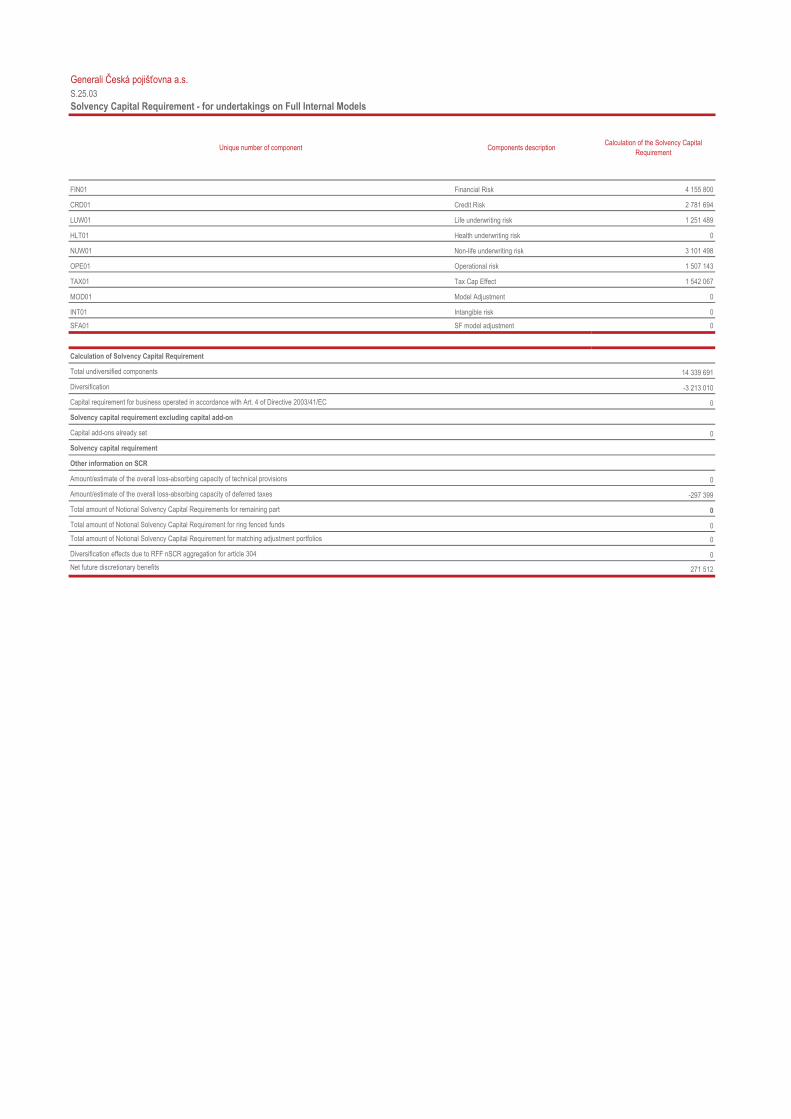
Generali Česká pojišťovna a.s.
Solvency Capital Requirement - for undertakings on Full Internal Models
Unique number of component Components description Calculation of the Solvency Capital
Requirement
FIN01 Financial Risk 4 155 800
CRD01 Credit Risk 2 781 694
LUW01 Life underwriting risk 1 251 489
HLT01 Health underwriting risk 0
NUW01 Non-life underwriting risk 3 101 498
OPE01 Operational risk 1 507 143
TAX01 Tax Cap Effect 1 542 067
MOD01 Model Adjustment 0
INT01 Intangible risk 0
SFA01 SF model adjustment 0
Calculation of Solvency Capital Requirement
Total undiversified components 14 339 691
Diversification -3 213 010
Capital requirement for business operated in accordance with Art. 4 of Directive 2003/41/EC 0
Solvency capital requirement excluding capital add-on
Capital add-ons already set 0
Solvency capital requirement
Other information on SCR
Amount/estimate of the overall loss-absorbing capacity of technical provisions 0
Amount/estimate of the overall loss-absorbing capacity of deferred taxes -297 399
Total amount of Notional Solvency Capital Requirements for remaining part 0
Total amount of Notional Solvency Capital Requirement for ring fenced funds 0
Total amount of Notional Solvency Capital Requirement for matching adjustment portfolios 0
Diversification effects due to RFF nSCR aggregation for article 304 0
Net future discretionary benefits 271 512
S.25.03
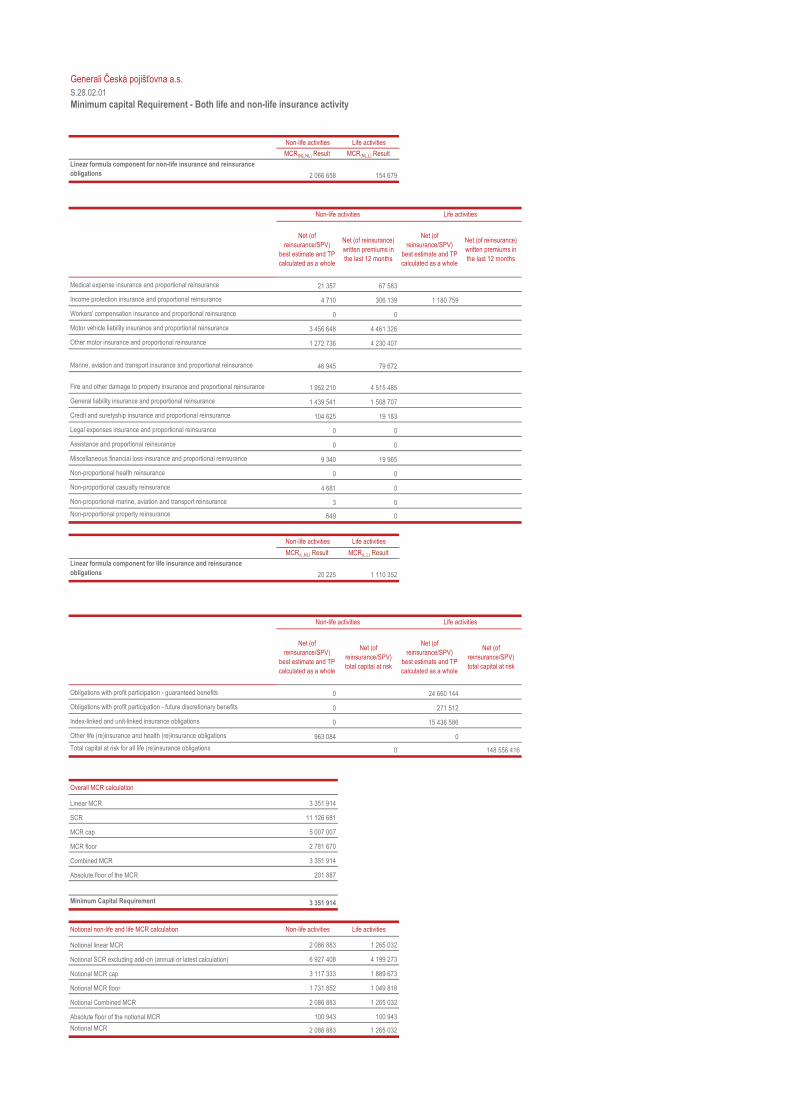
Generali Česká pojišťovna a.s.
Minimum capital Requirement - Both life and non-life insurance activity
Non-life activities Life activities
MCR(NL,NL) Result MCR(NL,L) Result
Linear formula component for non-life insurance and reinsurance
obligations 2 066 658 154 679
Net (of
reinsurance/SPV)
best estimate and TP
calculated as a whole
Net (of reinsurance)
written premiums in
the last 12 months
Net (of
reinsurance/SPV)
best estimate and TP
calculated as a whole
Net (of reinsurance)
written premiums in
the last 12 months
Medical expense insurance and proportional reinsurance 21 357 67 583
Income protection insurance and proportional reinsurance 4 710 306 139 1 180 759
Workers' compensation insurance and proportional reinsurance 0 0
Motor vehicle liability insurance and proportional reinsurance 3 456 648 4 461 326
Other motor insurance and proportional reinsurance 1 272 736 4 230 407
Marine, aviation and transport insurance and proportional reinsurance 46 945 79 672
Fire and other damage to property insurance and proportional reinsurance 1 952 210 4 515 485
General liability insurance and proportional reinsurance 1 439 541 1 508 707
Credit and suretyship insurance and proportional reinsurance 104 625 19 183
Legal expenses insurance and proportional reinsurance 0 0
Assistance and proportional reinsurance 0 0
Miscellaneous financial loss insurance and proportional reinsurance 9 340 19 965
Non-proportional health reinsurance 0 0
Non-proportional casualty reinsurance 4 681 0
Non-proportional marine, aviation and transport reinsurance 3 0
Non-proportional property reinsurance 649 0
Non-life activities Life activities
MCR(L,NL) Result MCR(L,L) Result
Linear formula component for life insurance and reinsurance
obligations 20 225 1 110 352
Net (of
reinsurance/SPV)
best estimate and TP
calculated as a whole
Net (of
reinsurance/SPV)
total capital at risk
Net (of
reinsurance/SPV)
best estimate and TP
calculated as a whole
Net (of
reinsurance/SPV)
total capital at risk
Obligations with profit participation - guaranteed benefits 0 24 660 144
Obligations with profit participation - future discretionary benefits 0 271 512
Index-linked and unit-linked insurance obligations 0 15 436 586
Other life (re)insurance and health (re)insurance obligations 963 084 0
Total capital at risk for all life (re)insurance obligations 0 148 556 416
Overall MCR calculation
Linear MCR 3 351 914
SCR 11 126 681
MCR cap 5 007 007
MCR floor 2 781 670
Combined MCR 3 351 914
Absolute floor of the MCR 201 887
Minimum Capital Requirement 3 351 914
Notional non-life and life MCR calculation Non-life activities Life activities
Notional linear MCR 2 086 883 1 265 032
Notional SCR excluding add-on (annual or latest calculation) 6 927 408 4 199 273
Notional MCR cap 3 117 333 1 889 673
Notional MCR floor 1 731 852 1 049 818
Notional Combined MCR 2 086 883 1 265 032
Absolute floor of the notional MCR 100 943 100 943
Notional MCR 2 086 883 1 265 032
S.28.02.01
Non-life activities Life activities
Non-life activities Life activities