madhobpur lake : physical condition
TRANSCRIPT
Lab Report on
Physical Condition of
Madhobpur Lake
Submitted By
Arnab Mazumder
Reg no : 2013135033
Dept of GEE,SUST

Certified
Md. Anowarul Islam
Assistant Professor
Dept. of GEE,
SUST.
Nusrat Jahan Koley
Lecturer
Dept. of GEE,
SUST.
Acknowledgement
The author is grateful to the almighty for the good health and wellbeing that
were necessary to complete the report work.
The author is also grateful to Md. Anowarul Islam and Nusrat Jahan Koley,
guide teachers for the tour .Their perspective suggestions helped me to make
this endeavour successful.
The author also likes to express his gratitude his fellow classmates and senior
Syed Tawhidur Rahman for the stimulating discussions for helping to
understand the lab report.
The author likes to express his hearties thank to the local people of the study
area for their cooperation and instant help during the field study .
Last but not least , the author would like to thank the members of dept of
Geography and Environment of Shahjalal University of Science and
Technology for helping and suggesting to complete the report .

Contents
Contents name Page
No.
No.
Front page I
Certified II
Acknowledgement III
Contents IV
List of Tables and Figures V
Abstract VI
Chapter – 01 [Introduction]
1.1 Introduction 1
1.2 Geography of the area 1
1.3 Location and Physiography 2
1.4 Demography of the area 3
1.5 The pattern of Land use 4
1.6 Ethnic composition and religion 4
1.7 Health 4
1.8 Occupation 4
1.9 Labour 5
1.10 Food Consumption Patterns 5
1.11 Housing 5
1.12 Water and Sanitation 5
1.13 Aims and Objectives 5
Chapter – 02 [Research Methodology]
2.1 Methodology 7
2.2 Area selection 7
2.3 Data collection 7
2.4 Primary data collection 7
2.5 Secondary data collection 8
2.6 Analysis 8
2.7 Presentation 8
Chapter – 03 [Climatic and Vegetation status]
3.1 Climatic status 9
3.2 Climatic change in winter season 9
3.3 Climatic change in summer season 9
3.4 People’s Perception about Environmental Change 9
3.5 People’s Perception about Temperature and Rainfall Change 10
3.6 Changes in Rainfall 11
3.7 Major Agricultural Products 12
3.8 Social change due to variability of climate 12
3.9 High pricing of land 13
3.10 Less income 13
3.11 Migration 13
3.12 Unemployment 14
3.13 Extinct agricultural product 14
3.14 Common natural disasters 15
3.15 People’s perception about the climate change 15

3.16 Flora of the study area 16
3.17 Fauna of the study area 16
Chapter-04 [Socio and Economic condition ]
4.1 Economy 17
4.2 Primary Economic Activities 17
4.3 Secondary Economic Activities 17
4.4 Trade and commerce 17
4.5 Livelihood Pattern 17
4.6 Settlement Pattern 18
Chapter – 05 [Conclusion, Recommendation and Reference ]
6.1 Recommendation 19
6.2 Conclusion 19
6.3 Reference 20
List of Table and figures
Map of Kamalganj 2
Map of Madhobpur Lake 3
Madhobpur lake 6
Environmental change 10
Temperature change 11
Rainfall change 12
Social change due to climate change 12
Social change due to unemployment 14
Common Natural Disaster of Adampur 15

Abstract
This reports depicts environmental displacement with the premise of increased
frequency of natural disasters and the adverse impacts of climate change. It
provides an introduction, socio-economic condition, climatic and vegetative
status of Madhobpur lake, methodology, data comparison and finally the
conclusion and recommendation our whole project. To do this report we have to
take some steps and worked through by them. First we collected primary data
from Madhobpur Lake by field survey and secondary data from several website. After collecting all primary and secondary data, we used Microsoft Office Excel
2007 for analysis data systematically. And then we presented data on this report.
Introduction, description, socio- economic and climatic status are included in
first chapter. Aims and objects of the project are also found in this chapter. The
second chapter is about Methodology such as study area selection, surveying,
data collection, data analysis methods and finally data presentation. In third
chapter, deals with the climatic condition of Madhobpur on the basis of
secondary data. This chapter also deals with the people’s perception and
environmental change, temperature and rainfall change(change of climatic
variables), social change due to the variability of climate, major agricultural
products, effects on agricultural productivity due to temperature and rainfall,
endangered agricultural products, common natural disaster, people’s perception
about climate change.
Chapter 5 is the ending part of the report. Here is also a recommendation part
which means the problem has to face in the time of survey.
And at last references are added in the report from which we collected data and
different information’s, using in this report.

Page | 1
Chapter-1
Introduction 1.1 Location
Madhobpur Lake is a lake in Kamalganj Upazila in the MouloviBazar District.
It is one of the popular tourist spot in Bangladesh. The lake is located within
and beside greenish tea garden.
It surrounded by small green hills and trees.Different kinds of waterplants are
there like water lilies of different kinds and colors. Its in the midst of Tea
gardens, and artificially created small hills in one side and quite big.Once you
climb up the hills you can see the breathtaking view of the whole lake.
Madhobpur lake is located 16+ KM away from Sreemangal, 30 KM from
Moulvibazar district town and 15 KM from Lawachhara Reserve Forest.
You have to stop the car at the entrance and walk in for about 10 mins through
the green tea garden to reach the lake. One you reach there, you will find a
beautiful and refreshing water body full of red lilies lies calmly in the midst of
hills around. Take a deep breath and just enjoy the calmness of the nature; relax
your body and soul with the fresh air and chimes of the birds.
1.2 Geography of the area
Kamalganj, a place of peace and tranquillity located at 91.52 east longitude and
24.20 north latitude of global demarcation having 187 square miles, located in
the southern part of the district. The upazila is bounded on the north by
Rajnagar upazila, on the east by Kulaura upazila and India, on the south by
India and on the west by Sreemangal and Maulvibazar Sadar upazila.
Kamalganj Upazila consists of 1 paurashava, 9 wards, 29 mahallahs, 9 unions,
111 mauzas, and 251 villages.

Page | 2
Fig- map of Kamalganj Upazilla
1.3 Location and Physiography:
Eastern and western parts of this Upazila are hilly mountains and most of this
part is covered with forest. An old human habitation developed in plain land of
eastern part of the upazila. Rajkandi reserve forest situated in northeast area and
the Bhanugach Mountains are in west part of the region. The highest peak of the
mountain is 500 feet high located in the south verge.
Page | 3
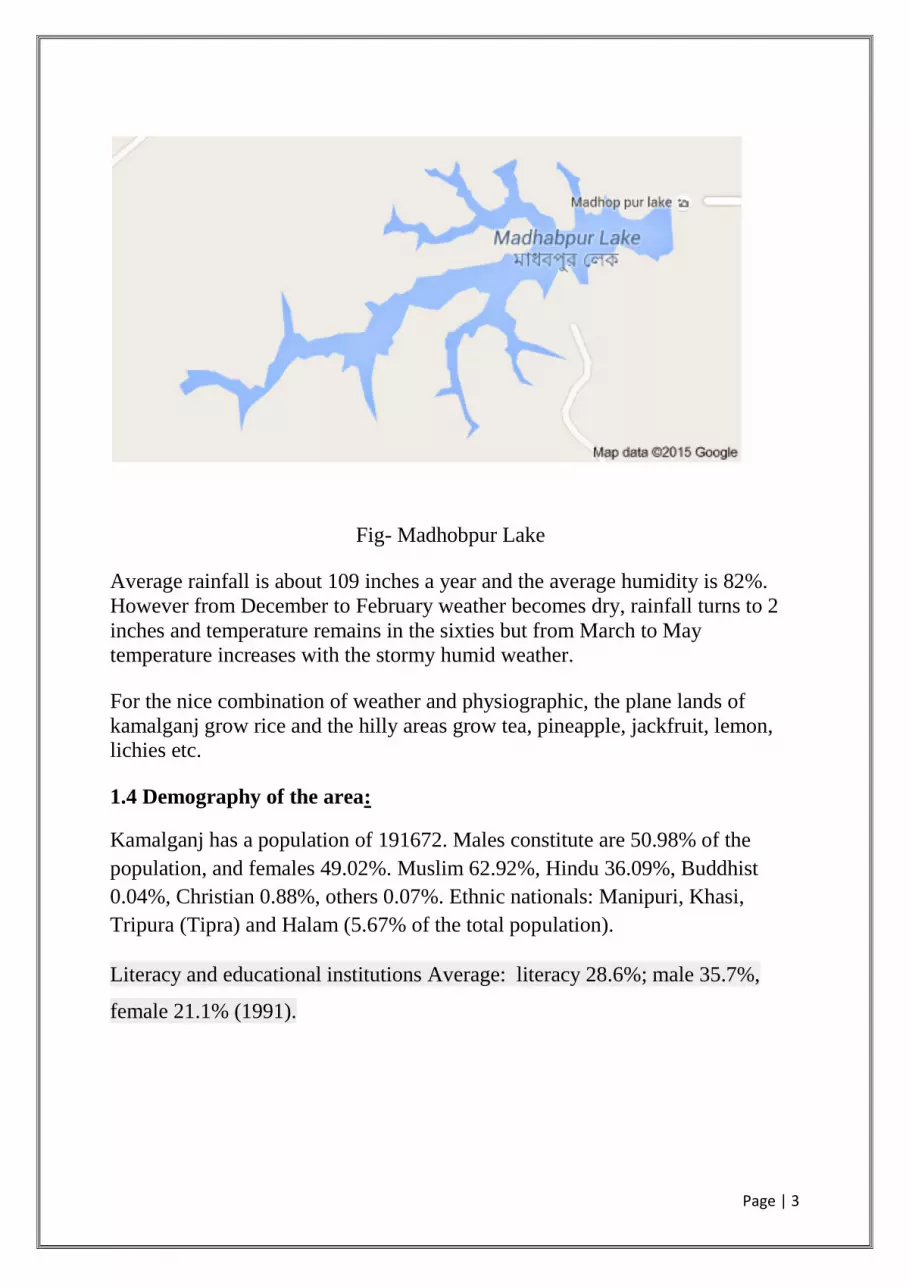
Fig- Madhobpur Lake
Average rainfall is about 109 inches a year and the average humidity is 82%.
However from December to February weather becomes dry, rainfall turns to 2
inches and temperature remains in the sixties but from March to May
temperature increases with the stormy humid weather.
For the nice combination of weather and physiographic, the plane lands of
kamalganj grow rice and the hilly areas grow tea, pineapple, jackfruit, lemon,
lichies etc.
1.4 Demography of the area:
Kamalganj has a population of 191672. Males constitute are 50.98% of the
population, and females 49.02%. Muslim 62.92%, Hindu 36.09%, Buddhist
0.04%, Christian 0.88%, others 0.07%. Ethnic nationals: Manipuri, Khasi,
Tripura (Tipra) and Halam (5.67% of the total population).
Literacy and educational institutions Average: literacy 28.6%; male 35.7%,
female 21.1% (1991).
Page | 4
1.5 The pattern of Land use:
Land use Arable land 22672 hectare, non-agricultural 8748 ha, fallow 506
ha, khashland 787.44 hectares; single crop 13.89%, double crop 69.45%, treble
crop16.66%. There are 14 tea gardens in this upazila.
Main crops are Paddy, wheat, sugarcane, tea, betel nut, mustard seed, potato,
yam, aubergine, barbati (kind of kidney bean), bottle gourd, lemon, and
watermelon.
1.6 Ethnic composition and religion:
Kamalganj inherits common anthropological identity of Bangalee culture with
little difference to neighboring Upazilas. Though Muslim & Hindu community
comprises the major northwest portion of the upazila but in tea gardens of
southeast is mostly inhabited by garden laborers migrated from India and people
of Monipuri origin dominate 4 Union Councils of south region
1.7 Health:
The major disease in the village is fever or malaria that affects people during
the summer months of April to August. The nearest health centre is the Primary
health Centre. An upazila health center is in this upazila.
1.8 Occupation:
The main occupation of the village is agriculture and loom. Paddy is the main
crop cultivated by the people. Paddy has become a major source of income for
the people. Other food crops that are cultivated are rice, sweet potato, tomatoes,
chilies, mustard, beans, and lettuce. The households also rear livestock;
household’s rear and lettuce. The households also rear livestock; households
rear cows, pigs and a majority reaches.

Page | 5
1.9 Labor:
The Paddy plantations require a lot of maintenance throughout the year. It
creates labour opportunities for the people in the village especially for those
who do not have their own plantations. All the labour that is required in the
plantations is from the village itself.
1.10 Food Consumption Patterns:
Rice is the staple food but the food pattern changes according to the seasons. In
the winter, the people have along with rice more of sweet potato and tomatoes
as these are the harvest seasons of these vegetables. During the summer months,
the people consume less as they have only rice with whatever vegetables that is
available.
1.11 Housing:
The housing pattern of the village is mixed. A majority of 70 percent of
households have kacha house, 9 percent have Paka type of house and 16 percent
are semipaka.
1.12 Water and Sanitation:
In this village does not have proper sanitation facilities; 42 percent of
households do not have toilets in their home stead. The households who have
toilets also have pit latrines.
1.13 Aims and Objectives of the Study
a) To apply the theoretical knowledge in the field I acquired from the courses of
last four semesters.
b) To know that, how does the theoretical knowledge can be applicable in
practical field.
c) To learn about the process of observational study.

Page | 6
Fig- Madhobpur Lake
Page | 7
Chapter-2
Research Methodology
2.1 Methodology:
Methodology is usually a guideline system for solving a problem, with specific
components such as phases, tasks, methods, techniques and tools
In case of us firstly a study area is selected.
2.2 Area selection:
Our study area was selected on Madhobpur Lake in Kamalganj. Usually a study
area is selected on basis of the people area and most of the people of
Kamalganj is Manipuri. We collected many datas from them and thus we found
variation from them. They gave us different insights about climate change,
which represents the perception of the rural of our country.
2.3 Data collection:
Data collection is the primary step of a study tour. There are two types of data.
They are primary data and secondary data. Primary data are collected from
questioner’s survey and the secondary data are collected from different govt.
office.
2.4 Primary data collection:
We were divided into groups at Madhobpur Lake area. Each group collected the
primary datas from different houses. We asked the peoples about the climate of
Area. Some of them have no idea about climate change.
We also asked them about the effect of climate changes and stored them. How
climate change hindered their crops? Which crops are not grown at this time?
We also collect their perception about climate change.

Page | 8
2.5 Secondary data collection:
Here we have to collect secondary data for questioner’s survey. In that case we
need to collect a map of our study area. So we collected a map of Kamalganj.
We also collected climatic data (rain fall , temperature and humidity ).We also
collected the secondary data from internet.
2.6 Analysis:
It is the most important work for us. We stored all the datas that we collected in
different table. We analyzed each of the questions. We found out the percentage
of statistical data and then calculate them. Lastly We compare the primary and
secondary data.
2.7 Presentation:
An important work for a report is to present data. Here we present the data in
different diagrams. For population statistics we represent it in population
pyramid. In bar diagram we show education back ground and pie chart for
different religious people.
Page | 9
Chapter-3
Climatic and Vegetation status
3.1 Climatic status:
As there is no weather station in Madhobpur lake, so the information of climate
of Madhobpur lake has to know from the nearest station of Kamlganj in
Sreemongol.
In Madhobpur lake area the Climate changes in different weathers
3.2 Climatic change in winter season:
During winter season the temperature of the area is 29 degree centigrade as
maximum abd 15 degree centigrade as minimum.The temperature of the area is
greatly changed in the recent ten years.The Average temperature in winter
season is 23.7 degree centigrade.As the rainfall is low in winter so the
maximum rainfall is 150 mm.
3.3 Climatic change in summer season:
During summer season temperature is very high. The average maximum
temperature is over 35 degrees centigrade and minimum avg. temperature is
over 26 degree. Maximum Rainfall is over 350 mm in a single day.
3.4 People’s Perception About Environmental Change
In that case we collected perception about climate change from different peoples
of the nearby area. We tried to collect data about the effect of climate change in
their livelihood. As the environment is warming day by day, so we tried to
justify this via real field work. We also tried to know about the awareness of
people about environmental change.

Page | 10
Figure – People’s perception about environmental change
Here, 43.69% people say that temperature is increasing. 18.94% says
temperature is increasing and rainfall is decreasing. They described rising
temperature as cause of less rainfall and less availability of water. That means
peoples are conscious about global warming.
3.5 People’s Perception about Temperature and Rainfall Change
Global warming is the rise in the average temperature of Earth's atmosphere and
oceans since the late 19th century, and its projected continuation in some part of
the world there are heavy rainfall and some part there is no rain. We tried to
know the condition of the area. We asked people about any significant change
in local temperature during last ten years. They answered yes or no. Here ‘yes’
means change of temperature and ‘no’ means unchanged of temperature.
44%
14%
3%
10%
19%
3%7%
0%0%5%
10%15%20%25%30%35%40%45%50%
high tem. less rainfall
less temp.
high rainfall
high temp. +
less rainfall
high temp. +
high rainfall
other land slide
Environmental Change
Series1
Page | 11
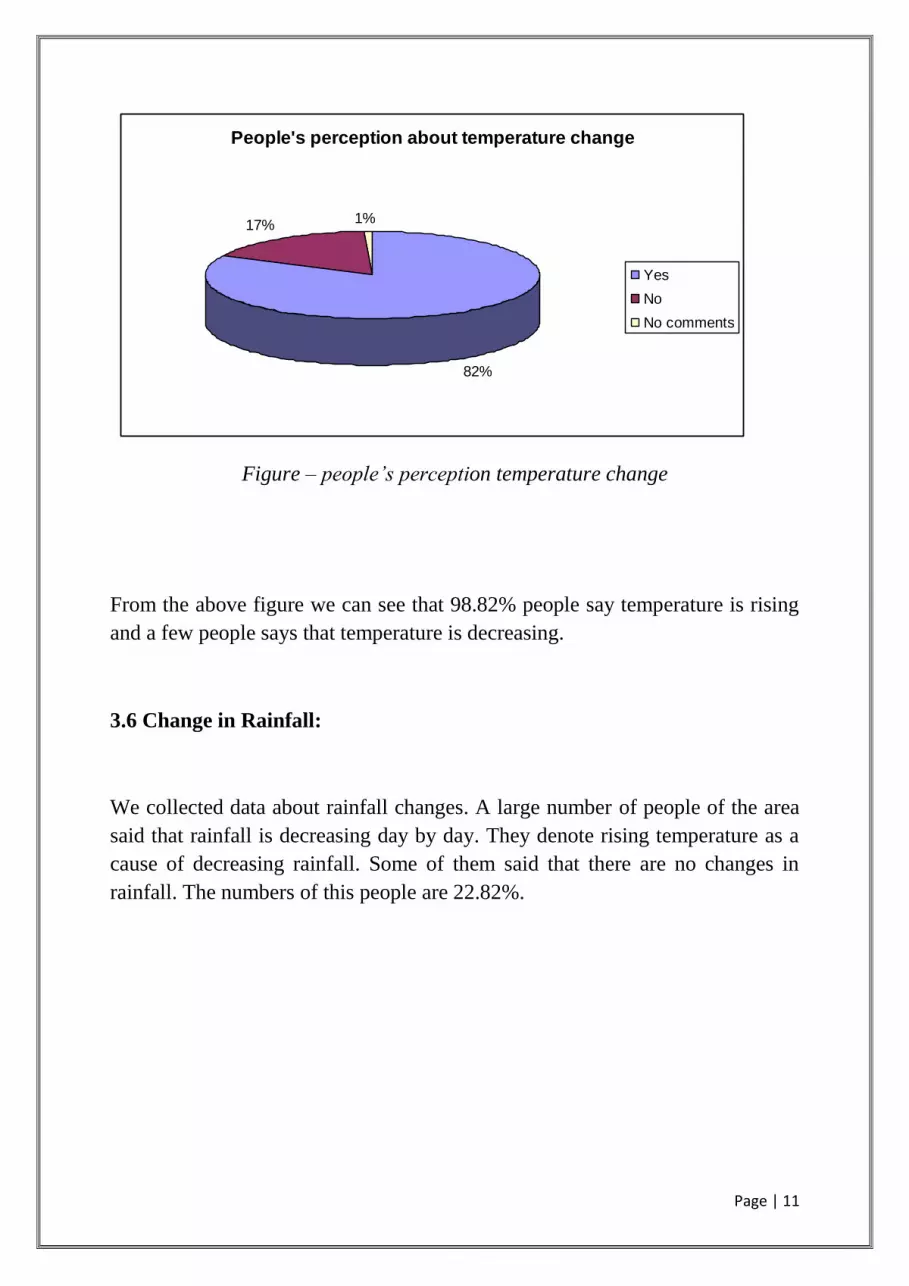
Figure – people’s perception temperature change
From the above figure we can see that 98.82% people say temperature is rising
and a few people says that temperature is decreasing.
3.6 Change in Rainfall:
We collected data about rainfall changes. A large number of people of the area
said that rainfall is decreasing day by day. They denote rising temperature as a
cause of decreasing rainfall. Some of them said that there are no changes in
rainfall. The numbers of this people are 22.82%.
People's perception about temperature change
82%
17% 1%
Yes
No
No comments

Page | 12
Figure – people’s perception about rainfall change
3.7 Major Agricultural Products:
Madhobpur lake as well as Kamlganj upazilla economy mainly depends on
agricultural crops. They grow different type of crops and vegetables. Mainly
they grow paddy. Vegetables are tomato, ladies finger, cauliflower, chilly etc.
3.8 Social change due to variability of climate:
The area’s agriculture is highly dependent on climatic factors. Variability of
climate causes the social change. Social change means the discreteness from
ideal social system. There are some social changes found at the area due to the
variability of climate.
people's perception about rainfall
increas
decreas
no change

Page | 13
Figure – Social change due to climatic change.
3.9 High pricing of land:
High pricing of land is the main social change occurred at Kamalganj. When
increased demand for food and energy combine, pressure on land conversion is
increased leading to further climate change which in turn may affect
productivity of land and availability of land. This criterion creates high pricing
of land.
3.10 Less income:
People of the area have agriculture base economy but climate has an effect on
their income. In recent years, the climate of the area is much change. So, the
production of crops and vegetables has decreased .This phenomenon causes less
income of the people of the area.
3.11 Migration:
Migration mainly caused for the following reason:
Different types of social chaos such as family-family conflict for land,
conflict between rich and poor.
10%4%
22%
12%
52%65%
Social change due to climate change
migration unemployment less income social chaos high price of land
Page | 14
People have failed to collect their live stock from their correspondent
area.
Less production of agricultural products also encourages migration.
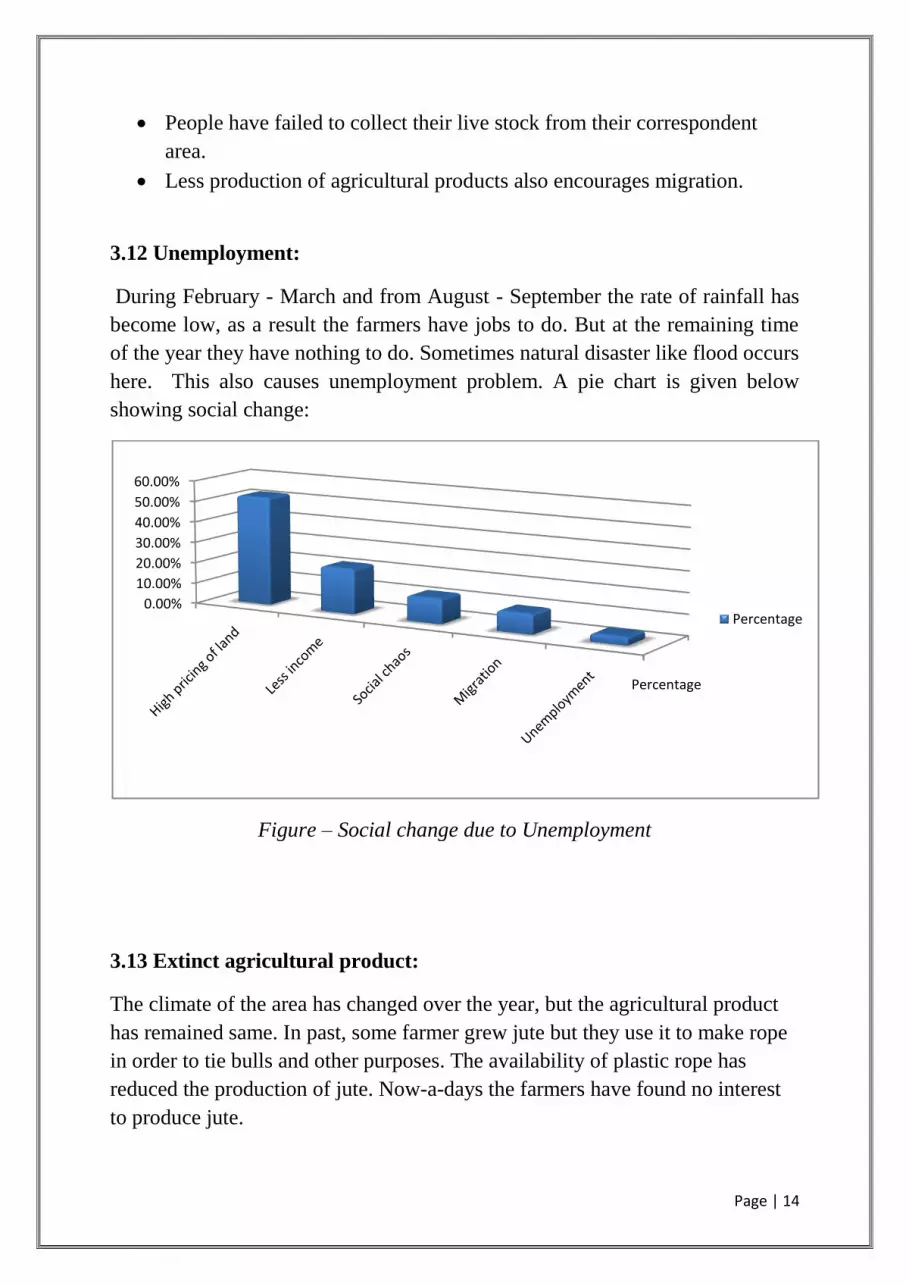
3.12 Unemployment:
During February - March and from August - September the rate of rainfall has
become low, as a result the farmers have jobs to do. But at the remaining time
of the year they have nothing to do. Sometimes natural disaster like flood occurs
here. This also causes unemployment problem. A pie chart is given below
showing social change:
Figure – Social change due to Unemployment
3.13 Extinct agricultural product:
The climate of the area has changed over the year, but the agricultural product
has remained same. In past, some farmer grew jute but they use it to make rope
in order to tie bulls and other purposes. The availability of plastic rope has
reduced the production of jute. Now-a-days the farmers have found no interest
to produce jute.
Percentage
0.00%
10.00%
20.00%
30.00%
40.00%
50.00%
60.00%
Percentage
Page | 15
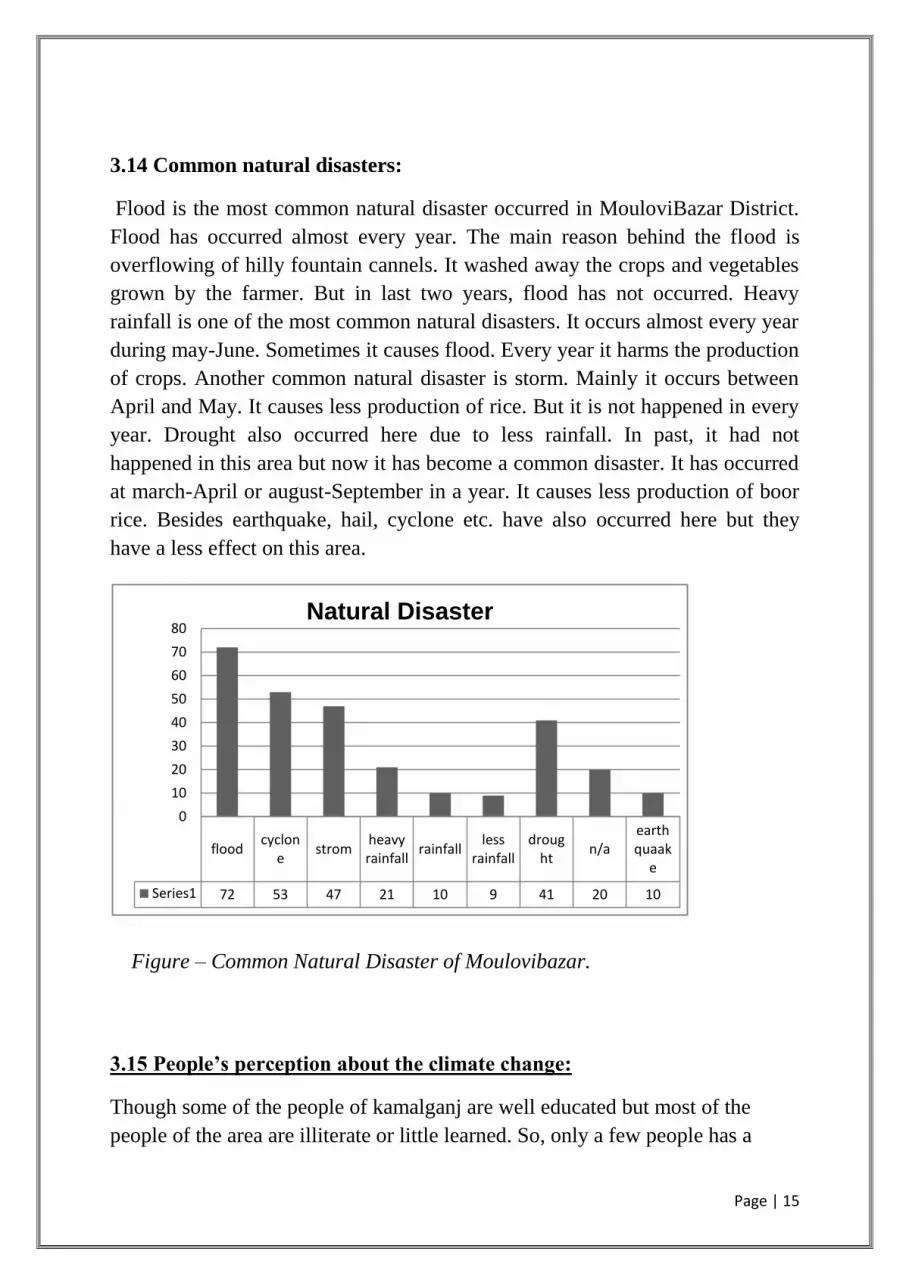
3.14 Common natural disasters:
Flood is the most common natural disaster occurred in MouloviBazar District.
Flood has occurred almost every year. The main reason behind the flood is
overflowing of hilly fountain cannels. It washed away the crops and vegetables
grown by the farmer. But in last two years, flood has not occurred. Heavy
rainfall is one of the most common natural disasters. It occurs almost every year
during may-June. Sometimes it causes flood. Every year it harms the production
of crops. Another common natural disaster is storm. Mainly it occurs between
April and May. It causes less production of rice. But it is not happened in every
year. Drought also occurred here due to less rainfall. In past, it had not
happened in this area but now it has become a common disaster. It has occurred
at march-April or august-September in a year. It causes less production of boor
rice. Besides earthquake, hail, cyclone etc. have also occurred here but they
have a less effect on this area.
Figure – Common Natural Disaster of Moulovibazar.
3.15 People’s perception about the climate change:
Though some of the people of kamalganj are well educated but most of the
people of the area are illiterate or little learned. So, only a few people has a
floodcyclon
estrom
heavy rainfall
rainfallless
rainfalldroug
htn/a
earth quaak
e
Series1 72 53 47 21 10 9 41 20 10
0
10
20
30
40
50
60
70
80Natural Disaster
Page | 16
concept on climate change. For them (the illiterate and little learned) , climate
change means the change of temperature and rainfall. According to the most of
the people, the average rate of rainfall is decreasing every year. So, temperature
is increasing day by day.
3.16 Flora of Study Area:
Most of the trees are of the evergreen type, whereas most of the tallest trees are
deciduous and semi-deciduous. There are four main groups of hydrophytes that
found in wetland systems throughout the world. Submerged water wetland
vegetation can grow in saline and fresh-water conditions. For example: Hydrilla
verticillata, Potamogeton Crispus are fully under water vegetation.
Crop Field vegetations e.g., Alternanthera Sessilis, Cotula Hemispaerica etc,
have been found around the Madhobpur lake which are the important source
of food for the migratory ducks.
Homestead vegetations e.g., Barringtonia acuatangula, Bambusa arudinacea
etc have been found in Tanguar haorwith rich species diversity.
3.17 Fauna of Study Area:
Fish are more dependent on wetland ecosystems than any other type of habitat.
Wetland International (WI) conducts waterfowl census every year in different
wetlands in Banfladesh with the help of Bangladesh Bird Club (Bbc). Much
more species of migratory birds come to this Madhobpur Lake as this lake is an
ideal place for their food and habitat. Rui, Mrigel, puti, chanda, and invertebrate
Chingri or shrimp etc are found in Madhobpur Lake. The other important fish
species are Magur, Baem, gutum etc.
Page | 17
Chapter-4
Socio and economic condition
4.1 Economy:
The economy of the area is mainly agriculture based. There are lots of tea
garden in the nearby area. There are less industries in that area . only there are
some tea factories by some govt and non-govt. Companies . The main exports of
Maulvi Bazar are bamboo, tea, pineapple, cane, jackfruit, oranges, agarr, rubber,
mangoes and lemons. The area is also home to the three largest tea gardens (size
and production wise) in the world. Pineapples from the Sreemangal area are
famous for their flavour and natural sweetness.
4.2 Primary Economic Activities
Heavily dependent on tea gardening. Many types of fruits such as- Banana,
Pineapple, Jackfruit, Papaya etc are produce here. There are many types of
masala such as- Ginger, Turmeric etc also produce here. There are also some
rubber garden where the local people work.
4.3 Secondary Economic Activities
Bangladesh Tea Research Instititute (BTRI) is nearby to the area. Lots of people
of this area are directly and indirectly connected with it .and maximum people
women work in the teafactories.
4.4 Trade and Commerce
Fruits, masala and tribal textile are the major exports of the area. Tourism is
another commerce here which is growing fast as a source of revenue. Bamboo
craft and local-made cigarillos are now exported out of the districts.
4.5 Livelihood Pattern
The major livelihood activities in the study areas, determined by perceptions of
a few numbers of people interview and some statatistical data’s over the
internet. It is found that the highest percentage of households were dependent
on Tea cultivation for livelihood in Madhobpur Lakearea as well as Kamalganj
area. Livestock and fruit gardening were also important on-farm activities for
the framers of all two districts. In the case of off-farm activities, the highest
percentages of households were dependent on wage earnings for their livelihood
in all districts.There are a lots of Monipuri people in that area .they made a
important fact on the livelihood area.

Page | 18
Most Monipuries are agriculturists, primarily practicing subsistence farming
with limited cash crop production. The principal crop is rice. Other vegetables,
such as corn, sesame, lentils, chili, ginger, turmeric, garlic, beans, pumpkin, and
cucumber are also sown together with the rice, and supplement the family diet
as well as providing extra income. Even to this day, a large portion of
indigenous peoples depend upon tea production for rice production and as the
main source of their subsistence and livelihood.
4.6 Settlement Pattern:
Before the construction of Sreemangal area the Kamalganj was not as like as
we see . Settlement pattern of Kamalganj is unique. People make their house
along the slope of Hill. Actually, the town has been grown up along the slope
of Hill.

Page | 19
Chapter-5
Conclusion,recomadation and reference
5.1 Conclusion:
We mainly observed on climatic and socio-economic condition of
Madhobpur Lake area from last years to present. We collected data by own
body and then analysis the change of climatic and socio-economic status. It
alerts the people of the area and also ours about the climate change and its
effect on us. The perception of the people of Kamalganj about climate
change is quite same. Global warming is the main cause of climate change.
Implementation of climate change adaptation measures such as flood control
and land erosion with improved embankments as well as salinity and high
temperature tolerant crop production and floating cultivation will contain the
problem within our borders. Climate change should be handled with due
importance in all development programs. We should give consciousness to
the people about the change of climate. This report represents the perception
of the rural people of our country about climate.
5.2 Recommendation:
To prepare this report I have to suffer some problem.
We couldn’t understand their language easily. Cause people of
Madhobpur Lake use their local language and most people use this local
language. We have no idea about their language.
We have to suffer most to collect secondary data. Secondary data is not
available. We got it from internet. Sreemangal weather office can’t help
us cause they have no climatic data of Madhobpur lake area. And there is
no weather station in Kamalganj also . So we have to take some datas of
Sreemangal and MouloviBazar to represnt Madhobpur Lake area .
In the study area, most of the people are illiterate. They don’t know what
is climate.
Page | 20
5.3 Reference
1.www.wikipedia.com 2.www.slideshare.net
3.www.bbs.gov.bd 4.www.weatheronline.co.uk
5.www.discoverybangladesh.com 6.kamolganj.moulvibazar.gov.bd
7. Rahman S.T. (2015)Climatic and socio-economic change of
Adampur,Kamalganj,