application of geophysical and geotechnical investigations in engineering site evaluation
TRANSCRIPT
International Journal of Physical Sciences Vol. 4 (8), pp. 443-454, August, 2009 Available online at http://www.academicjournals.org/IJPS ISSN 1992 - 1950 © 2009 Academic Journals Full Length Research Paper
Application of geophysical and geotechnical investigations in engineering site evaluation
O. J. Akintorinwa* and J. I. Adesoji
Department of Applied Geophysics, Federal University of Technology, P.M.B. 704, Akure. Nigeria.
Accepted 08 July, 2009
Geophysical and geotechnical studies were conducted at a proposed Switch station facility for Telecommunication at a site in the south-eastern part of Nigeria. The aim of the study is to evaluate the sub-soil conditions and electrical properties of the soil which may have effect on the proposed mast and switch facilities system. The geophysical investigation involved the Vertical Electrical Sounding (VES) technique using the Schlumberger configuration and a geotechnical investigation. A total of sixteen (16) VES stations were occupied within the study site. The geotechnical study involved Boreholes drilling as well as Cone Penetration Tests (CPT). A total of six (6) CPTs and three (3) Boreholes drilling were utilised within the study area. This was done to provide controls on the geophysical interpretation. Four subsurface layers were delineated within the study area which include: the topsoil (mixture of sand, silt and clay), coarse sand, clayey sand and sand. This correlated with the sub-soil investigation. The study area is underlain by a stratum of medium stiff to stiff lateritic clayey/silty sand to the depth of about 20 m as explored by the Borehole. The choice of foundation construction for the proposed structure must take care of the settlement characteristics of the clayey material. The subsurface layers up to a depth of 5 m is of moderate to high resistivity values (> 180 ohm-m) and it may not serve as a good electric earthing material, therefore there is a need to improve the subsurface conductivity of this layer most especially within the area where the electrode for the earthling system will be buried. Key words: Vertical electrical sounding, conductivity, cone penetration test, earthing, settlement characteristic.
INTRODUCTION With the growing demand for space utilization, there are also an increasing number of incidences of structural damages which can be accompanied by collateral losses. Uncertainties associated with the design and planning of structures play a role in such failures. Design uncertain-ties related to unknown soil properties are among the most important (Bremmer, 1999). The non linear behaviour of soil under stress, the difficulty in estimating soil properties in undisturbed or in-situ conditions, and high spatial variability, all make it impossible to predict the exact behaviour of soil in time and space. These difficulties call for safety factor to ensure an adequate margin against unexpected deviations in the predicted situation.
Different approaches are commonly used in other to ascertain the in-situ geo-mechanical properties of the soil; *Corresponding author. E-mail: [email protected].
i) The use of Geophysical Techniques, such as electrical resistivity method (VES) or seismic method. ii) Direct probing using static or dynamic penetration techniques and or boreholes. The success in the applicability of geophysical techni-ques depends on so many factors. The most important is the existence of a significant and detectable contrast between the physical properties of the different units in the subsurface, such as velocity, electrical resistivity, conductivity, density, acoustic properties, subsurface geology and the environmental conditions. Penetration devices produce little overall disturbance in the soil. The most widely used static and dynamic penetration test are the Cone Penetration Test CPT (for soft soils) and the Standard Penetration Test SPT (for relatively hard soils) (Baldi et al., 1995).
For CPT, a cone at the end of a series of rods is pushed into the ground at a constant rate, and measure-ments are made of the resistance to the penetration of
444 Int. J. Phys. Sci. the cone. This is known as “cone resistance” or qc, which is the total force (Qc) acting on the cone divided by the projected area (Ac) of the cone. The cone resistance qc is a direct indicator of the strength of the soil at a given depth. Cost, efficiency, speed, simplicity, reliability, and the ability to provide near continuous information on the soil properties with depth are the important reasons for the increasing popularity of CPT. The primary signify-cance of CPT comes from the fact that it represents a miniature driven pile or foundation in soil; hence, the pile bearing capacity (pressure between a foundation and the soil which will produce shear failure in the soil) can be directly estimated from qc. Thus, CPT provides valuable constraints for all settlement and stability calculations. CPT qc responds to soil changes within five to ten times the cone diameter (standard = 35.6 mm) above and below the cone. Although CPT provides valuable infor-mation as to the strength of the soil, the information is restricted to the CPT location (Eslaamizaad et al., 1998). CPTs are commonly performed tens or hundreds of meters apart. Soil models based on lateral interpolation of CPT data collected at a few locations at a given site obviously contain large uncertainties, increasing the risk in engineering design. The aims and objectives of the study are: 1. To delineate the subsurface geological sequence and determine the geoelectric parameter. 2. To identify existing subsurface geologic features such as faults, sinkholes and cavities in an area prone to subsidence and geologic instabilities. 3. To determine from soil resistivity measurements, the nature of the soil and its suitability as an electrical system earthing medium. 4. To determine the geotechnical and nature of the study area. 5. To evaluate from the above the suitability of the subsurface soil within the study area for the proposed communication mast system. Geomorphology/Climate/Vegetation/Geology of the study area The area is in the coastal region of Nigeria and the elevation is of low lying with elevation of not more than 3 m above the sea level. The Nigeria coastal zone is within the tropical climate areas. The rainy season is April to November and dry season is in December to march. The area has an annual rainfall varies between 1,500 and 4,000mm (Ibe, 1988). During the rainy season, wind speed increases to about 10 m/s especially during heavy rainfalls and thunderstorms. Temperature in the coastal area is modulated by the cloud cover and by the damp air. However, the mean monthly temperature vary between 24 and 32oC. Mangrove and rain forests characterize the vegetation of the study area.
The study area is located within the Niger Delta basin
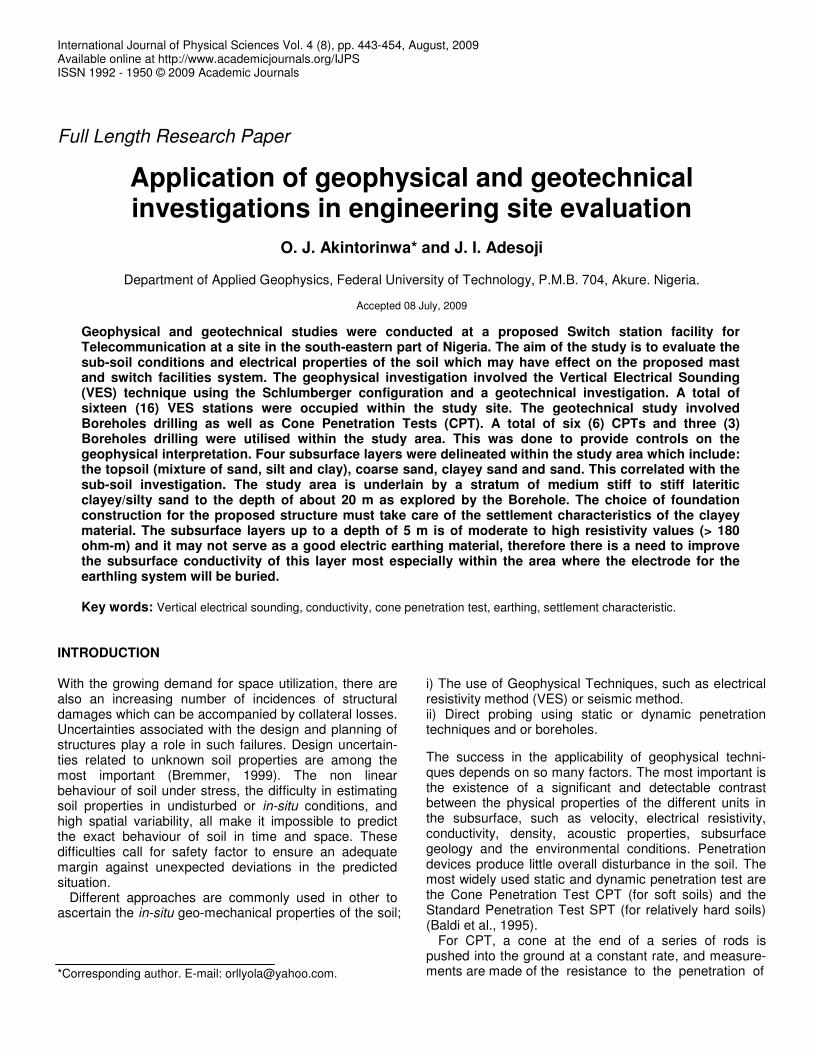
which is a major geomorphic feature in the Nigeria coastal zone. The evolution of the modern Niger Delta started in the Early Tertiary with sediments being sup-plied by the Niger – Benue river system which over the years have built-up a large Delta. The Niger Delta com-plex consists of sedimentary formations deposited in a high-energy deltaic environment. Sediment built up was accompanied by growth faulting normal to the direction of propagation of the progradation which resulted in a series of near parallel faults bounded by the depositional belt. These depobelts are successively younger from north to south. Overlying these depobelts is the stratigraphic sequence that consists of three sedimentary units (Benin Formation, Agbada Formation and Akata Formation). The Benin Formation is described as “Coastal plain sands”. It consists mainly of sand and gravels with thick-nesses that can reach 2,100 m (Avbovbo, 1978). The sands and sandstones are coarse to fine granular in texture and can be unconsolidated. The Agbada Forma-tion consists mainly of sands, sandstones and siltstones. The sandstones or sands are very coarse to fine grained. They are often poorly sorted except where sand grades into shale. The Akata Formation is the major basal unit in the Niger Delta Complex. This is a marine pro-delta megafacies, comprising mainly of shales with occasional turbidite sandstones and siltstones. METHODOLOGY Geophysical survey Sixteen (16) vertical electrical soundings were conducted within the study area (Figure 1) using an ABEM-SAS 300C Terrameter. Schlumberger array was employed with electrode separations (AB) ranging from 2 to 1000 m. The location of each sounding station was recorded in Universal Traverse Mercator (UTM) coordinates with the aid of a GARMIN 12 channel personal navigator (GPS) unit. The soundings were performed parallel to the traverse lines and the apparent resistivity values were calculated.
The apparent resistivity measurements at each station were plotted against electrode spacing (AB/2) on bi-logarithmic graph sheets. The curves were inspected to determine the number and nature of the layering. Partial curve matching was carried out for the quantitative interpretation of the curves. The results of the curve matching (layer resistivities and thicknesses) were fed into the computer as a starting model in an iterative forward modeling technique using RESIST version 1.0 (Vander Velper, 1988). From the interpretation results (layer resistivities and thicknesses), geoelectric sections along directions (N-S and E-W) were produced, and results were also used to generate maps and layer parameter histograms. Geotechnical survey Cone Penetration tests were performed at a total of six (6) locations within the study area (Figure 1). The tests were carried out to a depth of 20 m. The Dutch static penetration measures the resistance of penetration into soils using a 60o steel cone with an area of 10.2 cm2. The cone penetrometer test is a means of ascertaining the resistance of the soil. The layer sequences are
Akintorinwa and Adesoji 445
Figure 1. Data Acquisition Map of the Study Area showing the Vertical Electrical Sounding (VES) Stations and the Geotechnical Sampling Points.
interpreted from the variation of the values of the cone resistance with depth. The test is carried out by securing the winch frame to the ground by means of anchors. These anchors provided the necessary power to push the cone into the ground. The cone and the tube are pushed together into the ground for 20 to 25 cm; the cone is pushed ahead of the tube for 3.5 cm at a uniform rate of about 2 cm/sec. The resistance to the penetration of the cone registered on the pressure gauge connected to the pressure capsule is recorded. The tube is then pushed down and the procedure described above repeated. From the series of recorded gauge readings, cone resistance and sleeve friction are plotted against depth. Three boreholes were drilled within the study area (Figure 1) undisturbed samples at various locations were taken at appropriate intervals using a specially designed 60.5 mm internal diameter U – Type sampler. The sampler is fitted with a cutter at the open end and a waste barrel at the other end. A round steel ball in the driving head of the sampler permits the escape of air and water as the sample enters the tube. The diameter of the sample tube is 25 mm and lined with 60.5 mm plastic tube. The samples are trimmed to the desired length and usually 15 cm covered in a plastic tube. An identification label is attached. The numbers of blows required to drive the sample 15 cm into the ground is recorded. Sometimes, the regular U4 sampler is used to recover the undisturbed samples.
The in situ Standard Penetration Test (SPT) was carried out, usually in the non-cohesive strata. The standard penetration test
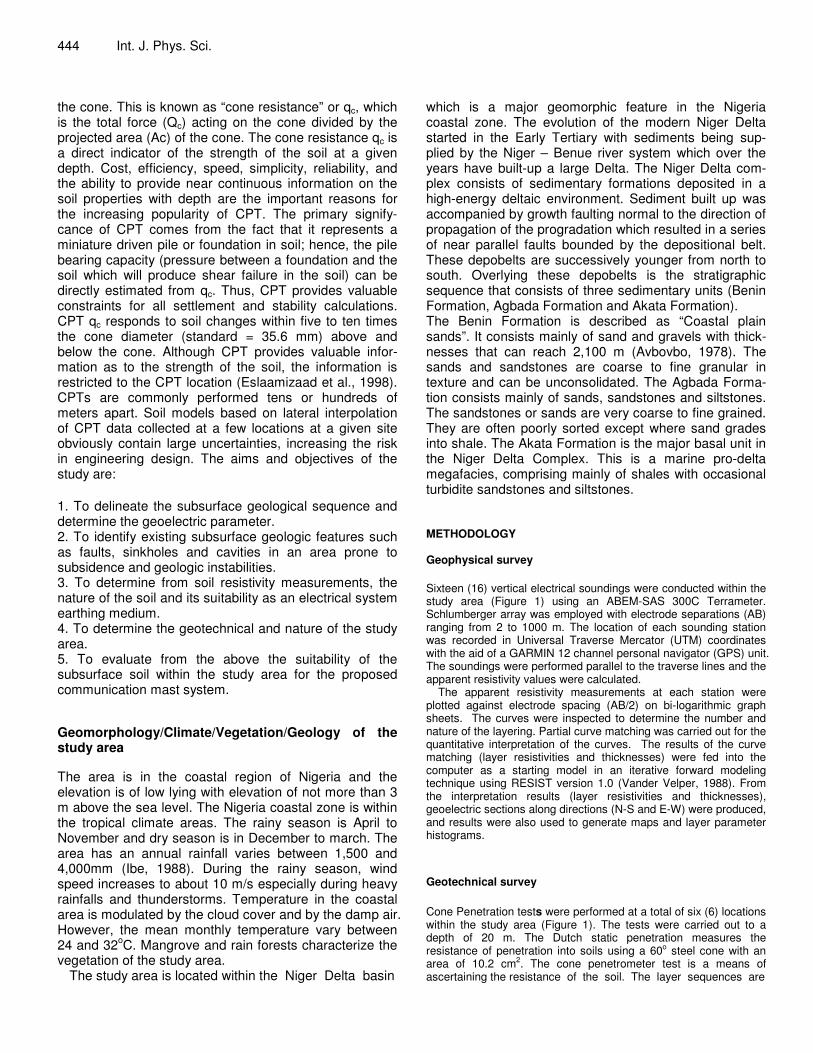
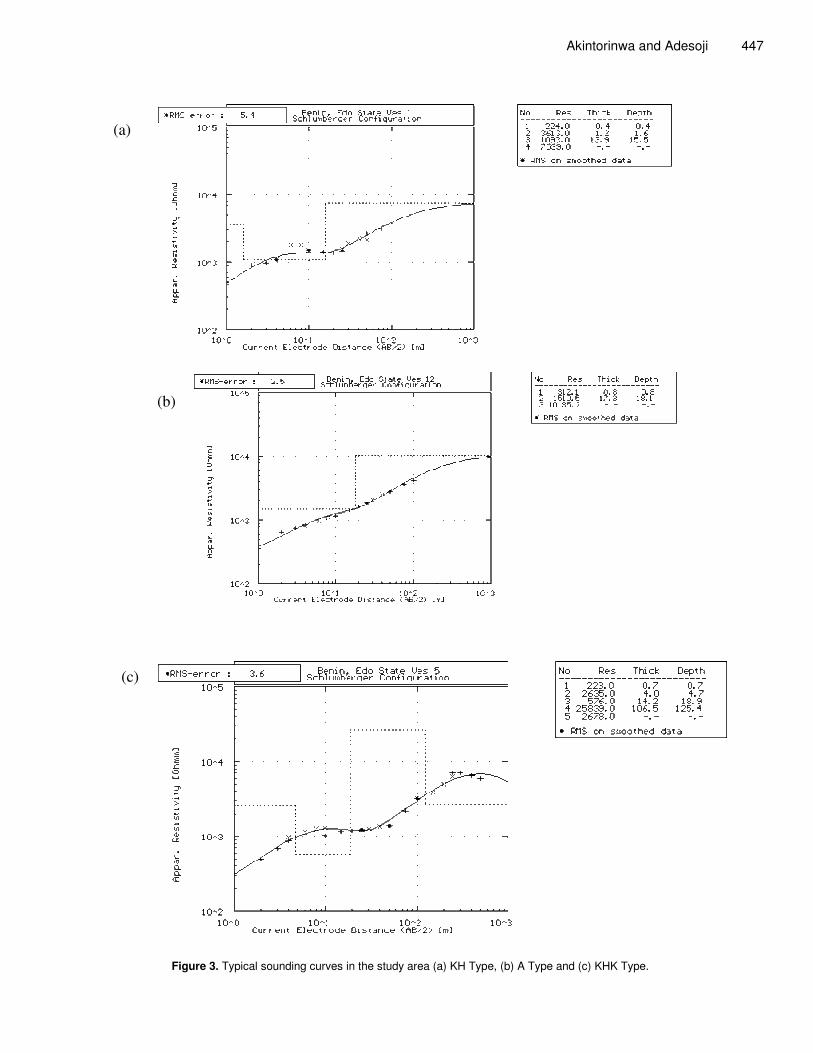
consists of driving a thick walled 50 mm diameter steel tube into the sand at the bottom of each borehole by means of a 63.5 kg hammer dropping 75cm. The number of blows required to drive the tube 30 cm after an initial penetration of 15 cm is recorded as the SPT number. The SPT number can be used as an empirical measure of the compactness of the sand. RESULTS AND DISCUSSIONS The results of the study were presented as Sounding Curves, Histograms, Geoelectric sections, Maps, and Logs. Characteristic of the VES curves Curves types identified ranges from A, KH and KHK varying between three to five geoelectric layers. The KH curve type dominates (Figure 2), constituting 62.5% of the totals while the A and KHK types constitute 25 and 12.5% respectively. Typical curve types in the area are as shown in Figure 3a-c.
446 Int. J. Phys. Sci.
0
10
20
30
40
50
60
70
A KH KHK
Curve Type
Freq
uenc
y (%
)
Figure 2. Histogram of the VES curve types in the study area.
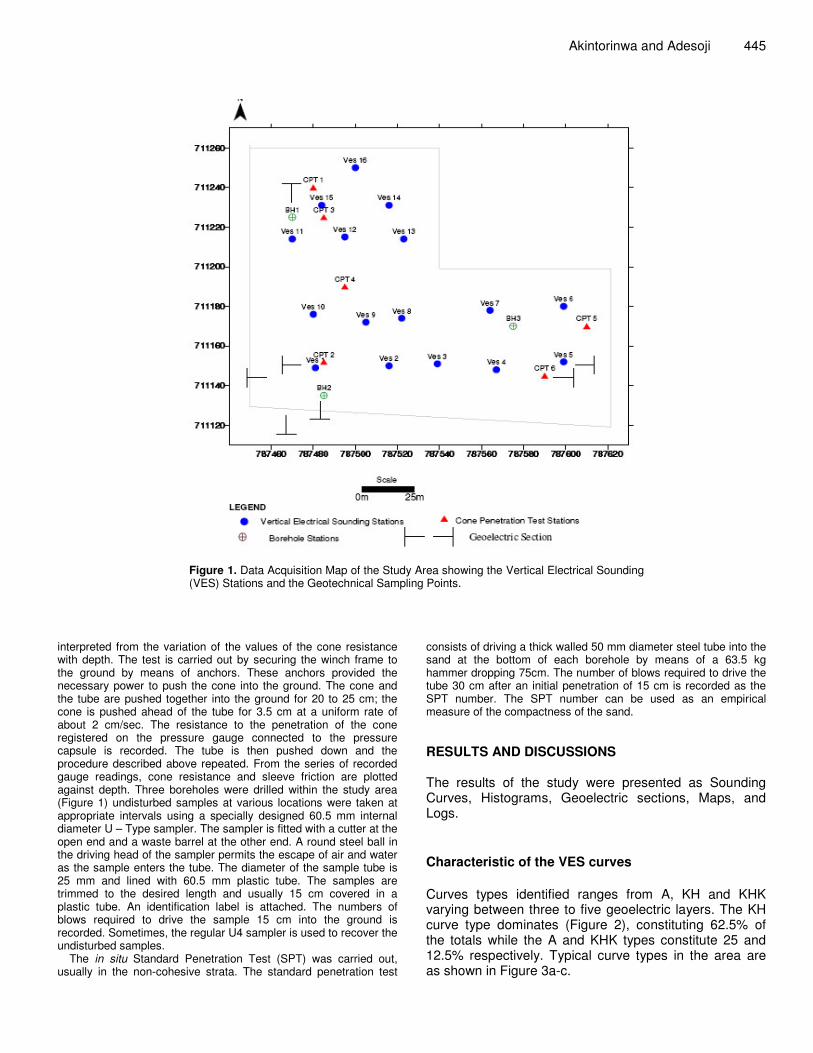
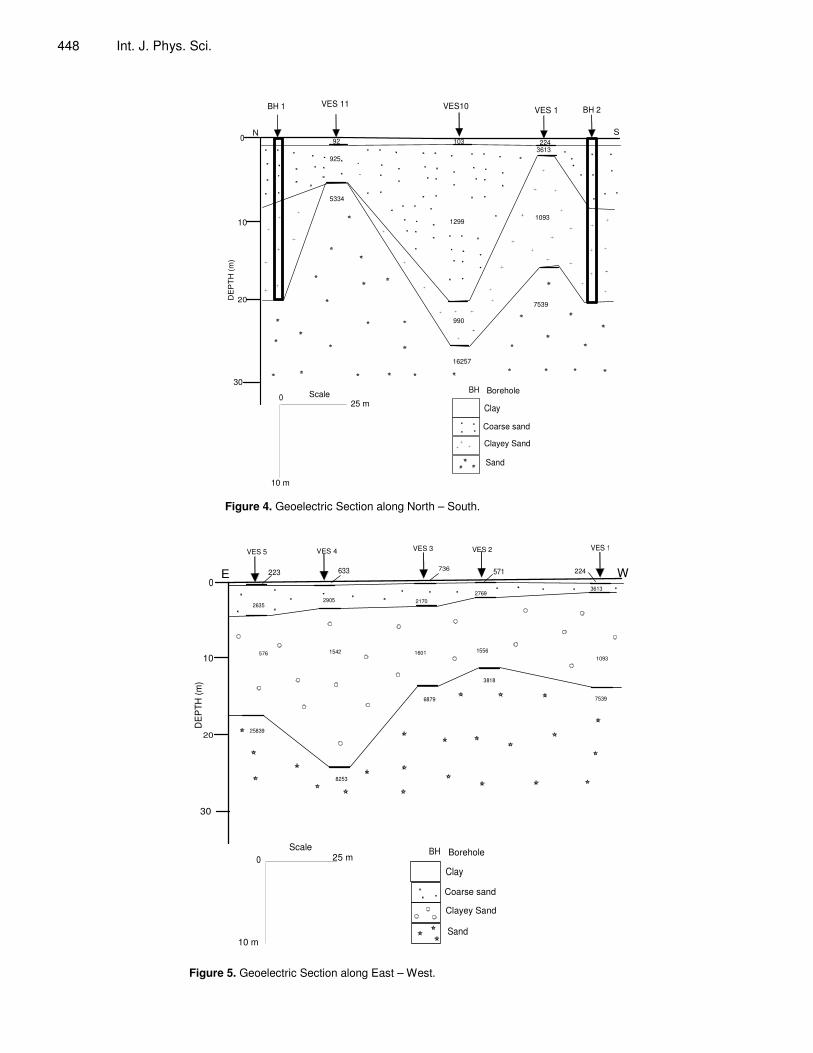
Geoelectric and lithological characteristic The VES interpretation results were used to prepare 2-D geoelectric sections displayed in Figures 4 and 5. The geoelectric sections identified four geoelectric/geologic subsurface layers comprising the clay/sandy clay topsoil (resistivity varies from 92 to 736 -m and thickness ranges from 0.5 to 1.5 m); clayey coarse sand/laterite (resistivity varies from 925 to 3613 -m and thickness ranges from 1.2 to 19.5 m); clayey sand (resistivity varies from 576 to 1601 -m and thickness ranges from 5.4 to 24 m) and coarse sand with resistivity varies from 3818 to 25839 -m. Isoresistivity and isopach map of the topsoil
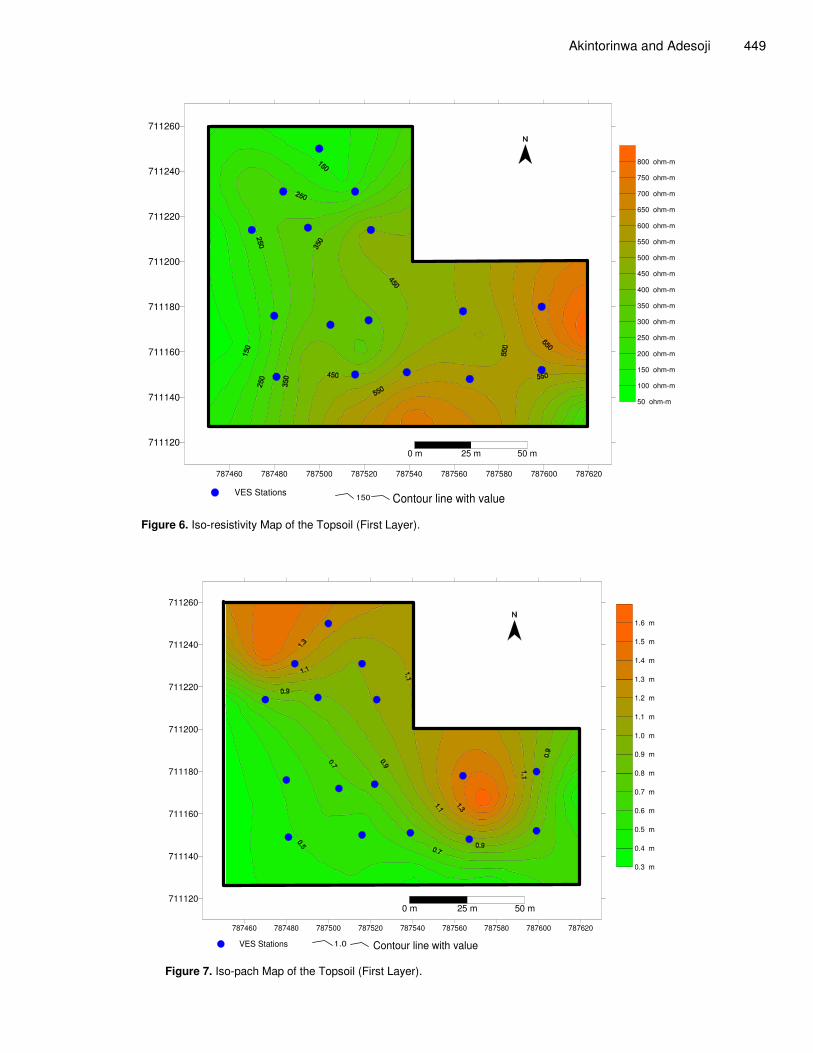
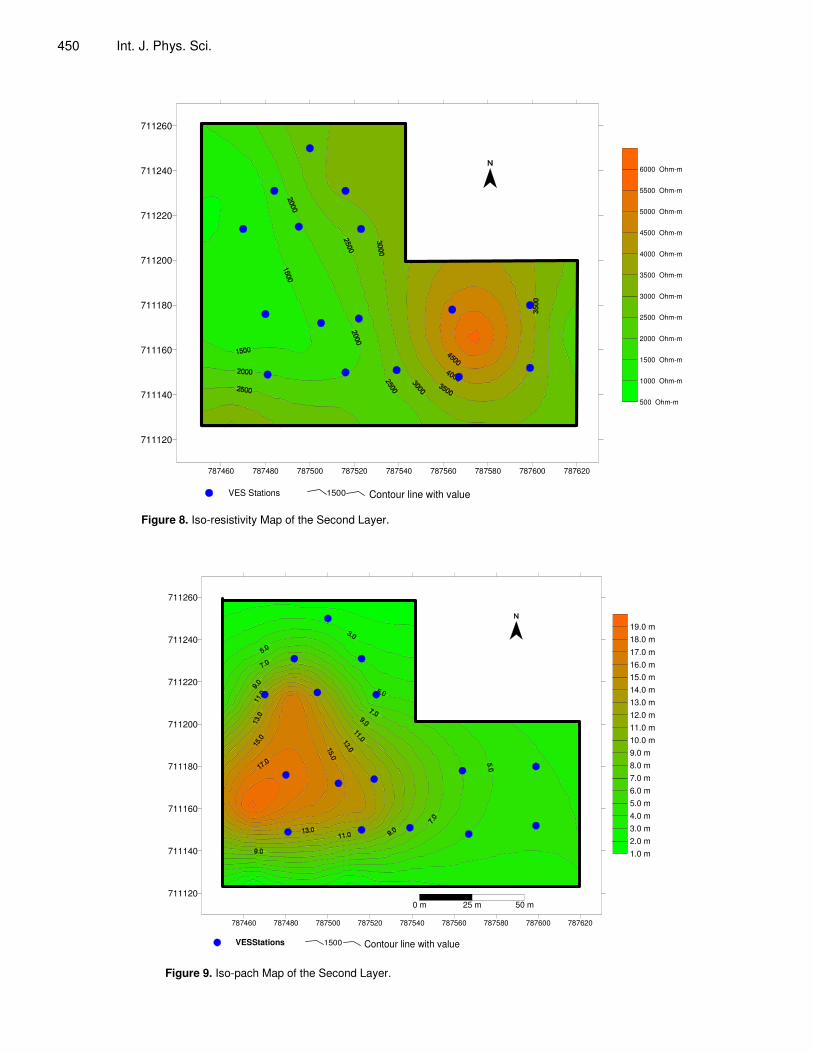
Figures 6 and 7 show the isoresistivity and Isopach map of the topsoil respectively. The topsoil consists of clay and sandy clay. The south eastern parts of the area have the highest resistivity value reaching 850 Ω-m. The south western and north western areas shows relatively low resistivity values (< 150 Ω-m) indicating that, the western parts have larger clay content than the eastern parts of the area. Figure 7 shows the Isopach map of the topsoil. The thickness of the topsoil ranges from 0.5 – 1.5 m. Towards the south eastern parts of the area we have a closure of highest thickness up to 2 m. The thickness of the topsoil is not important for the earthling electrode system since the burial of the electrode is meant to be within 5 - 8 m. Isoresitivity and isopach map of the second layer Figures 8 and 9 show the Isoresistivity and Isopach map of the second layer respectively. The second layer com-prises of laterite and clayey coarse sand with resistivity
values ranging from 1000 to 5500 Ω-m (Figure 8). The thickness range from 2 to 19 m (Figure 9), as shown on the Isoresistivity map. The highest resistivity values were identified towards the south eastern flank of the study area (up to 5500 -m) and the lowest resistivity values were identified at the western flank( 1000 -m). The Isopach map shows the largest thickness at the western flank of the study area with a thickness up to 19 m. The second layer can be considered as a possible candidate for the burial of the earthing material as a result of its appreciable thickness (up to19 m in western parts). The higher resistivity value of the second layer (sand layer) is not suitable to
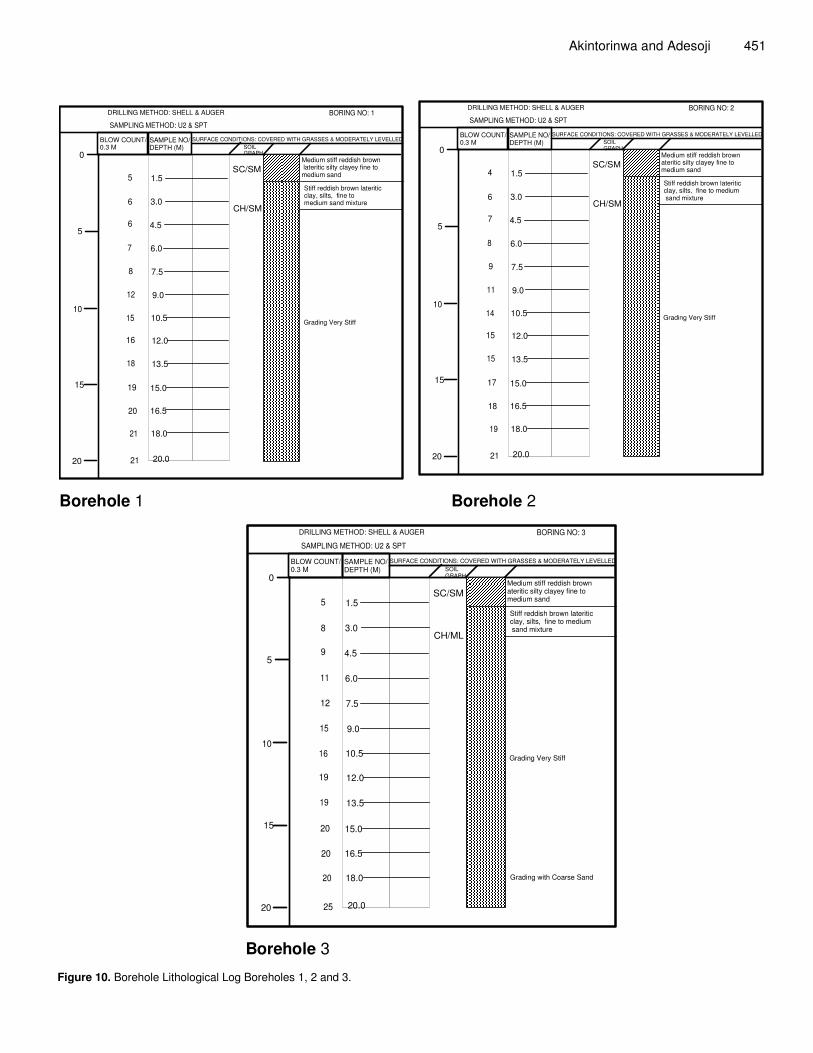
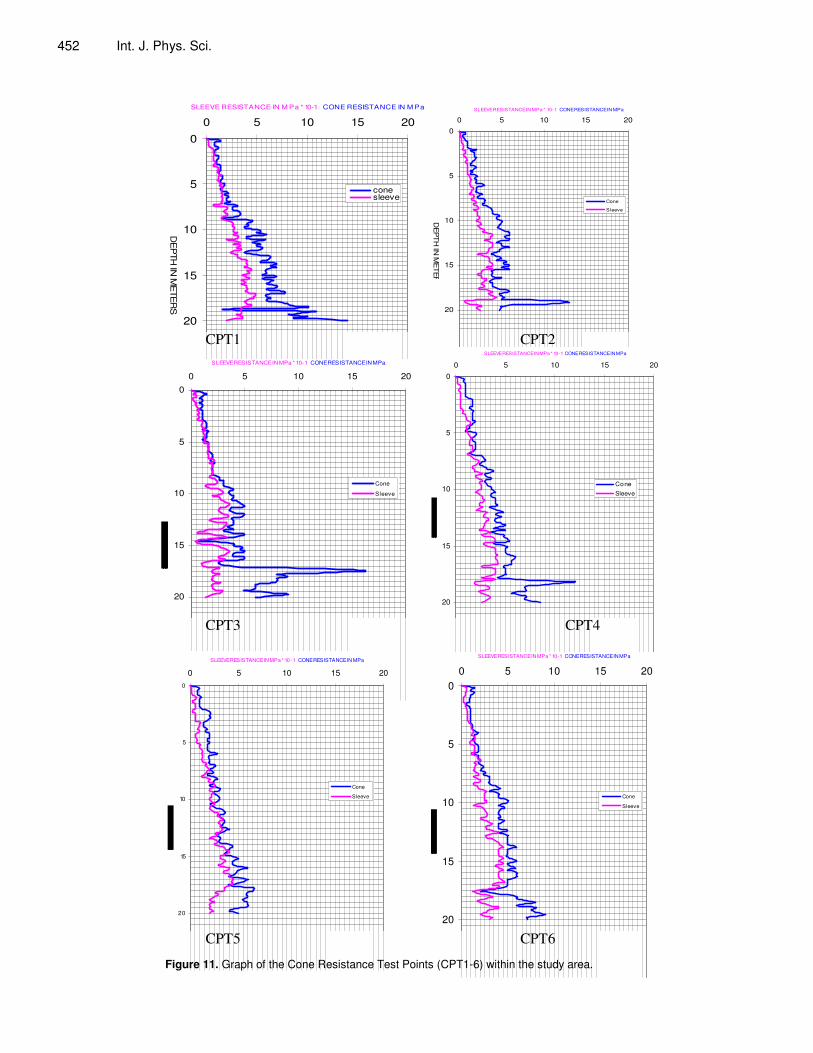
Figures 8 and 9 show the Isoresistivity and Isopach map of the second layer respectively. The second layer comprises of laterite and clayey coarse sand with resis-tivity values ranging from 1000 to 5500 Ω-m (Figure 8). The thickness range from 2 to 19 m (Figure 9), as shown on the Isoresistivity map. The highest resistivity values effectively serve as a medium for an earthing sys-tem. Therefore, there is need to increase the subsurface conductivity of this layer, especially within the area where the earthing electrode will be buried, preferably in the western parts of the area. Geotechnical results The borehole log (Figure 10) as well as the Cone penetration test plots (Figure 11), indicate that, the sub-soils are a consolidated reddish brown lateritic clayey and silty sand mixture with varying silt content. Based on the soil properties (identified from the collected soil samples) a 3-layered generalized profile was compiled (Table 1). The top layer, which is about 0.5 m thick, consists of consolidated reddish brown lateritic clayey and silty sand with vegetation roots. This top layer is underlain by a 29 m thick layer of reddish brown lateritic clay, silt and fine to medium grained sand mixtures, which are characterized by high plasticity. Due to the observed variations in the soil parameters, the subsurface can then be sub-divide into two layers. The thickness of the top layer varies between 0.5 to 8.5 m, and the silt content increases with depth, while the clay content decreases slightly. The values of the Standard Penetration Test (SPT) increases from 5 to 14 with a CPT of between 1 and 4 MPa (Table 1). The thicknesses of the lower layer vary from 8.5 to 20 m, and silt content decrease with depth as well as the clay content. The SPT-N values increases from 16 to 25 and CPT from 4 to 10 MPa with an average of about 5 MPa (Table 1). Sub-soil engineering evaluation of the study area
Soil corrosion that can lead to severe corrosion failure is known to be associated with low resistivity. Low resis-tivities (<100 -m) are indicative of good electrical con- ductivity paths arising from reduced aeration, increased
Akintorinwa and Adesoji 447
(a)
(b)
(c)
Figure 3. Typical sounding curves in the study area (a) KH Type, (b) A Type and (c) KHK Type.
448 Int. J. Phys. Sci.
20
10
BH 1 VES 11 VES10 VES 1 BH 2
925
5334
1299
990
3613
1093
7539
16257
Clay
Coarse sand
Clayey Sand
Sand
0
10 m
25 mScale
N S22492 103
DE
PT
H (
m)
30
0
BH Borehole
Figure 4. Geoelectric Section along North – South.
25839
8253
6879
3818
7539
576 1542 1601 15561093
26352905 2170
27693613
VES 5 VES 4 VES 3 VES 2 VES 1
20
10
0
10 m
25 mScale
E W
DE
PTH
(m)
223 633 736 571 224
30
Clay
Coarse sand
Clayey Sand
Sand
BH Borehole
0
Figure 5. Geoelectric Section along East – West.
Akintorinwa and Adesoji 449
787460 787480 787500 787520 787540 787560 787580 787600 787620
711120
711140
711160
711180
711200
711220
711240
711260
VES Stations
50 ohm-m
100 ohm-m
150 ohm-m
200 ohm-m
250 ohm-m
300 ohm-m
350 ohm-m
400 ohm-m
450 ohm-m
500 ohm-m
550 ohm-m
600 ohm-m
650 ohm-m
700 ohm-m
750 ohm-m
800 ohm-m
Contour line with value
0 m 25 m 50 m
150 Figure 6. Iso-resistivity Map of the Topsoil (First Layer).
787460 787480 787500 787520 787540 787560 787580 787600 787620
711120
711140
711160
711180
711200
711220
711240
711260
VES Stations
0.3 m
0.4 m
0.5 m
0.6 m
0.7 m
0.8 m
0.9 m
1.0 m
1.1 m
1.2 m
1.3 m
1.4 m
1.5 m
1.6 m
1.0 Contour line with value
0 m 25 m 50 m
Figure 7. Iso-pach Map of the Topsoil (First Layer).
450 Int. J. Phys. Sci.
VES Stations
500 Ohm-m
1000 Ohm-m
1500 Ohm-m
2000 Ohm-m
2500 Ohm-m
3000 Ohm-m
3500 Ohm-m
4000 Ohm-m
4500 Ohm-m
5000 Ohm-m
5500 Ohm-m
6000 Ohm-m
787460 787480 787500 787520 787540 787560 787580 787600 787620
711120
711140
711160
711180
711200
711220
711240
711260
1500 Contour line with value Figure 8. Iso-resistivity Map of the Second Layer.
787460 787480 787500 787520 787540 787560 787580 787600 787620
711120
711140
711160
711180
711200
711220
711240
711260
VESStations
1.0 m2.0 m3.0 m4.0 m5.0 m6.0 m7.0 m8.0 m9.0 m10.0 m11.0 m12.0 m13.0 m14.0 m15.0 m16.0 m17.0 m18.0 m19.0 m
0 m 25 m 50 m
1500 Contour line with value Figure 9. Iso-pach Map of the Second Layer.
Akintorinwa and Adesoji 451
0
5
10
15
20
5
6
6
7
8
12
15
16
18
19
20
21
21
DRILLING METHOD: SHELL & AUGER
SAMPLING METHOD: U2 & SPT
BORING NO: 1
BLOW COUNT/0.3 M
SAMPLE NO/DEPTH (M)
20.0
18.0
16.5
15.0
13.5
12.0
10.5
9.0
7.5
6.0
4.5
3.0
1.5
SURFACE CONDITIONS: COVERED WITH GRASSES & MODERATELY LEVELLEDSOILGRAPH
SC/SM
CH/SM
Grading Very Stiff
Medium stiff reddish brown lateritic silty clayey fine to medium sand
Stiff reddish brown lateritic clay, silts, fine to medium sand mixture
0
5
10
15
20
4
6
7
8
9
11
14
15
15
17
18
19
21
DRILLING METHOD: SHELL & AUGER
SAMPLING METHOD: U2 & SPT
BORING NO: 2
BLOW COUNT/0.3 M
SAMPLE NO/DEPTH (M)
20.0
18.0
16.5
15.0
13.5
12.0
10.5
9.0
7.5
6.0
4.5
3.0
1.5
SURFACE CONDITIONS: COVERED WITH GRASSES & MODERATELY LEVELLEDSOILGRAPH
SC/SM
CH/SM
Grading Very Stiff
Medium stiff reddish brownateritic silty clayey fine to medium sand
Stiff reddish brown lateritic clay, silts, fine to medium sand mixture
Borehole 1 Borehole 2
0
5
10
15
20
5
8
9
11
12
15
16
19
19
20
20
20
25
DRILLING METHOD: SHELL & AUGER
SAMPLING METHOD: U2 & SPT
BORING NO: 3
BLOW COUNT/0.3 M
SAMPLE NO/DEPTH (M)
20.0
18.0
16.5
15.0
13.5
12.0
10.5
9.0
7.5
6.0
4.5
3.0
1.5
SURFACE CONDITIONS: COVERED WITH GRASSES & MODERATELY LEVELLEDSOILGRAPH
SC/SM
CH/ML
Grading Very Stiff
Medium stiff reddish brownateritic silty clayey fine to medium sand
Stiff reddish brown lateritic clay, silts, fine to medium sand mixture
Grading with Coarse Sand
Borehole 3 Figure 10. Borehole Lithological Log Boreholes 1, 2 and 3.
452 Int. J. Phys. Sci.
0
5
10
15
20
0 5 10 15 20SLEEVE RESISTANCE IN M Pa * 10-1 CONE RESISTANCE IN M Pa
DE
PTH
IN M
ETE
RS
conesleeve
0
5
10
15
20
0 5 10 15 20
SLEEVE RESISTANCE IN MPa * 10-1 CONE RESISTANCE IN MPa
DE
PT
H IN
ME
TE
RS
Cone
Sleeve
CPT1 CPT2
0
5
10
15
20
0 5 10 15 20
SLEEVE RESISTANCE IN MPa * 10-1 CONE RESISTANCE IN MPa
Cone
Sleeve
0
5
10
15
20
0 5 10 15 20
SLEEVE RESISTANCE IN MPa * 10-1 CONE RESISTANCE IN MPa
Cone
Sleeve
CPT3 CPT4
0
5
10
15
20
0 5 10 15 20
SLEEVE RESISTANCE IN MPa * 10 -1 CONE RESISTANCE IN MPa
Cone
Sleeve
0
5
10
15
20
0 5 10 15 20
SLEEVE RESISTANCE IN MPa * 10-1 CONE RESISTANCE IN MPa
Cone
Sleeve
CPT5 CPT6 Figure 11. Graph of the Cone Resistance Test Points (CPT1-6) within the study area.
Akintorinwa and Adesoji 453
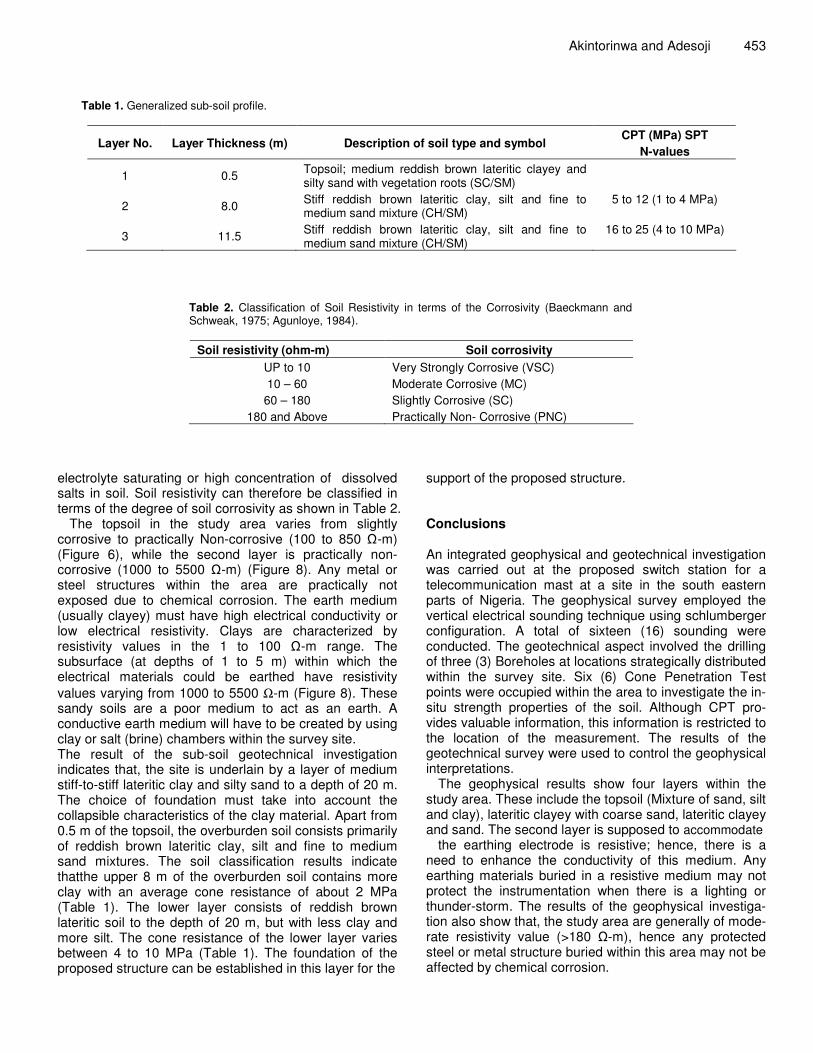
Table 1. Generalized sub-soil profile.
Layer No. Layer Thickness (m) Description of soil type and symbol CPT (MPa) SPT
N-values
1 0.5 Topsoil; medium reddish brown lateritic clayey and silty sand with vegetation roots (SC/SM)
2 8.0 Stiff reddish brown lateritic clay, silt and fine to medium sand mixture (CH/SM)
5 to 12 (1 to 4 MPa)
3 11.5 Stiff reddish brown lateritic clay, silt and fine to medium sand mixture (CH/SM)
16 to 25 (4 to 10 MPa)
Table 2. Classification of Soil Resistivity in terms of the Corrosivity (Baeckmann and Schweak, 1975; Agunloye, 1984).
Soil resistivity (ohm-m) Soil corrosivity UP to 10 Very Strongly Corrosive (VSC) 10 – 60 Moderate Corrosive (MC)
60 – 180 Slightly Corrosive (SC) 180 and Above Practically Non- Corrosive (PNC)
electrolyte saturating or high concentration of dissolved salts in soil. Soil resistivity can therefore be classified in terms of the degree of soil corrosivity as shown in Table 2.
The topsoil in the study area varies from slightly corrosive to practically Non-corrosive (100 to 850 -m) (Figure 6), while the second layer is practically non-corrosive (1000 to 5500 -m) (Figure 8). Any metal or steel structures within the area are practically not exposed due to chemical corrosion. The earth medium (usually clayey) must have high electrical conductivity or low electrical resistivity. Clays are characterized by resistivity values in the 1 to 100 -m range. The subsurface (at depths of 1 to 5 m) within which the electrical materials could be earthed have resistivity values varying from 1000 to 5500 Ω-m (Figure 8). These sandy soils are a poor medium to act as an earth. A conductive earth medium will have to be created by using clay or salt (brine) chambers within the survey site. The result of the sub-soil geotechnical investigation indicates that, the site is underlain by a layer of medium stiff-to-stiff lateritic clay and silty sand to a depth of 20 m. The choice of foundation must take into account the collapsible characteristics of the clay material. Apart from 0.5 m of the topsoil, the overburden soil consists primarily of reddish brown lateritic clay, silt and fine to medium sand mixtures. The soil classification results indicate thatthe upper 8 m of the overburden soil contains more clay with an average cone resistance of about 2 MPa (Table 1). The lower layer consists of reddish brown lateritic soil to the depth of 20 m, but with less clay and more silt. The cone resistance of the lower layer varies between 4 to 10 MPa (Table 1). The foundation of the proposed structure can be established in this layer for the
support of the proposed structure. Conclusions An integrated geophysical and geotechnical investigation was carried out at the proposed switch station for a telecommunication mast at a site in the south eastern parts of Nigeria. The geophysical survey employed the vertical electrical sounding technique using schlumberger configuration. A total of sixteen (16) sounding were conducted. The geotechnical aspect involved the drilling of three (3) Boreholes at locations strategically distributed within the survey site. Six (6) Cone Penetration Test points were occupied within the area to investigate the in- situ strength properties of the soil. Although CPT pro-vides valuable information, this information is restricted to the location of the measurement. The results of the geotechnical survey were used to control the geophysical interpretations.
The geophysical results show four layers within the study area. These include the topsoil (Mixture of sand, silt and clay), lateritic clayey with coarse sand, lateritic clayey and sand. The second layer is supposed to accommodate
the earthing electrode is resistive; hence, there is a need to enhance the conductivity of this medium. Any earthing materials buried in a resistive medium may not protect the instrumentation when there is a lighting or thunder-storm. The results of the geophysical investiga-tion also show that, the study area are generally of mode-rate resistivity value (>180 -m), hence any protected steel or metal structure buried within this area may not be affected by chemical corrosion.
454 Int. J. Phys. Sci. The results of the geotechnical investigation show that the site is underlain by layers of medium stiff-to-stiff late-ritic clay and silty sand to the depth of 20 m. The choice of foundation material must take into account the charac-teristics of the clayey material. REFERENCES Agunloye O (1984). Soil aggressivity along steel pipeline route at
Ajaokuta. J. Mining Geol. 21(1 & 2): 97-101. Avbovbo AA (1978). Tertiary lithostratigraphy of Niger Delta: Am. Assoc.
Pet. Geol. Bull. 62: 295-300. Baeckmann WV, Schweak W (1976). Handbook of cathodic protection:
The theory and practice of electrochemical corrosion protection techniques. Portucullis press survey. p. 396.
Baldi G, Bellotti R, Ghionna VN, Lo Presti DCF (1995). Modulus of sands from CPT and DMT: Proceedings of the 12th International Conference on Soil Mechanics and Foundation Engineering, pp.165–170.
Bremmer CN (1999). Developments in geomechanical research for
infrastructural projects, in 12th European Conference on Soil Mechanic and Geotechnical Engineering: Geotechniek, Special Issue, pp. 52–55.
Eslaamizaad S, Robertson PK (1998). Cone penetration resistance of sand from seismic tests, in Robertson PK, Mayne PW, Eds., Geotechnical site characterization: Balkema, pp. 1027–1032.
Ibe AC (1988). Coastaline erosion in Nigeria. Ibadan university press, Ibadan, Nigeria.
Vander Velper BPA. (1988). Resist version 1.0, Msc. Research project, ITC, Delf Netherland.