designing-in performance: a framework for evolutionary energy performance feedback in early stage...
TRANSCRIPT
Automation in Construction 38 (2014) 59–73
Contents lists available at ScienceDirect
Automation in Construction
j ourna l homepage: www.e lsev ie r .com/ locate /autcon
Designing-in performance: A framework for evolutionary energyperformance feedback in early stage design
Shih-Hsin Eve Lin, David Jason Gerber ⁎School of Architecture, University of Southern California, Watt Hall 204, Los Angeles, CA 90089, USA
⁎ Corresponding author. USC Viterbi School of EnginTel.: +1 617 794 7367.
E-mail address: [email protected] (D.J. Gerber).URL's: http://www.djgerber.com, http://www.usc.com
0926-5805/$ – see front matter © 2013 Elsevier B.V. All rihttp://dx.doi.org/10.1016/j.autcon.2013.10.007
a b s t r a c t
a r t i c l e i n f oArticle history:Accepted 13 October 2013Available online 1 December 2013
Keywords:Multidisciplinary design optimization (MDO)Conceptual energy analysisPerformance based designGenetic Algorithm (GA)Multi-objective optimizationDesign decision supportDesign automationDomain integration
Multidisciplinary design optimization (MDO) has been identified as a potential means for integrating design andenergy performance domains but has not been fully explored for the specific demands of early stage architecturaldesign. In response a design framework, titled Evolutionary Energy Performance Feedback for Design (EEPFD), isdeveloped to support early stage design decision-making byproviding rapid iterationwith performance feedbackthrough parameterization, automation, and multi-objective optimization. This paper details the developmentand initial validation of EEPFD through two identified needs of early stage design: 1) the ability to accommodateformal variety and varying degrees of geometric complexity; and 2) the ability to provide improved performancefeedback formultiple objective functions. Through experimental cases the research presents effective applicationof EEPFD for architectural design.
© 2013 Elsevier B.V. All rights reserved.
1. Introduction
Awidely accepted idea that the availability of simulated performancefeedback will lead to improved performance in design in conjunctionwith the idea that automation and integration of performance analysisinto early stage design will also contribute to higher performing designshas led to the authors pursuing the concept of “designing-in perfor-mance.” Our concept is part of the performance based design body of re-search and is different only in that “designing-in performance” is definedin this paper as a method for providing performance feedback to influ-ence design exploration and subsequent decision making that is not in-trinsically available in a conventional design process, especially in theearly stages. The framework is based on the finding that currentlythere is limited direct and validated feedback between the domains ofdesign and energy simulation and optimization available during theearly stages of the design process where it has been acknowledged thatsuch decision making has the highest potential impact on the overallbuilding performance [1]. “Designing-in performance” is therefore con-ceived of as a performance based design environmentwhere a designer'sstate ofmind can automatically be influenced by performance based de-sign feedback within a designer's common parametric workflow.
The use of multidisciplinary design optimization (MDO) to providethe desired performance feedback for design decision making has
eering, Los Angeles, CA, USA.
(D.J. Gerber).
ghts reserved.
demonstrated a potentially effective means to overcome the limitationsof current performance-based design processes. MDO provides the op-portunity for design automation to bring performance analysis to theearly stages of design by providing an expanded set of design alterna-tives that can be easily generated, assessed, and ranked according tomultiple performance criteria to generate a visualized and simulta-neously quantified trade-off analysis. Motivating the research is thegap in currentMDO attempts to fully explore the applicability of this ap-proach to early stage architectural design. The scope of this research isto evaluate the suitability of applying MDO to early stage design inthis context for the purpose of assisting design decision making. There-fore, an MDO design framework entitled Evolutionary Energy Perfor-mance Feedback for Design (EEPFD) is established for designer useduring the conceptual stages of design where geometry and massinghave not been finalized. The objectives of this paper are to first detailthe development of EEPFD, the constituent integrations and steps, andthe implementation of a customized Genetic Algorithm (GA) basedmulti-objective optimization (MOO). Theoverall goal of EEPFD is to pro-vide designers with more immediate and easily accessible performancefeedback within their early stage design exploration process. However,prior to the exploration of EEPFD's usability by designers, the frame-workmust first be validated against two identified prerequisite criteria.The two critical criteria for evaluation of the framework's applicabilityare 1) the ability to provide a solution space with an improved perfor-mance, across the multiple competing objective functions defined inSection 3, and 2) the ability to be adaptable to awide spectrumof designscenarios, both in typology and geometric complexity. To be consideredsuccessful both of these criteria need to be met in a timely manner,
60 S.-H.E. Lin, D.J. Gerber / Automation in Construction 38 (2014) 59–73
thereby reducing design cycle latency and improving upon aspects ofdesign uncertainty. The focus of this paper is twofold:first on describingthe development of EEPFD, and secondon EEPFD's ability to successfullymeet the aforementioned prerequisites. Furthermore the success of ourwork will be to see an intrinsic integration of energy simulation withinthe dynamic and differentiated concept design processes for architects.Some benchmark studies focusing on the process validation throughboth manual and automated exploration processes using EEPFD havebeen researched and described [2]. These process studies are a follow-on from this work and a precedent for future work on development ofbest practices.
2. Background and literature review
With the advancement of computational tools for building design,performance is claiming a more prominent role as a driving force indesign decision making [3]. However, design professionals are oftenunable to adequately explore design alternatives and their impact onenergy consumption upfront due to an array of challenges between de-sign and energy performance domains.While several efforts weremadeto isolate these challenges, time constraints and interoperability issuesbetween software and expert domains have been identified as twomajor contributing factors [4–10]. Consequently, in part, performanceassessments are typically made after the initial design phase, wherethe analysis is performed on a very limited set of design alternativesrather than to support early stage design decisions where a broaderrange of possibly more optimal solutions may exist [11]. In addition,previous research has suggested that trade-off studies are necessaryin order to provide adequate feedback for design decision making[11,12]. This is consistent with the widely accepted view that design istypically understood as an ill-defined problem [13], involving compet-ing objectives for design professionals to design, explore and synthesize.However, these studies can become time intensive and complicated;requiring input from multiple disciplines in order to provide relevantfeedback, and as such are often minimized by necessity and marginal-ized as a result. In order to overcome these obstacles, several re-searchers have made efforts to isolate tool and process requirementsthat can facilitate the “designing-in performance” environment[6,7,9,14]. To summarize their efforts, a design framework and toolnot only require a user friendly environment, but also have the abil-ity to provide 1) rapid generation of design alternatives; 2) rapidevaluation of design alternatives; 3) trade-off analysis for compet-ing criteria; and 4) a search method to identify design alternativeswith better fit performance.
When facing the challenges of integrating design with energy simu-lation and performance analysis, efforts can be encapsulated into twogroups. One focus has been on the interoperability issue among soft-ware and different domain expertise. Examples of these efforts can befound in data model and process standardization [15–17] along withcollaborative framework development [18–22]. While solutions tointeroperability would ease in the generation and evaluation of designalternatives, it is arguably insufficient [23] and cannot fulfill all the iden-tified requirements for “designing-in performance” in early stage con-ceptual design. This leads to a second research focus on providing anintelligent search method which incorporates rapid evaluation andtrade-off analysis to further support design decision making duringthe early conceptual stages. This second category of research has twothrusts: sensitivity analysis [24–26] and the development of optimiza-tion techniques [10,27–34] as intelligent searching methods that sup-port trade-off analyses for identifying “best fits” across competingobjectives. In this case sensitivity analysis is used as ameans to decreaseuncertainties of often changing and complexly coupled and de-coupledvariables during the design process. However, design objectives areoften non-commensurable with their relative importance and difficultto evaluate before post sensitivity analysis [12]. In addition, even withsensitivity analysis in place, a method that can quickly identify higher
performing design is still needed. Therefore, considering that time isstill a dominant factor in dictating stopping points during the earlydesign stage, andwhile both research thrusts present promising poten-tial in supporting decisionmaking, this researchquestions the feasibilityof sensitivity analysis alone as a primary approach to drive the genera-tion of an early design solution space. As a result, a multi-objective op-timization and search inclusive of sensitivity analysis approach ischosen as the foundation and focus of this research.
The utilization of parametric modeling coupled with optimizationtechniques has drawn attention as a potential solution to provide anintelligent searchingmethod for efficient feedback. Thismethod is usuallyreferred to as multidisciplinary design optimization (MDO) in the aero-space and automobile industries [35]. In this research, MDO is referredto as a general term of the approach that couples parameterizationand optimization techniques to solve multi-objective problems. WhileMDO has been demonstrated as an effectivemeans for integratingmul-tiple expert domains along with impacting decisions made during theproduct design process [36], it has also demonstrated potential whenapplied to the Architecture, Engineering and Construction (AEC) indus-try. However, the majority of MDO applications to aspects of buildingdesign and energy performance have been limited to mechanicalsystem design [37–40], glazing and façade designs [10,38,41–43],retrofitting strategies [44], or studies on the effectiveness of optimiza-tion algorithms [29,45]. Where research has shown interest into therelationship between design form and energy performance, overly sim-plified geometry is often employed as a means of proof of concept[29,30,34]. Significant to our approach and the context of these designstage limitations where form exploration with energy performancefeedback is considered anessential need for “designing-in performance”during the early stage of the design process, the potential value of MDOto facilitate the process has as of yet been fully explored.
A critical distinction of this research is the focus on the application ofMDOby the architectural designfieldwhereas previous researches havebeen primarily through the fields of building science or engineering[46]. Other recent representative efforts focused on designers' utilizingparametric design and optimization techniques in energy simulation in-clude: Janssen's EPPD [29], Caldas' GENE_ARCH [28] along with the col-laborative works of Yi and Malkawi [31,32]. Janssen's EPPD utilizes anasynchronous decentralized evolutionary approach to accelerate thefeedback process with the aim of making it easier for designers to useevolutionary algorithms. However, the lack in flexibility for designersto formulate their design problemand the lack in the amount of time re-quired in generating feedback are reported as the remaining challengesfor EPPD [29]. A user interface for non-programmers has been devel-oped to facilitate the process but there are currently no usability studiespresented outside of the EPPD research team [47]. In parallel, Caldas'GENE_ARCH [28] is a GA basedmulti-objective optimization (MOO) de-sign exploration tool which incorporates energy and daylighting perfor-mance as objective functions. Currently, it has been applied to examinefaçade configurations and shape generations. While the stated purposeof GENE_ARCH is to assist architects in pursuing more sustainable de-sign, Caldas asserts that, “when a design is generated and evaluated byGENE_ ARCH, it is a whole building entity that is being assessed, notan initial design concept or an abstract geometrical shape [28].” As a re-sult, the application of GENE_ARCH to assist design exploration duringthe early design stage, where concept and form evaluation is needed,has not been adequately resolved. In order to extend the design prob-lems that can be explored through GENE_ARCH, it is further integratedwith a shape grammar to act as GENE_ARCH's shape generationmodule[48]. However, the usability and flexibility of GENE_ARCH outside of theresearch team have been neither explored nor evaluated. In addition,during Caldas' research, it was found that reductions in overall energyconsumption were observed in direct relation to the overall buildingsize, which unfortunately led to optimal designs only being identifiedas those minimizing space within the allowable design constraints[49,50]. As such, it can be argued that reliance on design constraints

61S.-H.E. Lin, D.J. Gerber / Automation in Construction 38 (2014) 59–73
alone is not enough to control optimization results. While the use ofenergy use intensity (EUI) instead of overall energy consumption asthe objective function measurement negates the issue of preferencetowards minimized program, a means of including an evaluation ofcompliance with the desired spatial programming areas is still neededto provide the trade-offs between expected performance and met de-sign requirements. Furthermore, the geometries explored throughGENE_ARCH are currently limited to the stacking of simple orthogonalbox volumes with roof tapering and façade opening variations, withmore complex geometries still left unexplored [28,48]. In an effort toincrease the geometric complexity available during the building perfor-mance optimization process, Yi and Malkawi utilize hierarchical point-based relations to define the design form [31]. The proposed designmethod is then further applied to include consideration of Computa-tional Fluid Dynamics (CFD) and energy simulation [32]. While thisapproach successfully demonstrates the ability to explore more com-plex forms during the optimization process, it requires designers todefine their design concept as a series of hierarchical point-based rela-tionships. As this is not currently included in published design processesoutside of the original research team, there is concern regarding theusability and applicability of this method of geometric definition beingused during the design process.
While the current efforts of Janssen, Caldas, and Yi and Malkawirecognize the importance of form exploration and its impact on energyuse, some efforts are unable to accommodate effective exploration ofcomplex geometry [28,29], while others are only able to do so througha customized encoding scheme [48,51] or specified design logic[31,32]. This limits their frameworks' ability to be adopted and furthertested for early stage design where the exploration of varying degreesof form is needed. Subsequently, published experimental case studieshave relied solely on the use of the researchers themselves as the exper-imental user. Therefore, the impact of these frameworks on the designprocess outside of a controlled environment remains as an essentialquestion. Consequently, the applicability of these frameworks on thedesign process, and that of MDO in general for the early stage designprocess, has been left largely unexplored or measured.
3. Evolutionary energy performance feedback for design (EEPFD)
In response to observed gaps in existing research, an early stage de-sign framework which supports conceptual form exploration in varyingdesign problems is needed in order to further validate the use of MDOfor enabling designing-in performance during the early stage of thedesign process. EEPFD is therefore developed utilizing two essentialcomponents from MDO methodology, parametric design and multi-objective optimization. EEPFD incorporates both conceptual energyanalysis and design exploration of simple to complex geometry in
Fig. 1. EEPFD's six-step process for integr
order to provide energy performance feedback for early stage designdecision making. Included in the multi-objective optimization (MOO)process are the competing objective function of spatial programmingand financial performances for consideration in performance trade-offstudies. Subsequent reference to the improved performance of aparticular design refers to these three domains and their respectivemeasurements of energy use intensity (EUI), net present value (NPV),and spatial programming compliance (SPC).
The process of applying EEPFD to obtain performance feedback fordesign decisions can be described in the six steps illustrated in Fig. 1.The first step has two subcategories: the generation of the initial designand the generation of design alternatives. In EEPFD, the initial design isgenerated by the user through a parametricmodel and a constraintsfile.At this point the initial geometry, applicable parameters and ranges, siteinformation, program requirements, and available financial informationare instantiated manually by the user. The generation of the design al-ternatives is part of the automated process driven by the customizedGA-based MOO in EEPFD. Once the initial design is input into the auto-mated system, the following steps are then cycled through until theautomation loop is interrupted either by the user or by the meeting ofthe system's termination criteria. Once the automation loop ends,there are two ways to proceed: 1) a design alternative is selectedbased on the multi-objective trade off analysis provided by EEPFD andthe design proceeds to the next stage of development or; 2) the usermanually implements changes in the initial design or constraints file be-fore reengaging the automation loop. A detailed description of the pro-cess as a whole and of each step, designer driven and or computerdriven, and the process of applying EEPFD implemented by users canbe found in a previously published work [2].
The development of EEPFD necessitates an ability to generate thedesired automation and optimization or search routine. In response aprototype tool, H.D.S. Beagle [52], is developed in parallel with EEPFDto facilitate this research and the development of the framework [53].H.D.S. Beagle is developed as a plug-in of Autodesk® Revit® [54](Revit), which integrates Autodesk® Green Building Studio® [55](GBS) andMicrosoft® Excel® [56]with Revit as needed. Revit is a build-ing information modeling platform that enables designers to definetheir geometry while providing a series of parameters that impactthe development of varying geometric configurations. The EEPFD is de-signed for the user to design their parametric conceptual model in aconceptualmass family, a purposefully common activity in architecturalpractices. The mass family is customized to communicate to the threeobjective analytical engines and the GA through a set of template inter-faces enabled through toggles and the establishing of parameter ranges.This platform also serves as an insertion point for the energy settingsnecessary for a conceptual energy analysis through GBS. GBS is a web-based energy analysis service that serves as the energy simulation
ating design and energy simulation.
62 S.-H.E. Lin, D.J. Gerber / Automation in Construction 38 (2014) 59–73
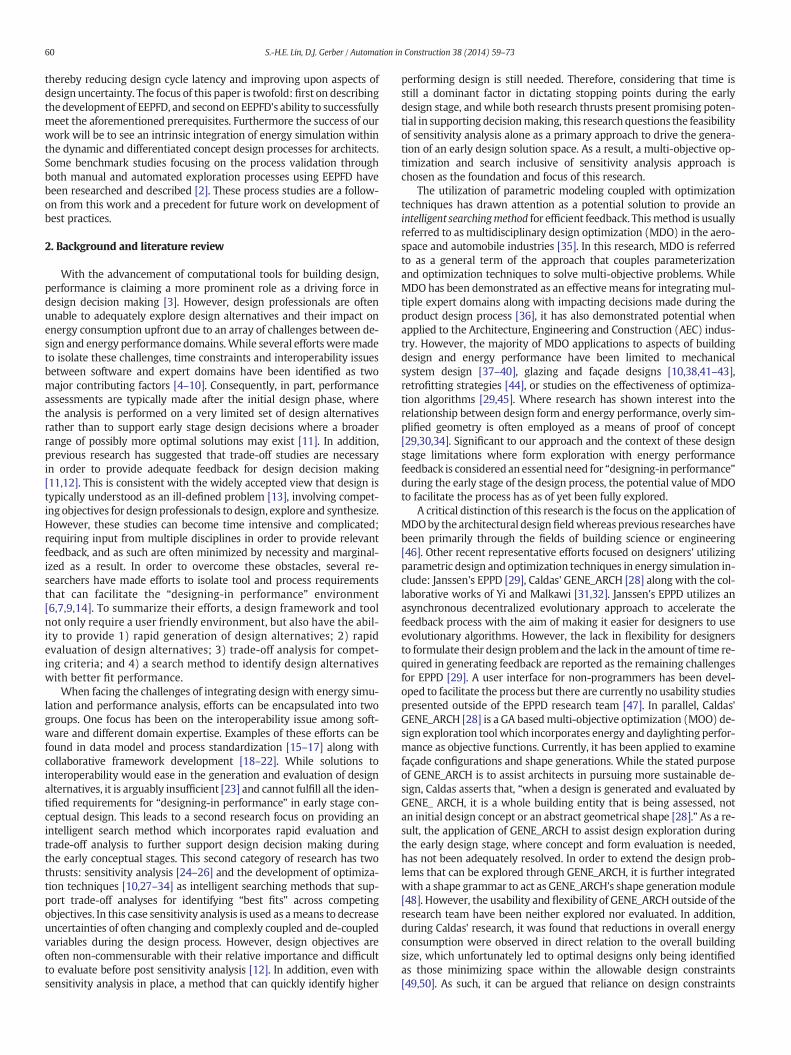
engine for the prototype. Finally, Excel provides not only a means ofcontaining financial parameters and formulas, but also a user interfaceproxy in which designers can set up design parameters, parameterranges, constraints, spatial program parameters, and the spatial pro-graming compliance formula. The selection of the platforms is madebased on three considerations: 1) the research interest focus on energy,financial and design requirement domains; 2) the potential of futurecloud-based implementation; and 3) the bypassing of typically encoun-tered interoperability issues between design and energy simulationdomains. The detailed functionality of each platform and the systemarchitecture of H.D.S. Beagle can be found in previously publishedwork [2]. After the determination of the platforms, a GA based MOOmethod is implemented to complete the automation routine. A detaileddescription of the GA based MOO method driving this overall frame-work is introduced in Fig. 2 illustrating the GA implemented by this re-search. Original to our work is the stage in which the GA is introducedinto the designer workflow and the encoding methods to enable earlystage geometrically focused design exploration. Our GA is based on pre-vious research and uses a tournament selection approach for generatingPareto optimal solutions.
3.1. Objective functions
The selected objective functions by this research are divided intospatial programing compliance, energy performance, and financialperformance. The spatial programing compliance score evaluates themeeting of the project defined program requirements by a generateddesign option. The energy use intensity (EUI) value evaluates theestimated energy performance of the generated design option. Finally,the financial performance NPV value is calculated according to the
Fig. 2. The algorithmic workflow of the multi-obje
definition of the financial pro forma for each generated design option.The three objective functions can be formulaically expressed as follows:
Sobj ¼ Max: SPCEobj ¼ Min: EUIFobj ¼ Max: NPVwhereSobj ¼ SpatialProgramingComplianceObjectiveFunctionEobj ¼ EnergyPerformanceObjectiveFunctionFobj ¼ FinancialPerformanceObjectiveFunctionSPC ¼ SpatialProgrammingComplianceScoreEUI ¼ EnergyUse IntensityNPV ¼ NetPresent Value
3.1.1. Spatial programing compliance objective function (SPC)Program requirements are usually thefirst criterion to be considered
by a design project and are typically a driving factor early on in the de-sign process. While the flexible nature of program requirements allowsfor compromise in the interest of meeting other design goals, such asminimizing energy consumption [50], this component should be includ-ed in any design exploration process involving trade-off analysisstudies. In response, SPC is selected by this research as an objectivefunction as part of the trade-off analysis.
Table 1 provides an example of the SPC calculation as defined by thisresearch. Input for the SPC calculation is derived from three sources:I) project requirements from the user; II) design model informationfrom generated design alternative; and III) research defined calculationformula. The first set of values is provided by the designer through theExcel template in order to define the project's spatial requirements. In
ctive optimization in our EEPFD framework.

Table 1An example of spatial program parameters & scoring formula for a mix-used building ex-perimental case.
Spatial programparameter name
Value Valuesource
Office Area Requirement 55000a IHotel Area Requirement 50000a
Retail Area Requirement 40000a
Parking Area Requirement 22680a
Total Parking Area Gross Floor Area: Parkingb IITotal Office Area Gross Floor Area: Officeb
Total Retail Area Gross Floor Area: Retailb
Total Hotel Area Gross Floor Area: Hotelb
Spatial Programing Compliance Score Formula
a= abs(Total Office Area−Office AreaRequirement)∕Office Area Requirement
III
b= abs(Total Hotel Area−Hotel AreaRequirement)∕Hotel Area Requirement
c= abs(Total Retail Area−Retail AreaRequirement)∕Retail Area Requirement
d= abs(Total Parking Area−Parking AreaRequirement)∕Parking Area Requirement
Final SPC Score= 100∗(1−(a+b+c+d)∕4)a Value obtained from the excel template (*xlxs) defined by user for each project.b Value obtained from the design model (*rvt).
Table 2Financial settings, parameters, and formula in the Beagle Financial Model (NPV).
Costcategory
Financial paramname
Formula
Constructioncost
Land Acquisition Unit Land Acquisition Cost∗Lot SizeStructure Unit Structure Cost∗Gross VolumeFloor Construction Unit Floor Construction Type Cost∗
Mass Floor AreaSlab Construction Unit Slab Construction Type Cost∗
Mass Slab AreaExterior WallConstruction
Unit Exterior Wall Construction Cost∗Mass Exterior Wall Area
Exterior Wall–UndergroundConstruction
Unit Exterior Wall−UndergroundConstruction Cost∗Mass Exterior Wall−Underground Area
Interior WallConstruction
Unit Interior Wall Construction Cost∗Mass Interior Wall Area
Glazing Construction Unit Glazing Type Cost∗Mass Glazing AreaRoof Construction Unit Roof Construction Cost*
Mass Roof AreaSkylight Construction Unit Skylight Construction Cost∗
Mass Skylight AreaShade Construction Unit Shade Construction Cost∗
Mass Sade AreaCirculation Cost Unit Circulation Cost∗Gross Floor AreaHVAC System Cost Unit HVAC System Cost∗Gross Volume
Operationcost
Annual Electricity Cost Electricity EUI∗Electrical Cost∗Gross Floor Area
Annual Fuel Cost Fuel EUI∗Fuel Cost∗Gross Floor AreaAnnual Operating Cost Unit Operation Cost∗Gross Floor Area
Revenue Annual Lease Payment Unit Lease Payment∗Gross Floor AreaCash flow Cash Flow Time Span Fixed User Defined Value
Discount Rate Fixed User Defined Value
Financial score
NPV ¼ ∑T
t¼1
Ct
1þ rð Þt C0
!
whereT ¼ Cash Flow Time Spanr ¼ Annual Rate of ReturnC0 ¼ Construction CostCt ¼ Revenue−Operation Cost
Note:Italic text — Value retrieved from user modifiable template.Underlined text — Value retrieved from the conceptual mass building (.rvt).Italic underlined bold text — Value retrieved from the energy analysis results.
63S.-H.E. Lin, D.J. Gerber / Automation in Construction 38 (2014) 59–73
the example provided in Table 1 the project requirements are defined as55,000ft2 of office area, 50,000ft2 of hotel area, 40,000ft2 of retail area,and 22,680ft2 of parking area. The second set of inputs is extractedautomatically by the Beagle from each design alternative according toeach alternative's generated spatial programing results. For example, adesign alternative for the requirements in Table 1 may have 45,000ft2
of office, 37,000ft2 of hotel, 42,000ft2 of retail, and 21,650ft2 of parking.The final value set is derived from the input of the previous two sets intothe SPC formula as defined in Table 1, also in an automated fashion. Inthis case the previously outlined design alternative would receive anSPC score of 86.5 thereby indicating an 86.5% compliance with theuser defined design program requirements.
3.1.2. Energy performance objective function (EUI)The energy use intensity (EUI) is selected since it reflects the esti-
mated overall building energy consumption in relation to the overallbuilding floor area. The process to obtain the energy analysis result isautomated by H.D.S. Beagle through the systems integration of Revitand GBS. After obtaining the simulation results of each design alterna-tive, energy use intensity with usage and cost of electricity and fuel isextracted by H.D.S. Beagle to calculate the objective scores for eachdesign alternative. Despite the abundance of data available, such asdaylighting analysis, renewable energy potential, lifecycle energy cost,or monthly heating load and cooling load, this research focuses onutilizing the total energy use intensity as the energy performance objec-tive function. Usage and cost of both electricity and fuel for each designalternative are used as inputs necessary for the net present value finan-cial calculations as described below.
3.1.3. Financial performance objective function (NPV)The primary goal of including the net present value objective func-
tion is to evaluate potential design alternatives according to their esti-mated costs and prospective incomes. For this purpose a net presentvalue (NPV) is utilized to provide a design alternative's financial perfor-mance through an estimate of the expected construction costs, opera-tion costs, and generated revenue values. Included information of eachdesign alternative is extracted from both the generated geometry andthe simulated energy analysis results. Construction costs are derivedfrom combining calculated material quantities from the generatedgeometry with their respective user provided unit prices or acceptance
of the default cost settings. Operation costs are calculated by combiningthe expected fuel and electricity usages from the energy simulation re-sults with per unit costs provided by the user or defaults in the system.Finally, prospective income is derived from a user defined or defaultvalue for each square foot of specified program combined with thecalculated program quantities from the generated geometry.
Table 2 provides a listing of these elements and themeans by whichthey are implemented to generate the NPV of each design alternative.
The list of available parameters contributing to the estimate of theconstruction cost of a design alternative is considered flexible andextensible in nature with the ability to contract and expand due touser preference and levels of market cost detail. The same is applicableto the contributing parameters for the operation cost estimates. Itshould be noted that due to this flexible nature the accuracy and exten-sive quality of the resulting NPV score are highly dependent on the userinput for the local and timing of the market conditions.
3.2. Design problem formulation
In order to apply a GA to a problem there is a need for a formalmathematical definition of inquiry. Once the relationship between aproblem and its respective solution pool is defined, the systematicalexploration and evaluation of the solution pool can be achieved.Parameters applicable to this process can be divided into two primary

Table 3Energy setting parameters available for exploration by name, type and range.
ID Energy setting parameter name Parametertype
Variationrange/(Unit)
E1 Conceptual Construction Enumeration NAE1-1 Mass Exterior WallE1-2 Mass Interior WallE1-3 Mass Exterior
Wall–UndergroundE1-4 Mass RoofE1-5 Mass FloorE1-6 Mass SlabE1-7 Mass GlazingE1-8 Mass Skylight
Mass ShadeMass Opening
E2 Target Percentage Glazing Real number [0,1]E3 Target Sill Height Real number [0,a] (Project
Length Unit)E4 Shade Depth Real number [0,a](Project
Length Unit)E5 Target Percentage Skylight Real number [0,1]E6 Skylight Width & Depth Real number [0,a](Project
Length Unit)
a Value dependent on input from user.
Table 4An example of the list of parameters, types, and their exploration ranges of a GA run with13 parameters of interest.
Parameter Name Type Unit Exploration Range
G1 Level#Hotel Integer N/A [4,6]G2 Level#Office Integer N/A [4,6]G3 Level#Retail Integer N/A [4,6]G4 Level#Parking Integer N/A [1,3]G5 TwistAngle Real ° [0, 90]G6 TopSetback Real ft [1,10]G7 ScaleFactor Real N/A [0.8, 1.25]G8 CanyonWidth Real ft [12,30]G9 BaseSetback Real ft [6,15]G10 Target Percentage Glazing Real N/A [0.2, 0.83]G11 Shade Depth Real ft [0, 4.5]G12 Target Percentage
SkylightReal N/A [0, 0.45]
G13 Conceptual Construction strings N/A 1. Single Pane Clear — No Coating– Mass Glazing 2. Single Pane — Tinted
3. Single Pane — Reflective4. Double Pane Clear— No Coating5. Double Pane — Tinted6. Double Pane — Reflective7. Double Pane Clear— LowE ColdClimate, High SHGC8. Double Pane Clear— LowE HotClimate, Low SHGC9. Double Pane Clear— HighPerformance, LowE, High Tvis,Low SHGC10. Triple Pane Clear— LowEHot orCold Climate
64 S.-H.E. Lin, D.J. Gerber / Automation in Construction 38 (2014) 59–73
categories; parameters possessing a range of acceptable values whichdefine the solution pool of interest and parameters possessing givenvalues which are used tomeasure and evaluate individuals falling with-in that defined pool of interest.
Parameters possessing a range of acceptable values that are used todefine the solution pool of interest in the context of this research canbe further divided into design parameters and energy setting parameters.Design parameters are parameters that drive geometric configurationsand can be treated as design specific parameters to be defined by theuser. Energy setting parameters are parameters that relate to energyconsumption. In addition these two subcategories can be consideredgenotype parameters as they are used to define the “genes” later usedby EEPFD's customized GA.Design parameters and energy setting param-eters are described in further detail in the following sections.
Parameters possessing a given value are used to measure and evalu-ate the performance of individual potential design solutions accordingto EEPFD's defined objective functions. These parameters can be furtherdivided into spatial program parameters and financial pro forma parame-ters which are used by the SPC and NPV respectively as previously de-scribed. These values are all fixed during a GA run but can be adjustedby the user as needed prior to GA engagement.
3.2.1. Design geometry parametersDesign geometry parameters are used to define the associative
parametric model and provide all form driving parameters along withtheir acceptable ranges. The extent and configuration of these parame-ters are dependent on the user. This set of parameters can be further di-vided into three sections: driving, driven, and fixed. Driving parameterscan be considered as independent parameters possessing acceptableranges in values such as building height, number of levels, tapering ortwisting factors, and orientation. Driven design parameters do not pos-sess a range of acceptable values and are directly dependent on drivingparameters. For example, retail space is being defined as ground level ir-respective of the resulting number of office floors above. Fixed designparameters also possess only a single given value but are not dependenton either driven or driving parameters. With regards to the GA, onlydriving parameters can later be used as “genes.” Careful considerationmust be made regarding settings that affect both the resulting geomet-ric configuration of the potential design solution and the energy perfor-mance of the said solution. For example, the occupancy of a space has aconsiderable impact on the expected energy usage of that space. There-fore design geometry parameters must be established in such a way asto provide an association with all generated levels and a space programtype per level so as to ensure consistency in the EUI calculations. This isachievedby assigning and stacking the different program types in a con-sistent order. This is also at present a limitation of themethod describedin the limitations discussion in Section 6.
3.2.2. Energy setting parametersEnergy setting parameters are those which have a direct impact on
the translation of a potential design solution from the design geometryand massing form into an energy model through Revit such as quantityof glazing or thermal properties of exterior wall construction. However,the specific parameters of this type available to this research are limitedby those available through Revit and are described in Table 3.
As with design geometry parameters, the level of depth explored bythe energy setting parameters is directly dependent on the user. Forexample, the overall amount of glazing can be applied to the buildingas either awhole or in varying amounts on specifically oriented surfaceswhich will have a varying impact on the calculated objective functions.
3.3. Genetic Algorithm encoding
In applying a GA there are three typical coding schemes: binary, nu-merical, and symbolic with the binary coding scheme being the mostcommon.However, this research employs the numerical coding scheme
as it was determined to be the most suitable to supplying the flexibilityneeded by EEPFD so designers are able to formulate their design prob-lems through standard use of a design platform and parametric model-ing process. Designers more commonly explore parameters that arerange based. Through the numerical encoding scheme each parameterof interest and possessing of a user-defined range of acceptable valuescan be considered as a “gene.” A “chromosome” is then defined as a se-ries of “genes”with a value fallingwithin the acceptable range assignedto each “gene.” Therefore, a designwith 13parameters of interest, as de-scribed in Table 4, will have design alternatives with a chromosomecomprised of 13 values, one assigned for each genewithin the set explo-ration range.

65S.-H.E. Lin, D.J. Gerber / Automation in Construction 38 (2014) 59–73
In the application of the numerical coding scheme three types ofparametric values are used: continuous numbers (real), discrete num-bers (integers) and enumerations (e.g. different construction types(strings)). In addition, parameter values are confined to fall withinuser established constraints during an engagement of the GA to yieldvalid results. Continuous numbers can be considered as real numberswith their values utilized exactly as generated by the GA with no mod-ification. For example if the TwistAngle parameter as listed in Table 4, isdefined as possessing a range of 0° to 90° then any value generatedthrough either mutation or crossover falling within this range wouldbe considered valid be it 54.3° or 45°. Discrete numbers, however, areconfined to integer values despite the actual value generated by theGA. For example, the parameter entitled Level#Hotel in Table 4 has adesignated value of 4 to 6 stories. However, as only integer values areof practical interest in this category, if a value of 5.3 is obtained duringthe GA operation then a value of 5 would be used as the value forthis parameter. A similar approach is used for enumeration of stringparameters. Enumeration parameters are parameters that, instead ofrequesting a value, request that a selection be made from a text basedlist. For example, an enumeration parameter might ask that a construc-tion type be selected from the provided options. In this case an integervalue is assigned to each option and then treated as such during theGA operation. After the operation is complete the resulting integervalue is then coordinated with the original text based selection. For ex-ample, if there are 10 choices of construction type available for MassGlazing and a value of 3.2 is obtained through the GA operation thenthe 3rd choice on the construction type list would be assigned to thisvalue.
3.4. Population methods
There are three population mechanisms used by the GA in thisresearch, one for the initial population (gen=0); one for the first gener-ation (gen=1); and one for populating all subsequent generations(genN1). This approach is used to ensure that the initial populationprovides a full spectrum of possible offspring before proceeding withoptimization. For the initial population (gen=0), the GA is instructedto evenly distribute parameter values among the resulting offspring soas to ensure that all potential gene values are available for further
Fig. 3. A sample design alternative's “chromosome” composed of 13 “genes” corresponding with10 with an even distribution of parametric values across user defined ranges of interest for eac
exploration. For example, in Fig. 3 G8, entitled CanyonWidth, dictatesthe space found between the two resulting towers. The user definedrange of interest has been designated as 12ft to 30ftwith the initial pop-ulation to contain ten offspring. Therefore the algorithm will assignvalues for G8 in increments of 2ft to cover the full range of interest with-in the initial population (gen=0). If the initial population contained six-teen offspring then the explored value for G8would be in increments of1.2ft. To ensure the depth of diversity available to all subsequent poten-tial offspring, the population of the first generation (gen=1) is designedso that all individuals resulting from the initial generation (gen=0)have a chance to become a parent to the next generation. Beyond theinitial (gen=0) and first generations (genN1) all ensuing parents arechosen via tournament selection coupled with elitism favoring higherperforming or more “fit” individuals, this is described in detail in thenext section. Themore fit the individual the higher the probability of se-lection as a parent for the next generation. In addition, for all subse-quent generations (genN0) crossover and mutation operators are usedas opposed to the even distribution of potential values. However, theparameters affected by these operators are randomly chosen, therebyallowing the same parents to have the potential of multiple varyingoffspring. This ensures the diversity potential of generated offspring(genN0).
3.5. GA operators
3.5.1. SelectionThere are two selectionmethods used in order to identify parents for
successive generations. The first method is reserved solely for applica-tion to the first generation (gen=1)where each individual from the ini-tial population (gen=0) is guaranteed to be used as a parent for thefirstgeneration (gen=1) at least once. A tournament selection method isused for identifying parents for all subsequent generations (genN1). Acommonly used GA selection method is through the use of fitnessproportionate selection where the probability of each individual beingselected is based on their perceived fitness [57]. Individuals with higherrankings are more likely to be selected than those ranked lower and soon. However, this method may lead to early convergence by prematuresuper individuals [58]. To avoid this drawback, a tournament selectionmethod is chosen instead where tournament groups are composed of
Table 4. Available selection of “gene” values defined through the initial population size ofh “gene.” Highlighted values are specific to the provided graphic example.

66 S.-H.E. Lin, D.J. Gerber / Automation in Construction 38 (2014) 59–73
randomly selected individuals within the Parental Pool. All members inthe tournament group are then evaluated where the highest ranked in-dividual is then selected as a parent for the next generation [59]. Thisprocess is repeated until all necessary parents have been identified forthe next generation. In the case of EEPFD the Parental Pool is not onlyconfined to only the members of the most recent generation but alsoincludes all previously selected parents of previous generations. This isto ensure that if no improvement is perceived in the offspring that ahigh performing individual will survive subsequent generations.
3.5.2. CrossoverAs a GA operator, crossover is in reference to the exchange of para-
metric values between parents to breed new combinations of thesevalues in resulting offspring. The user provided crossover ratio providesthe quantity of parameters available for this exchange. For example, adesignated crossover rate of 60% would mean that 60% of the parame-ters would be randomly selected for exchange of values between theparents. This process is illustrated in Fig. 4where the exchanged param-eters can be tracked as G1, G2, G3, G4, G9 and G10.
3.5.3. MutationUnlike the crossover operator, which is limited in selection to the
exact parametric values provided by the parents, the mutation mecha-nism allows for the introduction of new parametric values providedthat they fall within the user provided range of interest. This allowsfor the probability of new gene combinations occurring in later genera-tions and provides a means of increasing the available diversity of theoffspring. The mutation operator is engaged after the crossover processwhere the user provided mutation ratio determines the probability ofthe event of mutation being allowed or not for the offspring of interest.For example, if the mutation ratio is designated as 1% then each
Fig. 4. An example of the resulting exchange of parametric va
offspring has a 1% chance of a mutation event occurring. If a mutationevent is determined to have occurred then the GA will randomly selecta parameter and determine its value based on the originally set range ofinterest, thereby replacing the value that would otherwise have beeninherited from the parents. Optimal settings for both crossover ratiosand mutation ratios require further research and tuning and are sensi-tive and different for each of the scenarios used throughout theresearch.
3.6. Evaluation
Each generated design alternative is evaluated according to the pre-viously defined objective functions. Since the multiple performancecriteria of interest are often in direct or complex andun-obvious compe-tition, the search towards the optimumbecomes amatter of finding thebest compromise through a study of tradeoffs rather than the identifica-tion of a single optimized solution [60]. Therefore, a Pareto rankingmethod is utilized as an evaluation mechanism. In the Pareto rankingmethod, the Pareto-Dominance (pb) concept is used to compare twoindividuals. The superiority of one individual over another is decidedby comparing the two individuals' performance across the multipleobjectives. Below is the definition of the Pareto-Dominance concept asapplied to the previously defined three objective functions of EEPFD:
∀ f∈ sobj; Eobj; Fobjn o
f solution1ð Þ≤ f solution2ð Þ∃ f∈ sobj; Eobj; Fobj
n of solution1ð Þb f solution2ð Þ
⇒solution1 pb solution2:
According to this definition, if solution1 has a higher performance inall three objectives than solution2 (denoted by solution1 pbsolution2),
lues as generated through the GA crossover mechanism.

67S.-H.E. Lin, D.J. Gerber / Automation in Construction 38 (2014) 59–73
then solution1 dominates solution2 in the order of rank. For example, ifindividual A has the objective scores of (94, 160, 65) and individual Bhas the scores (97, 102, 82) then individual Bwould be considered dom-inant, or more “fit,” than individual A andwould be ranked higher sinceindividual B's objective scores are all consideredmore “fit” than individ-ual A's. However, if individual C has the objective scores of (90, 104, 85)and individual D has the scores (98, 153, 90) then individual C and Dwould be considered incomparable or unable to dominate each other.In this example this designation would be made due to individual Dhaving better “fit” scores in SPC and NPV but not having a better “fit”in EUI score than individual C. Since all objective scores are consideredequal in priority, individual C and individual D cannot dominate eachother and sowould be assigned the same rank. In this research the rank-ing of an individual implies the number of individuals within the samepool which are considered dominant to the individual in question.Therefore, the fittest individual in a set of offspring would be assignedthe ranking of 1 with all other offspring following suit.
Ranki ¼ 1þ Num Individualdominatedð Þ
Consequently, higher ranked individuals have a higher probability tobe selected as a parent for the reproduction process. All individualswhodo not dominate each other are therefore assigned the same rankingwith equal probability to be selected as parents for the next generation.The specific Pareto ranking method adopted by this research can befound in Fonseca and Fleming's Pareto ranking method [61].
3.7. Termination criteria
Currently the research provides three means of terminating the GAprocess. The first and second are user defined through either amax iter-ation value being provided or a maximum runtime being reached. Thethird is triggered when the GA reaches three generations that havethe same optimal result i.e. there no longer is a quantifiable improve-ment or difference in subsequent offspring. At this point the GA willdetermine that the design has reached the optimal set of solutions andterminate the process.
3.8. Trade off analysis for design decision support
Currently, the Beagle is able to automatically record and store per-formance data for each design alternative along with 2D and 3D designform visualizations based on user specifications. In addition, a summarytable of all generateddesign alternatives, gene values, objective functionscores, and genealogy is available as an Excel file for review at the com-pletion of a GA run. Although intended to be included in future versionsof the Beagle as part of the automated process, currently a developedcustomized code for MATLAB® [62] is used to generate the tradeoffanalysis. Through the manually implemented code for MATLAB®, afinal Pareto ranking of generated design alternatives and the solutionspace analysis are provided from extracting the necessary data fromthe summary Excel file compiled by the Beagle. As part of this analysis4 data plots are generated: a 3D surface data visualization of all 3 objec-tive scores of each design alternative, 2D graph of NPV vs. EUI, 2D graphof NPV vs. SPC, and 2D graph of EUI vs. SPC. The 3D data visualization iscolor coded according to the overall Pareto ranking of each design alter-native while the 2D data plots are color coded according to Pareto rank-ing of the 2 objectives of interest only. These graphic representationsand ranking information allow users to understand the performanceof the selected option and the compromises of certain performance as-pects of that choice. It is the intention that a future version of H.D.S.Beagle will generate this analysis information and visualizations with-out manual intervention, including combining the 3D illustration ofeach design alternative with the resulting generated objective tradeoffstudy so that both geometry and performance may be evaluated in
parallel. It is also intended that a sensitivity analysis be included aspart of the overall support for early stage design decision making.
4. Validation methodology
A framework being considered as a potential solution forimplementing a GA basedMOOmethod to provide a “designing-in per-formance” environment must not only meet the four previously identi-fied criteria but also do so in a timelymanner in order to be applicable toearly stage design. In addition, it must be versatile enough in nature tobe adaptable to awide range of design problems and geometric palettes.As a result, the purpose of the validation process described here is to de-termine whether EEPFD meets these criteria and can provide resultswith improved performance. To pursue this, a series of varying designscenarios need to be generated. In this paper, a design scenario isdefined as a hypothetical design problem consisting of parametricallydefined characteristics that include but are not limited to space pro-gramming type, driving parameters, driven parameter, project size,and project requirements. For this research these scenarios are com-piled so as to represent a geometric complexity range from a simpleorthogonal box to towers with double curvature and twisting factors.Complexity within program requirements is also accounted for to in-clude scenarios with single use requirements such as an office buildingto mixed-use space requirements including underground parking,retail, hotels, etc. This spectrum is compiled by the authors so as toemulate the types of complexity that real world design problemsmight present as challenges to architects or that might be encounteredin a design studio setting.
A total of 12 scenarios are prepared for testing through the applica-tion of EEPFD for the same hypothetical site located inWest Hollywood,California. Once prepared, the performance of the initial design is usedas the benchmark by which to compare all generated design alterna-tives. This research proceeds to categorize the types of measurementsto be collected into three categories: design problem, process, andproduct. Measurements falling into the design problem category arevalues collected regarding the physical aspects of the design and are fur-ther divided into two subcategories: project complexity and designcomplexity. Project complexity refers to the project size as measuredin square feet and the number of types of program spaces, such asparking, commercial or residential, that are included within the designproblem. Design complexity refers to the amount of surfaces i.e. tessel-lation required to be included in the energymodel alongwith the num-ber of available parameters as provided by the design problem. Processbased measurements are divided into two subcategories: speed anddocumented GA settings. Speed is in reference to themeasured time ex-perienced in running the energy analysis. The GA settings refer to thevalues documented for a series of user adjustable characteristics of theGA including the initial population size, crossover ratio, mutationratio, population size, selection size, and maximum iterations. Productmeasures focus on evaluating the feedback quantity and quality of theresulting solution space. Quantity refers to the number of design itera-tions generated over an 8hour work period for example. Quality is inreference to performance ranges of the resulting solution space asdefined by EUI, NPV, and SPC.
Success in this research is not defined as the reaching of an optimalsolution providing the mathematically defined ideal convergence astypically intended in other MDO applications. This is due to the issueof time constraints usually dominating the stopping point of the earlydesign exploration process and the inherent nature of design decisionmaking being based on trade off and often subjective choice. Consider-ing the issue of time the goal of EEPFD is to provide a design alternativepool with improved performance by which to support informed designdecision making. Therefore, success in this research is defined as theobservation that EEPFD consistently provides a design alternative solu-tion pool with measurable performance improvement within the timeallowed.
68 S.-H.E. Lin, D.J. Gerber / Automation in Construction 38 (2014) 59–73
5. Research findings and validation
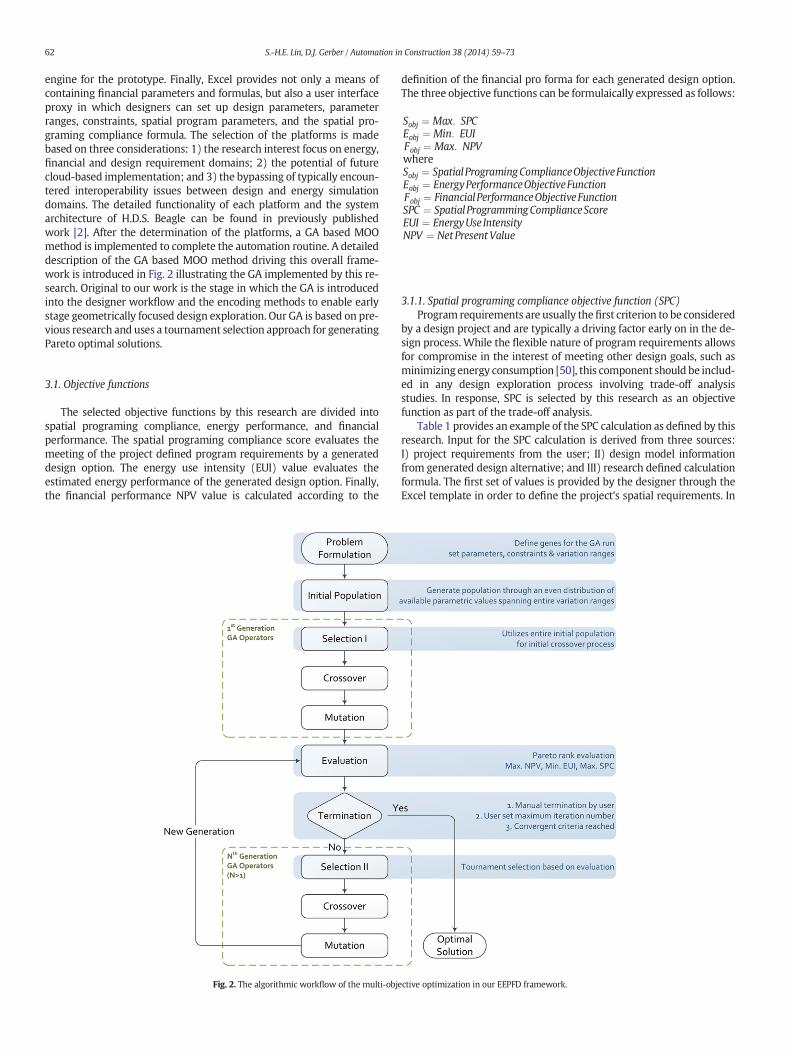
In this section the results of three scenarios from the larger set havebeen presented for in-depth discussion. These three are selected from
Fig. 5. The summary table of the 12 experimental cases providing comparison of design paramesurement of surface tessellation count i.e. geometric complexity and time for automated energy
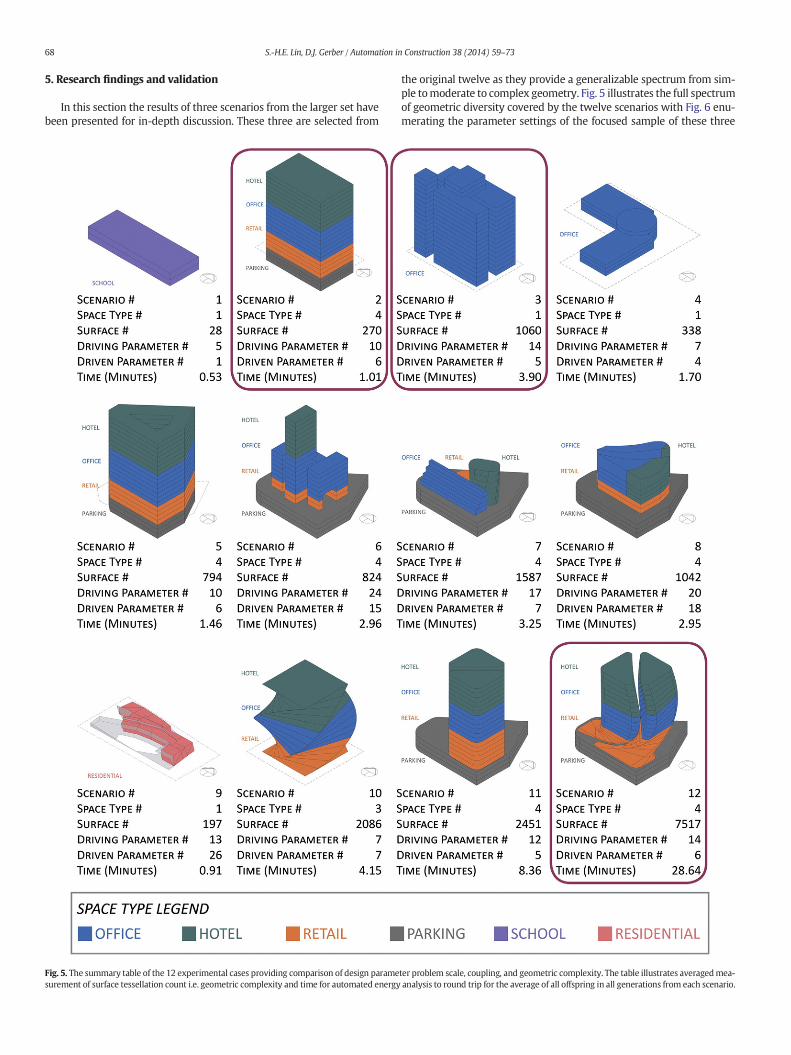
the original twelve as they provide a generalizable spectrum from sim-ple tomoderate to complex geometry. Fig. 5 illustrates the full spectrumof geometric diversity covered by the twelve scenarios with Fig. 6 enu-merating the parameter settings of the focused sample of these three
ter problem scale, coupling, and geometric complexity. The table illustrates averagedmea-analysis to round trip for the average of all offspring in all generations from each scenario.
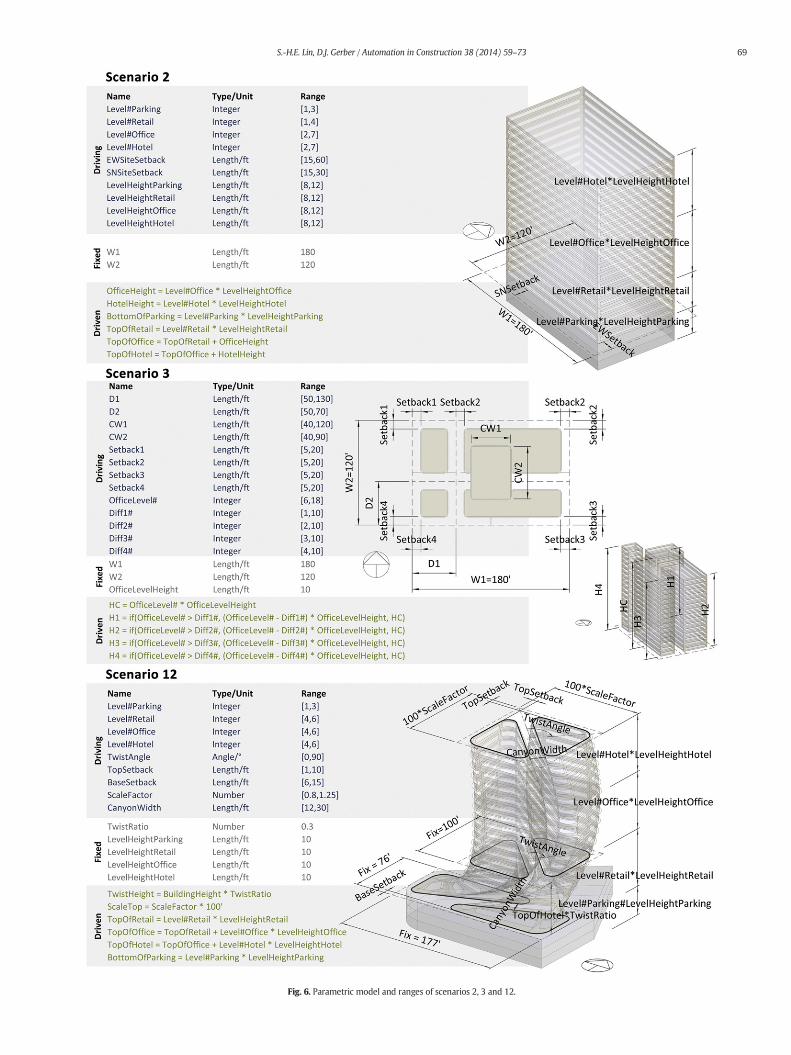
Fig. 6. Parametric model and ranges of scenarios 2, 3 and 12.
69S.-H.E. Lin, D.J. Gerber / Automation in Construction 38 (2014) 59–73
70 S.-H.E. Lin, D.J. Gerber / Automation in Construction 38 (2014) 59–73
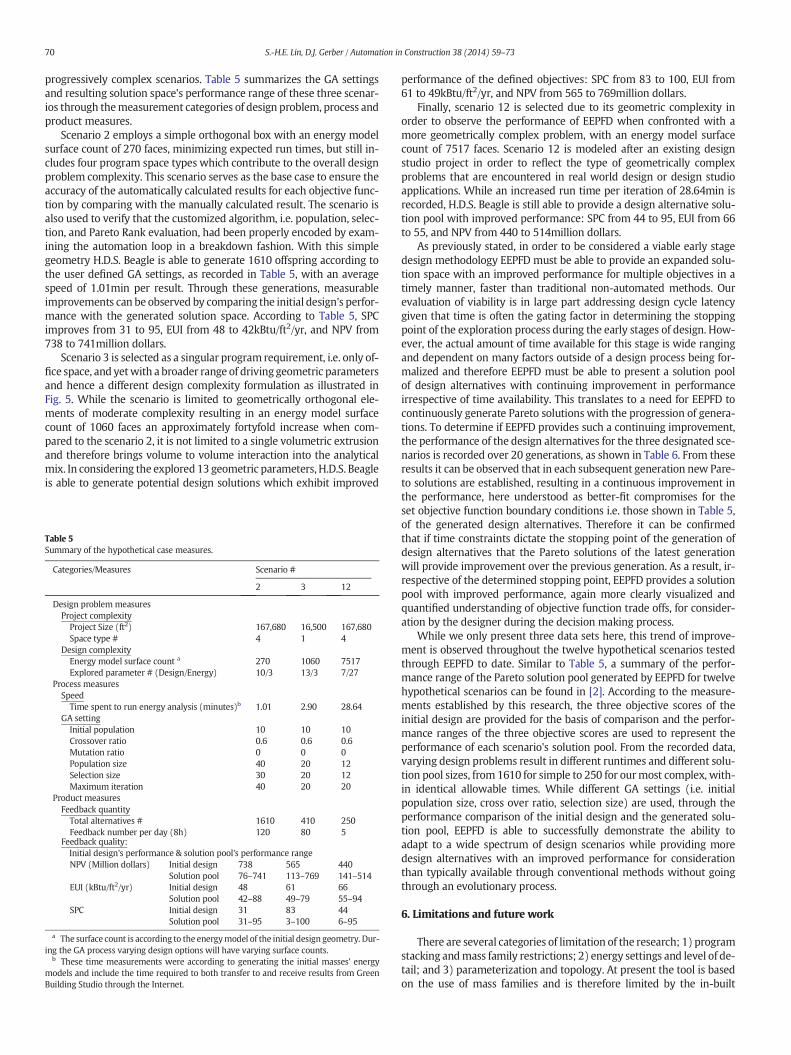
progressively complex scenarios. Table 5 summarizes the GA settingsand resulting solution space's performance range of these three scenar-ios through themeasurement categories of design problem, process andproduct measures.
Scenario 2 employs a simple orthogonal box with an energy modelsurface count of 270 faces, minimizing expected run times, but still in-cludes four program space types which contribute to the overall designproblem complexity. This scenario serves as the base case to ensure theaccuracy of the automatically calculated results for each objective func-tion by comparing with the manually calculated result. The scenario isalso used to verify that the customized algorithm, i.e. population, selec-tion, and Pareto Rank evaluation, had been properly encoded by exam-ining the automation loop in a breakdown fashion. With this simplegeometry H.D.S. Beagle is able to generate 1610 offspring according tothe user defined GA settings, as recorded in Table 5, with an averagespeed of 1.01min per result. Through these generations, measurableimprovements can be observed by comparing the initial design's perfor-mance with the generated solution space. According to Table 5, SPCimproves from 31 to 95, EUI from 48 to 42kBtu/ft2/yr, and NPV from738 to 741million dollars.
Scenario 3 is selected as a singular program requirement, i.e. only of-fice space, and yetwith a broader range of driving geometric parametersand hence a different design complexity formulation as illustrated inFig. 5. While the scenario is limited to geometrically orthogonal ele-ments of moderate complexity resulting in an energy model surfacecount of 1060 faces an approximately fortyfold increase when com-pared to the scenario 2, it is not limited to a single volumetric extrusionand therefore brings volume to volume interaction into the analyticalmix. In considering the explored 13 geometric parameters, H.D.S. Beagleis able to generate potential design solutions which exhibit improved
Table 5Summary of the hypothetical case measures.
Categories/Measures Scenario #
2 3 12
Design problem measuresProject complexity
Project Size (ft2) 167,680 16,500 167,680Space type # 4 1 4
Design complexityEnergy model surface count a 270 1060 7517Explored parameter # (Design/Energy) 10/3 13/3 7/27
Process measuresSpeed
Time spent to run energy analysis (minutes)b 1.01 2.90 28.64GA setting
Initial population 10 10 10Crossover ratio 0.6 0.6 0.6Mutation ratio 0 0 0Population size 40 20 12Selection size 30 20 12Maximum iteration 40 20 20
Product measuresFeedback quantity
Total alternatives # 1610 410 250Feedback number per day (8h) 120 80 5
Feedback quality:Initial design's performance & solution pool's performance rangeNPV (Million dollars) Initial design 738 565 440
Solution pool 76–741 113–769 141–514EUI (kBtu/ft2/yr) Initial design 48 61 66
Solution pool 42–88 49–79 55–94SPC Initial design 31 83 44
Solution pool 31–95 3–100 6–95
a The surface count is according to the energymodel of the initial design geometry. Dur-ing the GA process varying design options will have varying surface counts.
b These time measurements were according to generating the initial masses' energymodels and include the time required to both transfer to and receive results from GreenBuilding Studio through the Internet.
performance of the defined objectives: SPC from 83 to 100, EUI from61 to 49kBtu/ft2/yr, and NPV from 565 to 769million dollars.
Finally, scenario 12 is selected due to its geometric complexity inorder to observe the performance of EEPFD when confronted with amore geometrically complex problem, with an energy model surfacecount of 7517 faces. Scenario 12 is modeled after an existing designstudio project in order to reflect the type of geometrically complexproblems that are encountered in real world design or design studioapplications. While an increased run time per iteration of 28.64min isrecorded, H.D.S. Beagle is still able to provide a design alternative solu-tion pool with improved performance: SPC from 44 to 95, EUI from 66to 55, and NPV from 440 to 514million dollars.
As previously stated, in order to be considered a viable early stagedesign methodology EEPFD must be able to provide an expanded solu-tion space with an improved performance for multiple objectives in atimely manner, faster than traditional non-automated methods. Ourevaluation of viability is in large part addressing design cycle latencygiven that time is often the gating factor in determining the stoppingpoint of the exploration process during the early stages of design. How-ever, the actual amount of time available for this stage is wide rangingand dependent on many factors outside of a design process being for-malized and therefore EEPFD must be able to present a solution poolof design alternatives with continuing improvement in performanceirrespective of time availability. This translates to a need for EEPFD tocontinuously generate Pareto solutions with the progression of genera-tions. To determine if EEPFD provides such a continuing improvement,the performance of the design alternatives for the three designated sce-narios is recorded over 20 generations, as shown in Table 6. From theseresults it can be observed that in each subsequent generation new Pare-to solutions are established, resulting in a continuous improvement inthe performance, here understood as better-fit compromises for theset objective function boundary conditions i.e. those shown in Table 5,of the generated design alternatives. Therefore it can be confirmedthat if time constraints dictate the stopping point of the generation ofdesign alternatives that the Pareto solutions of the latest generationwill provide improvement over the previous generation. As a result, ir-respective of the determined stopping point, EEPFD provides a solutionpool with improved performance, again more clearly visualized andquantified understanding of objective function trade offs, for consider-ation by the designer during the decision making process.
While we only present three data sets here, this trend of improve-ment is observed throughout the twelve hypothetical scenarios testedthrough EEPFD to date. Similar to Table 5, a summary of the perfor-mance range of the Pareto solution pool generated by EEPFD for twelvehypothetical scenarios can be found in [2]. According to the measure-ments established by this research, the three objective scores of theinitial design are provided for the basis of comparison and the perfor-mance ranges of the three objective scores are used to represent theperformance of each scenario's solution pool. From the recorded data,varying design problems result in different runtimes and different solu-tion pool sizes, from 1610 for simple to 250 for ourmost complex, with-in identical allowable times. While different GA settings (i.e. initialpopulation size, cross over ratio, selection size) are used, through theperformance comparison of the initial design and the generated solu-tion pool, EEPFD is able to successfully demonstrate the ability toadapt to a wide spectrum of design scenarios while providing moredesign alternatives with an improved performance for considerationthan typically available through conventional methods without goingthrough an evolutionary process.
6. Limitations and future work
There are several categories of limitation of the research; 1) programstacking andmass family restrictions; 2) energy settings and level of de-tail; and 3) parameterization and topology. At present the tool is basedon the use of mass families and is therefore limited by the in-built
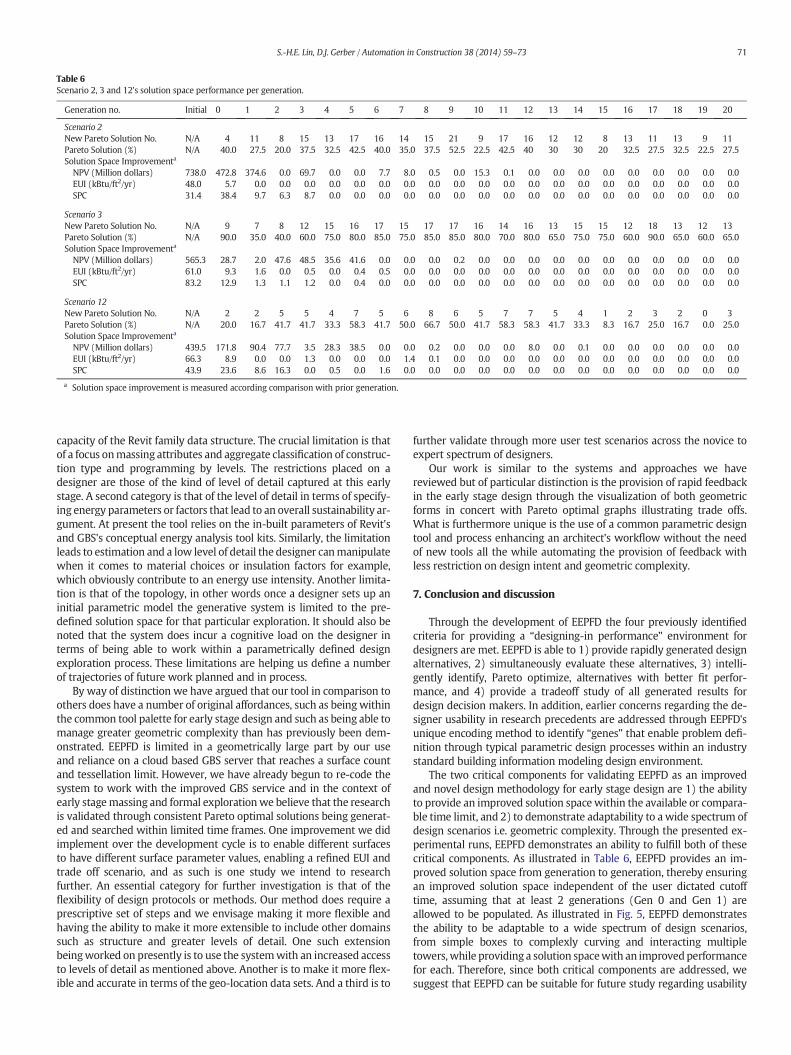
Table 6Scenario 2, 3 and 12's solution space performance per generation.
Generation no. Initial 0 1 2 3 4 5 6 7 8 9 10 11 12 13 14 15 16 17 18 19 20
Scenario 2New Pareto Solution No. N/A 4 11 8 15 13 17 16 14 15 21 9 17 16 12 12 8 13 11 13 9 11Pareto Solution (%) N/A 40.0 27.5 20.0 37.5 32.5 42.5 40.0 35.0 37.5 52.5 22.5 42.5 40 30 30 20 32.5 27.5 32.5 22.5 27.5Solution Space Improvementa
NPV (Million dollars) 738.0 472.8 374.6 0.0 69.7 0.0 0.0 7.7 8.0 0.5 0.0 15.3 0.1 0.0 0.0 0.0 0.0 0.0 0.0 0.0 0.0 0.0EUI (kBtu/ft2/yr) 48.0 5.7 0.0 0.0 0.0 0.0 0.0 0.0 0.0 0.0 0.0 0.0 0.0 0.0 0.0 0.0 0.0 0.0 0.0 0.0 0.0 0.0SPC 31.4 38.4 9.7 6.3 8.7 0.0 0.0 0.0 0.0 0.0 0.0 0.0 0.0 0.0 0.0 0.0 0.0 0.0 0.0 0.0 0.0 0.0
Scenario 3New Pareto Solution No. N/A 9 7 8 12 15 16 17 15 17 17 16 14 16 13 15 15 12 18 13 12 13Pareto Solution (%) N/A 90.0 35.0 40.0 60.0 75.0 80.0 85.0 75.0 85.0 85.0 80.0 70.0 80.0 65.0 75.0 75.0 60.0 90.0 65.0 60.0 65.0Solution Space Improvementa
NPV (Million dollars) 565.3 28.7 2.0 47.6 48.5 35.6 41.6 0.0 0.0 0.0 0.2 0.0 0.0 0.0 0.0 0.0 0.0 0.0 0.0 0.0 0.0 0.0EUI (kBtu/ft2/yr) 61.0 9.3 1.6 0.0 0.5 0.0 0.4 0.5 0.0 0.0 0.0 0.0 0.0 0.0 0.0 0.0 0.0 0.0 0.0 0.0 0.0 0.0SPC 83.2 12.9 1.3 1.1 1.2 0.0 0.4 0.0 0.0 0.0 0.0 0.0 0.0 0.0 0.0 0.0 0.0 0.0 0.0 0.0 0.0 0.0
Scenario 12New Pareto Solution No. N/A 2 2 5 5 4 7 5 6 8 6 5 7 7 5 4 1 2 3 2 0 3Pareto Solution (%) N/A 20.0 16.7 41.7 41.7 33.3 58.3 41.7 50.0 66.7 50.0 41.7 58.3 58.3 41.7 33.3 8.3 16.7 25.0 16.7 0.0 25.0Solution Space Improvementa
NPV (Million dollars) 439.5 171.8 90.4 77.7 3.5 28.3 38.5 0.0 0.0 0.2 0.0 0.0 0.0 8.0 0.0 0.1 0.0 0.0 0.0 0.0 0.0 0.0EUI (kBtu/ft2/yr) 66.3 8.9 0.0 0.0 1.3 0.0 0.0 0.0 1.4 0.1 0.0 0.0 0.0 0.0 0.0 0.0 0.0 0.0 0.0 0.0 0.0 0.0SPC 43.9 23.6 8.6 16.3 0.0 0.5 0.0 1.6 0.0 0.0 0.0 0.0 0.0 0.0 0.0 0.0 0.0 0.0 0.0 0.0 0.0 0.0
a Solution space improvement is measured according comparison with prior generation.
71S.-H.E. Lin, D.J. Gerber / Automation in Construction 38 (2014) 59–73
capacity of the Revit family data structure. The crucial limitation is thatof a focus onmassing attributes and aggregate classification of construc-tion type and programming by levels. The restrictions placed on adesigner are those of the kind of level of detail captured at this earlystage. A second category is that of the level of detail in terms of specify-ing energy parameters or factors that lead to an overall sustainability ar-gument. At present the tool relies on the in-built parameters of Revit'sand GBS's conceptual energy analysis tool kits. Similarly, the limitationleads to estimation and a low level of detail the designer canmanipulatewhen it comes to material choices or insulation factors for example,which obviously contribute to an energy use intensity. Another limita-tion is that of the topology, in other words once a designer sets up aninitial parametric model the generative system is limited to the pre-defined solution space for that particular exploration. It should also benoted that the system does incur a cognitive load on the designer interms of being able to work within a parametrically defined designexploration process. These limitations are helping us define a numberof trajectories of future work planned and in process.
By way of distinction we have argued that our tool in comparison toothers does have a number of original affordances, such as beingwithinthe common tool palette for early stage design and such as being able tomanage greater geometric complexity than has previously been dem-onstrated. EEPFD is limited in a geometrically large part by our useand reliance on a cloud based GBS server that reaches a surface countand tessellation limit. However, we have already begun to re-code thesystem to work with the improved GBS service and in the context ofearly stagemassing and formal explorationwe believe that the researchis validated through consistent Pareto optimal solutions being generat-ed and searched within limited time frames. One improvement we didimplement over the development cycle is to enable different surfacesto have different surface parameter values, enabling a refined EUI andtrade off scenario, and as such is one study we intend to researchfurther. An essential category for further investigation is that of theflexibility of design protocols or methods. Our method does require aprescriptive set of steps and we envisage making it more flexible andhaving the ability to make it more extensible to include other domainssuch as structure and greater levels of detail. One such extensionbeingworked on presently is to use the systemwith an increased accessto levels of detail as mentioned above. Another is to make it more flex-ible and accurate in terms of the geo-location data sets. And a third is to
further validate through more user test scenarios across the novice toexpert spectrum of designers.
Our work is similar to the systems and approaches we havereviewed but of particular distinction is the provision of rapid feedbackin the early stage design through the visualization of both geometricforms in concert with Pareto optimal graphs illustrating trade offs.What is furthermore unique is the use of a common parametric designtool and process enhancing an architect's workflow without the needof new tools all the while automating the provision of feedback withless restriction on design intent and geometric complexity.
7. Conclusion and discussion
Through the development of EEPFD the four previously identifiedcriteria for providing a “designing-in performance” environment fordesigners are met. EEPFD is able to 1) provide rapidly generated designalternatives, 2) simultaneously evaluate these alternatives, 3) intelli-gently identify, Pareto optimize, alternatives with better fit perfor-mance, and 4) provide a tradeoff study of all generated results fordesign decision makers. In addition, earlier concerns regarding the de-signer usability in research precedents are addressed through EEPFD'sunique encoding method to identify “genes” that enable problem defi-nition through typical parametric design processes within an industrystandard building information modeling design environment.
The two critical components for validating EEPFD as an improvedand novel design methodology for early stage design are 1) the abilityto provide an improved solution space within the available or compara-ble time limit, and 2) to demonstrate adaptability to a wide spectrum ofdesign scenarios i.e. geometric complexity. Through the presented ex-perimental runs, EEPFD demonstrates an ability to fulfill both of thesecritical components. As illustrated in Table 6, EEPFD provides an im-proved solution space from generation to generation, thereby ensuringan improved solution space independent of the user dictated cutofftime, assuming that at least 2 generations (Gen 0 and Gen 1) areallowed to be populated. As illustrated in Fig. 5, EEPFD demonstratesthe ability to be adaptable to a wide spectrum of design scenarios,from simple boxes to complexly curving and interacting multipletowers, while providing a solution spacewith an improvedperformancefor each. Therefore, since both critical components are addressed, wesuggest that EEPFD can be suitable for future study regarding usability

72 S.-H.E. Lin, D.J. Gerber / Automation in Construction 38 (2014) 59–73
bydesigners outside of the original research team to understandwheth-er designers can actually incorporate and utilize the generated data anddesign alternatives to support their design decision making during theearly stage of the design process.
Another topic in need of future study is the development of under-standing of user driven GA settings available through EEPFD becausein addition to the geometric variabilitywe also need to empiricallymea-sure our GA settings impact on the Problem, Process, and Product mea-surements. The actual impact of these GA settings on the overallsolution pool has yet to be fully explored and quantified. In addition,the optimal settings to provide the most efficient solution pool haveyet to be identified. Both of these issues are being further researched.However an important conclusion can begin to be drawn and theorizedand that is architectural design problemsmaynot need convergence butrather may need to see trending in the successive generations anotheraspect of the work being further researched. Another possible applica-tion of EEPFD in need of further study stems from observations of thedistinct needs of early stage architectural design versus other industriesor later design phases. When provided with identical design require-ments and energy settings, butwith significantly varying conceptual de-signs, a wide range of resulting performance boundaries is observed.This implies that the potential performance levels of generated designalternatives are significantly determined by the initial design problemi.e. design geometry and their parameterization. While the applicationofMDO to other fieldsmay be for optimizing a single designwith a driv-ing objective such as aerodynamic performance over weight, early con-ceptual architectural design demands more complex combinations ofobjective functions in conjunctionwith design idiosyncrasy, subjectivityand diversity. Therefore, the ability of EEPFD to rapidly determine theperformance potential of multiple competing conceptual designs forthe same design requirements may be more applicable than pursuinga single optimized solution space. However, the full impact of thisobservation for EEPFD is being further explored and researched inorder to propose and validate the best practice of MDO in early stagearchitectural design.
Acknowledgments
The authors thank theUSCDean of Architecture QingyunMa and thejunior faculty research grant program; Ms. Bei “Penny” Pan our initiallead software developer; Junwen Chen, Ke Lu, Shitian Shen, andYunshan Zhu for their continued software development; and AutodeskInc. who in part made the research possible by their generous supportwithin the IDEA Studio program.
References
[1] U. Bogenstätter, Prediction and optimization of life-cycle costs in early design, Build.Res. Inf. 28 (5–6) (2000) 376–386.
[2] D.J. Gerber, S.-H.E. Lin, Designing in complexity: simulation, integration, andmultidisci-plinary design optimization for architecture, Simulation (2013), http://dx.doi.org/10.1177/0037549713482027(Published online before print April 9, 2013).
[3] B. Kolarevic, A.M. Malkawi, Performative Architecture: Beyond Instrumentality,Spon Press, New York, 2005.
[4] D.B. Crawley, J.W. Hand, M. Kummert, B.T. Griffith, Contrasting the capabilities ofbuilding energy performance simulation programs, Build. Environ. 43 (4) (2008)661–673.
[5] A.M. Malkawi, Developments in environmental performance simulation, Autom.Constr. 13 (4) (2004) 437–445.
[6] R. Oxman, Performance-based design: current practices and research issues, Int.J. Archit. Comput. 6 (1) (2008) 1–17.
[7] G. Augenbroe, Trends in building simulation, Build. Environ. 37 (8–9) (2002) 891–902.[8] S. Attia, L. Beltrán, A. De Herde, J. Hensen, “Architect Friendly”: a Comparison Of ten
Different Building Performance Simulation Tools, Building Simulation 2009, 27–30July 2009, Glasgow, Scotland, 2009. 204–211.
[9] S. Attia, J.L.M. Hensen, L. Beltrán, A. De Herde, Selection criteria for building perfor-mance simulation tools: contrasting architects' and engineers' needs, J. Build.Perform. Simul. 5 (3) (2012) 155–169.
[10] B. Welle, J. Haymaker, Z. Rogers, ThermalOpt: a methodology for automatedBIM-based multidisciplinary thermal simulation for use in optimization environ-ments, Build. Simul. 4 (4) (2011) 293–313.
[11] A.D. Radford, J.S. Gero, Tradeoff diagrams for the integrated design of the physicalenvironment in buildings, Build. Environ. 15 (1) (1980) 3–15.
[12] D.E. Grierson, Pareto multi-criteria decision making, Adv. Eng. Inform. 22 (3) (2008)371–384.
[13] H.A. Simon, The structure of ill structured problems, Artif. Intell. 4 (3–4) (1973)181–201.
[14] S. Attia, E. Gratia, A. De Herde, J.L.M. Hensen, Simulation-based decision support toolfor early stages of zero-energy building design, Energy Build. 49 (2012) 2–15.
[15] C. Eastman, J.-M. Lee, Y.-S. Jeong, J.-K. Lee, Automatic rule-based checking of buildingdesigns, Autom. Constr. 18 (8) (2009) 1011–1033.
[16] G. Augenbroe, P. deWilde, H.J. Moon, A. Malkawi, An interoperability workbench fordesign analysis integration, Energy Build. 36 (8) (2004) 737–748.
[17] J. Plume, J.Mitchell, Collaborative design using a shared IFC buildingmodel— learningfrom experience, Autom. Constr. 16 (1) (2007) 28–36.
[18] G. Augenbroe, Integrated building performance evaluation in the early designstages, Build. Environ. 27 (2) (1992) 149–161.
[19] Y.E. Kalay, P3: computational environment to support design collaboration, Autom.Constr. 8 (1) (1998) 37–48.
[20] K. Papamichael, J. LaPorta, H. Chauvet, Building design advisor: automated integra-tion of multiple simulation tools, Autom. Constr. 6 (4) (1997) 341–352.
[21] D. Holzer, Optioneering in collaborative design practice, Int. J. Archit. Comput. 8 (2)(2010) 165–182.
[22] B. Toth, F. Salim, J. Burry, J.H. Frazer, R. Drogemuller, M. Burry, Energy-oriented de-sign tools for collaboration in the cloud, Int. J. Archit. Comput. 9 (4) (2011) 339–360.
[23] M.M. Mourshed, D. Kelliher, M. Keane, ArDOT: a Tool to Optimise EnvironmentalDesign of Buildings, Building Simulation 2003, August 11–14, 2003, Eindhoven,Netherlands, 2003. 919–926.
[24] S. Attia, A tool for design decision making: zero energy residential buildings in hothumid climates, Architecture et climat, Université catholique de Louvain, Universitécatholique de Louvain, 2012.
[25] C.J. Hopfe, J.L.M. Hensen, Uncertainty analysis in building performance simulationfor design support, Energy Build. 43 (10) (2011) 2798–2805.
[26] C. Struck, P.J.C.J. de Wilde, C.J. Hopfe, J.L.M. Hensen, An investigation of the optionspace in conceptual building design for advanced building simulation, Adv. Eng. In-form. 23 (4) (2009) 386–395.
[27] L.G. Caldas, L.K. Norford, A design optimization tool based on a genetic algorithm,Autom. Constr. 11 (2) (2002) 173–184.
[28] L.G. Caldas, Generation of energy-efficient architecture solutions applyingGENE_ARCH:an evolution-based generative design system, Adv. Eng. Inform. 22 (1) (2008) 59–70.
[29] P.H.T. Janssen, An Evolutionary System for Design Exploration, Joining Languages,Cultures and Visions: CAADFutures 2009, 17–19 June 2009, Les Presses del'Université de Montréal, Montréal, 2009. 259–272.
[30] F. Flager, B. Welle, P. Bansal, G. Soremekun, J. Haymaker, Multidisciplinary processintegration and design optimization of a classroom building, Inf. Technol. Constr.14 (38) (2009) 595–612.
[31] Y.K. Yi, A.M. Malkawi, Optimizing building form for energy performance based onhierarchical geometry relation, Autom. Constr. 18 (6) (2009) 825–833.
[32] Y.K. Yi, A.M. Malkawi, Site-specific optimal energy form generation based on hierar-chical geometry relation, Autom. Constr. 26 (2012) 77–91.
[33] E. Asadi, M.G. da Silva, C.H. Antunes, L. Dias, Multi-objective optimization for build-ing retrofit strategies: a model and an application, Energy Build. 44 (2012) 81–87.
[34] D. Tuhus-Dubrow,M. Krarti, Genetic-algorithm based approach to optimize buildingenvelope design for residential buildings, Build. Environ. 45 (7) (2010) 1574–1581.
[35] AIAA, Current State of the Art on Multidisciplinary Design Optimization (MDO),American Institute of Aeronautics and Astronautics, Washington D.C., USA, 1991.
[36] In: N.M. Alexandrov, M.Y. Hussaini (Eds.), Multidisciplinary Design Optimization:State of the Art, Society for Industrial and Applied Mathematics, 1997.
[37] J. Pantelic, B. Raphael, K.W. Tham, A preference driven multi-criteria optimizationtool for HVAC design and operation, Energy Build. 55 (2012) 118–126.
[38] M. Hamdy, A. Hasan, K. Siren, Applying a multi-objective optimization approachfor design of low-emission cost-effective dwellings, Build. Environ. 46 (1) (2011)109–123.
[39] L. Magnier, F. Haghighat, Multiobjective optimization of building design usingTRNSYS simulations, genetic algorithm, and artificial neural network, Build. Environ.45 (3) (2010) 739–746.
[40] J.A. Wright, H.A. Loosemore, R. Farmani, Optimization of building thermal designand control by multi-criterion genetic algorithm, Energy Build. 34 (9) (2002)959–972.
[41] M. Fesanghary, S. Asadi, Z.W. Geem, Design of low-emission and energy-efficientresidential buildings using a multi-objective optimization algorithm, Build. Environ.49 (2012) 245–250.
[42] A. Omidfar, Design Optimization of a Contemporary High Performance ShadingScreen-Integration of ‘Form’ and Simulation Tools, Building Simulation 2011,IBPSA Australasia and AIRAH, Sydney, Australia, 2011. 1779–1787.
[43] K. Suga, S. Kato, K. Hiyama, Structural analysis of Pareto-optimal solution sets formulti-objective optimization: an application to outer window design problemsusing multiple objective genetic algorithms, Build. Environ. 45 (5) (2010)1144–1152.
[44] E. Asadi, M.G. da Silva, C.H. Antunes, L. Dias, A multi-objective optimization modelfor building retrofit strategies using TRNSYS simulations, GenOpt and MATLAB,Build. Environ. 56 (2012) 370–378.
[45] K. Mela, T. Tiainen, M. Heinisuo, Comparative study of multiple criteria decisionmaking methods for building design, Adv. Eng. Inform. 26 (4) (2012) 716–726.
[46] S. Attia, M. Hamdy, W. O'Brien, S. Carlucci, Assessing gaps and needs for integratingbuilding performance optimization tools in net zero energy buildings design, EnergyBuild. 60 (2013) 110–124.

73S.-H.E. Lin, D.J. Gerber / Automation in Construction 38 (2014) 59–73
[47] P. Janssen, C. Basol, K.W. Chen, Evolutionary developmental design for non-programmers, 29th eCAADe Conference: Respecting Fragile Places, 21–24 September2011, University of Ljubljana, Faculty of Architecture (Slovenia), 2011, pp. 245–252.
[48] L. Caldas, Generation of energy-efficient patio houses: combining GENE_ARCH and aMarrakesh Medina shape grammar, 2011 AAAI Spring Symposium Series: ArtificialIntelligence and Sustainable Design, 21–23 March 2011, Palo Alto, CA, USA, 2011.
[49] L.G. Caldas, Three-dimensional shape generation of low-energy architectural solu-tions using Pareto genetic algorithms, 23th eCAADe Conference: Digital Design:the quest for new paradigms, 21–24 September 2005, Lisbon, Portugal, 2005,pp. 647–654.
[50] L.G. Caldas, GENE_ARCH: an evolution-based generative design system for sustain-able architecture, in: I. Smith (Ed.), Intelligent Computing in Engineering and Archi-tecture, vol. 4200, Springer Berlin/Heidelberg, 2006, pp. 109–118.
[51] P. Janssen, J. Frazer, M.-X. Tang, A framework for generating and evolving buildingdesigns, Int. J. Archit. Comput. 3 (4) (2005) 449–470.
[52] D.J. Gerber, S.-H.E. Lin, Designing-in Performance Through Parameterization, Auto-mation, and Evolutionary Algorithms: ‘H.D.S. BEAGLE 1.0’, CAADRIA 2012: BeyondCodes and Pixels, 25–28 April 2012, Chennai, India, 2012. 141–150.
[53] D.J. Gerber, S.-H.E. Lin, B.P. Pan, A.S. Solmaz, Design Optioneering: Multi-DisciplinaryDesign Optimization Through Parameterization, Domain Integration and Automa-tion of a Genetic Algorithm, SimAUD 2012, 26–30 March 2012, Orlando, FL, USA,2012. 23–30.
[54] Autodesk, Autodesk Revit, http://www.autodesk.com/products/autodesk-revit-family/overview2013(Accessed on 6 April).
[55] Autodesk, Autodesk Green Building Studio: Web-Based Energy Analysis Software,http://usa.autodesk.com/green-building-studio/2013(Accessed on 6 April).
[56] Microsoft, Excel — Analyze, http://office.microsoft.com/en-us/excel/2013(Accessedon 6 April).
[57] J.E. Baker, Reducing Bias and Inefficiency in the Selection Algorithm, the SecondInternational Conference on Genetic Algorithms on Genetic Algorithms and TheirApplication, 28–31 July 1987, L. Erlbaum Associates Inc., Cambridge, Massachusetts,United States, 1987, pp. 14–21.
[58] G. Rudolph, Convergence analysis of canonical genetic algorithms, IEEE Trans. Neu-ral Netw. 5 (1) (1994) 96–101.
[59] B.L. Miller, D.E. Goldberg, Genetic algorithms, tournament selection, and the effectsof noise, Complex Syst. 9 (1995) 193–212.
[60] C.A. Coello Coello, G.B. Lamont, D.A. Van Veldhuisen, Evolutionary Algorithms forSolving Multi-Objective Problems, 2nd ed. Springer, New York, 2007.
[61] C.M. Fonseca, P.J. Fleming, Genetic algorithms for multiobjective optimization:formulation, discussion and generalization, The Fifth International Conference onGenetic Algorithms, 17–21 July 1993, Morgan Kaufmann, San Mateo, CA, USA,1993, pp. 416–423.
[62] The MathWorks, MATLAB: The Language of Technical Computing, http://www.mathworks.com/products/matlab/2013(Accessed on 3 May 2013).