a multimodal toolkit for thermal performance feedback in conceptual design modelling
TRANSCRIPT
A multimodal toolkit for thermal performance feedback in conceptual design modelling
Mani Williams1, Jane Burry2, Flora Salim3, Stig Anton Nielsen4, Alexander Peña de Leon5, Kamil Sharaidin6, and Mark Burry7 1,2,3,5,6,7Spatial Information Architecture Laboratory, RMIT University, Australia,4Department of Architecture, Chalmers University of Technology, Sweden 1,2,5,6, http://www.sial.rmit.edu.au, 3http://florasalim.com, 5http://penadeleon.com, 7http://mcburry.net/ [email protected], [email protected], [email protected], [email protected], [email protected], [email protected], [email protected]
Abstract. This paper presents a multimodal toolkit for rapid performance-driven façade design that includes both virtual and physical performance feedback. The toolkit has been user tested in the SmartGeometry 2013 event by the Thermal Reticulations workshop cluster. Although the workshop participants were predominately digital design focused, the authors observed several distinct approaches to the tool selection and workflow involving both physical and virtual simulations, with a favoring to tools that produce fast visual outcomes. The approaches to tool selection are presented here as case studies with their workflow mapped for discussion. We conclude that access to a diverse range of simulation tools for design evaluation is advantageous to the creativity of the design process. Keywords. Tools development, design process, performance-based design, simulation, sensors.
Introduction The ubiquity of computing and digital technologies has seen the progression of the ways they are used for design, from being a mere drafting aid to something closer to the analogy of a Swiss-army knife tool for generating, prototyping, inspecting, and evaluating design ideas in digital and/or physical representations. Designers such as ShoP Architects now model every detail of the design in a virtual environment in order to extract building information, optimize and simulate building performance. Designing for volatile environments poses some uncertainties, which can potentially widen the margin of error in the performance predictions for buildings in design. Designers increasingly seek to understand the performance of their design through garnering feedback from physical prototyping and analogue simulation of the complex physical environment (Moya et al., 2013). Sensors are tools for designers to digitally infiltrate the physical space. When used in physical simulation, sensors quantify environmental information of the design context and its performance. We propose to extend the current digital design workflow to include physical simulation into a multimodal performance feedback toolkit. The aim is to combine virtual and physical simulations to give designers a more comprehensive understanding of their design’s performance. It is a positive contribution to the design development workflow.
Thermal Reticulations (TR) is a research project that aims to develop tools and platforms to assist designers to better understand the thermal performance of façade design directions in early design. Precedence exists of thermal testing setups in larger scale and of longer simulation durations (Melcher and Karmazínová, 2012); the
novelty of the TR project is our focus on rapid performance feedback from the combination of virtual and physical simulations.
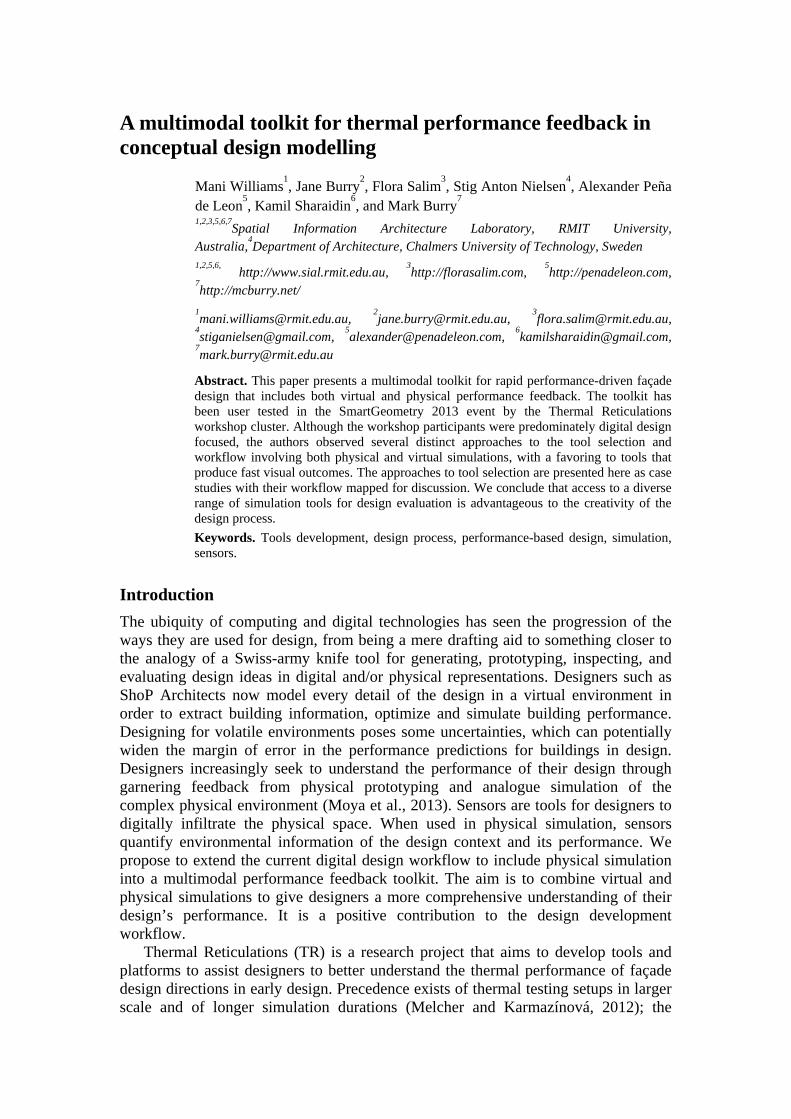
Here we assembled a system of workflow (Figure 1) to model and simulate heat transfer across and through façades. This system is a combination of virtual analyses using open access software as well as physical testing and comparison of prototypes for understanding thermal behaviors of the façades. Feedback included real time visualization, interpreted visualization and collection of numerical data. TR was one of the workshop clusters in the SmartGeometry 2013 event (SG2013). Designers from academia and industry participated in the four day intensive hands-on workshop to explore thermal performance in façade design. The toolkit enabled the designers to produce multiple design iterations and conduct thermal simulations using multiple approaches.
We observed several distinct approaches to the tool selection. For example there were designers that began with digital modeling and virtual simulation and then progressed to physical prototyping and verification, whereas others approached the process in reverse by conducting physical prototyping and simulation first. In this paper we will present a selection of these approaches and analyze designers’ selection criteria for their choices of tool from the provided toolkit. The opportunities and limitations of the tools are also discussed. We conclude that access to a diverse range of simulation tools for design evaluation is advantageous to the creativity of the design process.
Figure 1 A diagram of available tools within the toolkit and possible workflow paths
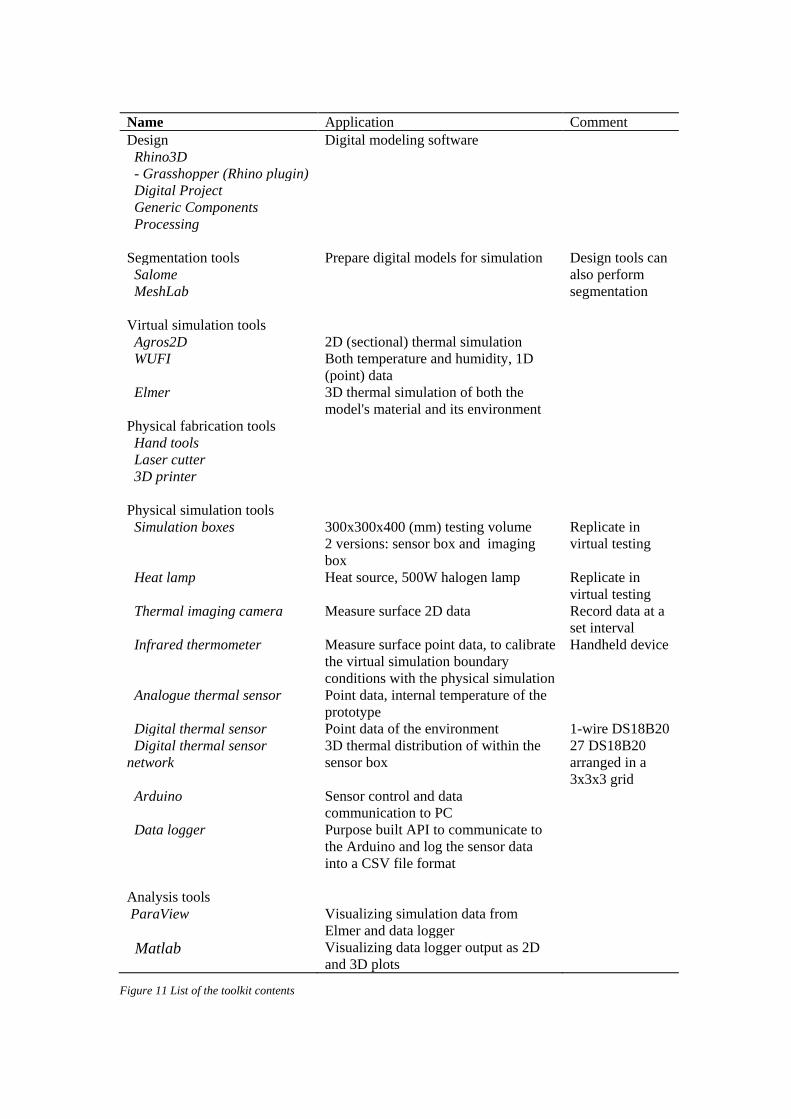
Toolkit content To support a comprehensive understanding of the thermal performance of a prototype, the TR toolkit contained a selection of tools ranging from digital simulation software,
physical sensory devices, to support tools such as data analysis and design-fabrication packages. (Figure 11)
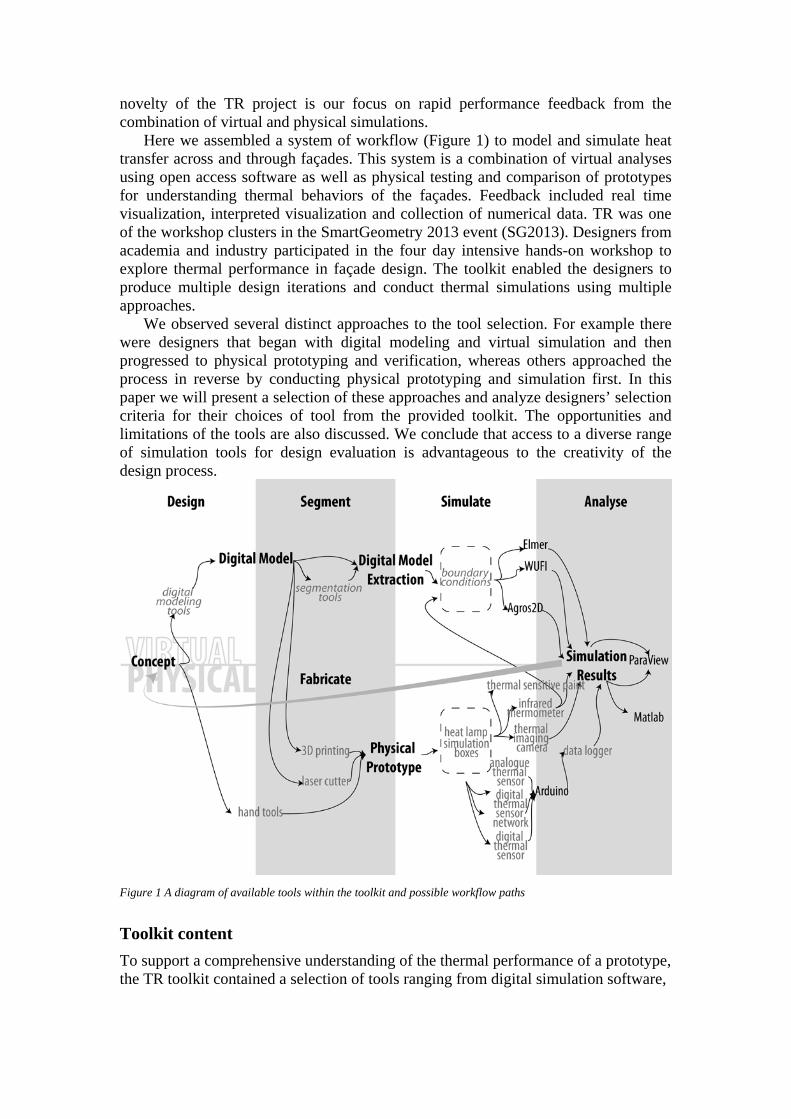
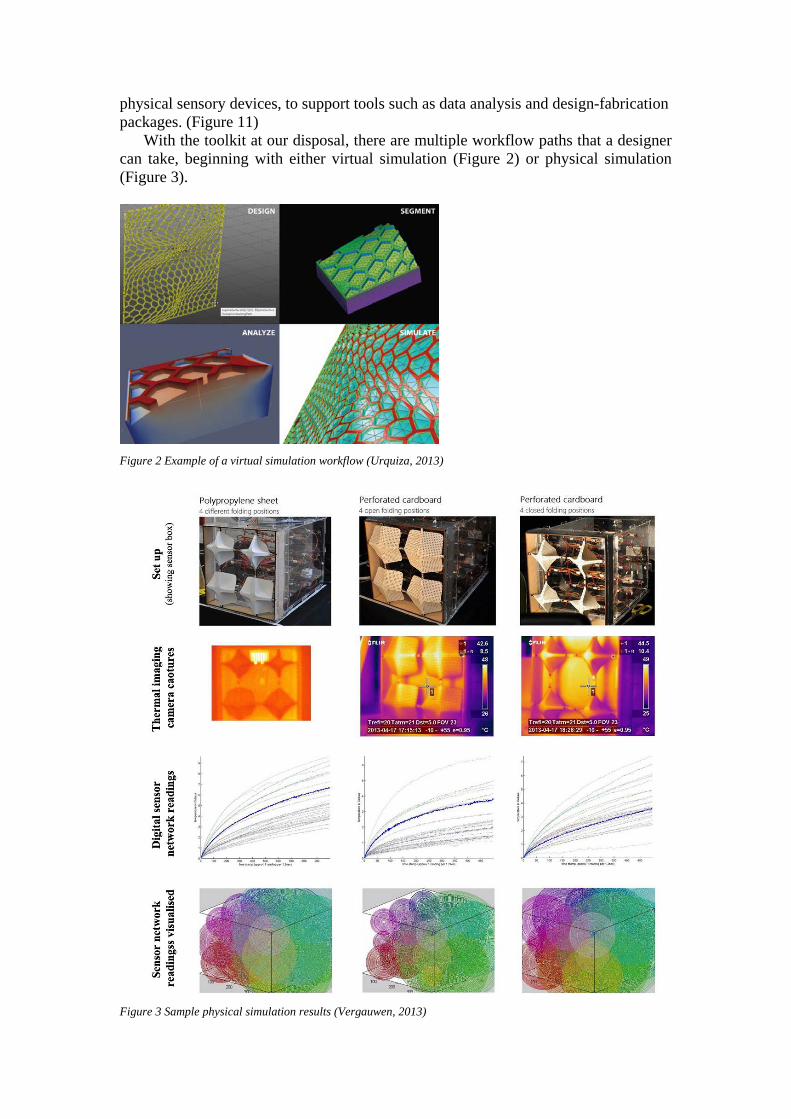
With the toolkit at our disposal, there are multiple workflow paths that a designer can take, beginning with either virtual simulation (Figure 2) or physical simulation (Figure 3).
Figure 2 Example of a virtual simulation workflow (Urquiza, 2013)
Figure 3 Sample physical simulation results (Vergauwen, 2013)
In the next section we present several case studies from the recent SG2013 workshop to demonstrate the TR toolkit in action.
Background SmartGeometry is an annual week-long event, including a four-day workshop and two-day symposium [1] . TR was selected as one of the ten workshop clusters, delivered by the authors to a group of thirteen participants (to be referred as “users” in this paper). The toolkit was developed by the authors to be used during the workshop.
Prior to the workshop, the users received instructions for the toolkit including how to access its virtual simulation components. The users were also encouraged to prepare a model to be brought to the workshop. A short demonstration of the toolkit components was provided at the beginning of the workshop. The users were able to select the simulation workflow to suit their individual design intent. The outcomes of the four-day workshop were presented to the SG2013 attendees during the SG2013 Symposium event both as an exhibition as well as a verbal presentation. A selection of the façade designs is presented in Figure 10.
The case study workflows were deduced from users' design documentations and authors' direct observations.
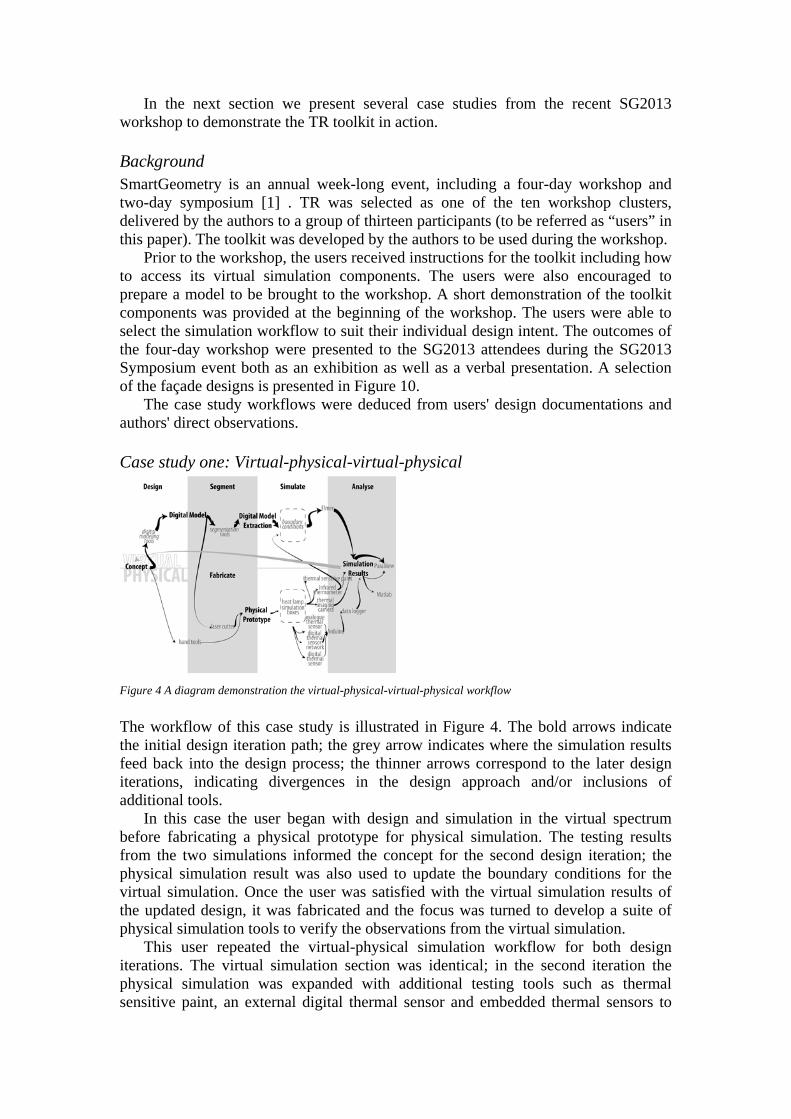
Case study one: Virtual-physical-virtual-physical
Figure 4 A diagram demonstration the virtual-physical-virtual-physical workflow
The workflow of this case study is illustrated in Figure 4. The bold arrows indicate the initial design iteration path; the grey arrow indicates where the simulation results feed back into the design process; the thinner arrows correspond to the later design iterations, indicating divergences in the design approach and/or inclusions of additional tools.
In this case the user began with design and simulation in the virtual spectrum before fabricating a physical prototype for physical simulation. The testing results from the two simulations informed the concept for the second design iteration; the physical simulation result was also used to update the boundary conditions for the virtual simulation. Once the user was satisfied with the virtual simulation results of the updated design, it was fabricated and the focus was turned to develop a suite of physical simulation tools to verify the observations from the virtual simulation.
This user repeated the virtual-physical simulation workflow for both design iterations. The virtual simulation section was identical; in the second iteration the physical simulation was expanded with additional testing tools such as thermal sensitive paint, an external digital thermal sensor and embedded thermal sensors to
collect data on different aspects of the design and to compare it with the virtual simulation results. We suspect the set-up requirement of the individual tools influenced the tool selection decisions. With virtual simulation, each software simulator is produced by a different developer so the input parameters are not fully compatible. In the case of physical simulation the authors designed the simulation set up with compatibility as an important design feature, for example the two simulation boxes have the identical façade fixture specifications.
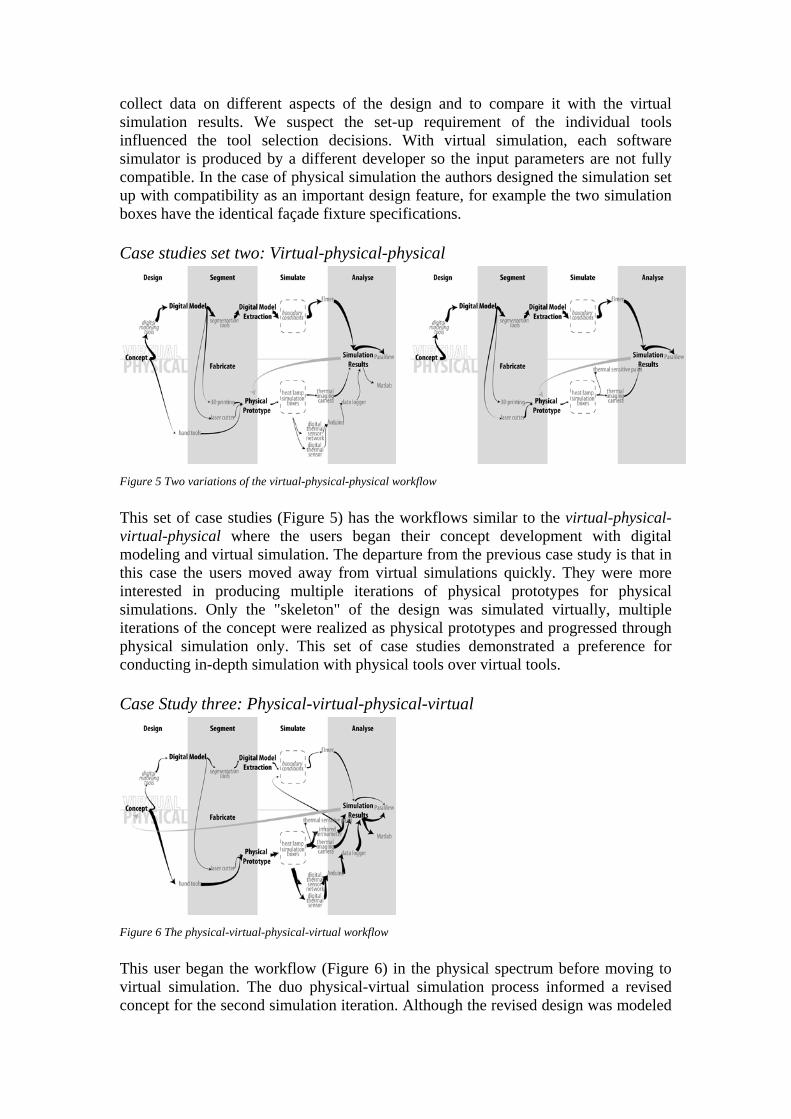
Case studies set two: Virtual-physical-physical
Figure 5 Two variations of the virtual-physical-physical workflow
This set of case studies (Figure 5) has the workflows similar to the virtual-physical-virtual-physical where the users began their concept development with digital modeling and virtual simulation. The departure from the previous case study is that in this case the users moved away from virtual simulations quickly. They were more interested in producing multiple iterations of physical prototypes for physical simulations. Only the "skeleton" of the design was simulated virtually, multiple iterations of the concept were realized as physical prototypes and progressed through physical simulation only. This set of case studies demonstrated a preference for conducting in-depth simulation with physical tools over virtual tools.
Case Study three: Physical-virtual-physical-virtual
Figure 6 The physical-virtual-physical-virtual workflow
This user began the workflow (Figure 6) in the physical spectrum before moving to virtual simulation. The duo physical-virtual simulation process informed a revised concept for the second simulation iteration. Although the revised design was modeled
with digital tools, the user still followed the physical-virtual workflow from the first iteration, with the addition of thermal sensitive paint into the physical testing toolset. This case is the reversal of the first case study virtual-physical-virtual-physical, and similar to the first case, this user preferred to experiment with physical simulation workflow and kept the virtual simulation workflow identical.
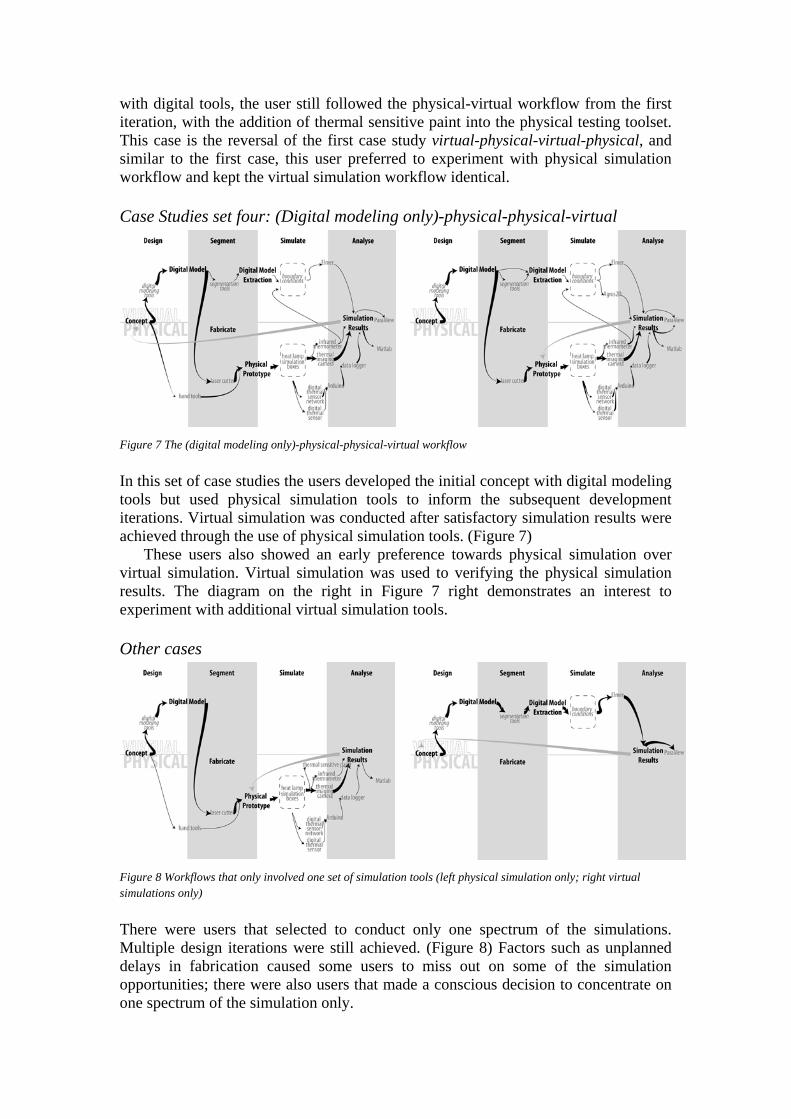
Case Studies set four: (Digital modeling only)-physical-physical-virtual
Figure 7 The (digital modeling only)-physical-physical-virtual workflow
In this set of case studies the users developed the initial concept with digital modeling tools but used physical simulation tools to inform the subsequent development iterations. Virtual simulation was conducted after satisfactory simulation results were achieved through the use of physical simulation tools. (Figure 7)
These users also showed an early preference towards physical simulation over virtual simulation. Virtual simulation was used to verifying the physical simulation results. The diagram on the right in Figure 7 right demonstrates an interest to experiment with additional virtual simulation tools.
Other cases
Figure 8 Workflows that only involved one set of simulation tools (left physical simulation only; right virtual simulations only)
There were users that selected to conduct only one spectrum of the simulations. Multiple design iterations were still achieved. (Figure 8) Factors such as unplanned delays in fabrication caused some users to miss out on some of the simulation opportunities; there were also users that made a conscious decision to concentrate on one spectrum of the simulation only.
Analysis From the presented case studies, it is clear that the workflow undertaken by the users of the toolbox varies. In the SG2013 setting, the users were highly encouraged to use a wide range of the tools in the toolkit. Considering the focus of SmartGeometry on computer aided design (Peters and Peters, 2013), it is not surprising that many users began their workflow with the digital modeling tools. Although the recommended virtual simulation workflow was presented before the physical simulation tools and workflow, this did not deter users from selecting physical simulation workflow for their initial design simulation. The intensive mode meant that tools that produce quick visual results were favored, for example the selection of thermal imaging camera over the digital sensor network. Users were also interested in the time variant of the simulation. Videos of the time-lapse of the thermal imaging captures and animated sensor network results were well received.
Many of the tools in the toolkit were new to the users, especially the selection of virtual simulation tools. Simulation set-up was an influential factor of tool selection; some users expressed frustration with the strict input requirements of some of the virtual simulation tools. Difficulties such as a model's failure to mesh (required for the simulation software Elmer) meant that some of the digital models had to be simplified or remodeled before being put through the simulation workflow. In comparison, users with prior fabrication experience could make physical prototypes close to their original intent. The two simulation boxes had the identical prototype fixture specifications and were designed such that the prototypes could be smoothly installed and removed. The testing equipments were also relatively easy to apply. A prototype could quickly switch between different physical simulation set-ups. This ease of use meant that we observed a more varied physical simulation workflow path when inspecting the workflow patterns.
A question raised during the development of the TR workshop was how to compare the simulation results between physical and virtual simulation workflows. The rigorous interpretation of the numerical data from both virtual and physical processes would require time and appropriate statistical analysis, which was not available during the workshop. The physical simulation tools are sensitive to the uncontrolled room conditions, unlike virtual simulations where a constant boundary condition can be set. Small changes in starting conditions could affect the fluctuations of the logged sensor data. Therefore, it is likely that the actual figures will need to be manipulated to provide direct comparison between the tests of different façades with any veracity. This also means that the physical simulation workflow can illuminate the performance issues caused by the combined effect of multiple design and environmental parameters. The virtual simulation tools are deterministic and reproducible, but to receive results that are appropriate for quick design decision-making, compromises have to be made in terms of model and environment complexity.
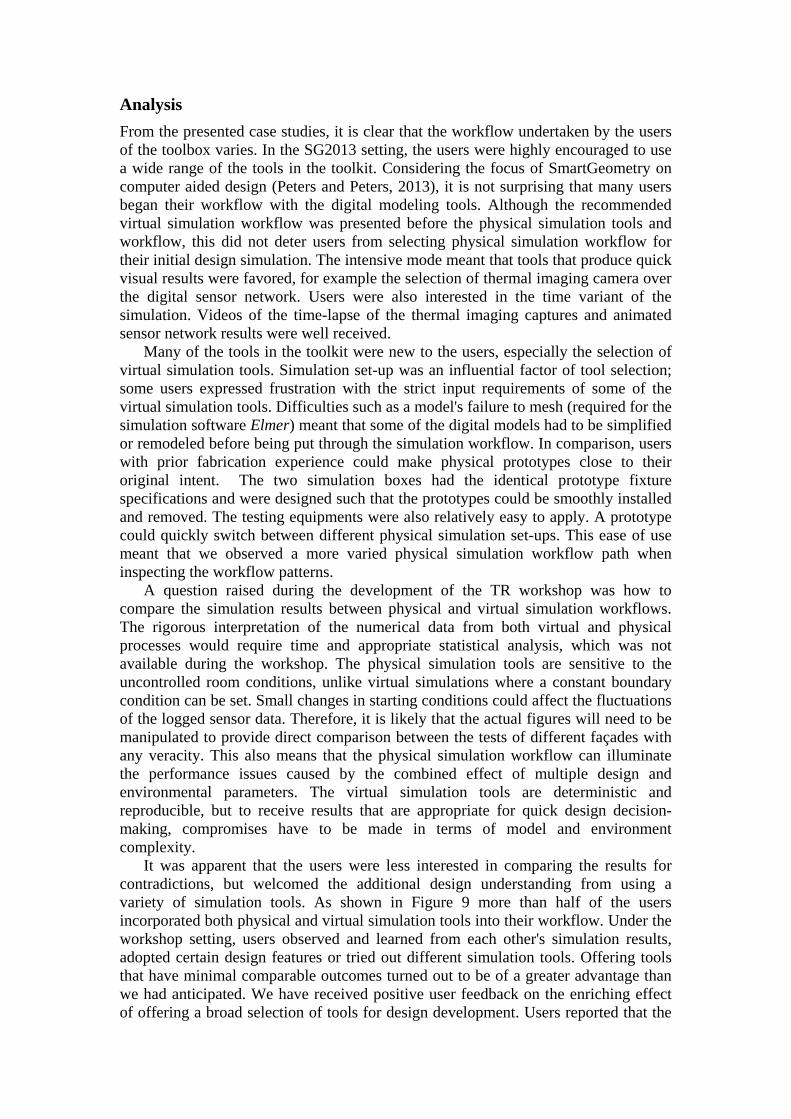
It was apparent that the users were less interested in comparing the results for contradictions, but welcomed the additional design understanding from using a variety of simulation tools. As shown in Figure 9 more than half of the users incorporated both physical and virtual simulation tools into their workflow. Under the workshop setting, users observed and learned from each other's simulation results, adopted certain design features or tried out different simulation tools. Offering tools that have minimal comparable outcomes turned out to be of a greater advantage than we had anticipated. We have received positive user feedback on the enriching effect of offering a broad selection of tools for design development. Users reported that the
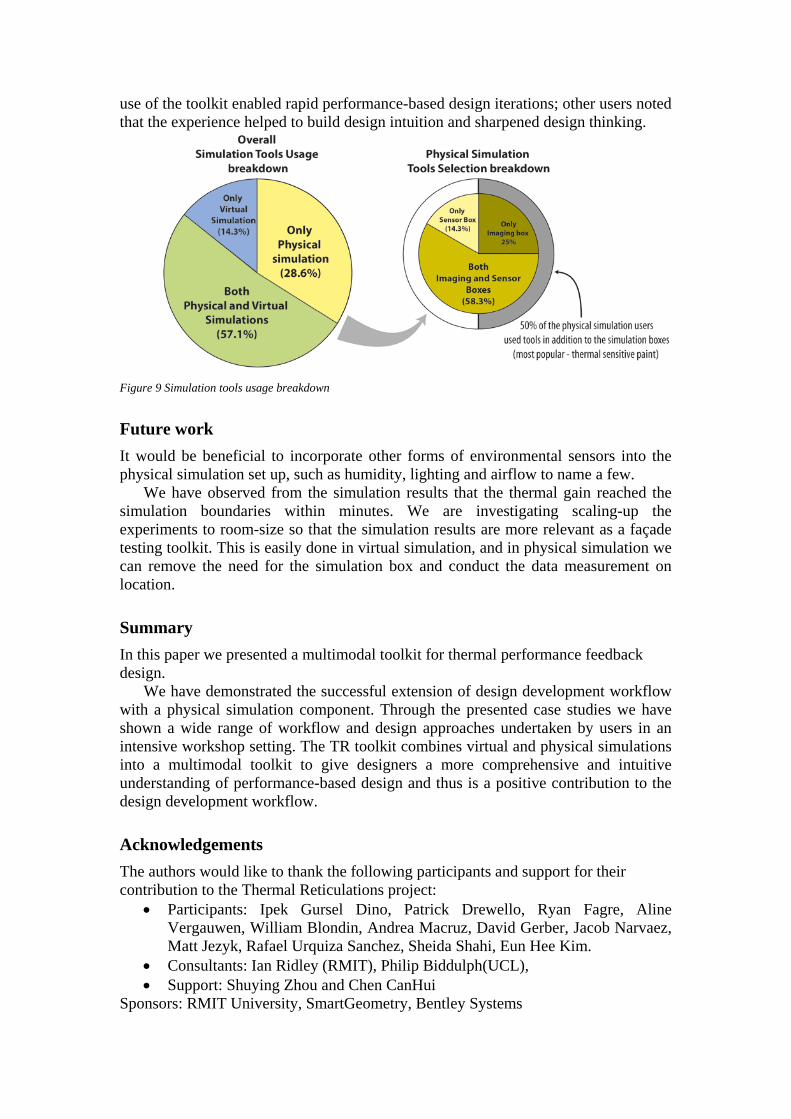
use of the toolkit enabled rapid performance-based design iterations; other users noted that the experience helped to build design intuition and sharpened design thinking.
Figure 9 Simulation tools usage breakdown
Future work It would be beneficial to incorporate other forms of environmental sensors into the physical simulation set up, such as humidity, lighting and airflow to name a few.
We have observed from the simulation results that the thermal gain reached the simulation boundaries within minutes. We are investigating scaling-up the experiments to room-size so that the simulation results are more relevant as a façade testing toolkit. This is easily done in virtual simulation, and in physical simulation we can remove the need for the simulation box and conduct the data measurement on location.
Summary In this paper we presented a multimodal toolkit for thermal performance feedback design.
We have demonstrated the successful extension of design development workflow with a physical simulation component. Through the presented case studies we have shown a wide range of workflow and design approaches undertaken by users in an intensive workshop setting. The TR toolkit combines virtual and physical simulations into a multimodal toolkit to give designers a more comprehensive and intuitive understanding of performance-based design and thus is a positive contribution to the design development workflow.
Acknowledgements The authors would like to thank the following participants and support for their contribution to the Thermal Reticulations project:
• Participants: Ipek Gursel Dino, Patrick Drewello, Ryan Fagre, Aline Vergauwen, William Blondin, Andrea Macruz, David Gerber, Jacob Narvaez, Matt Jezyk, Rafael Urquiza Sanchez, Sheida Shahi, Eun Hee Kim.
• Consultants: Ian Ridley (RMIT), Philip Biddulph(UCL), • Support: Shuying Zhou and Chen CanHui
Sponsors: RMIT University, SmartGeometry, Bentley Systems
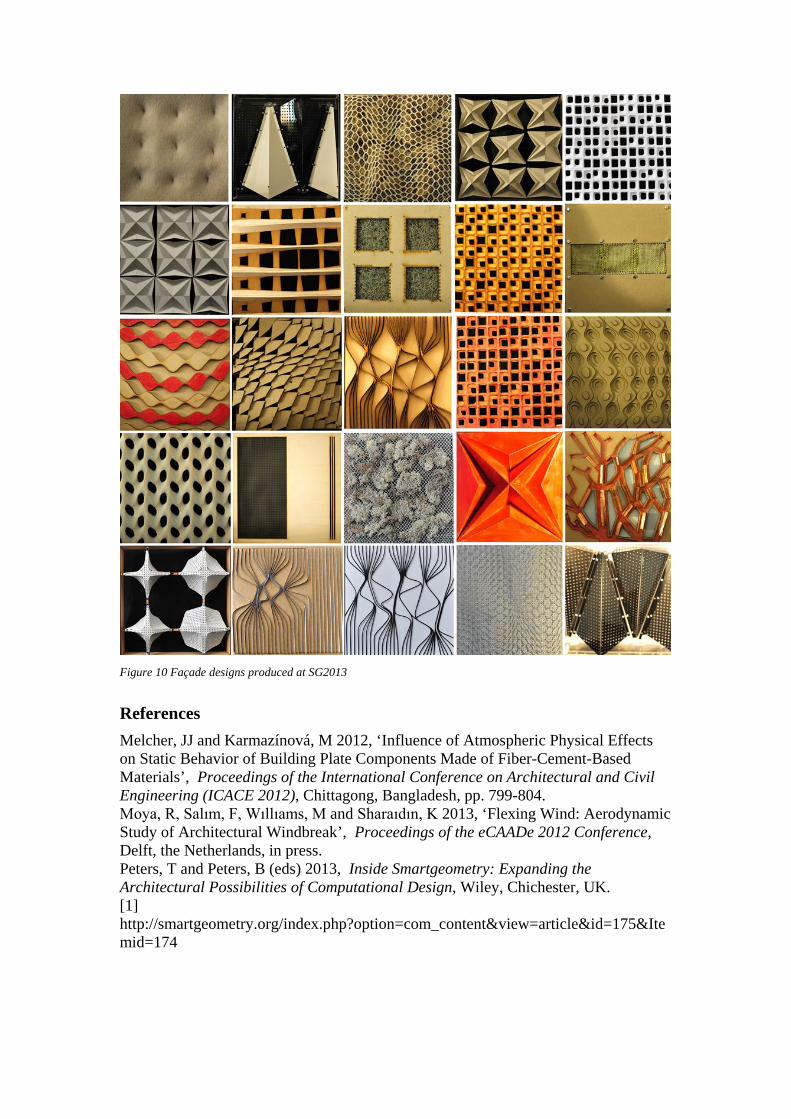
Figure 10 Façade designs produced at SG2013
References Melcher, JJ and Karmazínová, M 2012, ‘Influence of Atmospheric Physical Effects on Static Behavior of Building Plate Components Made of Fiber-Cement-Based Materials’, Proceedings of the International Conference on Architectural and Civil Engineering (ICACE 2012), Chittagong, Bangladesh, pp. 799-804. Moya, R, Salım, F, Wıllıams, M and Sharaıdın, K 2013, ‘Flexing Wind: Aerodynamic Study of Architectural Windbreak’, Proceedings of the eCAADe 2012 Conference, Delft, the Netherlands, in press. Peters, T and Peters, B (eds) 2013, Inside Smartgeometry: Expanding the Architectural Possibilities of Computational Design, Wiley, Chichester, UK. [1] http://smartgeometry.org/index.php?option=com_content&view=article&id=175&Itemid=174
Name Application Comment Design Digital modeling software Rhino3D - Grasshopper (Rhino plugin) Digital Project Generic Components Processing
Segmentation tools Prepare digital models for simulation Design tools can also perform segmentation
Salome MeshLab Virtual simulation tools Agros2D 2D (sectional) thermal simulation WUFI Both temperature and humidity, 1D
(point) data
Elmer
3D thermal simulation of both the model's material and its environment
Physical fabrication tools Hand tools Laser cutter 3D printer
Physical simulation tools Simulation boxes 300x300x400 (mm) testing volume
2 versions: sensor box and imaging box
Replicate in virtual testing
Heat lamp Heat source, 500W halogen lamp Replicate in virtual testing
Thermal imaging camera Measure surface 2D data Record data at a set interval
Infrared thermometer Measure surface point data, to calibrate the virtual simulation boundary conditions with the physical simulation
Handheld device
Analogue thermal sensor Point data, internal temperature of the prototype
Digital thermal sensor Point data of the environment 1-wire DS18B20 Digital thermal sensor network
3D thermal distribution of within the sensor box
27 DS18B20 arranged in a 3x3x3 grid
Arduino Sensor control and data communication to PC
Data logger
Purpose built API to communicate to the Arduino and log the sensor data into a CSV file format
Analysis tools ParaView Visualizing simulation data from
Elmer and data logger
Matlab Visualizing data logger output as 2D and 3D plots
Figure 11 List of the toolkit contents