effects of feedback sign and credibility on goal setting and task performance
TRANSCRIPT

ORGANIZATIONAL BEHAVIOR AND HUMAN DECISION PROCESSES 4, 45-67 (1989)
Effects of Feedback Sign and Credibility on Goal Setting and Task Performance
PHILIP M. PODSAKOFF
Indiana University
AND
JIING-LIH FARH
Louisiana State University
Despite previous research on feedback sign and feedback accuracy, little is known about the main and interactive effects of these two feedback dimen- sions on specitic types of cognitive and behavioral responses. The present laboratory study used 90 undergraduate students to examine the infhrence of feedback sign and feedback credibility on goal setting and task performance. Consistent with propositions derived from social learning theory and control theory, the results showed that feedback sign had a main effect on subjects’ performance. Subjects who received negative feedback performed at higher levels than subjects who received positive feedback. In addition, feedback sign was found to interact with feedback credibility to intluence subjects’ self-set goals and performance. Subjects who received more credible negative feed- back set higher goals and performed at higher levels than subjects who re- ceived less credible negative feedback, while subjects who received more credible positive feedback did not set higher goals or perform significantly better than subjects who received less credible positive feedback. The findings also suggest that feedback sign combines with both ability and self-efficacy to determine task performance. 6 1989 Academic PW, 1~.
The role of performance feedback on human behaviors has been a topic of considerable interest in organizational behavior. Research in this do- main has generally shown that feedback plays a critical role in basic human motivational processes (Ilgen, Fisher, & Taylor, 1979). For exam- ple, research on goal setting has shown that performance feedback is a
The authors thank Daniel R. Ilgen, Edwin A. Locke, and two anonymous reviewers for their helpful suggestions on earlier drafts of this paper. This research was partially funded by summer research grants from Louisiana State University and Indiana University. An abbreviated version of this paper was reported in the Proceedings of the 1986 Academy of Management Meetings. The authors of this paper wish to be considered equal contributors. Requests for reprints may be sent to Jiing-Lih Farh, Department of Management, Louisiana State University, Baton Rouge, LA 70803; or Philip M. Pod&off, Department of Manage- ment, Indiana University, Bloomington, IN 47405.
45 0749-5978/89 $3.00 Copyright 0 1989 by Academic Press, Inc. All rights of reproduction in any form reserved.

46 PODSAKOFF AND FARH
necessary condition for goal setting to work and feedback combines with goals to affect performance (Erez, 1977; Locke, Shaw, Saari, & Latham, 1981).
AS Ilgen et al. (1979) have pointed out, feedback originates from three distinct sources: other individuals, the task environment, and one’s self. Feedback that is provided by one’s superior or peers such as “you have done a very good job,” is often referred to as evaluative feedback and is among the most salient type of performance feedback in organizational settings. A substantial amount of research has been directed toward the effects of the sign of evaluative feedback on satisfaction (e.g., Ilgen et al., 1979; Taylor, Fisher, & Ilgen, 1984), and the perceived accuracy of the feedback received (e.g., Stone 62 Stone, 1985). This research generally shows that individuals who receive positive feedback are more satisfied and perceive their feedback to be more accurate than are individuals who receive negative feedback. Much less attention, however, has been fo- cused on the potential effects that feedback sign has on other cognitive or behavioral responses, or the interactive effects of feedback sign and feed- back credibility.
This is not to say that theoretical perspectives regarding the effects of feedback sign and credibility on human responding do not exist. Indeed, recent developments in the area of social learning theory (Bandura, 1986; Bandura & Cervone, 1983) and control theory (cf. Campion & Lord, 1982; Carver & Scheier, 1981; Taylor et al., 1984) provide rather explicit state- ments regarding the potential individual and joint effects of these vari- ables on affective states, goal setting, and performance.
According to social learning theory (Bandura & Cervone, 1983), an individual’s reaction to performance feedback depends on two cognitive regulators. The first one is a self-evaluative mechanism, in which indi- viduals compare performance feedback with some internal performance standards or goals and react to these comparisons. When individuals commit themselves to explicit standards or goals, perceived negative dis- crepancies between what they do and what they seek to achieve create self-dissatisfactions that serve as motivational inducements for enhanced effort.
The second cognitive regulator posited by social learning theorists is a self-efficacy mechanism, defined as an individual’s judgment of his or her capabilities to organize and execute courses of action required to attain designated types of performance (Bandura, 1986, p. 391). Research has shown that perceived self-efficacy is a significant determinant of perfor- mance (e.g., Locke, Frederick, Lee, & Bobko, 1984). In addition, re- search has also shown that an individual’s experience of success with a particular task is an influential source of efficacy information (e.g., Bandura, Adams, & Beyer, 1977). According to this perspective, perfor-

FEEDBACK SIGN AND CREDIBILITY 47
mance feedback should shape perceived self-efficacy, which in turn de- termines individuals’ reactions to feedback. Recent research (Bandura h Cervone, 1983) indicates that when both goals (i.e., internal standards) and performance feedback are present, the self-evaluative and efficacy influences predict the magnitude of motivation enhancement.
As noted by Taylor et al. (1984), control theory assumes that individ- uals’ reactions to feedback are determined by their desire to minimize the discrepancy between their behavior and their internal standards. When feedback indicates that one has met or exceeded the standard (positive or favorable feedback), it is generally expected that the individual’s goals and effort for subsequent work will remain stable. However, when feed- back indicates that a negative discrepancy does exist between perfor- mance and internal standards (negative or unfavorable feedback), at- tempts to reduce this discrepancy can be accomplished by increasing effort (Matsui, Okada, 8z Inoshita, 1983) and/or reducing one’s standards. Recent research by Campion and Lord (1982) has shown that individuals’ reactions to initial failure to reach a performance standard are to intensify their effort, whereas repeated failures eventually lead to giving up the standards.
Based on the above review, both social learning theory and control theory suggest that feedback sign affects an individual’s satisfaction, goal setting, and performance through the feedback’s effect on the individuals’ perceptions of the discrepancies between his or her behavior and the behavior standards he or she is trying to attain. When unfavorable (neg- ative) feedback is received, and indicates that progress toward an estab- lished behavioral standard has fallen behind or that one’s performance is below standard, satisfaction should decrease. Moreover, if the individual believes that the discrepancy between his or her behavior and the stan- dard is reducible (i.e., the individual’s self-efficacy for reaching the stan- dard remains high), both the individual’s self-set goals and the effort required to reach those standards should increase.
The receipt of positive feedback, on the other hand, frequently conveys the message that performance is “on target” and that the individual is meeting standards. Under these conditions, individuals should feel satis- tied with their progress and few changes would be expected to take place in either their self-set goals or the effort they put forth, particularly when they perceive little value in attaining higher level goals, or doubt their ability to achieve these goals (Taylor et al., 1984).
Since previous research has shown that the acceptance of feedback depends on its perceived credibility (Ilgen et al., 1979) the effects of such feedback on satisfaction and performance should be greater for individ- uals who perceive that the feedback sender is a credible source than for those individuals who perceive the source to lack credibility.

48 PODSAKOFF AND FARH
Overview of the Study
Within the context of the above discussion, the first objective of the present study is to examine the effects of feedback sign and credibility on satisfaction, self-set goals, and actual performance. Based on social learn- ing theory and control theory, we expected that feedback sign would have a main effect on subjects’ satisfaction, self-set goals, and performance. More specifically, we hypothesized that subjects who receive negative feedback will be more dissatisfied than subjects who receive positive feedback, although subjects who receive negative feedback will set higher goals and perform at higher levels than subjects who receive positive feedback. Furthermore, we hypothesized that the effects of negative feedback on subjects’ satisfaction, self-set goals, andperformance will be more pronounced when the feedback is perceived to be administered by a more credible source than when it is perceived to be administered by a less credible source.
The second objective of this study was to examine (1) the potential mediating effects of satisfaction and self-set goal on the relationship be- tween feedback and performance, and (2) how feedback combines with self-efficacy and individual ability to determine performance. Prior re- search by Bandura (1982) and Locke et al. (1984) has suggested that (1) ability is a key determinant of self-efficacy and (2) self-efficacy not only influences performance directly, but also indirectly through its effects on personal goal setting. As such, additional research designed to examine the combined effects of feedback, ability, and self-efficacy on self-set goals and performance should prove valuable.
The study incorporated a 2 (positive vs negative feedback) by 2 (high vs low credibility) factorial design with an added control group. It was di- vided into two sessions. In the first session, all subjects performed an object-listing task for seven trials under a “do your best” goal. After- ward, subjects in the experimental groups were provided with positive or negative feedback with high or low credibility. Subjects in the control group did not receive any feedback. Subjects’ dissatisfaction with perfor- mance, self-efficacy, and personal goals were measured by self-reports. In the second session, all subjects completed an additional 7 trials of the same object-listing task. Subject’s behavioral reactions to feedback were measured by their performance in the second session.
METHOD
Subjects
The subjects used in this study were 90 college students (45 male, 45 female) who received extra credit for their participation in the experi- ment. All subjects were randomly assigned to one of five conditions (four treatment and one control group).
FEEDBACK SIGN AND CREDIBILITY 49
Procedure
Because of the design of this study, subjects were run through the experimental conditions individually. The experimental protocol was modeled after that used by Locke (1966). The task was to list as many objects as possible in 1 min that could be described by the adjective at the top of the page. Subjects were signaled to begin and stop writing by taped instructions.
After subjects were instructed about the task, they were given a prac- tice trial. Immediately after the practice trial, subjects were signaled to start the first period in which they performed the object-listing task for 7 trials. At the end of the period, the experimenter came in and picked up the completed protocol and told the subject that she needed a few minutes to evaluate his/her work, and while she was gone she would like the subject to complete a questionnaire (which was a filler). During this time, the experimenter quickly calculated the average number of objects listed by the subject per trial (which served as the measure of performance in the present study). She then came back into the observation room to administer the feedback manipulation. Subjects in the control group were neither told that the experimenter would evaluate their performance nor given the feedback message. However, to maintain equivalent conditions, the control subjects were also asked to complete the filler questionnaire.
Feedback Manipulations
All subjects in the experimental conditions received performance feed- back. They were first told the average number of objects they actually listed per trial. Feedback sign was then manipulated by providing subjects with bogus normative data. Specifically, subjects in the positive feedback condition were told that they have done very well and their performance was 2 above the average. Subjects in the negative feedback condition were told that they have not done very well and their performance was 3 below the average. ’ Feedback credibility was manipulated by telling the subjects that the evaluation was based on a comparison of the subject’s
’ Subjects in the negative feedback condition were told that their performance was 3 below average instead of 2 for three reasons. First, research by Bandura and Cervone (1986) showed that self-evaluation operates as an influential motivator only when attainments fall markedly or moderately short of a comparative standard. Second, pilot studies conducted by the authors indicated that while 2 above average was perceived as more plausible than 3 above average by subjects in the positive feedback condition, subjects in the negative feedback conditions did not perceive 3 below average as implausible. Third, goal setting literature (Locke et nl., 1981) suggests that harder goals lead to better performance than medium or easy goals. Thus, to avoid the risk of having a substandard discrepancy that may be perceived as small, we raised the standard by 1 and thus increased the discrepancy by 50% for subjects in the negative feedback condition.

50 PODSAKOFF AND FARH
performance with that of more than 300 college students on the same test (high credibility) or that the evaluation was simply based on the experi- menter’s experience (low credibility). In an effort to strengthen the feed- back credibility manipulation, the subjects in the high credibility condi- tion were not only given the verbal feedback but also presented with a table that contained presumably published data about the average perfor- mance of more than 300 college students who had completed the same test. A total of 30 tables were prepared, each geared toward a specific performance level. Needless to say, the information in the table was bogus and subjects were always presented with the table that provided information of average performance consistent with the feedback sign manipulation. For example, if a subject in the high-credibility negative- feedback condition completed an average of 7 objects per trial, the ex- perimenter showed him/her a table that had a mean of 10 objects per trial.
Self-Report Measures
After the feedback manipulation, all subjects, including those in both the control and experimental groups, were asked to complete a question- naire which contained the measures of the subjects’ perceived self- efficacy at reaching various performance attainments, their performance goal for the next session, and their self-dissatisfaction with their perfor- mance .
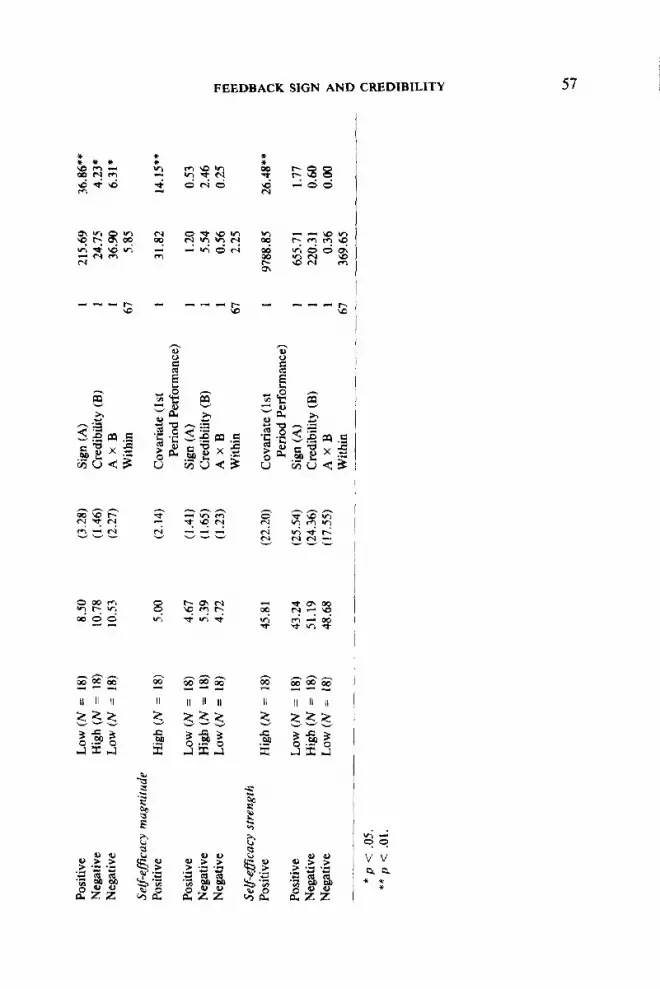
The self-efficacy scale was modeled after that of Locke et al. (1984). Subjects recorded their perceived self-efficacy for 8 possible levels of performance attainments from 2 to 16 objects with a increment of 2. For each of these performance levels, subjects first indicated whether they felt they could achieve that level (either yes or no) and then (b) the degree of certainty they felt in reaching that level (from 0 to 100%). Consistent with Locke et al. (1984), the total number of yes’s across the 8 perfor- mance levels was used to measure the magnitude of self-efficacy, whereas the average certainty ratings for the medium to high performance levels (levels 6,8, 10, and 12 in the present study) were used to represent the strength of self-efficacy.
Subjects’ performance goals were obtained by having them indicate the number of objects they intended to list for each adjective presented to them in the second session. All but 5 subjects gave quantitative goals. The five subjects who did not give specific goals all stated that their goal was to “do my best.”
In measuring self-evaluative reactions, subjects rated their self- satisfaction or dissatisfaction on two 13-point scales adapted from Bandura and Cervone (1983), ranging from (1) “highly self-satisfied,” through (7) “neutral,” to (13) “highly self-dissatisfied.” On the first scale

FEEDBACK SIGN AND CREDIBILITY 51
they rated their self-satisfaction or dissatisfaction with their performance in the first session, which they had just completed. For the second rating, subjects indicated how self-dissatisfied they would be were they to achieve the same rating of performance on their subsequent attempt.
Immediately after the completion of the questionnaires, the experi- menter began the second session, in which subjects performed another 7-item object listing task. At the end of the second period, all subjects were asked to indicate the average number of objects per trial that the experimenter expected them to list for the second session. Following the completion of this questionnaire, subjects were debriefed thoroughly and were made completely aware that the feedback they received had no relationship to their actual performance.
RESULTS
Manipulation Checks
The temporal placement of manipulation checks presented a knotty problem in this experiment (cf., Fromkin & Streufert, 1976; Kidd, 1976). If the manipulation checks were obtained immediately after the feedback, they may have sensitized subjects or increased their suspicions about the hypotheses and the purpose of the experiment. If they were taken at the end of the experiment, the impact of the manipulations may not have been strong enough to be durable throughout the experiment. Moreover, there was a risk that subjects’ performance in the second period may have an impact on their perceptions of the initial feedback. To avoid these prob- lems, a separate study was conducted to assess the effectiveness of the feedback manipulations. Thirty-six subjects (15 male, 21 female) drawn from the same student population were randomly assigned to the four treatment conditions described earlier. These subjects were run under the same cover story and procedure as those who participated in the main study. After receiving the feedback, subjects were asked to complete a manipulation check questionnaire. Then, the experiment was terminated and subjects were thoroughly debriefed and dismissed.
The questionnaire contained items that measured perceived perfor- mance, feedback accuracy, and experimenter credibility. Perceived per- formance was measured by a single item asking subjects to indicate how well they had performed on the creativity test (1 = well below average; 5 = well above average). A 2 by 2 analysis-of-variance factorial design was used to analyze the data obtained. The results are reported in Table 1. As this table indicates, subjects in the positive feedback condition reported their performance to be higher than subjects in the negative feedback condition [MS = 3.94 vs 2.06; F(1,32) = 308.27, p < .OOlJ. In addition, there was a significant interaction between feedback credibility

52 F’ODSAKOFF AND FARH
TABLE 1 CELL MEANS AND ANALYSIS OF COVARIANCE OF EFFECTS OF FEEDBACK SIGN AND
FEEDBACK CREDIBILITY ON SUBJECTS’ PERCEIVED PERFORMANCE, FEEDBACK ACCURACY, AND EXPERIMENTER CREDIBILITY
Feedback Feedback Cell standard Mean sign credibility means deviations Source df squares F
Perceived pqhormance Positive High (N = 9) 4.11 (0.33) Sian (A) 1 32.11 308.27** Positive Low (N = 9) 3.78 (0.W Credibility (B) 1 0.11 1.07 Negative High (N = 9) 2.00 (0.W AxB 1 0.44 4.27* Negative Low (N = 9) 2.11 (0.33) Within 32 0.10 Feedback accuracy Positive High (N = 9) 3.41 (0.43) Sign (A) 1 0.00 0.01 Positive Low (N = 9) 3.04 (0.42) Credibility (B) 1 2.25 6.48* Negative Higb (N = 9) 3.56 (0.75) AxB 1 0.15 0.44 Negative Low (N =9) 2.93 (0.W Within 32 0.35 Experimenter credibilio Positive High (N = 9) 3.78 Sign (4 1 0.25 Positive Low (N = 9) 3.17 ::?I; Credibility (B) 1 3.36 fE** Negative High (N = 9) 3.94 AxB 1 0.00 0:oo Negative Low (N = 9) 3.33 Within 32 0.42
+ p < .05. ** p < .Ol.
and feedback sign [F(1,32) = 4.27, p < .05]. Simple main effects tests indicated that subjects who received more credible positive feedback had higher perceived performance than those who received less credible pos- itive feedback [F(1,32) = 5.00, p < .05], whereas feedback credibility had no effect on perceived performance for those who received negative feed- back, F < 1. Feedback credibility had no significant main effect.
Feedback accuracy was measured by three items adapted from Stone and Stone (1985): (a) the project director’s evaluation reflected my true performance, (b) the project director accurately evaluated my perfor- mance, and (c) the feedback I received tias an accurate evaluation of my performance. All three items were measured on 5-point Likert scales (1 = strongly disagree; 5 = strongly agree). The alpha coefficient for this scale was .74. Results of ANOVA, shown in Table 1, indicated that there was a significant main effect due to feedback credibility. Subjects in the high credibility condition perceived the feedback they received to be more accurate than those who were in the low credibility condition [MS = 3.48 vs 2.98; F(1,32) = 6.48; p < .02]. None of the other effects were signif- icant.
Experimenter credibility was assessed by two items adapted from Fisher, Ilgen, and Hoyer (1979): (a) I feel this project director was being very honest with me when she gave me the feedback and (b) this project director really knows a lot about student performance on the creativity test. These items were also measured on S-point Likert scales (1 =

FEEDBACK SIGN AND CREDIBILITY 53
strongly disagree; 5 = strongly agree). The alpha coefftcient for this scale was .43. Results of ANOVA, also shown in Table 1, revealed a significant main effect due to feedback credibility. Subjects who received more cred- ible feedback perceived the project director (i.e., experimenter) to be more credible than those who received less credible feedback [MS = 3.86 vs 3.25,F(1,32) = 8.10,~ <.Ol]. Noneoftheothereffectswere significant.
The above results clearly indicate that our manipulation effectively altered subject’s perception of their previous performance and the cred- ibility of the feedback message. Subjects who received the negative feed- back perceived their performance to be lower than those who received the positive feedback. Subjects who received the highly credible feedback regardless of feedback sign reported their feedback to be more accurate and the experimenter to be more knowledgeable and honest with them than those who received the less credible feedback.
Effects of Feedback on Performance
No significant differences were found in the performance of the exper- imental and control groups in the first 7-trial session (all Fs < 1). Figure 1 plots the mean number of objects listed by the experimental and control groups for the first and second performance periods. An examination of this figure reveals that the means of second period performance for the five groups were in the following order: High Credibility/Negative Feed- back (highest), Low Credibility/Negative Feedback, Control, Low Cred- ibility/Positive Feedback, and High Credibility/Positive Feedback (low- est).
A 2 (feedback sign = positive vs negative) x 2 (feedback credibility = high vs low) analysis of covariance (ANCOVA), using the first period performance as the covariate, was used to analyze the performance of the subjects in the second period. Since the proper use of ANCOVA neces- sitates a demonstration of slope homogeneity across treatment groups (Kerlinger & Pedhazur, 1973), tests of slope differences were first made by comparing a linear model that allowed separate slopes for the four treatment groups against one that had only one common slope parameter for estimating the covariate-criterion relationship pooled across the four treatments. This analysis found the assumption of homogeneity of slopes across treatments to be tenable. Following this, the analysis of covariance was conducted and the results are reported in Table 2. Examination of this table revealed a significant main effect for feedback sign. Subjects who received negative feedback listed significantly more objects in the second period than subjects who received positive feedback. There was also a significant interaction effect between feedback sign and feedback credibility. Simple effects tests indicated that subjects who received more

54 PODSAKOFF AND FARH
Mew Number
Gb&-
8-
8-
High Credlblllty Negative Hudback
-n-
LOW CmdlblllIy Negative Feedback
-%
LOW Cmdlblllly PoSItI’m Fe&back
-e-
Control Group
-A-
Hlgh Cmdlblllty Posltlve Feedback
-c
First Period Second Period
FIG. 1. Mean number of objects listed as a function of feedback sign and feedback cred- ibility.
credible negative feedback listed more objects than those who received less credible negative feedback [F(1,67) = 7.91, p < .Ol], whereas sub- jects who received highly credible positive feedback performed no better than those who received less credible positive feedback (F < 1). Feed- back credibility had no main effect.
In addition, subjects in the negative feedback-high credibility and neg- ative feedback-low credibility conditions listed significantly more objects in the second period (F(1,33) = 32.69, p < .Ol; F(1,33) = 15.97, p < .Ol, respectively) than control group subjects (A4 = 7.30), whereas subjects in the positive feedback conditions performed at the same level as the con- trol subjects (both Fs < 1).
Effects of Feedback on Subjects’ Self-Reports
Table 3 reports the analysis of covariance of the effects of feedback sign and credibility on subjects’ self-reported personal goals, perceptions of

TABL
E 2
CEL
L M
EAN
S AN
D A
NAL
YSIS
OF
CO
VAR
IAN
CE
OF
EFFE
CTS
OF
FEED
BAC
K SI
GN
AN
D F
EED
BAC
K C
RED
IBIL
ITY
ON
AVE
RAG
E N
UM
BER
O
F z
OBJ
ECTS
LIS
TED
IN
TH
E SE
CO
ND
PER
IOD
fl P
Feed
back
N
umbe
r of
St
anda
rd
Mea
n R
Fe
edba
ck s
ign
cred
ibilit
y ob
ject
s lis
ted
devi
atio
ns
Sour
ce
df
squa
res
F z
Posi
tive
Hig
h (A
’ =
18)
7.01
(1
.95)
C
ovar
iate
(1
st
1 27
6.66
24
8. IO
**
2 pe
riod
perfo
rman
ce)
Posi
tive
Low
(N
=
18)
7.44
(1
.46)
Si
gn (
A)
1 39
.48
35.4
0**
%
Neg
ativ
e H
igh
(N =
18
) 9.
02
(2.8
8)
Cre
dibi
lity
(B)
1 2.
38
2.13
N
egat
ive
Low
(N
=
18)
8.25
(2
.62)
Ax
B 1
6.51
5.
89*
E W
ithin
67
1.
12
fl --
~~
__~~
~_
.___
.~
__
z *
p <
.05.
P
** p
< .
Ol.
3

TABL
E 3
CEL
L M
EAN
S AN
D A
NAL
YSIS
OF
CO
VAIU
ANC
E O
F EF
FEC
TS O
F FE
EDBA
CK
SIG
N A
ND
FEE
DBA
CK
CR
EDIB
ILIT
Y O
N S
UBJ
ECTS
’ PER
SON
AL G
OAL
S,
4 PE
RC
EPTI
ON
S O
F EX
PER
IMEN
TER
’S
GO
AL,
DIS
SATI
SFAC
TIO
N
WIT
H P
ERFO
RM
ANC
E, A
ND
SEL
F-EF
FIC
ACY
Feed
back
sig
n Fe
edba
ck
cred
ibilit
y C
ell
mea
ns
Stan
dard
de
viat
ions
So
urce
Subj
ects
’ pe
rson
al g
oals
Po
sitiv
e H
igh
(N =
18
) 6.
56
Posi
tive
Low
(N
=
17)
7.00
N
egat
ive
Hig
h (N
=
17)
8.53
N
egat
ive
Low
(N
=
16)
7.13
Subj
ects
’ pe
rcep
tions
of
expe
rimen
ter’s
ex
pect
atio
ns
Posi
tive
Hig
h (N
=
16)
6.69
Posi
tive
Low
(N
=
17)
7.88
N
egat
ive
Hig
h (N
=
18)
9.11
N
egat
ive
Low
(N
=
18)
8.83
Subj
ects
’ se
w-d
issa
tisfa
ctio
n w
ith p
erfo
rman
ce
Posi
tive
Hig
h (N
=
18)
5.89
ww
w4)
(3
.00)
(1
.37)
Cov
aria
te (
1st
Perio
d P
erfo
rman
ce)
Sign
(A
) C
redi
bilit
y (B
) AX
B W
ithin
(1.5
4)
(2.2
1)
(2.4
0)
(1.5
8)
Cov
aria
te (
1st
Perio
d P
erfo
rman
ce)
Sign
(A
) C
redi
bilit
y (B
) AX
E W
ithin
(2.2
6)
Cov
aria
te (
1st
Perio
d P
erfo
rman
ce)
df 1 1 1 1 63 I 1 1 1 67 1
Mea
n sq
uare
s
155.
31
18.0
3 6.
06
15.7
8 2.
47
98.3
9
49.6
8 1.
26
8.23
2.
45
0.29
,
F
61.9
5**
7.30
**
2.45
6.
39*
40.2
2**
20.3
1**
0.51
3.
36 (p
c
.07)
0.05
Posi
tive
Low
(N
=
18)
8.50
(3
.28)
N
egat
ive
Hig
h (N
=
18)
10.7
8 (1
.46)
N
egat
ive
Low
(N
=
18)
10.5
3 (2
.27)
Self-
efic
acy
mag
nitu
de
Posi
tive
Posi
tive
Low
(A
’ =
18)
4.67
(1
.41)
N
egat
ive
Hig
h (N
=
18)
5.39
(1
.65)
N
egat
ive
Low
(A
’ =
18)
4.72
(1
.23)
Self-
efic
acy
srre
ngrh
Po
sitiv
e
Posi
tive
Low
(N
=
18)
43.2
4 (2
5.54
) N
egat
ive
Hig
h (N
=
18)
51.1
9 (2
4.36
) N
egat
ive
Low
(N
=
IS)
48.6
8 (1
7.55
)
Hig
h (N
=
18)
5.00
(2
.14)
Hig
h (N
=
18)
45.8
1 (2
2.20
)
Sign
(A
) 1
215.
69
Cre
dibi
lity
(B)
1 24
.75
AxB
1 36
.90
With
in
67
5.85
Cov
aria
te
(1st
Pe
riod
Per
form
ance
) Si
gn (
A)
Cre
dibi
lity
(B)
AxB
With
in
Cov
aria
te
(1 st
Pe
riod
Per
form
ance
) Si
gn (
A)
Cre
dibi
lity
(B)
AxB
With
in
1 3 1
.82
1 1.
20
1 5.
54
1 0.
56
67
2.25
1 97
88.8
5
1 65
5.71
1
220.
31
1 0.
36
67
369.
65
* p -
=c .05.
**
p <
.O
I.
36.8
6**
4.23
* 6.
31*
14.1
5**
0.53
2.
46
0.25
2 g
26.4
8**
iit
7c
1.77
0.
60
0.00
Y

58 PODSAKOFF AND FARH
experimenter’s expectations, self-dissatisfaction with performance, and self-efficacy.
Subjects’ personal goals. The results of ANCOVA revealed a signifi- cant main effect for feedback sign, but not for feedback credibility. Sub- jects in the negative feedback condition set significantly higher personal goals than subjects in the positive feedback condition, although none of the four experimental groups differed significantly from the control group subjects (iI = 7.78). However, a closer examination of the data reported in Table 3 suggested that this main effect may have really resulted from the fact that subjects in the negative feedback high credibility condition set higher goals than subjects in the other three conditions. This interpre- tation was supported by two additional analyses. First, as indicated in Table 3, there was a significant interaction between feedback sign and feedback credibility. Subjects that received more credible negative feed- back set higher goals than subjects that received less credible negative feedback [F(1,63) = 8.20, p < .Ol], whereas feedback credibility had no impact on personal goals for those who received positive feedback [F < 11. Second, an analysis of the data reported in Table 3 using Tukey’s honestly significant difference (HSD) test indicated that subjects in the negative feedback-high credibility condition set personal goals that were higher (p < .05) than subjects in any of the other three conditions.
Perception of experimenter’s expectation. Examination of the data on subjects’ perceptions of experimenter’s expectations indicated a main effect for feedback sign. Subjects in the positive feedback condition per- ceived the experimenter to have significantly lower expectations than those perceived by subjects in the negative feedback condition. More- over, subjects in the high credibility-positive feedback condition per- ceived the experimenter’s expectation to be significantly lower [F(1,29) = 6.40, p < .05] than that perceived by control group subjects (M = 8.69). No significant main effect was obtained for feedback credibility. However, the interaction effect between feedback sign and credibility approached significance [F(1,67) = 3.36, p < .07]. Analysis of this inter- action indicated that subjects who received more credible positive feed- back generally perceived the experimenter’s expectation to be lower than subjects who received less credible positive feedback [F(1,67) = 3.59, p < .lO], whereas subjects who received more credible negative feedback perceived the experimenter’s expectation no differently than subjects who received less credible negative feedback (F < 1).
Self-dissatisfaction with performance. As noted earlier, subject’s self- dissatisfaction with performance was measured by two items, one refer- ring to previous performance, the other referring to future performance. Since these two items were highly correlated with each other (r = .84, p

FEEDBACK SIGN AND CREDIBILITY 59
< .Ol), they were combined to form a single index, dissatisfaction with performance. Results of ANCOVA indicated a strong main effect for feedback sign [F(1,67) = 36.86, p < .OOl]. As expected, subjects who received negative feedback were more self-dissatisfied with their perfor- mance than those who received positive feedback. There was also a main effect for feedback credibility [F( 1,67) = 4.23, p < .05] and an interaction between feedback sign and feedback credibility [F( 1,67) = 6.3 1, p < .05]. Simple effects tests indicated that subjects who received high credibility positive feedback were less dissatisfied with their performance than those who received low credibility positive feedback [F(1,67) = 10.37, p < .Ol], whereas feedback credibility had no effect on dissatisfaction with perfor- mance for those who received negative feedback (F < 1).
In addition, subjects in the negative feedback-high credibility and neg- ative feedback-low credibility conditions were significantly more self- dissatisfied with their performance [F( 1,33) = 33.61, p < .Ol ; F( I ,33) = 23.45, p < .Ol, respectively] than control group subjects (M = 6.28). It was also found that subjects in the positive feedback-low credibility con- dition were more self-dissatisfied with their performance than the control subjects [F(1,33) = 4.69, p < ,051, whereas subjects in the positive feed- back-high credibility condition were not significantly different from the control subjects (F < 1).
Self-eficacy. Neither feedback sign nor feedback credibility had main or interactive effects on the strength or the magnitude of subject’s re- ported self-efftcacy.
Exploratory Causal Analysis
A path analytic model was used to integrate the findings and examine the potential mediating effects of subjects’ self-dissatisfaction with per- formance and personal goals on the relationship between feedback and performance, and how feedback combines with ability and self-efficacy to influence performance (see Fig. 2). The rationale for this model was based on previous theory and research, and consistent with Locke et al. (1984), the two self-efficacy measures were first standardized (by converting them to Z-scores) and then summed to form a composite measure. (Self- efftcacy strength and magnitude were correlated .65 [p < .05], with each other; and each correlated .91 [p < .Ol] with the composite self-efficacy scale.)
In this model, feedback sign and ability level (as measured by the subject’s first period performance) are identified as exogenous variables because of their temporal sequencing. The feedback sign variable was scaled by assigning a value of 1 to the negative feedback condition and a value of 2 to the positive feedback condition.

60 FQDSAKOFF AND FARH
Fe&ck’ Sign
-06
\
(-.lO)
(.39)
/, .56"
.42.* (.lO
mny
FIG. 2. Path analysis model. The coeffkients outside of the parentheses represent stan- dardized path coefficients. The coefficients inside the parentheses are the standardized path coefficients when ability is measured by practice-trial performance (refer to text for expla- nation).
As noted in the introduction, a substantial amount of previous research on feedback (cf. Ilgen et al., 1979; Taylor et al., 1984) has indicated that subjects who receive unfavorable (negative) feedback are generally less satisfied than subjects who receive more favorable (positive) feedback. Moreover, according to the tenets of goal setting theory (Locke, Cart- ledge, & Knerr, 1970), dissatisfaction with prior performance should lead to an increase in the personal goals set by the subject and, subsequently, to an increase in performance. Thus, we would expect feedback sign to have not only a direct effect on performance, but also an indirect effect on it through its intIuence on self-dissatisfaction and the subjects’ personal goals. These causal relationships are represented in the model by the direct path from feedback sign to performance, and the sequence of paths from feedback sign through self-dissatisfaction and personal goals to per- formance.
Bandura (Bandura, 1977, 1982, 1986; Bandura, Adams, Hardy, & How- ells, 1980) has noted the importance of both ability (past performance) and modeling or suggestions by others on perceptions of self-efficacy, and the role of self-efficacy on subsequent performance. Similar observations have been made by Locke et aE. (1984), who suggest that both self- efficacy and ability may work directly and indirectly through personal

FEEDBACK SIGN AND CREDIBILITY 61
goals to influence performance. These linkages have been indicated in the model by the paths from ability and feedback sign to self-efficacy, and from ability and self-efficacy to personal goals and performance.
The zero-order correlations for the aforementioned measures are shown in Table 4. LISREL VI (Joreskog & S&born, 1985) was used to estimate the path coefftcients in the model. This analysis resulted in a chi-square value of 2.38 with 4 degrees of freedom (p = .67) with a GFI (goodness of fit index) equal to 99. The nonsignificant chi-square test and large GFI suggest that the overidentified model adequately describes the data. The standardized path coefficients resulting from this analysis are shown in Fig. 2. As indicated in this figure, the exploratory path analysis supports the direct (negative) effect of feedback sign on performance. As expected, feedback sign was also found to decrease subjects’ self- dissatisfaction, which in turn led to an increase of subjects’ personal goals. (The latter finding was marginally significant, path coefftcient = .15, f = 1.93, p < .06.) In addition, feedback sign was found to have no significant effect on self-efficacy. Consistent with the findings reported by Locke et al. (1984), ability (i.e., past performance) was found to have a direct effect on self-efficacy and subsequent performance, and self- efficacy was found to have a direct effect on subsequent performance. Somewhat surprisingly, however, the relationship between personal goal and subsequent performance was found to be nonsignificant, and ability was found to have a direct effect on personal goal.
DISCUSSION
Consistent with propositions derived from both social learning theory and control theory, the results of the present study provided evidence that individual reactions to feedback are mediated by a self-evaluative mech- anism. When individuals are provided with feedback indicating that their previous performance level does not meet what is expected of them, the
TABLE 4 CORRELATION MATRIX FOR MEASURES USED IN PATH ANALYSIS“ (N = 65)
1 2 3 4 5 6 Performance
1. Ability (performance in - .59 -.03 .56 .06 .67 .84 the 1st session)
2. Ability (practice trial) - .02 .39 .04 .42 .56 3. Feedback sign - -.lO - .55 - .23 - .33 4. Self-effkxcy (composite) - .ll .69 .63 5. Dissatisfaction with - .22 .24
performance 6. Personal goal - .73
0 Irl a .25, p c .05; Irl 2 .32, P < .ol.

62 PODSAKOFF AND FARH
findings of our research suggest that the information triggers an inter& comparison process, which determines how individuals react to feedback. Upon receiving negative feedback, individuals become more dissatisfied with their previous performance level, set higher performance goals for their future performance, and perform at a higher level than those who receive positive feedback or no feedback at all. Our results also indicated that feedback credibility tended to augment the effects of feedback sign; that is, the more credible the feedback, the stronger its effect on subse- quent goal setting, affective responses, and performance.
The results also show that the effects of feedback sign combine with prior performance and self-efftcacy to determine performance, and repli- cate and extend the recent work of both Bandura and Cervone (1983) and Locke et al. (1984), which shows that prior performance affects self- efficacy and that self-efficacy, in turn, influences both personal goals and future performance. Somewhat surprisingly, however, the results did not provide support for the linkage between personal goals and performance (Locke et al., 1984).
One possible explanation for the discrepancy in the findings of the present study with those reported by Locke et al. (1984) is the differences in the pattern of correlations obtained in the two studies. In their study, Locke et al. (1984) found that the relationship between personal goals and performance was stronger than the relationship between ability and per- formance (r = 0.57 vs 0.47). The opposite was true in the present study. Indeed, the correlation between first period performance and second pe- riod performance in the present study was .84, which is stronger than the correlation between goals and performance of .73. As a result, when both first period performance and goal are entered into the path analysis to predict second period performance and first period performance was par- tialled out, personal goals had less of an effect. The stronger relationship between first period performance (ability) and second period performance observed in this study as compared to that reported by Locke et al. (1984) may have occurred because different measures of ability were used. In our study, ability was measured by the average performance of the first seven trials, whereas Locke et al. (1984) used single trial performance as their ability indicator, making our measure more reliable.*
As a test of this possibility, path analysis was run again with practice trial performance used as the measure of ability, rather than performance
’ In addition, as noted by one of our anonymous reviewers, it is conceivable that subjects did some spontaneous goal setting in the first period. Thus, by partialling out subjects’ first period performance, we are probably partialling out some goal variance as well, and under- estimating the effects of goals on subsequent performance.

FEEDBACK SIGN AND CREDIBILITY 63
during the first 7-trial session. The path coefficients which are pertinent to our discussion are reported in Fig. 2 in parentheses ( ). As these data indicate, when practice trial performance is used as the measure of abil- ity, subjects’ personal goals were found to influence performance; sug- gesting that the choice of the ability measures does affect the findings. These results suggest that researchers need to be aware of the issue of differential measurement error in their measures because it can greatly affect the outcomes of parameter estimation in path analysis (Kenny, 1979). Researchers are encouraged to use multiple measures of a single construct, and then explicitly model measurement error in their parame- ter estimation process.
The relationship between personal goals and subsequent performance may also be affected by the type of feedback message subjects receive prior to goal setting. When negative feedback is received, it sends a clear message to the subject that they have performed considerably below av- erage. Under these conditions, subjects may become disenchanted with their previous performance levels and feel they are under some external pressure to improve their future performance. In contrast, subjects in the positive feedback condition are likely to feel little pressure to further improve their future performance, because they are led to believe that they have done well in the previous period. Thus, it is conceivable that personal goals set under high motivation (negative feedback) conditions may have a stronger relationship to subsequent performance than those set in low motivation (positive feedback) conditions.
To test this possibility, we examined the correlations between personal goals and performance increments by feedback condition. Performance increment was measured by subtracting subjects’ first period perfor- mance from their second period performance. These results are reported in Table 5. As this table indicates, personal goals had a much stronger relationship with the performance increments of subjects in the negative feedback condition (r = .62, p < .Ol), than for subjects in the positive feedback condition (r = .14, nonsignificant), and the differences in these correlations are significant (t = 2.28, p < .05).’ To further test the hy- pothesis that goals were important in the case of negative feedback, but
3 The potential differences in the relationships between the variables of interest and increments in performance from the first to the second performance period were assessed using hierarchical moderated regression analyses. In this analysis, perfomrance increments are regressed on the variable of interest (e.g., subjects’ personal goals), feedback sign, and the interaction of the variable of interest x feedback sign. If the interaction effect is signif- icant (i.e., adds to the amount of variance accounted for in subjects’ performance incre- ments), then it suggests that the relationship between the variable of interest and perfor- mance increments is different under conditions of positive and negative feedback.

64 PODSAKOFF AND FARH
TABLE 5 CORRELATIONS BETWEEN PREDICTOIW AND PERFORMANCE INCREMENTS IN THE SECOND
PERIOD AMONG SUBJECTS RECEIVING POSITIVE AND NEGATIVE FEEDBACK
Positive Negative Predictor feedback feedback Test for significant variables (N = 35-36) (N = 33-36) interaction effect0
Personal goal .14 .62** t = 2.28 (p < .05) First period
performance .Ol .44** t = 1.77 (n.s.) Practice trial
performance .15 .49** t = 1.74 (n.s.) Self-efficacy
magnitude .23 .52** t = 2.10 (p < .05) Self-efficacy
strength .25 HI** t = 2.43 (p < .05) Composite
self-efficacy .27 .62** t = 2.58 @ < .Ol)
0 The r-value reported in this table represents the significance of the interaction between the variable of interest and feedback sign on performance increments in a moderated re- gression equation after the variable of interest and feedback sign have already been loaded into the equation fmt. Thus, a significant t-value suggests that the relationship between the variable of interest and subjects’ improvement in performance from the frst to the second performance period is different for subjects in the positive and negative feedback conditions.
* p < .05. ** p < .Ol.
not positive feedback, we also compared the results of two additional regression analyses. In these analyses, we regressed the subjects’ perfor- mance in the second period on their performance in the first period, their self-efficacy, and personal goals. Consistent with the results reported in Table 5, the findings of these analyses indicated that for the positive feedback condition when self-efficacy and performance in the first session were controlled for, personal goals did not have an effect on subsequent performance (p = -.07, t = - .37, n.s.). However, in the negative feedback condition, personal goals had a significant effect (p = .19, t = 2.10, p < .05) on performance in the second period, even when perfor- mance in the first period and self-efficacy were partialled out. Taken together, these results suggest that in the case of positive feedback, goals have no independent effect on subsequent performance, while in the case of negative feedback, personal goals do independently affect subsequent performance. Future research should examine more closely why feed- back sign moderates the relationship between goals and subsequent per- formance. There would appear to be two possibilities. First, personal goals set after negative feedback may be more varied than goals set after positive feedback. Second, subjects may be more committed to the per-
FEEDBACK SIGN AND CREDIBILITY 65
sonal goals they set after receiving negative feedback than after positive feedback.
Both Bandura and Cervone (1983) and Carver, Blaney, and Scheier (1979) have noted that an individual’s response to failure is mediated in part by the individual’s efficacy regarding his/her ability to reduce the discrepancy between their own behavior and the desired state.4 These authors have argued that while a high self-efficacy should lead to in- creased effort on the task, a low self-efficacy should lead to reduced effort on the task. This interpretation is consistent with the findings reported in Table 5 which also show that in the negative feedback condition, all the self-efficacy measures were highly related to the subjects’ performance increments. In addition, the table shows that subjects’ ability measures in the negative feedback condition were also positively related to their per- formance increments. The above results, taken together, suggest that when subjects are confronted with negative feedback indicating a perfor- mance discrepancy, those who have high ability and high self-efficacy improve their performance significantly more than those who have low ability and self-efficacy. Thus, the above results provide additional sup- port for the critical role of self-efficacy in determining an individual’s reaction to negative feedback.
Of course, the findings of the present study regarding the generally enhancing effects of negative feedback on subjects’ personal goals and performance are not without some further qualification. It is worth not- ing, for example, that the previous research reported by Campion and Lord (1982) showed that while the initial response by individuals who fail to reach a standard is to intensify their efforts, repeated failures eventu- ally result in the abandoning of a standard. This finding suggests that the generally enhancing effect of negative feedback on goals and performance may not persist in the case of repeated negative feedback. If this inter- pretation is correct, it would appear that one aspect that needs additional attention in future research is how subjects respond following repeated negative feedback.
Also needing further qualification is the finding that feedback had no effect on subjects’ self-reported self-efficacy. It is important to note that in the present study self-efficacy was measured in terms of absolute num- bers (i.e., subjects were asked whether or not they were able to think up a specific number of items), whereas feedback was manipulated in a rel- ative sense (i.e., subjects were provided with false norms). Given that all subjects were accurately told how many items they listed in the first
4 The authors are indebted to Daniel Ilgen for bringing the importance of this particular research to our attention.

66 PODSAKOFF AND FARH
period, and this number was not significantly different UC~OSS the exper- imental groups, it is not surprising that feedback was found to have no effect on self-efficacy. To permit a fair test of the effects of feedback on self-efficacy, one would have to measure self-efficacy in the same terms as the feedback that is provided to the subjects.5 For our study, this might have been accomplished by asking subjects to judge whether they were able to attain performance levels of 5 above average, 4 above average, 3 above average, . . . etc. Thus, additional attention should also be given in future research to the way self-efficacy is measured.
REFERENCES Anderson, C. A., & Jennings, D. L. (1980). When experiences of failure promote expecta-
tions of success: The impact of attributing failure to ineffective strategies. Journal of Personality, 48, 393-407.
Bandma, A. (1977). Social learning theory. Englewood Cliffs, NJ: Prentice-Hall. Bandura, A. (1982). Self-efficacy mechanism in human agency. American Psychologist, 37,
122-147. Bandura, A. (1986). Social foundations of thought and action: A social cognitive theory.
Englewood Cliffs, NJ: Prentice-Hall. Bandura, A., Adams, N. E., & Beyer, J. (1977). Cognitive processes mediating behavioral
change. Journal of Personality and Social Psychology, 35, 125-139. Bandura, A., Adams, N. E., Hardy, A. B., & Howells, G. N. (1980). Tests of the generality
of self-efficacy theory. Cognitive Therapy and Research, 4, 39-66. Bandura, A., & Cervone, D. (1983). Self-evaluative and self-efficacy mechanisms governing
the motivational effects of goal systems. Journal ofPersonality and Social Psychology, 45, 1017-1028.
Bandura, A., & Cervone, D. (1986). Differential engagement of self-reactive influences in cognitive motivation. Organizational Behavior and Human Decision Processes, 38, 92-l 13.
Campion, M. A., & Lord, R. G. (1982). A control systems conceptualization of the goal- setting and changing process. Organization Behavior and Human Performance, 30, 265-287.
Carver, C. S., Blaney, P. H., L Scheier, M. F. (1979). Reassertion and giving up: The interactive role of self-directed attention and outcome expectancy. Journal of Person- ality and Social Psychology, 37, 1859-1870.
Carver, C. S., & Scheier, M. F. (1981). Attention and self-regulation: A control theory approach to human behavior. New York: Springer-Verlag.
Erez, M. (1977). Feedback: A necessary condition for the goal setting-performance rela- tionship. Journal of Applied Psychology, 62, 624-627.
Fisher, C. D., Bgen, R. D., & Hoyer, W. D. (1979). Source credibility, information fa- vorability, and job offer acceptance. Academy of Management Journal, 22, 94-103.
Fromkin, H., & Streufert, S. (1976). Laboratory experimentation. In M. Dunnette (Ed.), Handbook of industrial and organizational psychology (pp. 415465). Chicago, IL: Rand McNally.
’ We would like to thank one of the anonymous reviewers for noting the potential limi- tations of our measure of self-efficacy, and for suggesting how this variable should be assessed in future research.
FEEDBACK SIGN AND CREDIBILITY 67
Ilgen, D. R., Fisher, C. D., &Taylor, M. S. (1979). Consequences of individual feedback on behavior in organizations. Journal of Applied Psychology, 64, 349-371.
Ilgen, D. R., & Hamstra, B. W. (1972). Performance satisfaction as a function of the dif- ference between expected and reported performance at five levels of reported perfor- mance. Organizational Behavior and Human Performance, I, 359-370.
Jbreskog, K. G., & S&born, D. (1985). LISREL-VI: Analysis of linear structural relation- ships by the method of maximum likelihood. Chicago: National Educational Resources, Inc.
Kenny, D. A. (1979). Correlation and causality. New York: Wiley. Kerlinger, F. N., & Pedhazur, E. J. (1973). Multiple regression in behavioral research. New
York: Holt, Rinehart & Winston. Kidd, R. F. (1976). Manipulation checks: Advantage or disadvantage. Representative Re-
search in Social Psychology, 7, 160-165. Locke, E. A. (1966). The relationship of intentions to level of performance. Journal of
Applied Psychology, 50, 60-66. Locke, E. A., Cartledge, N., & Knerr, C. S. (1970). Studies of the relationship between
satisfaction, goal setting, and performance. Organization Behavior and Human Perfor- mance, 5, 135-158.
Locke, E. A., Frederick, E., Lee, C., & Bobko, P. (1984). Effect of self-efficacy, goals, and task strategies on task performance. Journal ofApplied Psychology, 69, 241-251.
Locke, E. A., Shaw, K. N., Saari, L. M., & Latham, G. P. (1981). Goal setting and task performance: 1%9-1980. Psychological Bulletin, 90, 125-152.
Matsui, T., Okada, A., & Inoshita, 0. (1983). Mechanism of feedback affecting task per- formance. Organizational Behavior and Human Pet$ormance, 31, 114-122.
Sibley, R., & McFarland, D. J. (1974). A state-space approach to motivation. In D. J. McFarland (Ed.), Motivational control systems analysis. New York: Academic Press.
Stone, D. L., & Stone, E. F. (1985). The effects of feedback consistency and feedback favorability on self-perceived task competence and perceived feedback accuracy. Or- ganizational Behavior and Human Decision Processes, 36, 167-185.
Stone, E. F., & Stone, D. L. (1984). The effects of multiple sources of performance feed- back and feedback favorability of self-perceived task competence and perceived feed- back accuracy. Journal of Management, 10, 371-378.
Taylor, M. S., Fisher, C. D., & Ilgen, D. R. (1984). Individuals’ reactions to performance feedback in organizations: A control theory perspective. In K. M. Rowland & G. R. Ferris (Eds.), Research in personnel and human resources management (Vol. 2, pp. 81-124). Greenwich, CN: JAI Press.
RECEIVED: July 30, 1987