designing effective teacher performance pay programs
TRANSCRIPT
NBER WORKING PAPER SERIES
DESIGNING EFFECTIVE TEACHER PERFORMANCE PAY PROGRAMS: EXPERIMENTAL EVIDENCE FROM TANZANIA
Isaac MbitiMauricio RomeroYoudi Schipper
Working Paper 25903http://www.nber.org/papers/w25902
NATIONAL BUREAU OF ECONOMIC RESEARCH1050 Massachusetts Avenue
Cambridge, MA 02138May 2019
We are especially grateful to Karthik Muralidharan for his collaboration in the early stages of this project and subsequent discussions. We thank the leadership and staff at Twaweza for their collaboration and support on this project. We would also like to thank Austin Dempewolff, Mitch Downey, David Evans, John Friedman, Delia Furtado, Guthrie Gray-Lobe, Ronak Jain, Joseph Mmbando, Molly Lipscomb Johnson, Terence Johnson, Michael Kremer, Derek Neal, Omer Ozak, Bobby Pakzad-Hurson, Wayne Aaron Sandholtz, Enrique Seira, Daniela Scur, Jay Shimshack, Bryce Millet Steinberg, Tavneet Suri, and seminar/conference participants at UC San Diego, Universidad del Rosario, NEUDC, PacDev, RISE, SOLE, and SREE for their comments. Erin Litzow and Jessica Mahoney provided excellent research assistance through Innovations for Poverty Action. We are also grateful to EDI Tanzania for their thorough data collection and implementation efforts. The EDI team included Respichius Mitti, Phil Itanisia, Timo Kyessey, Julius Josephat, Nate Sivewright, and Celine Guimas. This evaluation was funded by Twaweza with supplemental funding from the REACH Trust Fund at the World Bank. We are grateful to Peter Holland, Jessica Lee, Arun Joshi, Owen Ozier, Salman Asim, and Cornelia Jesse for their support through the REACH initiative. Financial support from the Asociacion Mexicana de Cultura, A.C. is gratefully acknowledged by Romero. This paper was partly written while Mbiti was visiting the Brown University Economics Department and the Population Studies and Training Center (PSTC). We received IRB approval from Innovations for Poverty Action, UC San Diego, and University of Virginia. The protocol was also reviewed and approved by the Tanzania Commission for Science and Technology (COSTECH). A randomized controlled trials registry entry and the pre-analysis plan are available at: https://www.socialscienceregistry.org/trials/1009 The views expressed herein are those of the authors and do not necessarily reflect the views of the National Bureau of Economic Research.
At least one co-author has disclosed a financial relationship of potential relevance for this research. Further information is available online at http://www.nber.org/papers/w25903.ack
NBER working papers are circulated for discussion and comment purposes. They have not been peer-reviewed or been subject to the review by the NBER Board of Directors that accompanies official NBER publications.
© 2019 by Isaac Mbiti, Mauricio Romero, and Youdi Schipper. All rights reserved. Short sections of text, not to exceed two paragraphs, may be quoted without explicit permission provided that full credit, including © notice, is given to the source.

Designing Effective Teacher Performance Pay Programs: Experimental Evidence from Tanzania Isaac Mbiti, Mauricio Romero, and Youdi SchipperNBER Working Paper No. 25903May 2019JEL No. C93,H52,I21,M52,O15
ABSTRACT
We use a field experiment in Tanzania to compare the effectiveness on learning of two teacher performance pay systems. The first is a Pay for Percentile system (a rank-order tournament). The second rewards teachers based on multiple proficiency thresholds. Pay for Percentile can (under certain conditions) induce optimal effort among teachers, but our threshold system is easier to implement and provides teachers with clearer goals and targets. Both systems improved student test scores. However, the multiple-thresholds system was more effective in boosting student learning and is less costly.
Isaac MbitiBatten School of Leadership and Public PolicyUniversity of VirginiaP. O. Box 400893Charlottesville, VA 22904and [email protected]
Mauricio RomeroCentro de Investigacion [email protected]
Youdi SchipperTwaweza127 Mafinga Road off Kinondoni Road P.O. Box 38342 Dar es [email protected]
A randomized controlled trials registry entry is available at https://www.socialscienceregistry.org/trials/1009
1 Introduction
Over the past two decades, global education priorities have shifted from increasing pri-mary school enrollment to promoting policies that improve learning. This shift has beendriven in part by evidence revealing poor and stagnant levels of learning among stu-dents in developing countries, despite significant investments in education (World Bank,2018). Given the central role of teachers in the education production function (Hanushek& Rivkin, 2012; Chetty, Friedman, & Rockoff, 2014b, 2014a), as well as the large shareof the education budget devoted to their compensation, policy makers and researchersare increasingly interested in interventions that increase the effectiveness of teachers.Teacher performance pay programs are seen as a potential policy response to addressthese concerns because they strengthen the links between teacher renumeration and stu-dent learning outcomes (World Bank, 2018; Bruns, Filmer, & Patrinos, 2011).1 However,there is limited evidence on how to best structure teacher incentives.
Insights from economic theory suggest that sophisticated teacher incentive designs,such as those based on rank-order tournaments, are more effective and may inducegreater — and potentially socially optimal — levels of effort among teachers as opposedto those based on proficiency thresholds (Neal & Schanzenbach, 2010; Neal, 2011; Bar-levy & Neal, 2012; Loyalka, Sylvia, Liu, Chu, & Shi, in press). However, the theoreticaladvantages of rank-order tournament incentive schemes may not materialize in practicebecause participants need to “think strategically about their co-workers’ efforts to finda Nash equilibrium” (Charness & Kuhn, 2011). That is, it may be more difficult forteachers to determine how to react optimally to such schemes. In contrast, incentiveschemes based on proficiency thresholds are perceived as more transparent and easierto implement compared to tournaments. Such incentive designs are commonly usedin education systems, despite their well-known shortcomings — including encouragingteachers to focus on marginal students (Neal & Schanzenbach, 2010). Since each incen-tive system has its own set of practical and theoretical advantages and disadvantages,there is a need for empirical studies that compare the effectiveness of different designs.
We conduct a randomized experiment that examines the effectiveness of two differ-ent incentive schemes in a nationally representative set of 180 Tanzanian public schools.The first is a “Pay for Percentile” (a rank-order tournament) scheme based on research
1Teacher performance pay programs have been implemented in both developed and developing con-texts. For instance, the share of US school districts with teacher performance pay programs has increasedby more than 40% from 2004 to 2012 (Imberman, 2015). Less developed countries such as Brazil, Chile,and Pakistan have also implemented performance pay programs, often as large pilot programs (Alger,2014; Ferraz & Bruns, 2012; Barrera-Osorio & Raju, in press; Contreras & Rau, 2012).
1
by Barlevy and Neal (2012). The second is a “Levels” scheme that features multipleproficiency thresholds. To the best of our knowledge, this is the first documented im-plementation of proficiency-based teacher incentives with multiple (curricular-based)thresholds. Both types of incentive programs rewarded teachers for the performance oftheir students on externally administered tests in math, Kiswahili, and English in first,second, and third grade.2 To facilitate comparisons, the per-student bonus budget wasequalized (ex-ante) across grades, subjects, and treatment arms. The average teacherbonus was equal to approximately 3.5% of the annual net salary (roughly half a month’spay).3 Further, all teachers in our study were provided with baseline student reports sothey were aware of each students’ initial skill (or proficiency) level. Following Neal (2013)and Mbiti et al. (in press), we evaluate the incentive programs using data from both theincentivized (or “high-stakes”) test that was administered to all students to determineteacher bonuses and a non-incentivized (or “low-stakes”) test that was administered toa sample of students for research purposes.4
In the 60 schools assigned to the Pay for Percentile arm, students were first tested andthen assigned to one of several “baseline ability groups” based on their learning level(across all schools). At the end of the school year, students were re-tested and rankedwithin their assigned group based on their test scores. Teachers were rewarded in pro-portion to their students’ rankings within each group. By handicapping the differencesin initial student performance across teachers, the system does not penalize teacherswho serve disadvantaged students. To ensure that teachers understood the incentivescheme, we developed information packets that used culturally appropriate scripts andexamples, and also budgeted extra time to explain the design details in this treatment.
In the 60 schools assigned to receive incentives based on proficiency targets (the “Lev-els” arm), teachers earned bonuses based on their students’ mastery of several grade-specific skills. As incentive programs using single-proficiency thresholds encourageteachers to focus on students close to the passing threshold, we included several thresh-olds to mitigate this concern. The skill thresholds were salient milestones based on thenational curriculum and ranged from very basic (e.g., number recognition) to more com-plex skills (e.g., multiplication) in order to allow teachers to earn rewards from a wide
2English was dropped from the national curriculum in first and second grades in the middle of theexperiment. We therefore focus on our analysis on math and Kiswahili test scores and present the analysisof English scores in the Appendix.
3Similar incentive sizes were used in Fryer (2013); Glewwe, Ilias, and Kremer (2010); Mbiti et al. (inpress); Muralidharan and Sundararaman (2011); Lavy (2002); Ladd (1999); Vigdor (2008). See Leigh (2012)for additional details.
4Both types of tests were conducted in control schools. However, the results of the “incentivized” testdid not trigger any payments in these schools.
2
range of students. This system retains the clarity of more basic single-proficiency thresh-old systems. Since teachers in developing contexts are generally unfamiliar with incen-tive schemes, such clarity can be an important factor in encouraging the widespreadacceptance of the system. Further, Miller and Babiarz (2013) argue that threshold (or“bright-line”) designs are well-suited for situations where the thresholds correspond toimportant goals or objectives. As reward payments for each skill were inversely pro-portional to the number of students that attained the skill, harder-to-obtain skills wererewarded more.5 Since the Levels system only requires students to be tested at the endof the year, it is simpler to implement than the Pay for Percentile system which requireslinked beginning and end of year student test scores. However, as rewards are based onabsolute learning levels, the system may disadvantage teachers who serve students frompoorer backgrounds.
We report two main findings. First, both types of teacher incentives are effectiveat improving learning outcomes compared to the control group, especially when weexamine the results from the incentivized tests. Focusing on the results at the end of thesecond year of the program, we find modest test score increases for students in Pay forPercentile schools relative to students in control schools. Using a composite measure oftest-scores across subjects (math and Kiswahili), students in this treatment arm scored.13σ higher (p-value .027) compared to the control group. The Levels treatment was alsoeffective at increasing student learning. At the end of the second year, the composite testscores of students in the Levels treatment were .22σ higher (p-value < 0.01) comparedto the control group.
Test score gains in both treatments were lower on the non-incentivized tests. Com-posite test scores increased by .044σ (p-value .31) and .096σ (p-value .037) in Pay forPercentile schools and Levels schools. As the test content was similar, the differencesin treatment effects are likely due to differences in student effort on test taking. Theincentivized tests involved the whole classroom and were typically used as official endof school year tests. This could induce teachers to encourage their students to exert(relatively) more effort on these tests. In contrast, the non-incentivized tests involveda smaller number of students and were conducted in a more inconspicuous manner.6
The effects of student test-taking effort on test scores has been documented in previous
5As bonus payments were determined ex-post based on pass rates, teachers face some uncertaintyabout the exact bonus sizes. We abstract from this by assuming an individual teacher’s effort wouldhave a negligible effect on the aggregate pass rate and that teachers have sufficient ex-ante information(e.g., through experience) to have reasonable predictions about the pass rates. Appendix B provides moredetails.
6Appendix C provides more details about the testing procedures.
3
studies such as Levitt, List, Neckermann, and Sadoff (2016), Gneezy et al. (2017), andMbiti et al. (in press).
Our second main finding suggests that the details of teacher incentive design mat-ter. Despite the theoretical advantages of the Pay for Percentile system, in this settingthe Levels incentive system was more effective at improving learning than the Pay forPercentile system. At the end of the second year, the estimated treatment effect onthe incentivized composite test score in Levels schools was .096σ higher (p-value .097)relative to the estimates for Pay for Percentile schools. The treatment effect on the non-incentivized composite test score shows a similar pattern, although the difference issmaller (.052σ) and statistically insignificant (p-value .29). The greater learning gains inLevels schools are also reflected in lower grade repetition rates in those schools relativeto Pay for Percentile schools. At the end of the second year, students in Levels schoolswere 3.3 percentage points less likely (p-value .048) to repeat a grade compared the stu-dents in the control group. As 14 percent of students in control schools repeated a grade,this represents a 25 percent reduction. This reduction in repetition among Levels schoolswas significantly different (p-value .041) from the limited (and insignificant) effect in thePay for Percentile treatment.
We also use a comprehensive set of survey data collected from school administrators,teachers, and students to shed light on theoretically relevant mechanisms. We do notfind any evidence of negative treatment effects on non-incentivized subjects such as sci-ence, suggesting that learning gains in incentivized subjects were not at the expense oflearning in other subjects. Despite the concerns that the Levels system may induce teach-ers to focus on marginal students, we find similar learning gains across all five quintilesof the student baseline test score distribution in the second year (using composite testscores) in both treatment arms.
Given the well-documented concerns about teachers misunderstanding incentive de-signs (Goodman & Turner, 2013; Fryer, 2013), teacher comprehension was high underboth systems, allowing us to rule out a differential lack of understanding as a majordriving factor. However, even if teachers understood how payments were made, those inthe Pay for Percentile schools may have had a relatively harder time determining how tobest react to the incentive. For instance, if teachers had limited information (or ambigu-ity) about the efforts and capabilities of other teachers in the tournament, they may havereduced their own effort in the Pay for Percentile scheme if they believed they were notcompetitive. Consistent with this notion, teachers in the Pay for Percentile schools re-ported they expected to receive 18 percent lower bonus payments, on average, comparedto their Levels counterparts. These lower expectations could have dampened teachers’
4
responsiveness to the incentives and reduced effort. In addition, teachers in the Levelssystem were better able to articulate clear and specific targets for their students on theincentivized tests, perhaps due to the clearer reward structure and salient thresholds.
Our study contributes to debate on the optimal design of teacher incentives. There areonly a limited set of adequately powered experimental studies that compare differentteacher incentive designs (e.g., Muralidharan and Sundararaman (2011); Loyalka et al.(in press); Fryer Jr, Levitt, List, and Sadoff (2012)).7 Our study provides the first evi-dence on the effectiveness of a novel multiple threshold incentive system tied to specificcurriculum objectives. In addition, it shows that such system can elicit greater effortfrom teachers and deliver greater learning outcomes in early grades when compared toa more sophisticated cost-equivalent rank-order tournament scheme. This highlights theimportance of the practical limitations of tournaments outlined in Charness and Kuhn(2011). In addition, salient learning targets, such as those used in our Levels design, canpromote teacher effectiveness, especially in settings where teacher capacity is relativelylimited.
Overall, our results are consistent with the existing evidence suggesting that teacherincentives tend to be more effective in contexts where there is low accountability in theeducation system (Imberman, 2015; Ganimian & Murnane, 2016; Glewwe & Muralidha-ran, 2016). However, only a limited number of studies have examined tournament styleteacher incentives, and we are only aware of two studies in developing country contextsthat specifically evaluate Pay for Percentile schemes (see Loyalka et al. (in press) andGilligan, Karachiwalla, Kasirye, Lucas, and Neal (2018)).8
Since education systems in developing countries face numerous challenges includingaccountability constraints and lower teacher capacity relative to global scales, evidencethat can provide policy makers with insights on the relative cost-effectiveness of pro-grams that can improve learning outcomes is especially important (World Bank, 2014,2018). Our results highlight the trade-offs faced by education authorities who have toconsider the effectiveness and feasibility of implementation of different teacher incentivedesigns, often with limited information about the education production function.
7There is a small but growing set of studies that compare the effectiveness of different types of providerincentives in the healthcare sector in developing countries. Examples include Singh and Masters (2018)and Mohanan, Donato, Miller, Truskinovsky, and Vera-Hernandez (2019).
8Loyalka et al. (in press) find that Pay for Percentile incentives increased test scores among mathteachers in Chinese schools. Gilligan et al. (2018) find that Pay for Percentile have no impact on studentlearning in Ugandan schools, except for top students in schools with textbooks. In the US context, Fryer Jret al. (2012) find that Pay for Percentile schemes are most effective when the rewards are framed as losses,where teachers are first given a lump sum payment, and then required to return part of the payment iftheir students do not meet the required targets.
5
2 Experimental Design
2.1 Context
Tanzania allocates about one-fifth of overall government spending (roughly 3.5 percentof GDP) to education (World Bank, 2017). Much of this spending has been devoted topromoting educational access. As a consequence, net enrollment rates in primary schoolincreased from 53 percent in 2000 to 80 percent in 2014 (World Bank, 2017). Despite thesegains in educational access, educational quality remains a major concern. Resourcesand materials are scarce. For example, in 2017 only 14 percent of schools had accessto electricity and just over 40 percent had access to potable water (World Bank, 2017).Nationwide, there are approximately 43 pupils per teacher (World Bank, 2017), althoughearly grades often have much larger class sizes. In 2013, approximately five pupils shareda single mathematics textbook, while 2.5 pupils shared a reading textbook (World Bank,2017). Student learning levels are also low. In 2012, data from nationwide assessmentsshowed that only 38 percent of children aged 9-13 are able to read and do arithmeticat the grade 2 level, suggesting that educational quality is a pressing policy problem(Uwezo, 2013).
The poor quality of education is driven in part by limited accountability in the ed-ucation system. Quality assurance systems (e.g., school inspectors) typically focus onsuperficial issues such as the state of the school yard, rather than on issues that mayaffect learning (Mbiti, 2016). The lack of accountability is further reflected in teacher ab-sence rates. Data from unannounced spot checks shows that almost a quarter of teacherswere absent from school, and only half of the teachers who were at school were in theclassroom (World Bank, 2011). As a result, almost 60 percent of planned instructionaltime is lost (World Bank, 2011).
Tanzanian teachers’ unions have been actively lobbying for better pay as a way toaddress quality concerns in the education system. Yet, the correlation between teachercompensation and student learning is extremely low (Kane, Rockoff, & Staiger, 2008;Bettinger & Long, 2010; Woessmann, 2011; de Ree, Muralidharan, Pradhan, & Rogers,2018). Moreover, teachers salaries are currently relatively high — approximately 500,000TZS per month (∼ US$300) or roughly 4.5 times GDP per capita (World Bank, 2017)— and approximately 60 percent of the education budget is devoted to teacher com-pensation.9 Despite the relatively attractive wages of Tanzanian teachers, the teachers’union called a strike in 2012 to demand a 100 percent increase in pay (Reuters, 2012; PRI,
9The average teacher in a sub-Saharan African country earns almost four times GDP per capita, com-pared to OECD teachers who earn 1.3 times GDP per capita (OECD, 2017; World Bank, 2017).
6
2013).10
2.2 Interventions and Implementation
The interventions in this study were developed in close collaboration with Twaweza, anEast African civil society organization that focuses on citizen agency and public servicedelivery. The interventions were part of a series of projects launched under a broaderprogram umbrella known as KiuFunza (‘Thirst for learning’ in Kiswahili).11
The KiuFunza program targets teachers in focal grades 1, 2 and 3 who are responsiblefor teaching the focal subjects Kiswahili, English and math (arithmetic). A budget ofUS$150,000 per year for teacher and head teacher incentives was split between the twotreatment arms in proportion to the number of students enrolled. As a result, the prizemoney in each treatment arm was approximately US$3 per student. All interventionswere implemented by Twaweza in partnership with EDI (a Tanzanian research firm) anda set of local district partners. Head teachers were offered a bonus of 20 percent of thecombined bonus of all incentivized teachers in his or her school.12
Within each intervention arm, Twaweza distributed information describing the pro-gram in early 2015 and 2016: first to focal grade and subject teachers and head teachers,then to their respective communities via public meetings. From the program’s onsetTwaweza informed teachers the program would last two years. The implementationteams also conducted mid-year school visits to re-familiarize teachers with the program,gauge teacher understanding of the bonus payment mechanisms, and answer any re-maining questions.
At the end of the school year, all students in grades 1, 2, and 3 in every school,including control schools, were tested in Kiswahili, English, and math. Because thistest was used to determine teacher incentive payments, it was considered “high-stakes”(from the teachers’ perspective). Our non-incentivized research test was conducted ona different day, but within a few weeks from the incentivized test. Both sets of testswere based on the Tanzanian curriculum and were developed by Tanzanian educationprofessionals using the Uwezo learning assessment framework.13 We provide additional
10In recent years, other teacher strikes to demand pay increases have occurred in South Africa, Kenya,Guinea, Malawi, Swaziland, Uganda, Benin and Ghana.
11The first set of interventions under this program were launched in 2013 and evaluated by Mbiti et al.(in press).
12Twaweza included head teachers in the incentive design to ensure that they would be stakeholders inimproving learning outcomes. Likewise, any scaled-up teacher incentive program would feature bonusesfor head teachers.
13Uwezo learning assessments have been routinely conducted in Kenya, Tanzania, and Uganda since2010.
7
details about the design and implementation of both types of tests in Appendix C.
2.2.1 Pay for Percentile design
The Pay for Percentile design used in our intervention is based on research by Barlevyand Neal (2012). They show that this incentive structure can, under certain conditions,induce teachers to exert socially optimal levels of effort. One important necessary con-dition for Pay for Percentile to induce optimal effort is that teachers believe they arecompeting in properly seeded (or fair) contests. To achieve this, the Pay for Percentileuses a modified rank-order tournament structure that accounts for the heterogeneity instudents baseline learning levels across classrooms (and teachers). Specifically, the sys-tem divides students into groups based on their academic achievement (or “ability”),and a separate rank-order tournament is conducted for each group. Teacher’s are thenrewarded on the basis of their students’ rank-order within each ability group. With-out this adjustment, teachers in schools that served students from affluent backgroundswould be advantaged, and those serving less-affluent students may be discouraged fromexerting effort.
In order to implement this system in practice, we created student groups with similarinitial learning levels based on test score data from the previous school year for eachsubject-grade combination. Students without test scores in second and third grade weregrouped together in an “unknown” ability group.14 Since none of the first grade studentshad incoming test scores, we created broad country-level ability groups and assigned allfirst grade students within a school to the same group based on the historical averagetest scores for the school. Thus, all first-grade students within a school were assigned tothe same group.15
To compute the payment structure, we divide the total prize money in this treatmentarm equally across grades and subjects. We then apportion the subject-grade budget toeach ability-group in proportion to the total number of students in the grade who are ineach ability-group. At the end of the year, we ranked students within each ability-groupaccording to their endline test score. Within each ability-group we assigned teacherspoints proportional to the rank of their students. For a given ability-group, a teacherwould receive 99 points for a student in the top 1% of the group and zero points for astudent in the bottom 1% of the group. In other words, the rewards increase linearlyin rank. The total amount of money paid per point is the same across all groups, in all
14Roughly 20% of students are grouped into the “unknown” ability group. This includes newly enrolledstudents, as well as students who were enrolled but for some reason were not tested at baseline.
15Our results are robust to excluding grade 1 students from the sample. See Table D.1 in Appendix D.
8

subjects, and in all grades.For example, suppose there is a total of US$1,000 for teacher incentives and that there
are two ability groups with 40 and 60 students. Accordingly, the total budget for teacherbonuses in each ability group would be US$400 and US$600. In each ability-group, thetotal bonus would be equal to the sum of all teacher rewards or
X =100
∑i=1
b ∗ (i− 1) ∗ N100
where X is the total budget for teacher bonuses in each ability group, N is the number ofstudents in each ability group, i indexes a student’s percentile rank on the endline test,and b is the teacher reward per point. Since ∑100
i=1(i− 1) = 4, 950, the reward per point (b)is roughly ∼US$0.20 for both groups. Thus, in this example if a student was in the top1% of the either ability-group, their teacher would earn 99 ∗ 0.2 or US$20. Conversely,a median student would earn their teacher 50 ∗ 0.2 or US$10. In the first year of ourstudy, the total bonus available to teachers in Pay for Percentile schools was US$70,820and total enrollment was 22,296. For each grade and subject, teachers earned US$1.77for each student in the top 1% and US$0.89 for each student in the 50th percentile.
Although this design can deliver socially optimal levels of effort, it may be challeng-ing to implement at scale, particularly in settings with weak administrative capacitysuch as Tanzania. For instance, maintaining child-level panel databases is a non-trivialadministrative challenge. Moreover, the Pay for Percentile system may prove difficult tograsp for teachers. It presents each teacher with a series of tournaments (for each abilitygroup in each subject that they teach) and therefore the bonus payoff is relatively hardto predict, even if the design guarantees a fair system. Furthermore, the uncertaintyintroduced by competing against teachers from schools across the whole country maydilute the incentive.
2.2.2 Proficiency thresholds (Levels) design
Proficiency based systems are easier for teachers to understand and provide more ac-tionable targets than rank-order or value-added tournaments. Consequently, such sys-tems are likely to increase motivation among teachers and head teachers; however, theyhave well-known limitations. For example, they are unable to adequately account fordifferences in the initial distribution of student preparation across schools and class-rooms. Moreover, this type of system can encourage teachers to focus on students closeto the proficiency threshold, at the expense of students who are well above or below
9
the threshold (Neal & Schanzenbach, 2010). To mitigate this concern, our Levels designfeatures multiple thresholds ranging from very basic skills to more advanced skills inthe curriculum. This design allows teachers to earn bonuses for helping a broader setof students, including students with lower and higher baseline test scores.16 Miller andBabiarz (2013) argue that incentive designs based on “bright-line” performance thresh-olds (and goals) can be effective in helping service providers to focus on achieving thesegoals. They also argue that bright-line designs are well suited to helping providers focuson achieving important outcomes.17
In Levels schools, teachers are paid in proportion to the number of skills students ingrades 1-3 are able to master in mathematics, Kiswahili, and English. The total budgetis split across grades in proportion to the number of students enrolled in each grade.The budget is then divided equally among subjects and skills within each subject. Forexample, suppose the budget allocated to one grade for demonstrating proficiency inaddition (a math skill) is US$1,000. If there are 500 students in the grade, and 250pass the addition portion of the math test, then a teacher would receive US$4 for everystudent in her class that was proficient in addition.
Table 1 shows the skills (i.e., the thresholds) tested in each grade-subject combinationand the corresponding (ex-post) payment per student that each teacher would receive.Since the per pass bonus paid ex-post is equal to the skill budget divided by the numberof students passing the skill, the budget for easier-to-obtain skills is spread across morestudents — resulting in a lower per-pass bonus. Conversely, harder-to-obtain skills havea higher per pass bonus. Thus, teachers have the potential to earn larger bonuses if theirstudents are proficient in a larger number of skills, especially harder-to-obtain skills.18
[Table 1 about here.]16As discussed in Appendix B, a key practical challenge is ensuring that the thresholds are sufficiently
close together to prevent teachers from ignoring students who fall between two thresholds.17In the health sector, Miller and Babiarz (2013) argue bright-lines may be especially appropriate when
thresholds have clinical significance (e.g., vaccination rates). In our early grade education setting, thefundamental nature of the numeracy and literacy thresholds in our design corresponds with this criteria.
18Enrollment at each school is on average 1.6% of total enrollment across Levels schools. Hence, we canrule out teachers strategically choosing how many students to push over a threshold to maximize earningsbecause the total number of her students passing the threshold has a negligible effect on the overall passrate across schools.
10
2.3 A Note on English Language Teaching
As Kiswahili is the official language of instruction in primary schools in Tanzania, En-glish is taught as a second language. However, English is rarely spoken outside of theclassroom, so English language skills are quite low in Tanzania. For instance, only 12percent of grade 3 students were proficient at the grade 2 level in English (Uwezo, 2012).Given the challenges of teaching English in Tanzania, the subject was removed from thenational curriculum in grade 1 and 2 in 2015 to allow teachers to focus on numeracyand literacy in Kiswahili in those grades. English was still taught in grade 3, under arevised curriculum. However, the Education Ministry provided little guidance on howto transition to the new curriculum and as a result, there was substantial variation inits implementation. Some schools stopped teaching English in 2015, while others con-tinued until 2016. In addition, there was no official guidance on whether to use grade1 English materials in grade 3, as no new books were issued that reflected the curricu-lum changes. To maintain consistency between the curriculum and KiuFunza incentives,Twaweza dropped English from the incentives in grade 1 and 2 in 2016, but includedgrade 3 English teachers. To avoid confusion, we also communicated that our end-of-year English test in 2016 would still use the pre-reform grade 3 curriculum. Given theseissues in the implementation of the curriculum reform, it is unclear how to interpret theresults for English. In addition, these estimates are less policy relevant after the reform.Therefore, in order to facilitate a clearer analysis, we only present results for mathemat-ics and Kiswahili in the main text. Table D.2 in Appendix D presents the effects of ourtreatments on English test scores in grade 3.
3 Data and Empirical Specification
3.1 Sample Selection
The teacher incentive programs were evaluated using a randomized design. First, 10districts were randomly selected (see Figure 1).19 The study sample of 180 schools wastaken from a previous field experiment — studied by Mbiti et al. (in press) — where allstudents in grades 1, 2, and 3 had been tested at the end of 2014. These tests provided thebaseline student-level test score information required to implement the Pay for Percentiletreatment. As mentioned above, the Pay for Percentile design will deliver optimal levels
19The program was implemented in 11 districts, as one district was included non-randomly by Twawezafor piloting and training. We did not survey schools in the pilot district.
11
of effort only if teachers believe they are competing in fair contests. Thus, having reliableinformation about student initial learning levels was key.20
Within each district, we randomly allocated schools to one of our three experimentalgroups. Thus, in each district six schools were assigned to the Levels treatment, sixschools to the Pay for Percentile treatment, and six schools served as controls. In total,there were 60 schools in each group. The treatment assignment was also stratified bytreatment of the previous RCT and by an index of the overall learning level of studentsin each school. Further details are provided in Appendix A.
[Figure 1 about here.]
3.2 Data and Balance
Over the two-year evaluation, our survey teams visited each school at the beginningand end of the school year. We gathered detailed information about each school fromthe head teacher, including: facilities, management practices, and head teacher charac-teristics. We also conducted individual surveys with the teachers in our evaluation todetermine personal characteristics, including education and experience, and effort mea-sures, such as teaching practices and teacher absence. In addition, we conducted twotypes of classroom observations, in which we recorded teacher-student interactions.
Within each school, we surveyed and tested a random sample of 40 students (10 stu-dents from grades 1, 2, 3, and 4). Grade 4 students were included in our research samplein order to measure potential spillovers to other grades. Students in grades 1, 2, and3 who were sampled in the first year of the program were tracked over the two-yearevaluation period. Students in grade 4 in the first year were not tracked into grade 5due to budget constraints. In the second year of the program we sampled an additional10 incoming Grade 1 students. We collected a variety of data from our student sampleincluding test scores, individual characteristics such as age and gender, and perceptionsof the school environment. Crucially, the test scores collected on the sample of studentsare “low-stakes” for teachers and students. We supplemented the results from this setof non-incentivized student tests with the results from the incentivized tests that wereused to determine teacher bonus payments and were conducted in all schools, includingcontrol schools. Most articles studying teacher performance pay use incentivized teststo measure the overall treatment effects. However, it is unclear whether incentivized or
20We do not have data on whether teachers believe they are competing in a fair contest. However, beforereceiving any payment over 90% of teachers agreed or strongly agreed that the amount paid by Twawezawill be a fair, suggesting teachers think the contests are fair.
12
non-incentivized tests are better for measuring treatment effects. We therefore presentresults from both tests for completeness.21
Although the content (subject order, question type, phrasing, difficulty level) is consis-tent across the incentivized and non-incentivized tests, there are a number of importantdifferences in the test administration. The non-incentivized test took longer (40 minutes)than the incentivized test (15 minutes). The non-incentivized test had more questionsin each subject to avoid bottom- and top-coding, and also included an “other subject”module at the end to test spillover effects. Further, even though both tests were adminis-tered individually to students, the testing environment was different. Non-incentivizedtests were administered during a regular school day by survey enumerators. In contrast,the incentivized test was more “official” as all students in grades 1-3 were tested on aspecified day. On the test day, a Twaweza test team would administer the tests in ded-icated classrooms, with head teachers and teachers managing the flow of students. Inaddition, most schools used the incentivized test as the official end-of-year test. A num-ber of measures were introduced to enhance test security. First, to prevent test-taking bynon-target grade candidates, students could only be tested if their name had been listedand their photo taken at baseline. Second, each student was assigned one test randomlyselected out of ten test versions to prevent copying during the test and to reduce thebenefits of leakage. Finally, tests were handled, administered, and electronically scoredby Twaweza teams without any teacher involvement.
Most student, school, teacher, and household characteristics are balanced across treat-ment arms (See Table 2, Column 4). The average student in our sample was 8.9 yearsold in 2013, went to a school with 679 students, and was taught by a teacher who was 38years old. We were able to track 88% of students in our sample at the end of the secondyear, with no differential attrition. Teacher turnover rates over the two-year study periodwere generally balanced across treatments (see Table D.3 in the Appendix D.).
[Table 2 about here.]21As argued by Mbiti et al. (in press): “The confirmation that test-taking effort is a salient component of
measured test scores by Levitt et al. (2016) and Gneezy et al. (2017) presents a conundrum for educationresearchers as to what the appropriate measure of human capital should be for assessing the impact ofeducation interventions. On one hand, low-stakes tests may provide a better estimate of a true measure ofhuman capital that does not depend on external stimuli for performance. On the other hand, test-takingeffort is costly, and students may not demonstrate their true potential under low-stakes testing, in whichcase, an ‘incentivized’ testing procedure may be a better measure of true human capital.”
13

3.3 Empirical Specification
We estimate the effect of our interventions on students’ test scores using the followingOLS equation:
Zisdt = δ0 + δ1Levelss + δ2P4Pctiles + δ3Zisd,t=0 + Xiδ4 + Xsδ5 + γd + γg + εisdt, (1)
where Zisdt is the test score of student i in school s in district d at the end of year t.Levels and P4Pctile are binary variables which capture the treatment assignment of eachschool. Xi is a series of student characteristics (age, gender and grade), Xs is a set ofschool characteristics including facilities, students per teacher, school committee charac-teristics, average teacher age, average teacher experience, average teacher qualifications,the fraction of female teachers, and the stratification dummies. γd is a set of district fixedeffects, and γg is a set of grade fixed effects.
We scale our test scores using an Item Response Theory (IRT) model and then nor-malize them using the mean and standard deviation of the control schools to facilitatea clear interpretation of our results. We include baseline test scores and district fixedeffects in our specifications to increase precision.22
We examine the impact of the incentives using both the non-incentivized and incen-tivized testing data. However, given the limited set of student characteristics in the in-centivized test data, this analysis includes fewer student level controls. We use a similarspecification to examine teachers’ behavioral responses.
4 Results
In this section, we first explore how both incentive systems affected student test scoresand grade repetition. We then explore whether the incentives increase observable teachereffort. We then turn to heterogeneity by students and teacher characteristics. Finally, weexplore some possible mechanisms that could explain our results on test scores.
4.1 Test Scores
We present the estimated treatment effects of the incentive programs on student learningusing data from both the non-incentivized test (Table 3, Panel A) and the incentivizedtest (Table 3, Panel B). As discussed earlier, we focus our main analysis on math and
22We also balanced the timing of our survey activities, including the non-incentivized tests, acrosstreatment arms. Hence, the results are not driven by imbalanced survey timing.
14
Kiswahili due to the curriculum changes that occurred. We provide estimates of theintervention on English test scores in Table D.2 in Appendix D. To ameliorate concernsdue to multiple testing, we present a composite index of learning computed using anItem Response Theory model.
In the first year, both incentive schemes resulted in small but imprecisely estimatedchanges in test-scores on the non-incentivized test. Focusing on the composite learningindex (Panel A, Column 3), test-scores increased by about .057σ (p-value .24) in Levelsschools relative to the control group. Test scores were -.029σ smaller (p-value .46) inPay for Percentile schools relative to control schools. In the second year of the program,the estimated treatment effects on the non-incentivized test are generally larger than thefirst-year estimates (Panel A, Columns 4-6). Test scores on the composite index increasedby .096σ (p-value .037) in Levels schools and .044σ (p-value .31) in Pay for Percentileschools.
Most of the existing literature on teacher incentives relies on data from incentivizedtests that are used to determine teacher rewards (Muralidharan & Sundararaman, 2011;Fryer, 2013; Neal & Schanzenbach, 2010). Following this norm, we also present thetreatment effects of our interventions using incentivized exams (Panel B). Generally,the estimated treatment effects are larger compared to those estimated using the non-incentivized test (Panel A). In the first year of the program our composite measure oflearning was .17σ higher (p-value < 0.01) in Levels schools relative to the control group,and .059σ higher in Pay for Percentile schools but this was not statistically significant (p-value .28, see Column 3). In the second year, learning was .22σ higher (p-value < 0.01)in Levels schools and .13σ higher (p-value .027) in Pay for Percentile schools.23
The estimated treatment effects (on the incentivized test) for Levels schools are com-parable with those found in previous RCTs in India and Mexico (Muralidharan & Sun-dararaman, 2011; Behrman, Parker, Todd, & Wolpin, 2015). The estimated effects forthe Pay for Percentile design are lower than those found in Loyalka et al. (in press),but larger than those in Gilligan et al. (2018).24 In addition, the results suggest that theLevels design outperforms the Pay for Percentile design. Focusing on the composite testscores, the estimated differences between the incentive designs (α3 and β3 in Columns 3and 6) are always negative (i.e., Levels outperforms Pay for Percentile), and statisticallysignificant in three out of four cases.
23The treatment effects on threshold specific pass rates are shown in Tables D.4- D.7 in Appendix D.24For the full sample Gilligan et al. (2018) find that Pay for Percentile incentives have a small (0.01σ)
and statistically insignificant effect on learning. However, there is important heterogeneity in treatmenteffects. In schools with books, Pay for Percentile incentives improve learning outcomes by 0.11σ on thegrade-relevant sub-test. In schools without books, there is no significant treatment effect on learning.
15
The larger treatment effects found in the incentivized test are likely driven by test-taking effort, where teachers had incentives to motivate their students to take the testsseriously. The importance of student test-taking effort has been documented in other set-tings such as an evaluation of teacher and student incentives in Mexico City (Behrmanet al., 2015). As discussed in Section 3.2, administration of the incentivized test wastightly controlled by our implementation team. This mitigates any concerns about out-right cheating. Assuming that all the differences between our incentivized and non-incentivized results are driven by test-taking effort, student effort can increase test scoreresults between 0.016σ and 0.11σ (see Panel C). This is generally in line with the findingsof Gneezy et al. (2017) and Levitt et al. (2016).
Given the reward structure, teachers in both treatment arms were motivated to en-sure that their students took the incentivized test. There were no incentives to excludeacademically-weaker students because learning gains from all students would be re-warded. In the second year of the study, teachers in the Levels schools were able toincrease student participation in the incentivized test by 5 percentage points. Their coun-terparts in Pay for Percentile schools increased participation by 3 percentage points (seeTable D.8 in Appendix D). Following Lee (2009), we compute bounds on the treatmenteffects by trimming the excess test takers from the left and right tails of the incentivizedtest distribution. Focusing on the year-two results for brevity, the 95% confidence inter-val for the treatment effects from this bounding exercise for math is from -0.023 to 0.32in the Levels treatment and 0.014 to 0.17 in the Pay for Percentile treatment. The boundsfor Kiswahili range from 0.027 to 0.35 in the Levels and -0.0032 to 0.17 in the Pay forPercentile (see Table D.9 in Appendix D).
As discussed previously, we had limited information to properly group grade 1 stu-dents in Pay for Percentile schools. As this may limit the effectiveness of the Pay forPercentile scheme, we examine the effects of our interventions by focusing on grade 2and 3 students, where we are able to appropriately group most students by ability. Ourresults are generally robust to this sample restriction (see Table D.1 in Appendix D.).
[Table 3 about here.]
4.2 Grade repetition
Cross-country comparisons reveal there is a negative correlation between income percapita and the grade repetition rate in primary school (Manacorda, 2012). Grade rep-etition is commonplace in developing countries, and is thought to impose significant
16
individual and social costs, such as an increase in the probability that a student dropsout of school (Manacorda, 2012).
In Tanzania, the introduction of the 3R (Reading, wRiting and aRithmetic) curriculumin 2015 was accompanied by a change in grade repetition policy in grades 1, 2 and 3.Promotion is no longer automatic and pupils who do not master basic skills can be forcedto repeat, based on a decision by the school committee (automatic promotion remainsin place after grade 3). Thus, we can use grade repetition as an additional outcomemeasure of learning in early grades.
We examine the impact of both treatments on grade repetition in Table 4. In 2015, thefirst year of both the incentive program and the new retention policy, we do not find anystatistically significant changes in repetition rates in Levels or Pay for Percentile schools(Column 1). At the end of the second year, repetition rates in Levels schools were 3.3percentage points lower than the control group (p-value .048), a 24 percent reduction.Among students in Pay for Percentile schools there was a small positive and statisticallyinsignificant effect on grade repetition. Formal hypothesis tests show that the estimatedreduction in repetition in Levels schools was significantly lower (p-value .041) comparedto the estimated change in Pay for Percentile schools. Given that repetition rates reflectacademic performance, this provides additional evidence that the Levels system leads togreater learning improvements than the Pay for Percentile system.
[Table 4 about here.]
4.3 Spillovers to Other Grades and Subjects
As the teacher incentives only covered numeracy and literacy in grades 1, 2, and 3, apotential concern is that teachers and schools focus on these grades and subjects to thedetriment of other grades and subjects. For example, schools may shift resources such astextbook purchases from higher grades to grades 1, 2, and 3. In addition, teachers maycut back on teaching non-incentivized subjects such as science. On the other hand, if ourincentive programs improve literacy and numeracy skills, they may promote studentlearning in other subjects and these gains may persist over time. In order to assesspossible spillovers, we examine test scores in science for grades 1, 2, and 3. We alsoexamine test scores in grade 4 to test for any negative spillovers in higher grades, as wellas the persistence of any learning gains induced by the program (in the second year ofthe evaluation).
17

Overall, we do not see decreases in test scores of fourth graders, which suggests thatschools were not disproportionately shifting resources away from higher grades (Table5, Panel A). In the first year of the program, composite test scores for grade 4 students inLevels schools increased by .099σ (p-value .052) (Column 3). In Pay for Percentile schools,we find relatively small (-.027σ) and statistically insignificant (p-value .59) effects oncomposite test scores. Since we tested fourth-grade students and collected informationon those students at baseline, we conjecture that fourth-grade teachers assumed theywould be included in the incentives. As a result of this belief, they may have exertedeffort in the first year, but not in the second year once their non-eligibility had beenconfirmed. This type of spillover was also documented by Kremer, Miguel, and Thornton(2009), where a student incentive program for girls improved the performance of non-eligible boys who believed they would also benefit from the program.25
As third graders in the first year of our program transitioned to the fourth grade in thesecond year of the program, the fourth-grade results in the second year suggest that thelearning gains from both incentive programs fade over time (Table 5, Panel A, Columns4 to 6).
Contrary to the concerns of teacher performance pay critics, the effects of both pro-grams on science test scores are generally positive, suggesting that any estimated gainsattributable to the incentives are not coming at the expense of learning in other subjectsor domains that are not directly incentivized (see Table 5, Panel B).
[Table 5 about here.]
4.4 Teacher Effort
Since the treatments were designed to elicit teacher effort, in this section we examineteacher responsiveness to the incentives. We use teacher presence in school and in theclassroom as broad measures of teacher effort. Teacher presence was measured by oursurvey team and was collected shortly after our team arrived at a school in the morn-ing. Overall, we do not find any effect in this dimension of teacher effort across ourtreatments (see Table 6, Panel A). We use data from student reports to examine addi-tional dimensions of teacher effort in Panel B. According to students, teachers do not
25We also test for any spillover effects on the seventh grade primary school national exit exam (PSLE).We do not find any evidence that our incentives affected students performance on those tests. See TableD.10 in Appendix D.
18
provide any extra support in response to either treatment (Panel B, Column 1). Rela-tive to the control group, teachers do not assign more (or less) homework to studentsin either treatment. However, there are diverging patterns in the estimated coefficients.Students in the Levels treatment report a small (but statistically insignificant) increase inhomework, while students in Pay for Percentile schools report a small (but statisticallyinsignificant) reduction in homework. Formal hypothesis tests show that the differencein these estimates is statistically significant (p-value .065), suggesting that teachers as-signed relatively more homework in Levels schools (Panel B, Column 2). There is alsoevidence that the treatments altered the interactions between students and teachers. Stu-dents in Levels schools were 8 percentage points (p-value .033) more likely to report thatthe teacher called them by name in class. Students in Pay for Percentile schools reporteda 4.7 percentage point (p-value .14) increase. Corporal punishment is very common inTanzania. Almost 40 percent of students in the control group report had experiencedsome form of corporal punishment during the school year. Our results suggest thatboth incentives reduced incidences of corporal punishment. Students in Levels schoolsreported a 3 percentage point reduction (p-value .39) in corporal punishment. The re-ported reduction in Pay for Percentile schools was 6.1 percentage points (p-value .056).Overall, the results suggest that teacher incentives can foster a more positive learningenvironment in the classroom.
[Table 6 about here.]
In addition, we measure teacher effort using two sets of classroom observations. First,we conducted “external classroom observations,” where our survey teams observedteacher behavior by standing outside the classroom for several minutes to prevent dis-ruptions.26 We also conducted within-classroom observations following the World BankService Delivery Indicator protocols. However, in-class observations are often affectedby Hawthorne effects, which can reduce the usefulness of these protocols (Muralidharan& Sundararaman, 2010). Even though the external observations are less detailed, theyare arguably better able to capture broad measures of teacher behavior because theyare not affected by Hawthorne effects. We therefore focus on measures from the exter-nal observations and present the results from the in-class observations in Table D.11 inAppendix D.
26Schools in Tanzania have open layouts where classrooms are built around an open space in the middle.This layout allows surveyors to simply stand in the open space and observe the class from a distancethrough the windows.
19
Our findings using the external observations are shown in Table 7. For brevity, wefocus on the estimated differences between the two incentive systems reported in thebottom row (α3). We do not find any statistically significant differences in the likelihoodthat teachers were observed to be actively teaching, although the point estimates arelarger for Levels teachers (Column 1). Teachers in Pay for Percentile schools were 2.2percentage points (almost 50 percent) less likely to be engaged in classroom manage-ment activities (such as taking attendance or disciplining students) compared to Levelsteachers (Column 2). Teachers in Pay for Percentile schools were also 7.7 percentagepoints (29 percent) more likely to be off-task or engaged in unrelated activities such asreading a newspaper or sending a text message (Column 3). Finally, we do not observedifferences between the two incentives in distracted or off-task students, although thecoefficient on Pay for Percentile schools shows a larger reduction in student distraction(Column 4).
[Table 7 about here.]
4.5 Heterogeneity by Student Characteristics
In this section, we explore the heterogeneity in treatment effects across the distributionof student baseline composite test scores in Figure 2 (for the non-incentivized tests) andFigure 3 (for the incentivized tests).27
In the first year of the program, we find suggestive evidence that teachers in bothsystems focused their attention on the best students. This pattern is more pronounced inPay for Percentile schools where we can reject that the estimated learning gains are thesame for all quintiles (p-value 0.016). In the second year of the program, the treatmenteffects were more balanced across the distribution of students and we fail to reject thehypothesis that the treatment effects of each quintile are equal.28 Our first year resultsfor the Pay for Percentile treatment are in line with Gilligan et al. (2018) who find thatlearning gains were greater for above median students, especially in schools with books.Our second year results for the Pay for Percentile treatment are in line with Loyalka etal. (in press) who find learning gains across the entire distribution of students.
[Figure 2 about here.]27We also explore heterogeneity by additional student characteristics such as gender, as well as school
characteristics such as pupil teacher ratio, and find limited evidence of heterogeneity in those characteris-tics (see Tables D.12 and D.13 in Appendix D for details).
28Subject specific results are available in Figures D.1 - D.4 in Appendix D.
20
[Figure 3 about here.]
4.6 Heterogeneity by Teacher Characteristics
Empirical evidence shows that women are more averse to competition and exert rel-atively less effort than men in competitive situations such as rank-order tournaments(Niederle & Vesterlund, 2007, 2011). However, we do not find any significant hetero-geneous treatment effects by gender (Table 8, Column 1). We also do not find anyheterogeneous effects by teacher age, which proxies for experience.
Although previous studies (e.g., Metzler and Woessmann (2012) and Bietenbeck, Pi-opiunik, and Wiederhold (2018)) have shown that teacher content knowledge is predic-tive of student learning outcomes, we do not find any significant heterogeneity in ourtreatment effects by teacher content knowledge, measured by our survey team throughmath and word association tests (Column 3). More effective teachers, as measured bythe head teacher’s performance rating, were more responsive on average to the Levelsincentives compared to teachers in Pay for Percentile schools (Column 4). Teacher’swho were more confident in their teaching abilities responded more to both incentives(Column 5).
[Table 8 about here.]
4.7 Why are treatment effects different across both programs?
We examine potential mechanisms that could drive differences in behavior and outcomesbetween the two types of incentives, with a particular focus on differences in the incen-tive structures of the two systems. For instance, the Levels system is easier to understandand could provide clear learning targets for classrooms, relative to the Pay for Percentilesystem. This difference in clarity could also affect teachers’ expectations about their po-tential rewards from the incentive programs, which would ultimately affect the level ofeffort exerted.
Teachers understand both programs. Complex teacher incentive programs may be lesseffective if teachers cannot understand the program details and therefore do not opti-mally allocate their effort (Goodman & Turner, 2013; Loyalka et al., in press). Theseconcerns are potentially more important in contexts with weak management capacity,
21
which may be less able to effectively disseminate the details of a complex incentive pro-gram to teachers. Because the Pay for Percentile system is more complex, our resultsmay reflect differences in teacher understanding of the incentive systems. To reducethese concerns, we developed culturally appropriate materials, including Q&A formats,examples, and illustrations, which we used to communicate the details of the incentiveprogram to teachers. For example, in Pay for Percentile schools we explained that stu-dents would be grouped into separate contests based on their initial abilities, ensuringthat each contest would be fair. To make our explanation clear, we used an analogy ofa footrace. We explained that a race featuring one fast runner competing against sloweropponents would not be fair. A fairer system would group runners into separate racesbased on their speed.29
During baseline and midline school visits, teams reinforced teachers’ familiarity withthe main features of the program. During our visits, we tested teachers to ensure theyunderstood the details of the incentive program they were assigned to. We then con-ducted a review session to discuss the answers to the test questions to further ensurethat teachers understood the design details. Because we asked different questions dur-ing each survey round (baseline, midline and endline), we cannot compare the trends inunderstanding over time. However, despite the lack of temporal comparability, teachercomprehension was generally high and roughly equal across both types of incentiveprograms. For example, at the end of the second year 70% of teachers in Level schoolsknew that the amount of money paid per skill obtained by their students depended onthe total number of students that pass across Tanzania. Over 90% of teachers in Pay forPercentile schools were aware that a student from a low ability group ranked at the topof his group at the end of the year would give him or her a larger bonus than a studentin the highest ability group ranked low among their peers.30
Teachers expect higher earnings in the Levels system. Even though we equalized thebudgets across treatments, it is still possible that teachers’ beliefs about their potentialearnings could differ across the two incentive systems. In the Pay for Percentile system,the fact that the final bonus payment depends on the relative performance of otherteachers in schools across the country is more salient. Hence, teachers may be less
29We worked closely with Twaweza’s communications unit to develop our dissemination strategy andcommunications. The communications unit is experienced and highly specialized in developing materialsto inform and educate the general public in Tanzania.
30Although teacher understanding was relatively high, we also test for heterogeneity in treatment effectsby teachers’ understanding (at endline). We do not find any significant relationship between teacherunderstanding and student test scores. The results are shown in Table D.14 in Appendix D.
22
confident about their ability to receive large payouts compared to their peers in theLevels treatment, where payouts are determined by students’ proficiency levels. Priorto payout of the bonuses, we collected data on teachers’ earnings expectations from theincentives, as well as their beliefs about their performance relative to other teachers in thedistrict. As these questions were only applicable to teachers in the incentive programs,we compare teachers in the Pay for Percentile arm to the Levels scheme, which serves asthe omitted category in Table 9.
Teachers in Pay for Percentile schools had lower bonus earnings expectations com-pared to their peers in the Levels system. They expected almost 95,000 TZS (US$ 42) lessin bonus payments than teachers in the Levels system. This represents an 18% reductionin bonus expectations relative to the mean expectations of teachers in the Levels system(Column 1) and 36% of the realized mean bonus payment in 2016. The lower expecta-tions among Pay for Percentile teachers could be driven by the greater uncertainty ofearnings in rank-order tournaments such as Pay for Percentile systems. While the com-petitive pressure can be motivating, it can also be demotivating if an individual teacherhas low subjective beliefs about their probability to win relative to the probability ofcompetitors winning.
We also examine differences in teachers’ beliefs about their relative ranking withintheir district based on their (expected) bonus winnings in columns 2 to 4. Overall, we donot find any differences across the treatments in teachers’ beliefs about their rankings.Teachers were optimistic about their projected earnings: Only 9 percent of teachers ex-pected to be among the bottom earners (Column 2) and 7 percent were worried aboutearning a low bonus (Column 5). On the other hand, 80 percent expected to be amongthe top earners in the district (Column 4).
[Table 9 about here.]
Goal setting is easier for teachers in the Levels system. In addition to being relativelyeasier to understand, the Levels system provides teachers with a clear set of learningtargets and goals for their students. This can help guide their instructional strategies andareas of focus in the classroom, and perhaps even support individualized coaching.31
Our surveys collected information on the professional goals that teachers had set forthe academic year. In Table 10 we test whether the treatments affected teachers’ goal
31Recent papers in behavioral economics provide evidence on general productivity effects of settinggoals, for example Koch and Nafziger (2011); Gomez-Minambres (2012) and Dalton, Gonzalez, and Nous-sair (2015).
23
setting behavior. We do not find any differences in the likelihood of setting goals for thegeneral school exams between teachers in the treatment schools and their counterpartsin the control group (Column 1). However, teachers in the Levels system were almost 8percentage points more likely to have set goals for the incentivized Twaweza test thancontrol group teachers (Column 2). In contrast, teachers in Pay for Percentile schoolswere 2.5 percentage points (p-value .34) more likely to have set goals for the Twawezatest (Column 2). Although we cannot reject the equality of the two estimates, the resultsprovide some suggestive evidence that the Levels systems facilitated more goal-settingon the incentivized (Twaweza) test. Our surveys also collected information about specificteacher goals on the Twaweza test. Because Twaweza tests were administered in allschools, we were able to collect this information from teachers in treatment and controlschools. Teachers in both types of incentives schools were approximately 7 percentagepoints more likely to set a general goal (e.g., “I want my students to pass”) for the testthan teachers in control schools (Column 3). Additionally, teachers in Levels schoolswere almost 10 percentage points more likely to set a specific numerical target (e.g., “Iwant 50 percent of my students to pass”) for the Twaweza incentivized test, comparedto just under 4 percent of teachers in Pay for Percentile schools (Column 4). Althoughthese differences are not statistically significant, the point estimates in Column 2 and 4suggest greater incidences of goal-setting among teachers in the Levels design.32
[Table 10 about here.]
5 Cost-effectiveness
We use accounting records to examine the cost-effectiveness of our interventions, fol-lowing the framework outlined in Dhaliwal, Duflo, Glennerster, and Tulloch (2013). Thetotal annual cost of the teacher incentive programs was US$ 7.23 per student. This costestimate includes both the direct costs (value of incentive payments) as well as the imple-mentation costs (test design and implementation, communications, audit, transfer costs,etc.) of the program. However, the cost in the long run of the Pay for Percentile scheme
32This finding, in combination with the overall incentive effects, provides a link between our paperand a fast growing empirical literature that finds positive associations between quality of managementpractices (including provision of clear and well-defined targets, performance measurement and feedback,and setting performance related rewards and sanctions) and organizational goal achievement (Bloom,Lemos, Sadun, Scur, & Van Reenen, 2014).
24
is US$ 1.50 higher (US$ 8.73 total) due to pre-testing costs to determine ability groups.33
For each intervention, we use the treatment effect on the composite index in the in-centivized test in the second year to compute cost-effectiveness. We focus on the incen-tivized test to facilitate comparability with other teacher incentive studies. Since the Payfor Percentile treatment effects is 0.13σ in the second year, the cost-effectiveness of theintervention is 1.48σ per US$ 100 spent per child. The Levels treatment effects is 0.22σ,implying a cost-effectiveness of 3.04σ per US$ 100 spent per child. These estimatessuggest that both programs are cost-effective compared to several other interventionsin developing countries analyzed in the overview by (Kremer, Brannen, & Glennerster,2013). For instance, the Levels treatments, our intervention is more cost-effective thana computer-assisted learning program evaluated in India (1.54σ per US$ 100), but lesseffective than the incentive program on attendance in India (2.28σ per US$ 100).
6 Conclusion
We use a randomized controlled trial to compare the effectiveness of two differentteacher incentive programs aimed at improving early-grade learning in Tanzanian publicschools. Specifically, we compare the effectiveness of an innovative multiple-thresholdproficiency incentive design relative to an ostensibly more sophisticated, rank-ordertournament-style Pay for Percentile system in terms of their impact on student testscores.
We report two main findings. First, both programs lead to increases in test scores,compared to students in the control group. Second, despite the theoretical advantage ofthe Pay for Percentile system, our multiple threshold proficiency system was more ef-fective at increasing test scores and reducing grade repetition than the Pay for Percentilesystem.
Our results demonstrate some of the theoretical and practical considerations facingeducation authorities interested in adopting teacher incentive programs. Although rank-order tournament schemes can provide powerful incentives to increase effort, such sys-tems can be more opaque, making it harder for teachers to determine how to best exerteffort. By contrast, the multiple threshold proficiency system used in this study com-
33The costs of pre-treatment testing required in Pay for Percentile for Grades 2 and 3 are not includedin the cost figure, since this cost would only be incurred once (ability groups could be based on endlinedata after the first year of implementation). Our calculations also assume similar data management costsfor both programs, even though in reality the Pay for Percentile data costs were higher due to tasks suchas preparing the ability groups and programming the payment calculations. However, these are largelyfixed costs and relatively small relative to the variable costs, especially at scale.
25
municates clear student-level targets. These salient targets provide teachers with clearsignals about how to allocate their effort in the class. Since developing countries are of-ten faced with implementation capacity constraints, the multiple threshold system maybe particularly well suited for these contexts given its relative administrative simplicity.Further, such a system is arguably better suited for early grades, where the curriculumis focused on a narrower set of key learning milestones such as number recognition andsubtraction. Consequently, this incentive system can serve as an important complementto “teaching at the right level” programs, and education reforms that scale back overlyambitious curricula in early grades (Cunningham, 2018).
An important caveat is that our results focus on short run outcomes. In the longrun, concerns about gaming the system (e.g., teaching to the test) will be greater. Sincerank-order tournaments (such as Pay for Percentile) allow education systems to usedifferent tests and test-formats, they can minimize these concerns if administrators havethe willingness and capacity to implement such testing changes. Longer run studiesconducted at scale will be needed to better understand the long run advantages anddisadvantages of different teacher incentive systems.
References
Alger, V. E. (2014). Teacher incentive pay that works: A global survey of programs that improvestudent achievement.
Barlevy, G., & Neal, D. (2012). Pay for percentile. American Economic Review, 102(5),1805-31. Retrieved from http://www.aeaweb.org/articles.php?doi=10.1257/aer
.102.5.1805 doi: 10.1257/aer.102.5.1805Barrera-Osorio, F., & Raju, D. (in press). Teacher performance pay: Experimental evi-
dence from Pakistan. Journal of Public Economics.Behrman, J. R., Parker, S. W., Todd, P. E., & Wolpin, K. I. (2015). Aligning learning
incentives of students and teachers: Results from a social experiment in Mexicanhigh schools. Journal of Political Economy, 123(2), 325-364. Retrieved from https://
doi.org/10.1086/675910 doi: 10.1086/675910Bettinger, E. P., & Long, B. T. (2010, August). Does cheaper mean better? the impact
of using adjunct instructors on student outcomes. The Review of Economics andStatistics, 92(3), 598-613. Retrieved from http://ideas.repec.org/a/tpr/restat/
v92y2010i3p598-613.html
Bietenbeck, J., Piopiunik, M., & Wiederhold, S. (2018). Africa’s skill tragedy does teach-ers’ lack of knowledge lead to low student performance? Journal of Human Re-
26
sources, 53(3), 553–578.Bloom, N., Lemos, R., Sadun, R., Scur, D., & Van Reenen, J. (2014). The new empirical
economics of management. Journal of the European Economic Association, 12(4), 835–876.
Bruns, B., Filmer, D., & Patrinos, H. A. (2011). Making schools work: New evidence onaccountability reforms. World Bank Publications.
Charness, G., & Kuhn, P. (2011). Lab labor: What can labor economists learn from thelab? In Handbook of labor economics (Vol. 4, pp. 229–330). Elsevier.
Chetty, R., Friedman, J. N., & Rockoff, J. E. (2014a). Measuring the impacts of teachersi: Evaluating bias in teacher value-added estimates. American Economic Review,104(9), 2593–2632.
Chetty, R., Friedman, J. N., & Rockoff, J. E. (2014b). Measuring the impacts of teachersii: Teacher value-added and student outcomes in adulthood. American EconomicReview, 104(9), 2633–79.
Contreras, D., & Rau, T. (2012). Tournament incentives for teachers: evidence froma scaled-up intervention in Chile. Economic development and cultural change, 61(1),219–246.
Cunningham, R. (2018). Unicef think piece series: Curriculum reform. Retrieved fromhttps://www.unicef.org/esaro/EducationThinkPieces 5 CurriculumReform
.pdf (UNICEF Eastern and Southern Africa Regional Office, Nairobi)Dalton, P. S., Gonzalez, V., & Noussair, C. N. (2015). Paying with self-chosen goals: Incen-
tives and gender differences. (CentER Discussion Paper Series No. 2016-036)de Ree, J., Muralidharan, K., Pradhan, M., & Rogers, H. (2018). Double for nothing?
experimental evidence on an unconditional teacher salary increase in indonesia*.The Quarterly Journal of Economics, 133(2), 993-1039.
Dhaliwal, I., Duflo, E., Glennerster, R., & Tulloch, C. (2013). Comparative cost-effectiveness analysis to inform policy in developing countries: a general frame-work with applications for education. Education Policy in Developing Countries, 285–338.
Ferraz, C., & Bruns, B. (2012). Paying teachers to perform: The impact of bonus pay inPernambuco, Brazil. Society for Research on Educational Effectiveness.
Fryer, R. G. (2013). Teacher incentives and student achievement: Evidence from NewYork City public schools. Journal of Labor Economics, 31(2), 373–407.
Fryer Jr, R. G., Levitt, S. D., List, J., & Sadoff, S. (2012). Enhancing the efficacy of teacherincentives through loss aversion: A field experiment. NBER Working Paper(18237).
Ganimian, A. J., & Murnane, R. J. (2016). Improving education in developing countries:
27
Lessons from rigorous impact evaluations. Review of Educational Research, 86(3),719–755.
Gilligan, D., Karachiwalla, N., Kasirye, I., Lucas, A., & Neal, D. (2018). Educator incentivesand educational triage in rural primary schools. (mimeo)
Glewwe, P., Ilias, N., & Kremer, M. (2010). Teacher incentives. American EconomicJournal: Applied Economics, 2(3), 205-27. Retrieved from http://www.aeaweb.org/
articles.php?doi=10.1257/app.2.3.205 doi: 10.1257/app.2.3.205Glewwe, P., & Muralidharan, K. (2016). Chapter 10 - improving education outcomes
in developing countries: Evidence, knowledge gaps, and policy implications. InS. M. Eric A. Hanushek & L. Woessmann (Eds.), (Vol. 5, p. 653 - 743). Elsevier.
Gneezy, U., List, J. A., Livingston, J. A., Sadoff, S., Qin, X., & Xu, Y. (2017, November).Measuring success in education: The role of effort on the test itself (Working Paper No.24004). National Bureau of Economic Research. doi: 10.3386/w24004
Gomez-Minambres, J. (2012). Motivation through goal setting. Journal of EconomicPsychology, 33(6), 1223 - 1239. Retrieved from http://www.sciencedirect.com/
science/article/pii/S0167487012000967 doi: https://doi.org/10.1016/j.joep.2012.08.010
Goodman, S. F., & Turner, L. J. (2013). The Design of Teacher Incentive Pay and Edu-cational Outcomes: Evidence from the New York City Bonus Program. Journal ofLabor Economics, 31(2), 409 - 420. Retrieved from http://ideas.repec.org/a/ucp/
jlabec/doi10.1086-668676.html
Hanushek, E. A., & Rivkin, S. G. (2012). The distribution of teacher quality and implica-tions for policy. Annu. Rev. Econ., 4(1), 131–157.
Imberman, S. A. (2015). How effective are financial incentives for teachers? IZA Worldof Labor.
Kane, T. J., Rockoff, J. E., & Staiger, D. O. (2008, December). What does certificationtell us about teacher effectiveness? evidence from New York City. Economics ofEducation Review, 27(6), 615-631. Retrieved from http://ideas.repec.org/a/eee/
ecoedu/v27y2008i6p615-631.html
Koch, A., & Nafziger, J. (2011). Self-regulation through goal setting. The ScandinavianJournal of Economics, 113(1), 212-227. Retrieved from https://onlinelibrary.wiley
.com/doi/abs/10.1111/j.1467-9442.2010.01641.x doi: 10.1111/j.1467-9442.2010
.01641.xKremer, M., Brannen, C., & Glennerster, R. (2013). The challenge of education and
learning in the developing world. Science, 340(6130), 297–300.Kremer, M., Miguel, E., & Thornton, R. (2009). Incentives to learn. The Review of Economics
28
and statistics, 3(91), 437-456.Ladd, H. F. (1999). The dallas school accountability and incentive program: An eval-
uation of its impacts on student outcomes. Economics of Education Review, 18(1),1–16.
Lavy, V. (2002). Evaluating the effect of teachers’ group performance incentives on pupilachievement. Journal of Political Economy, 110(6), pp. 1286-1317. Retrieved fromhttp://www.jstor.org/stable/10.1086/342810
Lee, D. S. (2009). Training, wages, and sample selection: Estimating sharp bounds ontreatment effects. The Review of Economic Studies, 76(3), 1071–1102.
Leigh, A. (2012). The economics and politics of teacher merit pay. CESifo EconomicStudies, 59(1), 1–33.
Levitt, S. D., List, J. A., Neckermann, S., & Sadoff, S. (2016). The behavioralist goesto school: Leveraging behavioral economics to improve educational performance.American Economic Journal: Economic Policy, 8(4), 183–219.
Loyalka, P. K., Sylvia, S., Liu, C., Chu, J., & Shi, Y. (in press). Pay by design: Teacherperformance pay design and the distribution of student achievement. Journal ofLabor Economics.
Manacorda, M. (2012). The cost of grade retention. Review of Economics and Statistics,94(2), 596–606.
Mbiti, I. (2016). The need for accountability in education in developing countries. Journalof Economic Perspectives, 30(3), 109–32.
Mbiti, I., Muralidharan, K., Romero, M., Schipper, Y., Manda, C., & Rajani, R. (in press).Inputs, incentives, and complementarities in education: Experimental evidencefrom tanzania. The Quarterly Journal of Economics.
Metzler, J., & Woessmann, L. (2012). The impact of teacher subject knowledge on studentachievement: Evidence from within-teacher within-student variation. Journal ofDevelopment Economics, 99(2), 486–496.
Miller, G., & Babiarz, K. S. (2013). Pay-for-performance incentives in low-and middle-income country health programs. NBER Working Paper(No. 18932).
Mohanan, M., Donato, K., Miller, G., Truskinovsky, Y., & Vera-Hernandez, M. (2019).Different strokes for different folks: Experimental evidence on the effectiveness ofinput and output incentive contracts for health care providers with varying skills.NBER Working Paper(25499).
Muralidharan, K., & Sundararaman, V. (2010). The impact of diagnostic feedback toteachers on student learning: Experimental evidence from India. Economic Journal,120, F187–F203.
29
Muralidharan, K., & Sundararaman, V. (2011). Teacher performance pay: Experimentalevidence from India. Journal of Political Economy, 119(1), pp. 39-77. Retrieved fromhttp://www.jstor.org/stable/10.1086/659655
Neal, D. (2011). Chapter 6 - the design of performance pay in education. InE. A. Hanushek, S. Machin, & L. Woessmann (Eds.), Handbook of the eco-nomics of education (Vol. 4, p. 495 - 550). Elsevier. Retrieved from http://www
.sciencedirect.com/science/article/pii/B9780444534446000067 doi: https://doi.org/10.1016/B978-0-444-53444-6.00006-7
Neal, D. (2013). The consequences of using one assessment system to pursue twoobjectives. The Journal of Economic Education, 44(4), 339–352.
Neal, D., & Schanzenbach, D. W. (2010, February). Left behind by design: Proficiencycounts and test-based accountability. Review of Economics and Statistics, 92(2), 263–283. Retrieved from http://dx.doi.org/10.1162/rest.2010.12318
Niederle, M., & Vesterlund, L. (2007). Do women shy away from competition? do mencompete too much? The Quarterly Journal of Economics, 122(3), 1067–1101.
Niederle, M., & Vesterlund, L. (2011). Gender and competition. Annual Review of Eco-nomics, 3(1), 601–630.
OECD. (2017). Teachers’ salaries (indicator). (data retrieved from https://data.oecd.org/
eduresource/teachers-salaries.htm) doi: 10.1787/f689fb91-enPRI. (2013). Tanzanian teachers learning education doesn’t pay. Retrieved 13/09/2017,
from https://www.pri.org/stories/2013-12-20/tanzanian-teachers-learning
-education-doesnt-pay
Reuters. (2012). Tanzanian teachers in strike over pay. Retrieved 13/09/2017,from http://www.reuters.com/article/ozatp-tanzania-strike-20120730
-idAFJOE86T05320120730
Singh, P., & Masters, W. A. (2018). Performance bonuses in the public sector: Winner-take-all prizes versus proportional payments to reduce child malnutrition in in-dia. Journal of Development Economics. Retrieved from http://www.sciencedirect
.com/science/article/pii/S0304387818300610 doi: https://doi.org/10.1016/j.jdeveco.2018.10.003
Uwezo. (2012). Are our children learning? annual learning assessment report 2011(Tech. Rep.). Author. Retrieved from http://www.twaweza.org/uploads/files/
UwezoTZ2013forlaunch.pdf (Accessed on 05-12-2014)Uwezo. (2013). Are our children learning? numeracy and literacy across East Africa (Uwezo
East-Africa Report). Nairobi: Uwezo. (Accessed on 05-12-2014)Vigdor, J. (2008). Teacher salary bonuses in north carolina.
30
Woessmann, L. (2011). Cross-country evidence on teacher performance pay. Economicsof Education Review, 30(3), 404 - 418. Retrieved from http://www.sciencedirect
.com/science/article/pii/S0272775710001731 doi: http://dx.doi.org/10.1016/j.econedurev.2010.12.008
World Bank. (2011). Service delivery indicators: Tanzania (Tech. Rep.). The World Bank,Washington D.C.
World Bank. (2014). Service delivery indicators: Tanzania (Tech. Rep.). The World Bank,Washington D.C.
World Bank. (2017). World development indicators. (data retrieved from, https://data.worldbank.org/data-catalog/world-development-indicators)
World Bank. (2018). World development report 2018: Learning to realize education’s promise.The World Bank. Retrieved from https://elibrary.worldbank.org/doi/abs/10
.1596/978-1-4648-1096-1 doi: 10.1596/978-1-4648-1096-1
31
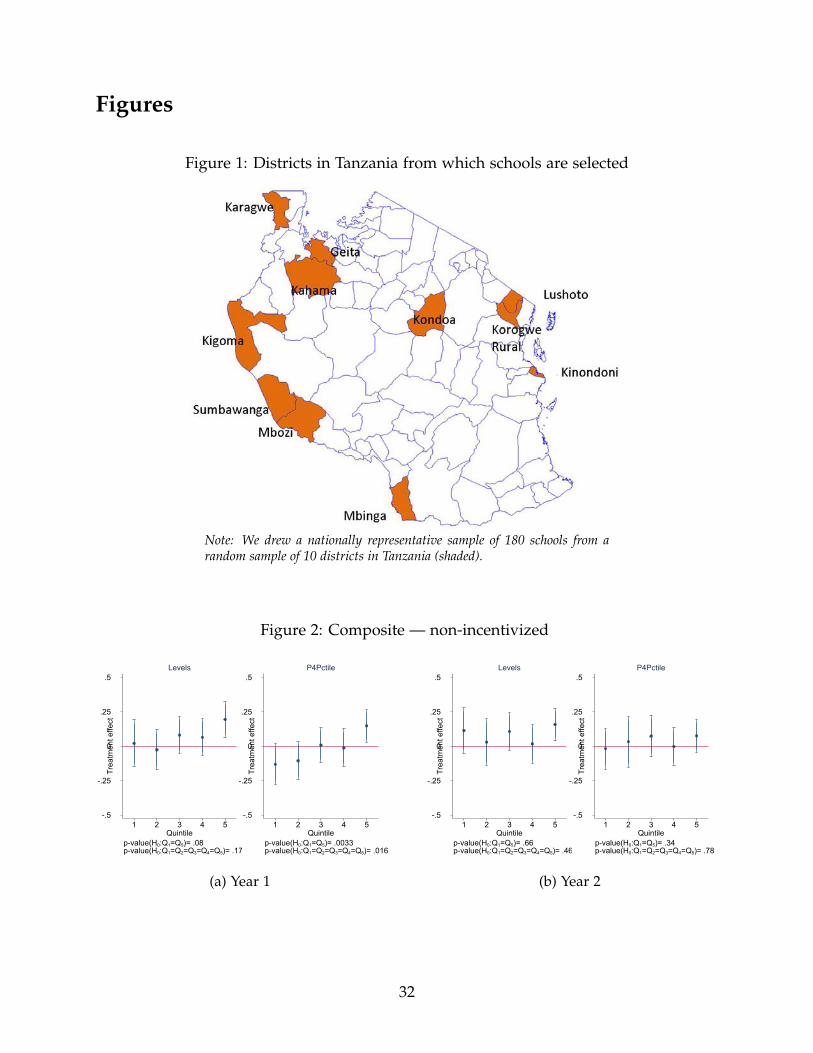
Figures
Figure 1: Districts in Tanzania from which schools are selected
Note: We drew a nationally representative sample of 180 schools from arandom sample of 10 districts in Tanzania (shaded).
Figure 2: Composite — non-incentivized
-.5
-.25
0
.25
.5
Trea
tmen
t effe
ct
1 2 3 4 5Quintile
p-value(H0:Q1=Q5)= .08p-value(H0:Q1=Q2=Q3=Q4=Q5)= .17
Levels
-.5
-.25
0
.25
.5
Trea
tmen
t effe
ct
1 2 3 4 5Quintile
p-value(H0:Q1=Q5)= .0033p-value(H0:Q1=Q2=Q3=Q4=Q5)= .016
P4Pctile
(a) Year 1
-.5
-.25
0
.25
.5
Trea
tmen
t effe
ct
1 2 3 4 5Quintile
p-value(H0:Q1=Q5)= .66p-value(H0:Q1=Q2=Q3=Q4=Q5)= .46
Levels
-.5
-.25
0
.25
.5
Trea
tmen
t effe
ct
1 2 3 4 5Quintile
p-value(H0:Q1=Q5)= .34p-value(H0:Q1=Q2=Q3=Q4=Q5)= .78
P4Pctile
(b) Year 2
32
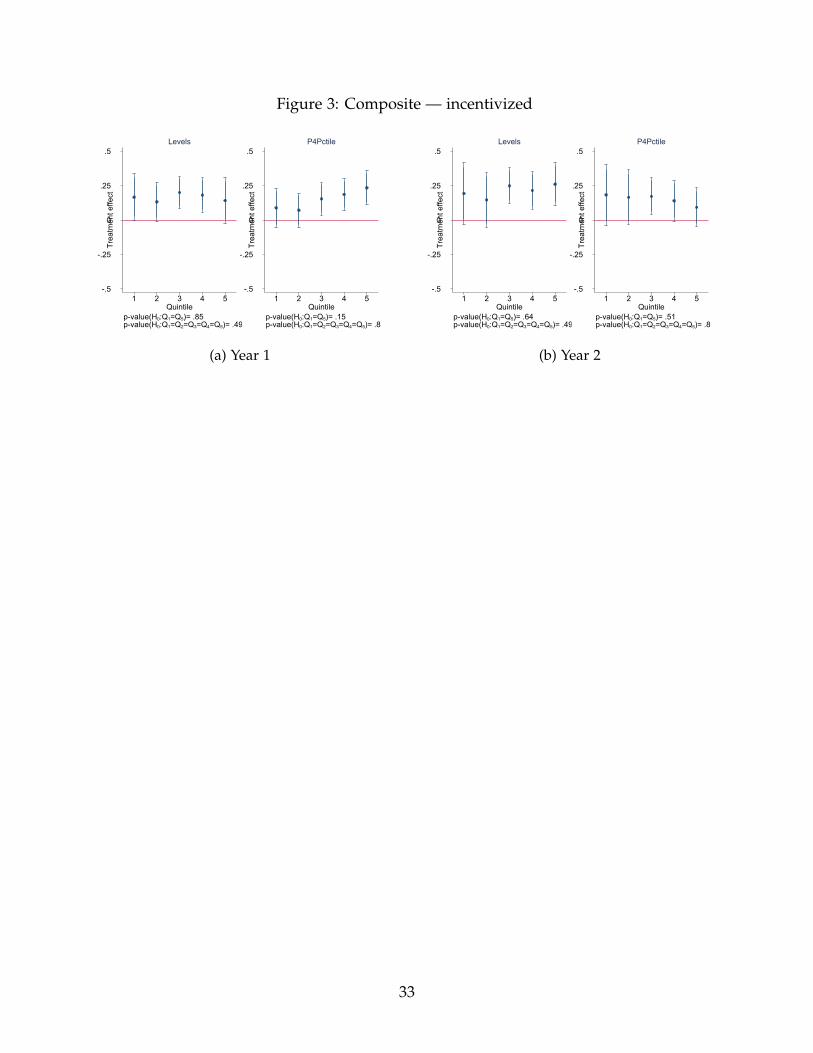
Figure 3: Composite — incentivized
-.5
-.25
0
.25
.5
Trea
tmen
t effe
ct
1 2 3 4 5Quintile
p-value(H0:Q1=Q5)= .85p-value(H0:Q1=Q2=Q3=Q4=Q5)= .49
Levels
-.5
-.25
0
.25
.5
Trea
tmen
t effe
ct
1 2 3 4 5Quintile
p-value(H0:Q1=Q5)= .15p-value(H0:Q1=Q2=Q3=Q4=Q5)= .8
P4Pctile
(a) Year 1
-.5
-.25
0
.25
.5
Trea
tmen
t effe
ct
1 2 3 4 5Quintile
p-value(H0:Q1=Q5)= .64p-value(H0:Q1=Q2=Q3=Q4=Q5)= .49
Levels
-.5
-.25
0
.25
.5
Trea
tmen
t effe
ct
1 2 3 4 5Quintile
p-value(H0:Q1=Q5)= .51p-value(H0:Q1=Q2=Q3=Q4=Q5)= .8
P4Pctile
(b) Year 2
33
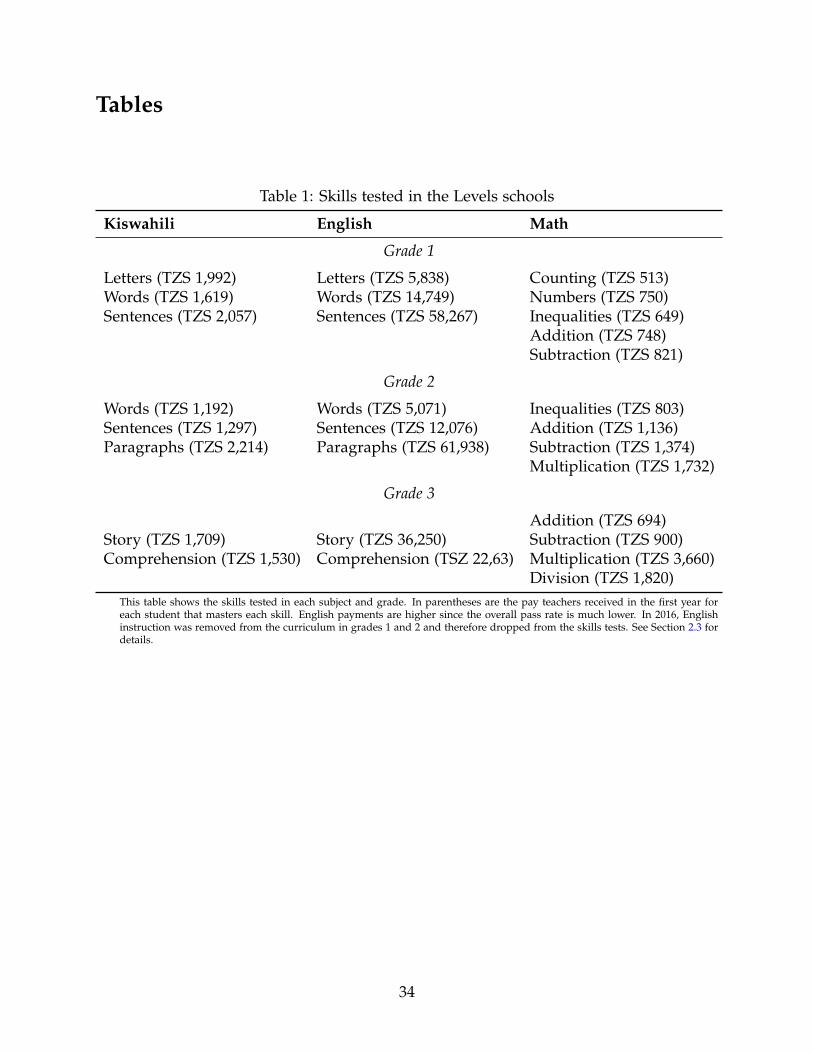
Tables
Table 1: Skills tested in the Levels schools
Kiswahili English Math
Grade 1
Letters (TZS 1,992) Letters (TZS 5,838) Counting (TZS 513)Words (TZS 1,619) Words (TZS 14,749) Numbers (TZS 750)Sentences (TZS 2,057) Sentences (TZS 58,267) Inequalities (TZS 649)
Addition (TZS 748)Subtraction (TZS 821)
Grade 2
Words (TZS 1,192) Words (TZS 5,071) Inequalities (TZS 803)Sentences (TZS 1,297) Sentences (TZS 12,076) Addition (TZS 1,136)Paragraphs (TZS 2,214) Paragraphs (TZS 61,938) Subtraction (TZS 1,374)
Multiplication (TZS 1,732)
Grade 3
Addition (TZS 694)Story (TZS 1,709) Story (TZS 36,250) Subtraction (TZS 900)Comprehension (TZS 1,530) Comprehension (TSZ 22,63) Multiplication (TZS 3,660)
Division (TZS 1,820)This table shows the skills tested in each subject and grade. In parentheses are the pay teachers received in the first year foreach student that masters each skill. English payments are higher since the overall pass rate is much lower. In 2016, Englishinstruction was removed from the curriculum in grades 1 and 2 and therefore dropped from the skills tests. See Section 2.3 fordetails.
34
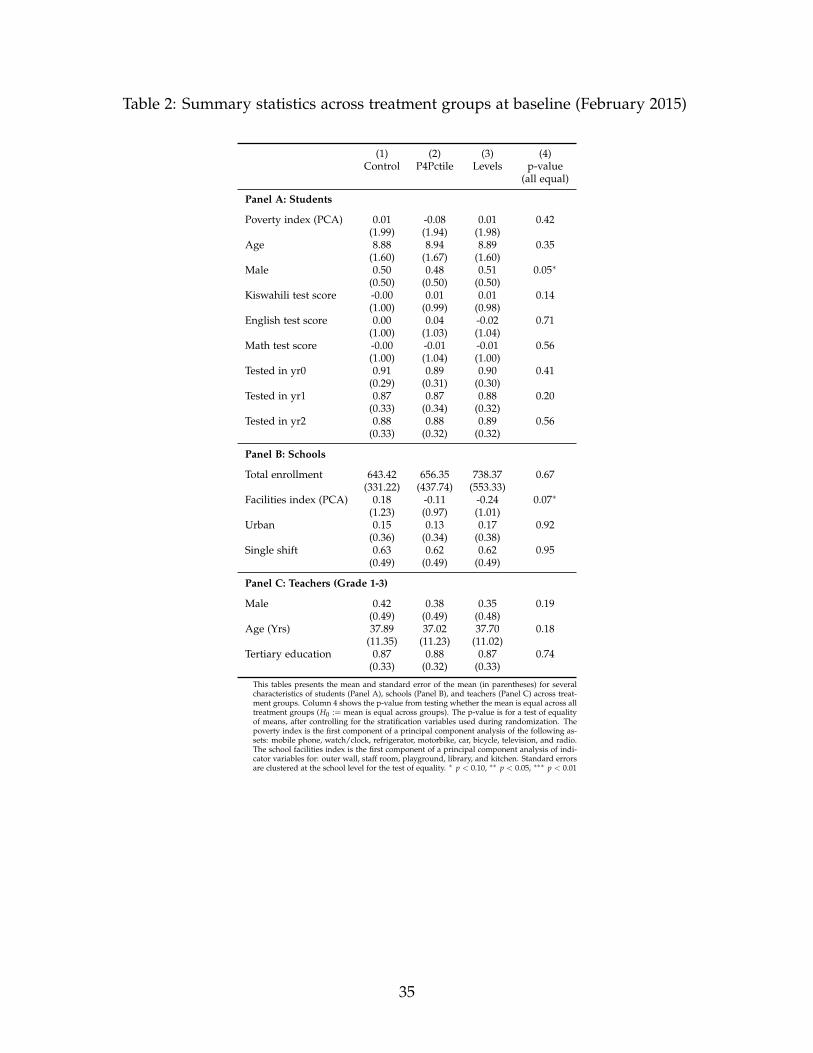
Table 2: Summary statistics across treatment groups at baseline (February 2015)
(1) (2) (3) (4)Control P4Pctile Levels p-value
(all equal)
Panel A: Students
Poverty index (PCA) 0.01 -0.08 0.01 0.42(1.99) (1.94) (1.98)
Age 8.88 8.94 8.89 0.35(1.60) (1.67) (1.60)
Male 0.50 0.48 0.51 0.05∗
(0.50) (0.50) (0.50)Kiswahili test score -0.00 0.01 0.01 0.14
(1.00) (0.99) (0.98)English test score 0.00 0.04 -0.02 0.71
(1.00) (1.03) (1.04)Math test score -0.00 -0.01 -0.01 0.56
(1.00) (1.04) (1.00)Tested in yr0 0.91 0.89 0.90 0.41
(0.29) (0.31) (0.30)Tested in yr1 0.87 0.87 0.88 0.20
(0.33) (0.34) (0.32)Tested in yr2 0.88 0.88 0.89 0.56
(0.33) (0.32) (0.32)
Panel B: Schools
Total enrollment 643.42 656.35 738.37 0.67(331.22) (437.74) (553.33)
Facilities index (PCA) 0.18 -0.11 -0.24 0.07∗
(1.23) (0.97) (1.01)Urban 0.15 0.13 0.17 0.92
(0.36) (0.34) (0.38)Single shift 0.63 0.62 0.62 0.95
(0.49) (0.49) (0.49)
Panel C: Teachers (Grade 1-3)
Male 0.42 0.38 0.35 0.19(0.49) (0.49) (0.48)
Age (Yrs) 37.89 37.02 37.70 0.18(11.35) (11.23) (11.02)
Tertiary education 0.87 0.88 0.87 0.74(0.33) (0.32) (0.33)
This tables presents the mean and standard error of the mean (in parentheses) for severalcharacteristics of students (Panel A), schools (Panel B), and teachers (Panel C) across treat-ment groups. Column 4 shows the p-value from testing whether the mean is equal across alltreatment groups (H0 := mean is equal across groups). The p-value is for a test of equalityof means, after controlling for the stratification variables used during randomization. Thepoverty index is the first component of a principal component analysis of the following as-sets: mobile phone, watch/clock, refrigerator, motorbike, car, bicycle, television, and radio.The school facilities index is the first component of a principal component analysis of indi-cator variables for: outer wall, staff room, playground, library, and kitchen. Standard errorsare clustered at the school level for the test of equality. ∗ p < 0.10, ∗∗ p < 0.05, ∗∗∗ p < 0.01
35
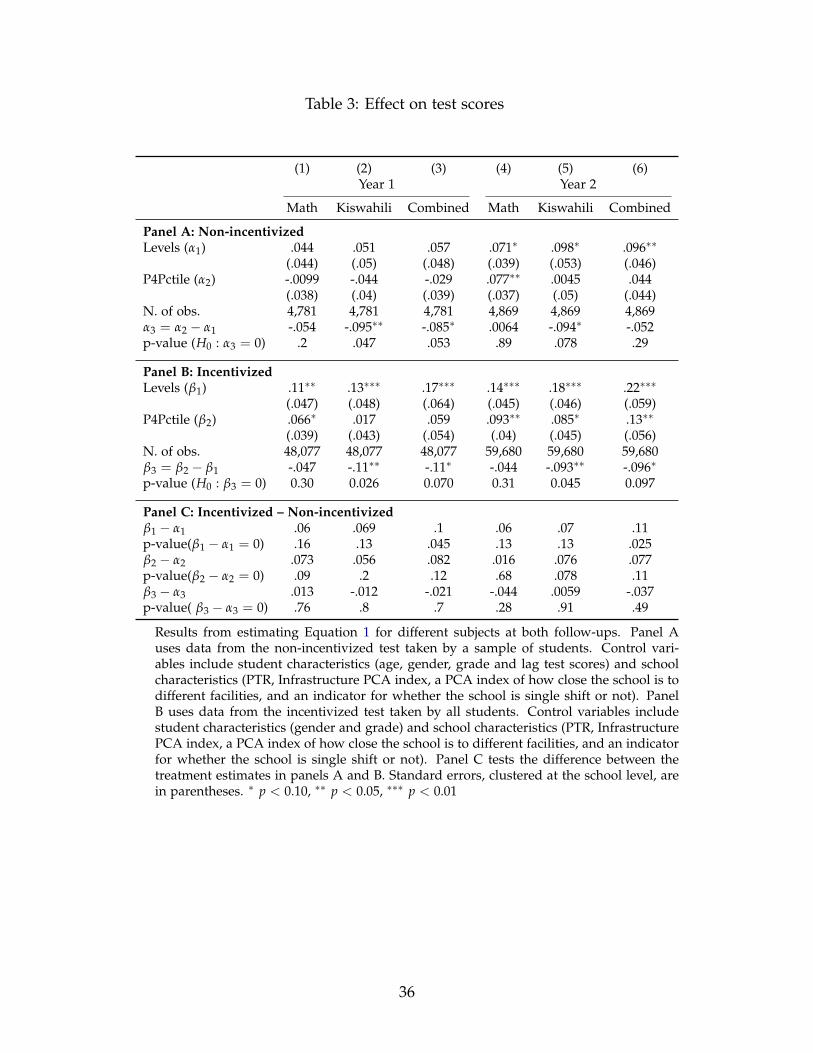
Table 3: Effect on test scores
(1) (2) (3) (4) (5) (6)Year 1 Year 2
Math Kiswahili Combined Math Kiswahili Combined
Panel A: Non-incentivizedLevels (α1) .044 .051 .057 .071∗ .098∗ .096∗∗
(.044) (.05) (.048) (.039) (.053) (.046)P4Pctile (α2) -.0099 -.044 -.029 .077∗∗ .0045 .044
(.038) (.04) (.039) (.037) (.05) (.044)N. of obs. 4,781 4,781 4,781 4,869 4,869 4,869α3 = α2 − α1 -.054 -.095∗∗ -.085∗ .0064 -.094∗ -.052p-value (H0 : α3 = 0) .2 .047 .053 .89 .078 .29
Panel B: IncentivizedLevels (β1) .11∗∗ .13∗∗∗ .17∗∗∗ .14∗∗∗ .18∗∗∗ .22∗∗∗
(.047) (.048) (.064) (.045) (.046) (.059)P4Pctile (β2) .066∗ .017 .059 .093∗∗ .085∗ .13∗∗
(.039) (.043) (.054) (.04) (.045) (.056)N. of obs. 48,077 48,077 48,077 59,680 59,680 59,680β3 = β2 − β1 -.047 -.11∗∗ -.11∗ -.044 -.093∗∗ -.096∗
p-value (H0 : β3 = 0) 0.30 0.026 0.070 0.31 0.045 0.097
Panel C: Incentivized – Non-incentivizedβ1 − α1 .06 .069 .1 .06 .07 .11p-value(β1 − α1 = 0) .16 .13 .045 .13 .13 .025β2 − α2 .073 .056 .082 .016 .076 .077p-value(β2 − α2 = 0) .09 .2 .12 .68 .078 .11β3 − α3 .013 -.012 -.021 -.044 .0059 -.037p-value( β3 − α3 = 0) .76 .8 .7 .28 .91 .49
Results from estimating Equation 1 for different subjects at both follow-ups. Panel Auses data from the non-incentivized test taken by a sample of students. Control vari-ables include student characteristics (age, gender, grade and lag test scores) and schoolcharacteristics (PTR, Infrastructure PCA index, a PCA index of how close the school is todifferent facilities, and an indicator for whether the school is single shift or not). PanelB uses data from the incentivized test taken by all students. Control variables includestudent characteristics (gender and grade) and school characteristics (PTR, InfrastructurePCA index, a PCA index of how close the school is to different facilities, and an indicatorfor whether the school is single shift or not). Panel C tests the difference between thetreatment estimates in panels A and B. Standard errors, clustered at the school level, arein parentheses. ∗ p < 0.10, ∗∗ p < 0.05, ∗∗∗ p < 0.01
36
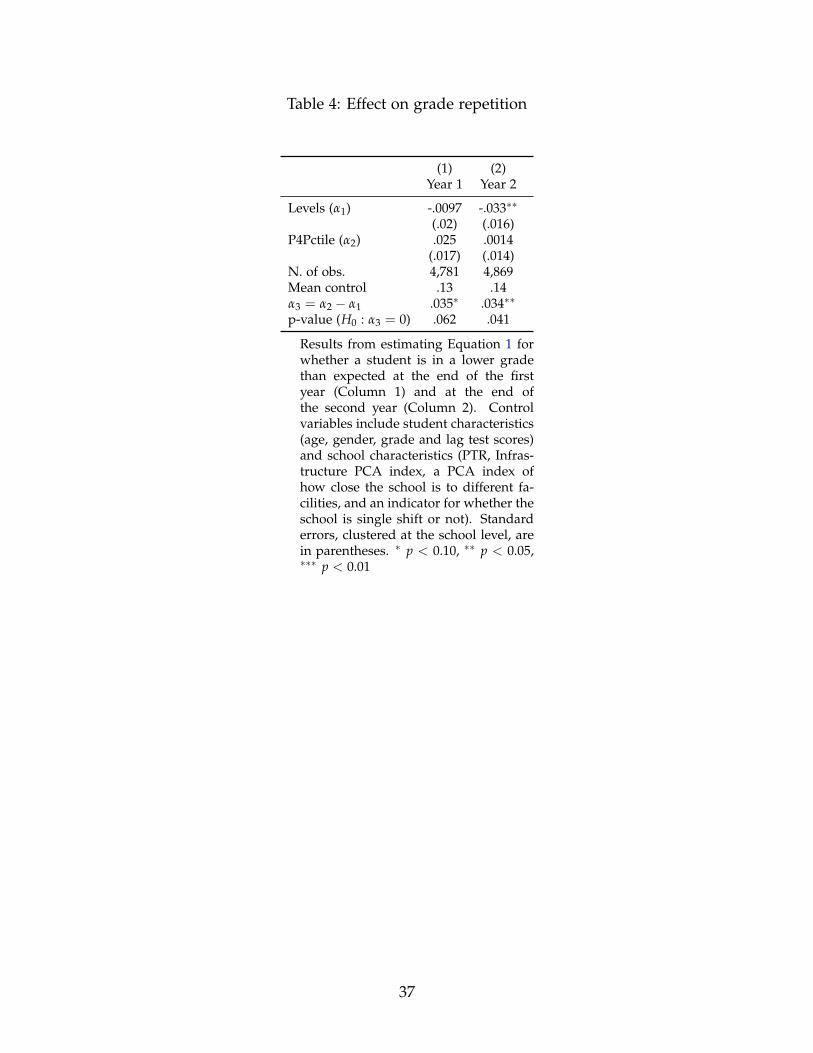
Table 4: Effect on grade repetition
(1) (2)Year 1 Year 2
Levels (α1) -.0097 -.033∗∗
(.02) (.016)P4Pctile (α2) .025 .0014
(.017) (.014)N. of obs. 4,781 4,869Mean control .13 .14α3 = α2 − α1 .035∗ .034∗∗
p-value (H0 : α3 = 0) .062 .041
Results from estimating Equation 1 forwhether a student is in a lower gradethan expected at the end of the firstyear (Column 1) and at the end ofthe second year (Column 2). Controlvariables include student characteristics(age, gender, grade and lag test scores)and school characteristics (PTR, Infras-tructure PCA index, a PCA index ofhow close the school is to different fa-cilities, and an indicator for whether theschool is single shift or not). Standarderrors, clustered at the school level, arein parentheses. ∗ p < 0.10, ∗∗ p < 0.05,∗∗∗ p < 0.01
37
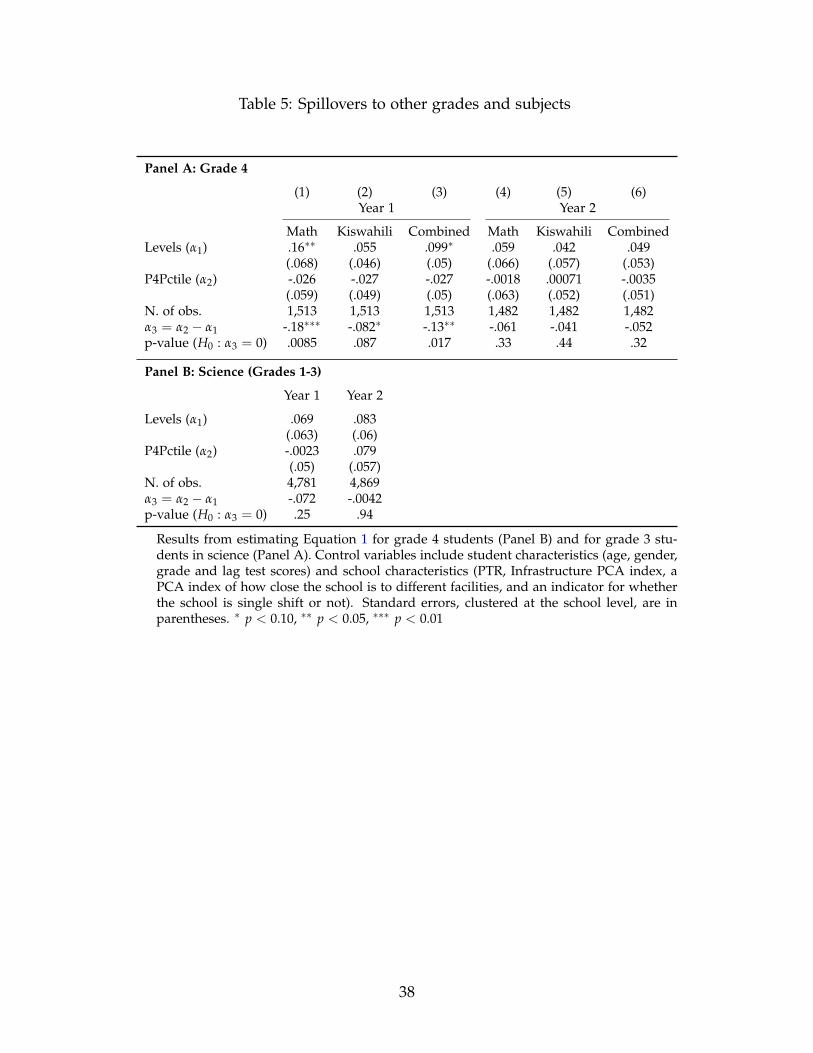
Table 5: Spillovers to other grades and subjects
Panel A: Grade 4
(1) (2) (3) (4) (5) (6)Year 1 Year 2
Math Kiswahili Combined Math Kiswahili CombinedLevels (α1) .16∗∗ .055 .099∗ .059 .042 .049
(.068) (.046) (.05) (.066) (.057) (.053)P4Pctile (α2) -.026 -.027 -.027 -.0018 .00071 -.0035
(.059) (.049) (.05) (.063) (.052) (.051)N. of obs. 1,513 1,513 1,513 1,482 1,482 1,482α3 = α2 − α1 -.18∗∗∗ -.082∗ -.13∗∗ -.061 -.041 -.052p-value (H0 : α3 = 0) .0085 .087 .017 .33 .44 .32
Panel B: Science (Grades 1-3)
Year 1 Year 2
Levels (α1) .069 .083(.063) (.06)
P4Pctile (α2) -.0023 .079(.05) (.057)
N. of obs. 4,781 4,869α3 = α2 − α1 -.072 -.0042p-value (H0 : α3 = 0) .25 .94
Results from estimating Equation 1 for grade 4 students (Panel B) and for grade 3 stu-dents in science (Panel A). Control variables include student characteristics (age, gender,grade and lag test scores) and school characteristics (PTR, Infrastructure PCA index, aPCA index of how close the school is to different facilities, and an indicator for whetherthe school is single shift or not). Standard errors, clustered at the school level, are inparentheses. ∗ p < 0.10, ∗∗ p < 0.05, ∗∗∗ p < 0.01
38
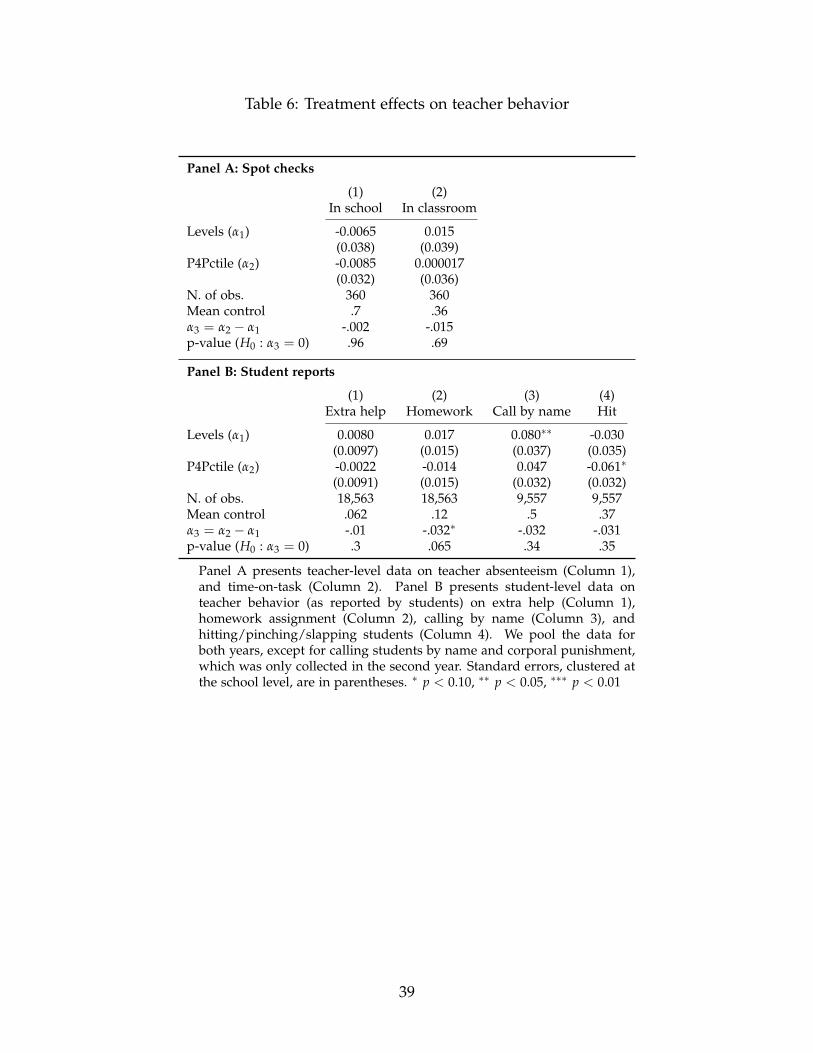
Table 6: Treatment effects on teacher behavior
Panel A: Spot checks
(1) (2)In school In classroom
Levels (α1) -0.0065 0.015(0.038) (0.039)
P4Pctile (α2) -0.0085 0.000017(0.032) (0.036)
N. of obs. 360 360Mean control .7 .36α3 = α2 − α1 -.002 -.015p-value (H0 : α3 = 0) .96 .69
Panel B: Student reports
(1) (2) (3) (4)Extra help Homework Call by name Hit
Levels (α1) 0.0080 0.017 0.080∗∗ -0.030(0.0097) (0.015) (0.037) (0.035)
P4Pctile (α2) -0.0022 -0.014 0.047 -0.061∗
(0.0091) (0.015) (0.032) (0.032)N. of obs. 18,563 18,563 9,557 9,557Mean control .062 .12 .5 .37α3 = α2 − α1 -.01 -.032∗ -.032 -.031p-value (H0 : α3 = 0) .3 .065 .34 .35
Panel A presents teacher-level data on teacher absenteeism (Column 1),and time-on-task (Column 2). Panel B presents student-level data onteacher behavior (as reported by students) on extra help (Column 1),homework assignment (Column 2), calling by name (Column 3), andhitting/pinching/slapping students (Column 4). We pool the data forboth years, except for calling students by name and corporal punishment,which was only collected in the second year. Standard errors, clustered atthe school level, are in parentheses. ∗ p < 0.10, ∗∗ p < 0.05, ∗∗∗ p < 0.01
39
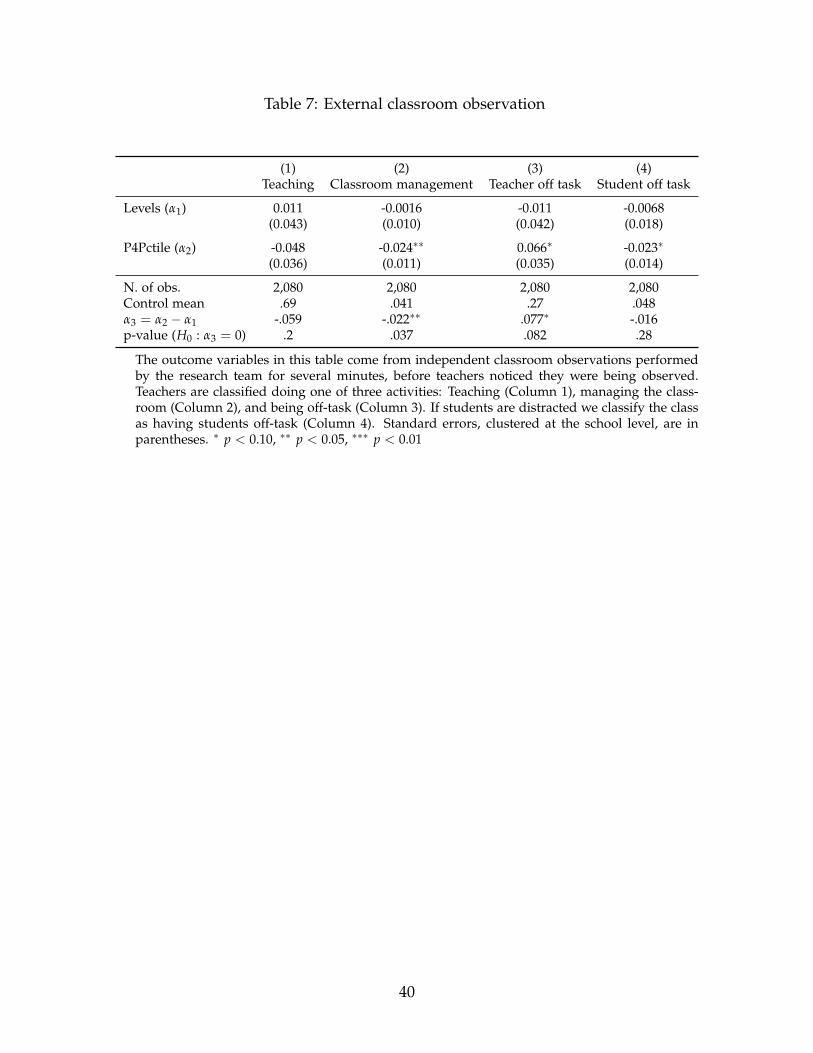
Table 7: External classroom observation
(1) (2) (3) (4)Teaching Classroom management Teacher off task Student off task
Levels (α1) 0.011 -0.0016 -0.011 -0.0068(0.043) (0.010) (0.042) (0.018)
P4Pctile (α2) -0.048 -0.024∗∗ 0.066∗ -0.023∗
(0.036) (0.011) (0.035) (0.014)
N. of obs. 2,080 2,080 2,080 2,080Control mean .69 .041 .27 .048α3 = α2 − α1 -.059 -.022∗∗ .077∗ -.016p-value (H0 : α3 = 0) .2 .037 .082 .28
The outcome variables in this table come from independent classroom observations performedby the research team for several minutes, before teachers noticed they were being observed.Teachers are classified doing one of three activities: Teaching (Column 1), managing the class-room (Column 2), and being off-task (Column 3). If students are distracted we classify the classas having students off-task (Column 4). Standard errors, clustered at the school level, are inparentheses. ∗ p < 0.10, ∗∗ p < 0.05, ∗∗∗ p < 0.01
40
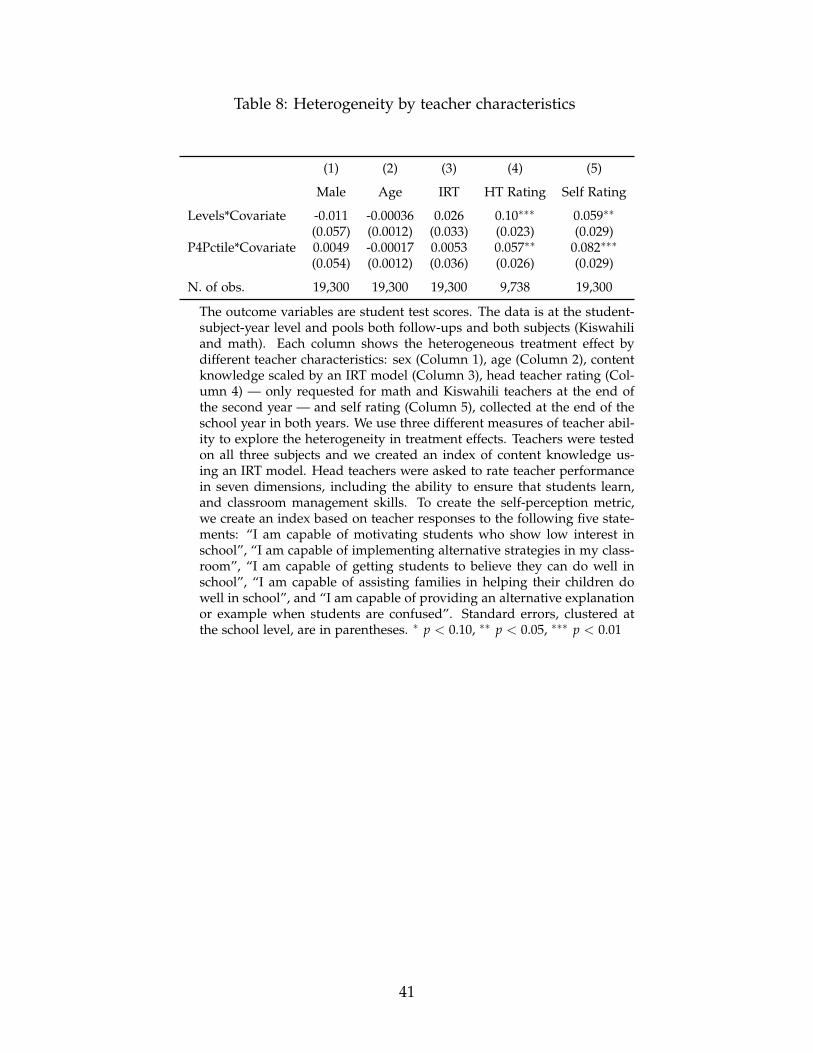
Table 8: Heterogeneity by teacher characteristics
(1) (2) (3) (4) (5)
Male Age IRT HT Rating Self Rating
Levels*Covariate -0.011 -0.00036 0.026 0.10∗∗∗ 0.059∗∗
(0.057) (0.0012) (0.033) (0.023) (0.029)P4Pctile*Covariate 0.0049 -0.00017 0.0053 0.057∗∗ 0.082∗∗∗
(0.054) (0.0012) (0.036) (0.026) (0.029)
N. of obs. 19,300 19,300 19,300 9,738 19,300
The outcome variables are student test scores. The data is at the student-subject-year level and pools both follow-ups and both subjects (Kiswahiliand math). Each column shows the heterogeneous treatment effect bydifferent teacher characteristics: sex (Column 1), age (Column 2), contentknowledge scaled by an IRT model (Column 3), head teacher rating (Col-umn 4) — only requested for math and Kiswahili teachers at the end ofthe second year — and self rating (Column 5), collected at the end of theschool year in both years. We use three different measures of teacher abil-ity to explore the heterogeneity in treatment effects. Teachers were testedon all three subjects and we created an index of content knowledge us-ing an IRT model. Head teachers were asked to rate teacher performancein seven dimensions, including the ability to ensure that students learn,and classroom management skills. To create the self-perception metric,we create an index based on teacher responses to the following five state-ments: “I am capable of motivating students who show low interest inschool”, “I am capable of implementing alternative strategies in my class-room”, “I am capable of getting students to believe they can do well inschool”, “I am capable of assisting families in helping their children dowell in school”, and “I am capable of providing an alternative explanationor example when students are confused”. Standard errors, clustered atthe school level, are in parentheses. ∗ p < 0.10, ∗∗ p < 0.05, ∗∗∗ p < 0.01
41
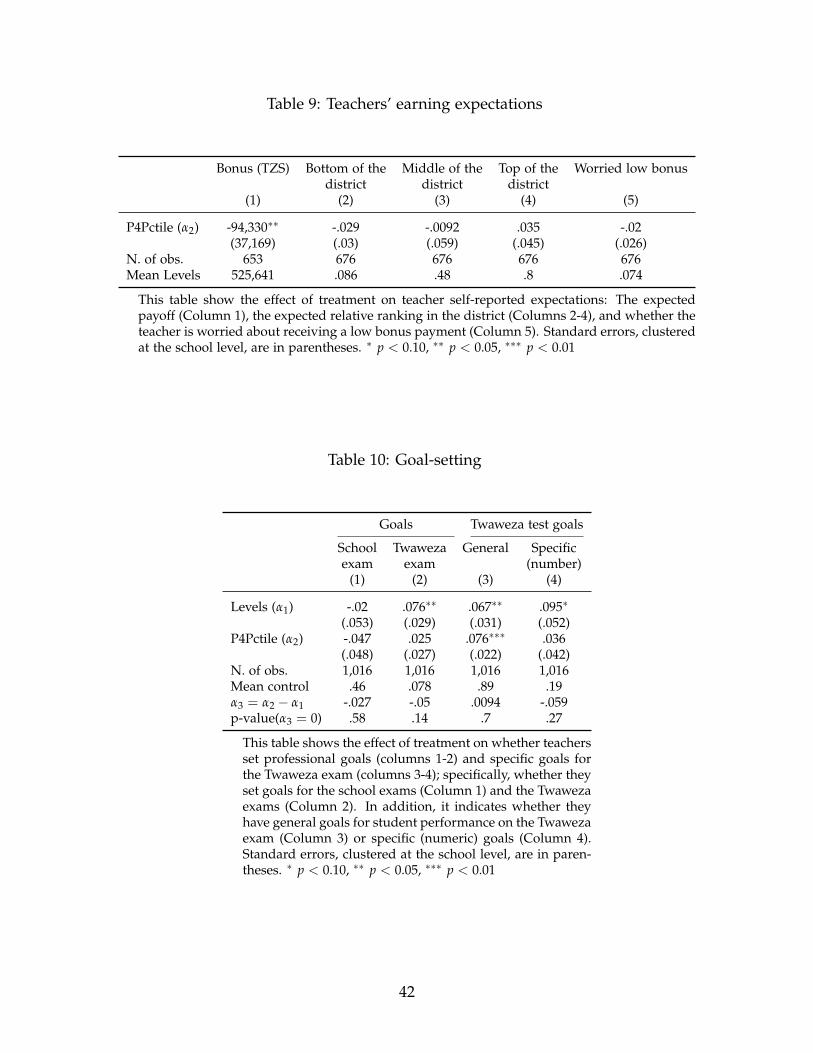
Table 9: Teachers’ earning expectations
Bonus (TZS) Bottom of the Middle of the Top of the Worried low bonusdistrict district district
(1) (2) (3) (4) (5)
P4Pctile (α2) -94,330∗∗ -.029 -.0092 .035 -.02(37,169) (.03) (.059) (.045) (.026)
N. of obs. 653 676 676 676 676Mean Levels 525,641 .086 .48 .8 .074
This table show the effect of treatment on teacher self-reported expectations: The expectedpayoff (Column 1), the expected relative ranking in the district (Columns 2-4), and whether theteacher is worried about receiving a low bonus payment (Column 5). Standard errors, clusteredat the school level, are in parentheses. ∗ p < 0.10, ∗∗ p < 0.05, ∗∗∗ p < 0.01
Table 10: Goal-setting
Goals Twaweza test goals
School Twaweza General Specificexam exam (number)
(1) (2) (3) (4)
Levels (α1) -.02 .076∗∗ .067∗∗ .095∗
(.053) (.029) (.031) (.052)P4Pctile (α2) -.047 .025 .076∗∗∗ .036
(.048) (.027) (.022) (.042)N. of obs. 1,016 1,016 1,016 1,016Mean control .46 .078 .89 .19α3 = α2 − α1 -.027 -.05 .0094 -.059p-value(α3 = 0) .58 .14 .7 .27
This table shows the effect of treatment on whether teachersset professional goals (columns 1-2) and specific goals forthe Twaweza exam (columns 3-4); specifically, whether theyset goals for the school exams (Column 1) and the Twawezaexams (Column 2). In addition, it indicates whether theyhave general goals for student performance on the Twawezaexam (Column 3) or specific (numeric) goals (Column 4).Standard errors, clustered at the school level, are in paren-theses. ∗ p < 0.10, ∗∗ p < 0.05, ∗∗∗ p < 0.01
42
FOR ONLINE PUBLICATION
A Randomization Details
This study builds on the sample of 350 schools that participated in the 2013 to 2014KiuFunza study (see Mbiti et al. (in press) for more details). In the 2013-14 study the350 schools in the sample were randomly placed into one of four treatment groups: 70schools received school grants, 70 schools received teacher incentives (using a singlethreshold design), 70 schools received both grants and incentives, and 140 schools werein the control group. In order to determine teacher awards, incentivized tests wereconducted in schools assigned to the incentives treatment or the combination treatment(a total of 140 schools). To faciliate the computation of treatment effects on incentivizedtests, we also conducted these tests in 40 control schools.
We take the set of 180 schools where endline “incentivized” tests had been conductedin 2014. Specifically, 70 schools from the incentive arm (labeled C1), 70 schools from thecombination arm (C2), and 40 schools from the control arm (C3). We use these tests asthe baseline data to implement the teacher incentive schemes in this study. This baselinedata is especially important for the Pay for Percentile incentive scheme as we have tosplit students into groups, and properly seed each contest.
In each district, there were seven schools in C1 (teacher incentives), seven in C2 (combi-nation), and four in C3 (the control group). We randomly assign schools from the previ-ous treatment groups into two new treatments groups (Levels or Pay for Percentile) anda control group. We stratify this randomization by district. However, in order to studythe long-term impacts of teacher incentives, we assign a higher proportion of schoolsin C1 (which involved threshold teacher incentives) to Levels. Similarly, we assign ahigher proportion of schools in the control group from the previous experiment (C3) tothe control group of this experiment.
For this experiment, we stratify the random treatment assignment by district, previoustreatment, and an index of the overall learning level of students in each school.34 TableA.1 summarizes the number of schools randomly allocated to each treatment arm basedon their assignment in the previous experiment. Each district has 18 schools, such thatthere are six schools in each of the new treatment groups (Levels, Pay for Percentile, andcontrol). Because the study was carried out in 10 districts, overall there are 60 schools ineach new treatment group: 30 above the median in baseline learning and 30 below.
34We created an overall measure of student learning and categorized schools as above or below themedian.
44
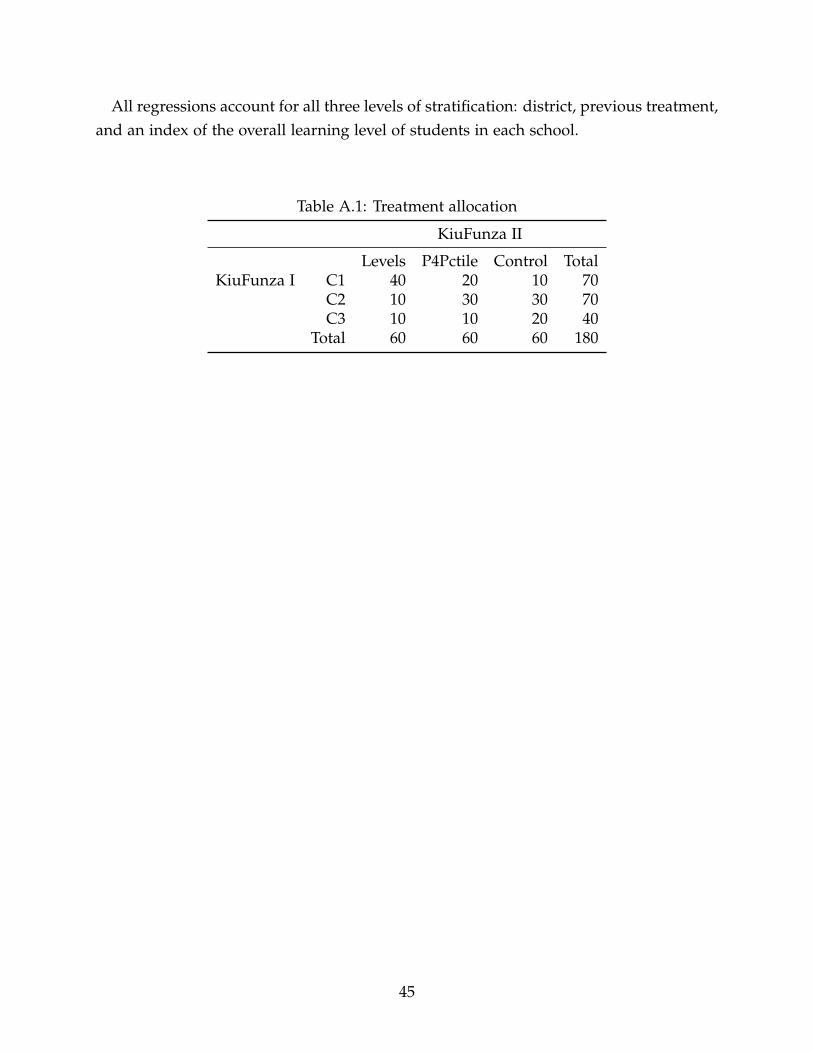
All regressions account for all three levels of stratification: district, previous treatment,and an index of the overall learning level of students in each school.
Table A.1: Treatment allocation
KiuFunza II
Levels P4Pctile Control TotalKiuFunza I C1 40 20 10 70
C2 10 30 30 70C3 10 10 20 40
Total 60 60 60 180
45
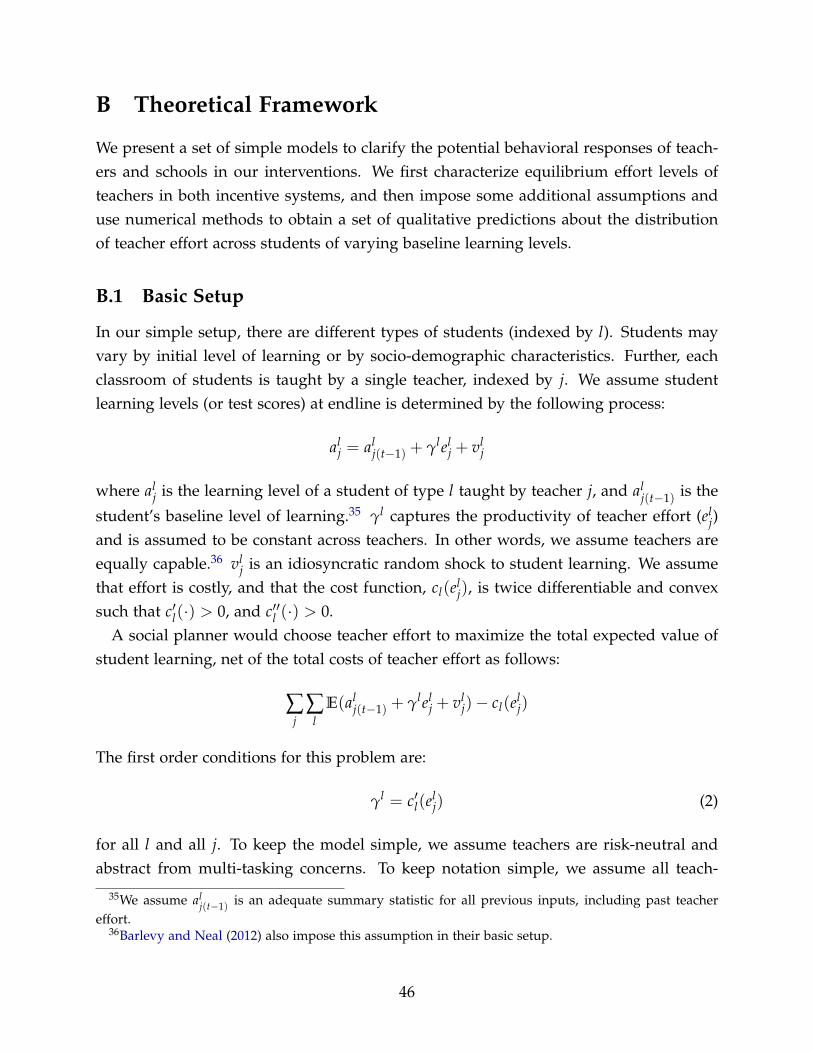
B Theoretical Framework
We present a set of simple models to clarify the potential behavioral responses of teach-ers and schools in our interventions. We first characterize equilibrium effort levels ofteachers in both incentive systems, and then impose some additional assumptions anduse numerical methods to obtain a set of qualitative predictions about the distributionof teacher effort across students of varying baseline learning levels.
B.1 Basic Setup
In our simple setup, there are different types of students (indexed by l). Students mayvary by initial level of learning or by socio-demographic characteristics. Further, eachclassroom of students is taught by a single teacher, indexed by j. We assume studentlearning levels (or test scores) at endline is determined by the following process:
alj = al
j(t−1) + γlelj + vl
j
where alj is the learning level of a student of type l taught by teacher j, and al
j(t−1) is the
student’s baseline level of learning.35 γl captures the productivity of teacher effort (elj)
and is assumed to be constant across teachers. In other words, we assume teachers areequally capable.36 vl
j is an idiosyncratic random shock to student learning. We assumethat effort is costly, and that the cost function, cl(el
j), is twice differentiable and convexsuch that c′l(·) > 0, and c′′l (·) > 0.
A social planner would choose teacher effort to maximize the total expected value ofstudent learning, net of the total costs of teacher effort as follows:
∑j
∑l
E(alj(t−1) + γlel
j + vlj)− cl(el
j)
The first order conditions for this problem are:
γl = c′l(elj) (2)
for all l and all j. To keep the model simple, we assume teachers are risk-neutral andabstract from multi-tasking concerns. To keep notation simple, we assume all teach-
35We assume alj(t−1) is an adequate summary statistic for all previous inputs, including past teacher
effort.36Barlevy and Neal (2012) also impose this assumption in their basic setup.
46
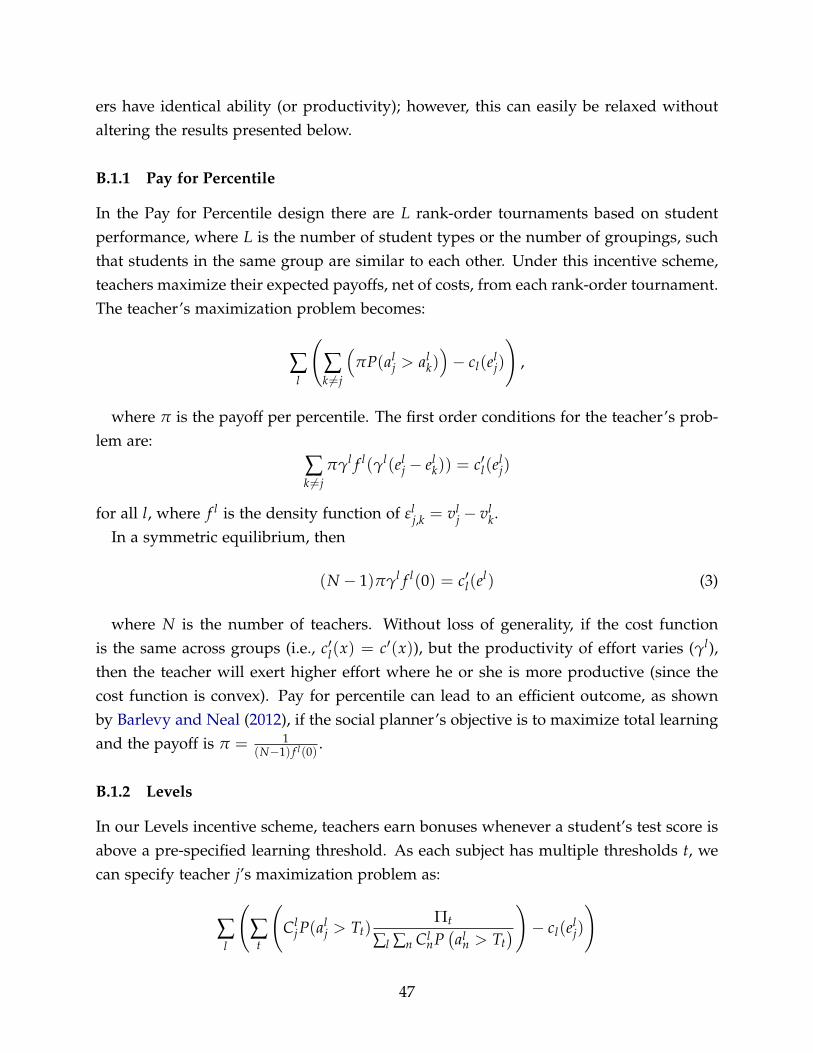
ers have identical ability (or productivity); however, this can easily be relaxed withoutaltering the results presented below.
B.1.1 Pay for Percentile
In the Pay for Percentile design there are L rank-order tournaments based on studentperformance, where L is the number of student types or the number of groupings, suchthat students in the same group are similar to each other. Under this incentive scheme,teachers maximize their expected payoffs, net of costs, from each rank-order tournament.The teacher’s maximization problem becomes:
∑l
(∑k 6=j
(πP(al
j > alk))− cl(el
j)
),
where π is the payoff per percentile. The first order conditions for the teacher’s prob-lem are:
∑k 6=j
πγl f l(γl(elj − el
k)) = c′l(elj)
for all l, where f l is the density function of εlj,k = vl
j − vlk.
In a symmetric equilibrium, then
(N − 1)πγl f l(0) = c′l(el) (3)
where N is the number of teachers. Without loss of generality, if the cost functionis the same across groups (i.e., c′l(x) = c′(x)), but the productivity of effort varies (γl),then the teacher will exert higher effort where he or she is more productive (since thecost function is convex). Pay for percentile can lead to an efficient outcome, as shownby Barlevy and Neal (2012), if the social planner’s objective is to maximize total learningand the payoff is π = 1
(N−1) f l(0) .
B.1.2 Levels
In our Levels incentive scheme, teachers earn bonuses whenever a student’s test score isabove a pre-specified learning threshold. As each subject has multiple thresholds t, wecan specify teacher j’s maximization problem as:
∑l
(∑
t
(Cl
j P(alj > Tt)
Πt
∑l ∑n ClnP(al
n > Tt))− cl(el
j)
)
47
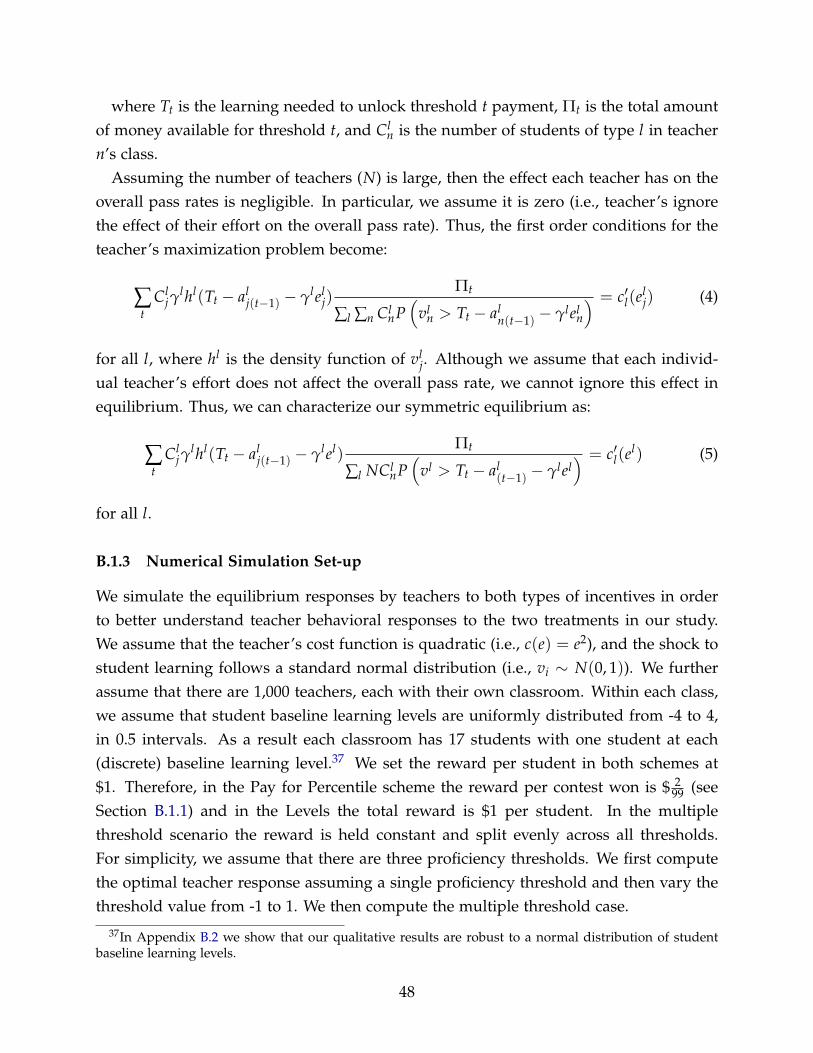
where Tt is the learning needed to unlock threshold t payment, Πt is the total amountof money available for threshold t, and Cl
n is the number of students of type l in teachern’s class.
Assuming the number of teachers (N) is large, then the effect each teacher has on theoverall pass rates is negligible. In particular, we assume it is zero (i.e., teacher’s ignorethe effect of their effort on the overall pass rate). Thus, the first order conditions for theteacher’s maximization problem become:
∑t
Cljγ
lhl(Tt − alj(t−1) − γlel
j)Πt
∑l ∑n ClnP(
vln > Tt − al
n(t−1) − γleln
) = c′l(elj) (4)
for all l, where hl is the density function of vlj. Although we assume that each individ-
ual teacher’s effort does not affect the overall pass rate, we cannot ignore this effect inequilibrium. Thus, we can characterize our symmetric equilibrium as:
∑t
Cljγ
lhl(Tt − alj(t−1) − γlel)
Πt
∑l NClnP(
vl > Tt − al(t−1) − γlel
) = c′l(el) (5)
for all l.
B.1.3 Numerical Simulation Set-up
We simulate the equilibrium responses by teachers to both types of incentives in orderto better understand teacher behavioral responses to the two treatments in our study.We assume that the teacher’s cost function is quadratic (i.e., c(e) = e2), and the shock tostudent learning follows a standard normal distribution (i.e., vi ∼ N(0, 1)). We furtherassume that there are 1,000 teachers, each with their own classroom. Within each class,we assume that student baseline learning levels are uniformly distributed from -4 to 4,in 0.5 intervals. As a result each classroom has 17 students with one student at each(discrete) baseline learning level.37 We set the reward per student in both schemes at$1. Therefore, in the Pay for Percentile scheme the reward per contest won is $ 2
99 (seeSection B.1.1) and in the Levels the total reward is $1 per student. In the multiplethreshold scenario the reward is held constant and split evenly across all thresholds.For simplicity, we assume that there are three proficiency thresholds. We first computethe optimal teacher response assuming a single proficiency threshold and then vary thethreshold value from -1 to 1. We then compute the multiple threshold case.
37In Appendix B.2 we show that our qualitative results are robust to a normal distribution of studentbaseline learning levels.
48
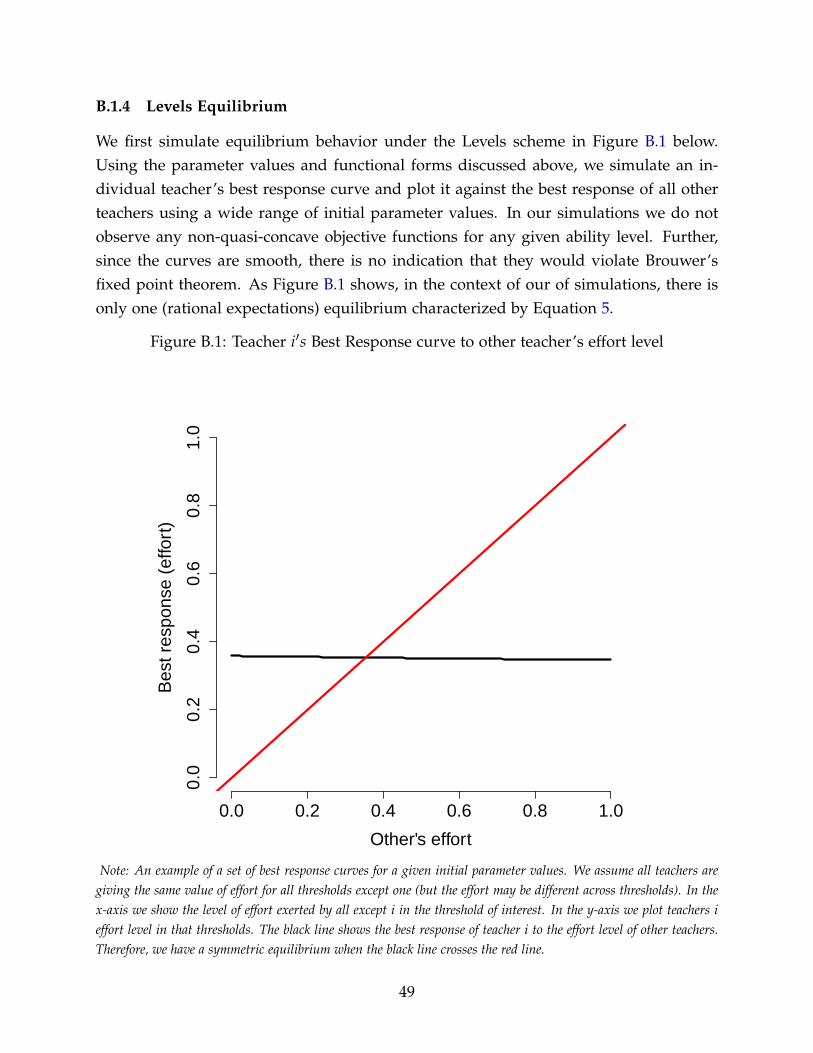
B.1.4 Levels Equilibrium
We first simulate equilibrium behavior under the Levels scheme in Figure B.1 below.Using the parameter values and functional forms discussed above, we simulate an in-dividual teacher’s best response curve and plot it against the best response of all otherteachers using a wide range of initial parameter values. In our simulations we do notobserve any non-quasi-concave objective functions for any given ability level. Further,since the curves are smooth, there is no indication that they would violate Brouwer’sfixed point theorem. As Figure B.1 shows, in the context of our of simulations, there isonly one (rational expectations) equilibrium characterized by Equation 5.
Figure B.1: Teacher i′s Best Response curve to other teacher’s effort level
0.0 0.2 0.4 0.6 0.8 1.0
0.0
0.2
0.4
0.6
0.8
1.0
Other's effort
Bes
t res
pons
e (e
ffort
)
Note: An example of a set of best response curves for a given initial parameter values. We assume all teachers aregiving the same value of effort for all thresholds except one (but the effort may be different across thresholds). In thex-axis we show the level of effort exerted by all except i in the threshold of interest. In the y-axis we plot teachers ieffort level in that thresholds. The black line shows the best response of teacher i to the effort level of other teachers.Therefore, we have a symmetric equilibrium when the black line crosses the red line.
49
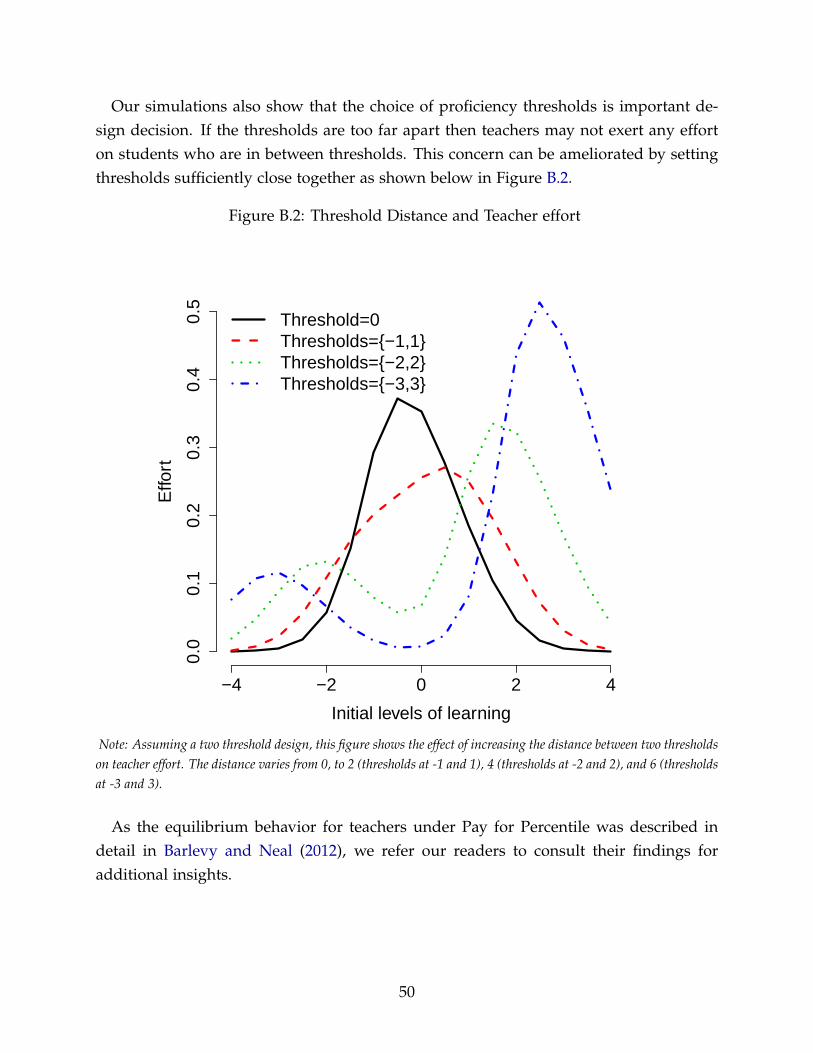
Our simulations also show that the choice of proficiency thresholds is important de-sign decision. If the thresholds are too far apart then teachers may not exert any efforton students who are in between thresholds. This concern can be ameliorated by settingthresholds sufficiently close together as shown below in Figure B.2.
Figure B.2: Threshold Distance and Teacher effort
−4 −2 0 2 4
0.0
0.1
0.2
0.3
0.4
0.5
Initial levels of learning
Effo
rt
Threshold=0Thresholds={−1,1}Thresholds={−2,2}Thresholds={−3,3}
Note: Assuming a two threshold design, this figure shows the effect of increasing the distance between two thresholdson teacher effort. The distance varies from 0, to 2 (thresholds at -1 and 1), 4 (thresholds at -2 and 2), and 6 (thresholdsat -3 and 3).
As the equilibrium behavior for teachers under Pay for Percentile was described indetail in Barlevy and Neal (2012), we refer our readers to consult their findings foradditional insights.
50
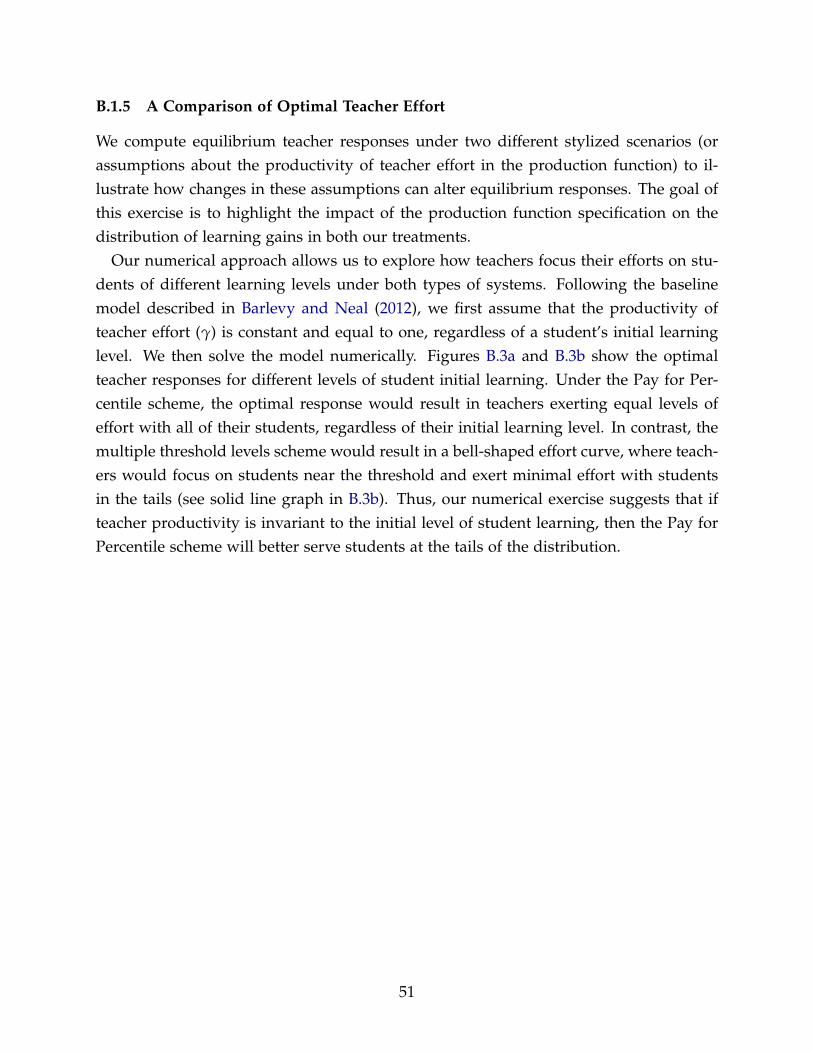
B.1.5 A Comparison of Optimal Teacher Effort
We compute equilibrium teacher responses under two different stylized scenarios (orassumptions about the productivity of teacher effort in the production function) to il-lustrate how changes in these assumptions can alter equilibrium responses. The goal ofthis exercise is to highlight the impact of the production function specification on thedistribution of learning gains in both our treatments.
Our numerical approach allows us to explore how teachers focus their efforts on stu-dents of different learning levels under both types of systems. Following the baselinemodel described in Barlevy and Neal (2012), we first assume that the productivity ofteacher effort (γ) is constant and equal to one, regardless of a student’s initial learninglevel. We then solve the model numerically. Figures B.3a and B.3b show the optimalteacher responses for different levels of student initial learning. Under the Pay for Per-centile scheme, the optimal response would result in teachers exerting equal levels ofeffort with all of their students, regardless of their initial learning level. In contrast, themultiple threshold levels scheme would result in a bell-shaped effort curve, where teach-ers would focus on students near the threshold and exert minimal effort with studentsin the tails (see solid line graph in B.3b). Thus, our numerical exercise suggests that ifteacher productivity is invariant to the initial level of student learning, then the Pay forPercentile scheme will better serve students at the tails of the distribution.
51
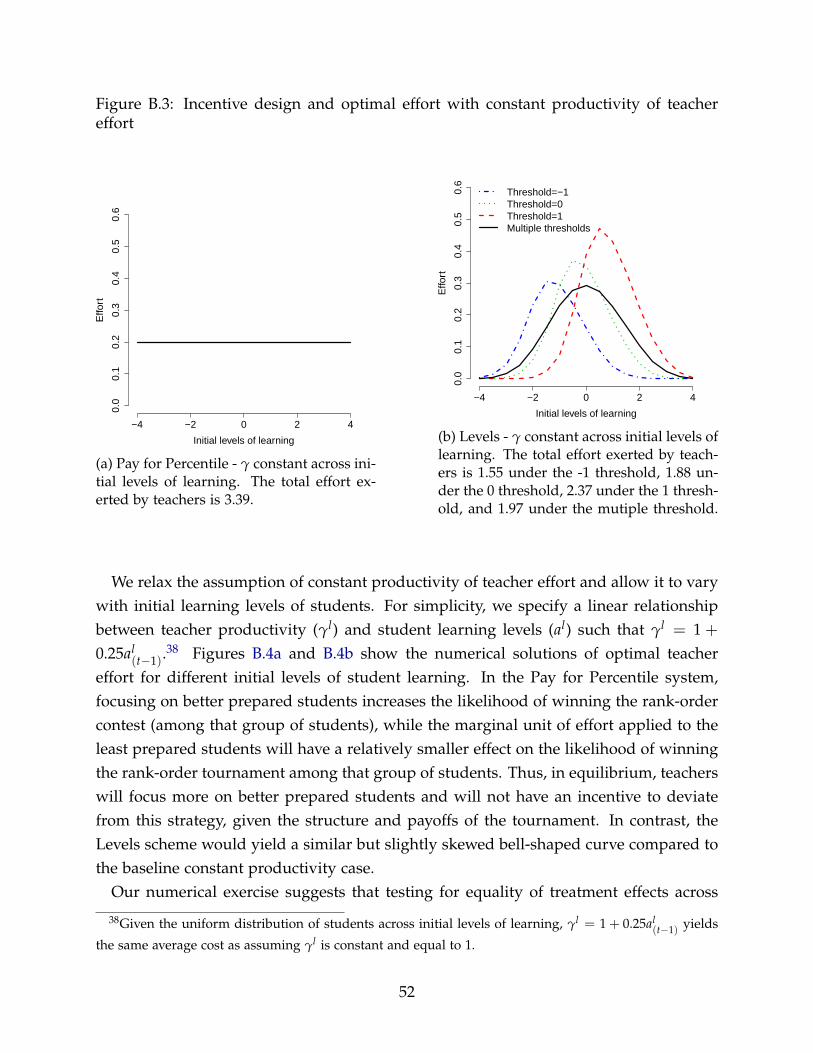
Figure B.3: Incentive design and optimal effort with constant productivity of teachereffort
−4 −2 0 2 4
0.0
0.1
0.2
0.3
0.4
0.5
0.6
Initial levels of learning
Effo
rt
(a) Pay for Percentile - γ constant across ini-tial levels of learning. The total effort ex-erted by teachers is 3.39.
−4 −2 0 2 4
0.0
0.1
0.2
0.3
0.4
0.5
0.6
Initial levels of learning
Effo
rt
Threshold=−1Threshold=0Threshold=1Multiple thresholds
(b) Levels - γ constant across initial levels oflearning. The total effort exerted by teach-ers is 1.55 under the -1 threshold, 1.88 un-der the 0 threshold, 2.37 under the 1 thresh-old, and 1.97 under the mutiple threshold.
We relax the assumption of constant productivity of teacher effort and allow it to varywith initial learning levels of students. For simplicity, we specify a linear relationshipbetween teacher productivity (γl) and student learning levels (al) such that γl = 1 +
0.25al(t−1).
38 Figures B.4a and B.4b show the numerical solutions of optimal teachereffort for different initial levels of student learning. In the Pay for Percentile system,focusing on better prepared students increases the likelihood of winning the rank-ordercontest (among that group of students), while the marginal unit of effort applied to theleast prepared students will have a relatively smaller effect on the likelihood of winningthe rank-order tournament among that group of students. Thus, in equilibrium, teacherswill focus more on better prepared students and will not have an incentive to deviatefrom this strategy, given the structure and payoffs of the tournament. In contrast, theLevels scheme would yield a similar but slightly skewed bell-shaped curve compared tothe baseline constant productivity case.
Our numerical exercise suggests that testing for equality of treatment effects across
38Given the uniform distribution of students across initial levels of learning, γl = 1 + 0.25al(t−1) yields
the same average cost as assuming γl is constant and equal to 1.
52
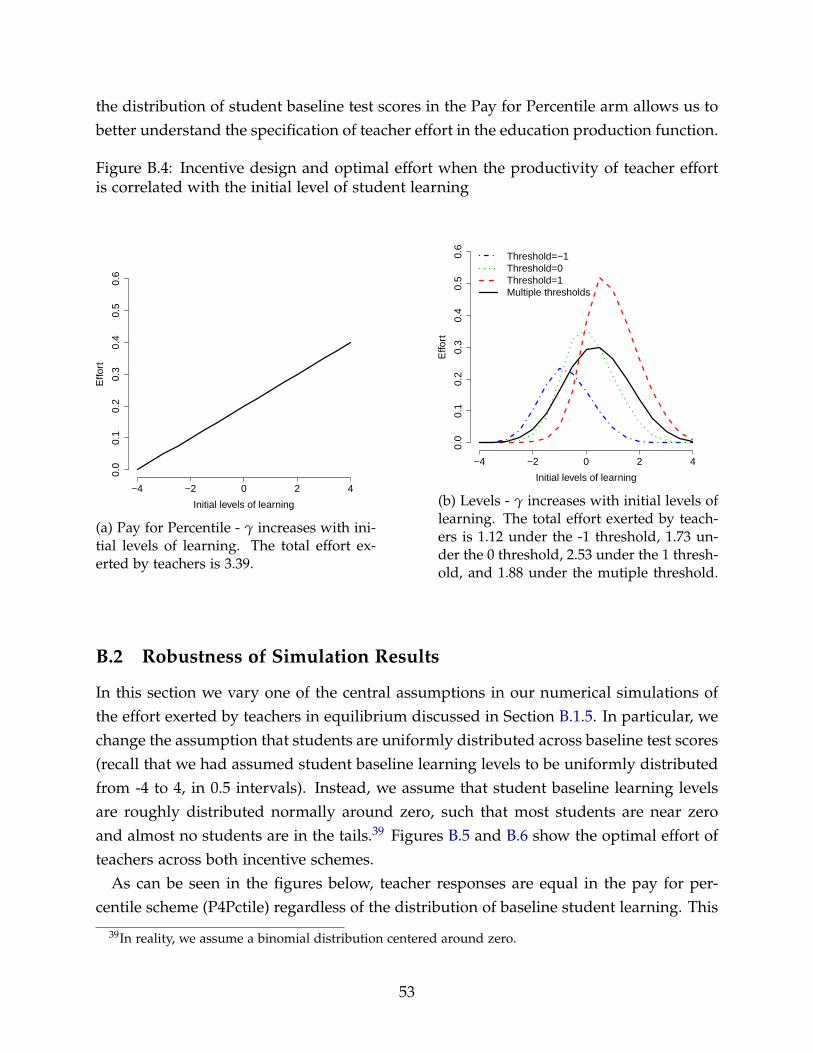
the distribution of student baseline test scores in the Pay for Percentile arm allows us tobetter understand the specification of teacher effort in the education production function.
Figure B.4: Incentive design and optimal effort when the productivity of teacher effortis correlated with the initial level of student learning
−4 −2 0 2 4
0.0
0.1
0.2
0.3
0.4
0.5
0.6
Initial levels of learning
Effo
rt
(a) Pay for Percentile - γ increases with ini-tial levels of learning. The total effort ex-erted by teachers is 3.39.
−4 −2 0 2 40.
00.
10.
20.
30.
40.
50.
6
Initial levels of learning
Effo
rt
Threshold=−1Threshold=0Threshold=1Multiple thresholds
(b) Levels - γ increases with initial levels oflearning. The total effort exerted by teach-ers is 1.12 under the -1 threshold, 1.73 un-der the 0 threshold, 2.53 under the 1 thresh-old, and 1.88 under the mutiple threshold.
B.2 Robustness of Simulation Results
In this section we vary one of the central assumptions in our numerical simulations ofthe effort exerted by teachers in equilibrium discussed in Section B.1.5. In particular, wechange the assumption that students are uniformly distributed across baseline test scores(recall that we had assumed student baseline learning levels to be uniformly distributedfrom -4 to 4, in 0.5 intervals). Instead, we assume that student baseline learning levelsare roughly distributed normally around zero, such that most students are near zeroand almost no students are in the tails.39 Figures B.5 and B.6 show the optimal effort ofteachers across both incentive schemes.
As can be seen in the figures below, teacher responses are equal in the pay for per-centile scheme (P4Pctile) regardless of the distribution of baseline student learning. This
39In reality, we assume a binomial distribution centered around zero.
53
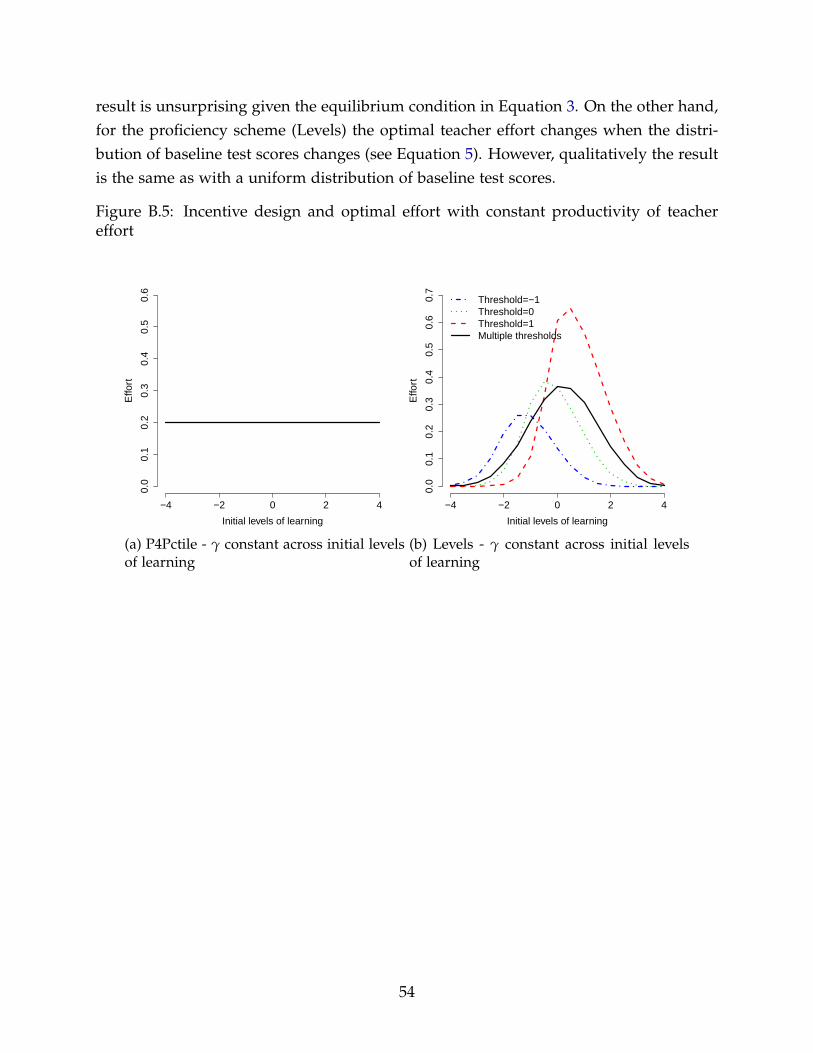
result is unsurprising given the equilibrium condition in Equation 3. On the other hand,for the proficiency scheme (Levels) the optimal teacher effort changes when the distri-bution of baseline test scores changes (see Equation 5). However, qualitatively the resultis the same as with a uniform distribution of baseline test scores.
Figure B.5: Incentive design and optimal effort with constant productivity of teachereffort
−4 −2 0 2 4
0.0
0.1
0.2
0.3
0.4
0.5
0.6
Initial levels of learning
Effo
rt
(a) P4Pctile - γ constant across initial levelsof learning
−4 −2 0 2 4
0.0
0.1
0.2
0.3
0.4
0.5
0.6
0.7
Initial levels of learning
Effo
rt
Threshold=−1Threshold=0Threshold=1Multiple thresholds
(b) Levels - γ constant across initial levelsof learning
54
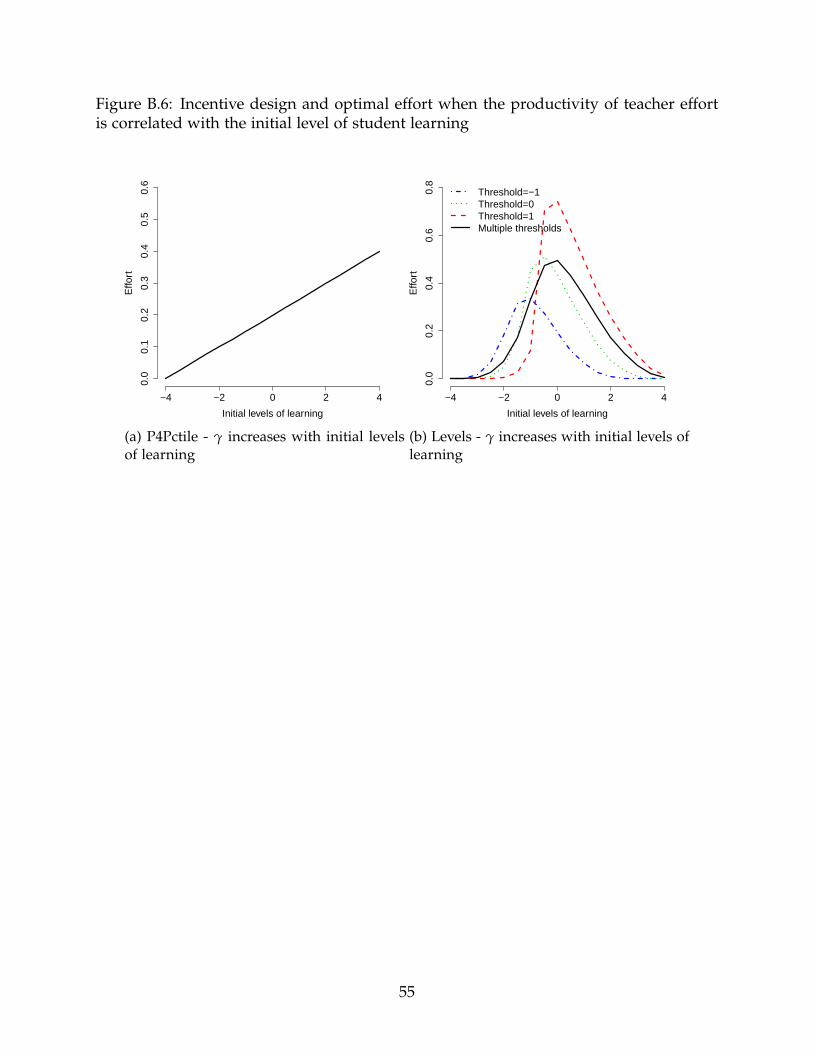
Figure B.6: Incentive design and optimal effort when the productivity of teacher effortis correlated with the initial level of student learning
−4 −2 0 2 4
0.0
0.1
0.2
0.3
0.4
0.5
0.6
Initial levels of learning
Effo
rt
(a) P4Pctile - γ increases with initial levelsof learning
−4 −2 0 2 4
0.0
0.2
0.4
0.6
0.8
Initial levels of learningE
ffort
Threshold=−1Threshold=0Threshold=1Multiple thresholds
(b) Levels - γ increases with initial levels oflearning
55
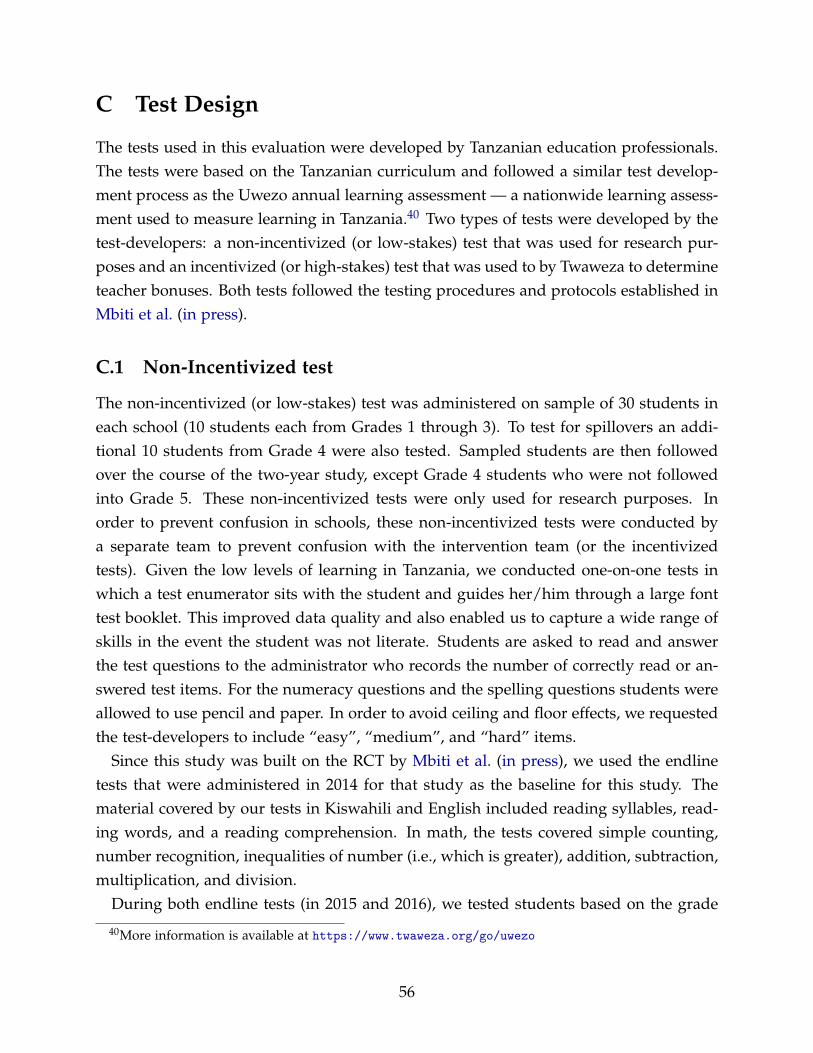
C Test Design
The tests used in this evaluation were developed by Tanzanian education professionals.The tests were based on the Tanzanian curriculum and followed a similar test develop-ment process as the Uwezo annual learning assessment — a nationwide learning assess-ment used to measure learning in Tanzania.40 Two types of tests were developed by thetest-developers: a non-incentivized (or low-stakes) test that was used for research pur-poses and an incentivized (or high-stakes) test that was used to by Twaweza to determineteacher bonuses. Both tests followed the testing procedures and protocols established inMbiti et al. (in press).
C.1 Non-Incentivized test
The non-incentivized (or low-stakes) test was administered on sample of 30 students ineach school (10 students each from Grades 1 through 3). To test for spillovers an addi-tional 10 students from Grade 4 were also tested. Sampled students are then followedover the course of the two-year study, except Grade 4 students who were not followedinto Grade 5. These non-incentivized tests were only used for research purposes. Inorder to prevent confusion in schools, these non-incentivized tests were conducted bya separate team to prevent confusion with the intervention team (or the incentivizedtests). Given the low levels of learning in Tanzania, we conducted one-on-one tests inwhich a test enumerator sits with the student and guides her/him through a large fonttest booklet. This improved data quality and also enabled us to capture a wide range ofskills in the event the student was not literate. Students are asked to read and answerthe test questions to the administrator who records the number of correctly read or an-swered test items. For the numeracy questions and the spelling questions students wereallowed to use pencil and paper. In order to avoid ceiling and floor effects, we requestedthe test-developers to include “easy”, “medium”, and “hard” items.
Since this study was built on the RCT by Mbiti et al. (in press), we used the endlinetests that were administered in 2014 for that study as the baseline for this study. Thematerial covered by our tests in Kiswahili and English included reading syllables, read-ing words, and a reading comprehension. In math, the tests covered simple counting,number recognition, inequalities of number (i.e., which is greater), addition, subtraction,multiplication, and division.
During both endline tests (in 2015 and 2016), we tested students based on the grade
40More information is available at https://www.twaweza.org/go/uwezo
56

we expected them to be enrolled. Both of these tests were grade specific tests designedto measure the main competencies outlined in the curriculum. The content of the testsis summarized in in Table C.1. The number of items of each test varied. In the firstyear the Kiswahili and English tests included 27 items for grade 1, 20 items for grade 2,and 9 items for grade 3. In the second year, the number of items was reduced mainlyby dropping items that required students to write (or spell). For math, there were 34items for grade 1, 24 items for grade 2, and 24 items for grade 3. In the second year, thenumber of items on the grade 1 math test was reduced. However, we added a numberof easier items to the grade 3 test, and left the length of the grade 2 test unchanged.
We standardize test scores using the mean and standard deviation of the control groupto compute Z-scores. We also scale the test scores using Item Response Theory (IRT)methods so that all students are on the same scale. The IRT scaling allows us to convertthe estimated treatment effects (measured in SDs) to equivalent years of schooling.
C.2 Incentivized test
The incentivized (or high-stakes) tests were used to determine teacher bonuses. Thesetests were taken by all students in grades 1, 2, and 3. Although there are no bonusesin the control schools, we administer the same type of “incentivized tests” in controlschools so that we could compute treatment effects using the incentivized test data. Anumber of measures were introduced to enhance test security. First, to prevent test-taking by non-target grade candidates, students could only be tested if their name hadbeen listed and their photo taken at baseline. Second, there were ten versions of thetests to prevent copying and leakage; each student was assigned a randomly generatednumber from a table to identify the test version, with the choice of the number based onday of the week and the first letter of the student’s name. Finally, tests were handled,administered, and scored by Twaweza without any teacher involvement. Several checkswere done ex-post by Twaweza to ensure there was not any cheating on the high-stakestest.
C.3 Comparability of tests
Both types of tests followed the same test-development framework. As a result, the sub-ject order, question type, and phrasing was similar across both tests. The main differenceis the incentivized test is shorter (about 15 mins per student) and uses a variety of stop-ping rules to reduce testing time. The non-incentivized test took about 40 minutes and
57
covered more skills. It also included more questions to avoid bottom- and top-coding.The specific skills tested are outlined in Table C.1.
Although the content between the two types of test is similar, there are a number of im-portant differences in the administration of the tests. The non-incentivized tests includedan “other subject” module to measure potential spillover effects. Non-incentivized testswere administered by taking sampled students out of their classroom during a regularschool day. In contrast, the incentivized tests were more “official” as all students inGrades 1-3 were tested on a prearranged test day. On the test day, students in othergrades would sometimes be sent home to avoid distractions. Extra-curricular activitieswere also canceled during the Twaweza test. In addition, most schools used the incen-tivized test as the end of year test. This also likely encouraged students in the controlgroup to exert effort on the test.
58
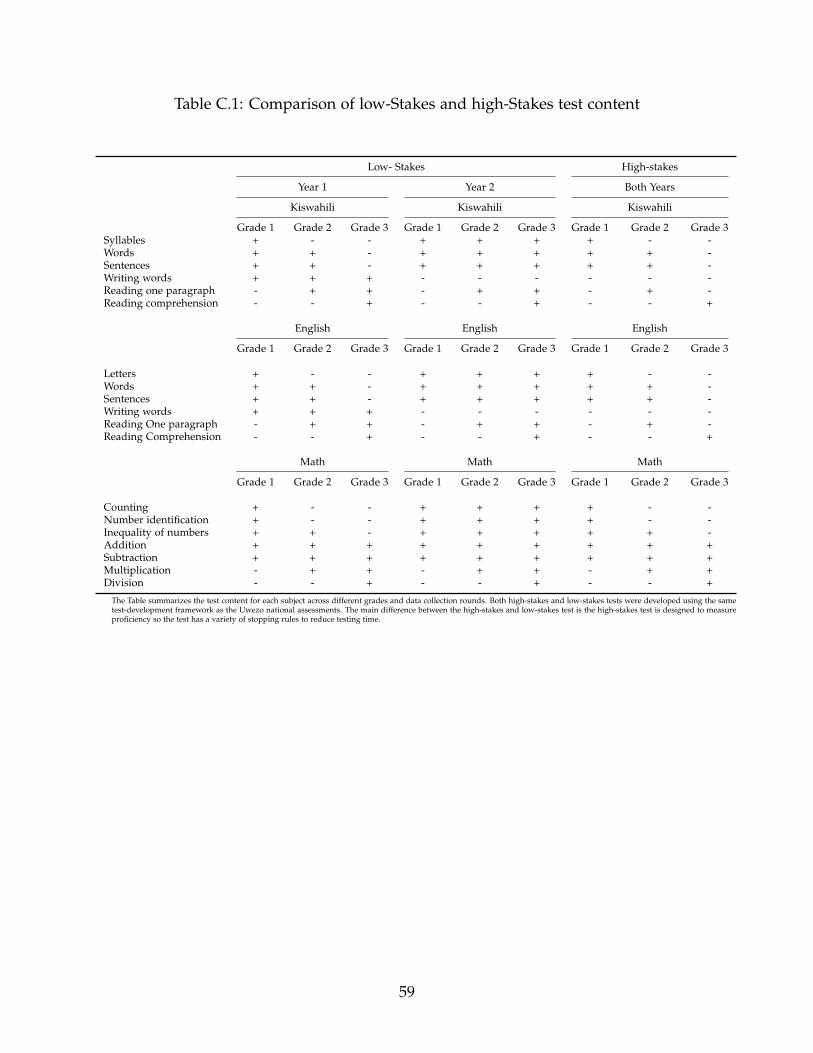
Table C.1: Comparison of low-Stakes and high-Stakes test content
Low- Stakes High-stakes
Year 1 Year 2 Both Years
Kiswahili Kiswahili Kiswahili
Grade 1 Grade 2 Grade 3 Grade 1 Grade 2 Grade 3 Grade 1 Grade 2 Grade 3Syllables + - - + + + + - -Words + + - + + + + + -Sentences + + - + + + + + -Writing words + + + - - - - - -Reading one paragraph - + + - + + - + -Reading comprehension - - + - - + - - +
English English English
Grade 1 Grade 2 Grade 3 Grade 1 Grade 2 Grade 3 Grade 1 Grade 2 Grade 3
Letters + - - + + + + - -Words + + - + + + + + -Sentences + + - + + + + + -Writing words + + + - - - - - -Reading One paragraph - + + - + + - + -Reading Comprehension - - + - - + - - +
Math Math Math
Grade 1 Grade 2 Grade 3 Grade 1 Grade 2 Grade 3 Grade 1 Grade 2 Grade 3
Counting + - - + + + + - -Number identification + - - + + + + - -Inequality of numbers + + - + + + + + -Addition + + + + + + + + +Subtraction + + + + + + + + +Multiplication - + + - + + - + +Division - - + - - + - - +
The Table summarizes the test content for each subject across different grades and data collection rounds. Both high-stakes and low-stakes tests were developed using the sametest-development framework as the Uwezo national assessments. The main difference between the high-stakes and low-stakes test is the high-stakes test is designed to measureproficiency so the test has a variety of stopping rules to reduce testing time.
59
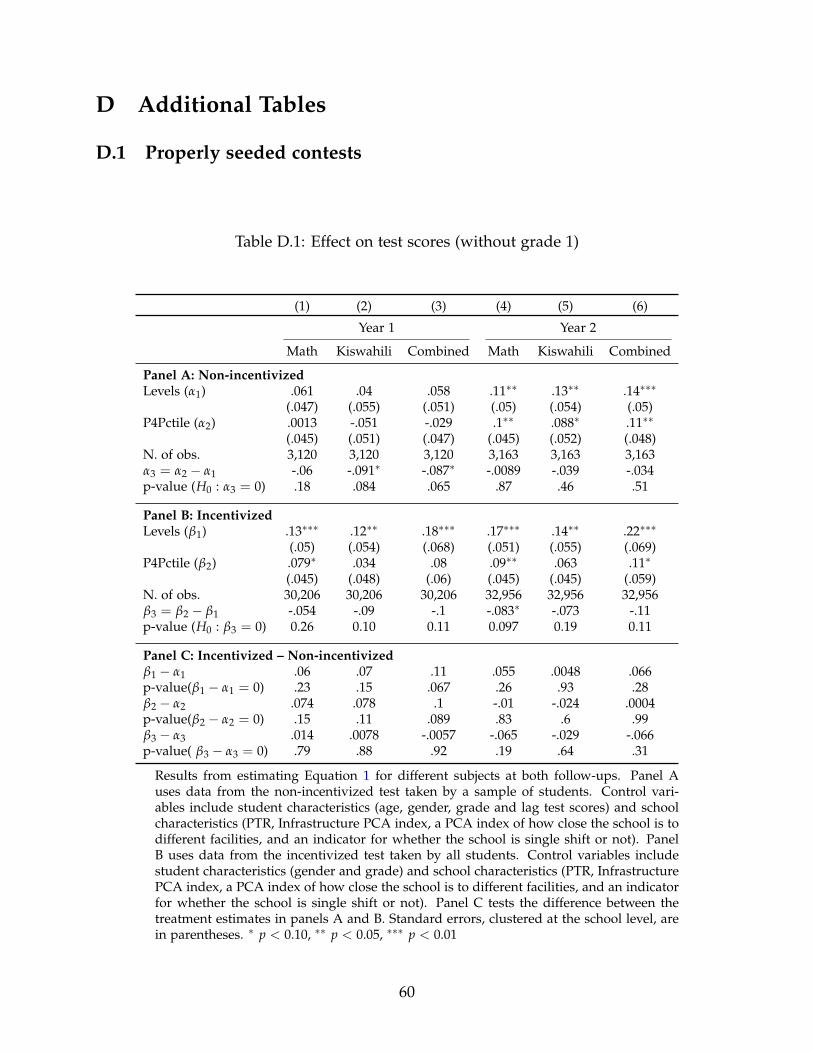
D Additional Tables
D.1 Properly seeded contests
Table D.1: Effect on test scores (without grade 1)
(1) (2) (3) (4) (5) (6)
Year 1 Year 2
Math Kiswahili Combined Math Kiswahili Combined
Panel A: Non-incentivizedLevels (α1) .061 .04 .058 .11∗∗ .13∗∗ .14∗∗∗
(.047) (.055) (.051) (.05) (.054) (.05)P4Pctile (α2) .0013 -.051 -.029 .1∗∗ .088∗ .11∗∗
(.045) (.051) (.047) (.045) (.052) (.048)N. of obs. 3,120 3,120 3,120 3,163 3,163 3,163α3 = α2 − α1 -.06 -.091∗ -.087∗ -.0089 -.039 -.034p-value (H0 : α3 = 0) .18 .084 .065 .87 .46 .51
Panel B: IncentivizedLevels (β1) .13∗∗∗ .12∗∗ .18∗∗∗ .17∗∗∗ .14∗∗ .22∗∗∗
(.05) (.054) (.068) (.051) (.055) (.069)P4Pctile (β2) .079∗ .034 .08 .09∗∗ .063 .11∗
(.045) (.048) (.06) (.045) (.045) (.059)N. of obs. 30,206 30,206 30,206 32,956 32,956 32,956β3 = β2 − β1 -.054 -.09 -.1 -.083∗ -.073 -.11p-value (H0 : β3 = 0) 0.26 0.10 0.11 0.097 0.19 0.11
Panel C: Incentivized – Non-incentivizedβ1 − α1 .06 .07 .11 .055 .0048 .066p-value(β1 − α1 = 0) .23 .15 .067 .26 .93 .28β2 − α2 .074 .078 .1 -.01 -.024 .0004p-value(β2 − α2 = 0) .15 .11 .089 .83 .6 .99β3 − α3 .014 .0078 -.0057 -.065 -.029 -.066p-value( β3 − α3 = 0) .79 .88 .92 .19 .64 .31
Results from estimating Equation 1 for different subjects at both follow-ups. Panel Auses data from the non-incentivized test taken by a sample of students. Control vari-ables include student characteristics (age, gender, grade and lag test scores) and schoolcharacteristics (PTR, Infrastructure PCA index, a PCA index of how close the school is todifferent facilities, and an indicator for whether the school is single shift or not). PanelB uses data from the incentivized test taken by all students. Control variables includestudent characteristics (gender and grade) and school characteristics (PTR, InfrastructurePCA index, a PCA index of how close the school is to different facilities, and an indicatorfor whether the school is single shift or not). Panel C tests the difference between thetreatment estimates in panels A and B. Standard errors, clustered at the school level, arein parentheses. ∗ p < 0.10, ∗∗ p < 0.05, ∗∗∗ p < 0.01
60
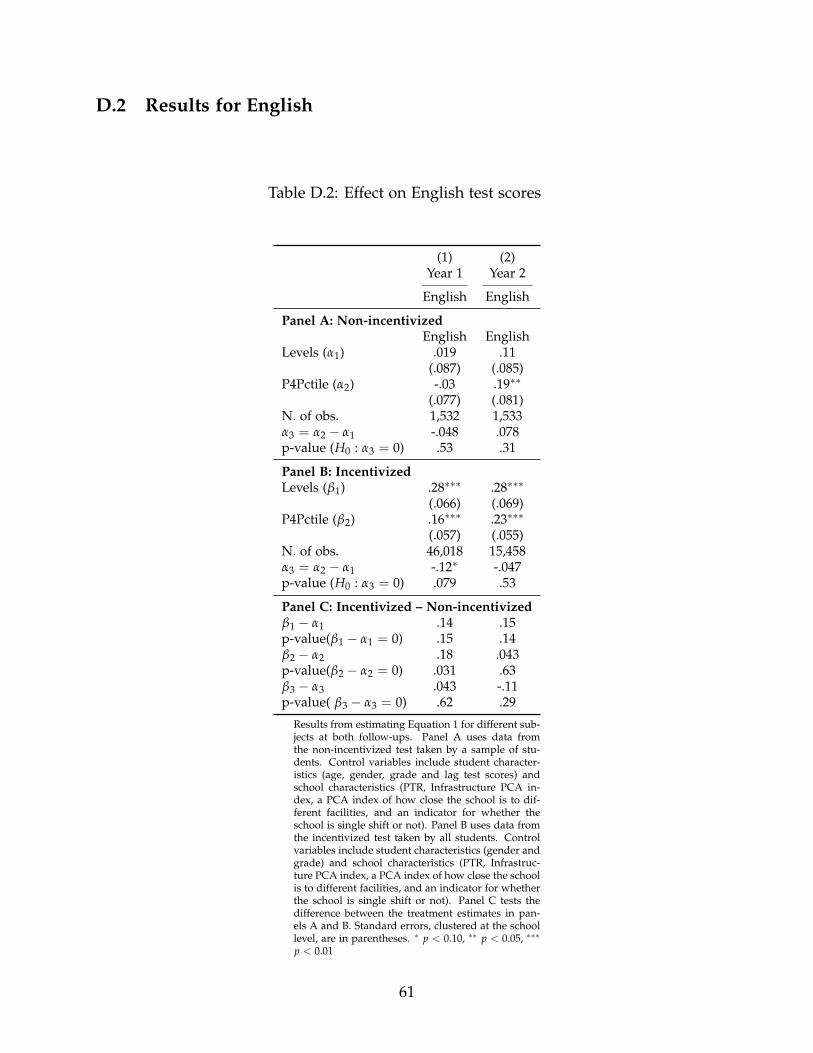
D.2 Results for English
Table D.2: Effect on English test scores
(1) (2)Year 1 Year 2
English English
Panel A: Non-incentivizedEnglish English
Levels (α1) .019 .11(.087) (.085)
P4Pctile (α2) -.03 .19∗∗
(.077) (.081)N. of obs. 1,532 1,533α3 = α2 − α1 -.048 .078p-value (H0 : α3 = 0) .53 .31
Panel B: IncentivizedLevels (β1) .28∗∗∗ .28∗∗∗
(.066) (.069)P4Pctile (β2) .16∗∗∗ .23∗∗∗
(.057) (.055)N. of obs. 46,018 15,458α3 = α2 − α1 -.12∗ -.047p-value (H0 : α3 = 0) .079 .53
Panel C: Incentivized – Non-incentivizedβ1 − α1 .14 .15p-value(β1 − α1 = 0) .15 .14β2 − α2 .18 .043p-value(β2 − α2 = 0) .031 .63β3 − α3 .043 -.11p-value( β3 − α3 = 0) .62 .29
Results from estimating Equation 1 for different sub-jects at both follow-ups. Panel A uses data fromthe non-incentivized test taken by a sample of stu-dents. Control variables include student character-istics (age, gender, grade and lag test scores) andschool characteristics (PTR, Infrastructure PCA in-dex, a PCA index of how close the school is to dif-ferent facilities, and an indicator for whether theschool is single shift or not). Panel B uses data fromthe incentivized test taken by all students. Controlvariables include student characteristics (gender andgrade) and school characteristics (PTR, Infrastruc-ture PCA index, a PCA index of how close the schoolis to different facilities, and an indicator for whetherthe school is single shift or not). Panel C tests thedifference between the treatment estimates in pan-els A and B. Standard errors, clustered at the schoollevel, are in parentheses. ∗ p < 0.10, ∗∗ p < 0.05, ∗∗∗
p < 0.01
61
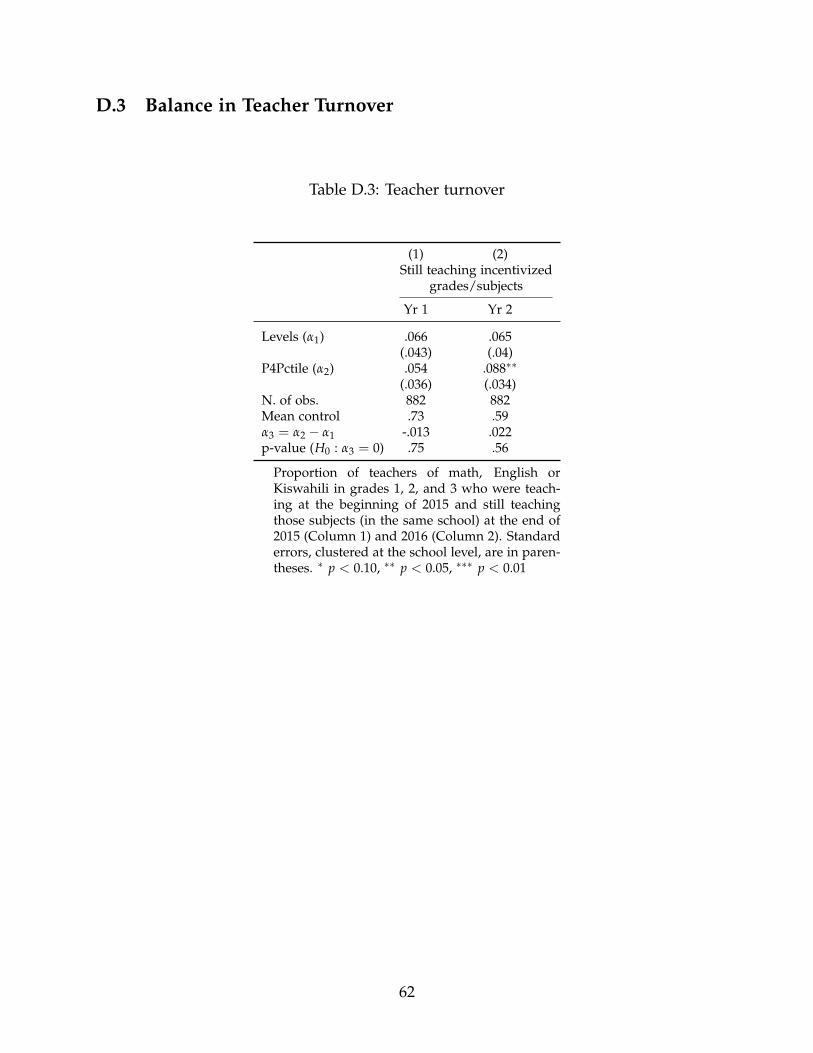
D.3 Balance in Teacher Turnover
Table D.3: Teacher turnover
(1) (2)Still teaching incentivized
grades/subjects
Yr 1 Yr 2
Levels (α1) .066 .065(.043) (.04)
P4Pctile (α2) .054 .088∗∗
(.036) (.034)N. of obs. 882 882Mean control .73 .59α3 = α2 − α1 -.013 .022p-value (H0 : α3 = 0) .75 .56
Proportion of teachers of math, English orKiswahili in grades 1, 2, and 3 who were teach-ing at the beginning of 2015 and still teachingthose subjects (in the same school) at the end of2015 (Column 1) and 2016 (Column 2). Standarderrors, clustered at the school level, are in paren-theses. ∗ p < 0.10, ∗∗ p < 0.05, ∗∗∗ p < 0.01
62
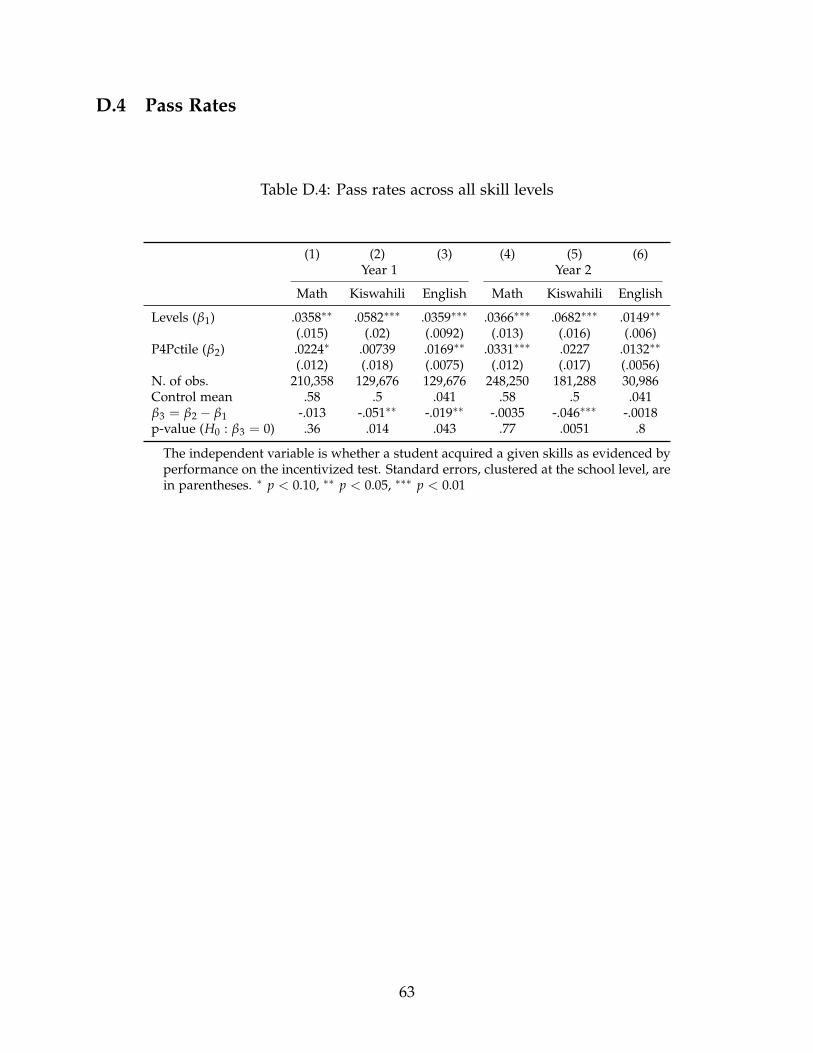
D.4 Pass Rates
Table D.4: Pass rates across all skill levels
(1) (2) (3) (4) (5) (6)Year 1 Year 2
Math Kiswahili English Math Kiswahili English
Levels (β1) .0358∗∗ .0582∗∗∗ .0359∗∗∗ .0366∗∗∗ .0682∗∗∗ .0149∗∗
(.015) (.02) (.0092) (.013) (.016) (.006)P4Pctile (β2) .0224∗ .00739 .0169∗∗ .0331∗∗∗ .0227 .0132∗∗
(.012) (.018) (.0075) (.012) (.017) (.0056)N. of obs. 210,358 129,676 129,676 248,250 181,288 30,986Control mean .58 .5 .041 .58 .5 .041β3 = β2 − β1 -.013 -.051∗∗ -.019∗∗ -.0035 -.046∗∗∗ -.0018p-value (H0 : β3 = 0) .36 .014 .043 .77 .0051 .8
The independent variable is whether a student acquired a given skills as evidenced byperformance on the incentivized test. Standard errors, clustered at the school level, arein parentheses. ∗ p < 0.10, ∗∗ p < 0.05, ∗∗∗ p < 0.01
63
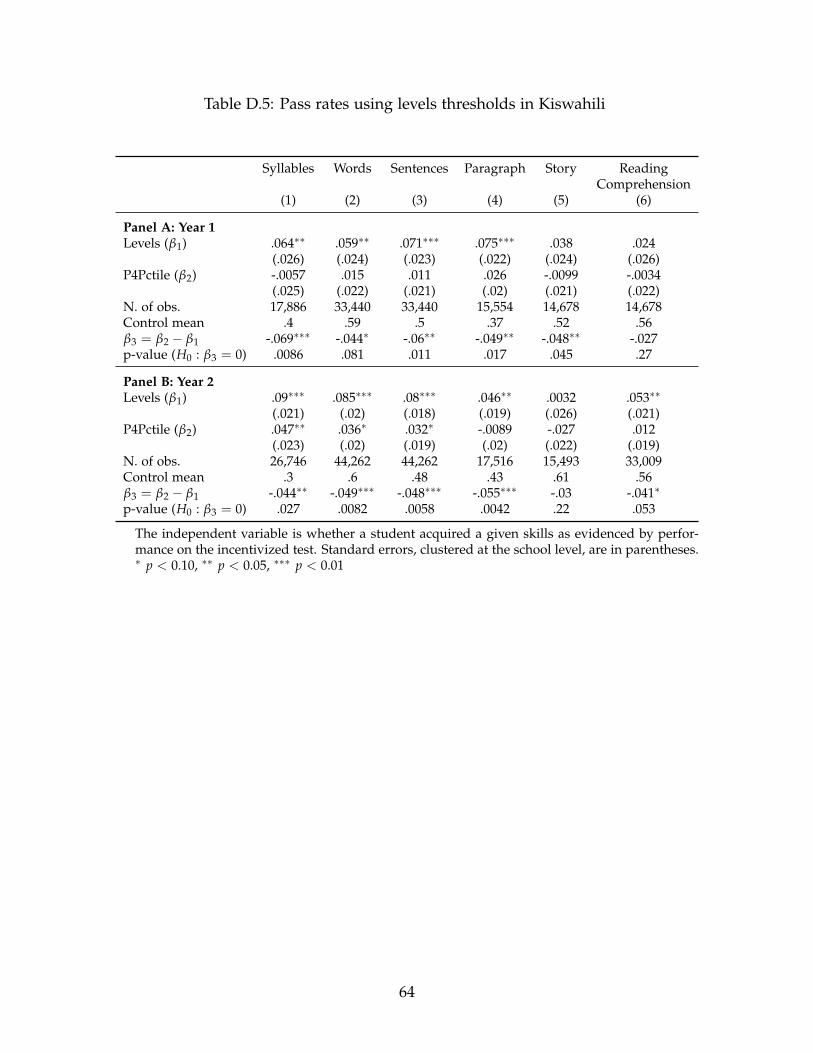
Table D.5: Pass rates using levels thresholds in Kiswahili
Syllables Words Sentences Paragraph Story ReadingComprehension
(1) (2) (3) (4) (5) (6)
Panel A: Year 1Levels (β1) .064∗∗ .059∗∗ .071∗∗∗ .075∗∗∗ .038 .024
(.026) (.024) (.023) (.022) (.024) (.026)P4Pctile (β2) -.0057 .015 .011 .026 -.0099 -.0034
(.025) (.022) (.021) (.02) (.021) (.022)N. of obs. 17,886 33,440 33,440 15,554 14,678 14,678Control mean .4 .59 .5 .37 .52 .56β3 = β2 − β1 -.069∗∗∗ -.044∗ -.06∗∗ -.049∗∗ -.048∗∗ -.027p-value (H0 : β3 = 0) .0086 .081 .011 .017 .045 .27
Panel B: Year 2Levels (β1) .09∗∗∗ .085∗∗∗ .08∗∗∗ .046∗∗ .0032 .053∗∗
(.021) (.02) (.018) (.019) (.026) (.021)P4Pctile (β2) .047∗∗ .036∗ .032∗ -.0089 -.027 .012
(.023) (.02) (.019) (.02) (.022) (.019)N. of obs. 26,746 44,262 44,262 17,516 15,493 33,009Control mean .3 .6 .48 .43 .61 .56β3 = β2 − β1 -.044∗∗ -.049∗∗∗ -.048∗∗∗ -.055∗∗∗ -.03 -.041∗
p-value (H0 : β3 = 0) .027 .0082 .0058 .0042 .22 .053
The independent variable is whether a student acquired a given skills as evidenced by perfor-mance on the incentivized test. Standard errors, clustered at the school level, are in parentheses.∗ p < 0.10, ∗∗ p < 0.05, ∗∗∗ p < 0.01
64
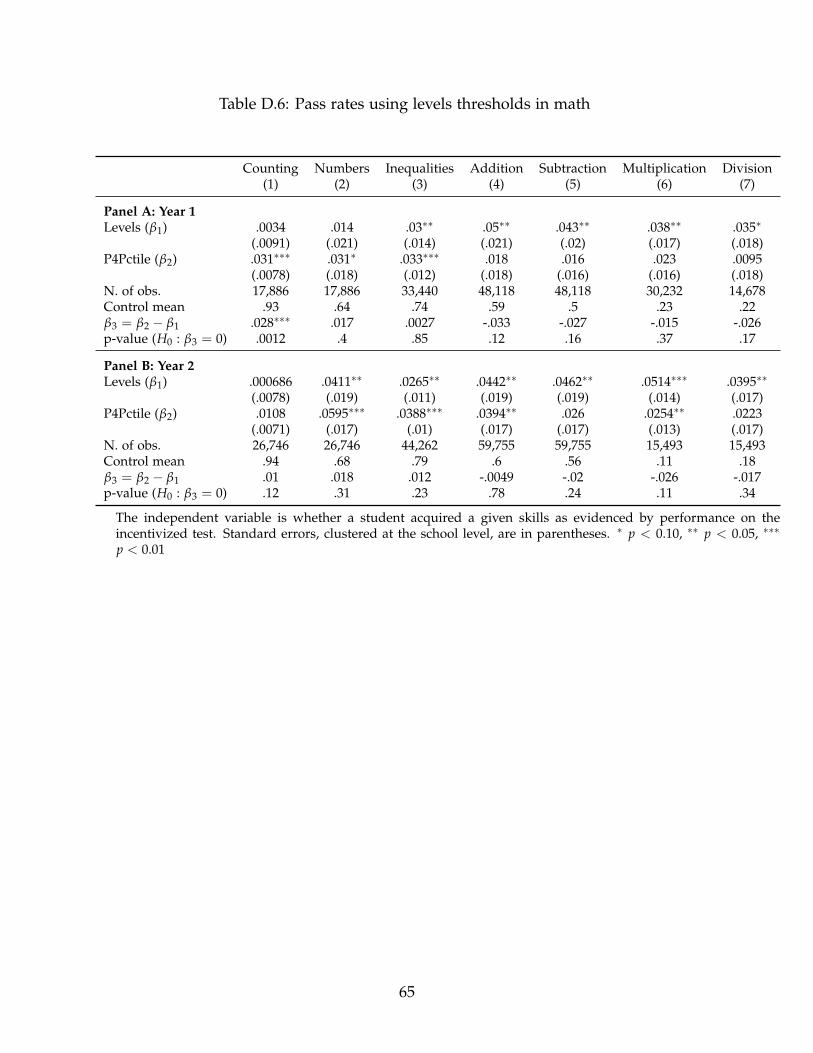
Table D.6: Pass rates using levels thresholds in math
Counting Numbers Inequalities Addition Subtraction Multiplication Division(1) (2) (3) (4) (5) (6) (7)
Panel A: Year 1Levels (β1) .0034 .014 .03∗∗ .05∗∗ .043∗∗ .038∗∗ .035∗
(.0091) (.021) (.014) (.021) (.02) (.017) (.018)P4Pctile (β2) .031∗∗∗ .031∗ .033∗∗∗ .018 .016 .023 .0095
(.0078) (.018) (.012) (.018) (.016) (.016) (.018)N. of obs. 17,886 17,886 33,440 48,118 48,118 30,232 14,678Control mean .93 .64 .74 .59 .5 .23 .22β3 = β2 − β1 .028∗∗∗ .017 .0027 -.033 -.027 -.015 -.026p-value (H0 : β3 = 0) .0012 .4 .85 .12 .16 .37 .17
Panel B: Year 2Levels (β1) .000686 .0411∗∗ .0265∗∗ .0442∗∗ .0462∗∗ .0514∗∗∗ .0395∗∗
(.0078) (.019) (.011) (.019) (.019) (.014) (.017)P4Pctile (β2) .0108 .0595∗∗∗ .0388∗∗∗ .0394∗∗ .026 .0254∗∗ .0223
(.0071) (.017) (.01) (.017) (.017) (.013) (.017)N. of obs. 26,746 26,746 44,262 59,755 59,755 15,493 15,493Control mean .94 .68 .79 .6 .56 .11 .18β3 = β2 − β1 .01 .018 .012 -.0049 -.02 -.026 -.017p-value (H0 : β3 = 0) .12 .31 .23 .78 .24 .11 .34
The independent variable is whether a student acquired a given skills as evidenced by performance on theincentivized test. Standard errors, clustered at the school level, are in parentheses. ∗ p < 0.10, ∗∗ p < 0.05, ∗∗∗
p < 0.01
65
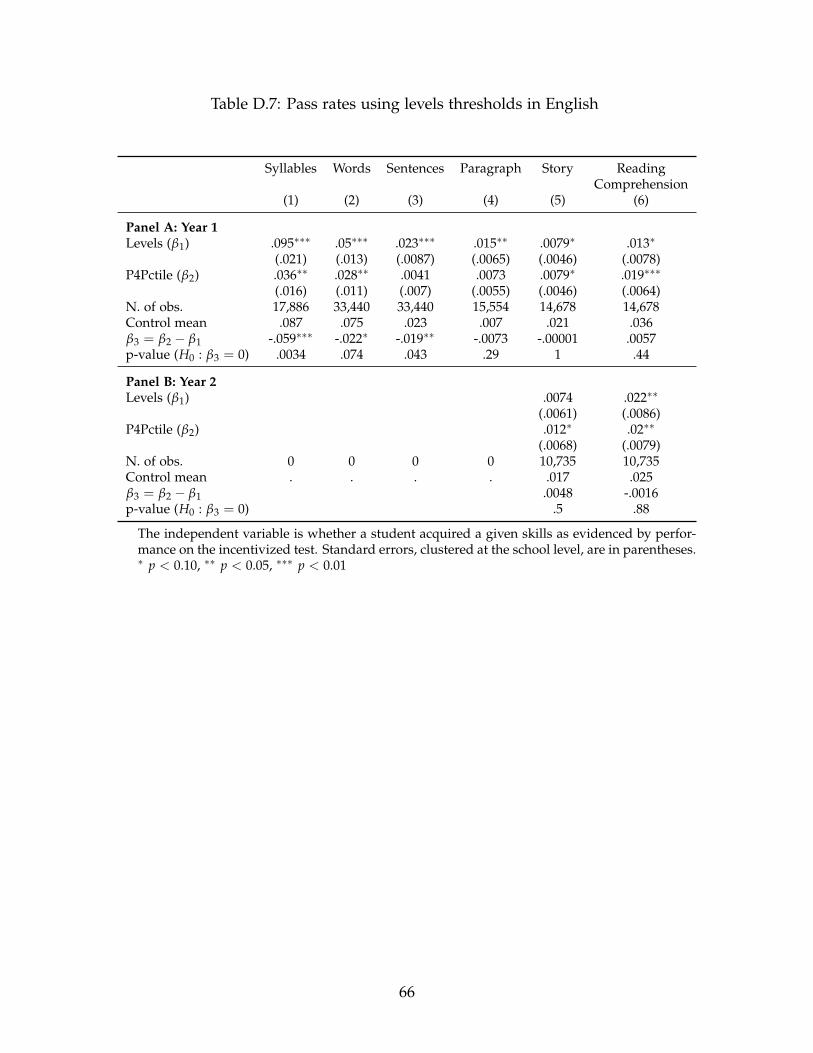
Table D.7: Pass rates using levels thresholds in English
Syllables Words Sentences Paragraph Story ReadingComprehension
(1) (2) (3) (4) (5) (6)
Panel A: Year 1Levels (β1) .095∗∗∗ .05∗∗∗ .023∗∗∗ .015∗∗ .0079∗ .013∗
(.021) (.013) (.0087) (.0065) (.0046) (.0078)P4Pctile (β2) .036∗∗ .028∗∗ .0041 .0073 .0079∗ .019∗∗∗
(.016) (.011) (.007) (.0055) (.0046) (.0064)N. of obs. 17,886 33,440 33,440 15,554 14,678 14,678Control mean .087 .075 .023 .007 .021 .036β3 = β2 − β1 -.059∗∗∗ -.022∗ -.019∗∗ -.0073 -.00001 .0057p-value (H0 : β3 = 0) .0034 .074 .043 .29 1 .44
Panel B: Year 2Levels (β1) .0074 .022∗∗
(.0061) (.0086)P4Pctile (β2) .012∗ .02∗∗
(.0068) (.0079)N. of obs. 0 0 0 0 10,735 10,735Control mean . . . . .017 .025β3 = β2 − β1 .0048 -.0016p-value (H0 : β3 = 0) .5 .88
The independent variable is whether a student acquired a given skills as evidenced by perfor-mance on the incentivized test. Standard errors, clustered at the school level, are in parentheses.∗ p < 0.10, ∗∗ p < 0.05, ∗∗∗ p < 0.01
66
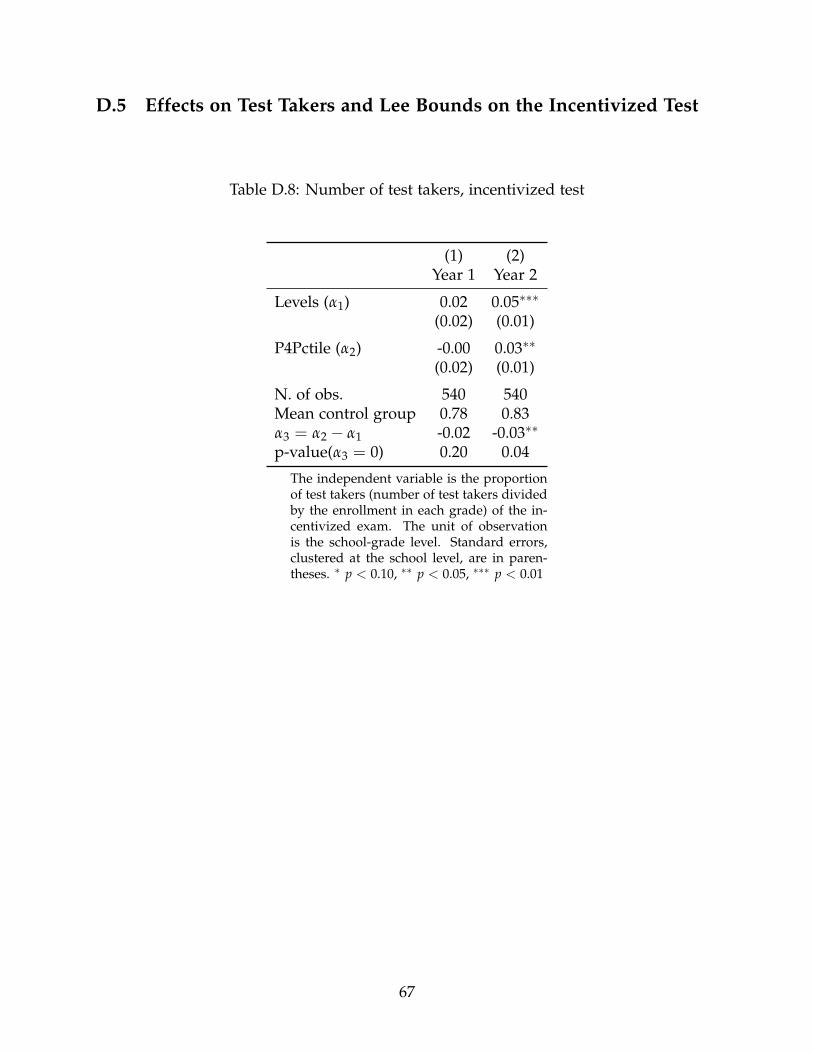
D.5 Effects on Test Takers and Lee Bounds on the Incentivized Test
Table D.8: Number of test takers, incentivized test
(1) (2)Year 1 Year 2
Levels (α1) 0.02 0.05∗∗∗
(0.02) (0.01)
P4Pctile (α2) -0.00 0.03∗∗
(0.02) (0.01)
N. of obs. 540 540Mean control group 0.78 0.83α3 = α2 − α1 -0.02 -0.03∗∗
p-value(α3 = 0) 0.20 0.04
The independent variable is the proportionof test takers (number of test takers dividedby the enrollment in each grade) of the in-centivized exam. The unit of observationis the school-grade level. Standard errors,clustered at the school level, are in paren-theses. ∗ p < 0.10, ∗∗ p < 0.05, ∗∗∗ p < 0.01
67
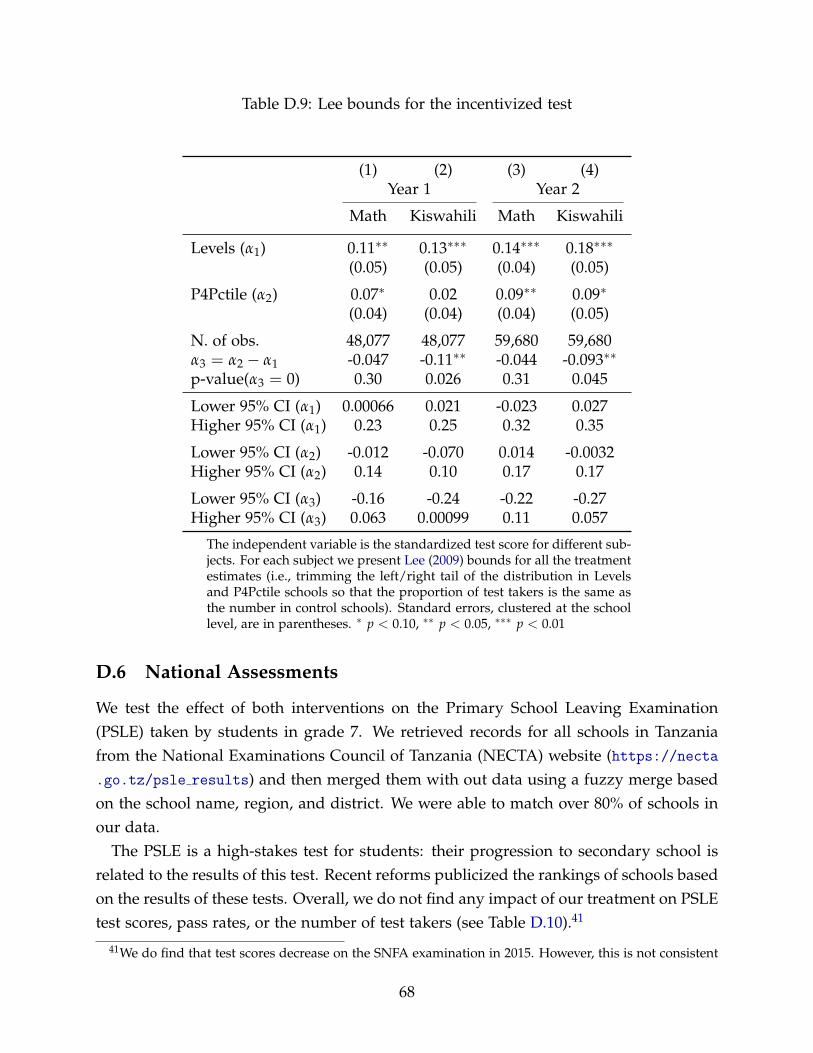
Table D.9: Lee bounds for the incentivized test
(1) (2) (3) (4)Year 1 Year 2
Math Kiswahili Math Kiswahili
Levels (α1) 0.11∗∗ 0.13∗∗∗ 0.14∗∗∗ 0.18∗∗∗
(0.05) (0.05) (0.04) (0.05)
P4Pctile (α2) 0.07∗ 0.02 0.09∗∗ 0.09∗
(0.04) (0.04) (0.04) (0.05)
N. of obs. 48,077 48,077 59,680 59,680α3 = α2 − α1 -0.047 -0.11∗∗ -0.044 -0.093∗∗
p-value(α3 = 0) 0.30 0.026 0.31 0.045
Lower 95% CI (α1) 0.00066 0.021 -0.023 0.027Higher 95% CI (α1) 0.23 0.25 0.32 0.35
Lower 95% CI (α2) -0.012 -0.070 0.014 -0.0032Higher 95% CI (α2) 0.14 0.10 0.17 0.17
Lower 95% CI (α3) -0.16 -0.24 -0.22 -0.27Higher 95% CI (α3) 0.063 0.00099 0.11 0.057
The independent variable is the standardized test score for different sub-jects. For each subject we present Lee (2009) bounds for all the treatmentestimates (i.e., trimming the left/right tail of the distribution in Levelsand P4Pctile schools so that the proportion of test takers is the same asthe number in control schools). Standard errors, clustered at the schoollevel, are in parentheses. ∗ p < 0.10, ∗∗ p < 0.05, ∗∗∗ p < 0.01
D.6 National Assessments
We test the effect of both interventions on the Primary School Leaving Examination(PSLE) taken by students in grade 7. We retrieved records for all schools in Tanzaniafrom the National Examinations Council of Tanzania (NECTA) website (https://necta.go.tz/psle results) and then merged them with out data using a fuzzy merge basedon the school name, region, and district. We were able to match over 80% of schools inour data.
The PSLE is a high-stakes test for students: their progression to secondary school isrelated to the results of this test. Recent reforms publicized the rankings of schools basedon the results of these tests. Overall, we do not find any impact of our treatment on PSLEtest scores, pass rates, or the number of test takers (see Table D.10).41
41We do find that test scores decrease on the SNFA examination in 2015. However, this is not consistent
68
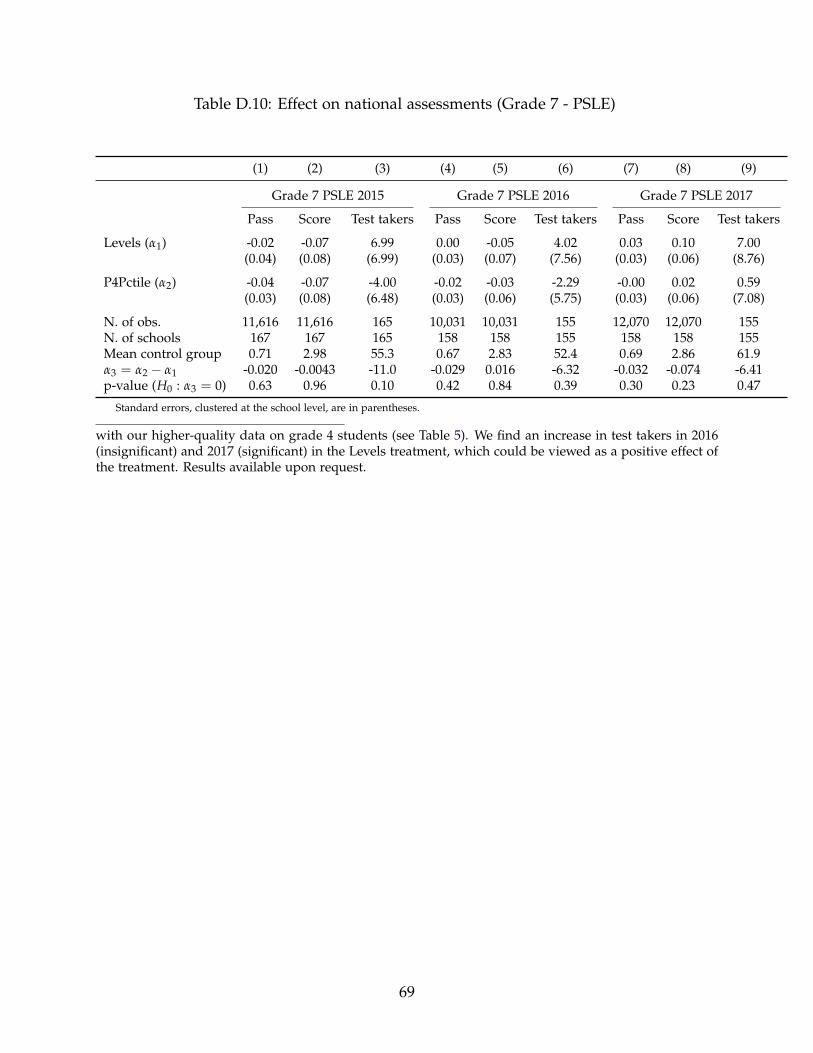
Table D.10: Effect on national assessments (Grade 7 - PSLE)
(1) (2) (3) (4) (5) (6) (7) (8) (9)
Grade 7 PSLE 2015 Grade 7 PSLE 2016 Grade 7 PSLE 2017
Pass Score Test takers Pass Score Test takers Pass Score Test takers
Levels (α1) -0.02 -0.07 6.99 0.00 -0.05 4.02 0.03 0.10 7.00(0.04) (0.08) (6.99) (0.03) (0.07) (7.56) (0.03) (0.06) (8.76)
P4Pctile (α2) -0.04 -0.07 -4.00 -0.02 -0.03 -2.29 -0.00 0.02 0.59(0.03) (0.08) (6.48) (0.03) (0.06) (5.75) (0.03) (0.06) (7.08)
N. of obs. 11,616 11,616 165 10,031 10,031 155 12,070 12,070 155N. of schools 167 167 165 158 158 155 158 158 155Mean control group 0.71 2.98 55.3 0.67 2.83 52.4 0.69 2.86 61.9α3 = α2 − α1 -0.020 -0.0043 -11.0 -0.029 0.016 -6.32 -0.032 -0.074 -6.41p-value (H0 : α3 = 0) 0.63 0.96 0.10 0.42 0.84 0.39 0.30 0.23 0.47
Standard errors, clustered at the school level, are in parentheses.
with our higher-quality data on grade 4 students (see Table 5). We find an increase in test takers in 2016(insignificant) and 2017 (significant) in the Levels treatment, which could be viewed as a positive effect ofthe treatment. Results available upon request.
69
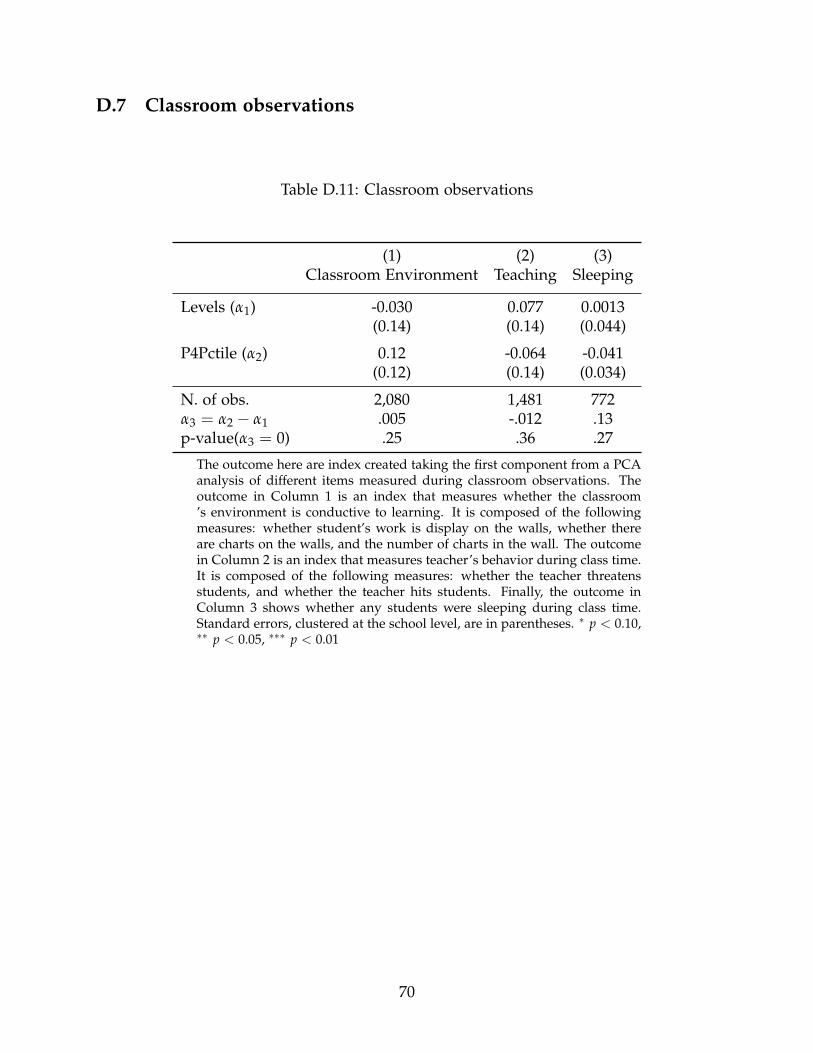
D.7 Classroom observations
Table D.11: Classroom observations
(1) (2) (3)Classroom Environment Teaching Sleeping
Levels (α1) -0.030 0.077 0.0013(0.14) (0.14) (0.044)
P4Pctile (α2) 0.12 -0.064 -0.041(0.12) (0.14) (0.034)
N. of obs. 2,080 1,481 772α3 = α2 − α1 .005 -.012 .13p-value(α3 = 0) .25 .36 .27
The outcome here are index created taking the first component from a PCAanalysis of different items measured during classroom observations. Theoutcome in Column 1 is an index that measures whether the classroom’s environment is conductive to learning. It is composed of the followingmeasures: whether student’s work is display on the walls, whether thereare charts on the walls, and the number of charts in the wall. The outcomein Column 2 is an index that measures teacher’s behavior during class time.It is composed of the following measures: whether the teacher threatensstudents, and whether the teacher hits students. Finally, the outcome inColumn 3 shows whether any students were sleeping during class time.Standard errors, clustered at the school level, are in parentheses. ∗ p < 0.10,∗∗ p < 0.05, ∗∗∗ p < 0.01
70
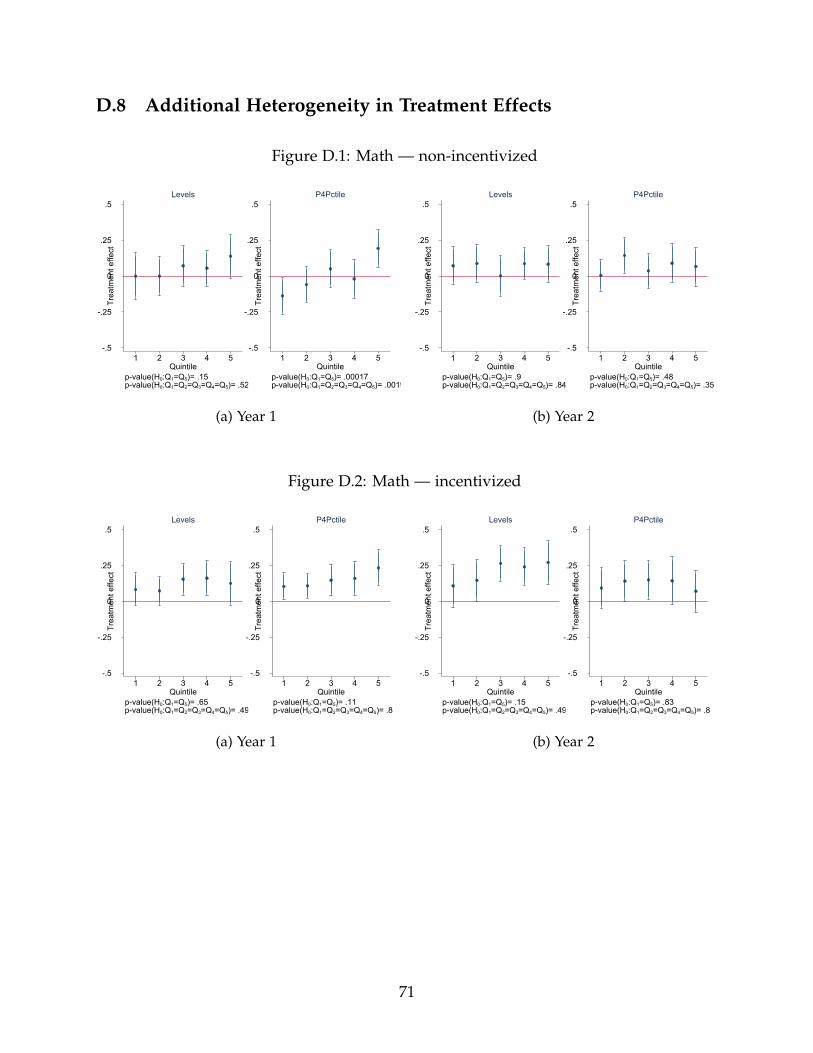
D.8 Additional Heterogeneity in Treatment Effects
Figure D.1: Math — non-incentivized
-.5
-.25
0
.25
.5
Trea
tmen
t effe
ct
1 2 3 4 5Quintile
p-value(H0:Q1=Q5)= .15p-value(H0:Q1=Q2=Q3=Q4=Q5)= .52
Levels
-.5
-.25
0
.25
.5
Trea
tmen
t effe
ct
1 2 3 4 5Quintile
p-value(H0:Q1=Q5)= .00017p-value(H0:Q1=Q2=Q3=Q4=Q5)= .0019
P4Pctile
(a) Year 1
-.5
-.25
0
.25
.5
Trea
tmen
t effe
ct
1 2 3 4 5Quintile
p-value(H0:Q1=Q5)= .9p-value(H0:Q1=Q2=Q3=Q4=Q5)= .84
Levels
-.5
-.25
0
.25
.5
Trea
tmen
t effe
ct
1 2 3 4 5Quintile
p-value(H0:Q1=Q5)= .48p-value(H0:Q1=Q2=Q3=Q4=Q5)= .35
P4Pctile
(b) Year 2
Figure D.2: Math — incentivized
-.5
-.25
0
.25
.5
Trea
tmen
t effe
ct
1 2 3 4 5Quintile
p-value(H0:Q1=Q5)= .65p-value(H0:Q1=Q2=Q3=Q4=Q5)= .49
Levels
-.5
-.25
0
.25
.5
Trea
tmen
t effe
ct
1 2 3 4 5Quintile
p-value(H0:Q1=Q5)= .11p-value(H0:Q1=Q2=Q3=Q4=Q5)= .8
P4Pctile
(a) Year 1
-.5
-.25
0
.25
.5
Trea
tmen
t effe
ct
1 2 3 4 5Quintile
p-value(H0:Q1=Q5)= .15p-value(H0:Q1=Q2=Q3=Q4=Q5)= .49
Levels
-.5
-.25
0
.25
.5
Trea
tmen
t effe
ct
1 2 3 4 5Quintile
p-value(H0:Q1=Q5)= .83p-value(H0:Q1=Q2=Q3=Q4=Q5)= .8
P4Pctile
(b) Year 2
71
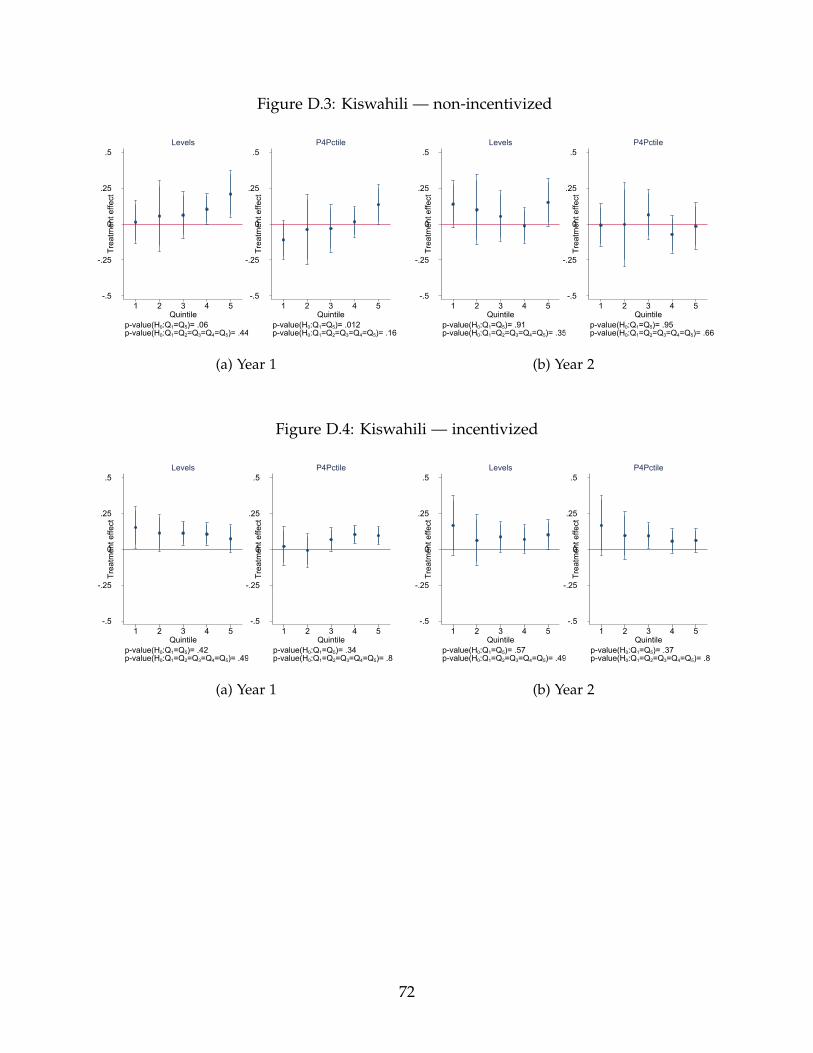
Figure D.3: Kiswahili — non-incentivized
-.5
-.25
0
.25
.5
Trea
tmen
t effe
ct
1 2 3 4 5Quintile
p-value(H0:Q1=Q5)= .06p-value(H0:Q1=Q2=Q3=Q4=Q5)= .44
Levels
-.5
-.25
0
.25
.5
Trea
tmen
t effe
ct
1 2 3 4 5Quintile
p-value(H0:Q1=Q5)= .012p-value(H0:Q1=Q2=Q3=Q4=Q5)= .16
P4Pctile
(a) Year 1
-.5
-.25
0
.25
.5
Trea
tmen
t effe
ct
1 2 3 4 5Quintile
p-value(H0:Q1=Q5)= .91p-value(H0:Q1=Q2=Q3=Q4=Q5)= .35
Levels
-.5
-.25
0
.25
.5
Trea
tmen
t effe
ct
1 2 3 4 5Quintile
p-value(H0:Q1=Q5)= .95p-value(H0:Q1=Q2=Q3=Q4=Q5)= .66
P4Pctile
(b) Year 2
Figure D.4: Kiswahili — incentivized
-.5
-.25
0
.25
.5
Trea
tmen
t effe
ct
1 2 3 4 5Quintile
p-value(H0:Q1=Q5)= .42p-value(H0:Q1=Q2=Q3=Q4=Q5)= .49
Levels
-.5
-.25
0
.25
.5
Trea
tmen
t effe
ct
1 2 3 4 5Quintile
p-value(H0:Q1=Q5)= .34p-value(H0:Q1=Q2=Q3=Q4=Q5)= .8
P4Pctile
(a) Year 1
-.5
-.25
0
.25
.5
Trea
tmen
t effe
ct
1 2 3 4 5Quintile
p-value(H0:Q1=Q5)= .57p-value(H0:Q1=Q2=Q3=Q4=Q5)= .49
Levels
-.5
-.25
0
.25
.5
Trea
tmen
t effe
ct
1 2 3 4 5Quintile
p-value(H0:Q1=Q5)= .37p-value(H0:Q1=Q2=Q3=Q4=Q5)= .8
P4Pctile
(b) Year 2
72
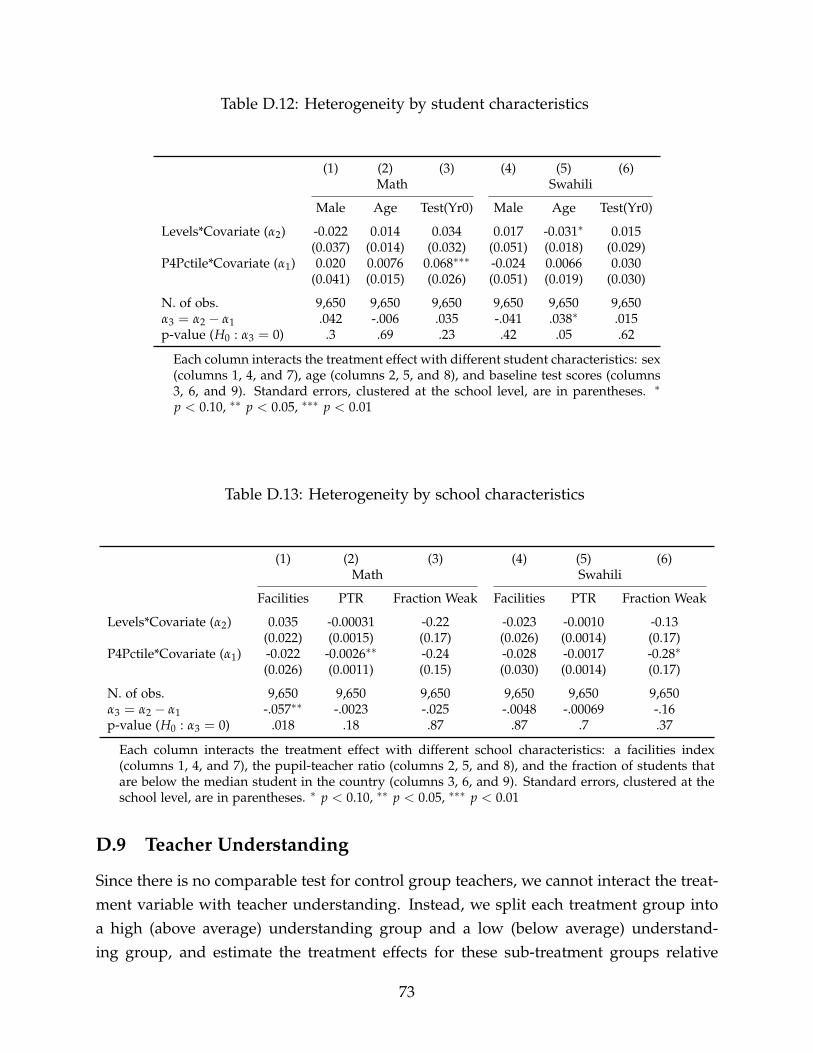
Table D.12: Heterogeneity by student characteristics
(1) (2) (3) (4) (5) (6)Math Swahili
Male Age Test(Yr0) Male Age Test(Yr0)
Levels*Covariate (α2) -0.022 0.014 0.034 0.017 -0.031∗ 0.015(0.037) (0.014) (0.032) (0.051) (0.018) (0.029)
P4Pctile*Covariate (α1) 0.020 0.0076 0.068∗∗∗ -0.024 0.0066 0.030(0.041) (0.015) (0.026) (0.051) (0.019) (0.030)
N. of obs. 9,650 9,650 9,650 9,650 9,650 9,650α3 = α2 − α1 .042 -.006 .035 -.041 .038∗ .015p-value (H0 : α3 = 0) .3 .69 .23 .42 .05 .62
Each column interacts the treatment effect with different student characteristics: sex(columns 1, 4, and 7), age (columns 2, 5, and 8), and baseline test scores (columns3, 6, and 9). Standard errors, clustered at the school level, are in parentheses. ∗
p < 0.10, ∗∗ p < 0.05, ∗∗∗ p < 0.01
Table D.13: Heterogeneity by school characteristics
(1) (2) (3) (4) (5) (6)Math Swahili
Facilities PTR Fraction Weak Facilities PTR Fraction Weak
Levels*Covariate (α2) 0.035 -0.00031 -0.22 -0.023 -0.0010 -0.13(0.022) (0.0015) (0.17) (0.026) (0.0014) (0.17)
P4Pctile*Covariate (α1) -0.022 -0.0026∗∗ -0.24 -0.028 -0.0017 -0.28∗
(0.026) (0.0011) (0.15) (0.030) (0.0014) (0.17)
N. of obs. 9,650 9,650 9,650 9,650 9,650 9,650α3 = α2 − α1 -.057∗∗ -.0023 -.025 -.0048 -.00069 -.16p-value (H0 : α3 = 0) .018 .18 .87 .87 .7 .37
Each column interacts the treatment effect with different school characteristics: a facilities index(columns 1, 4, and 7), the pupil-teacher ratio (columns 2, 5, and 8), and the fraction of students thatare below the median student in the country (columns 3, 6, and 9). Standard errors, clustered at theschool level, are in parentheses. ∗ p < 0.10, ∗∗ p < 0.05, ∗∗∗ p < 0.01
D.9 Teacher Understanding
Since there is no comparable test for control group teachers, we cannot interact the treat-ment variable with teacher understanding. Instead, we split each treatment group intoa high (above average) understanding group and a low (below average) understand-ing group, and estimate the treatment effects for these sub-treatment groups relative
73
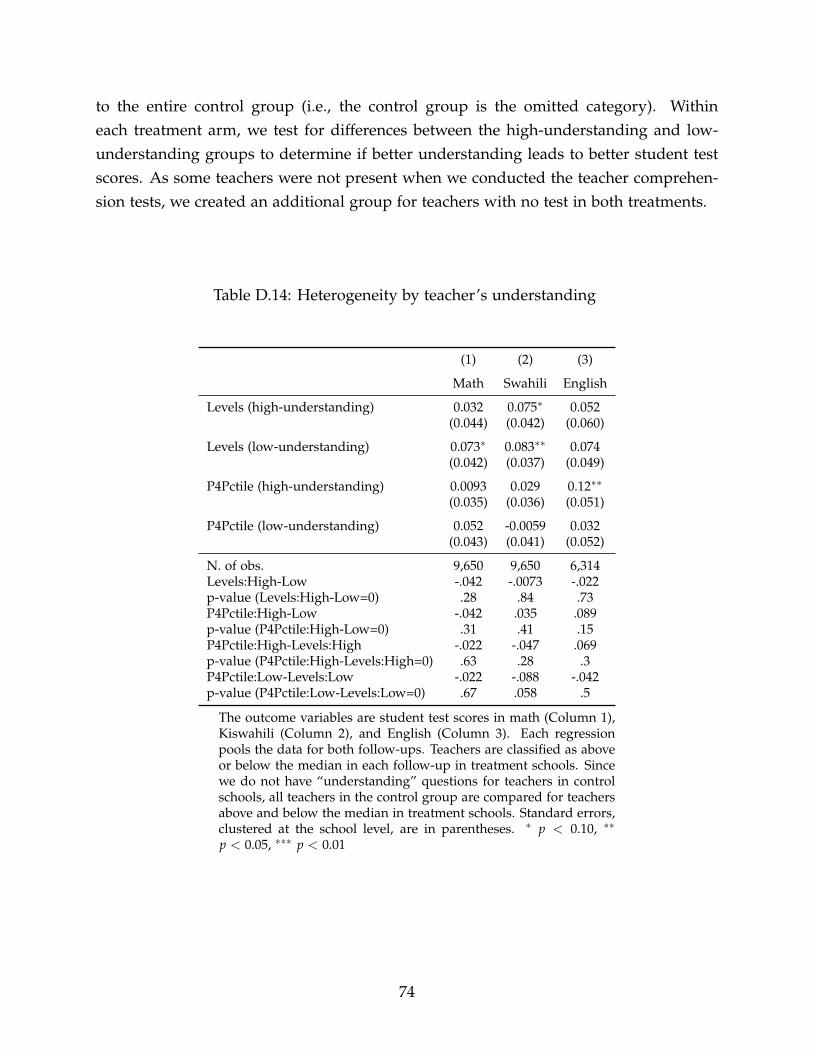
to the entire control group (i.e., the control group is the omitted category). Withineach treatment arm, we test for differences between the high-understanding and low-understanding groups to determine if better understanding leads to better student testscores. As some teachers were not present when we conducted the teacher comprehen-sion tests, we created an additional group for teachers with no test in both treatments.
Table D.14: Heterogeneity by teacher’s understanding
(1) (2) (3)
Math Swahili English
Levels (high-understanding) 0.032 0.075∗ 0.052(0.044) (0.042) (0.060)
Levels (low-understanding) 0.073∗ 0.083∗∗ 0.074(0.042) (0.037) (0.049)
P4Pctile (high-understanding) 0.0093 0.029 0.12∗∗
(0.035) (0.036) (0.051)
P4Pctile (low-understanding) 0.052 -0.0059 0.032(0.043) (0.041) (0.052)
N. of obs. 9,650 9,650 6,314Levels:High-Low -.042 -.0073 -.022p-value (Levels:High-Low=0) .28 .84 .73P4Pctile:High-Low -.042 .035 .089p-value (P4Pctile:High-Low=0) .31 .41 .15P4Pctile:High-Levels:High -.022 -.047 .069p-value (P4Pctile:High-Levels:High=0) .63 .28 .3P4Pctile:Low-Levels:Low -.022 -.088 -.042p-value (P4Pctile:Low-Levels:Low=0) .67 .058 .5
The outcome variables are student test scores in math (Column 1),Kiswahili (Column 2), and English (Column 3). Each regressionpools the data for both follow-ups. Teachers are classified as aboveor below the median in each follow-up in treatment schools. Sincewe do not have “understanding” questions for teachers in controlschools, all teachers in the control group are compared for teachersabove and below the median in treatment schools. Standard errors,clustered at the school level, are in parentheses. ∗ p < 0.10, ∗∗
p < 0.05, ∗∗∗ p < 0.01
74