developing pay-scales
TRANSCRIPT
12 September 2019
Presented by: Lionel van SchalkwijkPE Corporate Services
Developing pay-scales

Summary of Job Evaluation Process
•Job Analysis & Job Description
•Job Grading
•Grade Map
•Company salary scales
•Competitiveness analysis
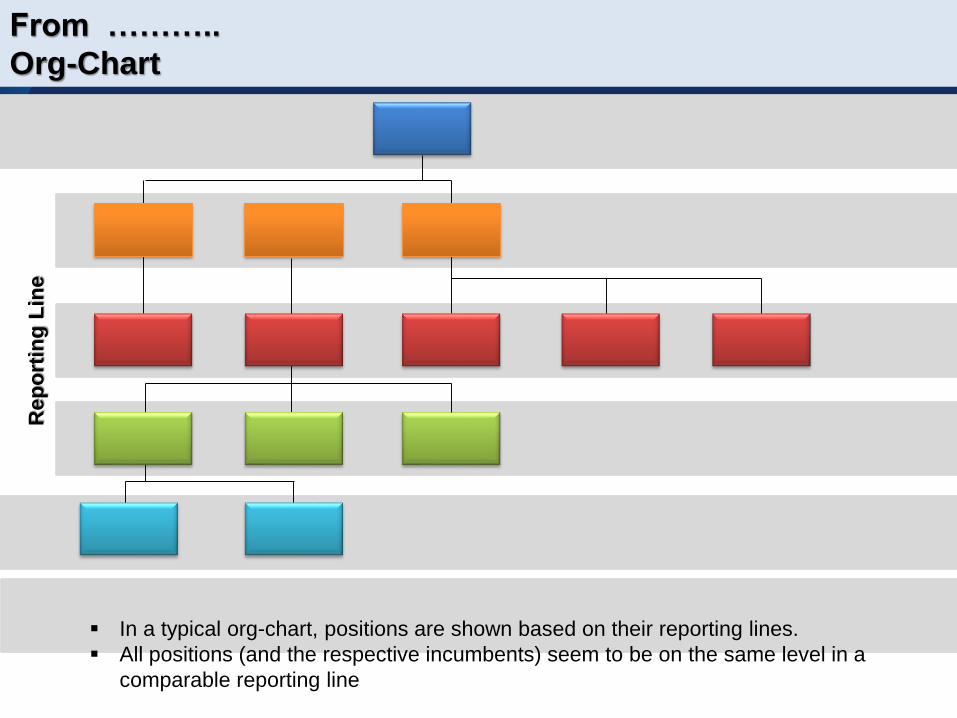
From ………..
Org-Chart
▪ In a typical org-chart, positions are shown based on their reporting lines.
▪ All positions (and the respective incumbents) seem to be on the same level in a
comparable reporting line
Rep
ort
ing
Lin
e
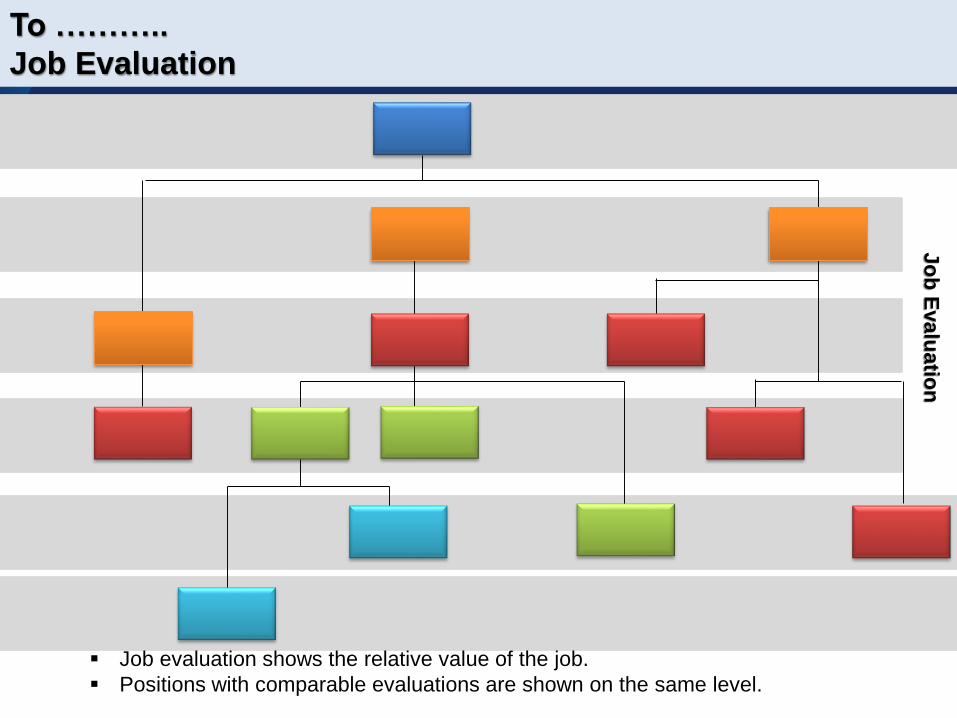
To ………..
Job Evaluation
▪ Job evaluation shows the relative value of the job.
▪ Positions with comparable evaluations are shown on the same level.
Jo
b E
valu
atio
n

13 September 2019 P-E Corporate Services SA 5
…..Grade*
16
15 Technical Manager
14
Financial Manager HR Manager Manufacturing Manager Inbound Logistics Manager Business Dev Manager
Outbound Logistics Manager Nat Sales / Mkt Manager
Design Engineer
Development Engineer
Financial Accountant Maintenance Supervisor Finished Goods Stores Svr. Client Liaison Supervisor
Senior Supervisor Production
Snr Supervisor Pre Production
Health & Safety Officer Logistics Planner Quality Assurance Officer Project Coordinator
Laser Programmer
Robot Programmer
Client Liaison Officer Process Technician
Quality Technician Junior Development Eng
Technical Supervisor Boiler Maker
Market Researcher / CLO
Mktng / Promo coordinator
Sales Executives
Shift Supervisor Procurement Officer X-Rider Project Leader
Stores Svr. (Bracket / Component)
Stores Svr. (Consumable Stores)
Stores Svr. (Raw Mat & Tube)
IR & HR Admin Officer Logistics Project Coordinator
Financial Accountant / Clerk Scrap & Security Officer
Wages / Office Admin
Creditors Clerk Data Capturer Quality Admin Clerk Junior Mech Specialist
Debtors Clerk Stores Co-ordinator Quality Receiving Inspec Systems Administrator
Pricing Administrator Technical Assistant
Receptionist
Fitment Team
ABC ManufacturingManaging Director
…... Grade* Finance Human Resources Manufacturing Logistics Sales & Business Development Technical
7
6
5
13
12
11
10
9
8
Grade Map

13 September 2019 P-E Corporate Services SA 6
0
100 000
200 000
300 000
400 000
500 000
600 000
700 000
800 000
900 000
1 000 000
1 100 000
1 200 000
1 300 000
0 1 2 3 4 5 6 7 8 9 10 11 12 13 14 15 16 17
Gu
aran
tee
d P
acka
ge (
Ran
ds
per
an
nu
m)
Paterson Grades
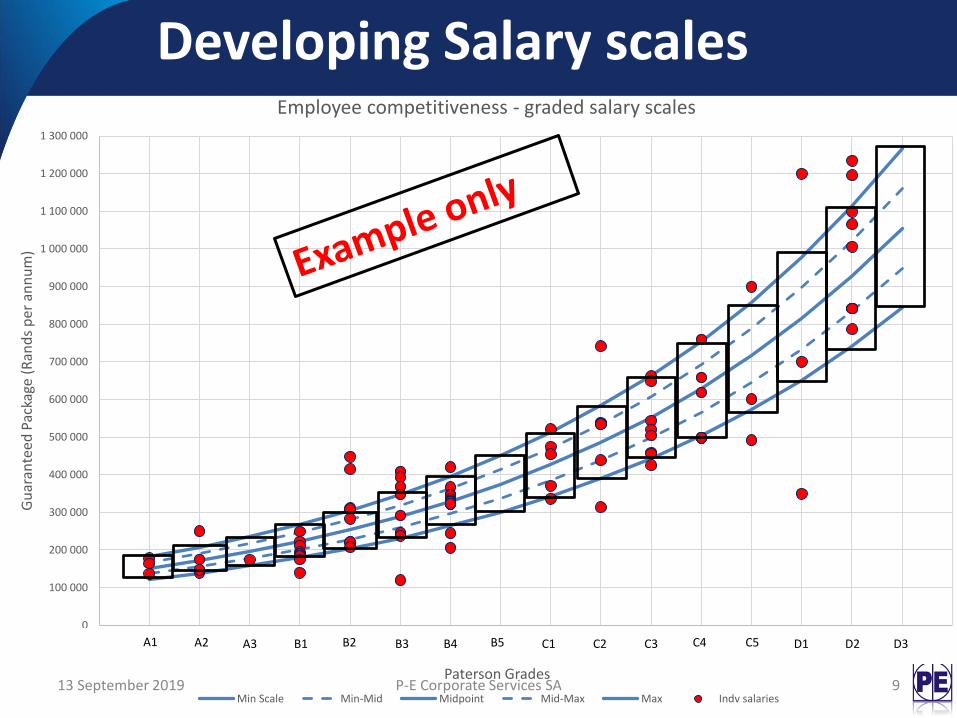
Employee competitiveness - graded salary scales
Indv salaries
A1 A2 A3 B1 B2 B3 B4 B5 C1 C2 C3 C4 C5 D1 D2 D3
Developing Salary scales
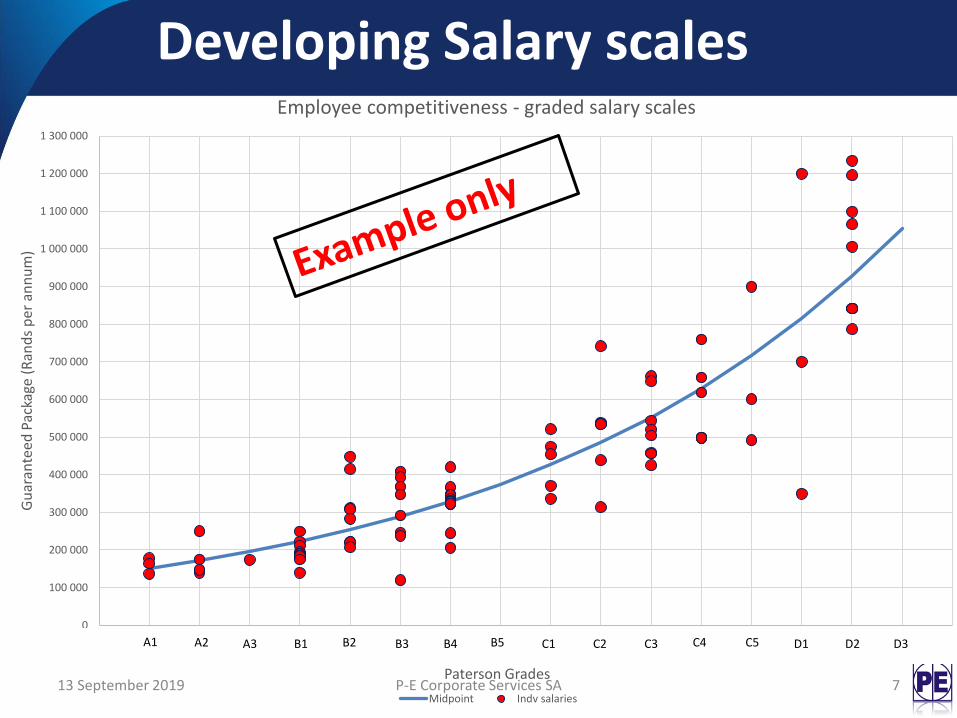
13 September 2019 P-E Corporate Services SA 7
0
100 000
200 000
300 000
400 000
500 000
600 000
700 000
800 000
900 000
1 000 000
1 100 000
1 200 000
1 300 000
0 1 2 3 4 5 6 7 8 9 10 11 12 13 14 15 16 17
Gu
aran
tee
d P
acka
ge (
Ran
ds
per
an
nu
m)
Paterson Grades
Employee competitiveness - graded salary scales
Midpoint Indv salaries
A1 A2 A3 B1 B2 B3 B4 B5 C1 C2 C3 C4 C5 D1 D2 D3
Developing Salary scales

13 September 2019 P-E Corporate Services SA 8
0
100 000
200 000
300 000
400 000
500 000
600 000
700 000
800 000
900 000
1 000 000
1 100 000
1 200 000
1 300 000
0 1 2 3 4 5 6 7 8 9 10 11 12 13 14 15 16 17
Gu
aran
tee
d P
acka
ge (
Ran
ds
per
an
nu
m)
Paterson Grades
Employee competitiveness - graded salary scales
Min Scale Min-Mid Midpoint Mid-Max Max Indv salaries
A1 A2 A3 B1 B2 B3 B4 B5 C1 C2 C3 C4 C5 D1 D2 D3
Developing Salary scales
13 September 2019 P-E Corporate Services SA 9
0
100 000
200 000
300 000
400 000
500 000
600 000
700 000
800 000
900 000
1 000 000
1 100 000
1 200 000
1 300 000
0 1 2 3 4 5 6 7 8 9 10 11 12 13 14 15 16 17
Gu
aran
tee
d P
acka
ge (
Ran
ds
per
an
nu
m)
Paterson Grades
Employee competitiveness - graded salary scales
Min Scale Min-Mid Midpoint Mid-Max Max Indv salaries
A1 A2 A3 B1 B2 B3 B4 B5 C1 C2 C3 C4 C5 D1 D2 D3
Developing Salary scales
13 September 2019 P-E Corporate Services SA 10
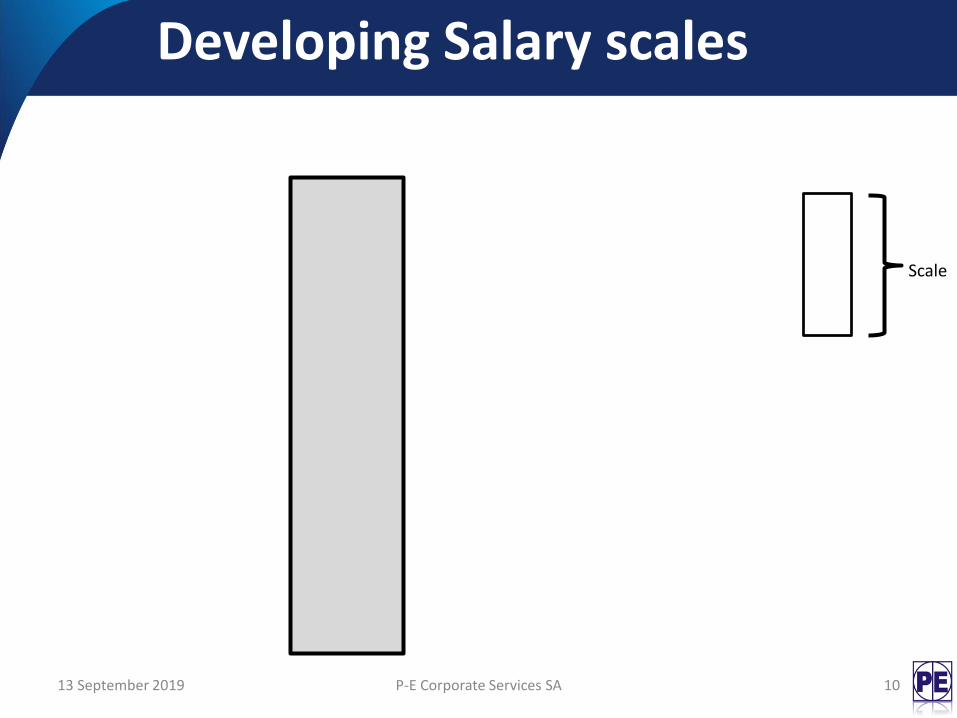
Scale
Developing Salary scales

Developing Salary scales
13 September 2019 P-E Corporate Services SA 12
13 September 2019 P-E Corporate Services SA 13
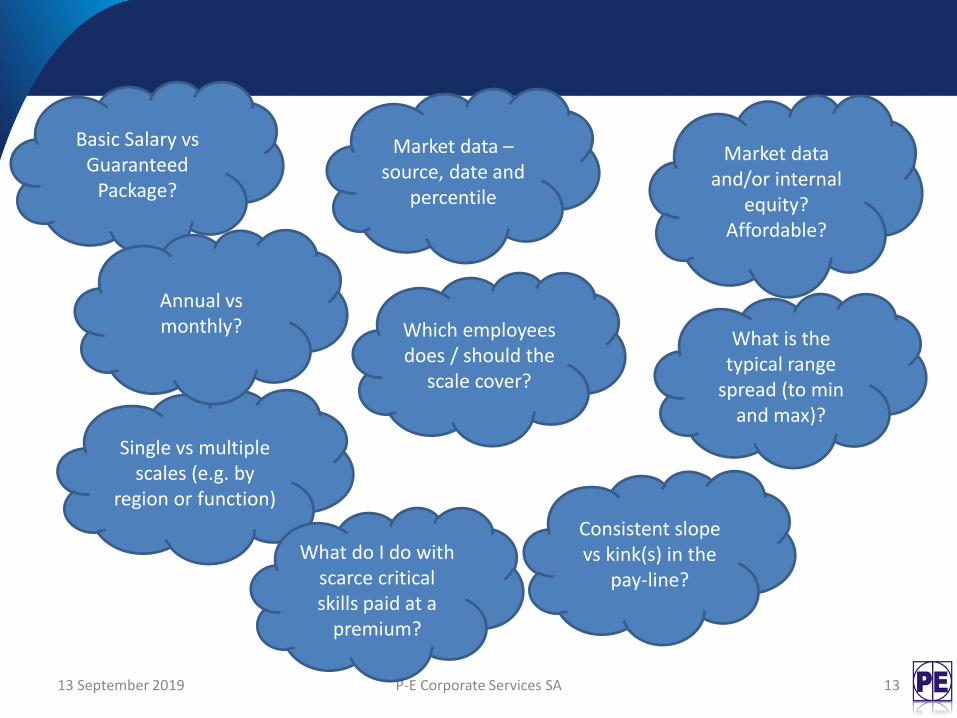
Basic Salary vs Guaranteed
Package?
Market data and/or internal
equity? Affordable?
Market data –source, date and
percentile
Single vs multiple scales (e.g. by
region or function)
Which employees does / should the
scale cover?
What do I do with scarce critical skills paid at a
premium?
What is the typical range
spread (to min and max)?
Consistent slope vs kink(s) in the
pay-line?
Annual vs monthly?
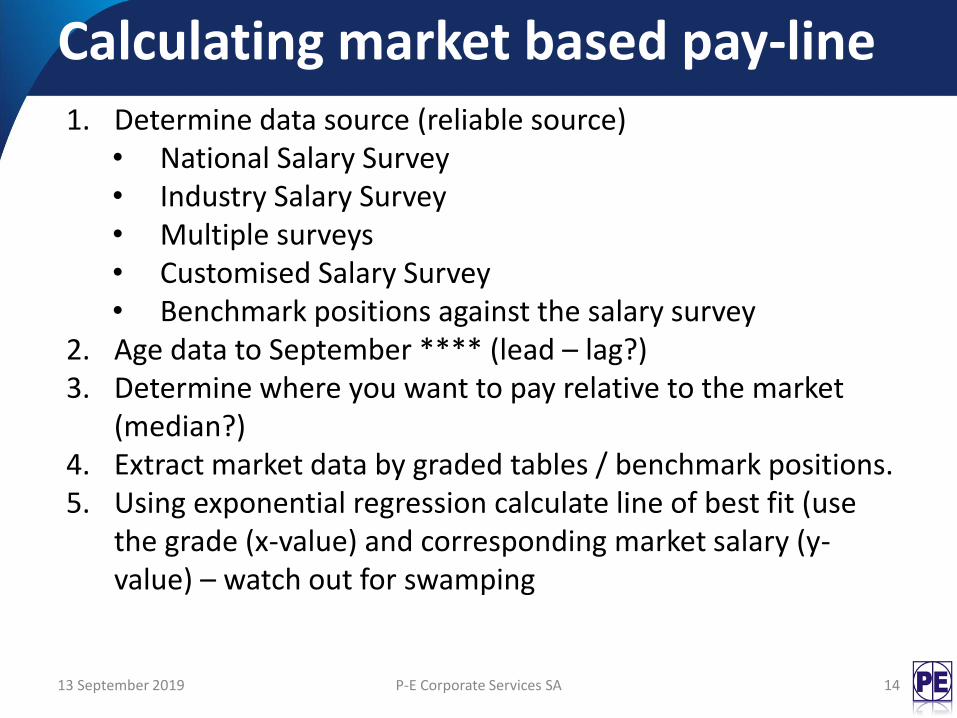
Calculating market based pay-line
13 September 2019 P-E Corporate Services SA 14
1. Determine data source (reliable source)• National Salary Survey• Industry Salary Survey• Multiple surveys• Customised Salary Survey• Benchmark positions against the salary survey
2. Age data to September **** (lead – lag?)3. Determine where you want to pay relative to the market
(median?)4. Extract market data by graded tables / benchmark positions. 5. Using exponential regression calculate line of best fit (use
the grade (x-value) and corresponding market salary (y-value) – watch out for swamping
13 September 2019 P-E Corporate Services SA 15
Survey Sample 25 P
32 115
494 958
529 632
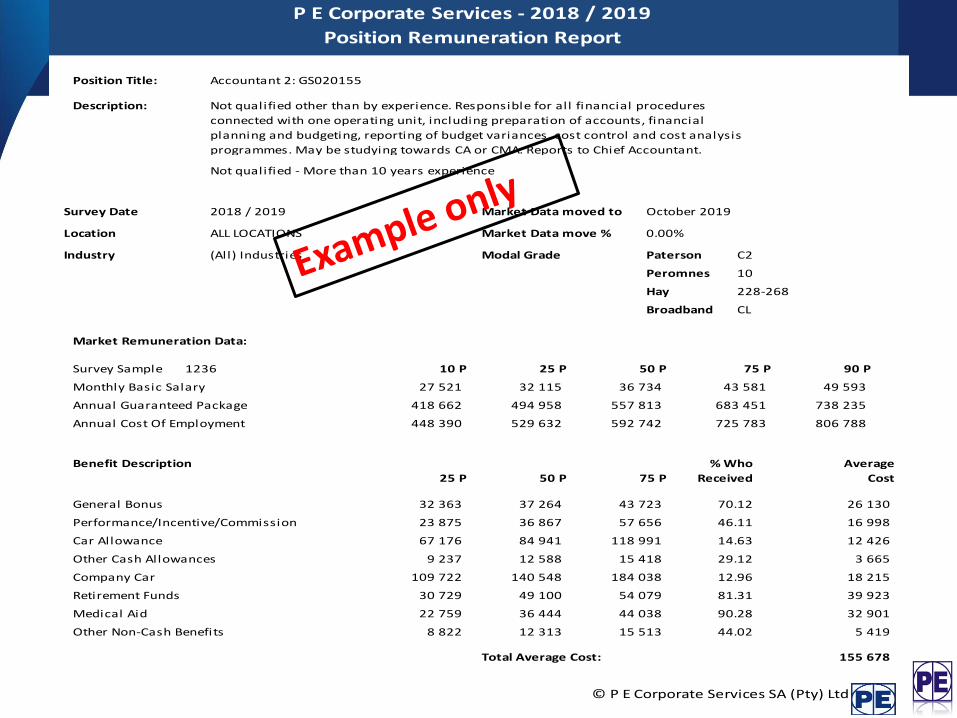
Total Average Cost: 155 678
© P E Corporate Services SA (Pty) Ltd
Other Non-Cash Benefits 8 822 12 313 15 513 44.02 5 419
Medical Aid 22 759 36 444 44 038 90.28 32 901
Retirement Funds 30 729 49 100 54 079 81.31 39 923
Company Car 109 722 140 548 184 038 12.96 18 215
Other Cash Allowances 9 237 12 588 15 418 29.12 3 665
Car Allowance 67 176 84 941 118 991 14.63 12 426
26 130
Performance/Incentive/Commission 23 875 36 867 57 656 46.11 16 998
75 P
General Bonus 32 363 37 264 43 723 70.12
Annual Cost Of Employment 448 390 592 742 725 783 806 788
Benefit Description % Who
Received
Average
Cost25 P 50 P
Monthly Basic Salary 27 521 36 734 43 581 49 593
Annual Guaranteed Package 418 662 557 813 683 451 738 235
Hay 228-268
Broadband CL
Market Remuneration Data:
1236 10 P 50 P 75 P 90 P
Industry (All) Industries Modal Grade Paterson C2
Peromnes 10
Survey Date 2018 / 2019 Market Data moved to October 2019
Location ALL LOCATIONS Market Data move % 0.00%
P E Corporate Services - 2018 / 2019
Position Remuneration Report
Position Title: Accountant 2: GS020155
Description: Not qualified other than by experience. Responsible for all financial procedures
connected with one operating unit, including preparation of accounts, financial
planning and budgeting, reporting of budget variances, cost control and cost analysis
programmes. May be studying towards CA or CMA. Reports to Chief Accountant.
Not qualified - More than 10 years experience

13 September 2019 P-E Corporate Services SA 16
Calculating market based pay-line
Company ABC Ltd - TITLE Grade Survey CodeGuaranteed Package (September ****)
25th 50th 75th
8 SALES ANALYST /SPECIALIST C3 C3 *** *** ***
7 INTERNAL AUDITOR C2 GS020030 *** *** ***
7 FACILITIES COORDINATOR C2 GS051257 *** *** ***
7 MAINTENANCE SUPERVISOR C2 GS080095 *** *** ***
7 ACCOUNTANT C2 GS020155 *** *** ***
7 EMPLOYEE ENGAGEMENT OFFICER C2 GS040060 *** *** ***
7 PAYROLL OFFICER C2 GS040015 *** *** ***
7 JUNIOR IT TECHNICIAN C2 GS030061 *** *** ***
7 SKILLS DEVELOPMENT ANALYST C2 C2 *** *** ***
7 MARKETING COORDINATOR C2 GS100022 *** *** ***
7 QA MANAGER C2 GS100250 *** *** ***
6 REVENUE ANALYST C1 GS020135 *** *** ***
6 RECRUITMENT OFFICER C1 GS040005 *** *** ***
6 COMPLIANCE SUPERVISOR C1 C1 *** *** ***
5 BOOKKEEPER B5 GS020115 *** *** ***
4 COMPLIANCE MONITORING B4 B4 *** *** ***
4 TEAM LEADER B4 GS100172 *** *** ***
3 TEAM LEADER - INBOUND B3 B3 *** *** ***
3 I PRODUCT ADMINISTRATOR B3 GS010095 *** *** ***
3 JUNIOR BOOKKEEPER B3 GS020100 *** *** ***
Calculating market based pay-line

13 September 2019 P-E Corporate Services SA 17
Calculating market based pay-lineCompany ABC Ltd - TITLE Grade Survey Code
Guaranteed Package (September ****)
25th 50th 75th
8 C3 ***
7 C2 ***
7 C2 ***
7 C2 ***
7 C2 ***
7 C2 ***
7 C2 ***
7 C2 ***
7 C2 ***
7 C2 ***
7 C2 ***
6 C1 ***
6 C1 ***
6 C1 ***
5 B5 ***
4 B4 ***
4 B4 ***
3 B3 ***
3 B3 ***
3 B3 ***
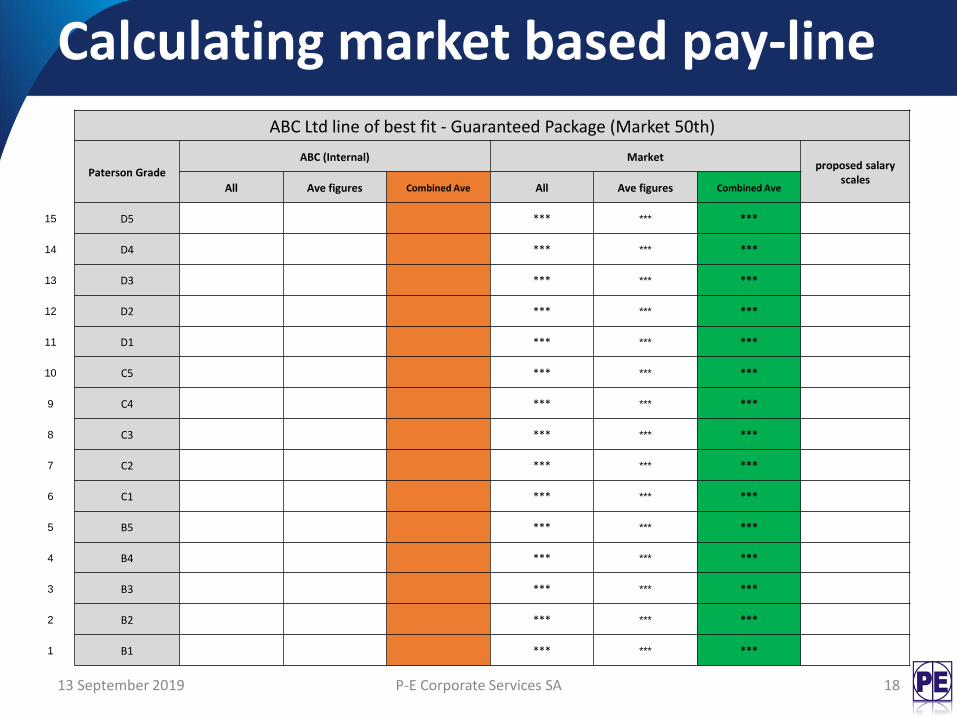
13 September 2019 P-E Corporate Services SA 18
ABC Ltd line of best fit - Guaranteed Package (Market 50th)
Paterson Grade
ABC (Internal) Marketproposed salary
scalesAll Ave figures Combined Ave All Ave figures Combined Ave
15 D5 *** *** ***
14 D4 *** *** ***
13 D3 *** *** ***
12 D2 *** *** ***
11 D1 *** *** ***
10 C5 *** *** ***
9 C4 *** *** ***
8 C3 *** *** ***
7 C2 *** *** ***
6 C1 *** *** ***
5 B5 *** *** ***
4 B4 *** *** ***
3 B3 *** *** ***
2 B2 *** *** ***
1 B1 *** *** ***
Calculating market based pay-line
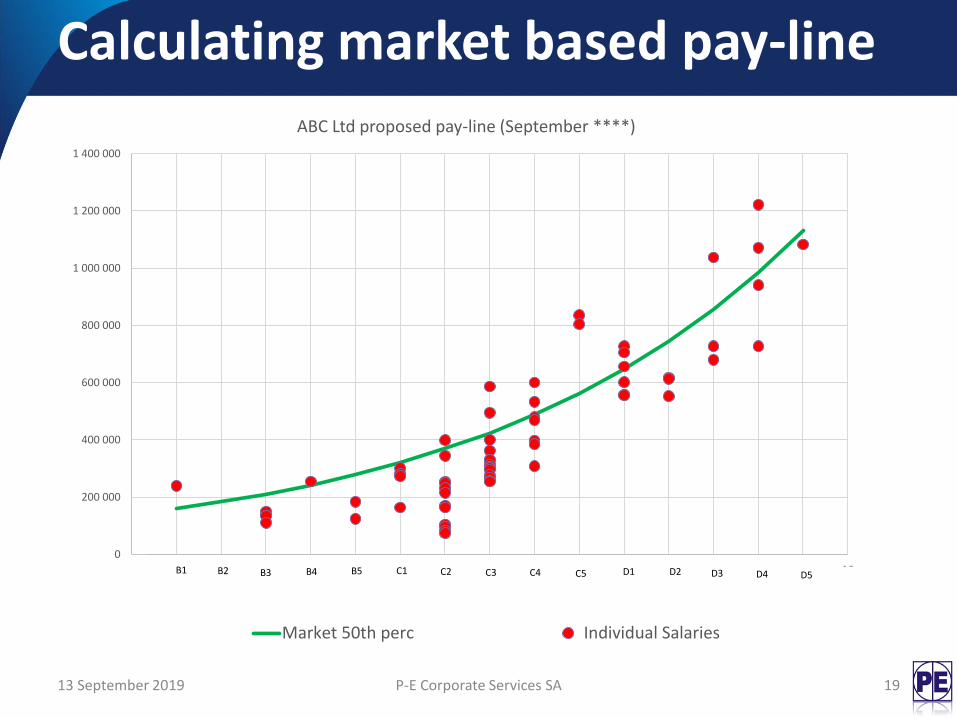
13 September 2019 P-E Corporate Services SA 19
0
200 000
400 000
600 000
800 000
1 000 000
1 200 000
1 400 000
0 1 2 3 4 5 6 7 8 9 10 11 12 13 14 15 16
ABC Ltd proposed pay-line (September ****)
Market 50th perc Individual Salaries
B1 B2 B3 B4 B5 C1 C2 C3 C4 C5 D1 D2 D3 D4 D5
Calculating market based pay-line
13 September 2019 P-E Corporate Services SA 20
Calculating market based pay-line
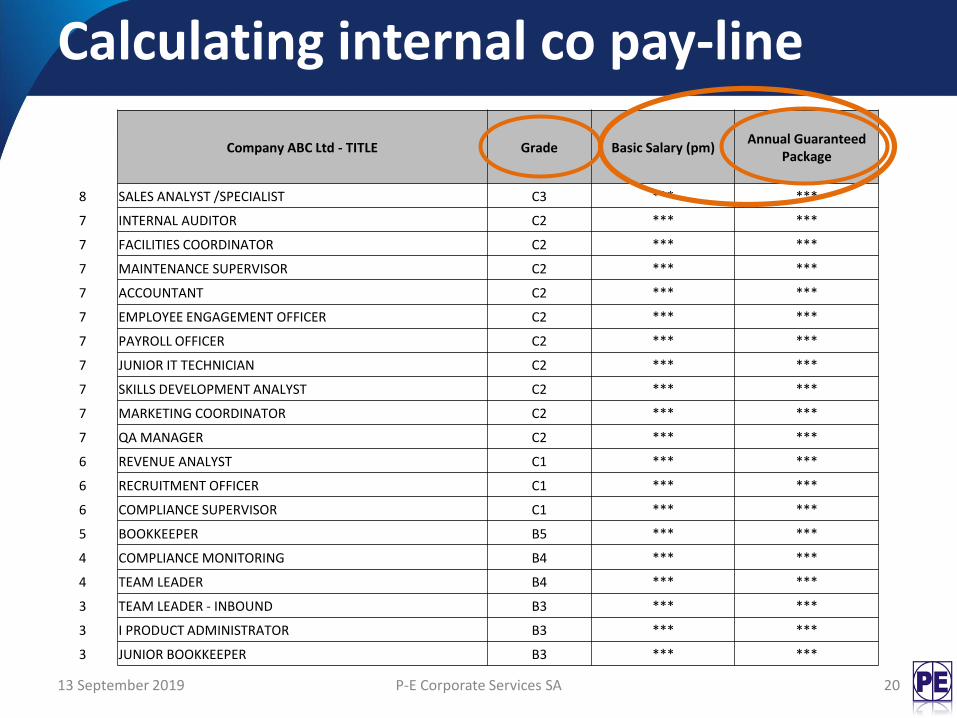
Calculating internal co pay-line
Company ABC Ltd - TITLE Grade Basic Salary (pm)Annual Guaranteed
Package
8 SALES ANALYST /SPECIALIST C3 *** ***
7 INTERNAL AUDITOR C2 *** ***
7 FACILITIES COORDINATOR C2 *** ***
7 MAINTENANCE SUPERVISOR C2 *** ***
7 ACCOUNTANT C2 *** ***
7 EMPLOYEE ENGAGEMENT OFFICER C2 *** ***
7 PAYROLL OFFICER C2 *** ***
7 JUNIOR IT TECHNICIAN C2 *** ***
7 SKILLS DEVELOPMENT ANALYST C2 *** ***
7 MARKETING COORDINATOR C2 *** ***
7 QA MANAGER C2 *** ***
6 REVENUE ANALYST C1 *** ***
6 RECRUITMENT OFFICER C1 *** ***
6 COMPLIANCE SUPERVISOR C1 *** ***
5 BOOKKEEPER B5 *** ***
4 COMPLIANCE MONITORING B4 *** ***
4 TEAM LEADER B4 *** ***
3 TEAM LEADER - INBOUND B3 *** ***
3 I PRODUCT ADMINISTRATOR B3 *** ***
3 JUNIOR BOOKKEEPER B3 *** ***

13 September 2019 P-E Corporate Services SA 21
Calculating internal co pay-line
Company ABC Ltd - TITLE Grade Basic Salary (pm)Annual Guaranteed
Package
8 C3 ***
7 C2 ***
7 C2 ***
7 C2 ***
7 C2 ***
7 C2 ***
7 C2 ***
7 C2 ***
7 C2 ***
7 C2 ***
7 C2 ***
6 C1 ***
6 C1 ***
6 C1 ***
5 B5 ***
4 B4 ***
4 B4 ***
3 B3 ***
3 B3 ***
3 B3 ***
13 September 2019 P-E Corporate Services SA 22
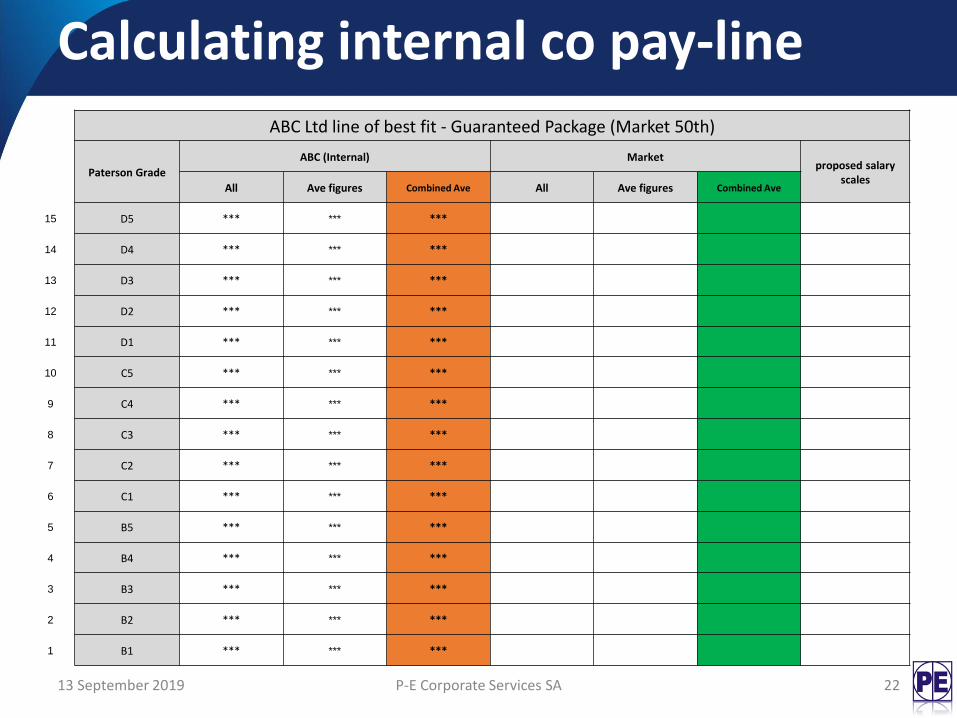
ABC Ltd line of best fit - Guaranteed Package (Market 50th)
Paterson Grade
ABC (Internal) Marketproposed salary
scalesAll Ave figures Combined Ave All Ave figures Combined Ave
15 D5 *** *** ***
14 D4 *** *** ***
13 D3 *** *** ***
12 D2 *** *** ***
11 D1 *** *** ***
10 C5 *** *** ***
9 C4 *** *** ***
8 C3 *** *** ***
7 C2 *** *** ***
6 C1 *** *** ***
5 B5 *** *** ***
4 B4 *** *** ***
3 B3 *** *** ***
2 B2 *** *** ***
1 B1 *** *** ***
Calculating internal co pay-line
13 September 2019 P-E Corporate Services SA 23
0
200 000
400 000
600 000
800 000
1 000 000
1 200 000
1 400 000
0 1 2 3 4 5 6 7 8 9 10 11 12 13 14 15 16
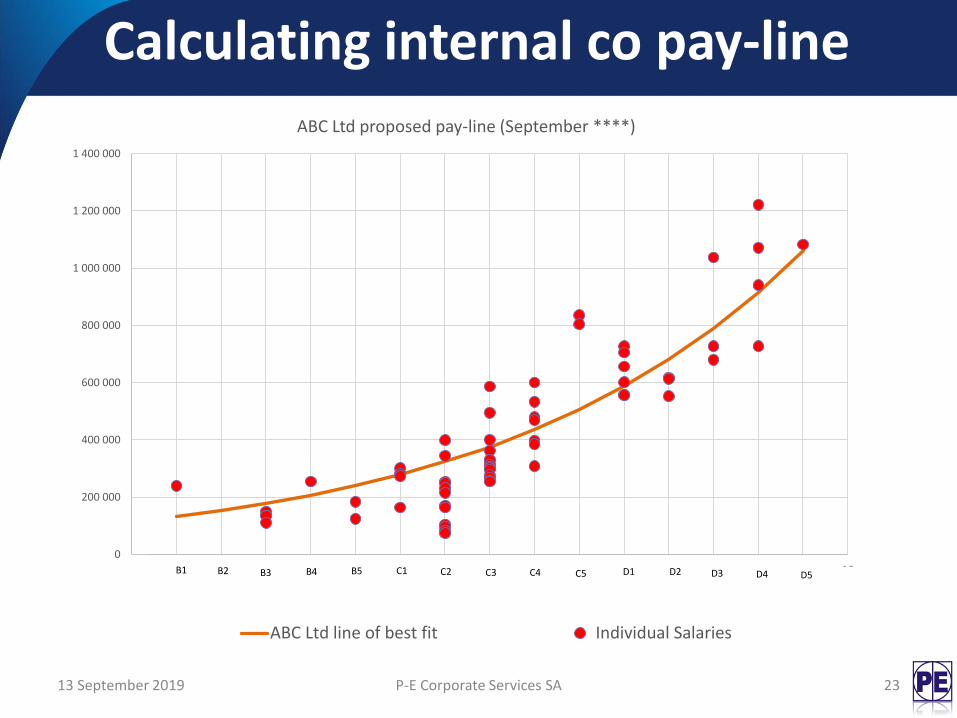
ABC Ltd proposed pay-line (September ****)
ABC Ltd line of best fit Individual Salaries
B1 B2 B3 B4 B5 C1 C2 C3 C4 C5 D1 D2 D3 D4 D5
Calculating internal co pay-line
13 September 2019 P-E Corporate Services SA 24
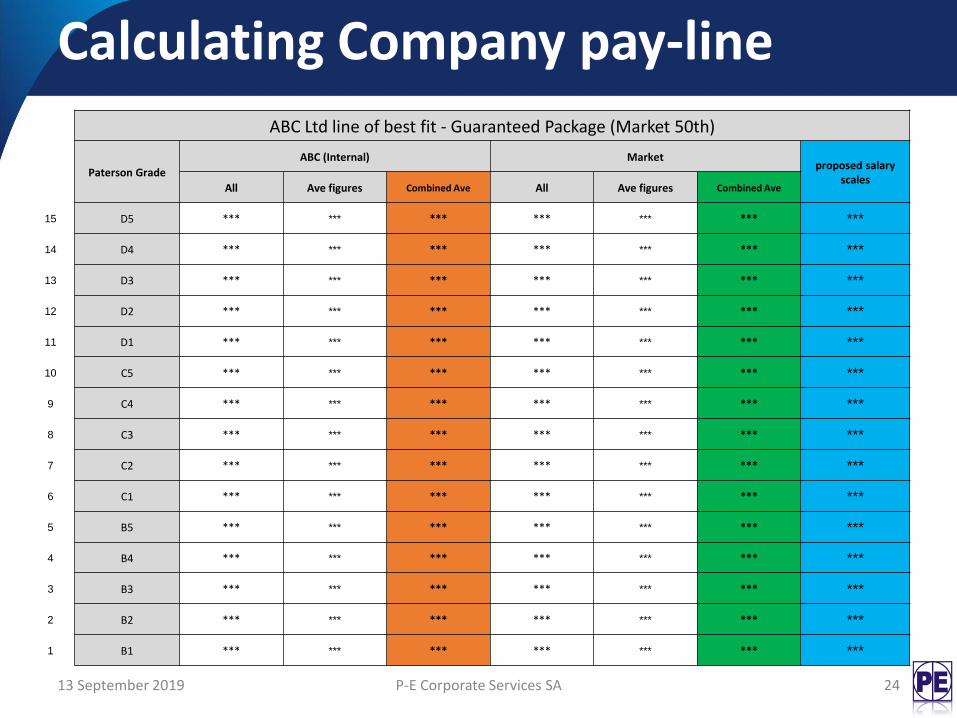
ABC Ltd line of best fit - Guaranteed Package (Market 50th)
Paterson Grade
ABC (Internal) Marketproposed salary
scalesAll Ave figures Combined Ave All Ave figures Combined Ave
15 D5 *** *** *** *** *** *** ***
14 D4 *** *** *** *** *** *** ***
13 D3 *** *** *** *** *** *** ***
12 D2 *** *** *** *** *** *** ***
11 D1 *** *** *** *** *** *** ***
10 C5 *** *** *** *** *** *** ***
9 C4 *** *** *** *** *** *** ***
8 C3 *** *** *** *** *** *** ***
7 C2 *** *** *** *** *** *** ***
6 C1 *** *** *** *** *** *** ***
5 B5 *** *** *** *** *** *** ***
4 B4 *** *** *** *** *** *** ***
3 B3 *** *** *** *** *** *** ***
2 B2 *** *** *** *** *** *** ***
1 B1 *** *** *** *** *** *** ***
Calculating Company pay-line

13 September 2019 P-E Corporate Services SA 25
0
200 000
400 000
600 000
800 000
1 000 000
1 200 000
1 400 000
0 1 2 3 4 5 6 7 8 9 10 11 12 13 14 15 16
ABC Ltd proposed pay-line (September ****)
ABC Ltd line of best fit Market 50th perc Individual Salaries Proposed pay-line
B1 B2 B3 B4 B5 C1 C2 C3 C4 C5 D1 D2 D3 D4 D5
Calculating Company pay-line
13 September 2019 P-E Corporate Services SA 26
0
200 000
400 000
600 000
800 000
1 000 000
1 200 000
1 400 000
0 1 2 3 4 5 6 7 8 9 10 11 12 13 14 15 16
Sala
ry (
guar
ante
ed P
acka
ge)
Ran
ds
per
an
nu
m
Paterson Grades
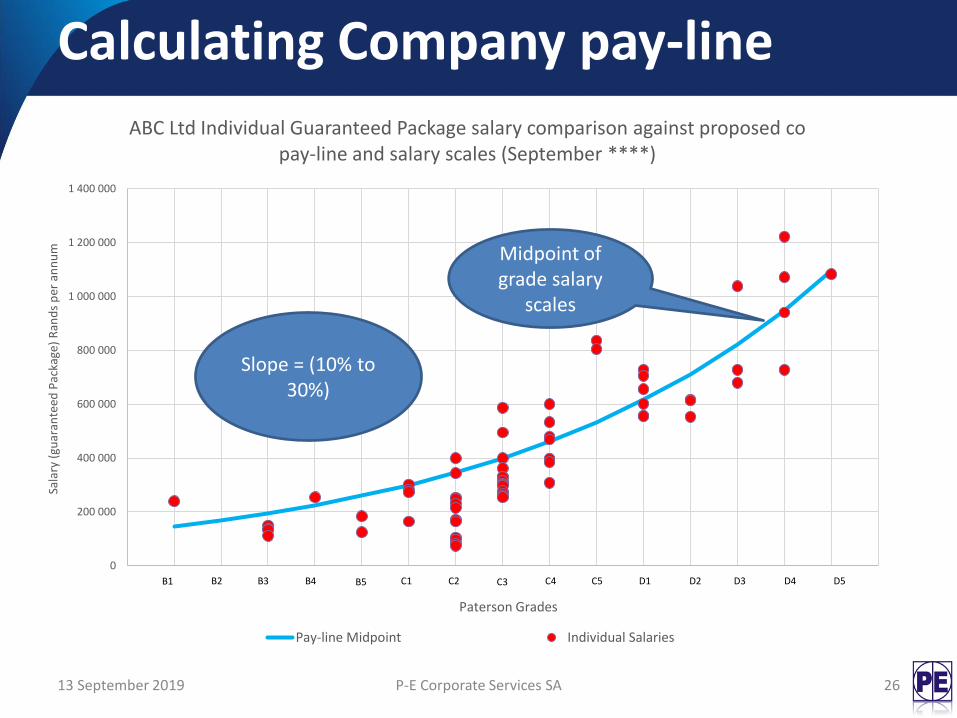
ABC Ltd Individual Guaranteed Package salary comparison against proposed co pay-line and salary scales (September ****)
Pay-line Midpoint Individual Salaries
B1 B2 B3 B4 B5 C1 C2 C3 C4 C5 D1 D2 D3 D4 D5
Calculating Company pay-line
Midpoint of grade salary
scales
Slope = (10% to 30%)
13 September 2019 P-E Corporate Services SA 27
0
200 000
400 000
600 000
800 000
1 000 000
1 200 000
1 400 000
0 1 2 3 4 5 6 7 8 9 10 11 12 13 14 15 16
Sala
ry (
guar
ante
ed P
acka
ge)
Ran
ds
per
an
nu
m
Paterson Grades
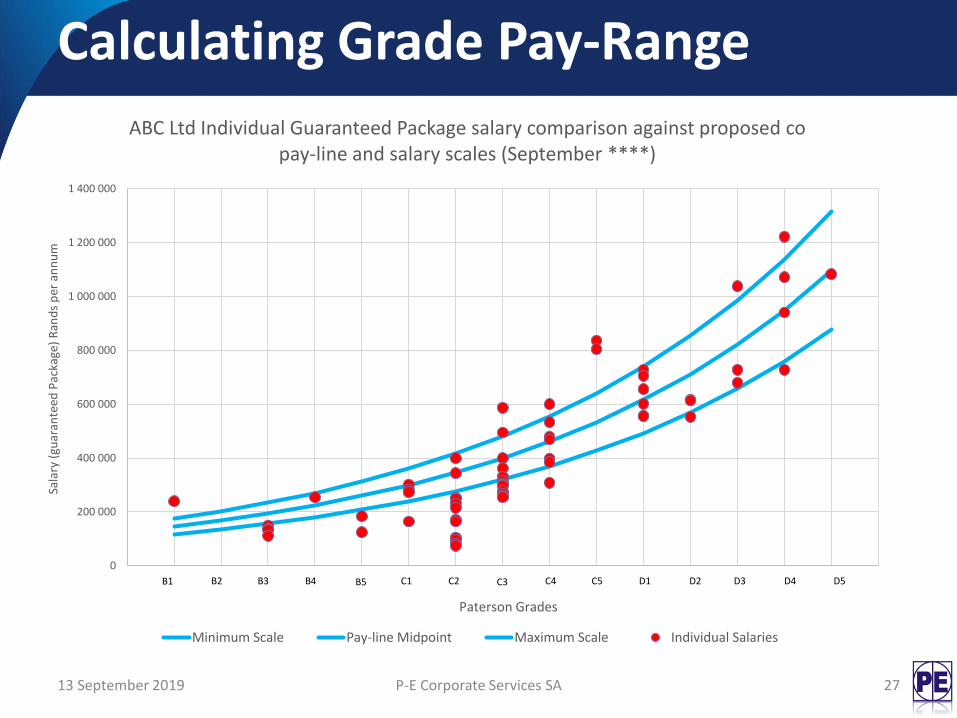
ABC Ltd Individual Guaranteed Package salary comparison against proposed co pay-line and salary scales (September ****)
Minimum Scale Pay-line Midpoint Maximum Scale Individual Salaries
B1 B2 B3 B4 B5 C1 C2 C3 C4 C5 D1 D2 D3 D4 D5
Calculating Grade Pay-Range

13 September 2019 P-E Corporate Services SA 28
Paterson Grade
Proposed salary-scales (Guaranteed Package)
Rands per annum as at September ****
Minimum Midpoint Maximum Slope
D5 *** *** *** 1. 176
D4 *** *** ***1. 176
D3 *** *** ***1. 176
D2 *** *** ***1. 176
D1 *** *** ***1. 176
C5 *** *** ***1. 176
C4 *** *** ***1. 176
C3 *** *** ***1. 176
C2 *** *** ***1. 176
C1 *** *** ***1. 176
B5 *** *** ***1. 176
B4 *** *** ***1. 176
B3 *** *** ***1. 176
B2 *** *** ***1. 176
B1 *** *** ***
13 September 2019 P-E Corporate Services SA 29
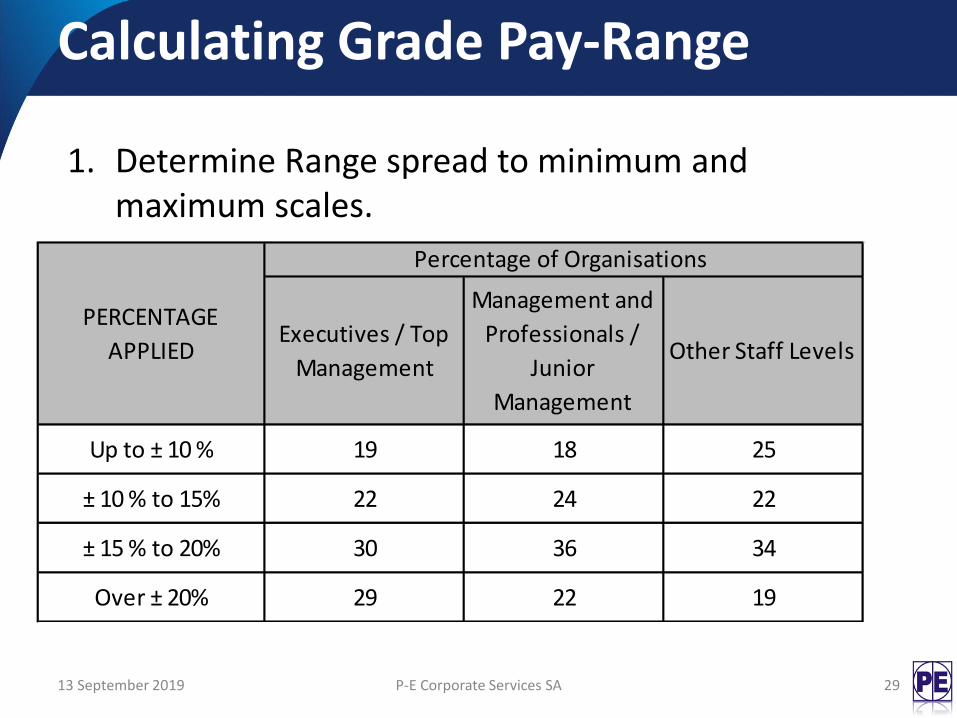
1. Determine Range spread to minimum and maximum scales.
Calculating Grade Pay-Range
Executives / Top
Management
Management and
Professionals /
Junior
Management
Other Staff Levels
Up to ± 10 % 19 18 25
± 10 % to 15% 22 24 22
± 15 % to 20% 30 36 34
Over ± 20% 29 22 19
Percentage of Organisations
PERCENTAGE
APPLIED
13 September 2019 P-E Corporate Services SA 30
0
100 000
200 000
300 000
400 000
500 000
600 000
700 000
800 000
900 000
1 000 000
1 100 000
1 200 000
1 300 000
0 1 2 3 4 5 6 7 8 9 10 11 12 13 14 15 16 17
Gu
aran
tee
d P
acka
ge (
Ran
ds
per
an
nu
m)
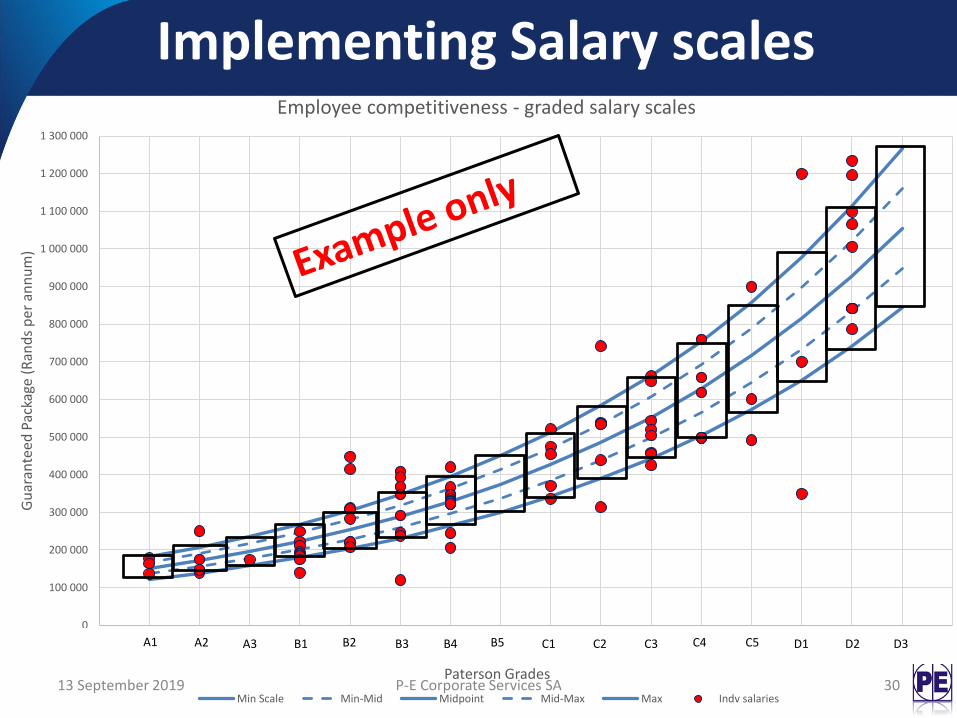
Paterson Grades
Employee competitiveness - graded salary scales
Min Scale Min-Mid Midpoint Mid-Max Max Indv salaries
A1 A2 A3 B1 B2 B3 B4 B5 C1 C2 C3 C4 C5 D1 D2 D3
Implementing Salary scales

Suggested guidelines for addressing outliers
• “Outliers” in terms of pay should be reviewed to identify their validity (ensure it is not simply a wrong grade on the payroll record etc), and corrective action taken where appropriate.
• Valid outliers should be ring-fenced with reasons for them being outside the pay scale parameters. (You may wish to approve these reasons).
• People paid outside the parameters, for no specific/valid reason, should be moved soonest to within the scales, or dependent on the size of the % move required, over a period of time (say within 2 - 3 years – this needs your input).
• New appointees should be paid within the scale parameters.
13 September 2019 P-E Corporate Services SA 32
0
100 000
200 000
300 000
400 000
500 000
600 000
700 000
800 000
2 3 4 5 6 7 8 9 10 11 12 13 14
Sala
ry (
Gu
aran
teed
Pac
kage
) R
and
s p
er a
nn
um
.
Paterson Grades
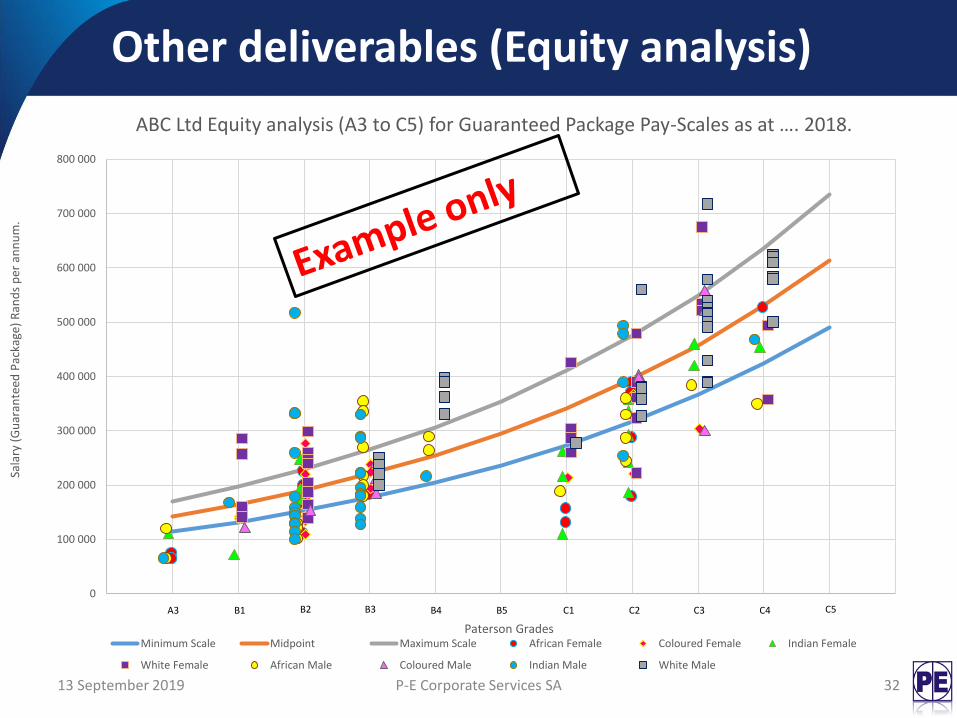
ABC Ltd Equity analysis (A3 to C5) for Guaranteed Package Pay-Scales as at …. 2018.
Minimum Scale Midpoint Maximum Scale African Female Coloured Female Indian Female
White Female African Male Coloured Male Indian Male White Male
A3 B1 B2 B3 B4 B5 C1 C2 C3 C4 C5 C5
Other deliverables (Equity analysis)

13 September 2019 P-E Corporate Services SA 33
Basic Salary vs Guaranteed
Package?
Market data and/or internal
equity? Affordable?
Market data –source, date and
percentile
Single vs multiple scales (e.g. by
region or function)
Which employees does the scale
cover?
What do I do with scarce critical skills paid at a
premium?
What is the typical range
spread?
Consistent slope vs kink(s) in the
pay-line?
Annual vs monthly?