feedback of performance indicators as a strategic instrument for school improvement
TRANSCRIPT

REICE - Revista Electrónica Iberoamericana sobre Calidad, Eficacia y Cambio en Educación2005, Vol. 3, No. 1 http://www.ice.deusto.es/rinace/reice/vol3n1_e/VanhoofVanPetegem.pdf
FEEDBACK OF PERFORMANCE INDICATORS AS A STRATEGIC INSTRUMENT FOR
SCHOOL IMPROVEMENT
Jan Vanhoof and Peter Van Petegem
1. INTRODUCTION
In the last decade the development of (international) educational indicators has been extendingin many ways: the number of countries involved, the aspects covered, the impact on educationalpolicy, their attention in the media. More recent is the attention that is given to the feedback ofindicators to individual schools. More and more stakeholders become convinced of the fact that abetter use of the indicators could lead to powerful opportunities for individual schools to analyse andimprove their educational quality (Van Petegem & Vanhoof, 2002). A very important role in thisrespect is reserved for models that provide individual schools with feedback.
This contribution firstly investigates whether there is a need for providing educationalindicators and benchmarks resulting from international comparative research to individual schools.Next, two Flemish case studies that actually equip schools with individual feedback are presented. Inthe third part we report on the interviews with school principals on their use of the school reports.
2. IS THERE A NEED FOR FEEDBACK?
There is no use in creating opportunities for feedback of quality indicators on and to individualschools, if there is no need for such information. As a consequence, the first question we need toaddress is whether schools themselves are interested in the indicators. The following elements indicatethat -both from the government’s and the schools’ view- they actually are.
2.1. From the government’s point of view
Schools are currently more autonomous then before. In the meanwhile (or as a result) they areexpected to invest in internal quality control. A government that stimulates its schools to evaluate theirown practices has to create the appropriate context to do so (Emin, 1995). Providing schools withrelevant information concerning their own functioning is an important requisite to facilitate suchevaluation. By providing indicators on individual schools the government primarily aims at informingschools in order to conduct a documented study of their own strengths and weaknesses. As such theemphasis is not on judging the quality of individual schools from the government’s perspective (cf. theinspectorate’s task).
Another reason -from the government’s point of view- that makes it desirable to providefeedback to individual schools is the motivation of schools towards the (international) gathering ofquality indicators. Schools often participate in scientific research without noticing its immediateresults. Despite the fact that the participation demands a considerable effort of schools they rarely see
Vanhoof and Van Petegem http://www.ice.deusto.es/rinace/reice/vol3n1_e/VanhoofVanPetegem.pdf
207
the direct benefits of it. Educational research that relies on the willingness of schools to participate isoften confronted with a striking amount of schools that is reluctant or unwilling to cooperate. One ofthe main reasons to explain this reluctance is that principals and teachers are not convinced of theusefulness of the studies for their individual school. The feedback to and on individual schools createsinteresting possibilities to alternate this situation.
2.2. From the schools’ point of view
Schools that undertake a self-evaluation need appropriate information to do so. Thisinformation is needed in a form that schools can use to evaluate how well they are providing for thedifferent needs of their pupils. On that basis they are equipped to evaluate their own performances andto take well-considered decisions about what actions and innovations to undertake. Having a realisticperception of its own efficiency and effectivity is an essential requisite to improve schools’ quality.The confrontation of one’s own performances with these of other (similar) schools -the mirror functionof school feedback- creates powerful opportunities to stimulate quality development. The set ofindicators enables schools to reflect and to discuss. The availability of benchmarks indicates whetherthey are performing relatively well or rather poor. In both cases schools are challenged to identifyexplanations, causes and –if necessary- solutions. Of course, the mere fact that schools receiveindividual feedback on their performances does not automatically imply that they will undertake thenecessary actions. Feedback is a necessary step but it is not necessarily a sufficient step.
3. TWO FLEMISH CASE STUDIES - SCHOOL REPORTS BASED ON TIMSS-R AND PISA
Recently the Flemish Ministry of Education has adopted the policy that information derivingfrom comparative international studies should result in feedback to individual schools. Not that thereis a legislative regulation from the Flemish Parliament or an official document that stimulates thecomposition of school reports. It seems crucially that the chairman and members of the Flemishsteering committee of the TIMSS-R and PISA studies were convinced of the fact that the feedback ofindicators is indeed an important possibility to enhance the impact of indicators. This interest for thefeedback of indicators was the main impetus of the Flemish school reports. As such the existingfeedback initiatives are rather the result of the personal interest of these members than of a formalpolicy decision. There is however another feature of the Flemish educational system that needsclarification. The TIMSS-R and the PISA studies are the only comparable indicators that are available inthe Flemish educational system since it has no system of central examinations. This rather uniquesituation makes it comprehensible why Flanders has no previous experience in the feedback ofnationally gathered information on indicators of individual schools.In the following we will focus on two exemplars that actually provide feedback to schools on the basisof international research, namely the TIMSS-R and PISA school reports.
3.1. School reports based on TIMSS-R
The TIMSS project (Third International Mathematics and Science Study) focuses on pupils'knowledge of and attitudes towards mathematics and science in grade 8 (ISCED 2). The Flemish schoolreports discussed here are based on the results of the TIMSS-R (repeat) study (Van Damme & Van denBroek, 2000; MGV, 2002, pp. 24-34). TIMSS-R collected extensive information from pupils, teachers,

Vanhoof and Van Petegem http://www.ice.deusto.es/rinace/reice/vol3n1_e/VanhoofVanPetegem.pdf
208
and school principals about mathematics and science curricula, instruction, home contexts, but alsoschool characteristics and policies. In Flanders researchers gathered some extra data in order to be ableto explain the differences between schools and classes within Flanders. The extended data broaden theinternational study by including more classes and more pupils and by including additional variables(e.g. intelligence tests, the extent of problematic behaviour, and percentage of absence) and aquestionnaire for the parents (including level of education, professional situation, country of origin).
The TIMSS-R school reports consist of three parts: an introduction, math and science results,and other relevant variables. The introduction focuses on some remarks that should be taken intoaccount while interpreting the feedback. The other sections are more elaborated.
Concerning math and science results the questioned classes in a particular school are situatedin relation to all the other classes (N=261) that participated in the TIMSS-R study. This comparisonwith other classes is provided on the ground of two types of information, namely on the basis of rawresults and on the basis of adjusted results. In the latter comparison the intake characteristics of pupilsare taken into account. Both the raw and adjusted class data are visualised using the following graph.The triangle () represents the mean score of the concerning class and the vertical line marks theconfidence interval. The dotted line indicates the mean score of all Flemish classes.Figure 1. Adjusted math results
The position of a class in such figure varies depending on whether raw data or adjusted dataare used. Classes move over a certain number of places going from the raw data to the adjusted data.The school reports state that this means that pupils perform better or worse than would be expectedgiven their input characteristics (Van Damme & Van den Broek, 2000). If the number of places a classmoves over is negative this means that the class has a relative worse result when the scores areadjusted, if the number is positive the class has performed relatively better than would be expectedgiven the intake. On that basis the school reports aim to be able to judge schools to be more or lesseffective. The school report is indicates how many places the individual classes in the particular schoolmove when the results are adjusted. For example: Class a (2 Latin): number of places moved, -3.00and Class b (2 Modern languages): number of places moved, +14.00. To interpret these data theTIMSS-R school report additionally presents a histogram that gives an overview of how many classesmove up a particular number of places if the intake characteristics of pupils are taken into account.

Vanhoof and Van Petegem http://www.ice.deusto.es/rinace/reice/vol3n1_e/VanhoofVanPetegem.pdf
209
One graph focuses on math results, another on science results. This information aims at enablingschools to determine the relative quality of the results of the different classes that participated in theTIMSS-R study.
Several types of information concerning the math and science results of classes and theirpupils may be obtained from figure 2. The school report provides the following clarification to thisfigure (Van Damme & Van den Broek, 2000, p.3).
Each pupil is represented by a little cross. The thick line is the most suitable connection between intelligence and
math/science scores in the class. The dotted lines mark the 95% confidence interval. The long line demonstrates the
overall connection between intelligence and math/science scores of all Flemish pupils in TIMSS-R. If the lower dotted line
lies above the long line the class has a significant better math score than would be expected given the intelligence scores.
If the long line is situated between the two dotted lines we cannot conclude with 95% certainty that the results of the
particular class differ significantly from the overall results.
Figure 2. The correlation between intelligence and math/science scores
Figure 2 also provides information on the differential effectiveness of classes. This means that a class that realises
relatively good results with low-intelligence pupils not necessary realises good results with high-intelligence pupils. This
information can be deduced from the steepness of the lines. If the thick school line is less steep than the long line this
means that in this particular class the pupils with a low intelligence score perform relatively better and the pupils with a high
intelligence score relatively worse. If the thick school line is steeper the opposite is true. In the above example it appears
that the class is not more or less differential effective than the mean Flemish class. The two lines are parallels.
Finally, the above figure also provides information on the input of classes. Both the length and the position of the school
line are relevant. The length is an indication for the heterogeneity of the intelligence scores of the pupils: a short line
indicates all pupils of the group have similar scores, a long line means the class is composed of pupils with high and low
intelligence scores. The position of the line –whether it lies mainly on the left or the right of the vertical 0-line informs about
the actual intelligence scores of the pupils. If the line lies mainly on the left of the vertical dotted line, the class is composed
of pupils with generally low intelligence scores. If it lies on the right the intelligence scores of pupils are higher than
average.
-47.0 -35.3 -23.5 -11.80.0
11.8 23.5 35.3 -47.0
Intelligence score
mat
h sc
ore
139
181
153
167X
X
X XX
XX
X
XX
X
X
X
X
X
X

Vanhoof and Van Petegem http://www.ice.deusto.es/rinace/reice/vol3n1_e/VanhoofVanPetegem.pdf
210
The third part of the TIMSS-R school report enables schools and classes to compare their resultswith these of all participating schools and classes. Information is provided at three levels: at the pupillevel (index for the life comfort at the pupil’s home, numeric and special intelligence score, educationlevel of the parents and positive math/science attitudes), at the class level (teachers’ view on theconstructivistic organisation of the learning environment, obstruction of the instruction by the pupilsand study orientation of the class group) and at the school level (frequency of problematic behaviour,the extent of problematic behaviour and percentage of absence). The information concerning thesevariables is presented to schools by reporting on (1) the results (mean score and standard deviation) ofall participating classes and schools in general (2) on the results (mean score and standard deviation)of pupils, classes and the individual school in particular. In order to enable comparison the reportprovides graphs that specify how many classes or schools have a particular (mean) score. Based onthis graph and the individual results schools can situate themselves in the broader group of allparticipating schools.
3.2. School reports based on PISA
PISA (The Programme for International Student Assessment) is an international survey on theknowledge and skills of 15-year-olds. Although the assessment domains are closely related to subjectslearned at school, PISA concentrates on the value of the skills acquired, beyond the school gates. Itassesses young people's capacity to use their knowledge and skills in order to meet real-life challenges,rather than merely looking at how well they have mastered a specific school curriculum. In the year2000-study PISA assessed literacy in reading, mathematics and science. These data are howeverbroadened towards more general outcomes and characteristics of learning. These include for instance:gender, family background (occupational status, family wealth, parental education, family structure,place of birth), and information on the learning environment and the organisation of schooling (schooland classroom climate, learning outside school and resources invested in education). In Flanders 124schools participated in the PISA-study (De Meyer et al., 2002). In each school 35 random selectedpupils took the assessments and were also asked to answer questionnaires about themselves and theirschools. School principals were asked to give further information on school characteristics in another30-minute questionnaire.
Each school that participated in the PISA study received information on the individualperformances of its pupils. In the school report they received three drawings similar to the one infigure 3 (one for each literacy domain) (De Meyer et al., 2002, p.21). Each school in the Flemish PISA
study is represented by a symbol. The mark of the particular school is indicated in red and theperformances of five similar schools are indicated in another colour. This way the researchers want tocreate an opportunity to compare the performance of a school with these of similar schools withoutindicating the name of these schools. The eight groups of similar schools are based on the(combination of) courses of study schools provide (for instance general education, technical education,general and vocational education, etc.).Figure 3. The reading literacy performances of Flemish schools, in comparison with the Flemish andinternational gradients for reading

Vanhoof and Van Petegem http://www.ice.deusto.es/rinace/reice/vol3n1_e/VanhoofVanPetegem.pdf
211
The symbol of the own school (indicated in colour) informs on two indicators. The heightinforms on the mean test score of all participating pupils in the school and the position in the breadthon the mean socio-economic status of the tested pupils. The different shades represent the differentproficiency levels that are distinguished in literacy domain (six in reading and two in math andscience). The graph also contains the Flemish (Vlaanderen) and international (internationaal) gradientof the specific literacy domain. As a consequence schools get an impression of their relativeperformance in a Flemish and international context.
4. RESEARCH QUESTIONS AND METHODOLOGY
In the following we present the results of interviews with 5 Flemish secondary school leaders.The purpose of this investigation was to gain an explorative insight of their use of and their remarks onthe recent initiated systems to provide schools with individual feedback as a result of the gathering of
_
_ General
_ Technical/vocational
_ Technical
_ Gen./technical
_ Gen./Tech./Voc.
_ Gen./Technical
+
_

Vanhoof and Van Petegem http://www.ice.deusto.es/rinace/reice/vol3n1_e/VanhoofVanPetegem.pdf
212
international educational indicators1. As such, we did not aim at reaching representative conclusionsat a general level.
In an interview (approximately 60 minutes) the personal views of principals were questioned.The focus of the interviews was the feedback provided to schools after their participation in theinternational comparative TIMSS-R and PISA studies. Attention was paid to schools’ need for feedbackand their use of the available information. Furthermore, we intended a critical reflection on the contentand form of the existing school reports. The school of the interviewed principals was one of theschools which participated in both the latest TIMSS-R and PISA study and which received two schoolreports. The fact that schools received both school reports was actually the only criterion in theselection of respondents. Nor other school-related aspects (number of pupils, denomination, structure,local context) nor the fact that they performed rather good or poor was taken into account.
5. RESULTS
5.1. Acquaintance with the school reports
Telephonic contacts with the respondents before the interviews already learned that principalsare acquainted with the school reports. They are rather familiar with the content and they are aware ofthe sources of the feedback.
At the moment schools were asked to participate in the TIMSS-R and PISA study, theresearchers clearly stipulated that schools would receive feedback on their performances. In spite ofthis, all principals lost the prospect of feedback out of sight. None of them was actually awaiting theschool reports. At the moment the school report arrived at the school all principals nonethelessconsulted them with great interest. All school leaders indicate they were very curious about their ownresults. Consequently, all principals at least had a look at the school report whilst the further use of itstrongly differs.
During the interviews principals primarily remembered whether their school performed well,on average or poorly. It appears that mainly information on the performances of pupils is kept in mind.Information concerning more specific aspects of pupils’ performances (such as differences betweenscience and math results) and other types of information (such as truancy rates) could not be recalled.Moreover, while reading the reports two principals didn’t notice that data on process aspects of theirschool (such as truancy rates and discipline) were included as well. We conclude that school leadersare very familiar with the existence and the background of the school reports but are less acquaintedwith the content.
5.2. Use of the school reports - findings
None of the principals considered how to use the school reports before these were actuallysent to the school. They had not planned in advance how to use the available data in the school’seducational policy. As such, in all schools the story of the school reports starts with their arrival at theprincipal’s desk. The use of the information by principals differs from that point. While one principal
1 As described in Van Petegem, P. & Vanhoof, J. (2002). Benchmarking the Quality of School education. Enhancing the impact ofindicators. Feedback of indicators to schools.

Vanhoof and Van Petegem http://www.ice.deusto.es/rinace/reice/vol3n1_e/VanhoofVanPetegem.pdf
213
only had a quick look at the results before passing them to relevant persons in charge, others filteredand distributed the information or actually made use of it themselves. Generally, we distinguish threedifferent ways of using the school reports by the principals: withholding, passing on and using.
5.3. Withholding the school reports
If the available data don’t fit in the discourse of the principals, they don’t seem to hesitate toobscure and withhold them. In case the information is counterproductive for their planned policy it iskept back from other stakeholders. If principals are -for example- strongly convinced of theengagement and efforts of their personnel to provide educational quality, they are reluctant to provideless good results to their personnel. In these cases the school reports don’t leave the principal’s office.‘The end justifies the means’ a principal says. The possibility to motivate teachers appears to be animportant requisite to start using the available information. In case the feedback differs from formerresults and from the principal’s own experiences the information isn’t used either. If school leadersdon’t know how to situate the available information in the other data on the school’s educationalpolicy the school reports are not used. This does not necessary imply that principals act mysteriouslyand maintain the greatest secrecy about the school reports. Often the decision to withhold the schoolreports is taken in consultation with other members of the school’s management.
As such school leaders withholding the school reports from the other school personnel put tworeasons forward to do so: (1) the data would put a damper on the engagement of their teachers and/or(2) the data didn’t match their own experiences and information from other sources on their school’sfunctioning. The interviewed principals that actually withheld the information are in charge of aschool that performed rather poor. They admit however that they would have passed the information tothe teaching staff if their school had performed better.
5.4. Passing the school reports
Some principals passed the school reports to different persons involved without paying muchattention to the reports themselves. These school leaders don’t have a clear view on what happenedwith the information afterwards. They assume that the information is consulted by individual teachersor that it was discussed at particular section meetings. The attention for the information in the schoolreports is however presumed to be rather limited: ‘there are no pedagogical or didactic lessonslearned from the available information’. One principal provided the school reports to the ‘participationcouncil’2 but again it was unclear whether the information was actually used or not.
The school reports are distributed either completely or partially. While one principal providedthe entire school reports to a selection of teachers, another principal provided a selective summary toall teachers. The latter stipulated that the summary was needed because of the formalistic and abstractnature of the school reports: ‘I had to translate the school reports prior to provide them to myteachers’. It is remarkable that principals take the perceived possibilities of teachers to interpret theinformation into account when they pass the school reports. They will -for example- rather provide theschool reports to teachers which are -because of their preliminary training- familiar with statistics thanto teachers which are not.
2 Four areas of responsibility for the "Participation Councils" ( Participatieraden) are established as a minimum in Flanders. These areas ofresponsibility can be extended by the councils themselves. They have 'the right to information'; 'advisory authority' as a minimum for thegeneral organisation and operation of the school; 'consultative authority' and 'authority of assent' (only in the grant-aided free educationnetwork) on, for example, the planning of the school calendar (Eurydice database on Flemish education - consulted September 2002).

Vanhoof and Van Petegem http://www.ice.deusto.es/rinace/reice/vol3n1_e/VanhoofVanPetegem.pdf
214
School leaders stipulate that pupils have the right to know how they performed as well. In case theschool reports include information on individual pupils these data are fed back to the pupils involved,at least if principals perceive this information to be accurate and if the pupils still attend the particularschool.
5.5 Using the school reports
All principals indicate that information (c.q. individual feedback) is valuable regardless of theactual performances of the school. In spite of this they appear to make different use of the informationaccording to their school’s performance. Of the interviewed principals only those in charge of schoolswith good results actually used the information. The term ‘using’ means that they did more with theschool reports than solely passing them through. This however only includes activities such asmotivating teachers and underlining the quality of the school at a reception. Activities relating to self-evaluation and quality improvement are not reported. Principals indicate that they lack strategies sothey had to start using the information in a rather ‘amateurish’ way.
The use of school reports seems to depend on the performances of schools. Good results are aconfirmation of the quality of a school’s functioning. These schools are flattered by their results in theschool reports. That way the information can be used to stimulate and motivate teachers and otherpersonnel. Schools with good results sometimes take the initiative to provide the information in theschool reports to the wider public as well. ‘Just like the Flemish department of Education was proud ofits results compared internationally, we -as a school- were proud of ours as well.’ The principals ofschools with rather poor results take the information very seriously as well but they do not distributethe school reports any further. They state that schools with poor results have to question their actualfunctioning and should search for potential causes and appropriate actions. However, if schools do notsucceed in addressing such questions the available information in the school reports will probably beleft unused. Potential reasons for finding are discussed in the following paragraph.
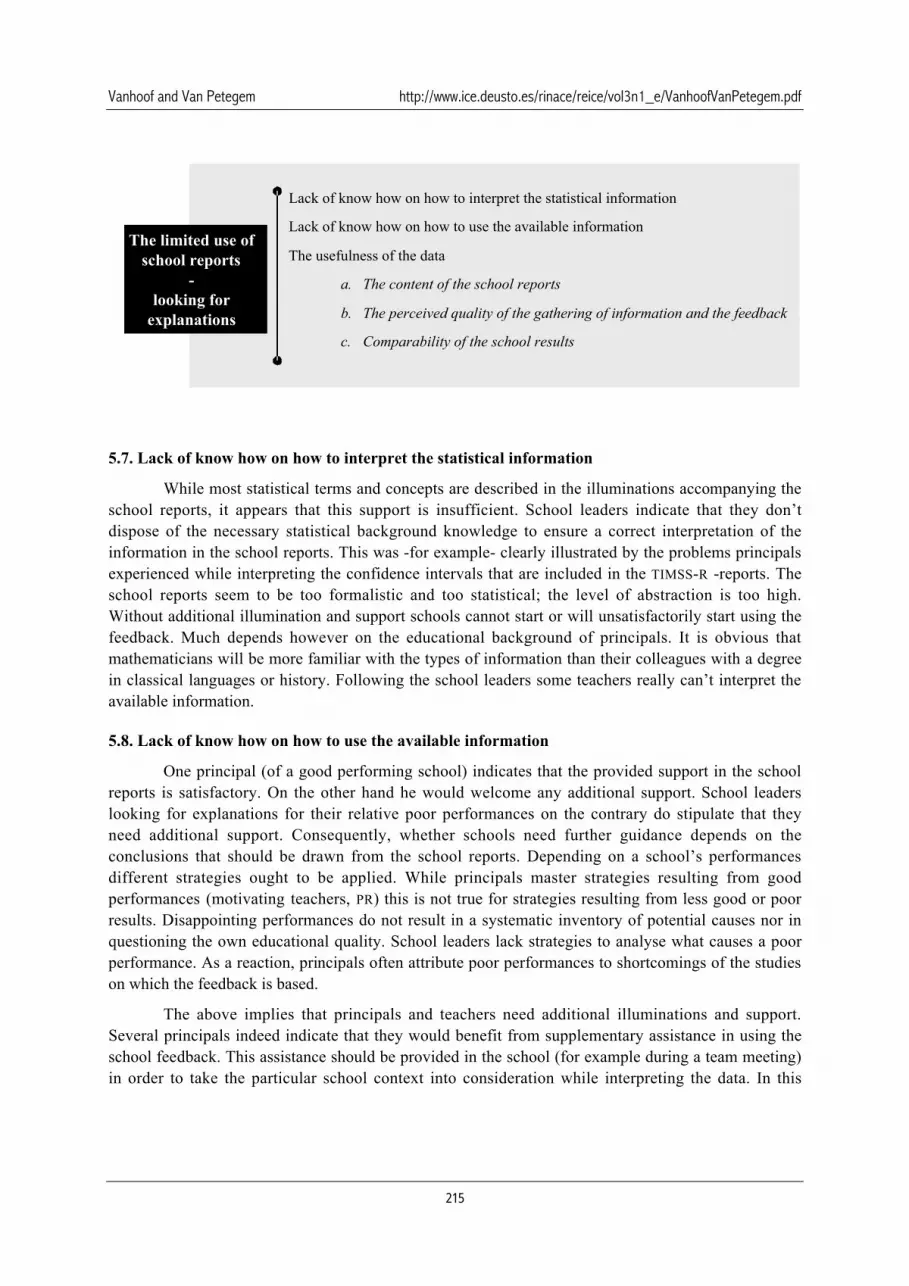
5.6. The limited use of school reports - looking for explanations
Despite the fact that principals subscribe the importance of feedback on different aspects of aschool’s functioning, we have to conclude on the basis of the five interviews (with all the restrictionsfor generalisations) that the TIMSS-R and PISA school reports are not or only very slightly used byschools. None of the school leaders indicated that the school reports actually led to a questioning oftheir own functioning and to specific policy decisions. Besides the motivation function and thepublicity function the school reports did not result in specific activities. As such there appears to be adistinction between principals’ demand for feedback and their use of it. In the following paragraphswe make an inventory of the arguments used by school leaders to account for their limited use of theschool reports.
Vanhoof and Van Petegem http://www.ice.deusto.es/rinace/reice/vol3n1_e/VanhoofVanPetegem.pdf
215
5.7. Lack of know how on how to interpret the statistical information
While most statistical terms and concepts are described in the illuminations accompanying theschool reports, it appears that this support is insufficient. School leaders indicate that they don’tdispose of the necessary statistical background knowledge to ensure a correct interpretation of theinformation in the school reports. This was -for example- clearly illustrated by the problems principalsexperienced while interpreting the confidence intervals that are included in the TIMSS-R -reports. Theschool reports seem to be too formalistic and too statistical; the level of abstraction is too high.Without additional illumination and support schools cannot start or will unsatisfactorily start using thefeedback. Much depends however on the educational background of principals. It is obvious thatmathematicians will be more familiar with the types of information than their colleagues with a degreein classical languages or history. Following the school leaders some teachers really can’t interpret theavailable information.
5.8. Lack of know how on how to use the available information
One principal (of a good performing school) indicates that the provided support in the schoolreports is satisfactory. On the other hand he would welcome any additional support. School leaderslooking for explanations for their relative poor performances on the contrary do stipulate that theyneed additional support. Consequently, whether schools need further guidance depends on theconclusions that should be drawn from the school reports. Depending on a school’s performancesdifferent strategies ought to be applied. While principals master strategies resulting from goodperformances (motivating teachers, PR) this is not true for strategies resulting from less good or poorresults. Disappointing performances do not result in a systematic inventory of potential causes nor inquestioning the own educational quality. School leaders lack strategies to analyse what causes a poorperformance. As a reaction, principals often attribute poor performances to shortcomings of the studieson which the feedback is based.
The above implies that principals and teachers need additional illuminations and support.Several principals indeed indicate that they would benefit from supplementary assistance in using theschool feedback. This assistance should be provided in the school (for example during a team meeting)in order to take the particular school context into consideration while interpreting the data. In this
The limited use of school reports
-looking for
explanations
Lack of know how on how to interpret the statistical information
Lack of know how on how to use the available information
The usefulness of the data
a. The content of the school reports
b. The perceived quality of the gathering of information and the feedback
c. Comparability of the school results

Vanhoof and Van Petegem http://www.ice.deusto.es/rinace/reice/vol3n1_e/VanhoofVanPetegem.pdf
216
sense principals refer to the role of the inspectorate, of the educational guidance services3 and ofresearchers themselves in the development and dissemination of strategies en methodologies.Principals need ready to use activities that help them in using the available information. Schoolsthemselves have however an important role to play as well in acquiring the necessary know how toselect and live up to relevant strategies. Schools should not only depend on other institutions to startusing the information.
In order to facilitate the use of the information school reports have to abandon the currentformal and abstract language. A principal stipulates that what schools have to do is exactly theopposite of the language usage in the school reports: schools should talk to people in anunderstandable language and report in more informal contexts. ‘An informal chat with an expert ismuch more informative than these abstract school reports.’
5.9. The usefulness of the data
Principals evaluate the usefulness of the data in the school report on the basis of three criteria:(a) the content of the school reports, (b) the perceived quality of the gathering of information and (c)the feedback and comparability of individual school data. If the school reports -as perceived by theprincipals- don’t meet these requirements, the information will probably be left unused. Instead ofattributing poor performances to features of the own organisation they will tend to conclude that theseare solely the result of the lack of relevance and accuracy of the provided data. Principals will forexample suspect that the research is characterised by some peculiar aspects or that the pupils or classesin the sample were by accident rather weak.
a. The content of the school reports
The use of the school reports logically depends on the content. Principals’ judgement of thecontent is based on their evaluation of the relevance of the provided data in the improvement of theirschool policy and on the accordance of the results in the school reports with their previousexperiences.
The relevance of the available data. School leaders are in the first place interested ininformation concerning educational output. Above all, they want to know how good theirpupils are performing. Information on ‘truancy rates’ and ‘obstruction of the instruction by thepupils’ for example does not seem to get equal attention. The focus of the TIMSS-R and PISA
school reports is exactly on pupils’ performances and as such they meet important informationneeds of schools. In some schools the information complements other information that isavailable on pupils’ performances (such as success rates in higher education).
Principals are aware of the fact that possibilities to feed back information to individual schoolson the basis of the TIMSS-R and PISA studies are limited. Nonetheless they would welcomeadditional school data on possible causes of a particular performance and on informationconcerning opportunities to optimize existing practices. Next to the individual educationalplans each school however has different information needs and specific questions (such as theabsence rates of teachers, the amount of participation in schools’ policy, the performances ofspecific pupil groups). In order to meet these needs the available data ought to be broadened.
3 These are external pedagogical support services to schools organised within the three main education ne tworks in the FlemishCommunity.
Vanhoof and Van Petegem http://www.ice.deusto.es/rinace/reice/vol3n1_e/VanhoofVanPetegem.pdf
217
However, school leaders don’t seem to have a clear vision on which information shouldadditionally be included. They find it hard to indicate which additional indicators would bemost valuable. As such it appears that principals are rather receptive than proactive. Theywelcome all information that is provided but they hardly succeed in selecting potentialindicators that would be useful in their school’s quality control.
As a rule, it doesn’t bother school leaders that the content of the school report is based oninformation gathered two years ago. Most of them indicate that they are primarily interested ingeneral trends and that school populations do not change that much. Moreover, they state thatthey can still remember the specific school population of two years ago. In some schools(middle schools for example) the data are not up to date anymore. In one school for exampleone third of the school population at the time of the TIMMS-study did not attend the schoolanymore when the feedback arrived. Although beyond the reach of the researchers, suchproblems imply that the content of the school reports is not perceived to be useful enough.Finally, principals mention that a two-year period is indeed too long in order to informindividual pupils on their performances. Given these considerations researchers should -withinthe bounds of possibility- try to provide the individual school feedback as soon as possible.
Accordance with principals’ previous experiences. Principals claim that they know theirschool through and through (how many hours are spent on a particular subject, who teachesthe studied class, which pupils were in that class, etc). As such they indicate that the feedbackmostly affirms what they already (intuitively) expected and that they are not surprised by theresults. We thus cautiously conclude that principals endorse and appreciate the information inthe school reports if their intuition is affirmed and that they question the relevance and thequality of the information if their intuition is (in a negative sense) not affirmed. In the lattercase they do not subscribe the reliable ‘mirror function’ of the school reports that shouldcomplement intuition.
b. The perceived quality of the gathering of information and the feedback
In general the international studies on the basis of the school feedback are perceived to bereliable and of a very good quality. Principals indicate in this regard that they don’t have the necessarybackground knowledge to criticize the researches. They all have the impression however that theoutput results should be put into perspective. ‘If another class, with different pupils and a differentteacher would have been questioned at another moment, the results would probably strongly differ.’The school leader of a good performing school states that information on bad performances should notbe ignored and that these results cannot automatically be attributed to shortcomings of the research.He’s nevertheless aware of the fact that he probably would be less critical about the researches thanhis colleagues of worse performing schools. This seems a correct evaluation. There are indeed somefeatures of the school reports that instigate the principals of schools with rather poor performances todoubt the quality of the studies.
School leaders don’t have a clear view on the reasons why researchers opt for a particularresearch design. This leads to judgements about the quality of the studies that are actuallyinappropriate. The fact that PISA -reports are for example based on questioning a randomsample of pupils makes the feedback not as useful for all schools. Principals refer to thefact that the mere mean math results do not provide much information if the pupils takevery diverse courses of study (general, technical and vocational education). After all, noneof the math teachers can benefit from the not-differentiated mean score. The total group of

Vanhoof and Van Petegem http://www.ice.deusto.es/rinace/reice/vol3n1_e/VanhoofVanPetegem.pdf
218
pupils is too diverse and takes too different courses under the responsibility of too manyteachers. As such the principals experience the design of TIMSS-R to be more interesting.These data refer to one specific class with one math teacher. What principals don’t knowis that the different purposes of both studies require different designs.
There are however also some critics which are not due to the insufficient backgroundknowledge of principals. We refer for example to the list with performances of individualpupils in the PISA report that was not always accurate (it was not included or in some casesit seemed to contain for example one or two names of pupils that never attended theschool). Principals find this impermissible in scientific research.
A third critique of principals relates to the importance of comparability of the schoolresults. This critique is depicted in the following paragraph.
c. Comparability of the school results
Principals support the possibilities to compare schools. Initially they are pleased to be able tocompare their results with these of other schools (in the Flemish education system) because it canthrow an interesting light on the own performances. Principals are very interested in information onhow other schools come to grips with certain problems. Comparisons should lead to advises on how tooptimise the own educational practices. Furthermore, schools would like to get in contact with similarschools that have better results in order to study how they do the same thing differently (c.q. better).
If schools have good results it is more pleasant to compare with others. In these cases thequality of the comparisons is not questioned. It is however questioned by principals of schools withrather poor results. One principal indicates that he had no idea about criteria that were used to selectsimilar school in the PISA report (although this was clearly indicated in the report). Because of that hisschool did not look for potential causes of the poor results. A school leader that actually did search forexplanations concluded that the comparability of his school with reference schools had to be doubted.Because of potential differences between schools that provide the same courses of study not allreference schools are actually similar to the school to be compared. If the system to compare schools isto be criticized, it seems logical that school leaders will be reluctant to put much weight on the schoolreports.
5.10. Additional aspects of the school reports
In the following paragraphs we pay attention to some additional aspects of the Flemish TIMSS-R and PISA-reports. These are (1) the role of feedback in order to participate at research and (2) theimportance of anonymity and confidentiality.
5.11. The role of feedback in order to participate at research
Following the interviewed principals the promised feedback wasn’t a necessary condition toparticipate in the TIMSS-R and PISA studies. Principals do however pay attention to the prospect offeedback when they decide on which research their school will participate. The importance offeedback is perceived differently by the school leaders. ‘Well I don’t think much of taking part ofresearch without feedback’ says one. Another principal talks about ‘scientific honesty’. In general theyalways welcome feedback but not without being aware that this is not always possible nor relevant.On the other hand there are also principals that state that they took part of the research in order tosupport the research and not in the first place because of the prospect of feedback. Their criterion todecide whether or not to participate is the perceived usefulness of the research in general.
Vanhoof and Van Petegem http://www.ice.deusto.es/rinace/reice/vol3n1_e/VanhoofVanPetegem.pdf
219
School leaders indicate that they would be willing to invest in more time consuming researchif this would result in additional feedback. Ideally they would like to decide themselves on whichindicators to be gathered. They favour a feedback system that enables them to select the informationthemselves in order to meet the needs of their particular school context. On the other hand they fearthat with the large formalisation of such systems the informative and appealing nature of the feedbackwill decrease.
5.12. Anonymity and confidentiality of the school reports
With ‘anonymity’ we mean that schools don’t know the identity of the other schools in thereport. Normally school leaders are not interested in the names of the other (reference) schools.Anonymity is a necessity. On the other hand they indicate that it could be informative to know theidentity of the reference school in order to justify whether the comparisons are justified and to -ifdesired- get in contact with better performing schools.
The confidentiality of the school reports is considered to be very important as well. Thesituation of (rather) poorly achieving schools is thought to get worse if third parties could dispose ofthe individual school results. In many cases the public availability of the school reports would put agreat damper on the engagement, dynamism and diligence of the school team. Principals share theopinion that it is the individual school’s responsibility to decide whether it would like to make the ownresults public or not. Principals of good performing schools that actually made their results public,indicate that they wouldn’t have if the results had been disappointing.
6. SUMMARY
In this contribution we presented the results of interviews with 5 school leaders. This is alimited number and as such the conclusions should be treated very cautiously. It was however not ouraim to reach representative conclusions. We wanted to gain an explorative insight of some aspects andthe remarks on the use of the recent initiated systems to provide schools with individual feedback.
At the moment the school report arrived at the school all principals consulted them with greatinterest. They all indicated they were very curious about their own results, especially about outputinformation. We concluded that school leaders are very familiar with the existence and the backgroundof the school reports but are less acquainted with their content. All principals indicate that information(c.q. individual feedback) is valuable regardless of the actual performances of the school. In spite ofthis they appear to make different use of the information according to their school’s performance. Wedistinguished three different ways of using the school reports by the principals: withholding, passingon and using. The school reports were only used in order to motivate the school team or to promote theschool.
Despite the fact that principals subscribe the importance of feedback on different aspects of aschool’s functioning, we concluded that the TIMSS-R and PISA school reports are not or only veryslightly used. Activities such as questioning of the own functioning and specific policy decisions werenot reported. Besides the motivation function and the publicity function the school reports did notresult in specific activities. As such there appears to be a divide between principals’ demand forfeedback and their use of it. To explain this divide we referred to principals’ lack of statisticalbackground knowledge and their lack of knowing how to use the available information. In both theTIMSS-R and PISA school reports there appears to be a tension between a generality and an

Vanhoof and Van Petegem http://www.ice.deusto.es/rinace/reice/vol3n1_e/VanhoofVanPetegem.pdf
220
individuality: a generality required in order to compare education systems internationally and resultingin an abstract language use on the one hand and an individuality of the concrete school that certainlyhas no benefits from such procedures and language on the other hand. Another factor in the limited useof the school reports is the perceived usefulness of the data. Principals evaluate the usefulness of thedata on the basis of following criteria: (a) the content of the school reports, (b) the perceived quality ofthe gathering of information and (c) the feedback and comparability of individual school data. If theschool reports -as perceived by the principals- don’t meet these requirements, the information willprobable be left unused. Instead of attributing poor performances to features of the own organisationthey will tend to conclude that these are solely the result of the lack of relevance and accuracy of theprovided data.
Given the explorative nature of this paper we round up with some questions that should beaddressed in further research in order to get a complete picture of principals’ use of the TIMSS-R andPISA feedback.
1. We distinguished three different ways of using the school reports by the principals:withholding, passing on and using.
a. Is it correct to conclude that the reports are only very slightly used or would arepresentative sample of schools lead to inconsistent findings?
b. What would be these inconsistent findings?
2. Which are exactly the problems principals face while interpreting and trying to use theavailable feedback?
3. What should be the content and the organisation (structure and methodology) of additionalsupport to schools that aims at preventing the problems in question 2?
4. Which indicators on a school’s functioning are experienced to be most relevant to be fedback?
5. Which indicators on a school’s functioning are experienced to be most relevant to becompared with similar schools?
Which information should be gathered in order to meet principals’ information needs resultingfrom questions 4 and 5?
REFERENCES
Bosker, R., Lam, J.F., Luyten, H., Steen, R., & de Vos, H. (1998). Het vergelijken van scholen [Comparingschools]. Enschede, The Netherlands: Universiteit Twente.
Darling-Hammond, L., & Ascher, C. (1991). Creating accountability in big city schools. New York: ColumbiaUniversity, ERIC Clearinghouse on Urban Education, and National Center for Restructuring Education,Schools and Teaching.
De Meyer, I., De Vos, H. & Van de Poele, L. (2002). Worldwide Learning At Age 15 - First Results from PISA
2000. Brussels:MVG.
DfES, (2001). Autumn Package. London: DfES.
Emin, J. (1995). Des indicateurs de performance des lycées [Performance indicators on high schools]. Paris:

Vanhoof and Van Petegem http://www.ice.deusto.es/rinace/reice/vol3n1_e/VanhoofVanPetegem.pdf
221
Direction de l’évaluation et de la prospective (DEP).
Fitz-Gibbon, C. (1997). The value added national project: Final report. London: SCAA.
Goldstein, H. (1993). Assessing group differences. Oxford Review of Education, 19, pp. 141-150.
MGV (Ministerie van de Vlaamse Gemeenschap), (2002). Vlaanderen in TIMSS [Flanders in TIMSS]. Brussels:MGV.
OECD, (2001). Knowlegde and skills for life. First results from PISA 2000. Paris: OECD.
The Scottish Office, (1997). Raising Standards, Setting targets: Secondary Schools Support Pack. Edinburgh:SOEID.
The Scottish Office, (2002). Setting Targets- Raising Standards in Schools. Edinburgh: SOEID.
Van Damme, J. & Van den Broek, A. (2000). Enige uitleg bij de schoolrapporten [Some clarifications by theschool reports]. Niet gepubliceerd manuscript. K.U.Leuven, Onderzoekscentrum voor Secundair en HogerOnderwijs: Leuven.
Vanhoof, J., Daems, F., Mahieu, P. & Van Petegem, P. (2003). Naar publiek rapporteren over scholen? Lessenuit buitenlandse ervaringen [Towards publishing information on individual schools?]. School enSamenleving, Afl. 2, februari 2003, pp. 5-25.
Van Petegem P. & Vanhoof J. (2002). Feedback of indicators to schools. In: Scheerens J. [edit.]. Benchmarkingthe quality of schools. Enschede, Universiteit Twente.
Yang, M., Goldstein, H., Rath, T en Hill, N. (1999). The use of assessment data for improvement purposes,Oxford Review of education, 25 (4), pp. 469 - 483.