farm facts. farming is still a family affair today, 99% of u.s. farms are owned by individuals,...
TRANSCRIPT

Farm Facts

Farming is still a Family affair
• Today, 99% of U.S. farms are owned by individuals, family partnerships or corporations with fewer than ten stockholders. Only .4% of farms are owned by non-family corporations
Farm Populations
• The farm population in the U.S. has declined from 22 million in 1880 to less than 5 million today

Farm Populations
• The farm population in the U.S. has declined from 22 million in 1880 to less than 5 million today
• The number of farms peaked at 6.8 million in 1935 and is down to 1.9 million farms today

What one acre of land can produce...
•Lettuce
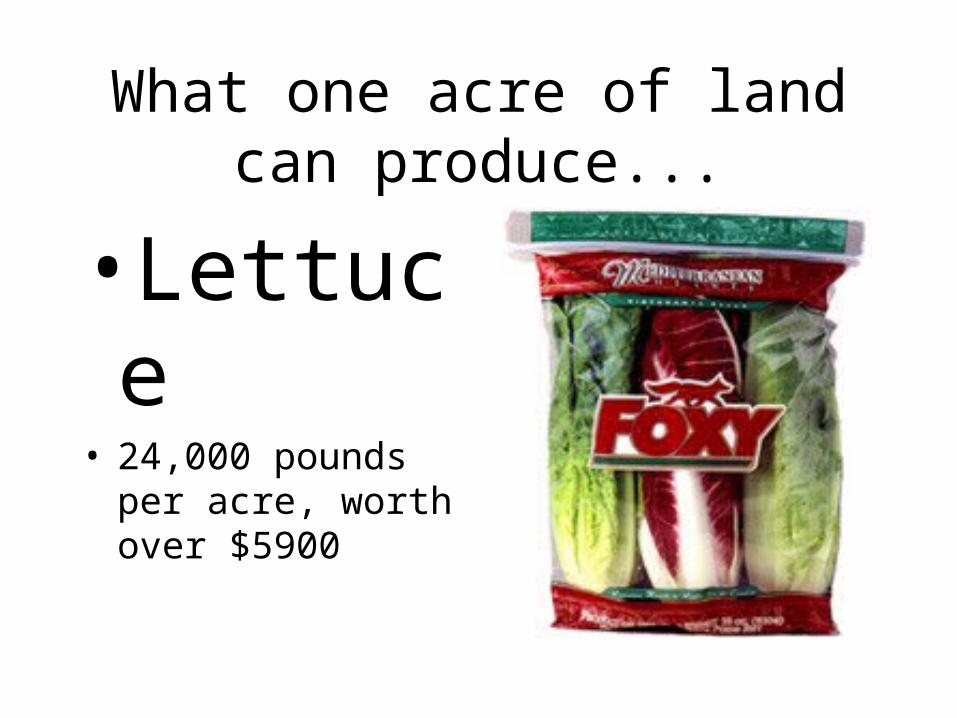
What one acre of land can produce...
•Lettuce• 24,000 pounds per
acre, worth over $5900

What one acre of land can produce...
• Strawberries

What one acre of land can produce...
• Strawberries 45,500 pounds per
acre, worth over $21,000

What one acre of land can produce...
•Potatoes

What one acre of land can produce...
•Potatoes• 36,000 pounds per
acre, worth over $4,400

What one acre of land can produce...
• Navel Oranges

What one acre of land can produce...
• Navel Oranges• 28,800 pounds
per acre, worth over $2,400

What one acre of land can produce...
• Sweet Corn

What one acre of land can produce...
• Sweet Corn• 1,328 pounds per
acre, worth $872

How farming has changed...
• In 1850, about 90 hours of labor were required to raise 100 bushels of corn. Yields were about 40 bushels per acre.

How farming has changed...
• By 1900, the amount of labor to produce 100 bushels of corn was down to about 35 hours. The yield per acre had not changed.

How farming has changed...
• By 1950 commercial fertilizers and tractors pushed yields to about 50 bushels per acre. About 14 hours of labor were required to produce 100 bushels of corn.

How farming has changed...
• Today, only 2.5 hours of labor are needed to produce 100 bushels of corn. Yields are routinely over 200 bushels per acre.

Number of People fed by One Farmer
19
0
20
40
60
80
100
120
140
1940

Number of People fed by One Farmer
1927
0
20
40
60
80
100
120
140
1940 1950

Number of People fed by One Farmer
1927
46
0
20
40
60
80
100
120
140
1940 1950 1960

Number of People fed by One Farmer
1927
46
73
0
20
40
60
80
100
120
140
1940 1950 1960 1970

Number of People fed by One Farmer
1927
46
73
115
0
20
40
60
80
100
120
140
1940 1950 1960 1970 1980
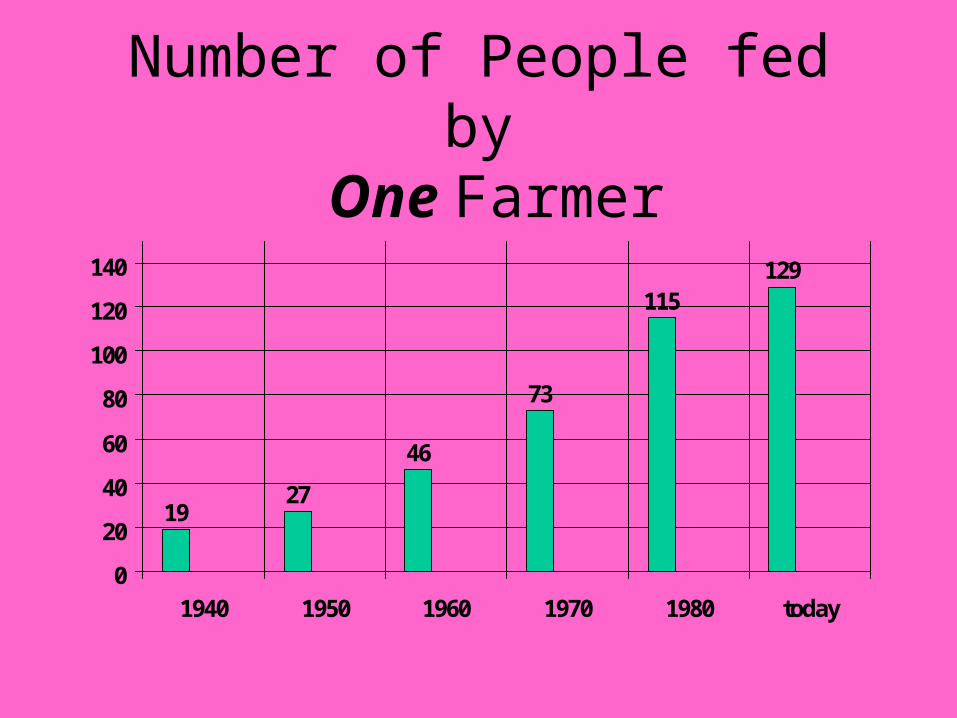
Number of People fed by One Farmer
1927
46
73
115129
0
20
40
60
80
100
120
140
1940 1950 1960 1970 1980 today

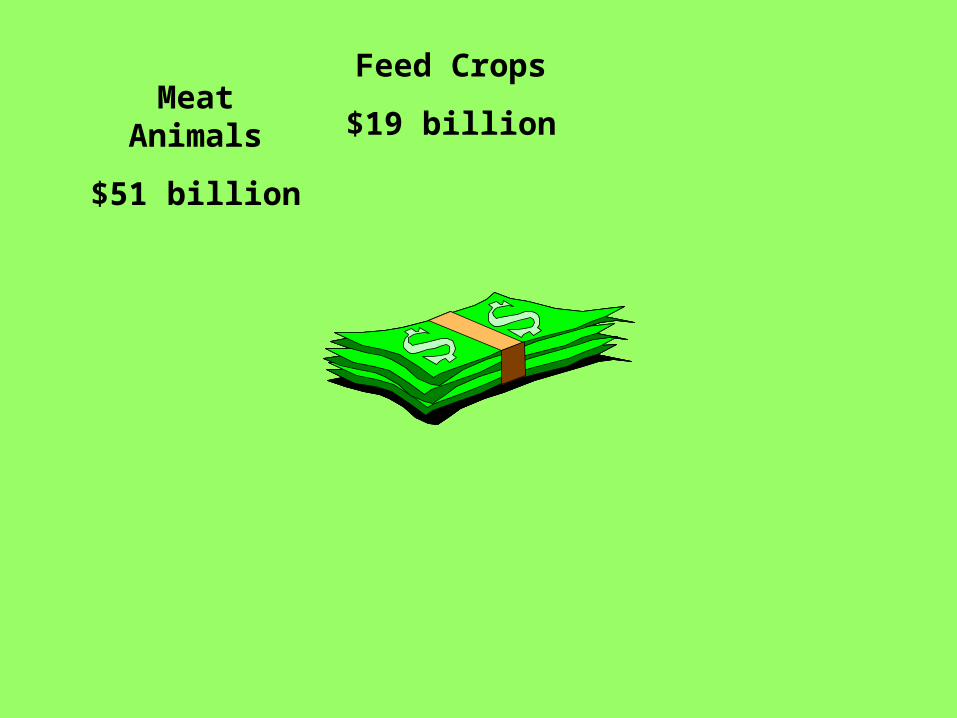
Farm Sales & Income

Meat Animals
$51 billion
Meat Animals
$51 billion
Feed Crops
$19 billion

Meat Animals
$51 billion
Feed Crops
$19 billionDairy
Products
$19 billion

Meat Animals
$51 billion
Feed Crops
$19 billionDairy
Products
$19 billion
Poultry & Eggs
$17 billion

Meat Animals
$51 billion
Feed Crops
$19 billionDairy
Products
$19 billion
Poultry & Eggs
$17 billion
Oil bearing crops
$13 billion

Meat Animals
$51 billion
Feed Crops
$19 billionDairy
Products
$19 billion
Poultry & Eggs
$17 billion
Oil bearing crops
$13 billionVegetables &
Melons
$12 billion

Meat Animals
$51 billion
Feed Crops
$19 billionDairy
Products
$19 billion
Poultry & Eggs
$17 billion
Oil bearing crops
$13 billionVegetables &
Melons
$12 billion
Cotton
$5 billion

Meat Animals
$51 billion
Feed Crops
$19 billionDairy
Products
$19 billion
Poultry & Eggs
$17 billion
Oil bearing crops
$13 billionVegetables &
Melons
$12 billion
Cotton
$5 billion
Tobacco
$3 billion

Top U.S. Farm Exports

Top U.S. Farm Exports
Wheat - $4.7 billion

Top U.S. Farm Exports
Tobacco –
$1.3 billion

Top U.S. Farm Exports
Corn - $4.2 billion

Top U.S. Farm Exports
Hides & Skins - $1.3 billion

Top U.S. Farm Exports
Vegetables - #3.3 billion

Top U.S. Farm Exports
Soybeans - $4.6 billion

Top U.S. Farm Exports
Fruit & Nuts - $4.0 billion

Top U.S. Farm Exports
Meat & Poultry - $4.4 Billion

Farming is more than just food..Some non-food products made from farm commodities
Corn

Farming is more than just food..Some non-food products made from farm commodities
Corn• Plastic

Farming is more than just food..Some non-food products made from farm commodities
Corn• Plastic
• Cooking Oil
Farming is more than just food..Some non-food products made from farm commodities
Corn• Plastic
• Cooking Oil
• Diapers

Farming is more than just food..Some non-food products made from farm commodities
Corn• Plastic
• Cooking Oil
• Diapers
• Packing Material

Farming is more than just food..Some non-food products made from farm commodities
Soybeans
Farming is more than just food..Some non-food products made from farm commodities
Soybeans• Ink

Farming is more than just food..Some non-food products made from farm commodities
Soybeans• Ink
• Paint

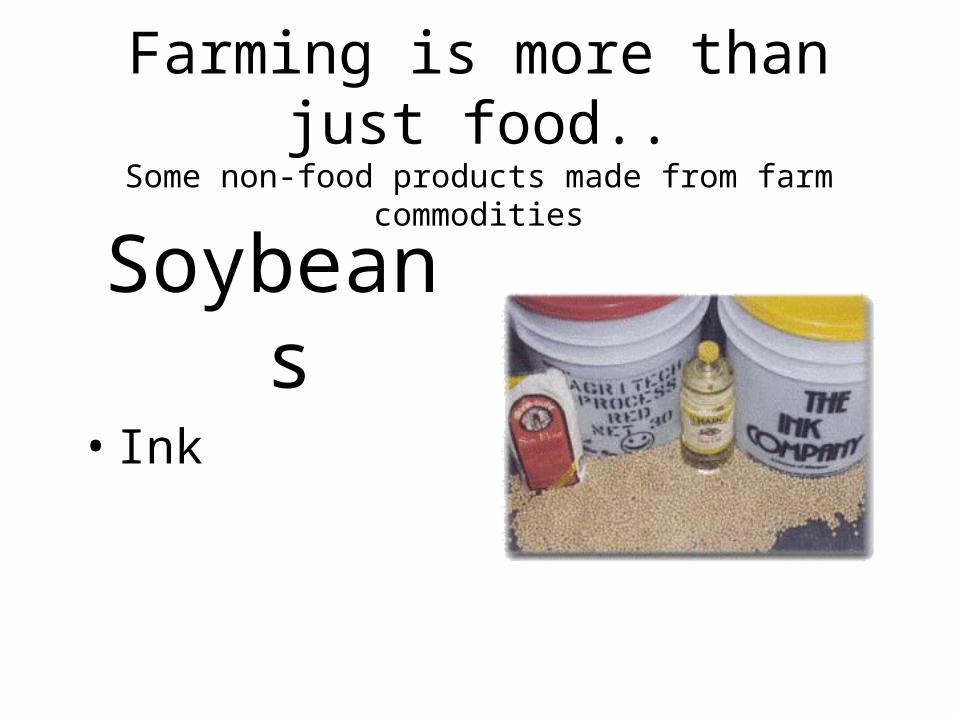
Farming is more than just food..Some non-food products made from farm commodities
Soybeans• Ink
• Paint
• feed

What’s On America’s Dinner Table?Annual Per Capita Consumption of Major Food Commodities
• Red Meat – 112 pounds

What’s On America’s Dinner Table?Annual Per Capita Consumption of Major Food Commodities
• Red Meat – 112 pounds
• Fresh vegetables – 113 pounds

What’s On America’s Dinner Table?Annual Per Capita Consumption of Major Food Commodities
• Red Meat – 112 pounds
• Fresh vegetables – 113 pounds
• Fresh fruits – 124 pounds

What’s On America’s Dinner Table?Annual Per Capita Consumption of Major Food Commodities
• Red Meat – 112 pounds
• Fresh vegetables – 113 pounds
• Fresh fruits – 124 pounds
• Cheese – 26 pounds
What’s On America’s Dinner Table?Annual Per Capita Consumption of Major Food Commodities
• Red Meat – 112 pounds
• Fresh vegetables – 113 pounds
• Fresh fruits – 124 pounds
• Cheese – 26 pounds• 234 eggs

What’s On America’s Dinner Table?Annual Per Capita Consumption of Major Food Commodities
• Beverage milk – 214 pounds

What’s On America’s Dinner Table?Annual Per Capita Consumption of Major Food Commodities
• Beverage milk – 214 pounds
• Rice – 18 pounds

What’s On America’s Dinner Table?Annual Per Capita Consumption of Major Food Commodities
• Beverage milk – 214 pounds
• Rice – 18 pounds• Fats & oils – 65
pounds

What’s On America’s Dinner Table?Annual Per Capita Consumption of Major Food Commodities
• Beverage milk – 214 pounds
• Rice – 18 pounds• Fats & oils – 65
pounds• Flour & cereal – 189
pounds