wind pressure and velocity around stepped unsymmetrical plan shape tall building using cfd...
TRANSCRIPT

ASIAN JOURNAL OF CIVIL ENGINEERING (BHRC) VOL. 17, NO. 8(2016)
PAGES 1055-1075
WIND PRESSURE AND VELOCITY AROUND STEPPED
UNSYMMETRICAL PLAN SHAPE TALL BUILDING USING CFD
SIMULATION– A CASE STUDY
K. Roy1 and A. Kumar Bairagi2 1Department of Civil Engineering, Techno India University, Saltlake, Kolkata-700091, India 2Civil Engineering, Kolkata Metropolitan Water and Sanitation Authority, Kolkata- 700 006,
West Bengal, India
Received: 9 March 2016; Accepted: 20 May 2016
ABSTRACT
This paper presents the study on wind pressure, velocity and force coefficient analysis done
in ANSYS software using CFD simulation (k-ε model) for stepped unsymmetrical plan
shape tall building for a wind incidence angle ranging from 0˚ to 360˚ with an interval of 45˚
in the ratio of 1:300. The study aims at establishing the similarity between the codes like IS
875-(PART 3)(1987), AS/NZS: 1170.2 (2011), ASCE: 7-02 (2002), and the experimental
rectangular model. The flow patterns around the building are considered for different heights
and for different wind angles which help to understand the difference in pressure variation
for designing purpose of the building.
Keywords: Computational fluid dynamics (CFD); stepped shape; wind angle; pressure
coefficient; force coefficient; velocity profile.
1. INTRODUCTION
As we build higher and longer structures, we must reckon with the forces of wind that affect
their stability and endurance. In the field of structural engineering it includes strong winds,
which may cause discomfort, as well as extreme winds, such as in a tornado, hurricane or
heavy storm, which may cause widespread destruction. In wind engineering we analyze
different structures with the help of wind tunnel and computational fluid dynamics (CFD)
modelling using various codes available for the analysis of pressure coefficients like New
Zealand code for wind engineering AS/NZS:1170.2 (2011) [1], Indian codes for wind
engineering IS 875 (Part 3)-1987 [2], ASCE:7-10 (2002) [3], BSCP 3: 1973 [4], NZS 4203-
1976 [5] Code of practice for general structural design loading for buildings. Amin and
E-mail address of the corresponding author: [email protected] (A. Kumar Bairagi)

K. Roy and A. Kumar Bairagi
1056
Ahuja [6] investigated the effects of wind forces and responses on rectangular tall building
by considering a wind tunnel tests. The experimental flow was simulated similar to exposure
category-II of Indian wind load code IS: 875 (part-3). Chakraborty et al. [7] studied the
effects of wind load on irregular plan shaped tall building with the help of experimental
studies in wind tunnel on a ‘+’ shaped tall building tall building. Kim et al. [8] investigated
the effects of wind pressure on tall tapered building with 4 types of models which have
various tapering ratios. Kwon et al. [9] served as an important first step in establishing an
on-line experimental database for use in the preliminary design of tall buildings subjected to
wind loads which was achieved by using a combination of several web-based programming
tools and popular software. Lin et al. [10] investigated the effects of local wind forces on tall
buildings with nine models of different rectangular cross sections in wind tunnel system in
terms of mean and RMS force coefficients, power spectral density, and span wise correlation
and coherence with the open terrain considerations. Mahajan et al. [11] investigated the
calculation of wind load is necessary for design of tall buildings, usually wind load is
calculated with the help of wind codes or wind tunnel testing. Mukherjee et al. [12]
researched about the wind pressure on different faces of ‘Y’ plan shaped building in
boundary layer wind tunnel for flow category of terrain II condition at mean wind speed of
10m/s. Shiva et al. [13] studied the variation of base shear (Fx) in the direction of wind on
five models as a function of wind incidence angle. Singla et al. [14] studied the behaviour of
R.C.C. tall buildings having different shapes of Square, Hexagonal and Octagonal, having
equal plan area and equal stiffness of the columns subjected to wind load has been analysed.
Zhou et al. [15] studied the action of wind, tall buildings which oscillate in across wind, and
torsional directions. Nine building cross sections were tested on an ultra-sensitive force
balance. All these work have helped for carrying out the analysis of stepped shape plan tall
building with the specified wind velocity and terrain condition and recording the values for
different wind angles. In spite of all these complex shape building existing nowadays a few
work have been done for the study of wind analysis on these structures which drives interest
for wind analysis on stepped unsymmetrical tall shape plan building.
2. NUMERICAL ANALYSIS k-ε model focuses on the mechanisms that affect the turbulent kinetic energy. k-ε equations
contain many unmeasurable and unknown terms. Thus minimizing unknowns and presenting
a set of equations which can be applied to a large number of turbulent applications.
For turbulent kinetic energy
𝜕(𝜌𝑘 )
𝜕𝑡+
𝜕(𝜌𝑘𝑢 𝑖)
𝜕𝑥𝑖
=𝜕
𝜕𝑥𝑗
𝜇𝑡
𝜎𝑘
𝜕𝑘
𝜕𝑥𝑗 + 2𝜇𝑡𝐸𝑖𝑗𝐸𝑖𝑗 − 𝜌𝜖 (1)
For dissipation ε

WIND PRESSURE AND VELOCITY AROUND STEPPED UNSYMMETRICAL … 1057
𝜕(𝜌∈)
𝜕𝑡+
𝜕(𝜌∈𝑢𝑖)
𝜕𝑥𝑖
=𝜕
𝜕𝑥𝑗
𝜇𝑡
𝜎∈
𝜕𝜖
𝜕𝑥𝑗
+ 𝐶1∈
∈
𝑘2𝜇𝑡𝐸𝑖𝑗𝐸𝑖𝑗 − 𝐶2∈𝜌
∈2
𝑘 (2)
It also can be said like this
(Rate of change of k or ε + Transport of k or ε by convection) = (Transport of k or ε by
diffusion + Rate of production of k or ε - Rate of destruction of k or ε)
Where
ui represents velocity component in corresponding direction
Eij represents component of rate of deformation
µt represents eddy viscosity
𝜇𝑡 = 𝜌𝐶𝜇
𝑘2
∈ (3)
The equations also consist of some adjustable constant σk, σε, C1ε and C2ε. The values of
these constants have been arrived at by numerous iterations of data fitting for a wide range
of turbulent flows. These are σk = 1.00, σε= 1.30, C1ε=1.44, C2ε =1.92, Cμ= 0.09
3. DOMAIN DETAILS
The arrangement used for the study of effects of wind on unsymmetrical Step Shaped tall
building in CFD is placed inside the domain (the regions of fluid flow in CFX are called
domains). The study based on different wind angle ranging from 0° to 360° as the model is
unsymmetrical. The domain used in this experiment as recommended by Frank et al. [16]
having inlet, the lateral and the top boundary should be 5H away from the building face and
the outflow boundary should be placed at least 15H behind the building face to allow for
proper flow development where H is the building height as shown in Fig. 1.
Figure 1. Domain details with dimensions

K. Roy and A. Kumar Bairagi
1058
4. OVERVIEW OF MODEL
4.1 Isolated rectangular model details
The model used for study have the area of 500 × 250 mm2 and with a height of 600mm. So
in comparison with that the isolated model is used for study is of rectangular shape with
length 500mm breadth 250mm and height 600mm for comparison with the code IS 875 (part
3)-1987 [2] details shown in Fig. 2. Scale for the numerical model is 1:300.
Figure 2. Details dimension of rectangular plan shape isolated building
4.2 Computational model details
The prototype building considered in this study has a plan dimensions of 250mm × 500mm
and a height of 600mm with a scale of 1:300. In this study considered step shape tall
building which consists of three parts. The rectangular bottom part having Depth (D) = 500
mm, Width (W) = 250 mm and Height (H) = 200 mm. The square intermediate part of Depth
(D) = 250 mm, Width (W) = 250 mm and Height (H) = 200 mm. And the triangular upper
part having Width (W) of two sides = 250 mm and Height (H) = 200 mm. Therefore total
height of the building becomes 600 mm as shown in Figs. 3(a) and 3(b).
(a) (b)
Figure 3. Dimension details of step shaped building

WIND PRESSURE AND VELOCITY AROUND STEPPED UNSYMMETRICAL … 1059
4.3 Mesh details Mesh adaption in CFX is the process in which, once or more during a run, the mesh is
selectively refined in areas that depend on the adaption criteria specified. This means that as
the solution is calculated, the mesh can automatically be refined in locations where solution
variables are hanging most rapidly, in order to resolve the features of the flow in these
regions. The tetrahedron meshing used and inflated near the boundary to avoid the unusual
flows. The detail of meshing are shown in Fig. 4(a) for isolate rectangular plan shape
building and Fig. 4(b) for step shaped tall building.
Figure 4(a). Computational mesh details of isolated rectangular tall building
Figure 4(b). Different view for meshing details of step shaped tall building
5. BOUNDARY CONDITION
The magnitude of the inlet velocity, the direction is taken to be normal to the boundary. The
terrain category 2 considered for the study (1.5m< height of the terrain<10m).The velocity
profile of the atmospheric boundary layer in the CFD are calculated by the following power
law:
K. Roy and A. Kumar Bairagi
1060
𝑈
𝑈𝐻
= 𝑍
𝑍𝐻 𝛼
(4)
Where U is the horizontal wind speed at an elevation Z; UH is the speed at the reference
elevation ZH; which was 10 m/s; α is the parameter that varies with ground roughness which
is 0.133 for terrain category 2 and ZH is 1.0 m for this case.
6. RESULT AND DISCUSSION
6.1 Isolated rectangular building
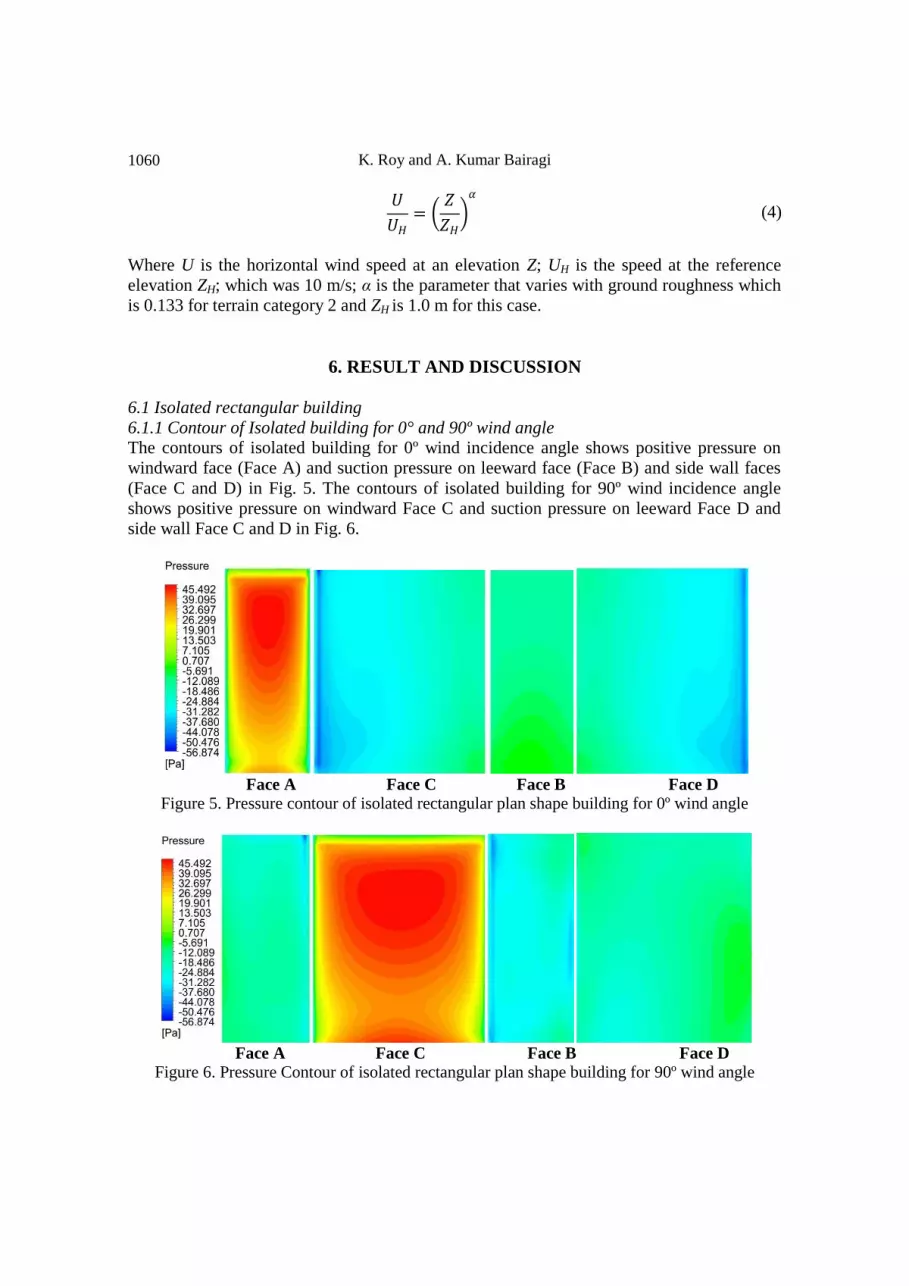
6.1.1 Contour of Isolated building for 0° and 90º wind angle The contours of isolated building for 0º wind incidence angle shows positive pressure on
windward face (Face A) and suction pressure on leeward face (Face B) and side wall faces
(Face C and D) in Fig. 5. The contours of isolated building for 90º wind incidence angle
shows positive pressure on windward Face C and suction pressure on leeward Face D and
side wall Face C and D in Fig. 6.
Face A Face C Face B Face D
Figure 5. Pressure contour of isolated rectangular plan shape building for 0º wind angle
Face A Face C Face B Face D
Figure 6. Pressure Contour of isolated rectangular plan shape building for 90º wind angle

WIND PRESSURE AND VELOCITY AROUND STEPPED UNSYMMETRICAL … 1061
6.1.2 Streamline for isolated building for 0º and 90º rectangular isolated building Streamline can be defined as a contour on a body that offers the minimum resistance to a gas
or liquid flowing around it. It’s an imaginary line in a fluid such that the tangent at any point
indicates the direction of the velocity of a particle of the fluid at that point. The streamline
shows symmetry for both 0º and 90º wind angle. The streamline is shown for rectangular
isolated building has been shown in Figs. 7 and 8.
(i)
(ii)
Figure 7. Streamline for rectangular plan shape building for 0º wind angle (i) Plan view, (ii)
Elevation view
(i)
(ii)
Figure 8. Streamline for rectangular plan shape building for 90º wind angle (i) Plan view, (ii)
Elevation view

K. Roy and A. Kumar Bairagi
1062
6.1.3 Velocity profile for isolated rectangular plan shape tall building The experiment is carrying out at terrain category 2. So according to the terrain condition the
velocity of wind is low due to effect of obstruction at the ground level of building and as the
obstructions decrease at higher altitude of building, so the wind velocity increases. This
condition satisfy the CFD simulation of the experimental rectangular plan shape tall
building. The velocity profile graph is shown in Fig. 9. The graph showing the velocity
profile at the inlet of the experimental rectangular tall shape plan building.
Figure 9. Velocity profile for rectangular plan shape tall building
6.1.4 Comparative study for isolated rectangular building The model taken for study is an isolated rectangle having height (h) 600mm, Length (l)
500mm and width (w) 250mm. The aspect ratio h/w = (600/250) = 2.4 and l/w = (500/250)
= 2. After comparing with the code IS 875 (Part-3) 1987 external pressure coefficients (Cpe)
for walls of rectangular clad buildings is shown in Table 1. After comparing the value of the
analytical model for 0º wind angle windward side (0.74) is found in accordance with
AS/NZS:1170.2 (2011) [1], IS 875 (part 3) 1987 [2], ASCE:7-10 (2002) [3] and where the
value comes to (0.80) for all the three codes. For 0º wind angle leeward value (-0.23)
matches with AS/NZS: 1170.2 (2011) [1] (-0.30) and ASCE: 7-10 (2002) [3] (-0.30) and for
side face value (-0.61) matches with AS/NZS: 1170.2 (2011) [1] (-0.65) and ASCE:7-10
(2002) [3] (-0.70).
For 90º wind angle windward side the experimental results come out to be 0.75 which is
in accordance with the code AS/NZS:1170.2 (2011) [1] which comes out to be (0.80) and
ASCE:7-10 (2002) [3] that comes out to be (0.80).
0.0
0.5
1.0
1.5
2.0
2.5
3.0
3.5
4.0
0 10 20
Z (
m)
Velocity (m/s)
velocity
Model height
= 0.6m
Domain height = 3.6m

WIND PRESSURE AND VELOCITY AROUND STEPPED UNSYMMETRICAL … 1063
Table 1: Comparative study between analytical results and codal provisions
7. STEP SHAPED TALL BUILDING
7.1 Contour of step shaped building for 0º and 90º wind angle External pressure coefficient (Cpe) for windward face (Face A) for 0 ° wind angle are
gradually increasing from lower to higher altitude whereas for 90º wind angle suction
pressure develops for side wall (Face A) with slight positive pressure at the top. For 0º wind
angle leeward side (Face B) a slight positive pressure develops along with suction pressure
but 90º wind angle side face (Face B) develops full suction pressure. Pressure contour for 0º
for side wall (Face C) shows suction pressure whereas for 90º windward side (Face C)
represents positive pressure with maximum Cpe at the top and less positive pressure at the
bottom due to friction with ground. Similarly for other faces for both 0º and 90º results in
suction pressure. The details shown in Table 2.
Table 2: Pressure contours for different faces of step shaped tall building
Face
Name Pressure Contours for 0º wind angle Pressure Contours for 90º wind angle
FACE A
Face
Analytical result
by CFD
simulation
IS 875 (part 3):
1987
ASCE:7-10
(2002)
AS/NZS:1170.2
(2011)
0º 90º 0º 90º 0º 90º 0º 90º
Windward 0.74 0.75 0.80 0.70 0.80 0.80 0.80 0.80
Leeward -0.23 -0.42 -0.10 -0.40 -0.30 -0.50 -0.30 -0.50
Side face -0.61 -0.87 -0.50 -0.70 -0.70 -0.70 -0.65 -0.65

K. Roy and A. Kumar Bairagi
1064
FACE B
FACE C
FACE D
FACE F
FACE H
7.2 Streamline for step shaped tall building for 0º and 90º wind angle The rectangle section is cut at a height of H/3, the square section is cut at a height of 3H/2,
and the triangle section is cut at a height of H for taking the streamline for both 0º and 90º
wind incidence angle. The flow pattern is symmetrical for 0º wind angle with two symmetrical
vortices in the leeward region. Velocity around the edges has increased due to separation of

WIND PRESSURE AND VELOCITY AROUND STEPPED UNSYMMETRICAL … 1065
flow. The unsymmetrical pattern of flow after formation the vortices indicate the turbulent
nature of flow. The streamline is shown for step shaped building for 0° and 90° has been
shown in Table 3.
Table 3: Streamline details for step shaped tall building for 0º and 90º wind angle
At level For 0º wind angle For 90º wind angle
At H/3
level
At 3H/2
level
At H
level
Elevation
7.3 Cpe of different faces for different angles
Pressure coefficient is defined as the pressure at any point as obtained from the CFD
simulation divided by the design wind pressure. This is given by the formula
K. Roy and A. Kumar Bairagi
1066
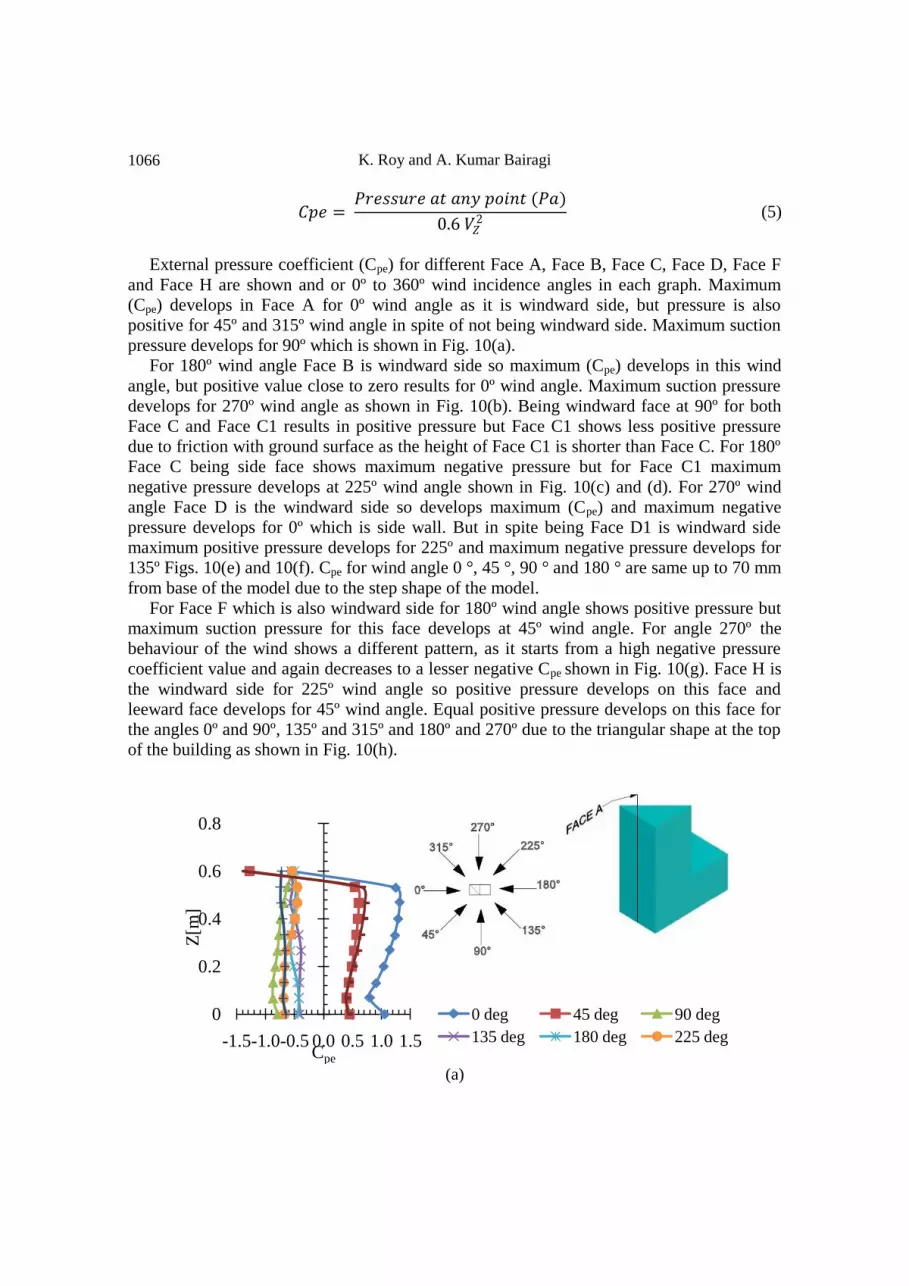
𝐶𝑝𝑒 = 𝑃𝑟𝑒𝑠𝑠𝑢𝑟𝑒 𝑎𝑡 𝑎𝑛𝑦 𝑝𝑜𝑖𝑛𝑡 (𝑃𝑎)
0.6 𝑉𝑍2 (5)
External pressure coefficient (Cpe) for different Face A, Face B, Face C, Face D, Face F
and Face H are shown and or 0º to 360º wind incidence angles in each graph. Maximum
(Cpe) develops in Face A for 0º wind angle as it is windward side, but pressure is also
positive for 45º and 315º wind angle in spite of not being windward side. Maximum suction
pressure develops for 90º which is shown in Fig. 10(a).
For 180º wind angle Face B is windward side so maximum (Cpe) develops in this wind
angle, but positive value close to zero results for 0º wind angle. Maximum suction pressure
develops for 270º wind angle as shown in Fig. 10(b). Being windward face at 90º for both
Face C and Face C1 results in positive pressure but Face C1 shows less positive pressure
due to friction with ground surface as the height of Face C1 is shorter than Face C. For 180º
Face C being side face shows maximum negative pressure but for Face C1 maximum
negative pressure develops at 225º wind angle shown in Fig. 10(c) and (d). For 270º wind
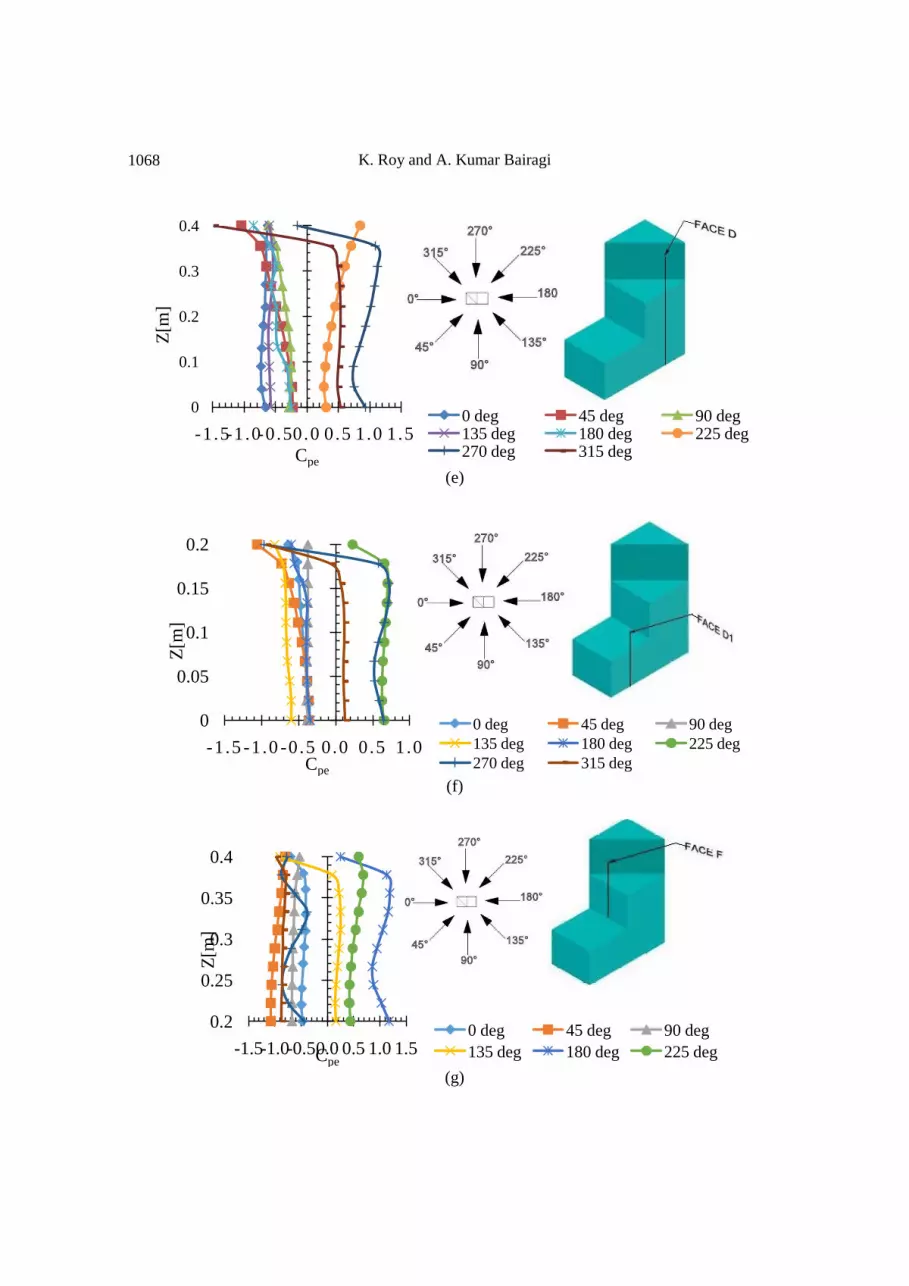
angle Face D is the windward side so develops maximum (Cpe) and maximum negative
pressure develops for 0º which is side wall. But in spite being Face D1 is windward side
maximum positive pressure develops for 225º and maximum negative pressure develops for
135º Figs. 10(e) and 10(f). Cpe for wind angle 0 °, 45 °, 90 ° and 180 ° are same up to 70 mm
from base of the model due to the step shape of the model.
For Face F which is also windward side for 180º wind angle shows positive pressure but
maximum suction pressure for this face develops at 45º wind angle. For angle 270º the
behaviour of the wind shows a different pattern, as it starts from a high negative pressure
coefficient value and again decreases to a lesser negative Cpe shown in Fig. 10(g). Face H is
the windward side for 225º wind angle so positive pressure develops on this face and
leeward face develops for 45º wind angle. Equal positive pressure develops on this face for
the angles 0º and 90º, 135º and 315º and 180º and 270º due to the triangular shape at the top
of the building as shown in Fig. 10(h).
(a)
0
0.2
0.4
0.6
0.8
-1.5-1.0-0.5 0.0 0.5 1.0 1.5
Z[m
]
Cpe
0 deg 45 deg 90 deg
135 deg 180 deg 225 deg

WIND PRESSURE AND VELOCITY AROUND STEPPED UNSYMMETRICAL … 1067
(b)
(c)
(d)
0
0.05
0.1
0.15
0.2
0.25
-1.0 -0.5 0.0 0.5 1.0
Z[m
]
Cpe
0 deg 45 deg 90 deg 135 deg
180 deg 225 deg 270 deg 315 deg
0
0.1
0.2
0.3
0.4
0.5
0.6
-1.5-1.0-0.50.0 0.5 1.0 1.5
Z[m
]
Cpe
0 deg 45 deg 90 deg 135 deg
180 deg 225 deg 270 deg 315 deg
0
0.05
0.1
0.15
0.2
-1.0-0.5 0.0 0.5 1.0
Z[m
]
Cpe
0 deg 45 deg 90 deg135 deg 180 deg 225 deg
K. Roy and A. Kumar Bairagi
1068
(e)
(f)
(g)
0
0.1
0.2
0.3
0.4
-1 .5-1.0-0.50.0 0.5 1.0 1.5
Z[m
]
Cpe
0 deg 45 deg 90 deg135 deg 180 deg 225 deg270 deg 315 deg
0
0.05
0.1
0.15
0.2
-1.5 -1.0 -0.5 0.0 0.5 1.0
Z[m
]
Cpe
0 deg 45 deg 90 deg
135 deg 180 deg 225 deg
270 deg 315 deg
0.2
0.25
0.3
0.35
0.4
-1.5-1.0-0.50.0 0.5 1.0 1.5
Z[m
]
Cpe
0 deg 45 deg 90 deg
135 deg 180 deg 225 deg

WIND PRESSURE AND VELOCITY AROUND STEPPED UNSYMMETRICAL … 1069
(h)
Figure 10. Cpe for different faces of step shaped tall building for different attacking wind angles.
(a) Face A, (b) Face B, (c) Face C, (d) Face C1, (e) Face D, (f) Face D1, (g) Face F, (h) Face H
7.4 Cpe around perimeter of building at different heights Horizontal lines a-b-c-d-a drawn through the H/6= 100mm for rectangular section. Line e-f-
g-h-e at H/2= 300mm for square section and Line i-j-k-i at 6H/5= 500mm for triangle
section along the perimeter of the building as shown in Fig. 11 and based upon those lines
the graphs are shown below figures describing the different pressure distributions of step
shaped building model at wind angle 0º and 90º. For Cpe at 0º wind angle at H/6 start from a
negative pressure value (-0.657) at point a and goes to a maximum positive Cpe (0.837).
Between point c and d the Cpe value comes to zero (-0.021) and then again being negative
between point d and a. For Cpe at 0º at H/2 between point e and f maximum positive Cpe
occurs at the point 1.185. For the height of 6H/5 maximum positive presure occurs at 1.301
between i and j as details shown in Fig. 12(a). It is clear that the Cpe values are gradually
incerasing from lower to higher altitude.
Figure 11. Different heights considered for Cpe along perimeter of step shaped building
0.4
0.45
0.5
0.55
0.6
-1 .5-1.0-0.50.00.51.01.5
Z[m
]
Cpe
0 deg 45 deg 90 deg135 deg 180 deg 225 deg270 deg 315 deg

K. Roy and A. Kumar Bairagi
1070
For Cpe at 90º wind angle at H/6 start from a negative Cpe value (-1.097) at point a and at
point b it goes to a further negative Cpe (-1.057) at point b. Between point b and c the Cpe
value results in negative value (0.806) and then again being negative between point c and a.
For Cpe at 0º at H/2 between point f and g positive Cpe occurs at the point 1.158 and then
again leads to suction pressure at point e (-1.086). For the height of 6H/5 maximum positive
presure occurs at 1.278 between i and j details shown in Fig. 12(b).
(a)
(b)
Figure 12. Cpe along perimeter of step shaped tall building at H/6, H/2 and 6H/5 (a) For 0º wind
angle, (b) For 90º wind angle
e f g h e
i i k j
e h
c b a
e f g
a b c d a

WIND PRESSURE AND VELOCITY AROUND STEPPED UNSYMMETRICAL … 1071
7.5 Force coefficient for step shaped tall plan building When a structure is immersed in flowing fluid like air, a force is exerted on it which depends
on the nature of flow, type of structure and is expressed in terms of non-dimensional
coefficient. This non-dimensional is termed as force coefficient.
Concept of determining force coefficients is similar to pressure coefficients. Like pressure
coefficient (Cpe) wind force coefficient is also a dimensionless coefficients. The force
components along direction of wind flow is called drag force and force components in other
normal directions are called lift force (across wind force) and transverse force (side force).
Here for the experimental step shaped plan shape model force coefficients have been
determined by the formula:
𝑃𝑍 = 0.6𝑉𝑍2 (6)
Where, Vz is the design wind velocity in m/s, which is considered as 10m/s for wind
analysis. Pz is design wind pressure in N/m2 at height z. And projected length has been taken
normal to the respective wind angles which are considered here.
Here force coefficients are discussed and plotted in two different graph along X and Y
direction as Cfx and Cfy respectively for angles 0° and 360° with an interval of 45º. In Fig.
13(a) the force coefficient along X direction is zero at 90°, maximum at 0° and minimum at
180° .But in Fig. 13(b) it is seen force coefficients are maximum at 90° and minimum at 0°
and 180° maximum negative force coefficients at 270º along Y direction.
Table 6: Force coefficient for step shaped tall plan building
Wind angle Cfx Cfy
0º 1.26 0.00
45˚ 0.58 0.58
90º -0.02 0.99
135˚ -0.72 0.67
180˚ -1.63 -0.01
225˚ -0.71 -0.64
270˚ -0.03 -1.37
315˚ 0.71 -0.70
(a)
-2.00
0.00
2.00
0˚ 90˚180˚
270˚
Cfx
Wind Angle

K. Roy and A. Kumar Bairagi
1072
(b)
Figure 13. Force coefficient for step shaped tall building (a) Cfx, (b) Cfy
7.6 Velocity profile for step shaped tall building The maximum velocity of wind depends upon the geographical condition of the area. The
experiment is carried out at terrain category 2. So according to the terrain condition the
velocity of wind is low due to effect of obstruction at the ground level of building and as the
obstructions decrease at higher altitude of building, so the wind velocity increases. This
condition satisfy the CFD simulation of the unsymmetrical step shaped plan shape tall
building.
In the Fig. 14(a) points 1 to 9 are marked at different distances from the face f the
building. Points are marked at inlet for point 1, then at a distance of 1000mm for point 2,
point 3 for at a distance of 400mm from face, point 4 is at a distance of 200mm, point 5 at
the Face A, point 6 at Face B and similarly for point 7, 8 and 9 like point 2, 3 and 4 as
mentioned above.
In Fig. 14(b) the graph shows different values for a height of H that is the building height
due to turbulence in flow at the front portion of the building and development suction
pressure at the back side of the building. After a height of 0.375H all the graph overlaps with
each other.
For the second graph the point 1 to point 5 are being shown in the Fig. 14(c) and the
graph is shown in Fig. 14(d) the values are being taken from the top of the building for each
step like for point 1 starting from top of the triangle at 600mm, poin2 and point 3 starting
from 400mm and point 4 and point 5 starting from 200mm so the graphs are not starting
from zero.
(a)
-2.00
-1.00
0.00
1.00
0˚ 45˚ 90˚ 135˚ 180˚ 225˚ 270˚ 315˚
Cfy
Wind Angle

WIND PRESSURE AND VELOCITY AROUND STEPPED UNSYMMETRICAL … 1073
(b)
(c)
(d)
Figure 14. (a) Plan view showing the different velocity measuring points from inlet to model and
model to outlet. (b) Velocity profile at the different velocity measuring points from inlet to
model and model to outlet. (c) Plan view showing the velocity measuring points at the top of the
step shaped tall shape tall building, (d) Velocity profile at the top of the step shaped tall building
0.0
0.5
1.0
1.5
2.0
2.5
3.0
3.5
4.0
0 10 20
Z (
m)
Velocity (m/s)
point 1
point 2
point 3
point 4
point 5
point 6
point 7
point 8
point 9
0.0
0.5
1.0
1.5
2.0
2.5
3.0
3.5
4.0
0 10 20
Z (
m)
Velocity m/s
point 1
point 2
point 3
point 4
point 5

K. Roy and A. Kumar Bairagi
1074
8. CONCLUSION
The experimental wind pressure measurements and analysis represented herein lead to
identification of the influence of aspect ratio and wind orientations on wind pressure
distribution on the step shaped tall plan building. Present study has showed that irregular
plan shaped buildings are subjected to different pressure distribution, as compared to regular
plan shaped buildings after distribution. Moreover with change in wind angle the negative
pressure (suction) induced may change drastically.
After comparing the value of the analytical model for 0º wind angle windward side (0.74)
is found in accordance with codes in which the value comes to (0.80) for all the three
codes. For 0º wind angle leeward value (-0.23) matches with codes taken for comparison
and for side face value (-0.61) also matches with codes taken for reference.
For 90º wind angle windward side the experimental results come out to be (0.75) which is
in accordance with the codes that comes out to be (0.80).
External pressure coefficient (Cpe) for windward face (Face A) for 0° wind angle are
gradually increasing from lower to higher altitude whereas for 90º wind angle suction
pressure develops for side wall (Face A) with slight positive pressure at the top.
For 270º wind angle Face D is the windward side so develops maximum positive pressure
coefficient (Cpe =1.12) at 0.78H and maximum negative pressure develops for 0º (Cpe =
0.59) at 0.9H which is side wall. But in spite being Face D1 is windward side maximum
positive pressure develops (Cpe = 0.72) at 0.8H for 225º and maximum negative pressure
(Cpe =0.71) develops for 135º at 0.9H. Thus Different arrangements of steps of the
building affect the wind loads acting on the tall buildings up to great extent, even if the
height of the buildings remains the same. When the shape of the building becomes step
shaped pressure variation changes drastically to high positive Cpe at 225º wind angle.
Wind pressure distribution on leeward face of experimental model shows development of
vorticity which shows high turbulence.
Force coefficients are discussed and plotted in two different graph along X and Y
direction as Cfx and Cfy respectively for angles 0° and 360° with an interval of 45º. The
force coefficient along X direction is zero at 90°, maximum at 0° and minimum at 180°.
But it is seen force coefficients are maximum at 90° and minimum at 0° and 180°
maximum negative force coefficients at 270º along Y direction.
Wind incidence angles and height ratio of buildings significantly affect the suction
pressure on sidewalls and leeward faces of the step shaped buildings.
REFERENCES
1. AS/NZS 1170.2: 2002. Structural Design Action, Part 2: Wind Actions, Australian,
New-Zealand Standard, Sydney, Wellington, 2002.
2. IS: 875 (Part 3). Indian Standard Code of Practice for Design Wind Load on Buildings
and Structures, Second Revision, New Delhi, India, 1987.
3. ASCE 7-02, Minimum Design loads for buildings and other structures, American
Society of Civil Engineers, New York, 2002.

WIND PRESSURE AND VELOCITY AROUND STEPPED UNSYMMETRICAL … 1075
4. BSCP 3: 1973 Code of basic data for design of buildings: Chapter V Loading, Part 2,
Wind loads, 1973.
5. NZS 4203-1976. Code of practice for general structural design loading for buildings.
6. Amin JA, Ahuja AK. Characteristics of wind forces and responses of rectangular tall
buildings, International Journal of Advanced Structural Engineering, (2014) 1-14.
7. Chakraborty S, Dalui SK, Ahuja AK. Wind load on irregular plan shaped tall building -
a case study, ISSN: 1226-6116, No. 1, 19(2014) 59-73.
8. Kim YM, You KP, You JY. Pressure fluctuations acting on a tapered building, The
Seventh Asia-Pacific Conference on Wind Engineering, Taipei, Taiwan, 2009.
9. Kwon D, Kijewski-Correa T, Kareem A. E-analysis/design of tall buildings subjected to
wind loads, Journal of Structural Engineering, (2008) 1139-53.
10. Lin N, Letchford Ch, Tamura Y, Liang B, Nakamura O. Characteristics of wind forces
acting on tall buildings, Journal of Wind Engineering & Science, 93(2005) 217-42.
11. Mahajan A, Sharma P, Pal Singh I. Wind effects on isolated buildings with different
sizes through CFD simulation, Journal of Mechanical and Civil Engineering, 11(2014)
67-72.
12. Mukherjee S, Chakraborty S, Dalui SK, Ahuja AK. Wind induced pressure on ‘Y’ plan
shape tall building, An International Journal of Wind and Structures, No. 5, 19(2014)
523-40.
13. Shiva Ahuja AK, Gupta PK. Wind loads on tall buildings with steps, Journal of
Academia and Industrial Research, 1(2013) 766-8.
14. Singla S, Kaur T, Kalra M, Sharma S. Behaviour of R.C.C. tall buildings having
different shapes subjected to wind load, International Conference on Advances in Civil
Engineering, (2012) pp, 156-160.
15. Zhou Y, Kijewsk T, Kareem A. Aerodynamic loads on tall buildings: interactive
database, Journal of Structural Engineering, 129(2003) 394-404.
16. Franke J, Hirsch C, Jensen A, Krüs H, Schatzmann M, Westbury P, Miles S, Wisse J.
Wright NG. Recommendations on the use of CFD in wind engineering, COST Action
C14, Impact of Wind and Storm on City Life and Built Environment, Von Karman
Institute for Fluid Dynamics, (2004) pp. 529-532.