wind around tall build.ings - aivc
TRANSCRIPT
Concise reviews of building technology
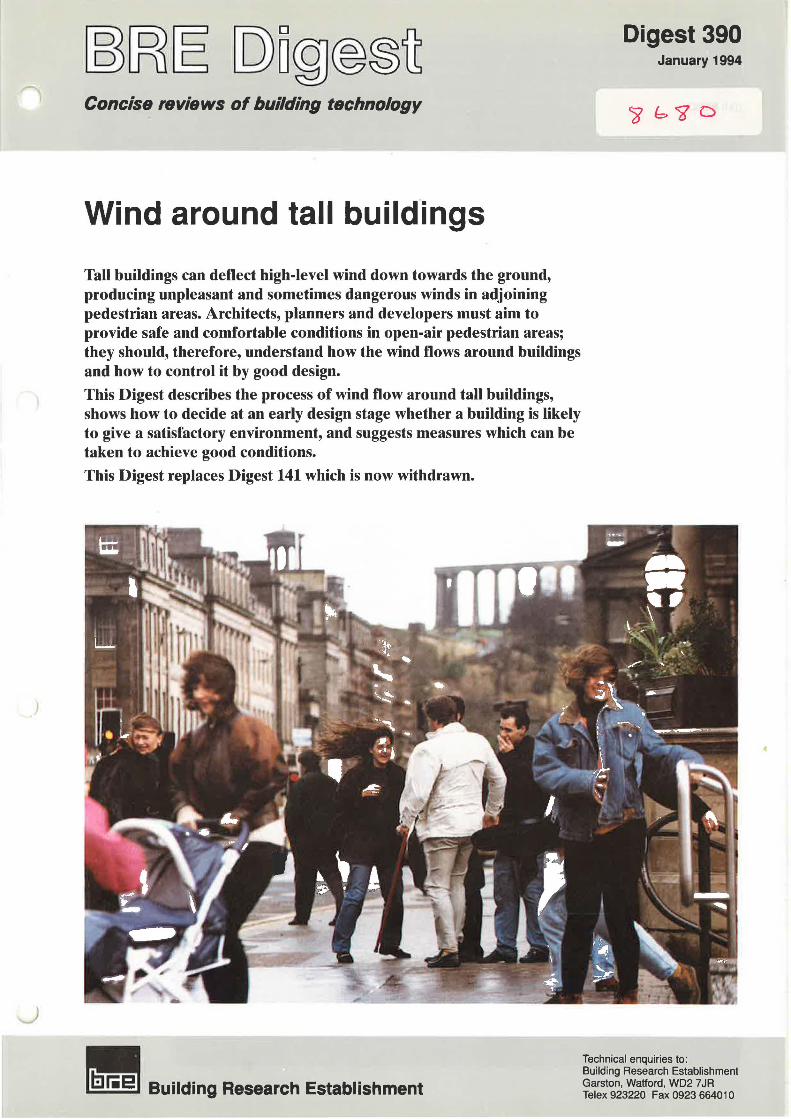
Wind around tall build.ings
Tall buildings can deflect high-level wind down towards the ground, producing unpleasant and sometimes dangerous winds in adjoining pedestrian areas. Architects, planners and developers must aim to provide safe and comfortable conditions in open-air pedestrian areas; they should, therefore, understand how the wind flows around buildings and how to control it by good design.
This Digest describes the process of wind flow around tall buildings, shows how to decide at an early design stage whether a building is likely to give a satisfactory environment, and suggests measures which can be taken to achieve good conditions.
This Digest replaces Digest 141 which is now withdrawn.
Digest 390 January 1994
Technical enquiries to: Building Research Establishment Garston, Watford, WD2 7 JR Telex 923220 Fax 0923 664010
390
In old towns, the more-or-less uniformly low buildings provide shelter from the wind but in the 1950s and 60s the urban landscape in the United Kingdom changed radically when it became dominated by wider, taller buildings. These act as scoops which catch the faster winds at high level and deflect them down into previously sheltered areas. The increased winds encountered at street level can be unpleasant or even dangerous for pedestrians. Precincts provided for shopping, markets, restaurants and play areas lose their attraction if they are exposed to strong winds.
Together with other practical and social problems, these experiences led to a reduction in the number of tall buildings being erected in the UK. We are, however, left with a legacy of tall buildings which still cause pedestrians much discomfort and inconvenience. In a few cases where unpleasant wind conditions threatened the commercial viability of shopping, roofs and screens were erected to protect pedestrians. Such cases provide a useful upper limit from which to gauge conditions on other sites.
Once these problems were realised, designers more commonly sought early advice on the wind environment that their proposals would generate; if necessary, they would then alter their design to improve conditions. Designers involved in refurbishing existing wind-swept developments have attempted to improve the poor conditions experienced over the years. In the 1990s designers, architects and engineers must respond to growing concerns about the environment and the quality of urban life, and incorporate pedestrian comfort into their designs.
In some countries, developers are obliged by law to assess the wind environment around proposed large
buildings and to comply with prescribed criteria. In the UK, an examination of wind environment is incorporated into the BRE Environmental Assessment Method for buildings- BREEAMO>. This assesses at the design stage the environmental consequences of a wide range of building characteristics; certificates are awarded for criteria that the building has satisfied. The wind environment criterion aims to eliminate danger and nuisance to passers-by resulting from wind deflections round large and tall buildings.
BRE pioneered the study of environmental winds in the 1960s and early 70s (2), using a wind tunnel to investigate the aerodynamics of buildings at model scale. Since then, model and full-scale testing has proliferated world wide; wind tunnels now operate in about 20 countries.
To assess the environmental wind effects around a proposed building development, there are three steps:
1 Determine the wind flow patterns around the buildings and measure or predict wind speeds at vulnerable locations.
2 Combine these local speeds with wind statistics from a nearby meteorological station and assess how often certain wind speeds will be exceeded.
3 Compare these data with established criteria for acceptable wind speeds, taking into account people's activities around the buildings.
If this process shows that some areas will be unacceptably windy, try methods of reducing speeds on the model and repeat these three steps until a satisfactory design is achieved. The steps are described in the following sections.
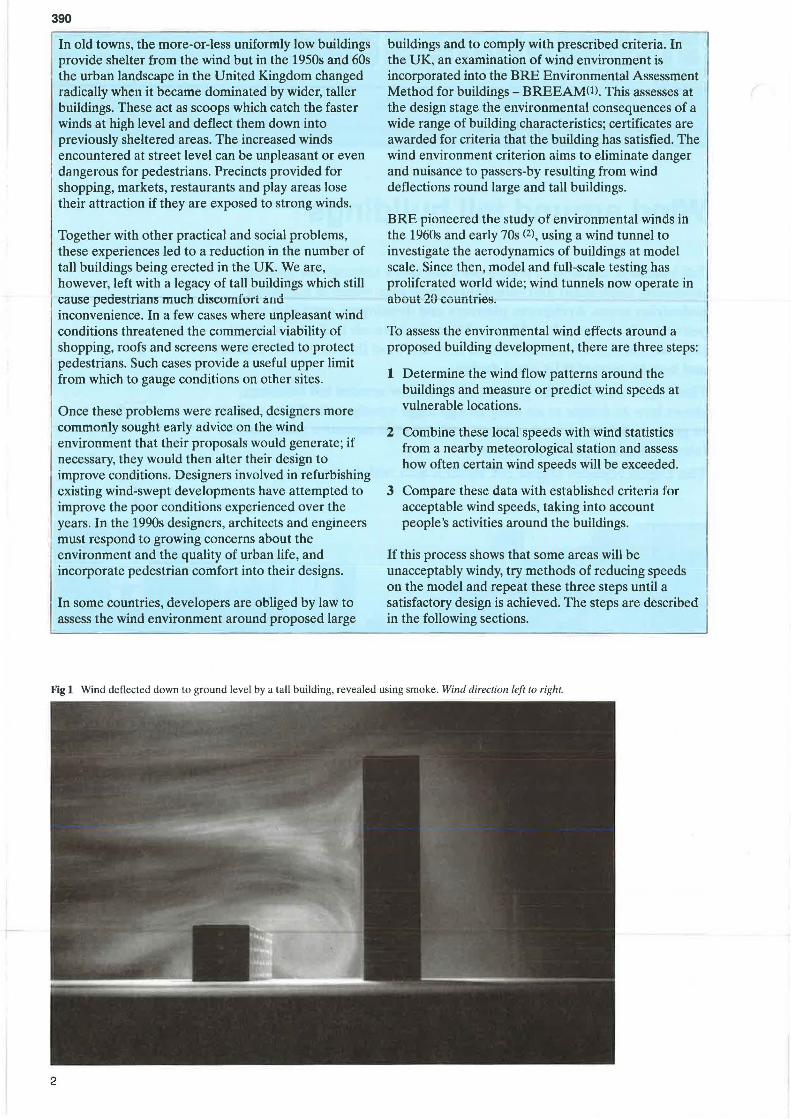
Fig 1 Wind deflected down to ground level by a tall building, revealed using smoke. Wind direction left to right.
2
390
I WIND FLOW PA'ITERNS AROUND BUILDINGS
The movement of the winrl hieh rihove the erirth's surface is controlled by large-scale weather patterns. At lower levels, the frictional drag of the surface modifies the flow to produce a turbulent boundary layer in which there is a progressive reduction in mean wind speed down to zero ·at the surface. In urban areas, buildings present a rough surface to the wind and there is a greater reduction in mean speed with height than there is in smoother rural or open country areas. At the same time, the wind becomes more turbulent, or gusty, over the rougher urban terrain. At an open site, the wind speed at pedestrian height may be about three-quarters of the speed measured at the standard 10 m height of meteorological instruments, but in a town it may be only about one-quarter to one-third of this measured speed.
When the wind blows over groups of low buildings, the main flow skims over the roof tops; ground level pedestrian areas are generally sheltered. If the wind meets a building which is considerably taller than its neighbours, much of it is deflected downwards, carrying the higher speed winds towards ground level - Fig 1. Some of this wind rolls into a horizontal vortex in the space between the tall building and any nearby low buildings to windward. The vortex stretches out sideways and wraps around the tall building in a characteristic horseshoe shape. Accelerated flow closer to the tall building face escapes round the corners of the building and forms two high speed jets of wind which stretch downwind for a considerable distance.
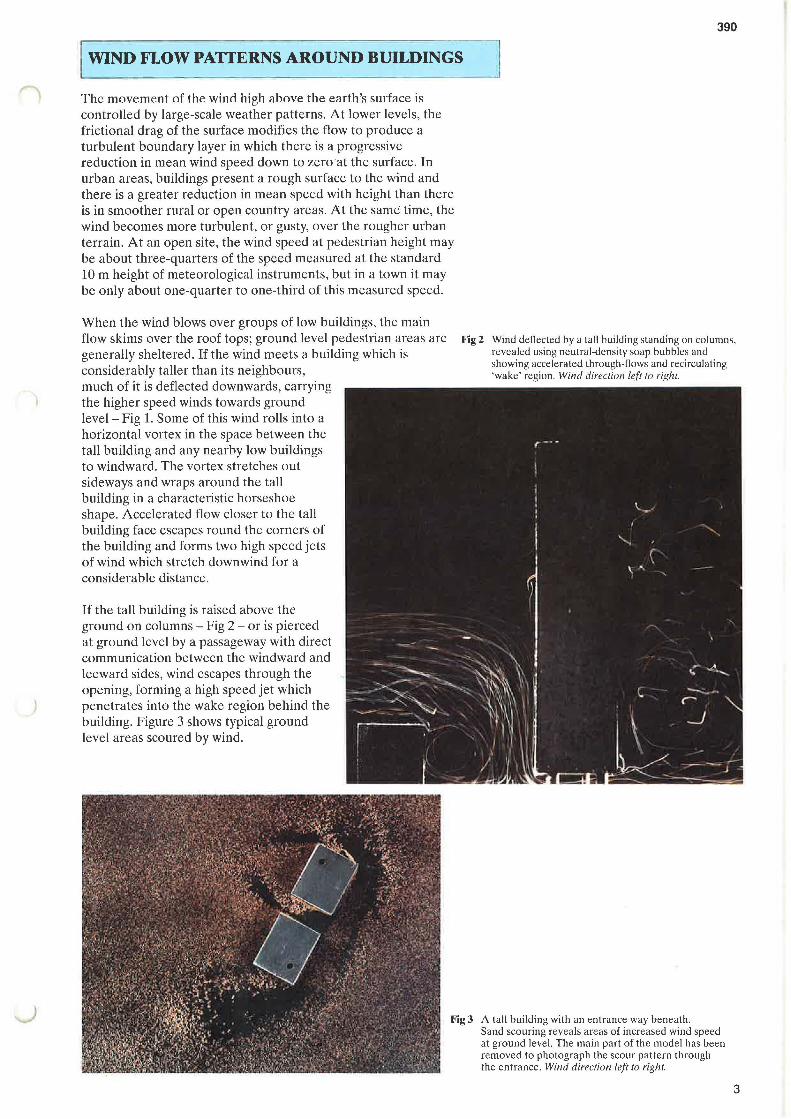
If the tall building is raised above the ground on columns - Fig 2 - or is pierced at ground level by a passageway with direct communication between the windward and leeward sides, wind escapes through the opening, forming a high speed jet which penetrates into the wake region behind the building. Figure 3 shows typical ground level areas scoured by wind.
Fig 2 Wind deflected by a tall building standing on columns, revealed using neutral-density soap bubbles and showing accelerated through-flows and recirculating 'wake' region. Wind direction left to right.
Fig 3 A tall building with an entrance way beneath. Sand scouring reveals areas of increased wind speed at ground level. The main part of the model has been removed to photograph the scour pattern through the entrance. Wind direction left to right.
3
390
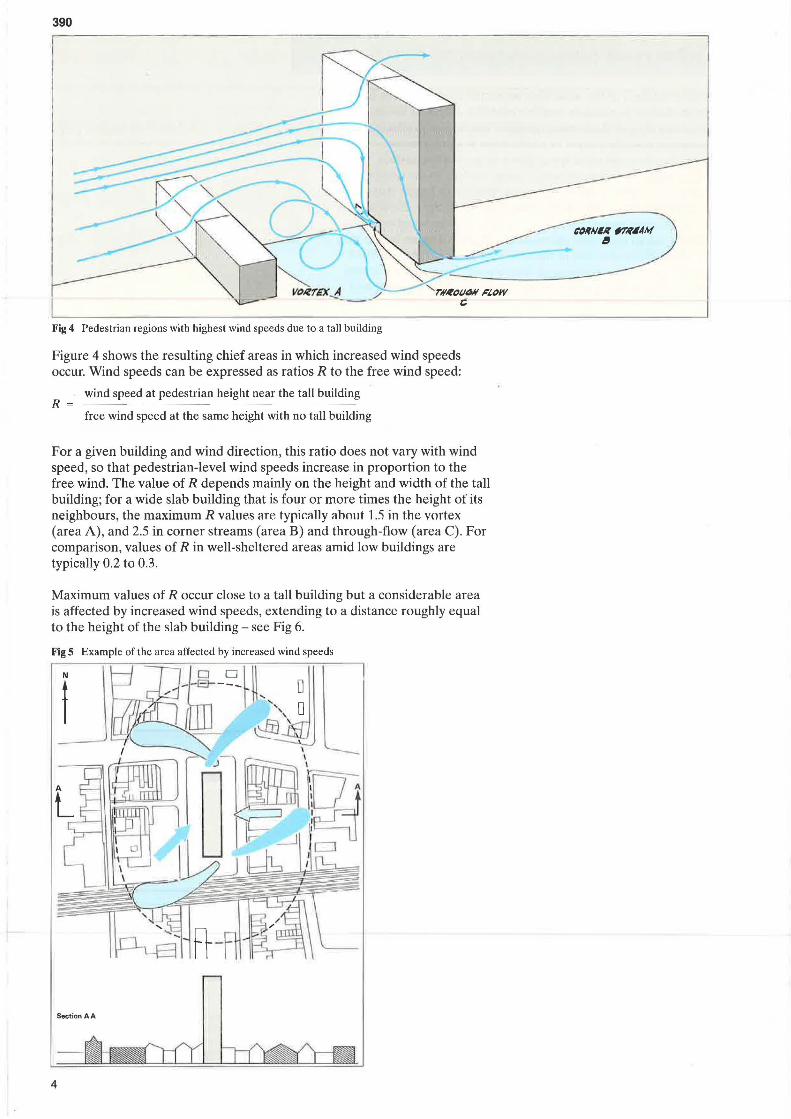
Fig 4 Pedestrian regions with highest wind speeds due to a tall building
Figure 4 shows the resulting chief areas in which increased wind speeds occur. Wind speeds can be expressed as ratios R to the free wind speed:
R = wind speed at pedestrian height near the tall building
free wind speed at the same height with no tall building
For a given building and wind direction, this ratio does not vary with wind speed, so that pedestrian-level wind speeds increase in proportion to the free wind. The value of R depends mainly on the height and width of the tall building; for a wide slab building that is four or more times the height of its neighbours, the maximum R values are typkfllly flhcmt 1.) in the vortex (area A), and 2.5 in corner streams (area B) and through-flow (area C). For comparison, values of R in well-sheltered areas amid low buildings are typically 0.2 to 0.3.
Maximum values of R occur close to a tall building but a considerable area is affected by increased wind speeds, extending to a distance roughly equal to the height of the slab building - see Fig 6.
Fig 5 Example of the area affected by increased wind speeds
Section AA
4
)
I WIND STATISTICS
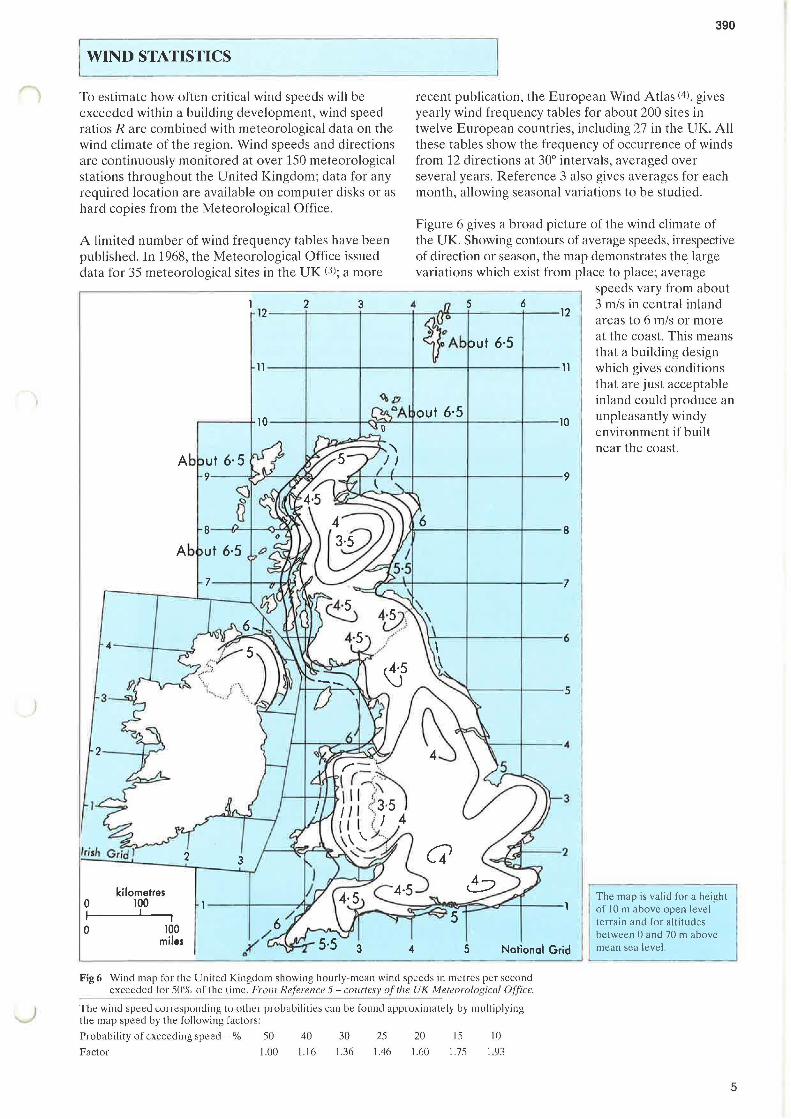
To estimate how often critical wind speeds will be exceeded within a building development, wind speed ratios R are combined with meteorological data on the wind climate of the region. Wind speeds and directions are continuously monitored at over 150 meteorological stations throughout the United Kingdom; data for any required location are available on computer disks or as hard copies from the Meteorological Office.
A limited number of wind frequency tables have been published. In 1968, the Meteorological Office issued data for 35 meteorological sites in the UK (3J; a more
0
0
kilometres 100
Ab
100 miles
390
recent publication, the European Wind Atlas (4J, gives yearly wind frequency tables for about 200 sites in twelve European countries, including 27 in the UK. All these tables show the frequency of occurrence of winds from 12 directions at 30° intervals, averaged over several years. Reference 3 also gives averages for each month, allowing seasonal variations to be studied.
Figure 6 gives a broad picture of the wind climate of the UK. Showing contours of average speeds, irrespective of direction or season, the map demonstrates the large variations which exist from place to place; average
6
3
5 Notional Grid
speeds vary from about 3 mis in central inland areas to 6 mis or more at the coast. This means that a building design which gives conditions that are just acceptable inland could produce an unpleasantly windy environment if built near the coast.
The map is valid for a height of 10 m above open level terrain and for altitudes between 0 and 70 m above mean sea level.
Fig 6 Wind map for the United Kingdom showing hourly-mean wind speeds in metres per second exceeded for 50% o[ the lime. From Reference 5 - courtesy of the UK Meteorological Office.
Tl1e wind sµeed cu11esµu11di11g lu ull1e1 (JI uuauililies call be found apµ1oximalely by multiplying the map speed by the following factors:
Probability of exceeding speed - % 50 40 30 25 20 15 10
Factor 1.00 1.16 1.36 1.46 1.60 1.75 1.93
5
390
I COMFORT AND SAFETY CRITERIA
Wind affects pedestrians' comfort and safety in two ways: The wind starts to be annoying at about 5 mis when it disturbs hair and clothing (bottom of Beaufort Scale 4). At 10 mis , it is definitely disagreeable, buffeting the body and snatching at carried objects such as umbrellas (Beaufort 6). At speeds of 15 mis, it starts to be dangerous: pedestrians are knocked off balance and risk injury by flying debris (Beaufort Scale 7).
• mechanically, by the force it exerts on the body and on inanimate objects
• thermally, by wind chill.
At low wind speeds, thermal discomfort is usually the dominant sensation, particularly in windy areas shaded from the sun. In places where people expect to be able to sit comfortably for a long time, for example in street cafes, a speed of 2 mis is about the limit for comfort.
Speeds above Beaufort 8 are definitely dangerous.
At higher speeds, the force of the wind becomes the main problem, increasing as the square of the wind SIJeeJ. Tile Beaufon Scaie is a useful measure uf wi1id force; a version is shown in Table 1. Each number covers a small range of hourly mean wind speeds; implicit in the effects are the short-term gusts, which may be 60% greater than the quoted mean speeds.
romfort levels ::ind ()Cceptahle wind speeds depend on people's activity. For example, there is a great difference between walking quickly through a windy
Table 2 suggests criteria for different activities, based upon the Beaufort Scale. The danger threshold is the same for all activities.
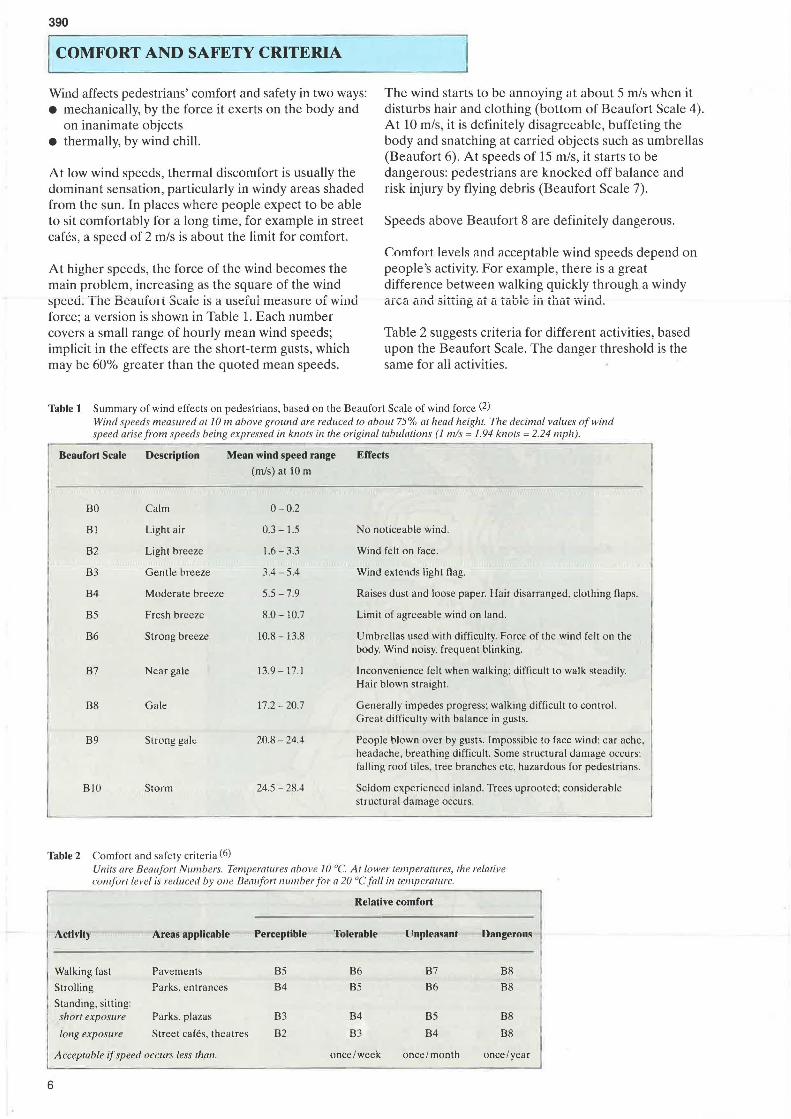
Table 1 Summary of wind effects on pedestrians, based on the Beaufort Scale of wind force (2)
Wind speeds measured at JO m above ground are reduced to about 75% at head height. The decimal values of wind speed arise from speeds being expressed in knots in the original tabulations (I mis = 1.94 kn ots= 2.24 mph).
Beaufort Scale Description
BO Calm
Bl Light air
B2 Light breeze
B3 Gentle breeze
B4 Moderate breeze
BS Fresh breeze
66 Strong breeze
B7 Near gale
B8 Gale
B9 Strong g~li;
BIO Storm
Mean wind speed range
(mis) at 10 m
0-0.2
0.3 - 1.5
1.6 - 3.3
3.4- 5.4
5.5 - 7.9
8.0- 10.7
10.8 - 13.8
13.9-17.l
17.2 - 20.7
20.8 - 24.4
24.5 - 28.4
Effects
No noticeable wind .
Wind felt on face .
Wind extends light flag .
Raises dust and loose paper. Hair disarranged, clothing flaps.
Limit of agreeable wind on land.
Umbrellas used with difficulty. Force of the wind felt on the body. Wind noisy. frequent blinking.
Inconvenience felt when walking; difficult to walk steadily. Hair blown straight.
Generally impedes progress; walking difficult to control. Great difficulty with balance in gusts.
People blown over by gusts. Impossible to face wind: car ache . headache, breathing difficult. Some structural damage occurs: falling roof tiles, tree branches etc. hazardous for pedestrians.
Seldom experienced inland. Trees uprooted: considerable structural damage occurs.
Table 2 Comfort and safety criteria (6)
6
Units are Beaufort Numbers. Temperalllres above JO 0 C. At lower tempera/llres, the relative cumf u rl level is reduced by Olle fleaufort number for a 20 °C fall in temperature.
Relative comfort
Activity Areas applicable Perceptible Tolerable llnple11H11nt ll1mgern11s
Walking fast Pavements 85 B6 B7 B8
Strolling Parks. entrances B4 B5 B6 B8
Standing, sitting: short exposure Parks. plazas 83 B4 BS 88
long exposure Street cafes. theatres 82 B3 B4 B8
Acceptable if speed occurs less rhan: once/week once/month once/year
I ASSESSMENT OF WIND ENVIRONMENT
The first stage in assessing whether conditions will be acceptable is to consider two major factors: the height of the tall building and the average wind speed of the site, shown by Fig 6.
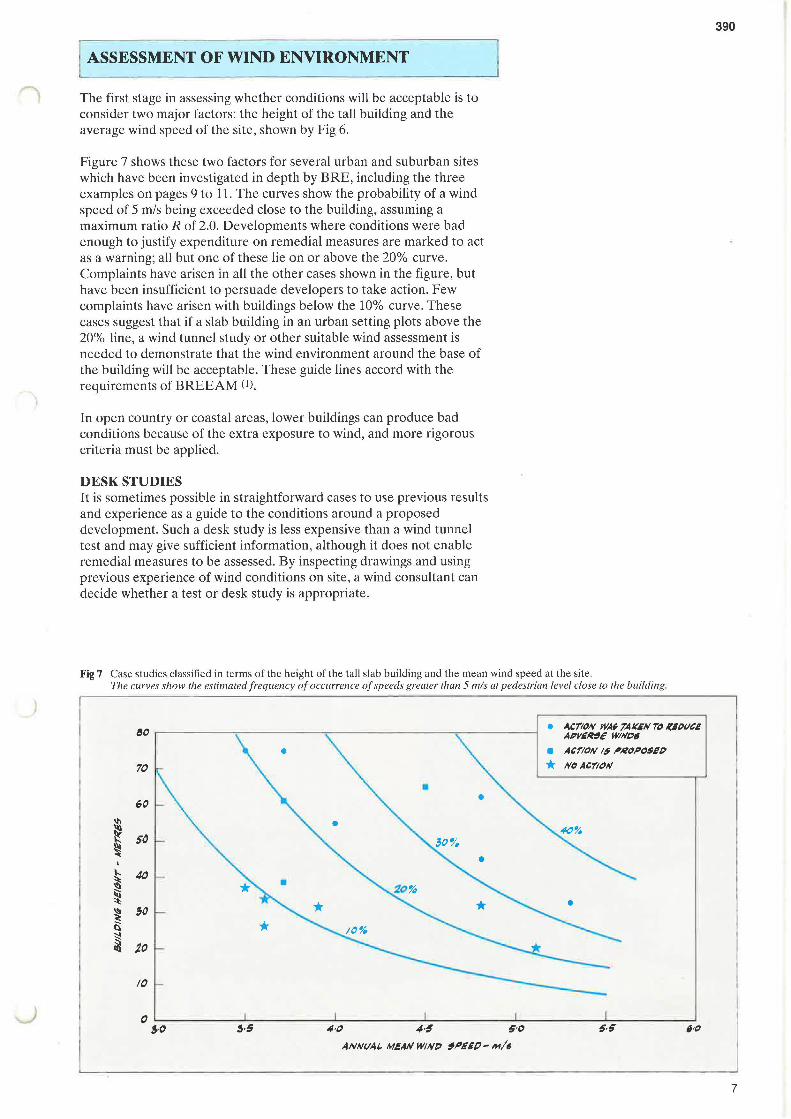
Figure 7 shows these two factors for several urban and suburban sites which have been investigated in depth by BRE, including the three examples on pages 9 to 11. The curves show the probability of a wind speed of 5 m/s being exceeded close to the building, assuming a maximum ratio R of 2.0. Developments where conditions were bad enough to justify expenditure on remedial measures are marked to act as a warning; all but one of these lie on or above the 20% curve. Complaints have arisen in all the other cases shown in the figure, but have been insufficient to persuade developers to take action. Few complaints have arisen with buildings below the 10% curve. These cases suggest that if a slab building in an urban setting plots above the 20% line, a wind tunnel study or other suitable wind assessment is needed to demonstrate that the wind environment around the base of the building will be acceptable. These guide lines accord with the requirements of BREEAM (!).
In open country or coastal areas, lower buildings can produce bad conditions because of the extra exposure to wind, and more rigorous criteria must be applied.
DESK STUDIES It is sometimes possible in straightforward cases to use previous results and experience as a guide to the conditions around a proposed development. Such a desk study is less expensive than a wind tunnel test and may give sufficient information, although it does not enable remedial measures to be assessed. By inspecting drawings and using previous experience of wind conditions on site, a wind consultant can decide whether a test or desk study is appropriate.
Fig 7 Case studies classified in terms of the height of the tall slab building and the mean wind speed at the site. The curves show the estimated frequency of occurrence of speeds greater than 5 mis at pedestrian level close to the building.
ao
70
"" ;n ~ 5~ ~ ... ~ ii'i ~
40
~ '" ~ ~ ;a 20
10
0
•
5-0 !·5 4·0 4·5 5·0
ANNI/Al. MEAN WIND ~PEEO- m/1
• '1.C7'10N WAi 7AK6N' ro 1(60U&£ AOV£Rde WINDS
• ACVON I~ lf'~OP0$8l) * NO ACrtON'
390
7
390
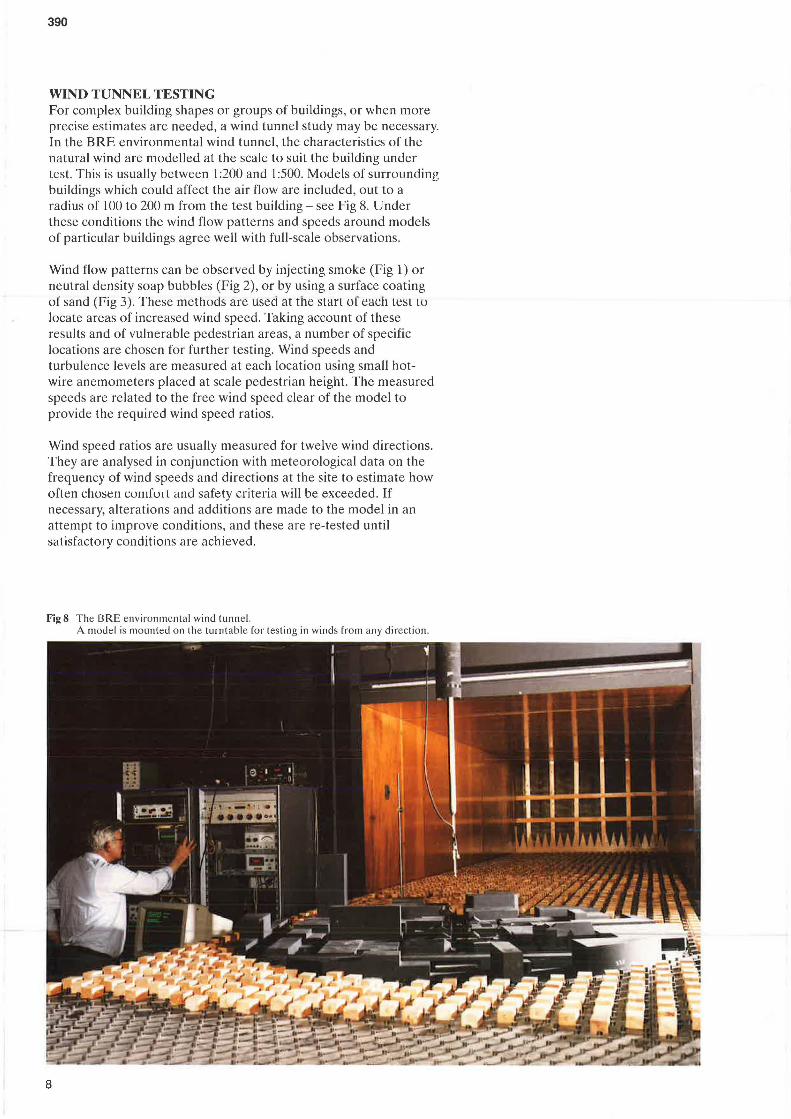
WIND TUNNEL TESTING For complex building shapes or groups of buildings, or when more precise estimates are needed, a wind tunnel study may be necessary. In the BRE environmental wind tunnel, the characteristics of the natural wind are modelled at the scale to suit the building under test. This is usually between 1:200 and 1:500. Models of surrounding buildings which could affect the air flow are included, out to a radius of 100 to 200 m from the test building - see Fig 8. Under these conditions the wind flow patterns and speeds around models of particular buildings agree well with full-scale observations.
Wind flow patterns can be observed by injecting smoke (Fig 1) or neutral density soap bubbles (Fig 2), or by using a surface coating of sand (Fig 3 ). These methods are used at the start of each Lest Lu
locate areas of increased wind speed. Taking account of these results and of vulnerable pedestrian areas, a number of specific locations are chosen for further testing. Wind speeds and turbulence levels are measured at each location using small hotwire anemometers placed at scale pedestrian height. The measured speeds are related to the free wind speed clear of the model to provide the required wind speed ratios.
Wind speed ratios are usually measured for twelve wind directions. They are analysed in conjunction with meteorological data on the frequency of wind speeds and directions at the site to estimate how often chosen rn111fo1 l and safety criteria will be exceeded. If necessary, alterations and additions are made to the model in an attempt to improve conditions, and these are re-tested until satisfactory conditions are achieved.
Fig 8 The BRE e nvironmenta l wind tunne l. A model is mounted o n the turntable for testing in winds from any direction.
8
PRACTICAL CASES In the following three examples, wind conditions near tall buildings were bad enough to justify expenditure on remedial measures (2). In each case the development was intended to provide pleasant, open spaces next to shops, markets and restaurants, but winds were such a problem that expensive roofs and screens had to be built to provide shelter.
There are many other examples in the UK of pedestrian areas scoured by winds. Some have been provided with protective roofs and screens, but often such remedial measures cannot be justified because of the cost. Recently, many of the high-rise developments of the 1950s and 60s have become due for renovation, and designers have taken the opportunity to try to improve wind conditions during renovation.
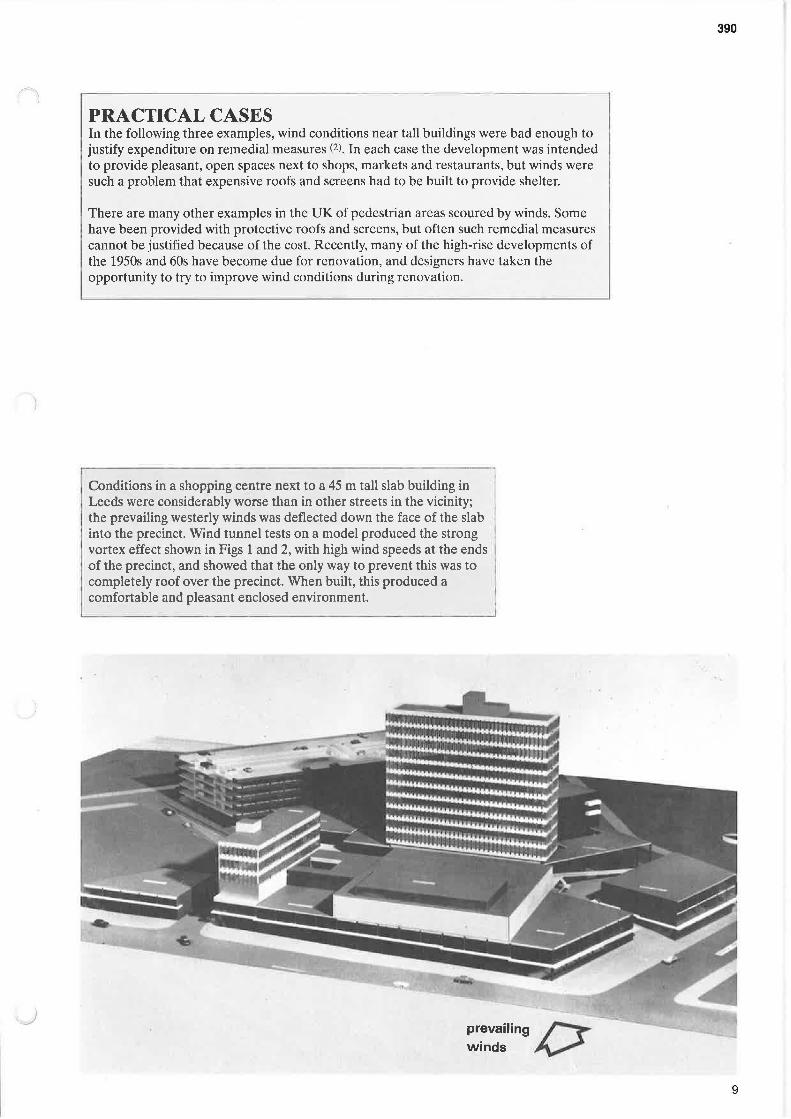
Conditions in a shopping centre next to a 45 m tall slab building in Leeds were considerably worse than in other streets in the vicinity; the prevailing westerly winds was deflected down the face of the slab into the precinct. Wind tunnel tests on a model produced the strong vortex effect shown in Figs 1 and 2, with high wind speeds at the ends of the precinct, and showed that the only way to prevent this was to completely roof over the precinct. When built, this produced a comfortable and pleasant enclosed environment.
prevailing ~ winds ~
390
9
390
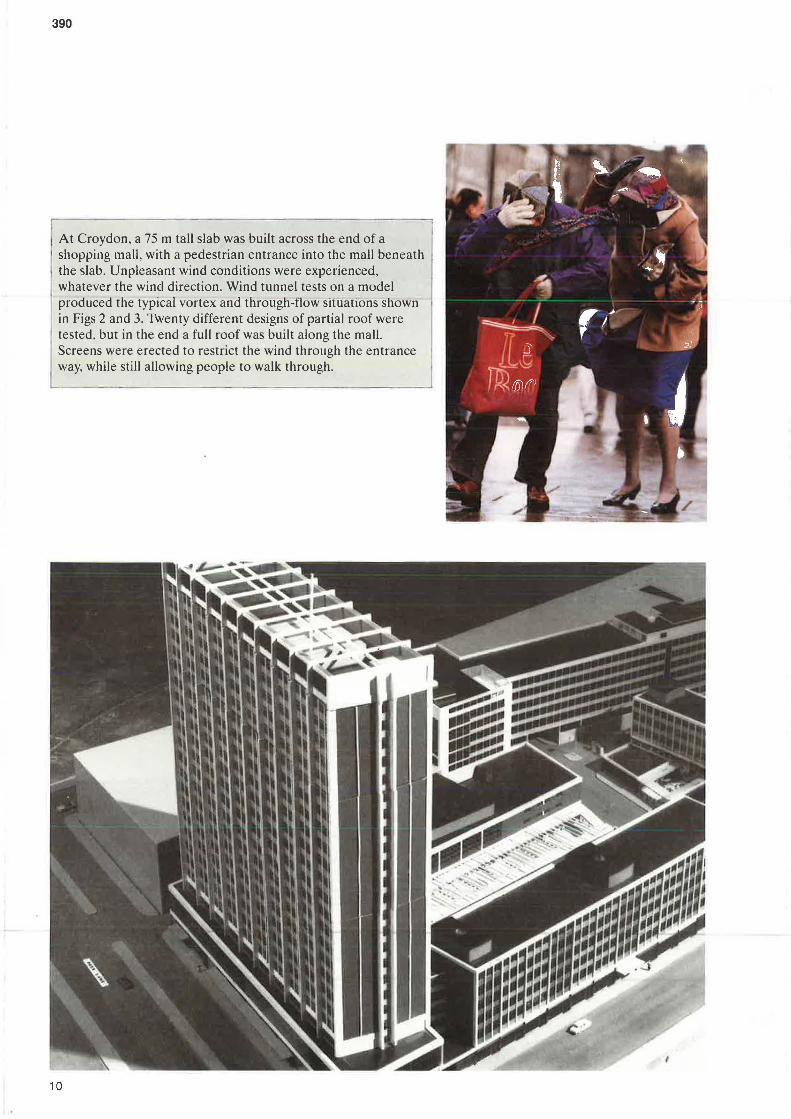
At Croydon, a 75 m tall slab was built across the end of a shopping mall, with a pedestrian entrance into the mall beneath the slab. Unpleasant wind conditions were experienced, whatever the wind direction. Wind tunnel tests on a model produced the typical vortex and through-flow situations shown in Figs 2 and 3. Twenty different designs of partial roof were tested. but in the end a full roof was built along the mall. Screens were erected to restrict the wind through the entrance way, while still allowing people to walk through.
10
390
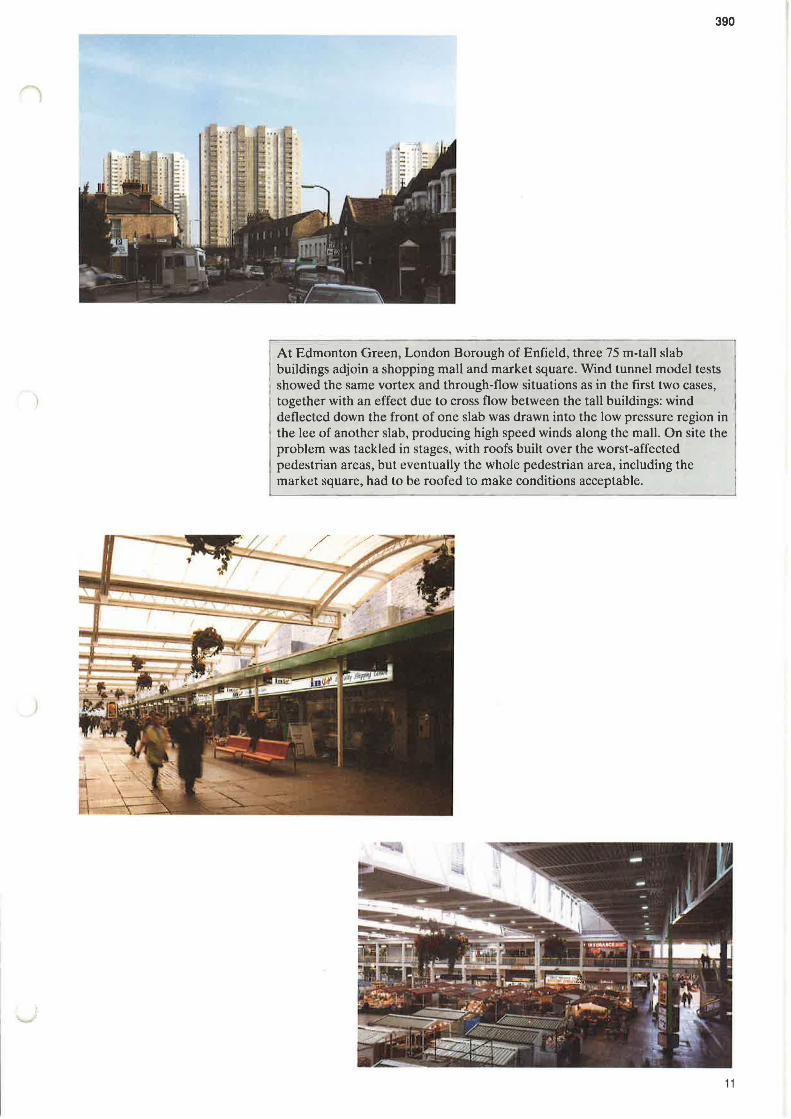
At Edmonton Green, London Borough of Enfield, three 75 m-tall slab buildings adjoin a shopping mall and market square. Wind tunnel model tests showed the same vortex and through-flow situations as in the first two cases, together with an effect due to cross flow between the tall buildings: wind deflected down the front of one slab was drawn into the low pressure region in the lee of another slab, producing high speed winds along the mall. On site the problem was tackled in stages, with roofs built over the worst-affected pedestrian areas, but eventually the whole pedestrian area, including the market square, had to be roofed to make conditions acceptable.
11
390
DESIGN RECOMMENDATIONS At the design stage, there are ways of reducing the risk of unpleasant wind conditions in pedestrian areas. Although it is impossible to prevent a tall building deflecting wind downwards, a development can often be configured so that these descending winds do not attack pedestrian areas. It must be realised, however, that the volume of wind deflected by a slab building is enormous, and that this can increase wind speeds out to a radius about equal to the building height. These recommendations can help to impede this down-flow and improve conditions at ground level.
DO • Keep tall buildings well away from sensitive
pedestrian areas, such as shops, where people should be encouraged to linger.
• Locate building entrances on the lee side and away from corners.
• Keep fume extracts away from the influence of tall buildings.
• Build extensive low-level horizontal obstructions close up to tall buildings (low buildings, a podium, car park, roof, etc) to deflect descending wind away from pedestrian areas.
• Position tall buildings so that their narrower faces are presented to the prevailing wind.
• Provide alternative sheltered routes for pedestrians on windy days.
• Chamfer or round the corners of tall buildings. This reduces the ground area affected by increased wind speeds. although it will not reduce the maximum speeds.
• Step back tall building facades to form a pyramid shape.
DON'T • Locate pedestrian access ways beneath tall
buildings.
• Position building entrances at corners of tall buildings.
• Locate pedestrian areas close to unbroken vertical walls of tall buildings.
Printed in the UK and published by the Building Research Establishment Available by subscription. Current prices from:
REMEDIAL MEASURES After completion, if a development with a tall building is found to be windy, there are few options:
• Build roofs over pedestrian areas.
• Build very large canopies around the base of the tall building.
• Erect screens in passage ways beneath tall buildings to restrict wind flow.
• Provide alternative sheltered routes for pedestrians on windy days.
REFERENCES AND FURTHER READING Building Research Establishment. BREEAM/New Offices Version 1/93 An environmental assessment for new offices. Garston, 1993.
2 Penwarden, AD and Wise, AFE. Wind environment around buildings. BRE Report, HMSO, 1975.
3 Shellard, HC. Tables of surface wind speed and direction over the United Kingdom. Meteorological Office Met 0 792. HMSO, 1968.
4 Troen, I and Peterson, EL. European Wind Atlas. Commission of the European Communities. Riso National Laboratory, Denmark, 1989.
5 Caton, PGF. Maps of hourly mean wind speed over the United Kingdom. 1965-73. Climatological Memorandum 79. Bracknell. Meteorological Office, 1976.
6 lsyumov, N and Davenport, AG. The ground level wind environment in built-up areas. Proceedings of the Fourth International Conference on wind effects on buildings and structures. Cambridge University Press, 1976. 403 - 422.
Other BRE Digests 346 The assessment of wind loads
Part I Background and method
Part 2 Classification of structures
Part 3 Wind climace in the UK
Part 4 'ICrrain and building factors and gust peak factors
Part S Assessment of wind speed over topography
Part 6 Loading coefficients for typical buildings
Part 7 Wind speeds for serviceability and fatigue assessments
Part 8 Internal pressures
350 Climate and site development Part I General climate of the UK
Part 2 Influence of microclimalc
Part 3 Improving microclimate through design
Crown copyright 1994
BRE Bookshop, Building Research Establishment, Garston, Watford, WD2 ?JR (Tel: 0923 664444). Full details of all recent issues of BRE publications are given in BRE News sent free to subscribers.
12 ISBN 0 85125 620 1
Printed in the UK for HMSO. Dd.8392706, 1/94, C100, 38938