meteorological observations in tall masts for mapping ... - essd
TRANSCRIPT

Meteorological observations in tall masts for mapping of atmospheric flow in Norwegian fjords
Birgitte R. Furevik1, Hálfdán Ágústsson2, Anette Lauen Borg1, Midjiyawa Zakari1,3, Finn Nyhammer2 and Magne Gausen4
1Norwegian Meteorological Institute, Allégaten 70, 5007 Bergen, Norway2Kjeller Vindteknikk, Norconsult AS, Tærudgata 16, 2004 Lillestrøm, Norway3Norwegian University of Science and Technology, Trondheim, Norway4Statens vegvesen, Region Midt, Norway
Correspondence to: Birgitte R. Furevik ([email protected])
Abstract. Since 2014, 11 tall meteorological masts have been erected in coastal areas of mid-Norway in order to provideobservational data for a detailed description of the wind conditions at several potential fjord crossing sites. The planned fjordcrossings are part of the Norwegian Public Roads Administration (NPRA) Coastal Highway E39-project. The meteorologicalmasts are 50 - 100 m high and located in complex terrain near the shoreline in Halsafjorden, Julsundet and Storfjorden in theMøre og Romsdal county of Norway. Observations of the three-dimensional wind vector are done at 2-4 levels in each mast,with a temporal frequency of 10 Hz. The dataset is corroborated with observed profiles of temperature at two masts, as wellas observations of precipitation, atmospheric pressure, relative humidity and dew point at one site . The first masts wereerected in 2014 and the measurement campaign will continue to at least 2024. The current paper describes the observationalsetup and observations of key atmospheric parameters are presented and put in context with observations and climatologicaldata from a nearby reference weather station. The 10-minute and 10 Hz wind data as well as other meteorologicalparameters are publicly available through Arctic Data Centre ( DOI: 10.21343/z9n1-qw63; Furevik et al., 2019).
1 Introduction
In 2014, the Norwegian Public Roads Administration (NPRA) started an evaluation of the environmental conditions, i.e.wind, atmospheric turbulence, waves and currents, pertaining to making the E39 road 'ferry-free’ between Kristiansand andTrondheim on the western coast of Norway. If realised, the project will include new crossings of eight of the largest fjords inNorway. The fjords are typically surrounded by steep mountains going up to 500 m. Fjord widths are 2-7.5 km, and waterdepths 200-1300 m. This requires a detailed understanding of the wind, wave and ocean current climate at the proposedcrossings which is achieved partly through a large atmospheric and oceanographic measurement programme.
In mid-Norway new fjord crossings are planned in Vartdalsfjorden, Sulafjorden and Halsafjorden, as well as near Julsundet.The observational campaign started here in 2014, with a considerable increase in measurement effort in October 2016. Theobservational programme will continue for at least 8 years, but may be extended to 12 years or more. The program includestall meteorological masts erected and operated by Kjeller Vindteknikk (KVT), equipped with sonic anemometers at severalevelations, observing with a temporal resolution of 10 Hz. The most recent masts are 70-100 m high while the masts erectedfirst have an elevation of ~50 m. A number of wave buoys with meteorological and oceanographic measurements have alsobeen installed. Similar measurement campaigns are carried out by the NPRA in other fjords, such as Bjørnafjorden, but thesedata are not publicly available. The fjord measurement programme of the NPRA is unique in Norway, both in terms ofmeasurement density, parameters measured and the time frame. To the authors knowledge, there has been no otherdedicated measurement campaign, providing simultaneous and detailed measurements of both the ocean and the loweratmospheric boundary layer in the complex coastal terrain of western Norway. Oceanographic and atmosphericmeasurements have typically been carried out independently and during shorter periods, related to e.g. research programmesor industry projects. Ongoing large observation programmes include the LoVE, Lofoten–Vesterålen Cabled Observatory ofthe shelf marine ecosystem (Godø et al., 2014), the Integrated Carbon Observation System (ICOS)-Norway and OceanThematic Centre (OTC) which is an international observation programme of greenhouse gasses (Steinhoff et al. 2019), and
1
1
2
3456
7
89
101112131415161718
19
202122232425
262728293031323334353637383940

the Nansen Legacy, a national research programme which includes extensive observations in the northern Barents Sea andArctic Ocean (Reigstad et al., 2019). The Norwegian Meteorological Institute (MET Norway) operates a national network ofmeteorological stations (observational data typically freely available) in the region of the E39 campaign. The NPRA and theNational Coastal Administration (NCA) operate meteorological stations in connection with infrastructure and roadsafety/operations, but wind measurements from these stations may be strongly affected by obstacles and local terrainfeatures. The Frøya meteorological mast recorded ocean wind conditions to form the basis for the NORSOK standard(Andersen and Løvseth, 1995, 2006; Standard Norge, 2017).
From a scientific standpoint, the measurement campaign provides an excellent platform to study the multi-scale variability inboundary-layer flow in complex terrain, and the variation of local flow with regard to the synoptic flow aloft, as previouslystudied by Jonassen et al. (2011) for southern Norway. The current campaign has already provided unique observations ofextreme winds and storms in complex terrain, but here the relevant topographic forcing is typically at a smaller scale thanhas been studied in many large field campaigns in and near the North Atlantic (e.g. the Norwegian IPY-Thorpex(Kristjánsson et al., 2011) and the Greenland Flow Distortion Experiment (Renfrew et al., 2008)). The boundary layer flowin this part of Norway is to a first order governed by a large scale orographic forcing on the mesoscale and synoptic flow, i.e.due to the high mountains of southern and western Norway. The boundary layer flow may decouple from the flow aloftwhile the local variability near the surface occurs on scales on the order of a few kilometres, as the flow is for exampleaccelerated along steep mountain slopes and narrow fjords, or stagnates in blocked flow in deep valleys, i.e. in terrain typicalfor the locations of the masts in the campaign. From a more pragmatic and engineering point of view, the data collection isimportant for describing the atmospheric forces, both climatic and short-term, pertaining to the technical design of largestructures in complex terrain. The data collection is unique in both the length as well as in the detail of the observed timeseries at the available sites. The series are long enough so that they can be of use in constructing a description of the climaticconditions at the sites, but they are also detailed enough to describe well single weather events of interest and capture someof the complexity in the flow structure on either side of the planned crossings. The wind and turbulence data has alreadyhighlighed that for such large structures as are planned, the spatial variability in the flow must be properly accounted for anddescribed.
The objective of the present paper is to provide documentation of the atmospheric part of the E39 dataset and the datahandling process for the mast data. The measurement programme is ongoing and the description given here is valid at thetime of publication. The paper is structured as follows. Section 2 describes the setup of the observation system, includingmast details, the data quality control and an overview of data availability. Access to the data is open, and handled through anew procedure at MET Norway, which is described in section 3. Section 4 presents observations of selected variables toillustrate available parameters and the data quality, and puts the data in context with the regional climate. A summary isgiven in section 5.
2 Setup of the observation system
As of December 2019, the observational dataset includes observations from 12 tall masts in three main regions of interest inMøre and Romsdal county in western Norway (Fig. 1). All the masts are operational except two: one has been dismantled,and other was discontinued and extended to twice the original height, becoming the 12th mast. Most masts are expected to beoperational for at least 8 years, with more details on their setup given below. The masts are located in a region characterizedwith a relatively complex orography, e.g. narrow and deep fjords, surrounded by steep and high mountains. The conditionsare more challenging in the Storfjorden region (region S in Fig. 1), where the brunt of the campaign is focussed, than in theJulsundet and Halsafjorden regions (J and H in Fig. 1). Further details on the setup and conditions at individual masts isgiven below. Long-term reference surface weather stations, operated by MET Norway, are found within approx. 20 km ofeach of the main region of interests. Two of these are located in flat terrain at airports, while the third is a located on thesmall island of Ona. The nearest upper air observations are made ~180 km to the northeast from Ona, at Ørlandet airport.
The main focus of the measurement campaign is to collect climatic data on the atmospheric and oceanic conditions at
2
41424344454647
484950515253545556575859606162636465
66676869707172
73
74757677787980818283
84

possible fjord crossings, pertaining to the dimensioning and design of long structures (suspension bridges and floatingbridges have been considered, as well as submerged tunnels). In this aspect, wind is the most important atmospheric variable.The main parameters of relevance can be split into two sets: a) mean quantities which can be described by e.g. the 10-minutemean wind, i.e. the wind speed and direction distribution, return levels of extreme winds and the vertical wind profile. b)turbulence quantities which must be described using observations with a high temporal frequency, e.g. turbulence intensities,the spectral energy density and coherent variations of the turbulence at two locations separated by short distance.Furthermore, the measurement campaign is corroborated by observations from buoys and LIDARs (not presented here), aswell long datasets with high-resolution simulations of weather with mesoscale numerical weather prediction andcomputational fluid dynamics (CFD) models (not presented here).
2.1 Masts and instrumentation
A summary of the key parameters for the masts are presented in Table 1, including geographical position, measurementperiod, base level height and measurement heights. The masts are built and operated by KVT for the NPRA. Observationsof wind are made at 2 - 4 levels in each of the masts, while additional atmospheric variables are observed at three sites.Observations are ongoing at all masts, except at Midsund which was dismantled in March 2019, and at Åkvik which becamea new station (Åkvik2) in May 2020 with a lenghened mast. The masts are guyed lattice towers (Storfjorden) and tubularmasts (Julsundet and Halsafjorden), except at Kårsteinen, Langeneset and Nautneset which are self-supporting lattice masts.Nautneset has previously been instrumented with an accelerometer to verify that the swinging motion of the self-supportingmasts has a negligible impact on the intended use of the wind measurements (Tallhaug, 2017).
The three wind components are recorded using three-axial ultrasonic anemometers (Gill WindMaster Pro) which is loggingat 20 Hz. The data is subsequently averaged to a temporal resolution of 10 Hz to reduce aliasing. The anemometers arelocated on 2 - 6 m long horizontal booms, with the boom directions approximately perpendicular to the prevailing and mostrelevant wind directions (derived a-priori from mesoscale simulations of wind). The true boom direction, as seen from themast, is presented in Table 1 (average for all levels). The lowermost sensors at the masts at Julbø, Halsaneset and Midsundare located at ~13 m above ground level and have been found to be too strongly affected by their vicinity to the tree toplevel. This is to some degree also the case for the lowermost sensor at Åkvik (17 magl). In July 2018 a software bug wasdocumented, affecting the vertical wind component of instrument produced before October 2015 (Gill Instruments, 2016).This error has been accounted for and only corrected data are made available as a part of the current dataset. 10 Hztemperature measurements were stored from some of the sonic anemometers, but are not part of the available dataset.
The 10-minute mean wind data is produced from the 10 Hz wind recordings and more than 99.95 % of the 10-minutesamples are based on a 50 % or better 10 Hz availability. A 90 % availability of 10 Hz data is found in 99 - 100 % of the 10-minute samples, depending on station. If a 99 % 10 Hz availability is required then the numbers are 96 - 99 % for the 10-minute means. The total uptime for 10-minute mean wind for all sensors and all masts is 98.9%. Instrument failures arefixed at the earliest convenience, with highest priority given to having operational sensors at the top of the masts. Anintermittent reduction in 10 Hz data availability is typically associated with errors due to precipitation and other intermittentexternal or technical disturbances. A malfunctioning instrument or logger will either lead to complete data loss or havesustained periods with a availability far below 100 % for the 10 Hz observations.
The stations Kvitneset_Temp and KvitnesetKlima are located in the same masts as Kvitneset. Kvitneset_Temp has inter-calibrated temperature sensors (PT100 from Campbell Scientific) at the same levels as the wind sensors, with a sampling rateof 0.2 Hz. KvitnesetKlima has measurements (1 Hz sampling rate) of temperature, dew point temperature, relative humidityand air pressure at 9 m above ground level (not corrected to mean sea level). Inter-calibrated temperature measurements at0.2 Hz (similar as at Kvitneset_Temp) are also done at four levels in the Trælbodneset mast, i.e. at the three levels with windsensors as well as at 3 m above ground level (here named as Trælbodneset_temp). A Geonor T-200B precipitation gauge isinstalled at Brandal (cf. Fig. 2).
3
858687888990919293
94
9596979899
100101102
103104105106107108109110111112
113114115116117118119120
121122123124125126127

Storfjorden
Storfjorden is the name of the fjord system, which is divided into Sulafjorden, Hjørundfjorden and Vartdalsfjorden inaddition to several other extensions further inland (Fig. 2). Sulafjorden is located approximately 10 km southwest fromÅlesund between the islands Hareidlandet in the west and Sula in the east. The fjord is aligned along a south-southeast north-northwest axis, and it is ~12 km long from the mainland to the island Godøy and 3-6 km wide. Hareidlandet and Sula havesteep mountains and their upper levels have an elevation of 500 – 700 m asl. In the south, Sulafjorden connects toVartdalsfjorden, a long narrow fjord, which runs perpendicular to Sulafjorden, southwest to northeast. South ofVartdalsfjorden is Ørsta municipality with Sunnmørsalpene, a high and steep mountain region reaching more than 1200masl. In the northeast, the narrow Hjørundfjorden connects to Storfjorden, running in a southeast - northwest direction.Figure 3 provides terrain profiles at all of the masts while Fig. 4 shows a photograph of Sulafjorden at the location ofKvitneset and Trælbodneset. The largest effort in the measurement campaign of the Coastal Highway E39 project in mid-Norway can be found here. An overview of the specific conditions at each mast is given below while details were presentedin Haslerud (2019) and references therein.
Sulafjorden
A precipitation station and four tall meteorological masts are located in Sulafjorden. The masts are located near both ends oftwo possible fjord crossing locations. Kvitneset and Langeneset on the western side and Trælbodneset and Kårsteinen on theeastern side.
The mast at Kvitneset is located on the headland Kvitneset on the northeast corner of Hareidlandet. The headland is a 300 mwide and 200 m long relatively flat area just below steep mountains reaching up more than 500 m over a distance of 1 km inthe southwest. Figure 3 shows the terrain profile along a section through the locations at Kvitneset and Trælbodneset, andserves to highlight the steepness and height of the surrounding mountains. The masts are located at 6 m asl, in a locationopen to the Norwegian Sea in the sector west-northwest to north-northwest. The 10-minute wind data availability is near 100% for all sensors. There was sporadic loss of 10 Hz data before July 2017 and in March 2019 due to technical issues. Thedata availability for the other atmospheric variables is near 100% until December 2018 when it is 0.1-0.9% lower.
A precipitation station was put in operation in March 2018, in the village Brandal between Kvitneset and Langeneset. Due toa fault, precipitation was not registered during the last 10 days of August 2018.
The Langeneset mast is located to the south in Sulafjorden (i.e. inward) from the mast at Kvitneset. It is mounted in a 100 mwide industrial area, below a steep mountain side (cf. Fig. 3). The slope is partly covered with an open forest and there arelow buildings in the industrial area. Due to sporadic losses and mast downtime in the summer of 2017 data acquisitionduring the first year was 94.6%. For 2018 and onwards the data availability is close to 100 %.
The mast at Trælbodneset is located at 12 m asl, on a small headland on the western side of the island Sula, with view to theopen sea towards the westnorthwest. Towards the east, a mountain rises 450 m over a distance of 1 km (Fig. 3). Thevegetation is relatively sparse at the mast and along the coast, while the mountainside has open forest. The 10-minuteavailability is 99 - 100% but the top sensor had a slightly later start than the other sensors (16 January 2018). The overallavailability of 10 Hz data is good, with a somewhat reduced availability during some winter months. The 10-minuteavailability of the temperature sensors in the masts is near 100 % the first two years, then 92.1 and 97.2 % in 2019 and 2020.
The mast at Kårsteinen is also located on a small headland with a steep mountain rising to 660 m in the northeasternquadrant (Fig. 2). The mast is located near the opening of Sulafjorden into Vartdalsfjorden. Due to defect hardware, theavailability was poor during the first few months of operation, but it is near 100% after February 2018. The availability of10 Hz data is generally good, but relatively low in September 2018.
4
128
129130131132133134135136137138139140
141
142143144
145146147148149150151
152153
154155156157
158159160161162163
164165166167

Vartdalsfjorden
The mast at Rjåneset is located at the tip of a small peninsula, just west of the settlement at Grøvika, on the southeasternshore of Vartdalsfjorden. There is a mountain rising to 1035 m a few kilometers to the east (Fig. 3), with steep mountainsidesin the sector from north - northeast to east, and some of them across the fjord. The headland has some trees and themountainside is forested. There are some low islands a couple of kilometres to the south and southeast. There are steepmountains across the fjord to the north and west, while the fjord is more open to the southwest where it meets Rovdefjordenand Voldsfjorden. The availability of 10-minute data from the top-most sensor is close to 100 % for the whole measurementperiod, while due to hardware issues, some data were lost for all sensors during September - November 2018, and after April2019. The availability of the 10 Hz raw data is generally good, with sporadic losses during summer and slightly increase inthe losses during late autumn for both years (2018 and 2019).
Hjørundfjorden
The mast at Gjeveneset is relatively low compared to the other masts, and is located at a potential building site for thecomponents of a floating structure. The mast is situated at the inlet of Hjørundfjorden at 3 m asl just by the sea, southwest ofHundeidvik, where the fjord opens up towards the north before meeting Storfjorden (Fig. 2). The mast is facing the fjord inthe sector south-southeast over west to north, and the land is fairly open towards northeast with spread buildings within afew hundred metres. In the east, open terrain slopes gently up to 20 m over a distance of 200 m and then more steeply up toabove 600 m over a distance of 600 m. On both sides of the fjord, steep mountains raise up to more than 1000 m asl. Theheadland has areas of trees and the mountain side is covered by forest. Data availability from the mast was just over 90% in2019 due to a hardware failure in the spring. In 2018 and 2020 the availability was good (100%).
Julsundet
Julsundet is the sound that connects Molde and Fræna municipality on the southeast side and the island municipalitiesMidsund and Aukra on the northwest side. Julsundet is approximately 17 km long and runs in a north-south direction. Onthe south side, the sound opens into Moldefjorden, and on the north side into Harøyfjorden. A bridge in the narrowmost partof the sound has been considered, where the width is 2.5 km and mountains reach up to 500 – 600 m on both sides, as seen inFig. 5 and Fig. 6. Two masts, Midsund (dismantled in spring 2019) and Nautneset, are placed on the western side and one,Julbø, on the eastern side of Julsundet (Fig. 5). The masts at Midsund and Nautneset are only separated by a horizontaldistance of ~100 m and have sensors at the same height over mean sea level as well as the same height over ground level.More details are given in Eriksen (2019), and references therein.
Julbø mast is placed on a low headland reaching fairly far into the sound. The topography on the headland goes up to 8 mwhile the mast is located at 4 masl. There are a few trees and a small cliff down to the sea on the southwest side. Themonthly 10-minute data availability is near 100% except during periods associated with technical failures in May, July,November and December 2014, March and July 2017. The 10 hz data availability is generally good, with greater loss duringthe previously mentioned months.
The Midsund mast was mounted on the west side of the sound, on the Nautneset headland. The headland is forest coveredand reaches roughly 300 m into the sound. The topography at the headland reaches up to 50 m with steep cliffs up from thesea. To the west of the headland the terrain rises steeply to 600 m. The mast was mounted 100 m from the outer headland at24 m asl. The monthly 10-minute data availability is 99 - 100% and the 10 Hz availability typically high, except duringperiods associated with technical failures in March and August 2014, May and July 2017, as well as June 2018. TheNautneset mast is placed on the harbour about 100 m east of the location of the Midsund mast. The mast has free sight fromnorth (360°) over east to south (180°). In the west the topography rises steeply to Midsund mast and further towards themountains. In November 2016 - January 2017 the two topmost sensors were out due to a lightning strike, but the lowermostsensor operated normally, and in March 2019 a technical failure caused loss of data. Apart from this, the data availability has
5
168
169170171172173174175176177
178
179180181182183184185186
187
188189190191192193194195
196197198199200
201202203204205206207208209

been close to 100%.
Halsafjorden
The Halsafjorden fjord runs in a southeast - northwest direction from Todalen in the south, towards the island Tustna (Fig.7). The fjord is roughly 2.5 km wide at the planned bridge location. The terrain reaches up to 200 – 500 m asl on both sidesand the sides are covered by forest (Fig. 7 and Fig. 8). A mast is placed at Halsaneset on the western side and another,Åkvik, is placed on the eastern side of the fjord. More details are given in Eriksen (2019), and references therein.
Halsaneset mast is mounted 10 masl, at tip of the headland Halsaneset which reaches 500 m out into Halsafjorden. There aretwo small, forested hills (15 and 40 m) on the headland, while the tip of the headland is more sparsely vegetated. The Åkvikmast is mounted at 6 masl on the tip of a 200 m wide and 500 m long and forest covered headland, Orneset, on the easternside of Halsafjorden. The headland is about 80 m high at the farm Haugen and slopes gradually towards the tip while thesouthern side of the headland is steep. The height of the mast at Åkvik was increased to 100 m in May 2020 and at the sametime the station got a new name, Åkvik2, and observations stopped at the original station. Due to the short observation seriesat Åkvik2, no observations from the station are presented here. Both the Halsaneset and Åkvik masts have a high annualdata-availability of 99.8-100% for 2016-2020.
3 Data handling and quality assurance
Data from the sites is handled as follows. Observational data is transmitted in near-realtime to KVT, with a temporarybackup locally stored in the mast loggers. Data is processed and quality checked on an hourly basis at KVT. As the mastmeasurements are ongoing and instruments may need replacing, the filtering process is monitored and improved when theneed arises. Furthermore, the operations of the mast observations are monitored in real-time by an automated system whichwarns about delays in observations, malfunctioning instruments, missing data or unphysical observed values.
The operational filtering of the 10 Hz wind data made publicly available is threefold. Unphysical values exceeding thespecifications of anemometers are flagged. Noise and data spikes associated with unphysical jumps in the measurementvalues are identified and removed from the dataset using a method similar to median filtering. Locked values, i.e. repeatedand identical measurement values for the three wind components, are removed. Further filtering of the available 10 Hzdataset is not done, and it is left to the user of the data to employ more stringent filtering routines, as he sees fit and neededfor the intended use of the data. Suggestions on applicable filtering methodologies and additional quality assurance are e.g.given in Hubbard et al. (2012), with more specific details given in in Capozzi et al. (2020) and Steinacker et al. (2011). Afterfiltering, the observed wind direction in the 10 Hz data is rotated towards true north, and 10-minute means are producedfrom the 10 Hz wind data. There is no minimum on the amount of 10 Hz samples used in producing the 10-minute averages,but the amount can be deduced by inspection of the available 10 Hz data. For other data than observations of wind, the raw-data are made available as is, and only a first screening of the data is done, with no additional filtering performed.
Hourly data at the native sampling rate and with 10-minute sampling is written to files (netCDF4-format), and are sent to avirtual server belonging to MET Norway via sftp, typically on a hourly or daily basis. MET Norway performs an additionalquality check on the data, to track any inconsistencies and delays in the data stream. Data from the masts are published asopen access on "http://thredds.met.no". THREDDS (Thematic Real-time Environmental Distributed Data Services) issoftware solution run on web servers that provides metadata and data access for scientific datasets, using a variety of remotedata access protocols such as OPeNDAP (Open-source Project for a Network Data Access Protocol). Due to the high dataamount for the 10 Hz wind data, the 10-minute data are stored separately. Both type of files include wind speed, winddirection and vertical wind speed. The 10-minute averages of the wind observations are based on 10 Hz data from the
6
210
211
212213214215
216217218219220221222223
224
225226227228229
230231232233234235236237238239240
241242243244245246247248

interval preceding the time stamp (i.e. labelled right), while the interval is open on the left side and closed on the right side(i.e. the end points only includes the observation concurrent with the time stamp).
4 Wind conditions and data overview during observation period
The long term automatic weather station Ona II (MET station number 62480) at the island Ona just off the coast (Fig. 1) isused as a reference station for the wind and temperature measurements. Ona II is operated by MET Norway and data areavailable from the open data API: "frost.met.no". Houry observations of wind speed and direction are available since 2001,and they are used to provide a description of the current state of the regional wind climate, which is well described byapproximately 18 years of data. For this period, the median wind speed at Ona is 6.6 ms-1 which varies from 5.1 ms-1 inAugust up to 8.7 ms-1 in January (Fig. 9). Winds above 30 ms-1 have been observed in the autumn and early winter, i.e. fromSeptember to December. Since the fjord crossings are separate projects with different timelines and since permits formounting the masts are granted separately, all the masts were erected at different times from 11 February 2014 in Julsundetto 14 March 2018 in Hjørundfjord. A 3-year period from Ona II is chosen to represent the period with fjord measurements(Fig. 10 top left). When compared to the wind speed distribution for the reference period of 18 years (Fig. 9) we see that thewind has been somewhat weaker during the the chosen 3 years than during the reference period. The median and 75thpercentiles of wind speed during February, July and November are lower than for the whole full series and there have beenno recordings of wind speed above 30 ms-1.
At the 11 stations discussed here (Table 2), the lowest annual median wind speed is found in the inner part of Sulafjorden atLangeneset (2.95 ms-1) and Kårsteinen (2.39 ms-1) while median wind speed above 5 ms-1 are recorded in Julbø (5.15 ms-1),Kvitneset (5.03 ms-1), and Rjåneset (5.04 ms-1). Strong winds are most frequent in Julsundet and at Kvitneset in Sulafjorden,while the highest 99th percentiles are found in the inner part of the fjords (Gjeveneset and Rjåneset) in spite of their lowermeasurement heights. This is presumably related to the local topography and how well the sites are exposed to directionassociated with strong winds. The 99th percentile for the, separately, upwards and downwards, oriented vertical winds,indicates that the strong vertical gusts are often found at the stations in Sulafjorden as well as at Nautneset, compared to atthe other stations, especially those in Halsafjorden.
The wind speed shows a clear seasonal variation at the Ona reference station and most of the masts, except Trælbodneset,Kårsteinen, Gjeveneset and Rjåneset (Fig. 9 and Fig. 10). Here, the time series are short, and the statistics are less reliable.
The wind roses for the Ona reference station (Fig. 9 and top left in Fig. 11) show that the directional distribution during the3 year period is quite typical for the climate conditions during the last 18 years, as would be expected at a site where the low-level flow is strongly affected by both the local terrain as well as the large scale orography of western Norway. They alsoshow that along the coast, the most frequent, as well as the strongest, winds are from the southwest and the northeast,following the general orientation of the coast. The synoptic scale flow aloft has a large contribution from the south and theeast, as well as a component from the northwest, but the orographic forcing typically deflects such flow along the large scaleorography (see Barstad and Grønås, 2005, and references therein). The wind roses covering the full observation period untilapril 2019 (Fig. 11) for the 11 stations indicate flow which is strongly affected by the local terrain. Southerly winds (windsblowing towards the sea) are frequent at all stations, and dominant at Julsundet, Halsafjorden, Trælbodneset, Gjeveneset andRjåneset. The strongest winds are also typically associated with southerly flow. While northeasterly winds are frequent atOna, the local terrain forcing at many of the observation sites typically stagnates such larger-scale flow, or rotates it alongthe main fjord axes. Furthermore, northeasterly flow at Ona is presumably a result of large scale synoptic flow from a widesector covering flow from the northwest to the northeast, and will hence be associated with different wind directions at eachsite. The sites most exposed to northeasterly flow are Åkvik, Gjeveneset and Rjåneset, while frequent and strong northerlyflow is in fact found at most of the sites, e.g. in Julsundet. In order to facilitate a more direct comparison of the windconditions at the sites and the variation within the region, wind roses from Ona and the sites, based on data for 1 year, areshown in Fig. 12. Only concurrent data is used for the roses in individual panels, i.e. short periods of downtime are removedfor all sites in the same fjord. The wind roses are overlaid on the topography and highlight in a qualitatively manner the
7
249250
251
252253254255256257258259260261262263264
265266267268269270271272
273274
275276277278279280281282283284285286287288289290291292

strong topographic forcing at low-levels in the fjords, as well as the large regional variations in the wind conditions for thegiven year. The similarity of the wind roses for Ona in Figs. 9, 11 and 12 implies that the same spatial variations exist in theregional wind climate, as for the 1 year period used in Fig. 12.
The monthly temperature, observed at the top most sensor in the Kvitneset mast is shown in Fig. 13, in addition totemperature observations from the Ona II reference station. There are on average small differences between the monthlytemperature at both sites, with most notable difference being that the maximum temperature is typically 1-3°C higher atKvitneset than at Ona. The observed mean monthly temperatures are also quite similar to the climatological mean from the18 year period. The most notable differences are that April, July and November 2018, as well as 2019 were 1-2°C warmerthan average, while March 2019 was ~2°C colder. To illustrate some of the details in the data, the temperature and wind atKvitneset during the early part of a varm day on 28 July 2018 are shown in Fig. 14. There was a high pressure over the Kolapeninsula and a low pressure system over the british isles, giving rise to the easterly advection of warm air which was ~20°Cat 850 hPa (not shown). Skies were clear and there was presumably a large scale subsidence in the lee of the mountains ofwest and mid Norway. The wind was southerly and weakening during the early hours of 28 July 2018, and the lowesttemperature was measured at 9 m a.g.l and the highest temperature at the top of the mast. This is indicative of a very stableboundary layer, which is cooled from below by radiatiative cooling as well as the sensible heat flux between the oceansurface and the surface layer. There are large oscillations in the temperature at upper levels, especially between 6 UTC and8:20. These are presumably associated with the advection of warm air, which is detached from the colder air below. The topsensors are within this warm layer for long periods while the depth of the layer varies such that the sensors at 44 m and 71 mare only located inside this layer for short periods of time. The wind speed starts to increase and the vertical mixing increasesbetween 7 and 8 UTC, and at 8:30 the colder surface air appears to be mixed up to at least 100 m but the layer is howeverstill stably stratified. Weak winds and a varying wind direction are associated with the period of strongest solar heating from9 until the early afternoon. There is a gradual warming of the whole layer until 12 (noon) at which time the whole layer iswell mixed or only weakly stably stratified, and the wind speed has increased at many of the masts. Large variations in thevertical velocity at the top sensor appear to be associated with periods of increased mechanical and convective mixing, inparticular between 10 and 11 UTC.
Masts on both sides of the fjords allow for investigation of the simultaneous differences in the wind field on each side of thefjord. An example is given for Halsafjorden (Fig. 15). The mean wind speed is stronger at Åkvik than at Halsaneset for allwind directions except for winds from the south. The strongest winds observed at the masts are observed at Halsanesetduring southerly winds, while winds are strongest at Åkvik during northwesterly flow. This is a result of the orographicforcing as well as the orientation of the fjord main axis. The mountain south of the Åkvik mast presumably introduces somsheltering while northwesterly flow may be accelerated somewhat along the terrain on the eastern side of the fjord.
As the full 3-dimensional wind vector is observed with a temporal frequency of 10 Hz, the turbulence spectral density can beestimated. An arbitrary example of such an estimate is given in Fig. 16, based on observations of a northerly storm at 50 m inthe Julbø mast . The analysis is based on observations from a 20-minute period starting at13:40 UTC on 1 January 2019.The horizontal wind vector is decomposed in components oriented along the mean wind direction, as well as perpendicularto it. The wind speed data are linearly detrended to ensure the stationarity of the wind data and smoothed to reduce effectsfrom the sharp interval boundary. The spectral density is calculated using a fast Fourier transformation, implemented in aperiodogram-method in a standard signal processing package (scipy, 2020) in the python programming language. The bluedots are the spectral energy density at individual frequencies while a 100 point running mean provides a smootherrepresantation of the results. The reduction in energy density with higher frequency has a similar slope as the -5/3 power lawfor turbulence spectra, i.e. as indicated by the theoretical predicion of Kolmogorov (1941). This is as expected and typicalfor turbulent flow at the site.
The meteorological station Ålesund (Nørve, no. 60945) has been operational since 2009 and is used as a reference forprecipitation. Brandal station located in Sulafjorden reveals much higher precipitation than what is recorded at Nørve, bothwhen comparing to the climatology based on 10 years but also within the same year (Fig. 17). This may be related to theproximity to the steep and high mountains at Brandal, stronger forced uplift during northerly flow and more spillover during
8
293294295
296297298299300301302303304305306307308309310311312313314315316317
318319320321322323
324325326327328329330331332333334
335336337338

southerly flow.
5 Data access
The data are available on the MET Norway API frost.met.no (precipitation measurements at Brandal II with station number59570) and from Arctic Data Centre (ADC): "DOI: 10.21343/z9n1-qw63" (Furevik et al., 2019). They are registered as adata collection, as it is a dynamic data set which is growing in time. The data is typically updated on a daily basis, but datamissing in the first dissemination to the server are typically available with a lag of 1 - 3 months.
The data on ADC are posted as a file for the raw data (10 Hz) and a file for the 10-minute mean wind speed, separately foreach mast and each month. Each file contains data from the different heights at the specific mast, including self-describingmetadata, such as geographical location and sensor heights. Temperature at different heights is also posted for each monthfor two mast (Kvitneset and Trælbodneset, files of type temp_0p2hz). Additional meteorological data from the weather mastat Kvitneset, i.e. tMetpack_1hz (temperature), prsMetpack_1hz (air pressure), dewpointMetpack_1hz (dew pointtemperature), RHMetpack_1hz (relative humidity) are posted in files with KvitnesetKlima in the file name.
6 Summary
We have presented the atmospheric part of a unique, and large, atmospheric and oceanic dataset, which is presently beingbuilt in connection with several planned fjord crossings in the Coastal Highway E39 - project of the NPRA. The atmosphericpart of this measurement programme includes wind observations in 12 tall masts in the three different fjord systems of Mid-Norway, and it started in 2014 and is presently ongoing. The overall data return is 98.9 %. The data collection is described,including a short summary of the geography at the sites. Examples of observed parameters are presented and put in contextwith observations and climatology from reference weather stations. The examples illustrate the quality of the data, but also astrong influence of the steep terrain on the wind measurements from these land-based masts. In addition to local design andplanning of infrastructure, the data collection may be useful for investigation of boundary flow in complex terrain, and forverification of numerical modelling. In combination with remote sensing and oceanographic data from buoys deployed in theproject, it offers a solid basis for the study of a fjord system over at least a decade. The data collection may furthermore beuseful for the industry or in other fields of research, where wind climate is of importance.
Author contributions. B. R. Furevik is responsible for publication of the data set and writing of the manuscript togetherwith H. Ágústson. H. Ágústson is responsible for the first line of quality control and a systematic analysis of the dataset, aswell as processing of files into netCDF-format and transfer to MET Norway. A. L. Borg is responsible for furher qualitycontrol of files, aggregation into monthly files and posting to the repository. B.R. Furevik, H. Ágústson and Z. Midjiyawamade the analyses presented in this paper. F. Nyhammer is responsible for the design, deployment and maintainance of themasts and instrumentation. M. Gausen is in charge of the measurement campaign for the Coastal Highway E39 project inMid-Norway.
Acknowledgements. This work and the measurement campaign is financed by the Norwegian Public Roads Administrationas part of the Coastal Highway E39 project in Mid-Norway. We acknowledge the contribution of Jørn Arve Hasselø atNPRA, who leads the fjord crossing project, together with Magne Gausen. Knut Harstveit is acknowledged for his part in thedesign of the measurement campaign, and as is Nina Elisabeth Larsgård for her part in the planning of the precipitation siteat Brandal. Map layers (used in figures 1-3, 5-8 and 12) are obtained from the Norwegian Mapping Authority(https://kartverket.no/). The Norwegian Mapping Authority’s free products are licensed under Creative CommonsAttribution 4.0 International (CC BY 4.0).
9
339
340
341342343344
345346347348349350
351
352353354355356357358359360361362
363364365366367368369
370371372373374375376

References
Andersen, O. J., and Løvseth, J.: Gale force maritime wind. The Frøya data base. Part 1: Sites and instrumentation. Reviewof the data base, Journal of Wind Engineering and Industrial Aerodynamics, 57, 97-109, DOI:10.1016/0167-6105(94)00101-I, 1995.
Andersen, O. J., and Løvseth, J.: The Frøya database and maritime boundary layer wind description, Marine Structures, 19,173-192, doi: 10.1016/j.marstruc.2006.07.003, 2006.
Barstad, I. and Grønås, S.: Southwesterly flows over southern Norway-Mesoscale sensitivity to large-scale wind directionand speed. Tellus A. 57, 136-152, 2005, DOI: 10.3402/tellusa.v57i2.14627.
Capozzi, V., Cotroneo, Y., Castagno, P., De Vivo, C., and Budillon, G.: Rescue and quality control of sub-dailymeteorological data collected at Montevergine Observatory (Southern Apennines), 1884–1963, Earth Syst. Sci. Data, 12,1467–1487, DOI: 10.5194/essd-12-1467-2020, 2020.
Eriksen, O. K.: E39, brukrysninger Julsundet og Halsafjorden, Møre og Romsdal, statusrapport for vindmålinger pr juni2019, Kjeller Vindteknikk, Lillestrøm, Norway, Technical report KVT/OKE/2019/R080, 38, 2019.
Furevik, B. R., Ágústsson, H., Lauen Borg, A., Nyhammer, F.: The E39 coastal highway observational dataset – atmosphericflow in complex coastal terrain in Mid-Norway, Norwegian Meteorological Institute. DOI: 10.21343/z9n1-qw63, 2019.
Gill Instruments: Software bug affecting ‘w’ wind component of the WindMaster family, Technical key note, Open File Keynote series number KN1509v6, http://gillinstruments.com/data/manuals/KN1509-WM-WMPro-W-Bug-Info-Sheet.pdf,accessed February 2020, 6 pp., 2016.
Godø, O. R., Johnsen, S., and Torkelsen, T.: The LoVe Ocean Observatory is in Operation, Marine Technology SocietyJournal, 48, 24-30, DOI: 10.4031/MTSJ.48.2.2, 2014.
Haslerud, A. S.: Analysis of wind measurements from 6 masts at Sulafjorden 24.11.2016-31.03.2019, Kjeller Vindteknikk,Technical report KVT/ASH/2019/R033, 292 pp., 2019.
Haslerud, A. S. and Ágústsson, H.: Analysis of wind measurements from 6 masts at Sulafjorden 24.11.2016-30.09.2018,Kjeller Vindteknikk, Lillestrøm, Norway, Technical report RAP-KVT-L-102 / KVT/ASH/2018/R108, 107 pp., 2018.
Hubbard, K., You, J., and Shulski, M.: Toward a Better Quality Control of Weather Data,Practical Concepts of QualityControl, edited by: Saber, M. and Nezhad, F., ISBN: 978-953-51-0887-0, InTech, DOI: 10.5772/51632, 2012
Jonassen, M. O., Ólafsson, H. , Reuder, J. and Olseth, J. A.: Multi-scale variability of winds in the complex topography ofsouthwestern Norway, Tellus A: Dynamic Meteorology and Oceanography, 64, 10.3402/tellusa.v64i0.11962, 2012.
Kolmogorov, A, 1941: The local structure of turbulence in incompressible viscous fluid for very large Reynolds' numbers. C.R. Acad. Sci., USSR, 30, 301 – 335.
Kristjánsson, J.E., Barstad, I. , Aspelien, T., Føre, I. , Godøy, Ø., Hov, Ø., Irvine, E., Iversen, T., Kolstad, E., Nordeng, T.E.,McInnes, H., Randriamampianina, R., Reuder, J., Sætra, Ø., Shapiro, M., Spengler, T. and Ólafsson, H.: The NorwegianIPY–THORPEX: Polar Lows and Arctic Fronts during the 2008 Andøya Campaign, Bull. Amer. Meteor. Soc., 92, 1443–1466, DOI: 10.1175/2011BAMS2901.1, 2011.
10
377
378379380
381382
383384
385386387
388389
390391
392393394
395396
397398
399400
401402
403404
405406
407408409410

Norwegian Public Roads Administration (NPRA): Bruprosjektering. Prosjektering av bruer, ferjekaier og andre bærendekonstruksjoner, Open File Håndbok N400, 175 pp., https://www.vegvesen.no/_attachment/865860/binary/1030718?fast_title=H%C3%A5ndbok+N400+Bruprosjektering.pdf, accessed 1 November 2019, 2015.
Reigstad, M., Eldevik, T., and Gerland, S.: The Nansen legacy, Fram Forum 2019, Framsenteret AS, pp. 100-105,https://framsenteret.no/wp-content/uploads/2019/03/Framforum-2019-digital.pdf, 2019.
Renfrew, I.A., Moore, G.W., Kristjánsson, J.E., Ólafsson, H., Gray, S.L., Petersen, G.N., Bovis, K., Brown, P.R., Føre, I.,Haine, T., Hay, C., Irvine, E.A., Lawrence, A., Ohigashi, T., Outten, S., Pickart, R.S., Shapiro, M., Sproson, D., Swinbank,R., Woolley, A., and Zhang, S.: The Greenland flow distorsion experiment, Bull. Amer. Meteor. Soc., 89, 1307–1324, DOI:10.1175/2008BAMS2508.1, 2008:
SciPy Documentation: https://docs.scipy.org/doc/scipy/reference/tutorial/signal.html (accessed February 2020)
Standard Norge, Actions and action effects, pp. 148, NORSOK N-003:2017, 2017.
Steinacker, R., Mayer, D., and Steiner, A.: Data Quality Control Based on Self-Consistency, Mon. Weather Rev., 139, 3974–3991, DOI: 10.1175/MWR-D-10-05024.1, 2011.
Steinhoff, T., Gkritzalis, T., Lauvset, S. K., Jones, S., Schuster, U., Olsen, A., Becker, M., Bozzano, R., Brunetti, F.,Cantoni, C., Cardin, V., Diverrès, D., Fiedler, B., Fransson, A., Giani, M., Hartman, S., Hoppema, M., Jeansson, E.,Johannessen, T., Kitidis, V., Körtzinger, A., Landa, C., Lefèvre, N., Luchetta, A., Naudts, L., Nightingale, P. D., Omar, A.M., Pensieri, S., Pfeil, B., Castaño-Primo, R., Rehder, G., Rutgersson, A., Sanders, R., Schewe, I., Siena, G., Skjelvan, I.,Soltwedel, T., van Heuven, S., Watson, A.: Constraining the Oceanic Uptake and Fluxes of Greenhouse Gases by Buildingan Ocean Network of Certified Stations: The Ocean Component of the Integrated Carbon Observation System, ICOS-Oceans, Frontiers in Marine Science, 6, 544 pp., DOI: 10.3389/fmars.2019.00544, 2019.
Tallhaug, L.: E39, Julsundet, Midsund kommune - vibrasjonsmåling Nautneset. Kjeller Vindteknikk, Lillestrøm, Norway,Technical report KVT/LT/2017/R046, 5 pp., 2017.
11
411412413
414415
416417418419
420
421
422423
424425426427428429430
431432

Figure 1. Overview of a part of the Møre and Romsdal region (approximate location shown in the inset) and thelocation of the three areas where the meteorological masts are located (S, J and H). The locations of three nationalweather stations with long-term data available, are indicated with coloured circles. Map layers are © Kartverket andlicensed under Creative commons version 4.
12
433434435436

Figure 2. Map of Storfjorden fjord system with location of the seven observational sites and height profiles shown inFig. 3. Map layers are © Kartverket and licensed under Creative commons version 4.
13
437438
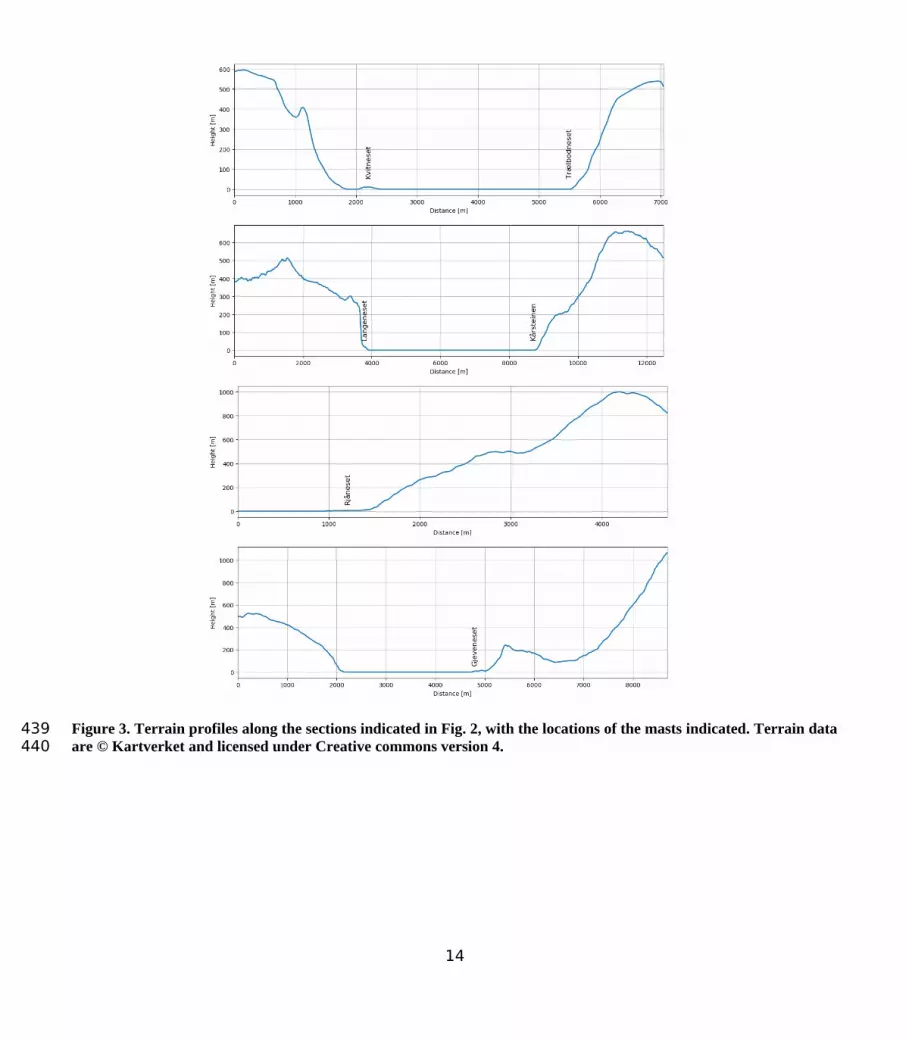
Figure 3. Terrain profiles along the sections indicated in Fig. 2, with the locations of the masts indicated. Terrain dataare © Kartverket and licensed under Creative commons version 4.
14
439440

Figure 4. Sulafjorden with the islands Hareidlandet, Godøy and Sula from left to right. Between Hareidlandet andGodøy is Breisundet, which is the main opening of the fjord system to the Norwegian Sea. Photograph taken on 13October 2016.
15
441442443

Figure 5. Map of Julsundet with location of meteorological masts and the height profile shown in Fig. 6. Map layersare © Kartverket and licensed under Creative commons version 4.
16
444445

Figure 6 Terrain profiles along the sections indicated in Fig. 5, with the locations of the masts indicated. Terrain dataare © Kartverket and licensed under Creative commons version 4.
17
446447

Figure 7. Map of Halsafjorden with location of the meteorological masts, and the height profile shown in Fig. 8. Themast Åkvik2 is a contination of Åkvik and located at the exact same location. Map layers are © Kartverket andlicensed under Creative commons version 4.
18
448449450
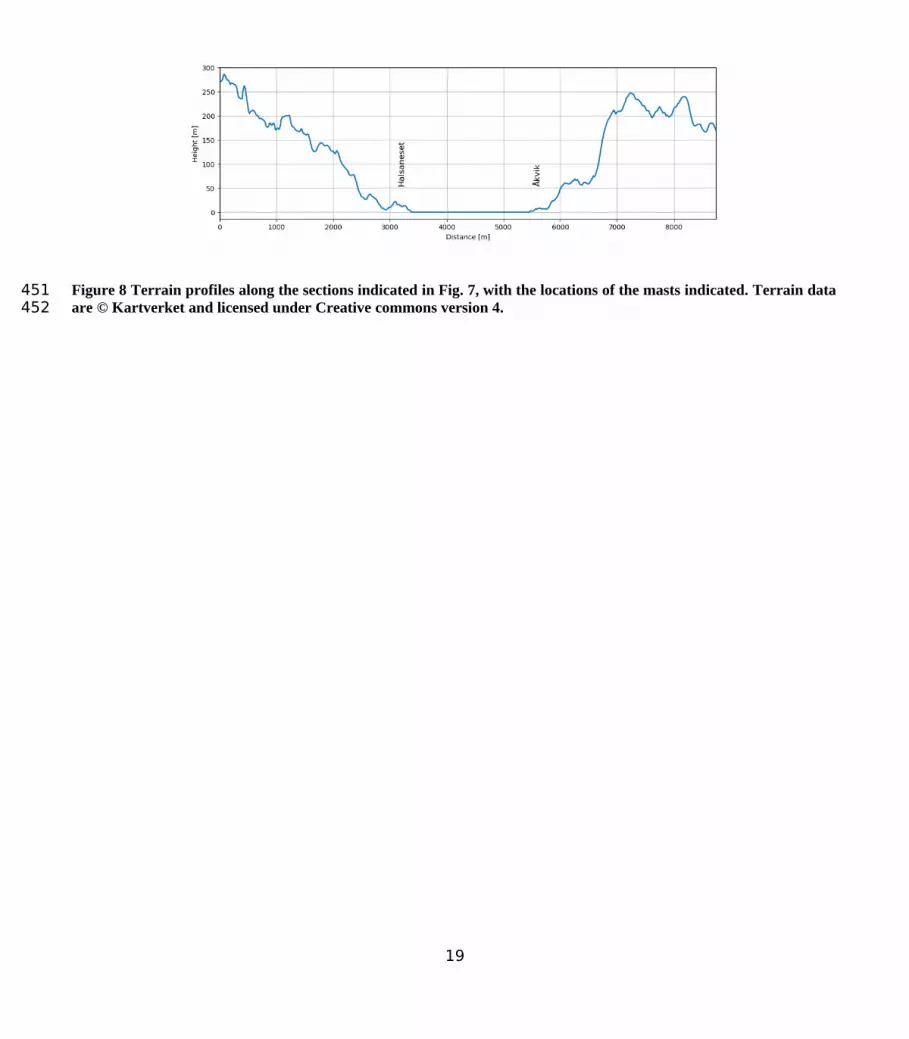
Figure 8 Terrain profiles along the sections indicated in Fig. 7, with the locations of the masts indicated. Terrain dataare © Kartverket and licensed under Creative commons version 4.
19
451452

Figure 9. Wind statistics for the 18 year climatological period at Ona II. Left: Box plot of wind speed per month ofthe year. The boxes in the plots shows the 25/75 percentiles with the median value as a circle inside. The lines aboveand below (the whiskers) represent 1.5 interquartile range from the box. Values beyond this are plotted as dots aboveeach line. The red numbers above each month, show the number of full months used to produce each box. Right:Wind rose showing the wind speed and direction distribution. The length and direction of the bar shows thedirectional distribution of the wind speed while the colour scale shows the wind speed distribution.
20
453454455456457458

Figure 10. Box plots of wind speed per month of the year over three years from Ona II (reference station) and allavailable data the uppermost sensor at the sites. The time periods for each panel are found in the correspondingpanel in Fig. 11.
21
459460461

Figure 11. Wind roses showing the wind speed and direction distribution over three years from Ona II (referencestation) and all available data from the uppermost sensor at the sites.
22
462463

Figure 12. Wind roses from Ona and the top-sensor of at each site, overlaid on topographic maps. Only data from1 March 2018 - 28 February 2019, at all the sites, are used to produce the wind roses. All the roses are in the samescale as the Ona wind rose (top left). Map layers are © Kartverket and licensed under Creative commons version 4.
23
464465466

Figure 13. Monthly mean, maximum and minimum temperature at top of Kvitneset mast and at the Ona referencemeteorological station. Also shown is the mean temperature (thick gray line) at Ona, for a 18 year period.
24
467468

Figure 14. Time series of temperature, wind direction, horizontal and vertical wind speed at Kvitneset (panel 1, 2 and4 from top) and horizontal wind speed from the top sensor of all four masts in Sulafjorden (panel 3). Sensor heightsat Kvitneset are given in the legends. The 10 Hz wind speed data are smoothed using a 30 s median filter.
25
469470471

Figure 15. Wind speed variation at Halsaneset and Åkvik in Halsafjorden, as a function of wind direction atHalsaneset on the western side of the fjord. Based on 4 years of data (2016 - 2019).
26
472473

Figure 16. Example of turbulence spectra for the along wind component during a northerly storm with ~25 m/s meanwind at the top sensor of the Julbø mast. The spectra are analysed from the 20-minute period before 14:00 UTC on 1January 2019.
27
474475476

Figure 17. Monthly measured precipitation at Brandal (green), compared to the same period (blue) and a mean for2009 - 2019 (orange) at the reference station Nørve in Ålesund.
28
477478
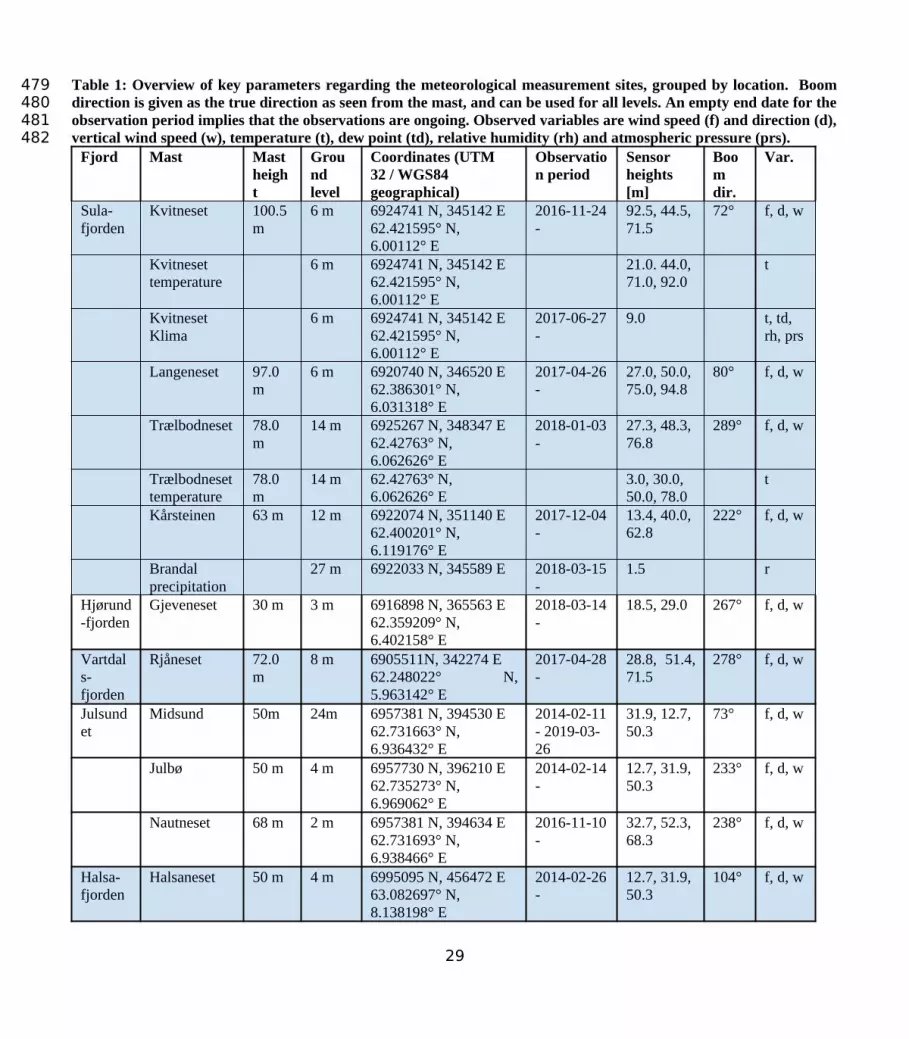
Table 1: Overview of key parameters regarding the meteorological measurement sites, grouped by location. Boomdirection is given as the true direction as seen from the mast, and can be used for all levels. An empty end date for theobservation period implies that the observations are ongoing. Observed variables are wind speed (f) and direction (d),vertical wind speed (w), temperature (t), dew point (td), relative humidity (rh) and atmospheric pressure (prs).
Fjord Mast Mast height
Ground level
Coordinates (UTM 32 / WGS84 geographical)
Observation period
Sensor heights [m]
Boom dir.
Var.
Sula-fjorden
Kvitneset 100.5 m
6 m 6924741 N, 345142 E62.421595° N, 6.00112° E
2016-11-24-
92.5, 44.5, 71.5
72° f, d, w
Kvitneset temperature
6 m 6924741 N, 345142 E62.421595° N, 6.00112° E
21.0. 44.0, 71.0, 92.0
t
Kvitneset Klima
6 m 6924741 N, 345142 E62.421595° N, 6.00112° E
2017-06-27-
9.0 t, td, rh, prs
Langeneset 97.0 m
6 m 6920740 N, 346520 E62.386301° N, 6.031318° E
2017-04-26-
27.0, 50.0, 75.0, 94.8
80° f, d, w
Trælbodneset 78.0 m
14 m 6925267 N, 348347 E62.42763° N, 6.062626° E
2018-01-03-
27.3, 48.3, 76.8
289° f, d, w
Trælbodnesettemperature
78.0 m
14 m 62.42763° N, 6.062626° E
3.0, 30.0, 50.0, 78.0
t
Kårsteinen 63 m 12 m 6922074 N, 351140 E62.400201° N, 6.119176° E
2017-12-04-
13.4, 40.0, 62.8
222° f, d, w
Brandal precipitation
27 m 6922033 N, 345589 E 2018-03-15-
1.5 r
Hjørund-fjorden
Gjeveneset 30 m 3 m 6916898 N, 365563 E62.359209° N, 6.402158° E
2018-03-14-
18.5, 29.0 267° f, d, w
Vartdals-fjorden
Rjåneset 72.0m
8 m 6905511N, 342274 E62.248022° N,5.963142° E
2017-04-28-
28.8, 51.4,71.5
278° f, d, w
Julsundet
Midsund 50m 24m 6957381 N, 394530 E62.731663° N, 6.936432° E
2014-02-11- 2019-03-26
31.9, 12.7, 50.3
73° f, d, w
Julbø 50 m 4 m 6957730 N, 396210 E62.735273° N, 6.969062° E
2014-02-14-
12.7, 31.9, 50.3
233° f, d, w
Nautneset 68 m 2 m 6957381 N, 394634 E62.731693° N, 6.938466° E
2016-11-10-
32.7, 52.3, 68.3
238° f, d, w
Halsa-fjorden
Halsaneset 50 m 4 m 6995095 N, 456472 E63.082697° N, 8.138198° E
2014-02-26-
12.7, 31.9, 50.3
104° f, d, w
29
479480481482

Åkvik 50 m 6 m 6995697 N, 458519 E63.08834° N, 8.178568° E
2015-03-062020-05-08
17.0, 31.9, 48.3
225° f, d, w
Åkvik2 100 m 6 m 6995697 N, 458519 E63.08834° N, 8.178568° E
2020-05-09-
48.3, 78.1, 97.2
225° f, d, w
30

Table 2: Main statistics of wind data set at top sensor, including mean, median, maximum wind speed and 99 th
percentile of wind speed, the maximum gust (3 s), as well as the 99th percentile of the up/down vertical wind gust [ms -
1].Fjord Mast Height
[m]Mean wind speed
Median wind speed
Maximumwind speed
99th perc. of wind speed
Max. gust
99th perc. vert. gust
Sulafjorden Kvitneset 92.5 5.64 5.03 29.70 16.52 37.0 -13.4 / 8.6Langeneset 94.8 3.59 2.95 24.34 13.26 37.3 -13.6 / 7.4Trælbodneset 76.8 5.01 4.24 27.04 15.97 46.1 -9.2 / 7.1Kårsteinen 62.8 3.17 2.39 23.21 12.97 32.1 -8.6 / 6.3
Hjørundfjorden Gjeveneset 29.0 5.85 4.83 23.55 17.82 43.6 -6.3 / 5.7Vartdalsfjorden Rjåneset 71.5 6.04 5.04 25.18 17.34 41.2 -6.8 / 6.3Julsundet Midsund 50.3 4.61 4.45 28.15 11.75 40.0 -7.4 / 6.2
Julbø 50.3 5.47 5.15 26.74 14.14 39.6 -4.8 / 5.0Nautneset 68.3 4.80 4.59 28.46 12.83 41.9 -9.0 / 6.1
Halsafjorden Halsaneset 50.3 4.30 3.91 23.87 12.62 35.1 -5.0 / 4.3Åkvik 48.3 3.80 3.03 23.00 12.94 34.4 -3.5 / 4.8
31
483484485