carbon dioxide column abundances at the wisconsin tall tower site
TRANSCRIPT

Carbon dioxide column abundances at the Wisconsin Tall Tower site
R. A. Washenfelder,1,7 G. C. Toon,2 J.-F. Blavier,2 Z. Yang,3 N. T. Allen,4
P. O. Wennberg,1,3 S. A. Vay,5 D. M. Matross,4,6 and B. C. Daube4,6
Received 6 February 2006; revised 12 May 2006; accepted 26 May 2006; published 18 November 2006.
[1] We have developed an automated observatory for measuring atmospheric columnabundances of CO2 and O2 using near-infrared spectra of the Sun obtained with a highspectral resolution Fourier Transform Spectrometer (FTS). This is the first dedicatedlaboratory in a new network of ground-based observatories named the Total CarbonColumn Observing Network. This network will be used for carbon cycle studies andvalidation of spaceborne column measurements of greenhouse gases. The observatorywas assembled in Pasadena, California, and then permanently deployed to northernWisconsin during May 2004. It is located in the heavily forested Chequamegon NationalForest at the WLEF Tall Tower site, 12 km east of Park Falls, Wisconsin. Under clearsky conditions, �0.1% measurement precision is demonstrated for the retrieved columnCO2 abundances. During the Intercontinental Chemical Transport Experiment–NorthAmerica and CO2 Boundary Layer Regional Airborne Experiment campaigns in summer2004, the DC-8 and King Air aircraft recorded eight in situ CO2 profiles over theWLEF site. Comparison of the integrated aircraft profiles and CO2 column abundancesshows a small bias (�2%) but an excellent correlation.
Citation: Washenfelder, R. A., G. C. Toon, J.-F. Blavier, Z. Yang, N. T. Allen, P. O. Wennberg, S. A. Vay, D. M. Matross, and B. C.
Daube (2006), Carbon dioxide column abundances at the Wisconsin Tall Tower site, J. Geophys. Res., 111, D22305,
doi:10.1029/2006JD007154.
1. Introduction
[2] In the last two decades, numerous studies [e.g.,Gurneyet al., 2002; Rayner et al., 1999; Tans et al., 1990] havecombined in situ measurements of CO2 obtained from aglobal network of surface sites [GLOBALVIEW-CO2, 2005]with global transport models to estimate regional-scalesurface exchange of CO2. Although the surface measure-ments are highly accurate, their limited spatial coverage andproximity to local sources and sinks make these estimatesquite sensitive to the errors in the transport model (e.g.,vertical mixing), particularly for sites located in the conti-nental interior. In particular, because the surface fluxes andvertical transport are correlated on diurnal and seasonaltimescales, errors in transport fields are aliased into theinferred exchange term as so-called ‘‘rectifier’’ effects[Denning et al., 1996; Gurney et al., 2002].
[3] Precise and accurate CO2 column measurements cancomplement the existing in situ network and provide in-formation about CO2 exchange on larger geographic scales.Unlike the near-surface volume mixing ratio (VMR), thecolumn integral of the CO2 profile is not altered by diur-nal variations in the height of the boundary layer. As aresult, it exhibits less spatial and temporal variability thannear-surface in situ data, while retaining information aboutsurface fluxes [Gloor et al., 2000]. Because few CO2
column measurements are available, understanding oftheir potential information content has been largely lim-ited to simulations [Rayner and O’Brien, 2001; Olsen andRanderson, 2004]. These studies show that CO2 columnmeasurements at carefully selected sites could be effectivein constraining global-scale carbon budgets [Rayner andO’Brien, 2001].[4] Three recent analyses of near-infrared solar spectra
obtained by Fourier Transform Spectrometers (FTS) dem-onstrate that column-averaged CO2 VMRs can be retrievedwith high precision [Yang et al., 2002; Dufour et al., 2004;Warneke et al., 2005]. The near-infrared spectral region isan appropriate observational choice for several reasons:(1) It is near the peak of the solar Planck function, expressedin units of photons/s/m2/sr/cm�1, maximizing signal-to-noise; (2) retrievals from O2 absorption lines in the near-infrared spectral region provide an internal standard; and(3) highly sensitive uncooled detectors are available for thisregion. For these reasons, the near-infrared region has alsobeen chosen by several space-based column observatories,including the Orbiting Carbon Observatory (OCO), the
JOURNAL OF GEOPHYSICAL RESEARCH, VOL. 111, D22305, doi:10.1029/2006JD007154, 2006ClickHere
for
FullArticle
1Division of Engineering and Applied Science, California Institute ofTechnology, Pasadena, California, USA.
2NASA Jet Propulsion Laboratory, California Institute of Technology,Pasadena, California, USA.
3Division of Geological and Planetary Sciences, California Institute ofTechnology, Pasadena, California, USA.
4Division of Engineering and Applied Sciences, Harvard University,Cambridge, Massachusetts, USA.
5NASA Langley Research Center, Hampton, Virginia, USA.6Department of Earth and Planetary Sciences, Harvard University,
Cambridge, Massachusetts, USA.7Now at Chemical Sciences Division, NOAA, Boulder, Colorado, USA.
Copyright 2006 by the American Geophysical Union.0148-0227/06/2006JD007154$09.00
D22305 1 of 11

Scanning Imaging Absorption Spectrometer for AtmosphericChartography (SCIAMACHY), and the Greenhouse GasesObserving Satellite (GOSAT).[5] Most of the existing FTS instruments from the Net-
work for the Detection of Stratospheric Change (NDSC)[Kurylo and Solomon, 1990] are not well suited for mea-surement of CO2 and other greenhouse gases. Most NDSCsites are located at high altitude to facilitate stratosphericmeasurements. To understand the sources and sinks ofgreenhouse gases, however, observatories should be locatedat low altitude. In addition, the existing NDSC sites areoptimized for observations of the midinfrared spectral
region, with KBr beamsplitters, aluminum optics, andmidinfrared detectors. Although many trace atmosphericconstituents have fundamental vibrational-rotational absorp-tions in the midinfrared spectral region, the near-infraredspectral region is a better choice for measuring CO2 andother greenhouse gases.[6] The Total Carbon Column Observing Network is a
new network of ground-based FTS sites. We describe thefirst dedicated laboratory in this network. This is an auto-mated FTS observatory developed for highly precise,ground-based solar absorption spectrometry in the near-infrared spectral region. Atmospheric column abundancesof CO2, CH4, CO, N2O, H2O, HDO, O2, and HF can beretrieved from the observed near-infrared spectral region.The observatory was assembled in Pasadena, California,and then deployed to Park Falls, Wisconsin, during May2004. We compare the column CO2 results with integratedin situ aircraft profiles, and present the CO2 column valuesfor May 2004 to October 2005. Readers interested in theseresults may wish to skip the detailed instrumental descrip-tion in section 2 and proceed directly to section 3.
2. Instrumentation
2.1. Bruker 125HR Spectrometer
[7] Solar spectra are acquired at high spectral resolutionusing a Bruker 125HR FTS housed in a custom laboratory(Figure 1). The Bruker 125HR has been substantiallyimproved over its predecessor, the Bruker 120HR. Oneimportant improvement is the implementation of the inter-ferogram sampling method described by Brault [1996], thattakes advantage of modern 24-bit delta-sigma analog-digitalconverters to improve the signal-to-noise ratio.[8] The spectrometer described here has been optimized
for measurements in the near-infrared spectral region, withgold-coated optics and a CaF2 beamsplitter with broadbandcoating. Interferograms are simultaneously recorded by twouncooled detectors. Complete spectral coverage from 3800to 15,500 cm�1 is obtained by simultaneous use of anInGaAs detector (3800–12,000 cm�1) and Si-diode detector(9500–30,000 cm�1) in dual-acquisition mode, with adichroic optic (Omega Optical, 10,000 cm�1 cut-on). Afilter (Oriel Instruments 59523; 15,500 cm�1 cut-off) priorto the Si diode detector blocks visible light, which wouldotherwise be aliased into near-infrared spectral domain. Theobserved spectral region includes absorption bands of CO2,CH4, CO, N2O, H2O, HDO, O2, and HF. Spectra from theSi-diode detector are not analyzed in this work, but areuseful for comparison with OCO and other future satelliteinstruments measuring the b1Sg
+(v = 0) X3Sg�(v = 0) O2
transition (A-band) between 12,950 and 13,170 cm�1. Forthe spectra obtained here, we use a 45 cm optical pathdifference and a 2.4 mrad field of view, yielding aninstrument line shape that has a full-width at half-maximumof 0.014 cm�1. This is sufficient to fully resolve individualabsorption lines in the near-infrared. The input optics use anoff-axis parabolic mirror that is the same type as thecollimating mirror. Hence the external field of view is also2.4 mrad, and the instrument accepts only a small fraction ofthe 9.4 mrad solar disk. The beam diameter is stopped downto 3.5 cm to reduce the saturation of the detectors and signalamplifiers. Figure 2a shows a typical spectrum, acquired in
Figure 1. (a) Photograph of the automated FTS laboratorylocated 25 m south of the WLEF Tall Tower. A dome,weather station, and network camera are mounted on theroof. (b) Block diagram showing the laboratory. A servo-controlled solar tracker directs the solar beam through aCaF2 window to the Bruker 125HR spectrometer in thelaboratory. A 10 cm cell with 5.1 hPa HCl is mounted in thesource compartment of the 125HR, prior to the input fieldstop. Two detectors simultaneously record the solarspectrum in the 3900–15,500 cm�1 region. The Herculescomputer uses custom data acquisition software to monitorand control the 125HR spectrometer, solar tracker, dome,weather station, camera, scroll pump, GPS satellite timeserver, temperature sensors, and heaters.
D22305 WASHENFELDER ET AL.: COLUMN CO2 AT WISCONSIN TALL TOWER SITE
2 of 11
D22305

110 s, with signal-to-noise ratios of �900:1 and �500:1 forthe InGaAs and Si diode detectors, respectively. The ob-served intensity is the product of the solar Planck functionwith the instrument response.[9] To maintain stability of the optical alignment, the
internal temperature of the spectrometer is controlled be-tween 28 and 30�C. To reduce acoustic noise and eliminaterefractive inhomogeneities, the internal pressure is main-tained at less than 2 hPa using a Varian TriScroll 300 scrollpump. The spectrometer is evacuated once per day, beforesunrise, and has a leak rate less than 2 hPa day�1. Theinstrument line shape is monitored using narrow HCl linesin the first overtone band (n0 = 5882 cm�1). A 10 cm cellwith 300 wedged Infrasil windows containing 5.1 hPa ofHCl gas is permanently mounted in the source compart-ment, prior to the entrance field stop wheel, as shown in
Figure 1b. Because of space constraints, the sample com-partment typically supplied with the 125HR is not used.
2.2. Laboratory and Other Instrumentation
[10] The 125HR spectrometer is mounted inside a mod-ified 6.1 � 2.4 � 2.6 m steel shipping container. Thecontainer is equipped with an air conditioning and heatingwall unit, power, lights, and telephone connection. Theinterior of the container is insulated with 9.0 cm ofR19 fiberglass covered with 0.32 cm thick aluminum sheet.These materials were chosen to minimize outgassing thatmay otherwise interfere with spectral observations.[11] The optical assembly (solar tracker) that transfers the
direct solar beam from the roof of the container to the FTSwas purchased from Bruker Optics. It consists of a servo-controlled assembly with two gold-coated mirrors that rotatein azimuth (0–310�) and elevation (�5 to +90�). The solartracker has two operational modes: pointing to the calculatedsolar position and active servo-controlled tracking. Initially,the solar tracker is pointed toward the calculated solarephemeris. This position is typically within 0.3� of theactual solar position, with error attributed to the alignmentand leveling of the solar tracker. The solar beam is directeddown through a hole in the laboratory roof, which is sealedwith an 11.5 cm diameter wedged CaF2 window. Inside thelaboratory, a small fraction of the incoming solar beam isfocused onto a Si quadrant detector located at the entrance tothe spectrometer. The solar tracker then uses the quadrantdetector signal for active tracking of the Sun, with amanufacturer-specified tracking accuracy of 0.6 mrad. Threeheaters on the base of the solar tracker activate when thetemperature drops below 5�C, to prevent damage to theoptics and electronics.[12] The solar tracker is housed in a fiberglass telescope
dome, manufactured by Technical Innovations, Inc. inBarnesville, Maryland. The dome is constructed of indus-trial grade fiberglass, with a 1.0 m � 1.3 m oval base.The wide shutter opening allows unobstructed views fromthe horizon to 5� beyond zenith. The dome is bolted to thecontainer roof, which is reinforced with eight 6.4 cm thicksteel tubes welded to the frame, and covered with a 0.64 cmthick steel plate. This stabilizes the solar tracker andprevents vibrations that may degrade spectral quality andflexing of the container roof which may degrade the solartracker alignment.[13] A Setra Systems, Inc. Model 270 pressure transducer
(±0.3 hPa), is mounted inside the container, with an inputtube at �2 m outside. Accurate knowledge of the pressure isimportant for evaluating the accuracy of the retrieved O2
columns. In addition, synoptic surface pressure variations of±10 hPa (±1%) would overwhelm the changes in the totalCO2 column that we wish to observe. The calibration of thepressure sensor is checked periodically by comparison to aFortin mercury manometer (Princo Instruments, Model 453)mounted in the laboratory as an absolute standard. Inaddition, the temperature of the Setra pressure transduceris monitored for evidence of bias. A weather stationmounted at �5 m includes sensors for air temperature(±0.3�C), relative humidity (±3%), solar radiation (±5%under daylight spectrum conditions), wind speed(±0.5 m s�1), wind direction (±5�), and the presence of rain.
Figure 2. (a) A single spectrum recorded on 9 September2004, with 0.014 cm�1 resolution. Signal-to-noise ratio is�900 for the InGaAs detector and �500 for the Si diodedetector. Near-infrared absorptions by H2O, O2, CO2, CH4,CO, and N2O are labeled with solid bars. (b) An enlargedview of the same spectrum, demonstrating the resolutionand signal to noise in a region with strong CO2 lines.
D22305 WASHENFELDER ET AL.: COLUMN CO2 AT WISCONSIN TALL TOWER SITE
3 of 11
D22305

[14] A small network camera (Stardot Technologies) witha fisheye lens (2.6 mm focal length) is positioned on theroof of the laboratory. The dome, solar tracker, weatherstation, and a wide view of the sky are visible within thefield of view of the camera. This allows us to remotelymonitor the operation of the equipment and verify weatherconditions.[15] Accurate knowledge of the time is critical in calcu-
lating the solar zenith angle (SZA), which is necessary toconvert retrieved atmospheric slant column abundances intovertical column abundances. We use a high-precision GPSsatellite receiver with a network time server (MasterclockNTP100-GPS) to maintain time synchronization of theBruker 125HR.
2.3. Data Acquisition and Instrumental Automation
[16] The laboratory equipment consists of the 125HRspectrometer, scroll pump, solar tracker, dome, weatherstation, NTP-GPS satellite time receiver, network camera,heaters (for 125HR, solar tracker, and scroll pump), tem-perature sensors, current and voltage sensors, and uninter-ruptible power supply (UPS). Each of these components ismonitored and/or controlled with an integrated CPU board(Hercules, Diamond Systems) and an additional custom-built control board. The Hercules board includes four serialports, used for communication with the solar tracker, dome,weather station, and modem. The Hercules board alsoincludes 32 wide-range analog inputs for monitoring tem-peratures, voltage, currents, and the pressure of the scrollpump. Five digital I/O lines of the Hercules board are usedto command power to the solar tracker, dome, modem, FTS,and the FTS reset line. The FTS, network camera, NTP-GPS satellite time receiver, and UPS are IP-addressable andare commanded within the local area network.[17] The operating system chosen for the Hercules com-
puter is QNX (QNX, Kanata, Ontario), a realtime, multi-tasking, multiuser, POSIX-compliant operating system forthe Intel family of microprocessors. QNX was selectedbecause of its stability and because its simple message-passing method of interprocess communication allows theacquisition and control functions of the data acquisitionsoftware to be separated into a number of logically discreteprocesses.[18] Throughout the night, the acquisition software
records weather and housekeeping data. When the calculatedsolar elevation angle reaches 0�, the scroll pump is com-manded on and the FTS is evacuated to 0.5 hPa. Followingthe pumping sequence, the dome opens and the solartracker points to the calculated solar ephemeris. If the solarintensity is sufficient (45 W m�2), the solar tracker beginsactive tracking of the Sun and the FTS begins acquisitionof solar interferograms. The specific acquisition parame-ters, including the field stop diameter, detector gains,scanner velocity, and optical path difference, are set insoftware. Typically, each scan requires 110 s to completeand consists of a single-sided interferogram with 45 cmoptical path difference recorded at 7.5 kHz laser fringe rate.Forward and reverse interferograms (with the moving mirrortraveling away from and toward the fixed mirror) areacquired in sequence. Throughout each scan, the solarintensity measured by the solar tracker quadrant sensor isrecorded at 0.5 Hz. Since only spectra acquired under stable
solar intensity are suitable for atmospheric retrievals, thestandard deviation of the solar intensity is later used toevaluate spectral quality. Forward and reverse interfero-grams are analyzed separately to maximize the number ofunobstructed scans. Acquisition of solar interferogramscontinues as long as the solar intensity is sufficient foractive tracking of the Sun. If the weather station detectsrain, then the dome closes and spectral acquisition ceasesuntil weather conditions improve. When the calculated solarelevation reaches 0� at the end of the day, the dome is closed.[19] Each night, interferograms recorded during the day
are copied onto a removable hard disk. Overnight analysissoftware performs a Fourier transform to produce spectrafrom the interferograms, and performs preliminary atmo-spheric column retrievals. These results are then emailed toPasadena to monitor performance. At two month intervals,the removable hard disk is manually replaced with an emptyone. The full disk is mailed to Pasadena for analysis andarchiving. This is necessary because only dial-up Internetaccess is available at the WLEF site. The operational datarate is �50 GB month�1.
3. Measurement Site
[20] The FTS observatory was assembled and tested inPasadena, California, and deployed to northern Wisconsinduring May 2004. The laboratory is located 25 m south ofthe WLEF television tower site (45.945�N, 90.273�W,442 m above sea level) in the Chequamegon National Forest,12 km east of Park Falls, Wisconsin (pop. 2800). The regionis heavily forested with low relief, and consists of mixednorthern hardwoods, aspen, and wetlands. Boreal lowlandand wetland forests surround the immediate research area.The Chequamegon National Forest was extensively loggedbetween 1860 and 1920, but has since regrown.[21] This site was chosen because the National Oceanic
and Atmospheric Administration Earth Systems ResearchLaboratory (NOAA ESRL) and other organizations conductextensive in situ measurements at the WLEF tower, facili-tating intercomparison between the column and boundarylayer measurements. Monitoring began in October 1994,when WLEF was added as the second site in the Tall Towerprogram. CO2 concentrations are measured continuously atsix levels on the 447 m tower [Zhao et al., 1997; Bakwin etal., 1995]. Fluxes of CO2, water vapor, virtual temperature,and momentum are monitored at three levels [Berger et al.,2001; Davis et al., 2003]. In addition, NOAA ESRLconducts weekly flask sampling [Komhyr et al., 1985] andmonthly aircraft profiles which collect flask samples be-tween 0.5 km and 4 km [Bakwin et al., 2003].
4. Data Analysis
[22] In this work, spectra are analyzed using a nonlinearleast squares spectral fitting algorithm (GFIT) developed atthe Jet Propulsion Laboratory. Atmospheric absorptioncoefficients are calculated line-by-line for each gas in achosen spectral window, and are used together with theassumed temperature, pressure, and VMR profile in theforward model to calculate the atmospheric transmittancespectrum. This is compared with the measured spectrum andthe VMR profiles are iteratively scaled to minimize the
D22305 WASHENFELDER ET AL.: COLUMN CO2 AT WISCONSIN TALL TOWER SITE
4 of 11
D22305

RMS differences between the calculated and measuredspectra. The theoretical instrument line shape, verified fromfits to low-pressure HCl gas cell lines, is used in calculatingthe forward model. Figure 2b shows a measured spectrumand the fitted result, for a region with strong CO2 lines.[23] The atmosphere is represented by 70 levels in the
forward model calculation. Pressure- and temperature-dependent absorption coefficients are computed for eachabsorption line at each level. Profiles of temperature andgeopotential height are obtained from the NOAA ClimateDiagnostics Center (CDC), with 17 pressure levels from1000 to 10 hPa and 1� � 1� geographic resolution. Atpressures less than 10 hPa, climatological profiles of tem-perature and geopotential height are used. Measured surfacepressure is used to define the lowest model level.[24] We retrieve CO2 and O2 in three bands: O2 0–0
a 1Dg� X 3Sg
� (n0 = 7882 cm�1); CO2 (14�1) – (00�0) (n0 =6228 cm�1); and CO2 (21�2) – (00�0) (n0 = 6348 cm�1).These will be referred to as the O2 7882 cm�1, CO2
6228 cm�1, and CO2 6348 cm�1 bands. Retrievals in thesethree bands require accurate spectroscopic parameters forO2, CO2, H2O, and solar lines. The HITRAN 2004 line listparameters [Rothman et al., 2005] were found to be defi-cient at the high accuracies that we require. In HITRAN2004, the O2 7882 cm�1 band has severe errors in strengthsfor low J lines and errors in widths for high J lines; the CO2
6228 cm�1 and 6348 cm�1 bands have errors in linepositions, air-broadened widths, and pressure shifts.[25] We have adopted improved line parameters for the
O2 7882 cm�1 retrievals, including line strengths fromPGOPHER model results [Newman et al., 2000], air-broadened widths [Yang et al., 2005], and temperature-dependent air-broadened widths [Yang et al., 2005]. Inaddition, we have made two empirical corrections to min-imize temperature and air mass dependence of the O2
retrieval: (1) The air-broadened width values [Yang et al.,2005] have been increased by 1.5%. (2) The temperaturedependence of the air-broadened width values [Yang et al.,2005] have been increased by 10% to bring them into betteragreement with measurements by Newman et al. [2000].Both of these empirical corrections are within the reportedmeasurements uncertainties. Four recent laboratory studiesreport the integrated O16O16 7882 cm�1 band strength as3.166 ± 0.069 � 10�24 cm molecule�1 [Lafferty et al.,1998], 3.10 ± 0.10 � 10�24 cm molecule�1 [Newman et al.,1999] (all O2 isotopes), 3.247 ± 0.080 � 10�24 cm mole-cule�1 [Cheah et al., 2000], and 3.210 ± 0.015 � 10�24 cmmolecule�1 [Newman et al., 2000]. Because the Newman etal. [2000] PGOPHER model shows good agreement withour atmospheric fitting retrievals, we have also adopted theNewman et al. [2000] integrated band strength.[26] In addition to the discrete lines of the O2 7882 cm�1
band, there is an underlying continuum absorption causedby collision-induced absorption. On the basis of laboratorymeasurements [Smith and Newnham, 2000; Smith et al.,2001], we generated a pseudo-linelist representing collision-induced absorption which includes separate contributionsfrom O2-O2 and O2-N2 collisions. Although the collision-induced absorption is included in the line-by-line calcula-tion to improve estimation of the continuum, only thediscrete 7882 cm�1 O2 lines are used in the computationof the O2 column amount.
[27] We have used updated line parameters for the CO2
6228 cm�1 and 6348 cm�1 band line strengths, air-broadenedwidths, and pressure shifts based on recent work by Toth etal. [2006a, 2006b]. We have also adopted updated H2O lineparameters for the 5000–7973 cm�1 region (B. Toth,private communication, 2005). These new line lists werefound to give superior spectral fits to our atmosphericspectra. The solar line list for all near-infrared spectralretrievals is derived from disk-center solar spectra recordedat Kitt Peak (31.9�N, 116�W, 2.07 km).[28] For O2, the assumed a priori VMR profiles are
constant with altitude. For CO2, the assumed a prioriVMR profiles vary seasonally in approximate agreementto model output from Olsen and Randerson [2004]. Wehave examined the sensitivity of the column CO2 retrievalto different reasonable a priori functions, including a profilewhich is constant with altitude, and found that the effect onretrieved column CO2 is � 0.1%.
5. Column O2 and CO2
[29] The consistency between retrieved column O2 andmeasured surface pressure is an important test of instru-mental stability. O2 is well mixed in the atmosphere, with adry-air VMR of 0.2095. This provides an internal standardthat can be used to check the short-term and long-termprecision of the FTS column retrievals. As described insection 3, surface pressure at the Park Falls site is recordedat 1 Hz using a calibrated Setra 270 pressure sensor. Thecalibrated accuracy of this sensor is �0.3 mb, whichcorresponds to an uncertainty of �0.03% in the surfacepressure. For the May 2004 to October 2005 spectra,retrieved column O2 is consistently 2.27 ± 0.25% higherthan the dry pressure column (where the dry pressurecolumn is equal to the observed surface pressure convertedto a column density minus the retrieved H2O column). Thiserror exceeds both the uncertainty in the dry pressurecolumn and the reported 0.5% uncertainty in the integratedO16O16 7882 cm�1 band strength of 3.21 � 10�24 cmmolecule�1 ± 0.015 � 10�24 cm molecule�1 [Newman etal., 2000]. However, the �4% spread in recent measure-ments of the integrated O16O16 7882 cm�1 band strength(section 4) suggests that this discrepancy may fall within theuncertainty of the laboratory measurements. In this analysis,the retrieved O2 columns have been reduced by 2.27% tobring the retrievals into agreement with the known atmo-spheric concentration of O2. Figure 3a shows O2 retrievalsfor air masses between 2 and 3 (SZA 60–70�) plotted as afunction of the dry pressure column. Throughout this work,‘‘air mass’’ refers to the ratio of the slant column to thevertical column and is approximately equal to the secant ofthe SZA; when the Sun is directly overhead, the SZA is 0�and the air mass is 1.0. The residuals are shown in the upperpanel of Figure 3a.[30] Figure 3b shows the time series of O2 VMR, calcu-
lated from column O2/dry pressure column. Results are notshown for 8 May 2005 to 14 July 2005, because of aninstrumental error in solar pointing. Much of the scatter inFigure 3b can be attributed to error in the line strengths andthe air-broadened widths that cause the O2 retrievals to varywith temperature and air mass. However, the systematicincrease in O2 VMR over time (�0.3%) is larger than (and of
D22305 WASHENFELDER ET AL.: COLUMN CO2 AT WISCONSIN TALL TOWER SITE
5 of 11
D22305

opposite sign to) the seasonal changes in O2 VMR. Coinci-dent changes in HCl concentration retrieved from the cali-bration cell are also observed. During May 2004 to October2005, the reflectivity of the gold-coated solar tracker mirrorsslowly degraded because of a manufacturing flaw. Thisreduced the measured solar intensity by approximately60% in the near-infrared spectral region. It is possible thatthe errors observed in the O2 and HCl retrievals may becaused by this signal loss, coupled with nonlinearity in theresponse of the InGaAs detector. Studies are underway toquantify this error and remove its influence on the retrievals.[31] Column retrievals of CO2 from the 6228 cm�1 and
6348 cm�1 bands show high precision and repeatability.Observations of column CO2 during one clear day and onepartly cloudy day in August 2004 are shown in Figure 4a.Figure 4b shows the column O2 retrievals during the sametime period. Spectra have been discarded as obstructed by
clouds if the solar intensity measured by the quadrantdetector fluctuated by more than 5% RMS during therecording of an interferogram. The mean and standarddeviation of the CO2 columns measured during a 1-hourclear observation period around local noon (24 individualspectra) on 14 August 2004 is 7.7235 ± 0.0078 �1021 molecules cm�2 and 7.7406 ± 0.0074� 1021 moleculescm�2 respectively for the 6228 cm�1 and 6348 cm�1 CO2
bands. This precision of �0.1% is typical for column CO2
Figure 3. (a) Relationship between retrieved column O2
and dry surface pressure for spectra recorded at air massesbetween 2 and 3. The retrieved column O2 has been reducedby 1.0227. Dry surface pressure is the measured surfacepressure converted to a column density minus the retrievedH2O column. (b) Time series of column-average O2 VMRduring May 2004 to October 2005. Scatter is attributed toerror in the line strengths and air-broadened widths whichcause the O2 retrievals to vary with temperature and airmass. The systematic changes of O2 VMR over time areattributed to detector nonlinearity.
Figure 4. Spectral retrievals compared for a clear day(14 August 2004) and a partly cloudy day (15 August2004). (a) Column CO2 retrieved from the 6228 cm�1
(solid) and 6348 cm�1 (shaded) bands. Although theretrievals demonstrate precision of �0.1%, there is asystematic offset of �0.2% between the two bands. Thisoffset is attributed to errors in the CO2 line list parameters.(b) Column O2 retrieved from the 7882 cm�1 band.(c) Column-average CO2 VMR calculated from columnCO2/dry surface pressure. (d) Column-average CO2 VMRcalculated from 0.2095 � column CO2/column O2.
D22305 WASHENFELDER ET AL.: COLUMN CO2 AT WISCONSIN TALL TOWER SITE
6 of 11
D22305
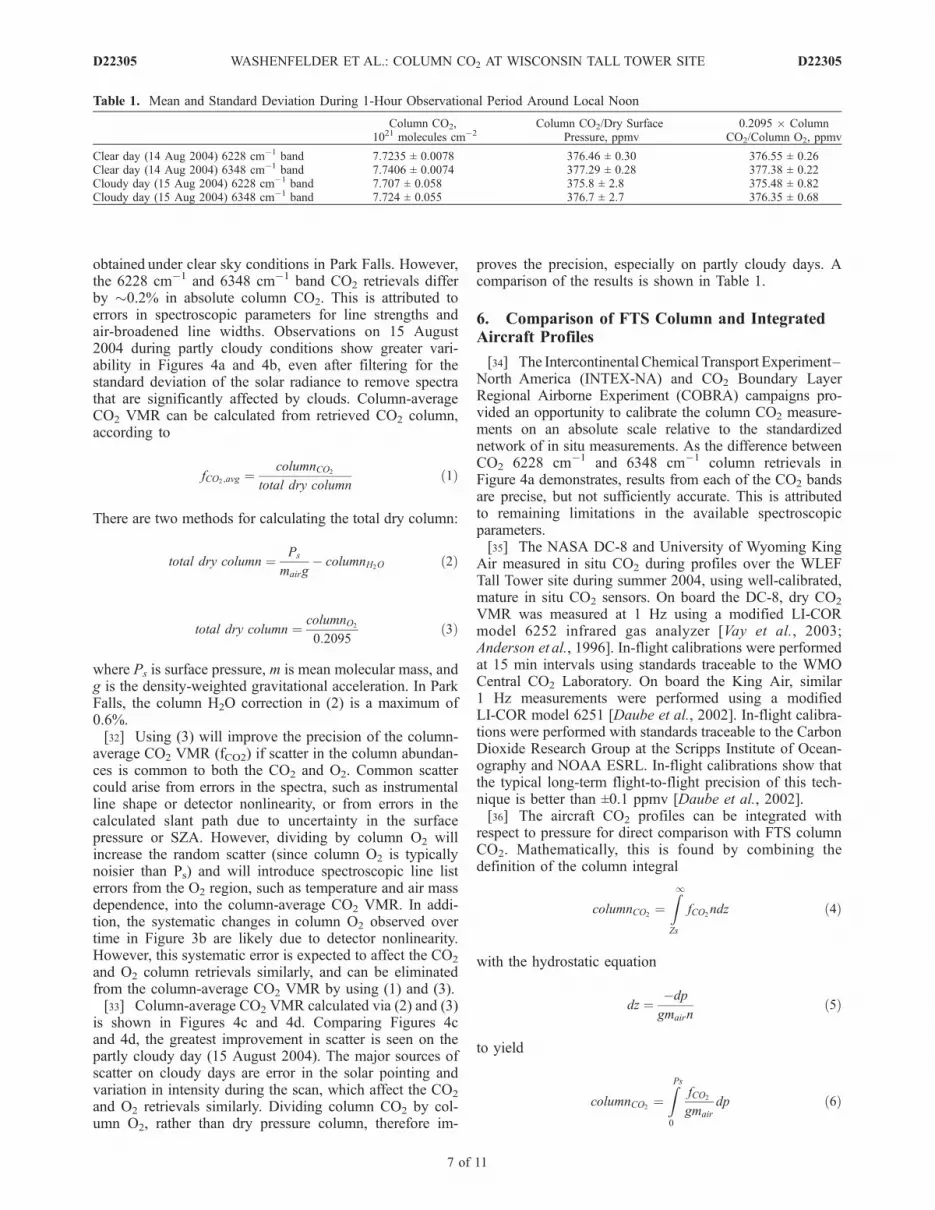
obtained under clear sky conditions in Park Falls. However,the 6228 cm�1 and 6348 cm�1 band CO2 retrievals differby �0.2% in absolute column CO2. This is attributed toerrors in spectroscopic parameters for line strengths andair-broadened line widths. Observations on 15 August2004 during partly cloudy conditions show greater vari-ability in Figures 4a and 4b, even after filtering for thestandard deviation of the solar radiance to remove spectrathat are significantly affected by clouds. Column-averageCO2 VMR can be calculated from retrieved CO2 column,according to
fCO2;avg ¼columnCO2
total dry columnð1Þ
There are two methods for calculating the total dry column:
total dry column ¼ Ps
mairg� columnH2O ð2Þ
total dry column ¼ columnO2
0:2095ð3Þ
where Ps is surface pressure, m is mean molecular mass, andg is the density-weighted gravitational acceleration. In ParkFalls, the column H2O correction in (2) is a maximum of0.6%.[32] Using (3) will improve the precision of the column-
average CO2 VMR (fCO2) if scatter in the column abundan-ces is common to both the CO2 and O2. Common scattercould arise from errors in the spectra, such as instrumentalline shape or detector nonlinearity, or from errors in thecalculated slant path due to uncertainty in the surfacepressure or SZA. However, dividing by column O2 willincrease the random scatter (since column O2 is typicallynoisier than Ps) and will introduce spectroscopic line listerrors from the O2 region, such as temperature and air massdependence, into the column-average CO2 VMR. In addi-tion, the systematic changes in column O2 observed overtime in Figure 3b are likely due to detector nonlinearity.However, this systematic error is expected to affect the CO2
and O2 column retrievals similarly, and can be eliminatedfrom the column-average CO2 VMR by using (1) and (3).[33] Column-average CO2 VMR calculated via (2) and (3)
is shown in Figures 4c and 4d. Comparing Figures 4cand 4d, the greatest improvement in scatter is seen on thepartly cloudy day (15 August 2004). The major sources ofscatter on cloudy days are error in the solar pointing andvariation in intensity during the scan, which affect the CO2
and O2 retrievals similarly. Dividing column CO2 by col-umn O2, rather than dry pressure column, therefore im-
proves the precision, especially on partly cloudy days. Acomparison of the results is shown in Table 1.
6. Comparison of FTS Column and IntegratedAircraft Profiles
[34] The Intercontinental Chemical Transport Experiment–North America (INTEX-NA) and CO2 Boundary LayerRegional Airborne Experiment (COBRA) campaigns pro-vided an opportunity to calibrate the column CO2 measure-ments on an absolute scale relative to the standardizednetwork of in situ measurements. As the difference betweenCO2 6228 cm�1 and 6348 cm�1 column retrievals inFigure 4a demonstrates, results from each of the CO2 bandsare precise, but not sufficiently accurate. This is attributedto remaining limitations in the available spectroscopicparameters.[35] The NASA DC-8 and University of Wyoming King
Air measured in situ CO2 during profiles over the WLEFTall Tower site during summer 2004, using well-calibrated,mature in situ CO2 sensors. On board the DC-8, dry CO2
VMR was measured at 1 Hz using a modified LI-CORmodel 6252 infrared gas analyzer [Vay et al., 2003;Anderson et al., 1996]. In-flight calibrations were performedat 15 min intervals using standards traceable to the WMOCentral CO2 Laboratory. On board the King Air, similar1 Hz measurements were performed using a modifiedLI-COR model 6251 [Daube et al., 2002]. In-flight calibra-tions were performed with standards traceable to the CarbonDioxide Research Group at the Scripps Institute of Ocean-ography and NOAA ESRL. In-flight calibrations show thatthe typical long-term flight-to-flight precision of this tech-nique is better than ±0.1 ppmv [Daube et al., 2002].[36] The aircraft CO2 profiles can be integrated with
respect to pressure for direct comparison with FTS columnCO2. Mathematically, this is found by combining thedefinition of the column integral
columnCO2¼
Z1
Zs
fCO2ndz ð4Þ
with the hydrostatic equation
dz ¼ �dpgmairn
ð5Þ
to yield
columnCO2¼
ZPs
0
fCO2
gmair
dp ð6Þ
Table 1. Mean and Standard Deviation During 1-Hour Observational Period Around Local Noon
Column CO2,1021 molecules cm�2
Column CO2/Dry SurfacePressure, ppmv
0.2095 � ColumnCO2/Column O2, ppmv
Clear day (14 Aug 2004) 6228 cm�1 band 7.7235 ± 0.0078 376.46 ± 0.30 376.55 ± 0.26Clear day (14 Aug 2004) 6348 cm�1 band 7.7406 ± 0.0074 377.29 ± 0.28 377.38 ± 0.22Cloudy day (15 Aug 2004) 6228 cm�1 band 7.707 ± 0.058 375.8 ± 2.8 375.48 ± 0.82Cloudy day (15 Aug 2004) 6348 cm�1 band 7.724 ± 0.055 376.7 ± 2.7 376.35 ± 0.68
D22305 WASHENFELDER ET AL.: COLUMN CO2 AT WISCONSIN TALL TOWER SITE
7 of 11
D22305

where f is the atmospheric mixing ratio, g is gravitationalacceleration, mair is the mean molecular mass, n is thenumber density, p is pressure, Ps is surface pressure, z isheight, and Zs is the surface height. The atmospheric mixingratio of CO2 is defined as
fCO2¼ fCO2;dry 1� fH2Oð Þ ð7Þ
where fCO2,dry is the dry-air CO2 vmr, measured by in situinstruments. Combining equations (6) and (7), together withthe relationship
mair ¼ mair;dry 1� fH2Oð Þ þ mH2O fH2O ð8Þ
gives
columnCO2¼
ZPs
0
fCO2;dry
gmair;dry 1þ mH2O
mair;dry
fH2O
1�fH2O
� �� �dp ð9Þ
Integrated column CO2 from (9) can be divided by the totalcolumn from (2) to yield the column-average CO2 VMR.[37] Eight unique aircraft profiles were measured on five
dates during 2004: 12 July, 14 July, 15 July, 14 August, and15 August. The first profile of the series, shown in Figure 5a,was a descending spiral by the NASA DC-8 from 10.0 km to0.7 km. Because the aircraft has a limited altitude range, it isnecessary to make assumptions about CO2 and H2O in theupper troposphere and stratosphere when using (9) to findintegrated column CO2. The tropopause pressure is deter-mined from the NOAACDC assimilated temperature profile.The median CO2 value measured in the free troposphere isassumed to extend from the aircraft ceiling to the tropopause.Above the tropopause, the assumed CO2 profile is taken froman in situ balloon profile (35�N, 104�W) recorded over FortSumner, New Mexico, during September 2004. The balloonprofile of CO2 as a function of altitude is coordinate-transformed into CO2 as a function of potential temper-ature (q), using simultaneous temperature and pressuremeasurements. For the aircraft profile, q is calculatedfrom the NOAA CDC assimilated temperature data.CO2 is assumed to be well mixed in the planetaryboundary layer between the surface and the 0.7 km floorof the aircraft profile. This is confirmed by in situmeasurements on the Tall Tower. The CO2 profile shownin Figure 5b is integrated with respect to pressure to findcolumn CO2. The assumed CO2 profile above the aircraft
Figure 5. (a) Ground track of the NASA DC-8 during avertical profile from 0.7 to 10.0 km on 12 July 2004. Thelocation of the Wisconsin Tall Tower is indicated. Aircraftaltitude is shown, where solid line indicates 0.7 km andshaded line indicates 12 km. (b) In situ CO2 measuredduring the 12 July 2004 profile. Tropopause pressure isdetermined from the NOAA CDC reanalysis. Above theaircraft ceiling (10.0 km), the median measured freetropospheric CO2 value is assumed to extend to thetropopause (dotted line). Above the tropopause, theassumed CO2 profile is taken from a September 2004balloon profile from 35�N, 104�W (dashed line). The CO2
profile is integrated with respect to pressure to calculate thetotal column. (c) Averaging kernel for the FTS CO2
retrievals. (d) Column-averaged CO2 VMR for FTS spectrarecorded during the aircraft profile. CO2 6228 cm�1 bandretrievals are shown as solid dots; CO2 6348 cm�1 bandretrievals are shown as shaded dots. Intermittent cloudsprevented continuous data acquisition.
D22305 WASHENFELDER ET AL.: COLUMN CO2 AT WISCONSIN TALL TOWER SITE
8 of 11
D22305

ceiling contributes the greatest uncertainty to the integration,and we have attributed a generous uncertainty of ±2 ppmv tothis portion of the profile.[38] Figure 5d shows the FTS column-average CO2
recorded during a 2-hour period which brackets theaircraft profile. These profiles were performed at air mass1.1–2.0 (SZA 25–60�). The column data are not contin-uous because intermittent cloud prevented the acquisitionof solar spectra. The 45-min period of the aircraft profile isindicated. The averaging kernel for the FTS CO2 retrievalsduring this period is shown in Figure 5c. The shape of theaveraging kernel is typical for a uniformly mixed, moderatelystrong absorber fitted by a nonlinear least squares profile-scaling retrieval. To accurately compare the FTS column-average CO2 and integrated aircraft profile, it is necessary toweight the aircraft profile by the FTS averaging kernel[Rodgers and Connor, 2003]. Because the averaging kernelvaries slightly with air mass, a separate averaging kernel iscalculated for each aircraft overpass.[39] Comparison of the eight integrated aircraft profiles
with the FTS CO2 columns is shown in Figure 6. There is alinear relationship between the integrated aircraft columnsand the retrieved FTS columns. The slope relationshipsdiffer for the two CO2 bands, with values of 1.0216 and1.0240 for CO2 6228 cm�1 and CO2 6348 cm�1 respec-
tively. The standard deviation of the fitting residuals is0.39 ppmv and 0.42 ppmv for the two bands. The sloperelationships from Figure 6 can be used to correct the FTSCO2 columns, bringing them into absolute agreement withthe calibrated in situ network.
7. Error Analysis for Column-AverageCO2 VMR
[40] The column-average CO2 VMR calculated accordingto 0.2095 � column CO2/column O2 is affected by threemain sources of error:[41] 1. The first source of error is measurement precision.
As discussed in section 5, the standard deviation of columnCO2/column O2 during a 1-hour period is better than 0.1%under clear sky conditions and �0.2% under partly cloudyconditions. Repeatability of the measurement is not asignificant source of error.[42] 2. The second source of error is spectroscopic
errors. As discussed in section 5, the retrieved O2
columns were reduced by 2.27% to bring them intoagreement with the dry surface pressure. Although thiscorrection falls outside the reported uncertainty of the16O16O 7882 cm�1 integrated band strength, we believethat it is likely attributed to an error in the line strengthsor air-broadened width parameters.[43] The absolute accuracy of the CO2 retrievals was
calibrated by comparison to integrated aircraft profiles, re-sulting in a correction of 1.0216 and 1.0240 for the CO2
6228 cm�1 and 6348 cm�1 bands. The standard deviationof the fitting residuals is 0.39 ppmv and 0.42 ppmv, orapproximately 0.1%. The aircraft profiles were performedwith the Sun at air mass 1.1–2.0 (SZA 25–0�), and thecolumn-average CO2 VMR is now well calibrated forthese values. However, this does not calibrate the column-average CO2 VMRs at higher air mass. A 1% change in theair-broadened widths results in a CO2 VMR change of�0.2% (±0.8 ppmv) at air mass 3 and �0.6% (±2.3 ppmv)at air mass 12. These parameters are not sufficiently con-strained by current spectroscopic line lists, leaving this as asignificant source of systematic error which can be corre-lated with air mass, time of day, and temperature.[44] 3. The third source of error is systematic instrumental
changes over time. As described in section 5, retrieved O2
VMR increased by �0.3% during the observation period.Because this increase is seen for O2 retrievals from theInGaAs detector in the 7882 cm�1 band, and not for O2
retrievals from the Si diode detector in the 13095 cm�1
A-band, we believe that this is due to detector nonlinearityand can be corrected. We expect that this error affects theCO2 and O2 retrievals similarly, but for now assume that thecolumn CO2/column O2 ratio may also have a systematicerror of 0.3% over the observation period.[45] The measurement precision of �0.1% under clear
sky and �0.2% under partly cloudy conditions does notaffect the accuracy of the measurements. However, spec-troscopic errors introduce a systematic bias which dependson air mass. We have calibrated the FTS column retrievalsat air mass 1.1–2.0 during July to August 2004, and expectthat the absolute accuracy at these air masses has been
Figure 6. Integrated profiles by the DC-8 (triangles) andKing Air (circles) compared to FTS retrievals from the twoCO2 bands. CO2 6228 cm�1 band retrievals are solid; CO2
6348 cm�1 band retrievals are shaded. Each integratedaircraft profile has been divided by the dry surface pressure,yielding the familiar units of ppmv. The relationshipbetween integrated profile and FTS column-average CO2
VMR is linear for each band. A linear fit with intercept 0gives slopes of 1.0216 for the CO2 6228 cm�1 band and1.0240 for the CO2 6348 cm
�1 band. The top plot shows thedifference between the FTS measurements and the fittedline.
D22305 WASHENFELDER ET AL.: COLUMN CO2 AT WISCONSIN TALL TOWER SITE
9 of 11
D22305

maintained within 0.3% throughout the subsequent datarecord.
8. Column-Average CO2 VMR During May 2004to October 2005
[46] Applying the slope corrections from section 6 allowsthe FTS column-average CO2 VMR to be compared directlyto in situ CO2 measurements. Column-average CO2 VMR,corrected in this manner, is shown in Figure 7a, togetherwith in situ CO2 measurements from 30 m and 396 m on theTall Tower. The in situ CO2 measurements are influenced bythe diurnal rectifier effect, which is caused by the overnightdecrease in the height of the planetary boundary layer.During the day, CO2 surface fluxes are diluted within athicker boundary layer, while CO2 surface fluxes at night
are concentrated near the surface. The column-average CO2
VMR is minimally influenced by the diurnal rectifier effect.Summertime drawdown in CO2 is observed in both the insitu and column measurements.[47] The seasonal cycle of column-average CO2 VMR
observed at Park Falls during May 2004 to October 2005 isshown as daily averages for air masses between 2 and 4(SZA 60–75�) in Figure 7b. In situ CO2 measurementsfrom the Tall Tower are shown as daily averages between1600–2000 UT (1000–1400 CST). As expected, the var-iation of CO2 is muted in the column, as compared tosurface measurements, on all timescales. During May 2004to May 2005, the observed peak-to-peak variation ofcolumn-average CO2 VMR is approximately 13 ppmv, withan average value of 376.2 ppmv. Comparing column-average CO2 retrievals observed in September and Octoberduring 2004 and 2005, we calculate a secular increase of1.8 ppmv yr�1. After accounting for this, we infer a peak-to-peak seasonal amplitude of 11 ppmv for Park Falls.These results are higher than model results by Olsen andRanderson [2004], which predict a mean seasonal columnCO2 amplitude of 7–8 ppmv in Wisconsin. This differencecould potentially arise from an error in the model predic-tions, because of uncertainty in the specifications of surfacefluxes or errors in the parameterization of mixing. Alterna-tively, the difference could be caused by differencesbetween the assumed meteorology and emission inventoriesincluded in the MATCH model.
9. Conclusions
[48] We have deployed an automated solar observatory toPark Falls, Wisconsin. Near-infrared solar absorptionspectra have been acquired continuously since May 2004.Short-term and long-term precision are evaluated by therepeatability of column retrievals within a day and by thecomparison of column O2 with surface pressure measure-ments. The precision of retrieved column CO2 under clear-sky conditions is�0.1%, as determined by the 1s variabilityof retrievals recorded within 1 hour. Under partly cloudyconditions, the CO2 column precision is much worse, butcan be improved by dividing column CO2 by column O2 tocalculate column-average CO2 VMR. This calculation elim-inates errors which are common to both CO2 and O2
retrievals, such as errors in solar pointing and variation insolar intensity during interferogram acquisition, and allowsuseful retrievals to be obtained under partly cloudy con-ditions. Comparison of retrieved column O2 to dry surfacepressure during May 2004 to October 2005 shows linearagreement with a 2.27 ± 0.25% bias.[49] The column CO2 retrievals were calibrated using
aircraft profiles from the INTEX-NA and COBRA cam-paigns during summer 2004. The CO2 6228 cm�1 and CO2
6348 cm�1 band retrievals overestimate the integrated air-craft profiles by factors of 1.0216 and 1.0240 respectively,with standard deviation of the fitting residuals of 0.39 ppmvand 0.42 ppmv. The systematic differences are attributedto known uncertainty in the CO2 spectroscopic line strengthsand air-broadened width parameters. The comparison toaircraft integrated columns allows the CO2 6228 cm�1 andCO2 6348 cm�1 retrievals to be corrected to the accepted insitu calibration scale. The aircraft profiles were performed
Figure 7. (a) Diurnal variation of column-average CO2
VMR (solid symbols) and Tall Tower CO2 at 30 m (solidline) and 396 m (shaded line). (b) Seasonal cycle of column-average CO2 VMR (solid symbols) and Tall Tower CO2
(shaded symbols) during May 2004 to October 2005. TallTower CO2 at 396 m is shown as daily averages between1000 and 1400 CST. Column-average CO2 VMR is shownas daily averages for air masses 2–4 (SZA 60–75�).
D22305 WASHENFELDER ET AL.: COLUMN CO2 AT WISCONSIN TALL TOWER SITE
10 of 11
D22305

with the Sun at air mass 1.1–2.0, and we are confident thatour column-average CO2 VMRs are now well calibrated forthese summertime, low air mass values. After calibration ofthe column retrievals with the integrated aircraft profilesand consideration of the complete error budget, we calculatethe uncertainty in retrieved column-average CO2 VMR to be�0.3% (±1.1 ppmv) at air masses less than 2 (SZA lessthan 60�) throughout the measurement time series.
[50] Acknowledgments. We thank Jeffrey Ayers for maintaining theground-based FTS laboratory in Park Falls, Wisconsin. We thank ArlynAndrews and the NOAA CCGG for providing WLEF Tall Tower CO2
measurements. Bruce Daube thanks Victoria Chow and Bhaswar Sen fortheir support in obtaining the balloon CO2 profile. We thank Andrew Orr-Ewing for helpful discussions and providing PGOPHER model results forthe O2 7882 cm�1 band. R.A.W. acknowledges support from the NationalScience Foundation and the California Institute of Technology. This workwas funded by NASA grant NAG5-12247 and NNG05-GD07G. Researchat the Jet Propulsion Laboratory, California Institute of Technology, isperformed under contract with NASA.
ReferencesAnderson, B. E., G. L. Gregory, J. E. Collins, G. W. Sachse, T. J. Conway,and G. P. Whiting (1996), Airborne observations of spatial and temporalvariability of tropospheric carbon dioxide, J. Geophys. Res., 101,1985–1997.
Bakwin, P. S., P. P. Tans, C. L. Zhao, W. Ussler, and E. Quesnell(1995), Measurements of carbon dioxide on a very tall tower, Tellus,47, 535–549.
Bakwin, P. S., P. P. Tans, B. B. Stephens, S. C. Wofsy, C. Gerbig, andA. Grainger (2003), Strategies for measurement of atmospheric columnmeans of carbon dioxide from aircraft using discrete sampling, J. Geo-phys. Res., 108(D16), 4514, doi:10.1029/2002JD003306.
Berger, B. W., K. J. Davis, C. X. Yi, P. S. Bakwin, and C. L. Zhao (2001),Long-term carbon dioxide fluxes from a very tall tower in a northernforest: Flux measurement methodology, J. Atmos. Oceanic Technol., 18,529–542.
Brault, J. W. (1996), New approach to high-precision Fourier transformspectrometer design, Appl. Opt., 35, 2891–2896.
Cheah, S. L., Y. P. Lee, and J. F. Ogilvie (2000), Wavenumbers, strengths,widths and shifts with pressure of lines in four bands of gaseous 16O2 inthe systems a1Dg � X3 Sg
� and b1 Sg+ � X3 Sg
�, J. Quant. Spectrosc.Radiat. Transfer, 64, 467–482.
Daube, B. C., K. A. Boering, A. E. Andrews, and S. C. Wofsy (2002), Ahigh-precision fast-response airborne CO2 analyzer for in situ samplingfrom the surface to the middle stratosphere, J. Atmos. Oceanic Technol.,19, 1532–1543.
Davis, K. J., P. S. Bakwin, C. X. Yi, B. W. Berger, C. L. Zhao, R. M.Teclaw, and J. G. Isebrands (2003), The annual cycles of CO2 and H2Oexchange over a northern mixed forest as observed from a very tall tower,Global Change Biol., 9, 1278–1293.
Denning, A. S., G. J. Collatz, C. G. Zhang, D. A. Randall, J. A. Berry, P. J.Sellers, G. D. Colello, and D. A. Dazlich (1996), Simulations of terres-trial carbon metabolism and atmospheric CO2 in a general circulationmodel: 1. Surface carbon fluxes, Tellus, 48, 521–542.
Dufour, E., F. Breon, and P. Peylin (2004), CO2 column averaged mixingratio from inversion of ground-based solar spectra, J. Geophys. Res., 109,D09304, doi:10.1029/2003JD004469.
GLOBALVIEW-CO2 (2005), GLOBALVIEW-CO2: Cooperative Atmo-spheric Data Integration Project –Carbon Dioxide [CD-ROM], GlobalMonit. Div., NOAA Earth Syst. Res. Lab., Boulder, Colo.
Gloor, M., S. M. Fan, S. Pacala, and J. Sarmiento (2000), Optimal samplingof the atmosphere for purpose of inverse modeling: A model study,Global Biogeochem. Cycles, 14, 407–428.
Gurney, K. R., et al. (2002), Towards robust regional estimates of CO2
sources and sinks using atmospheric transport models, Nature, 415,626–630.
Komhyr, W. D., R. H. Gammon, T. B. Harris, L. S. Waterman, T. J. Conway,W. R. Taylor, and K. W. Thoning (1985), Global atmospheric CO2 dis-tribution and variations from 1968–1982 NOAA GMCC CO2 flask sam-ple data, J. Geophys. Res., 90, 5567–5596.
Kurylo, M. J., and S. Solomon (1990), Network for the Detection of Strato-spheric Change, NASA report, Code EEU, Washington, D. C.
Lafferty, W. J., A. M. Solodov, C. L. Lugez, and G. T. Fraser (1998),Rotational line strengths and self-pressure-broadening coefficients forthe 1.27-mm, a1 Dg � X3 Sg
�, n = 0-0 band of O2, Appl. Opt., 37,2264–2270.
Newman, S. M., I. C. Lane, A. J. Orr-Ewing, D. A. Newnham, andJ. Ballard (1999), Integrated absorption intensity and Einstein coefficientsfor the O2 a1 Dg � X3 Sg
� (0,0) transition: A comparison of cavityringdown and high resolution Fourier transform spectroscopy with along-path absorption cell, J. Chem. Phys., 110, 10,749–10,757.
Newman, S. M., A. J. Orr-Ewing, D. A. Newnham, and J. Ballard (2000),Temperature and pressure dependence of line widths and integrated ab-sorption intensities for the O2 a1 Dg � X3 Sg
� (0,0) transition, J. Phys.Chem., 104, 9467–9480.
Olsen, S. C., and J. T. Randerson (2004), Differences between surface andcolumn atmospheric CO2 and implications for carbon cycle research,J. Geophys. Res., 109, D02301, doi:10.1029/2003JD003968.
Rayner, P. J., and D. M. O’Brien (2001), The utility of remotely sensed CO2
concentration data in surface source inversions, Geophys. Res. Lett., 28,175–178.
Rayner, P. J., I. G. Enting, R. J. Francey, and R. Langenfelds (1999),Reconstructing the recent carbon cycle from atmospheric CO2, d
13Cand O2/N2 observations, Tellus, 51, 213–232.
Rodgers, C. D., and B. J. Connor (2003), Intercomparison of remotesounding instruments, J. Geophys. Res., 108(D3), 4116, doi:10.1029/2002JD002299.
Rothman, L. S., et al. (2005), The HITRAN 2004 molecular spectroscopicdatabase, J. Quant. Spectrosc. Radiat. Transfer, 96, 139–204.
Smith, K. M., and D. A. Newnham (2000), Near-infrared absorption crosssections and integrated absorption intensities of molecular oxygen (O2,O2-O2, and O2-N2), J. Geophys. Res., 105, 7383–7396.
Smith, K. M., D. A. Newnham, and R. G. Williams (2001), Collision-induced absorption of solar radiation in the atmosphere by molecularoxygen at 1.27 mm: Field observations and model calculations, J. Geo-phys. Res., 106, 7541–7552.
Tans, P. P., I. Y. Fung, and T. Takahashi (1990), Observational constraintson the global atmospheric CO2 budget, Science, 247, 1431–1438.
Toth, R. A., L. R. Brown, C. E. Miller, V. M. Devi, and D. C. Benner(2006a), Line strengths of 12C16O2: 4550–7000 cm
�1, J. Mol. Spectrosc.,in press.
Toth, R. A., L. R. Brown, C. E. Miller, V. M. Devi, and D. C. Benner(2006b), Self-broadened widths and shifts of 12C16O: 4750–7000 cm�1,J. Mol. Spectrosc., in press.
Vay, S. A., et al. (2003), Influence of regional-scale anthropogenic emis-sions on CO2 distributions over the western North Pacific, J. Geophys.Res., 108(D20), 8801, doi:10.1029/2002JD003094.
Warneke, T., Z. Yang, S. Olsen, S. Korner, J. Notholt, G. C. Toon, V. Velazco,A. Schulz, and O. Schrems (2005), Seasonal and latitudinal variations ofcolumn averaged volume-mixing ratios of atmospheric CO2, Geophys.Res. Lett., 32, L03808, doi:10.1029/2004GL021597.
Yang, Z., G. C. Toon, J. S. Margolis, and P. O. Wennberg (2002), Atmo-spheric CO2 retrieved from ground-based near IR solar spectra, Geophys.Res. Lett., 29(9), 1339, doi:10.1029/2001GL014537.
Yang, Z., P. O. Wennberg, R. P. Cageao, T. J. Pongetti, G. C. Toon, andS. P. Sander (2005), Ground-based photon path measurements fromsolar absorption spectra of the O2 A-band, J. Quant. Spectrosc. Radiat.Transfer, 90, 309–321.
Zhao, C. L., P. S. Bakwin, and P. P. Tans (1997), A design for unattendedmonitoring of carbon dioxide on a very tall tower, J. Atmos. OceanicTechnol., 14, 1139–1145.
�����������������������N. T. Allen, B. C. Daube, and D. M. Matross, Division of Engineering
and Applied Sciences, Harvard University, Cambridge, MA 02138, USA.J.-F. Blavier and G. C. Toon, NASA Jet Propulsion Laboratory,
California Institute of Technology, Pasadena, CA 91109, USA.S. A. Vay, NASA Langley Research Center, Hampton, VA 23681, USA.R. A. Washenfelder, Chemical Sciences Division, NOAA, Boulder, CO
80305, USA. ([email protected])P. O. Wennberg, Division of Engineering and Applied Science, California
Institute of Technology, Pasadena, CA 91125, USA.Z. Yang, Division of Geological and Planetary Sciences, California
Institute of Technology, Pasadena, CA 91125, USA.
D22305 WASHENFELDER ET AL.: COLUMN CO2 AT WISCONSIN TALL TOWER SITE
11 of 11
D22305