utilizing promoter pair orientations for hmm-based analysis of chip-chip data
TRANSCRIPT
Utilizing promoter pair orientations for HMM-basedanalysis of ChIP-chip data
Michael Seifert1, Jens Keilwagen1, Marc Strickert1, and Ivo Grosse2
1Leibniz Institute of Plant Genetics and Crop Plant Research, Gatersleben, Germany2Martin Luther University, Institute of Computer Science, Halle, Germany
Abstract: Array-based analysis of chromatin immunoprecipitation data (ChIP-chip)is a powerful technique for identifying DNA target regions of individual transcrip-tion factors. Here, we present three approaches, a standard log-fold-change analy-sis (LFC), a basic method based on a Hidden Markov Model (HMM), and an ex-tension of the HMM approach to an HMM with scaled transition matrices (SHMM)to incorporate different promoter pair orientations. We compare the prediction ofABI3 target genes for the three methods and evaluate these genes using Geneves-tigator expression profiles and transient assays. We find that the application of theSHMM leads to a superior identification of ABI3 target genes. The software andthe ChIP-chip data set used in our case study can be downloaded from http://dig.ipk-gatersleben.de/SHMMs/ChIPchip/ChIPchip.html.
1 Introduction
In recent years, array-based analysis of chromatin immunoprecipitation data (ChIP-chip)has become a powerful technique to identify DNA target regions of individual transcrip-tion factors. ChIP-chip was firstly applied to yeast by [RRW+00] and [IHS+01] basedon promoter arrays. Nowadays, with the availability of sequenced genomes, ChIP-chip ismostly based on tiling arrays [JLG+08]. The analysis of ChIP-chip data is challengingbecause of the huge data sets containing thousands of hybridization signals. Most of theavailable methods focus on the analysis of ChIP-chip tiling array data. Examples includea moving average method by [KvdLDC04], a Hidden Markov Model (HMM) approach by[LML05], or TileMap by [JW05] including both approaches.RegardingA. thaliana, ChIP-chip is still far from being used routinely. In the trilateralproject ARABIDOSEED, ChIP-chip based on promoter arrays was established for theseed-specific transcription factor ABI3. ABI3 is one of the fundamental regulators of seeddevelopment that is involved in controlling chlorophyll degradation, storage product accu-mulation, and desiccation tolerance [VCC05].Here, we describe and compare three methods for the detection of transcription factortarget genes from ChIP-chip data. The first method, which we abbreviate by LFC, is a

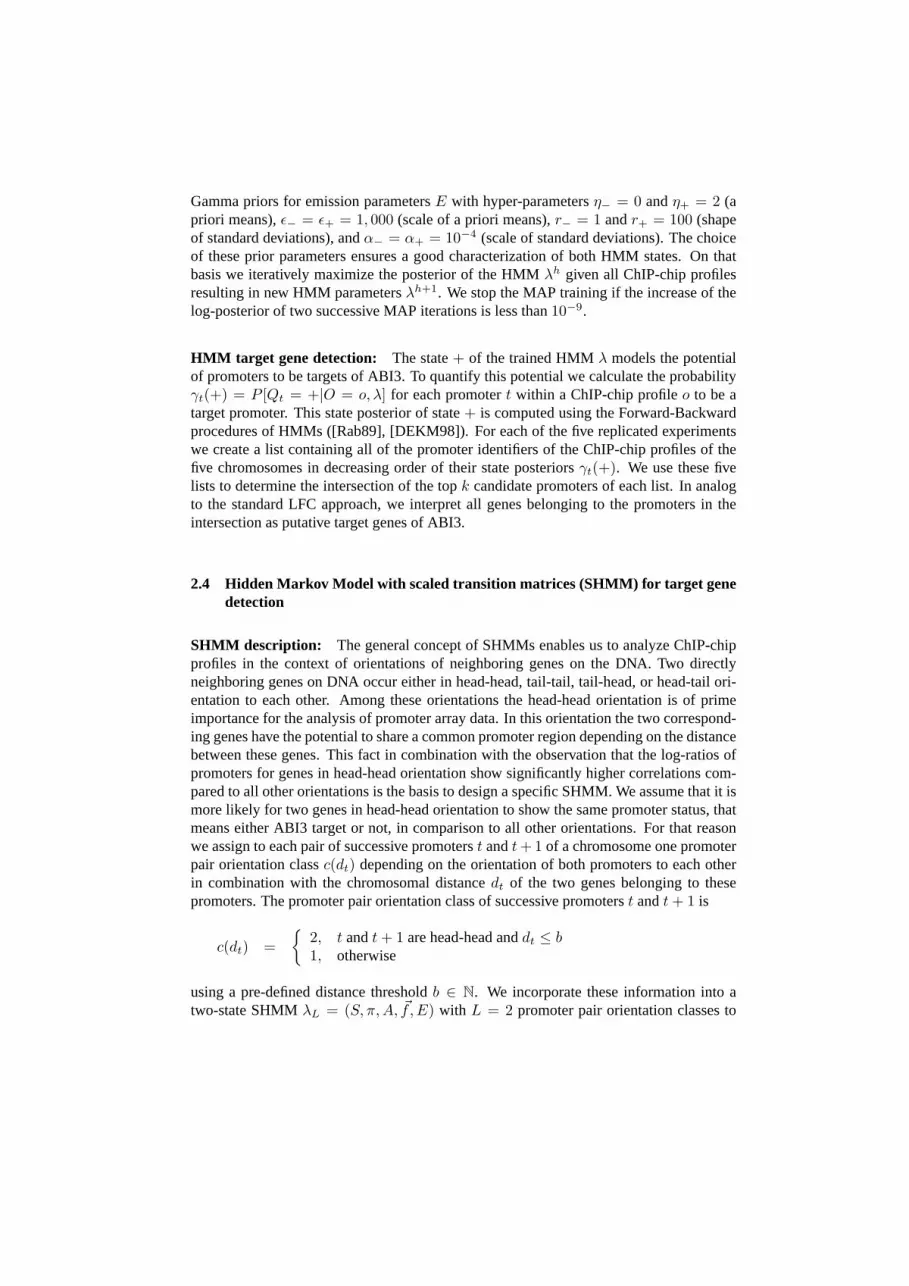
standard log-fold change analysis in which the genes belonging to the promoters with thehighest log-fold changes in the intersection of repeated experiments are considered to beputative target genes. The second method is based on a two-state (target promoter stateand non-target promoter state) HMM. The principle architecture of the HMM follows theproposed two-state architecture by [LML05]. Our approach is extended in that way thatall HMM parameters are directly learned from the ChIP-chip data. The HMM scores allpromoters by the probability of being in the target promoter state, and we consider allgenes belonging to promoters with the highest scores in the intersection of repeated ex-periments as putative target genes. The HMM allows statistical dependencies betweenChIP-chip measurements of adjacent promoters along the chromosomes. The existenceof such dependencies is clearly shown for ChIP-chip data of ABI3 in Fig. 1. We findthat adjacent promoters in head-head orientation show significantly greater correlationsthan promoter pairs in head-tail, tail-head, or tail-tail orientation. The high correlationsin ChIP-chip measurements of head-head promoter pairs can be explained by the arraydesign: since proximal promoters but not complete intergenic regions are spotted. Thus,high positive correlations of measurements for head-head promoter pairs result from DNAsegments of the intergenic region that bind to both promoter spots, or fragments of thesesegments where some of them bind to the one spot while the others bind to the other spot.The observation of correlations between ChIP-chip measurements of adjacent promotersmotivates the extension of the HMM approach to an HMM with scaled transition matrices(SHMM). The general concept of SHMMs was developed by [Sei06] and applied to theanalysis of tumor expression data by exploiting chromosomal distances of adjacent genesyielding to an improved detection of over-expressed and under-expressed genes. Here,we use this concept for discriminating head-head promoter pairs from other promoter pairorientations. The key assumption is that it is more likely for promoters in head-head ori-entation that both promoters are either target promoters or non-target promoters comparedto other promoter orientations.We use an ABI3 ChIP-chip data set for comparing the prediction of ABI3 target genes bythe LFC, the HMM, and the SHMM method. We evaluate putative ABI3 target genes using(i) publicly available expression data from Genevestigator [ZHHHG04] and (ii) transientassays to test whether a putative target promoter is controlled by ABI3.In general, good introductions to HMMs are given by [Rab89] or [DEKM98], extensionsof standard HMMs to HMMs with transition matrices are described in [KSSW03], andsome more details to SHMMs can be found in [Sei06]. A concept similar to SHMMs hasbeen developed by [MD04] with an application to gene prediction.
2 Methods
2.1 Data acquisition and pre-processing
To determine target genes of the ABI3 transcription factor the ChIP-chip technique by[RRW+00] and [IHS+01] was applied toA. thalianawildtype seeds. Isolated DNA frag-ments bound by ABI3 were amplified, radio-labeled, and hybridized to a macroarray con-

3'3'5'5'
head-head tail-tail tail-head head-tail
Direct Neighboring Gene Distance
Cor
rela
tion
3Kbp 5Kbp 7Kbp 9Kbp
−0.2
0.0
0.2
0.4
0.6
0.8
Figure 1: Pearson’s correlations for the four promoter pair orientations based on log-ratios ofABI3 ChIP-chip experiments in steps of250bp within the corresponding gene pair distance inter-val [3, 10]Kbp. A triangle represents a promoter and the orientation of its tip describes the readingdirection of the gene belonging to this promoter.
taining 11,904 promoters ofA. thaliana. The corresponding control sample was obtainedfrom the input chromatin of the wildtype seeds by fragmentation, amplification, labeling,and hybridization to another promoter macroarray. In total, each of these two experimentswas repeated five times. In a first normalization step, we center the median of each ex-periment to zero and perform a quantile normalization [BIAS03] separately for the ABI3ChIP-chip experiments and the control experiments. In a second step, we combine eachnormalized ABI3 ChIP-chip experiment with its corresponding control experiment by cal-culating the log-ratioot = IABI3(t) − IControl(t) for all promoterst, whereIABI3(t) isthelog2-signal intensity of promotert in the ABI3 ChIP-chip experiment, andIControl(t)is thelog2-signal intensity of promotert in the control experiment. We map all of the log-ratios of such an experiment combination to their corresponding positions in the genomeof A. thalianabased on the TAIR7 genome annotation, resulting in one ChIP-chip profileo = o1, . . . , oT per chromosome. AsA. thalianahas five chromosomes25 ChIP-chipprofiles were obtained from the five replicates.
2.2 Standard Log-Fold-Change analysis (LFC) for target gene detection
The log-ratio of a promoter characterizes the potential of the gene belonging to this pro-moter to be a target gene of the ABI3 transcription factor. Thus, we expect that putativeABI3 target genes have log-ratios that are significantly greater than zero in repeated ex-periments. For each of the five replicated experiments, we create a list containing all ofthe promoter identifiers of the ChIP-chip profiles of the five chromosomes in decreasingorder of their log-ratios. That is, promoters with log-ratios significantly greater than zeroare at the top of this list. We use these five lists to determine the intersection of the top

k candidate promoters of each list. This proceeding allows to assess the degree of repro-ducibility between the five replicates. We interpret all genes belonging to the promoters inthe intersection as putative target genes of ABI3.
2.3 Hidden Markov Model (HMM) for target gene detection
HMM description: We use a two-state HMMλ = (S, π,A,E) with Gaussian emissiondensities for the genome-wide detection of putative ABI3 target genes. The basis of thisHMM is the set of statesS = {−,+}. State− corresponds to a promoter that is not atarget of ABI3, and state+ corresponds to a promoter that is a target of ABI3. We denotethe state of promotert by qt ∈ S, and we assume that a state sequenceq = q1, ..., qT
belonging to a ChIP-chip profileo is generated by a homogeneous Markov model of order1 with start distributionπ = (π−, π+) and stochastic transition matrixA = (aij)i,j∈S
whereπ−, a−−, a++ ∈ (0, 1), π+ = 1 − π−, a−+ = 1 − a−−, anda+− = 1 − a++.The state sequence is assumed to be not observable, i.e. hidden, and the log-ratioot ofpromotert is assumed to be drawn from a Gaussian emission density, whose mean andstandard deviation depend on stateqt. We denote the vector of emission parameters byE = (µ−, µ+, σ−, σ+) with meansµ− andµ+, and standard deviationsσ− andσ+ forthe Gaussian emission densitybi(ot) = 1/(
√2πσi) exp(−0.5(ot − µi)2/σ2
i ) of log-ratioot given statei ∈ S.
HMM initialization: In general, an initial HMM has to discriminate ABI3 target pro-moters from non-target promoters with respect to their log-ratios in the ChIP-chip profile.Hence, a histogram of log-ratios of all five replicates helps to find good initial HMM pa-rameters. The choice of initial parameters addresses the presumptions that the proportionof non-target promoters is much higher than that of target promoters, and that the num-ber of successive non-target promoters is also much higher than the number of successivetarget promoters. In our case study we useπ− = 0.9 resulting in an initial start distri-bution π = (0.9, 0.1). Thus, we choose an initial transition matrixA with equilibriumdistributionπ. That is, we seta−− = 1 − s/π− anda++ = 1 − s/π+ with respect tothe scale parameters = 0.05 to control the state durations. We characterize the states byproper means and standard deviations using initial emission parametersµ− = 0, µ+ = 2,σ− = 1, andσ+ = 0.5. We refer to the initial HMM byλ1.
HMM training: We train the initial HMM based on all ChIP-chip profiles using amaximum a posteriori (MAP) variant of the standard Baum-Welch algorithm ([Rab89],[DEKM98]). This algorithm is part of the class of EM algorithms ([DLR77]), which it-eratively maximize their optimization function. With respect to the underlying biologicalquestion, the choice of the prior influences the quality of the trained HMM. We includebiological a priori knowledge into the MAP training using a Dirichlet prior with hyper-parametersϑ− = ϑ+ = 2 for start distributionπ, a product of Dirichlet priors withhyper-parametersϑab = 1 with a, b ∈ S for transition matrixA, and a product of Normal-
Gamma priors for emission parametersE with hyper-parametersη− = 0 andη+ = 2 (apriori means),ε− = ε+ = 1, 000 (scale of a priori means),r− = 1 andr+ = 100 (shapeof standard deviations), andα− = α+ = 10−4 (scale of standard deviations). The choiceof these prior parameters ensures a good characterization of both HMM states. On thatbasis we iteratively maximize the posterior of the HMMλh given all ChIP-chip profilesresulting in new HMM parametersλh+1. We stop the MAP training if the increase of thelog-posterior of two successive MAP iterations is less than10−9.
HMM target gene detection: The state+ of the trained HMMλ models the potentialof promoters to be targets of ABI3. To quantify this potential we calculate the probabilityγt(+) = P [Qt = +|O = o, λ] for each promotert within a ChIP-chip profileo to be atarget promoter. This state posterior of state+ is computed using the Forward-Backwardprocedures of HMMs ([Rab89], [DEKM98]). For each of the five replicated experimentswe create a list containing all of the promoter identifiers of the ChIP-chip profiles of thefive chromosomes in decreasing order of their state posteriorsγt(+). We use these fivelists to determine the intersection of the topk candidate promoters of each list. In analogto the standard LFC approach, we interpret all genes belonging to the promoters in theintersection as putative target genes of ABI3.
2.4 Hidden Markov Model with scaled transition matrices (SHMM) for target genedetection
SHMM description: The general concept of SHMMs enables us to analyze ChIP-chipprofiles in the context of orientations of neighboring genes on the DNA. Two directlyneighboring genes on DNA occur either in head-head, tail-tail, tail-head, or head-tail ori-entation to each other. Among these orientations the head-head orientation is of primeimportance for the analysis of promoter array data. In this orientation the two correspond-ing genes have the potential to share a common promoter region depending on the distancebetween these genes. This fact in combination with the observation that the log-ratios ofpromoters for genes in head-head orientation show significantly higher correlations com-pared to all other orientations is the basis to design a specific SHMM. We assume that it ismore likely for two genes in head-head orientation to show the same promoter status, thatmeans either ABI3 target or not, in comparison to all other orientations. For that reasonwe assign to each pair of successive promoterst andt + 1 of a chromosome one promoterpair orientation classc(dt) depending on the orientation of both promoters to each otherin combination with the chromosomal distancedt of the two genes belonging to thesepromoters. The promoter pair orientation class of successive promoterst andt + 1 is
c(dt) ={
2, t andt + 1 are head-head anddt ≤ b1, otherwise
using a pre-defined distance thresholdb ∈ N. We incorporate these information into atwo-state SHMMλL = (S, π,A, ~f, E) with L = 2 promoter pair orientation classes to

detect putative ABI3 target genes. The parametersS, π, A, andE are defined like in theHMM approach, and~f = (f1 := 1, f2) with f2 ∈ R+ andf2 > f1 is the vector ofscaling factors. In contrast to the standard HMM approach, we now assume that the statesequenceq of a ChIP-chip profileo is generated by an inhomogeneous Markov model oforder1 with start distributionπ and two scaled stochastic transition matricesA1 andA2 fordiscriminating head-head orientations from others based on the promoter pair orientationclasses. The transition matrixAl with l ∈ {1, 2} is defined by
Al =1fl
(a−− − 1 + fl a−+
a+−, a++ − 1 + fl
)with respect to the scaling factorfl that scales the expected state duration of statei ∈ S inA from 1/(1−aii) to fl/(1−aii) in Al. A transition from stateqt to stateqt+1 is achievedby using the corresponding transition matrixAc(dt) based on the integrated promoter pairorientation classc(dt). The self-transition probability of each statei ∈ S increases strictlyfrom matrixA1 to A2, and thus, for a head-head promoter pair that is modeled byA2 itis more likely that both promoters are targets or no targets of ABI3 compared to otherpromoter pairs modeled byA1. The log-ratios of promoters are modeled as described inthe HMM approach.
SHMM initialization: The basic initialization of the SHMM is done like for the HMM.In addition to that, we must choose a distance thresholdb for the promoter pair orientationclasses and a scaling factorf2 to specify the degree of differentiation between head-headorientation modeled byA2 and all others modeled byA1. Motivated by Fig. 1 we alwaysuseb = 9Kbp in our case study because in greater chromosomal distance the correlationsof head-head promoter pairs do not significantly differ from others. Moreover, we considerall f2 from 1.1 to 10 in steps of0.1.
SHMM training: The SHMM is trained like the HMM using the MAP variant of theBaum-Welch algorithm with identical prior hyper-parameters. The only difference be-tween both models occurs during the estimation of their transition matrices. Details of theparameter estimation are described by [Sei06].
SHMM target gene detection: The putative target genes of ABI3 are determined in ana-log to the HMM approach. The calculation of the state posteriorγt(+) is now done withrespect to the promoter pair orientation classes using the Forward-Backward proceduresof HMMs.

3 Results and discussion
3.1 Study of differences between HMM and SHMMs
The HMM approach enables us to analyze ChIP-chip data in the context of chromosomallocations of promoters, and the application of SHMMs extends this analysis by discrim-inating different types of promoter pair orientations. In a first study, we investigate howSHMMs behave compared to the standard HMM. For that reason, we use the Viterbi algo-rithm ([Rab89], [DEKM98]) to compare the most likely state sequenceq for a ChIP-chipprofile o under the trained HMM to that of all trained SHMMs with scaling factorf2 in-creasing from1.1 to 10 in steps of0.1. Here, the annotation of a promotert with log-ratioot is given byqt ∈ S, which we interpret as this promoter is either a putative ABI3 targetor not. The scaling factor allows to directly influence the annotation behavior for head-head promoters. That is, the higherf2 the more likely it is that both promoters of suchhead-head pairs are either putative ABI3 targets or not, and the closer we choosef2 to onethe closer is the annotation behavior of the SHMM to that of the HMM. The results areillustrated in Fig. 2a. We observe that the number of head-head promoter pairs where bothpromoters of such a pair have identical annotations increases for increasing scaling factorf2, and as consequence the number of head-head promoter pairs where both promoters ofsuch a pair have different annotations decreases. Obviously, each change in the annotationof a head-head promoter pair leads either to a change in the annotation of the upstream,downstream, or both of these promoter pairs. We see that the number of non-head-headpromoter pairs where both promoters of such a pair are annotated as putative ABI3 tar-gets decreases only slightly for SHMMs with increasing scaling factorf2 compared tothe HMM. We clearly see substantially more decrease in the number of non-head-headpromoter pairs where both promoters of such a pair are annotated as putative non-targetpromoters for SHMMs with increasing scaling factorf2 in relation to the HMM. Conse-quently, the number of non-head-head promoter pairs where both promoters of such a pairhave different annotations increases with increasing scaling factorf2. This study demon-strated that the annotation results of SHMMs can differ significantly from that of the HMMresulting in a more general model for the prediction of putative target genes.
3.2 Comparison of LFC, HMM, and SHMM to predict ABI3 target promoters
We use the LFC method for scoring putative ABI3 target promoters based on the log-ratiosof the promoters neglecting chromosomal locations and promoter pair orientations. Forcomparison, we make use of the HMM that models chromosomal locations of promotersand the SHMM that models chromosomal locations and orientations of promoter pairswhereas both methods score putative ABI3 target promoters via the state posterior of state+. In this comparison study we set the threshold for the maximal number of candidatesin a top list to200 because the mean log-ratio of1.06 at this level is already relativelysmall, and beyond, at a threshold of300 we did not get new putative ABI3 target genes bythe three methods. Moreover, we use the SHMM with scaling factorf2 = 4 in all further

analyses because this model is already quite different from the standard HMM (Fig. 2a),and the comparison of this model to SHMMs with scaling factorf2 = 6 andf2 = 10yielded identical target promoters. For each approach, we score all five experiments todetermine the intersection of putative ABI3 target promoters for the top50, 100, 150 and200 candidates under these experiments. Then, we use Venn diagrams to directly comparethe candidate promoters for these four top lists under all three methods. The results areshown in Fig. 2b. We observe that the SHMM predicted the greatest number of putativeABI3 target promoters, whereas the LFC method predicted the smallest number. Whenwe consider the Venn diagrams from the top100 list to the top200 list all candidates thatare predicted by the LFC method are also completely predicted by both the HMM and theSHMM. In addition to this, the candidates additionally predicted by the HMM from thetop 150 list to the top200 list are completely predicted by the SHMM. In summary, thisemphasizes that the SHMM approach tends to be more general in the prediction of putativeABI3 target promoters than the HMM and the LFC approach.
a)
−30 −20 −10 0 10 20 30
HM
MS
HM
M(1
.5)
SH
MM
(2.0
)S
HM
M(2
.5)
SH
MM
(3.0
)S
HM
M(3
.5)
SH
MM
(4.0
)S
HM
M(4
.5)
SH
MM
(5.0
)S
HM
M(5
.5)
SH
MM
(6.0
)S
HM
M(6
.5)
SH
MM
(7.0
)S
HM
M(7
.5)
SH
MM
(8.0
)S
HM
M(8
.5)
SH
MM
(9.0
)S
HM
M(9
.5)
SH
MM
(10)
++
−−
+−/−+
++
−−
+−/−+
head
−he
adno
n−he
ad−
head
b)
Top 50LFC HMM
SHMM(4.0)
0
2
0
1
0
0
3
Top 100LFC HMM
SHMM(4.0)
3
1
1
0
0
0
8
Top 150LFC HMM
SHMM(4.0)
2
0
4
0
1
0
10
Top 200LFC HMM
SHMM(4.0)
6
0
3
0
0
0
13
Figure 2:a): Frequencies of promoter pair annotations of the trained SHMM(f2) with scaling factorf2 ∈ [1.1, 10] in steps of0.1 in relation to the trained HMM based on Viterbi annotations. Thegrey gradient in the upper part expresses the quantity of annotation differences whereas the HMM isencoded by the grey with value zero. The annotations++, −−, and+ − / − + of promoter pairsmean that either both promoters are putative targets, non-targets, or only one promoter is a putativetarget of ABI3.b): Venn diagrams to compare putative ABI3 target promoters predicted by the LFCmethod, the trained HMM, and the trained SHMM(4.0).
3.3 Gene expression analysis of putative ABI3 target genes belonging to predictedABI3 target promoters
Next we investigate how putative target genes are regulated by ABI3. Therefore, we useGenevestigator [ZHHHG04] as independent source ofA. thalianagene expression datato analyze putative target genes. In Genevestigator, ABI3 is mainly expressed within thecategories inflorescence, silique, and seed. Based on that, we quantify the expression of allputative target genes by dividing the sum of expression values within these three categories

by the sum of expression values in all categories. This provides a quantitative measure,which we call Genevestigator score, for analyzing how a putative ABI3 target gene fol-lows the expression profile of ABI3. Additionally, transient assays have been performedto test whether putative target promoters in fusion with the glucuronidase (GUS) reportergene react on ABI3. The results are shown in Tab. 1. Calculating the Genevestigatorscore,16 of 22 putative target genes show significantly high scores at the level of the 95%-quantile0.15 based on the distribution of the Genevestigator scores for 1,000 randomlyselected genes. The promoters of these16 genes have been tested in transient assays, andwe find that15 of these promoters can activate the GUS expression through ABI3, and thepromoter of gene T21 shows nearly a two-fold repression of the GUS expression. Interest-ingly, the genes T21 and T22 are in head-head orientation to each other, and so they havethe potential to share a common promoter region. Based on the results of the transientassays the first gene might be repressed while the second is activated. Hence, it seemsthat activation and repression signals can be transmitted by ABI3 to these two target genesin head-head orientation via a potential common promoter region. Additionally, we pointout that only the SHMM approach was able to predict3 of these15 target genes activatedby ABI3 and the one target gene repressed by ABI3. In contrast to these16 target genes,the 6 remaining putative target genes do not significantly differ in their Genevestigatorscores at the level of the 5%-95%-quantile range[0.02, 0.15] based on the distribution ofthe Genevestigator scores for the 1,000 randomly selected genes. Interestingly,5 of these6 putative target genes are in head-head orientation to one of the previous target genes ac-tivated by ABI3, and so the potential common promoter region can already receive signalsfrom ABI3. Next we address the question if these6 putative ABI3 target genes are alsounder control of ABI3 via the potential common promoter region. To test this hypothesis,the promoters of4 of these6 putative target genes have been tested in transient assays.The promoters of the genes T2 and T11 show a low activation of the GUS expression,the promoter of gene T13 shows a two-fold repression of the GUS expression, and thepromoter of gene T9 does not seem to react on ABI3. In addition to this, gene T13 is inhead-head orientation with gene T23 that is not represented by its own proximal promoterfragment on the promoter arrays. The Genevestigator score of T23 is significantly higherthan those of the 1,000 random genes at the level of the 95%-quantile, and the promoterof this gene shows activation of the GUS expression in a transient assay. Hence, this genepair seems to behave like the gene pair T21 and T22. In summary, independent gene ex-pression profiles from Genevestigator give first hints which genes might be activated byABI3. Additionally, transient assays help to validate this results if the underlying test sys-tem is capable of simulating the natural situation in seeds. Twenty percent of the ABI3activated target genes with high Genevestigator scores could only be predicted through theapplication of the SHMM approach and would have been missed using the LFC or HMMapproach. Moreover, the SHMM predicted over forty percent more putative ABI3 targetgenes compared to the LFC method. For these9 genes the promoters of7 have been testedin transient assays whereas1 promoter does not react,1 represses the GUS expression, andthe5 others activate the GUS expression. This results emphasize the relevance of SHMMsin the detection of ABI3 target genes.

ID LFC HMM SHMM( 4.0) Genevestigator Transient AssayT1 1 1 1 0.94 5T2 1 1 1 0.11 2.5T3 1 1 1 0.86 12T4 0 0 1 0.03 -T5 0 0 1 0.39 3T6 1 1 1 0.72 15T7 1 1 1 0.90 7T8 0 0 1 0.46 12T9 0 0 1 0.07 1T10 0 0 1 0.95 6T11 0 1 1 0.09 2T12 1 1 1 0.74 24T13 1 1 1 0.09 0.4T14 1 1 1 0.93 8T15 0 1 1 0.10 -T16 1 1 1 0.95 27T17 1 1 1 0.98 27T18 0 1 1 0.98 27T19 1 1 1 0.98 27T20 1 1 1 0.57 8T21 0 0 1 0.20 0.6T22 1 1 1 0.81 30
Table 1: Overview of predicted ABI3 target genes at the level of the top 200 candidates in Fig. 2b.The ID column contains anonymized target gene identifiers (our biologists prepare a manuscript dis-cussing target genes). The numbers 1 and 0 in the method columns LFC, HMM, and SHMM(4.0)encode whether a gene is predicted or missed. Genevestigator quantifies the gene expression of atarget gene within the categories inflorescence, silique, and seed as described in Section 3.3. Tran-sient Assay contains the measured fold-change for a target gene promoter under ABI3 expressionvs. target gene promoter lacking ABI3 expression.
4 Conclusions and outlook
We introduced the LFC, the HMM, and the SHMM approach for the analysis of ChIP-chippromoter array data and compared these methods on ABI3 ChIP-chip data. The motivationfor the usage of HMMs is based on the observation of positive correlations between ChIP-chip measurements of adjacent promoters on the DNA (Fig. 1). Especially, the SHMMapproach is motivated by the fact that ChIP-chip measurements of head-head promoterpairs show significantly higher correlations than those of other promoter pair orientations.Based on SHMMs, we demonstrated that discriminating promoters in head-head orien-tations from other promoter orientations can lead to significantly different predictions oftarget and non-target promoters compared to the HMM (Fig. 2a). Regarding all threemethods, the SHMM predicted the highest number of putative ABI3 target promoters andall target promoters predicted by the LFC or the HMM have been included (Fig. 2b), butthe number of predicted putative ABI3 target promoters is not an optimal criterion to de-cide which of the methods should be preferred. For this reason, we used publicly availableexpression profiles from Genevestigator to analyze how a putative target gene follows theexpression profile of ABI3, and transient assays have been performed to test whether thepromoter of a putative target gene reacts on ABI3 (Tab. 1). We showed that expressiondata from Genevestigator can give first hints which genes might be activated by ABI3, andthat the validation can be done by transient assays. Twenty percent of the target genes withsignificantly high Genevestigator scores and activation in transient assays could only bepredicted by the SHMM and would have been missed by the LFC or HMM approach. Intotal, the SHMM predicted more than forty percent more putative target promoters (9 of22) compared to the LFC method. Seven of these promoters have been tested in transientassays whereas one promoter does not react, one represses the GUS expression, and thefive others activate the GUS expression. Taking this together, we conclude that the SHMM

can be seen as the more general model that should be preferred for the prediction of ABI3target genes. We conjecture that the proposed SHMM might possibly be useful for theanalysis of other promoter array ChIP-chip data.In the future, the study of seed development continues. For instance, we are awaitingChIP-chip data of the transcription factors LEC1, LEC2, and FUS3. This will provide usfirst insights into the transcriptional regulatory network involved in seed development. Incooperation with us, our biologists prepare a manuscript with details to the ABI3 ChIP-chip experiments including the discussion of ABI3 target genes.
5 Acknowledgments
We thank the groups of Lothar Altschmied, Helmut Baumlein, and Udo Conrad and espe-cially Urs Hahnel and Gudrun Monke for ChIP-chip data, transient assays, and valuablediscussions. This work was supported by the BMBF grants 0312706A and 0313155, andby the Ministry of culture Saxony-Anhalt grant XP3624HP/0606T.
References
[BIAS03] BM Bolstad, RA Irizarry, M Astrand, and TP Speed. A comparison of normaliza-tion methods for high density oligonucleotide array data based on variance and bias.Bioinformatics, 19(2):185–193, 2003.
[DEKM98] R Durbin, S Eddy, A Krogh, and G Mitchision.Biological sequence analysis - Prob-abilistic models of proteins and nucleic acids. Cambridge University Press, 1998.
[DLR77] A Dempster, N Laird, and D Rubin. Maximum likelihood from incomplete data viathe EM algorithm. Journal of the Royal Statistical Society, Series B, 39(1):1–38,1977.
[IHS+01] VR Iyer, CE Horak, CS Scafe, D Botsein, M Snyder, and PO Brown. Genomicbinding sites of the yeast cell-cycle transcription factors SFB and MBF.Nature,409:533–538, 2001.
[JLG+08] DS Johnson, W Li, DB Gordon, A Bhattacharjee, B Curry, and L Brizuela et al.Systematic evaluation of variability in ChIP-chip experiments using predefined DNAtargets.Genome Res, 18:393–403, 2008.
[JW05] H Ji and WH Wong. TileMap: create chromosomal map of tiling array hybridizations.Bioinformatics, 21(18):3629–3636, 2005.
[KSSW03] B Knab, A Schliep, B Steckemetz, and B Wichern. Model-based clustering with Hid-den Markov Models and its application to financial time-series data.In M. Schader,W. Gaul, and M. Vichi, editors, Between Data Science and Applied Data Analysis,Springer, pages 561–569, 2003.
[KvdLDC04] S Keles, MJ van der Laan, S Dudoit, and SE Cawley. Multiple testing methods forChIP-chip high density oligonucleotide array data.Working Paper Series 147, 2004.U.C. Berkeley Division of Biostatistics, University of California, Berkeley, CA.
[LML05] W Li, CA Meyer, and XS Liu. A hidden Markov model for analyzing ChIP-chipexperiments on genome tiling arrays and its application to p53 binding sequences.Bioinformatics, 21:i274–i282, 2005.

[MD04] I M Meyer and R Durbin. Gene structure conservation aids similarity based geneprediction.Nucleic Acids Research, 32(2):776–783, 2004.
[Rab89] L Rabiner. A Tutorial on Hidden Markov Models and Selected Applications in SpeechRecognition.Proceedings of the IEEE, 77(2):257–286, 1989.
[RRW+00] B Ren, F Robert, JJ Wyrick, O Aparicio, EG Jennings, I Simon, J Zeitlinger,J Schreiber, N Hannett, E Kanin, TL Volkert, CJ Wilson, SP Bell, and RA Young.Genome-Wide Location and Function of DNA Binding Proteins.Science,290(5500):2306–2309, 2000.
[Sei06] M Seifert. Analysing Microarray Data Using Homogeneous And InhomogeneousHidden Markov Models. Diploma Thesis; Martin Luther University; [email protected], 2006.
[VCC05] J Vicente-Carbajosa and P Carbonero. Seed maturation: developing an intrusivephase to accomplish a quiescent state.Int. J. Dev. Biol., 49:645–651, 2005.
[ZHHHG04] P Zimmerman, M Hirsch-Hoffman, L Hennig, and W Gruissem. GENEVESTI-GATOR. Arabidopsis Microarray Database and Analysis Toolbox.Plant Physiol.,136:2621–2632, 2004.