lab on a chip
TRANSCRIPT
www.rsc.org/loc
ISSN 1473-0197
Lab on a ChipMiniaturisation for chemistry, physics, biology, materials science and bioengineering
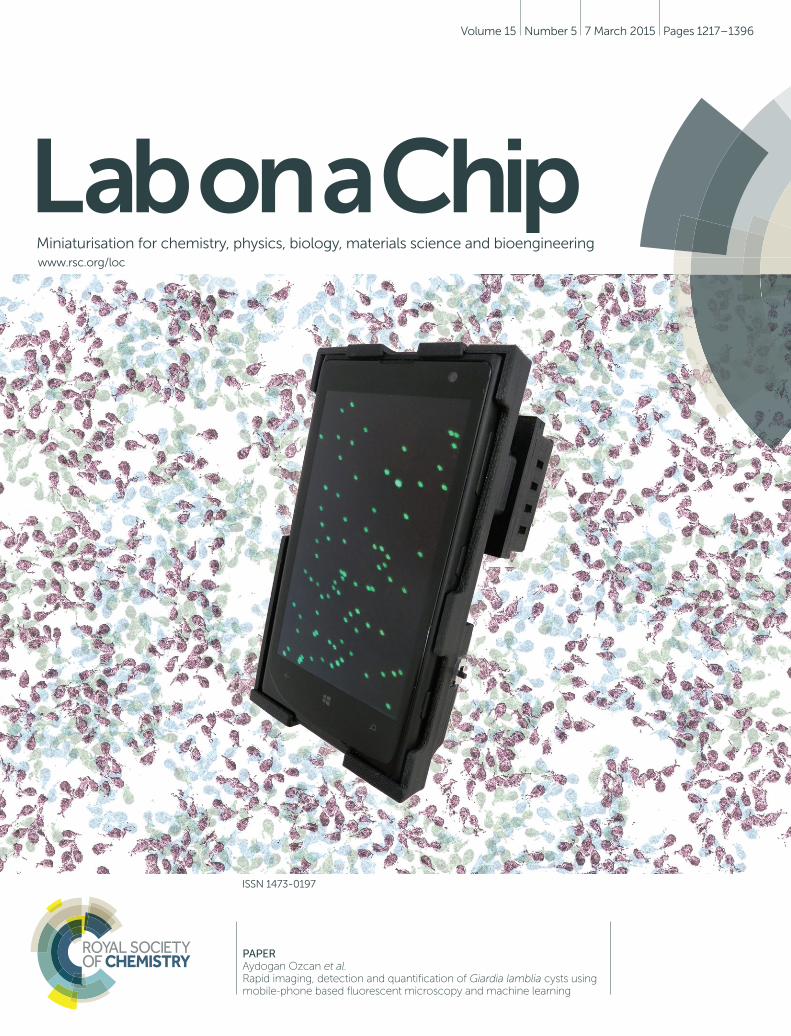
PAPERAydogan Ozcan et al.Rapid imaging, detection and quantification of Giardia lamblia cysts using mobile-phone based fluorescent microscopy and machine learning
Volume 15 Number 5 7 March 2015 Pages 1217–1396
Lab on a Chip
Publ
ishe
d on
16
Dec
embe
r 20
14. D
ownl
oade
d on
11/
03/2
015
16:4
2:28
.
PAPER View Article OnlineView Journal | View Issue
1284 | Lab Chip, 2015, 15, 1284–1293 This journal is © The R
aDepartment of Electrical Engineering, University of California Los Angeles (UCLA),
CA 90095, USA. E-mail: [email protected]; Web: http://www.innovate.ee.ucla.edu,
http://org.ee.ucla.edu; Tel: +1 310 825 0915bDepartment of Bioengineering, University of California Los Angeles (UCLA),
CA 90095, USAc California Nanosystems Institute (CNSI), University of California Los Angeles
(UCLA), CA 90095, USA
Cite this: Lab Chip, 2015, 15, 1284
Received 16th November 2014,Accepted 16th December 2014
DOI: 10.1039/c4lc01358a
www.rsc.org/loc
Rapid imaging, detection and quantification ofGiardia lamblia cysts using mobile-phone basedfluorescent microscopy and machine learning
Hatice Ceylan Koydemir,a Zoltan Gorocs,a Derek Tseng,a Bingen Cortazar,a
Steve Feng,a Raymond Yan Lok Chan,a Jordi Burbano,a Euan McLeoda
and Aydogan Ozcan*abc
Rapid and sensitive detection of waterborne pathogens in drinkable and recreational water sources is
crucial for treating and preventing the spread of water related diseases, especially in resource-limited
settings. Here we present a field-portable and cost-effective platform for detection and quantification of
Giardia lamblia cysts, one of the most common waterborne parasites, which has a thick cell wall that
makes it resistant to most water disinfection techniques including chlorination. The platform consists of a
smartphone coupled with an opto-mechanical attachment weighing ~205 g, which utilizes a hand-held
fluorescence microscope design aligned with the camera unit of the smartphone to image custom-
designed disposable water sample cassettes. Each sample cassette is composed of absorbent pads and
mechanical filter membranes; a membrane with 8 μm pore size is used as a porous spacing layer to
prevent the backflow of particles to the upper membrane, while the top membrane with 5 μm pore size is
used to capture the individual Giardia cysts that are fluorescently labeled. A fluorescence image of the filter
surface (field-of-view: ~0.8 cm2) is captured and wirelessly transmitted via the mobile-phone to our servers
for rapid processing using a machine learning algorithm that is trained on statistical features of Giardia cysts
to automatically detect and count the cysts captured on the membrane. The results are then transmitted
back to the mobile-phone in less than 2 minutes and are displayed through a smart application running on
the phone. This mobile platform, along with our custom-developed sample preparation protocol, enables
analysis of large volumes of water (e.g., 10–20 mL) for automated detection and enumeration of Giardia
cysts in ~1 hour, including all the steps of sample preparation and analysis. We evaluated the performance
of this approach using flow-cytometer-enumerated Giardia-contaminated water samples, demonstrating
an average cyst capture efficiency of ~79% on our filter membrane along with a machine learning based
cyst counting sensitivity of ~84%, yielding a limit-of-detection of ~12 cysts per 10 mL. Providing rapid
detection and quantification of microorganisms, this field-portable imaging and sensing platform running
on a mobile-phone could be useful for water quality monitoring in field and resource-limited settings.
Introduction
Providing access to safe drinking water, supplying adequatesanitation services, and promoting better hygiene practicesare important goals to eliminate water-related diseasesworldwide.1 Despite tremendous improvements over the pastseveral decades, there are still more than two billion peoplewho lack access to improved sanitation facilities and more
than half a billion people who live with unimproved drinkingwater sources, especially in developing parts of the world,2
which account for more than one-third of the total worldpopulation.3 Moreover, even developed countries are facingemerging problems such as limited financial resources,urbanization, and population growth that altogether increasethe occurrence of waterborne diseases. Accordingly, water-borne pathogens (e.g., bacteria, viruses, and parasites) posesignificant risks to human health worldwide, primarilythrough diarrhea (affecting four billion people each year), andcan impose significant economic burden and increasedhealthcare costs on countries.4 Therefore, rapid, sensitive,and cost-effective detection of contaminated water sourcesis an important step to prevent waterborne diseases and theirspread.5
oyal Society of Chemistry 2015
Lab on a Chip Paper
Publ
ishe
d on
16
Dec
embe
r 20
14. D
ownl
oade
d on
11/
03/2
015
16:4
2:28
. View Article Online
Among various waterborne pathogens, Giardia lamblia(G. lamblia) is one of the most common intestinal protozoanparasites that remains difficult to eliminate using traditionalmethods (e.g., chlorination)6,7 due to its thick cell wall. Con-ventional methods commonly used in water analysis labora-tories for detection and enumeration of this parasite dependon filtration of several liters of water, immunomagnetic sepa-ration of cysts from debris, and fluorescence detection of cystsusing bench-top microscopes.8 These methods offer highsensitivity and specificity but are time-consuming (requiringe.g., 1–2 days), need trained specialists to operate bulky andrelatively expensive equipment, and are prone to humanerrors. Various other detection methods9–18 such as e.g., Poly-merase Chain Reaction (PCR),9,12 flow cytometry,12 and hollow-fiber ultrafiltration in combination with heat dissociation,16
have also been developed to partially mitigate some of thesedisadvantages. These methods, however, are either too com-plex to operate in a field-portable design or cannot processlarge sample volumes (e.g., 10 mL) and therefore, they areimpractical to use in resource-limited environments for rapidanalysis of large volumes of water samples.
Here we present an alternative smartphone-enabled plat-form for rapid (i.e., ~1 h) detection and counting of intactG. lamblia cysts in water samples. In this work, we focusedon intact cyst capture and counting rather than detectionof cyst fragments since the ingestion of intact cysts causesGiardiasis. The opto-mechanical attachment to the smartph-one weighs only 205 g and is composed of a disposable
This journal is © The Royal Society of Chemistry 2015
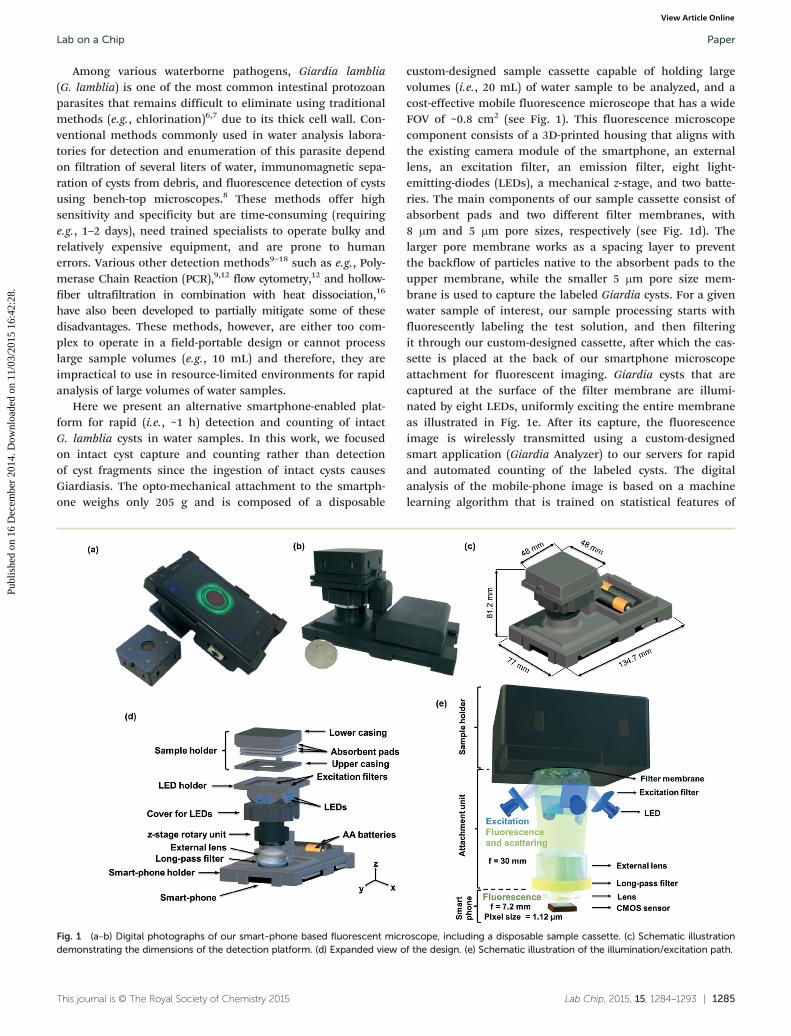
Fig. 1 (a–b) Digital photographs of our smart-phone based fluorescent micrdemonstrating the dimensions of the detection platform. (d) Expanded view o
custom-designed sample cassette capable of holding largevolumes (i.e., 20 mL) of water sample to be analyzed, and acost-effective mobile fluorescence microscope that has a wideFOV of ~0.8 cm2 (see Fig. 1). This fluorescence microscopecomponent consists of a 3D-printed housing that aligns withthe existing camera module of the smartphone, an externallens, an excitation filter, an emission filter, eight light-emitting-diodes (LEDs), a mechanical z-stage, and two batte-ries. The main components of our sample cassette consist ofabsorbent pads and two different filter membranes, with8 μm and 5 μm pore sizes, respectively (see Fig. 1d). Thelarger pore membrane works as a spacing layer to preventthe backflow of particles native to the absorbent pads to theupper membrane, while the smaller 5 μm pore size mem-brane is used to capture the labeled Giardia cysts. For a givenwater sample of interest, our sample processing starts withfluorescently labeling the test solution, and then filteringit through our custom-designed cassette, after which the cas-sette is placed at the back of our smartphone microscopeattachment for fluorescent imaging. Giardia cysts that arecaptured at the surface of the filter membrane are illumi-nated by eight LEDs, uniformly exciting the entire membraneas illustrated in Fig. 1e. After its capture, the fluorescenceimage is wirelessly transmitted using a custom-designedsmart application (Giardia Analyzer) to our servers for rapidand automated counting of the labeled cysts. The digitalanalysis of the mobile-phone image is based on a machinelearning algorithm that is trained on statistical features of
Lab Chip, 2015, 15, 1284–1293 | 1285
oscope, including a disposable sample cassette. (c) Schematic illustrationf the design. (e) Schematic illustration of the illumination/excitation path.
Lab on a ChipPaper
Publ
ishe
d on
16
Dec
embe
r 20
14. D
ownl
oade
d on
11/
03/2
015
16:4
2:28
. View Article Online
Giardia cyst images so that it can automatically and specifi-cally recognize cyst signatures from other (auto)fluorescentmicro-objects that are non-specifically captured on the filtermembrane. The result of this machine learning based analy-sis of each fluorescence image is returned back to the samemobile-phone within ~2 min, and is displayed to the userthrough the same Giardia Analyzer smart application.
We tested the performance of this automated detectionplatform using flow cytometer-enumerated G. lamblia-spikedwater solutions, where each test takes ~1 hour to run, includ-ing labeling, filtering, imaging and cyst counting steps. Ourexperiments demonstrated an average cyst capture efficiencyof ~79% along with an automated cyst counting sensitivityof ~84%, which together yielded a limit of detection (LoD) of~12 cysts per 10 mL. This field-portable fluorescent micros-copy platform that is integrated on a mobile-phone, togetherwith its machine learning based digital image processingframework, can provide a valuable solution for automated andrapid detection of various waterborne pathogens, in additionto Giardia cysts, even in remote and resource limited settings.
Materials and methodsMaterials
Hydrophilic polycarbonate black filter membranes (poresize = 5 μm) (product no. PCTB5013100) were purchasedfrom Sterlitech Corp. (Kent, WA, U.S.A.). Nuclepore track-etched polycarbonate membranes (pore size = 8 μm) (productno. 110414) were purchased from GE Healthcare Life Sciences(Pittsburgh, PA, U.S.A.). The absorbent pads (product no.28297-988) were purchased from VWR (Visalia, CA, U.S.A.).Black masking tape (product no. T743-1.0) and lens tube(product no. SM1L03) were purchased from Thorlabs (Newton,NJ, U.S.A.). Luer caps (product no. FTLLP-1) were purchasedfrom Value Plastics (Fort Collins, CO, U.S.A.). Disposablesyringes with BD Luer-Lok™ tip (product no. 309604) werepurchased from BD Company (Franklin Lakes, NJ, U.S.A.).Sprayon® epoxy paint (product no. 4190965) was purchasedfrom Chase Products Co. (Broadview, IL, U.S.A.).
Tween® 20 (product no. P9416) and reagent water (productno. 320072) were purchased from Sigma Aldrich (St. Louis,MO, U.S.A.). Isopropanol (product no. A416P-4) was pur-chased from Fisher Scientific (Pittsburgh, PA, U.S.A.). Anti-Giardia reagent fluorescein labelled stain (product no. Giardia-a-Glo™, A300FLK-20X), bulk parasite suspension (1% forma-lin fixed) (product no. P101), Giardia spiked suspensionsenumerated by flow cytometer and fixed using 1% formalin(product no. PACIR), wash buffer (product no. WB101), dilu-tion buffer (product no. B100-20), anti-fading mountingmedia (product no. M101), and counterstain (product no.C101) were purchased from Waterborne Inc. (New Orleans,LA, U.S.A.) and stored at 4 °C. The aspherized achromaticlens ( f = 30 mm) (product no. 49-662) was purchased fromEdmund Optics (Barrington, NJ, U.S.A). The long-pass filter(product no. FF01-500/LP-23.3-D) was purchased from SemrockInc. (Rochester, NY, U.S.A.). LEDs (product no. 516-2800-1-ND)
1286 | Lab Chip, 2015, 15, 1284–1293
and double sided adhesive tape (product no. 3M9720-ND)were purchased from Digi-Key Corporation (Thief River Falls,MN, U.S.A.). Excitation filter (product no. ET470/40x) waspurchased from Chroma Inc. (Bellows Falls, VT, U.S.A.).
Preparation of solutions
Before preparing water samples for analysis, we need to pre-pare two solutions for our experiments: a diluted antibody-based fluorescein-labelled stain and a 0.01% Tween® 20 solu-tion in reagent water. The diluted stain solution is used forlabeling of the Giardia cysts in the water sample while theTween® 20 solution is used to reduce the adhesion of theGiardia cysts onto the walls of the delivery syringe barrel inorder to increase the Giardia cyst recovery rate of our system.
To prepare the diluted stain, a concentrated anti-Giardiareagent fluorescein labelled stain (i.e. 20×) is diluted to 1×using the dilution buffer provided by the manufacturer witha ratio of 19 : 1 in an Eppendorf tube and mixed. In orderto prepare 0.01% Tween® 20 solution, 5 μL of Tween® 20 isadded into 50 mL of reagent water in a falcon tube anddissolved by vortex mixing at 10 000 rpm for five minutes. Allsolutions require storage at 4 °C following their preparation.
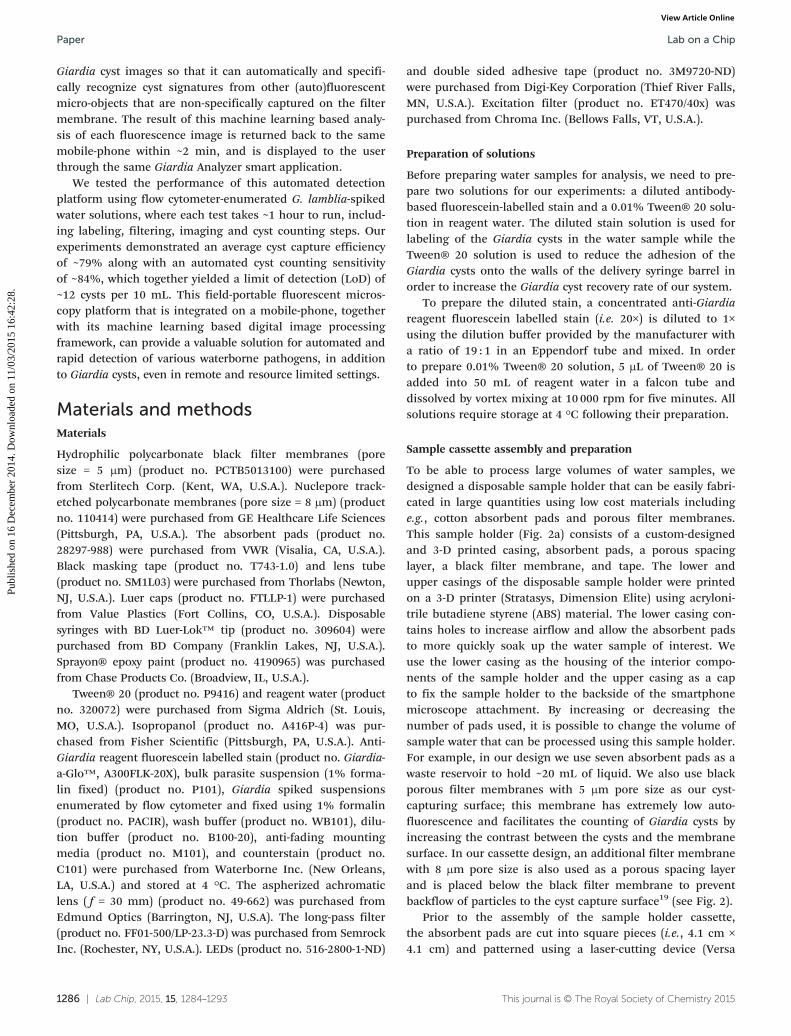
Sample cassette assembly and preparation
To be able to process large volumes of water samples, wedesigned a disposable sample holder that can be easily fabri-cated in large quantities using low cost materials includinge.g., cotton absorbent pads and porous filter membranes.This sample holder (Fig. 2a) consists of a custom-designedand 3-D printed casing, absorbent pads, a porous spacinglayer, a black filter membrane, and tape. The lower andupper casings of the disposable sample holder were printedon a 3-D printer (Stratasys, Dimension Elite) using acryloni-trile butadiene styrene (ABS) material. The lower casing con-tains holes to increase airflow and allow the absorbent padsto more quickly soak up the water sample of interest. Weuse the lower casing as the housing of the interior compo-nents of the sample holder and the upper casing as a capto fix the sample holder to the backside of the smartphonemicroscope attachment. By increasing or decreasing thenumber of pads used, it is possible to change the volume ofsample water that can be processed using this sample holder.For example, in our design we use seven absorbent pads as awaste reservoir to hold ~20 mL of liquid. We also use blackporous filter membranes with 5 μm pore size as our cyst-capturing surface; this membrane has extremely low auto-fluorescence and facilitates the counting of Giardia cysts byincreasing the contrast between the cysts and the membranesurface. In our cassette design, an additional filter membranewith 8 μm pore size is also used as a porous spacing layerand is placed below the black filter membrane to preventbackflow of particles to the cyst capture surface19 (see Fig. 2).
Prior to the assembly of the sample holder cassette,the absorbent pads are cut into square pieces (i.e., 4.1 cm ×4.1 cm) and patterned using a laser-cutting device (Versa
This journal is © The Royal Society of Chemistry 2015
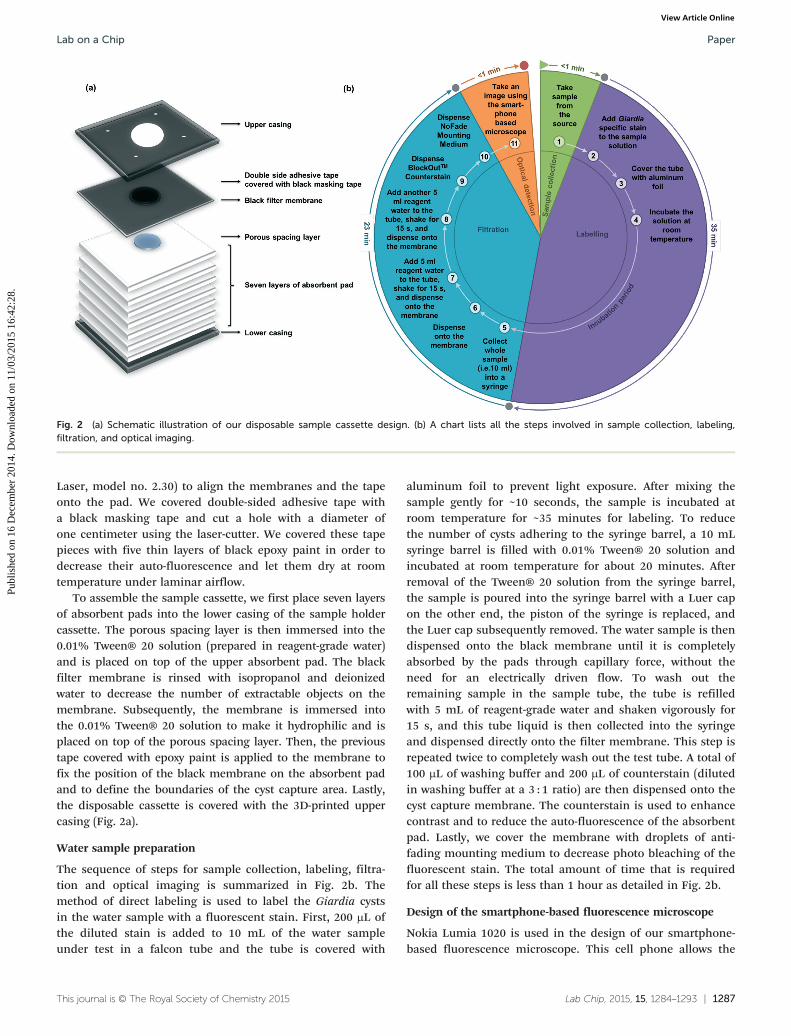
Fig. 2 (a) Schematic illustration of our disposable sample cassette design. (b) A chart lists all the steps involved in sample collection, labeling,filtration, and optical imaging.
Lab on a Chip Paper
Publ
ishe
d on
16
Dec
embe
r 20
14. D
ownl
oade
d on
11/
03/2
015
16:4
2:28
. View Article Online
Laser, model no. 2.30) to align the membranes and the tapeonto the pad. We covered double-sided adhesive tape witha black masking tape and cut a hole with a diameter ofone centimeter using the laser-cutter. We covered these tapepieces with five thin layers of black epoxy paint in order todecrease their auto-fluorescence and let them dry at roomtemperature under laminar airflow.
To assemble the sample cassette, we first place seven layersof absorbent pads into the lower casing of the sample holdercassette. The porous spacing layer is then immersed into the0.01% Tween® 20 solution (prepared in reagent-grade water)and is placed on top of the upper absorbent pad. The blackfilter membrane is rinsed with isopropanol and deionizedwater to decrease the number of extractable objects on themembrane. Subsequently, the membrane is immersed intothe 0.01% Tween® 20 solution to make it hydrophilic and isplaced on top of the porous spacing layer. Then, the previoustape covered with epoxy paint is applied to the membrane tofix the position of the black membrane on the absorbent padand to define the boundaries of the cyst capture area. Lastly,the disposable cassette is covered with the 3D-printed uppercasing (Fig. 2a).
Water sample preparation
The sequence of steps for sample collection, labeling, filtra-tion and optical imaging is summarized in Fig. 2b. Themethod of direct labeling is used to label the Giardia cystsin the water sample with a fluorescent stain. First, 200 μL ofthe diluted stain is added to 10 mL of the water sampleunder test in a falcon tube and the tube is covered with
This journal is © The Royal Society of Chemistry 2015
aluminum foil to prevent light exposure. After mixing thesample gently for ~10 seconds, the sample is incubated atroom temperature for ~35 minutes for labeling. To reducethe number of cysts adhering to the syringe barrel, a 10 mLsyringe barrel is filled with 0.01% Tween® 20 solution andincubated at room temperature for about 20 minutes. Afterremoval of the Tween® 20 solution from the syringe barrel,the sample is poured into the syringe barrel with a Luer capon the other end, the piston of the syringe is replaced, andthe Luer cap subsequently removed. The water sample is thendispensed onto the black membrane until it is completelyabsorbed by the pads through capillary force, without theneed for an electrically driven flow. To wash out theremaining sample in the sample tube, the tube is refilledwith 5 mL of reagent-grade water and shaken vigorously for15 s, and this tube liquid is then collected into the syringeand dispensed directly onto the filter membrane. This step isrepeated twice to completely wash out the test tube. A total of100 μL of washing buffer and 200 μL of counterstain (dilutedin washing buffer at a 3 : 1 ratio) are then dispensed onto thecyst capture membrane. The counterstain is used to enhancecontrast and to reduce the auto-fluorescence of the absorbentpad. Lastly, we cover the membrane with droplets of anti-fading mounting medium to decrease photo bleaching of thefluorescent stain. The total amount of time that is requiredfor all these steps is less than 1 hour as detailed in Fig. 2b.
Design of the smartphone-based fluorescence microscope
Nokia Lumia 1020 is used in the design of our smartphone-based fluorescence microscope. This cell phone allows the
Lab Chip, 2015, 15, 1284–1293 | 1287

Lab on a ChipPaper
Publ
ishe
d on
16
Dec
embe
r 20
14. D
ownl
oade
d on
11/
03/2
015
16:4
2:28
. View Article Online
capture of 38MP raw format (i.e., digital negative (DNG))images at a 4 : 3 aspect ratio with a pixel size of 1.12 μm.20,21
The built-in objective lens of the cellphone has a focal length,f of 7.2 mm and a relative aperture of f/2.2. Using the Nokiacamera application settings, we are also able to adjust a varietyof camera parameters (i.e., white balance, focus, ISO speed,exposure value, and contrast) for optimal image capture.
For fluorescence excitation, eight blue LEDs powered withtwo AA alkaline batteries are distributed evenly at each sideto uniformly excite the cysts captured on the membrane ofthe sample holder (see Fig. 1). The emission spectrum of eachLED is also filtered using an excitation bandpass filter witha center wavelength of 470 nm and bandwidth of ~40 nm. Anaspherized achromatic lens with a focal length, f2 of 30 mmis used to create a magnification factor of 0.24 (i.e., f/f2)between the sample plane and the CMOS sensor-chip of themobile-phone, which helps us achieve a large sample FOV(~0.8 cm2) per image, without any mechanical scanning. Toadjust the depth of focus of our microscope we have placeda z-stage between the external lens and the excitation LEDs.To block the excitation light, a long-pass emission thin-filmfilter with a cut-off wavelength of 510 nm is placed betweenthe existing cell phone lens and our external lens. The custom-designed opto-mechanical housing of our fluorescence micro-scope attachment is also 3D-printed (Stratasys, Dimension Elite)using ABS thermoplastic material.
Digital analysis of fluorescent images and automated cystcounting using machine learning
Digital image processing and machine learning algorithmsare applied to detect and count G. lamblia cysts captured on
1288 | Lab Chip, 2015, 15, 1284–1293
Fig. 3 Process flow for automated detection and counting of G. lamblWindows-based mobile phone. The processed image and cyst counting res
the filter membrane as illustrated in Fig. 3. In order to auto-matically detect and specifically count the cysts, the raw for-mat (i.e., DNG) fluorescence image is uploaded to our serversusing our Giardia Analyzer application (see Fig. 3). On theserver side, this DNG image is converted into TIFF formatand the Bayer pattern image is retrieved. After a simplemasking step, the inner part of the filter membrane imageis cropped as our target region of interest (ROI). The greenchannel image of our ROI is then converted into a binaryimage based on a threshold value of 0.02 (maximum inten-sity: 1), following subtraction of the background intensity.The obtained binary image contains not only the fluorescentparticles (i.e., cyst candidates) but also noise. Our algorithmeliminates some of this noise related artifacts by discardingeach connected component on the image that exhibits anarea substantially smaller than the size of an intact Giardiacyst. For each one of the remaining cyst candidates withinour ROI, we automatically generate a list of spatial featuressuch as area, eccentricity, orientation, and equivalent diame-ter, among others. To increase the sensitivity of the differen-tiation of cysts from other (auto)fluorescent particles, weadd more features to each particle's feature list by extractingintensity information (e.g., average intensity (Iave), minimumintensity (Imin), and maximum intensity (Imax)) of circularregions at each particle position with a three-pixel radiusfor not only the red, green, and blue channels of the RGBcolor space, but also their corresponding hue (H), saturation(S), value (V) of the HSV color space as well as the luma (Y),blue-difference (Cb) and red difference (Cr) of the YCbCrcolor space. Moreover, we include the differences of intensityparameters between each channel within a particular colorspace (e.g., Iave,Y − Iave,Cr, Imax,Y − Imax,Cr or Imin,Y − Imin,Cr).
This journal is © The Royal Society of Chemistry 2015
ia cysts using our custom developed smart application running on aults are sent back to the mobile phone within less than ~2 minutes.

Lab on a Chip Paper
Publ
ishe
d on
16
Dec
embe
r 20
14. D
ownl
oade
d on
11/
03/2
015
16:4
2:28
. View Article Online
This entire process creates a 71-item feature list for eachfluorescent particle (or cyst candidate) found within ourfilter ROI.
Next, we use a custom-developed machine learning algo-rithm to count and differentiate cysts from other unwanted(auto)fluorescent micro-objects in our filter ROI. This machinelearning algorithm utilizes a bootstrap aggregating,22–24 orbagging, approach to classify particles using the 71 differentfeatures extracted for each cyst candidate.25 Our training datathat we used to train our machine learning approach to dis-tinguish Giardia cysts from other micro-objects were popu-lated by 14 different experiments of varying cyst concentra-tions for a total of 1370 cysts and 1485 other micro-particles.To create this training data/library, which need to be gener-ated only once to statistically learn cyst images on our mobilemicroscope, each particle is labelled as either a cyst (or clus-ter of cysts) or other micro-object by manually determiningthe ground truth under a high-resolution bench-top micro-scope. Through this training process, we observed that thepixel area of the cyst clusters is proportional to the numberof cysts that form the cluster, based on which we generateda linear calibration curve, i.e., pixel area = 10.34 × (number ofcysts) + 9.60, exhibiting a high correlation coefficient of0.9808. This calibration curve is used to estimate the numberof cysts in each fluorescent cluster/spot that is labeled as“cysts” using our machine learning algorithm.
After this training process, when detecting and countingGiardia cysts on new (i.e., blind) test images, fluorescentobjects are automatically detected, noise-filtered, and the fea-ture lists (each with 71 entries) for the remaining particles/candidates are digitally extracted as described above. Eachset of features for a cyst or cluster candidate is comparedagainst the training data automatically using our machinelearning algorithm, classifying them as either Giardia cystsor other unwanted micro-objects. The final counting resultis stored in our server database and is also wirelessly trans-ferred to the smartphone through our custom developedapplication (Fig. 3).
Results and discussion
Our waterborne pathogen detection platform has some dis-tinct features that make it an ideal mobile analysis tool forrapid and automated imaging and detection of waterbornepathogens in resource limited settings: (1) the smartphonebased fluorescence microscope has a large FOV of ~0.8 cm2,which is more than an order of magnitude larger than theFOV of e.g., a 4× or 10× objective lens with a numerical aper-ture of ~0.1–0.2, making it possible to image the entire filtermembrane surface without the use of a mechanical scanningstage; (2) the disposable sample cassette is capable of hold-ing large volumes (e.g., 20 mL) of liquid sample and a furtherincrease in this volume can be achieved by adding morelayers of absorbent pads without a change in performance;and (3) its design is cost-effective and field-portable, weighingonly 205 g, excluding the mobile-phone.
This journal is © The Royal Society of Chemistry 2015
In order to blindly demonstrate the proof of concept ofour mobile fluorescence microscope (Fig. 1), G. lambliaspiked water solutions were used as test samples. Each watersample was prepared and processed according to the set ofprocedures described in Fig. 2 and our methods section.Fig. 4a shows a full FOV image captured using our smartphone-based fluorescence microscope. In the zoomed-in image,shown in Fig. 4b, the filter membrane that captures the cystsin the water sample forms the inner circle, the black maskingtape forms the middle circle, and the center part of the uppercasing of the sample holder forms the outer part. The cystROI, i.e., the filter membrane with 5 μm pores, has an imag-ing area of ~0.8 cm2. 26 different images taken with a 4×objective lens on a regular bench-top microscope were digi-tally stitched together to create a comparison image forthis large FOV (as shown in Fig. 4g – which is only used forcomparison purposes). The insets of Fig. 4b (i.e., the regionsmarked as c, d, e, and f) and Fig. 4g (i.e., the region markedas h) illustrate the performance of this mobile platform.Panels labeled with (i) in Fig. 4c–f and Fig. 4h show theimages obtained using 20× and 4× objective lenses, respec-tively, of a regular bench-top fluorescence microscope toprovide verification for (ii)-labeled images that were croppedfrom the digital image taken using our mobile fluorescencemicroscope. These cropped mobile-phone images are in goodagreement with conventional bench-top microscope imagesthat were captured for comparison, and individual as well asclustered cysts can be imaged using our mobile microscopyplatform.
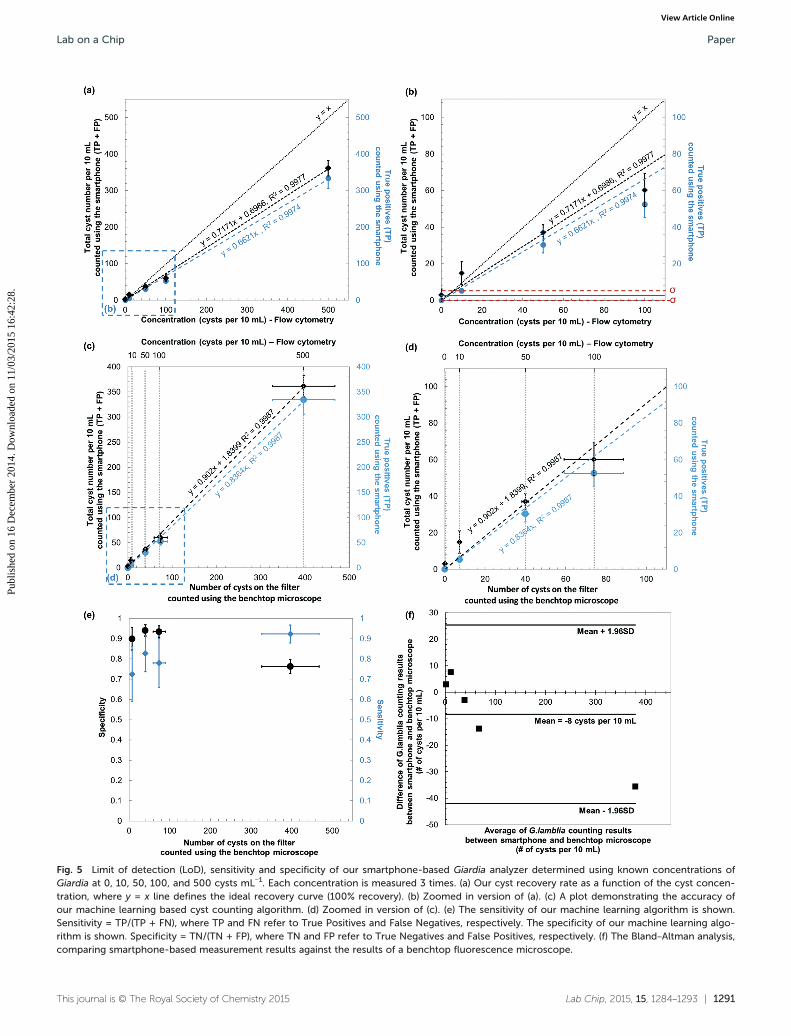
To explore the detection limit, sensitivity and specificityof our mobile-phone based cyst detection and quantificationapproach, we used flow-cytometer enumerated G. lambliaspiked water samples, each 10 mL in volume. Fig. 5 summa-rizes the results of these experiments, which were basedon five different cyst concentrations (i.e., 0, 10, 50, 100, and500 cysts per 10 mL), with each experiment blindly verifiedusing a bench-top fluorescence microscope, scanning >25different ROIs across the filter membrane surface.
Although on average 79% of G. lamblia cysts that existedin our water sample volume (10 mL) were physically capturedon the filter membrane, we achieved a lower overall cystrecovery as illustrated in Fig. 5a–b. The cyst detection effi-ciency of our system is influenced by two independent fac-tors: (1) the partial loss of Giardia cysts during the deliveryof the water volume of interest onto our disposable filtermembrane; and (2) inaccurate detection and counting ofthe captured fluorescent objects on the membrane surface byour machine learning algorithm. The second issue is partiallyaffected by difficulties in digitally differentiating the cystscaptured at the outer edges of the filter membrane, whichexhibit stronger auto-fluorescence arising from ABS materialof the sample cassette. Based on Fig. 5c–d, we can quantifythe overall sensitivity (i.e., sensitivity = TP/(TP + FN), whereTP and FN refer to True Positives and False Negatives, respec-tively26) of our machine learning algorithm as ~84%. In otherwords, the Giardia cysts that are physically captured on the
Lab Chip, 2015, 15, 1284–1293 | 1289
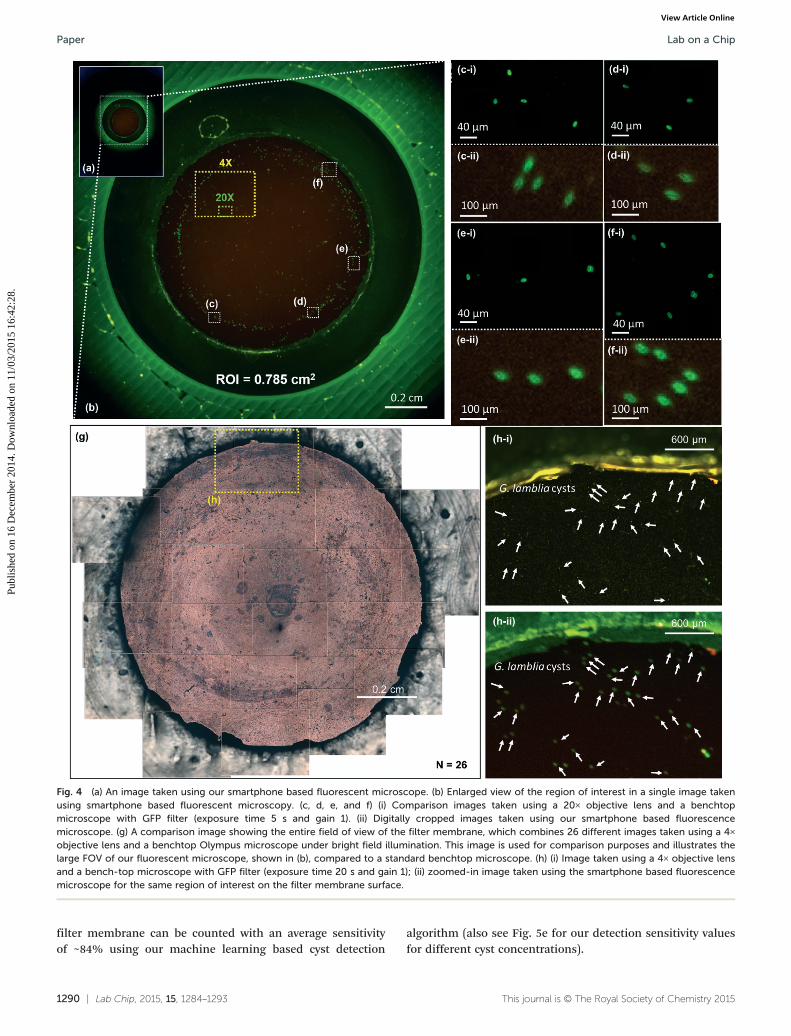
Fig. 4 (a) An image taken using our smartphone based fluorescent microscope. (b) Enlarged view of the region of interest in a single image takenusing smartphone based fluorescent microscopy. (c, d, e, and f) (i) Comparison images taken using a 20× objective lens and a benchtopmicroscope with GFP filter (exposure time 5 s and gain 1). (ii) Digitally cropped images taken using our smartphone based fluorescencemicroscope. (g) A comparison image showing the entire field of view of the filter membrane, which combines 26 different images taken using a 4×objective lens and a benchtop Olympus microscope under bright field illumination. This image is used for comparison purposes and illustrates thelarge FOV of our fluorescent microscope, shown in (b), compared to a standard benchtop microscope. (h) (i) Image taken using a 4× objective lensand a bench-top microscope with GFP filter (exposure time 20 s and gain 1); (ii) zoomed-in image taken using the smartphone based fluorescencemicroscope for the same region of interest on the filter membrane surface.
Lab on a ChipPaper
Publ
ishe
d on
16
Dec
embe
r 20
14. D
ownl
oade
d on
11/
03/2
015
16:4
2:28
. View Article Online
filter membrane can be counted with an average sensitivityof ~84% using our machine learning based cyst detection
1290 | Lab Chip, 2015, 15, 1284–1293
algorithm (also see Fig. 5e for our detection sensitivity valuesfor different cyst concentrations).
This journal is © The Royal Society of Chemistry 2015
Lab Chip, 2015, 15, 1284–1293 | 1291This journal is © The Royal Society of Chemistry 2015
Fig. 5 Limit of detection (LoD), sensitivity and specificity of our smartphone-based Giardia analyzer determined using known concentrations ofGiardia at 0, 10, 50, 100, and 500 cysts mL−1. Each concentration is measured 3 times. (a) Our cyst recovery rate as a function of the cyst concen-tration, where y = x line defines the ideal recovery curve (100% recovery). (b) Zoomed in version of (a). (c) A plot demonstrating the accuracy ofour machine learning based cyst counting algorithm. (d) Zoomed in version of (c). (e) The sensitivity of our machine learning algorithm is shown.Sensitivity = TP/(TP + FN), where TP and FN refer to True Positives and False Negatives, respectively. The specificity of our machine learning algo-rithm is shown. Specificity = TN/(TN + FP), where TN and FP refer to True Negatives and False Positives, respectively. (f) The Bland–Altman analysis,comparing smartphone-based measurement results against the results of a benchtop fluorescence microscope.
Lab on a Chip Paper
Publ
ishe
d on
16
Dec
embe
r 20
14. D
ownl
oade
d on
11/
03/2
015
16:4
2:28
. View Article Online

Lab on a ChipPaper
Publ
ishe
d on
16
Dec
embe
r 20
14. D
ownl
oade
d on
11/
03/2
015
16:4
2:28
. View Article Online
The LoD of our waterborne parasite imaging platformcan be estimated as ~12 Giardia cysts per 10 mL based onthe mean cyst count for the control samples plus 3 timestheir standard deviation27 (see Fig. 5a and b). Furthermore,the specificity of our detection method, (i.e., specificity = TN/(TN + FP), where TN and FP refer to True Negatives andFalse Positives, respectively26), can be measured as 90%,94%, 94%, and 76% for 10, 50, 100, and 500 cysts per 10 mLsamples, respectively (see Fig. 5e). We further compared theperformance of our smartphone based detection platformagainst a benchtop microscope using the Bland–Altman analysis,which shows a bias of −0.8 cysts per mL, with 95% confidenceintervals of −4.2 cysts per mL and 2.5 cysts per mL (Fig. 5f). Theseresults illustrate the success of our machine learning basedmobile microscopy platform to sensitively and specificallydetect and digitally separate cysts from other unwantedmicro-objects that are captured on the filter membrane.
To further improve our overall cyst detection performance,we can target the recovery of the cysts that are lost duringthe transfer of the water from the sample container onto theporous filter surface. Potential mechanisms for this partialloss of intact Giardia cysts in our sample processing stepsinclude: (i) rupture of the cysts due to mechanical forces andthe negative pressure that build up during the processing ofthe water sample; (ii) non-specific binding of the cysts tothe syringe barrel surface or the Luer cap; (iii) dead liquidvolumes that remain in our sample delivery scheme, whichmight function as reservoirs/traps for some Giardia cysts; and(iv) uncontrolled pore size variations or non-uniformities onthe filter membrane which might allow some cysts to passthrough the pores. Through a systematic study of thesepotential sources of cyst losses, we believe that we can furtherimprove our cyst capture efficiency on the filter membrane to>85–90% from its current value of 79%. We can also improvethe robustness of our detection platform against dirt andundesired large particles/objects that might be found in natu-ral water sources using a pre-filtration system. To handlesuch dirty natural water sources and still be able to achieve~1 cyst mL−1 level of detection limit, we can utilize a series oflarger pore filter membranes, where at each stage the poresize is gradually decreased, for example from 100 μm to 50 μmand then to ~25 μm, before the membrane filters that areemployed in our current sample holder design are used.
In terms of specificity and sensitivity of cyst detection,our machine learning algorithm utilizes a bagging approachto classify particles either as a cyst or other micro-object using71 different fluorescent image parameters as detailed in ourMethods section, and it was trained with mobile-phone basedGiardia images captured over a wide range of experiments,involving 1370 individual Giardia cyst images. To furtherimprove the performance of our machine learning code, wecan expand this cellphone based Giardia image library bycapturing e.g., >10000 individual Giardia cyst images usingour mobile microscope. This significant increase in our gold-standard image database/library should assist us in digitallyboosting our specificity and sensitivity analysis for the
1292 | Lab Chip, 2015, 15, 1284–1293
fluorescent objects that are captured on our filter membranearea. Especially, this larger training dataset of Giardia cystimages should better handle some of our current challengesin automated identification/recognition of the cysts that arecaptured at or close to the outer edges of the filter membrane,which contain some auto-fluorescence signal due to the 3Dprinted plastic material.
Conclusion
We introduced a hand-held and cost-effective mobile imagingplatform that is coupled with machine learning for auto-mated detection and enumeration of G. lamblia cysts in largevolumes of water. This platform includes a smartphone-based fluorescence microscope for imaging custom-designeddisposable water sample cassettes that capture fluorescentlylabeled Giardia cysts over a wide filter surface area (~0.8 cm2). Afluorescence image of the entire filter area is captured andtransferred to our servers using the smartphone over a wirelessnetwork for remote digital processing to automatically detectand count the Giardia cysts captured on the filter membrane.The result of this machine learning based analysis is trans-ferred back to the smartphone within 2 minutes using ourcustom-developed Windows phone application. Using flow-cytometer-enumerated Giardia spiked water samples, we dem-onstrated that this platform achieves a LoD of ~12 cysts per10 mL, where each experiment takes ~1 hour, including all thesteps of sample preparation and analysis. This portable systemis a promising tool for rapid and cost-effective on-site waterquality monitoring and spatio-temporal analysis in resource-limited regions. We also believe that this machine learningbased mobile fluorescent imaging and detection platform canbe further useful for screening of biological liquids of interest(e.g., blood and urine) and for detection and quantification ofvarious pathogens including e.g., bacteria, parasites, and eggsof parasites.
Conflicts of interest
A.O. is the co-founder of a company (Holomic LLC) that com-mercializes computational microscopy, sensing and diagnos-tics tools.
Acknowledgements
This project was funded by the Army Research Office (ARO).The Ozcan Research Group at UCLA also acknowledges thesupport of the Presidential Early Career Award for Scientistsand Engineers (PECASE), ARO Life Sciences Division (ARO;W911NF-13-1-0419 and W911NF-13-1-0197), ARO Young Inves-tigator Award, National Science Foundation (NSF) CAREERAward, NSF CBET Division Biophotonics Program, NSFEmerging Frontiers in Research and Innovation (EFRI) Award,NSF EAGER Award, Office of Naval Research (ONR), and theHoward Hughes Medical Institute (HHMI). This work is par-tially based upon research performed in a renovated laboratoryby the National Science Foundation under grant no. 0963183,
This journal is © The Royal Society of Chemistry 2015

Lab on a Chip Paper
Publ
ishe
d on
16
Dec
embe
r 20
14. D
ownl
oade
d on
11/
03/2
015
16:4
2:28
. View Article Online
which is an award funded under the American Recovery andReinvestment Act of 2009 (ARRA).
Notes and references
1 WHO, Water Quality and Health Strategy 2013–2020, http://
www.who.int/water_sanitation_health/publications/2013/water_quality_strategy.pdf?ua=1 (accessed Oct 1, 2014).2 WHO, Progress on sanitation and drinking-water - 2014 update,
http://www.who.int/water_sanitation_health/publications/2014/jmp-report/en/ (accessed Oct 1, 2014).3 Worldbank, World Development Indicators 2014, data.worldbank.
org/sites/default/files/wdi-2014-book.pdf (accessed Oct 1, 2014).4 WHO, Water Sanitation Health - Water related diseases, http://
www.who.int/water_sanitation_health/diseases/diarrhoea/en/(accessed Oct 1, 2014).5 Y.-F. Chen, L. Jiang, M. Mancuso, A. Jain, V. Oncescu and
D. Erickson, Nanoscale, 2012, 4, 4839–4857.6 S. Baldursson and P. Karanis, Water Res., 2011, 45, 6603–6614.
7 R. D. Adam, Clin. Microbiol. Rev., 2001, 14, 447–475. 8 EPA, Method 1623.1: Cryptosporidium and Giardia in Waterby Filtration/IMS/FA, 2012.9 R. H. Baque, A. O. Gilliam, L. D. Robles, W. Jakubowski and
T. R. Slifko, Water Res., 2011, 45, 3175–3184.10 H. Bridle, M. Kersaudy-Kerhoas, B. Miller, D. Gavriilidou,
F. Katzer, E. Innes and A. M. P. Y. Desmulliez, Water Res.,2012, 46, 1641–1661.
11 H.-A. Keserue, H. P. Füchslin and T. Egli, Appl. Environ.
Microbiol., 2011, 77, 5420–5427.12 H.-A. Keserue, H. P. Füchslin, M. Wittwer, H. Nguyen-Viet,
T. T. Nguyen, N. Surinkul, T. Koottatep, N. Schürch andT. Egli, Environ. Sci. Technol., 2012, 46, 8952–8959.This journal is © The Royal Society of Chemistry 2015
13 A. V. Koehler, A. R. Jex, S. R. Haydon, M. A. Stevens and
R. B. Gasser, Biotechnol. Adv., 2014, 32, 280–289.14 S. A. Lee, J. Erath, G. Zheng, X. Ou, P. Willems, D. Eichinger,
A. Rodriguez and C. Yang, PLoS One, 2014, 9, e89712.15 O. Mudanyali, C. Oztoprak, D. Tseng, A. Erlinger and
A. Ozcan, Lab Chip, 2010, 10, 2419–2423.16 E. R. Rhodes, L. F. Villegas, N. J. Shaw, C. Miller and
E. N. Villegas, J. Visualized Exp., 2012, 1–6.17 H. Zhu, S. O. Isikman, O. Mudanyali, A. Greenbaum and
A. Ozcan, Lab Chip, 2013, 13, 51–67.18 A. Ozcan, Lab Chip, 2014, 14, 3187–3194.
19 G. P. Vonk, Test Device Including Flow Control Means,US5185127, 1993.20 Q. Wei, H. Qi, W. Luo, D. Tseng, S. J. Ki, Z. Wan,
L. A. Bentolila, T. Wu, R. Sun and A. Ozcan, ACS Nano, 2013,7, 9147–9155.
21 Q. Wei, W. Luo, S. Chiang, T. Kappel, C. Mejia, D. Tseng,
R. Y. L. Chan, E. Yan, H. Qi, F. Shabbir, H. Ozkan, S. Fengand A. Ozcan, ACS Nano, 2014, DOI: 10.1021/nn505821y.22 P. Larranaga, B. Calvo, R. Sanatana, C. Bielza, J. Galdiano,
I. Inza, J. Lozano, R. Armananzas, G. Sanatafe and A. Perez,et al., Briefings Bioinf., 2006, 7, 86–112.23 J. R. Quinlan, In Proceedings of the Thirteenth National
Conference on Artificial Intelligence and the Eigth InnovativeApplications of Artificial Intelligence Conference, 1996,pp. 725–730.24 A. C. Tan and D. Gilbert, Appl. Bioinf., 2003, 2, 1–10.
25 E. Mjolsness and D. DeCoste, Science, 2001, 293, 2051–2055. 26 K. H. Zou, A. J. O'Malley and L. Mauri, Circulation, 2007,115, 654–657.27 H. Zhu, U. Sikora and A. Ozcan, Analyst, 2012, 137,
2541–2544.
Lab Chip, 2015, 15, 1284–1293 | 1293