robust tracking in cellular networks using hmm filters and cell-id measurements
TRANSCRIPT
Linköping University Post Print
Robust Tracking in Cellular Networks Using
HMM Filters and Cell-ID Measurements
Mussa Bshara, Umut Orguner, Fredrik Gustafsson and Leo Van Biesen
N.B.: When citing this work, cite the original article.
©2011 IEEE. Personal use of this material is permitted. However, permission to
reprint/republish this material for advertising or promotional purposes or for creating new
collective works for resale or redistribution to servers or lists, or to reuse any copyrighted
component of this work in other works must be obtained from the IEEE.
Mussa Bshara, Umut Orguner, Fredrik Gustafsson and Leo Van Biesen, Robust Tracking in
Cellular Networks Using HMM Filters and Cell-ID Measurements, 2011, IEEE
TRANSACTIONS ON VEHICULAR TECHNOLOGY, (60), 3, 1016-1024.
http://dx.doi.org/10.1109/TVT.2011.2107926
Postprint available at: Linköping University Electronic Press
http://urn.kb.se/resolve?urn=urn:nbn:se:liu:diva-67307
IEEE TRANSACTIONS ON VEHICULAR TECHNOLOGY, VOL. X, NO. X, MONTH YEAR 1
Robust Tracking in Cellular Networks Using HMMFilters and Cell-ID Measurements
Mussa Bshara, Member, IEEE, Umut Orguner, Member, IEEE, Fredrik Gustafsson, Senior Member, IEEE,and Leo Van Biesen, Senior Member, IEEE
Abstract—A localization algorithm based on cell identification(Cell-ID) information is proposed. Instead of building the lo-calization decisions only on the serving base station (BS), alldetected Cell-IDs (serving or non-serving) by the mobile station(MS) are utilized. The statistical modeling of user motion and themeasurements is done via a Hidden Markov Model (HMM) andthe localization decisions are made with Maximum A Posteriori(MAP) estimation criterion using the posterior probabilities froman HMM filter. The results are observed and compared tostandard alternatives on an example whose data were collectedfrom a WiMAX network in a challenging urban area in theBrussels capitol city.
Index Terms—Cell-ID, hidden Markov model, HMM, GPS,GSM, mobile WiMAX, navigation, LBS, positioning, positioningaccuracy, WiMAX networks.
I. INTRODUCTION
LOCALIZATION in wireless networks has attracted a lotof interest as a supporting means to services that require
sufficient localization accuracy (see [1] and the referencestherein). This includes location based services (LBSs), nav-igation, tracking, security applications etc.. Historically, theneed of locating users with mobile devices arises to respondto security applications such as tracking users with emergencycalls made by cellular phones [U.S. Enhanced 911 (E-911)].Indeed the regulations adopted by the U.S. federal Commu-nications Commission (FCC) require that all the emergencycalls made by cellular phones have to be localized within anaccuracy of 125 m in 67% of the cases [2]. Localization canbe done by measuring physical quantities related to the radiosignal traveling between a mobile terminal or a subscriberstation (SS) and a set of base stations (BSs), such as receivedsignal strength (RSS), time of arrival (TOA), time differenceof arrival (TDOA), angle of arrival (AOA), and Cell-ID.A broad spectrum of solutions can be found in literatureincluding those based on RSS [3–6], TOA [7], TDOA [8]
Copyright (c) 2011 IEEE. Personal use of this material is permitted.However, permission to use this material for any other purposes must beobtained from the IEEE by sending a request to [email protected].
Mussa Bshara is currently with the Department of Communication Engi-neering at HIAST (Higher Institute For Applied Sciences and Technology),Damascus, Syria. He has been with the the Department of FundamentalElectricity and Instrumentation, Vrije Universiteit Brussel, Brussels, Belgiumup to July 2010 (e-mail: [email protected]).
Leo Van Biesen is with the Department of Fundamental Electricity andInstrumentation, Vrije Universiteit Brussel, Brussels, Belgium (e-mail: [email protected]).
Umut Orguner and Fredrik Gustafsson are with the Department of ElectricalEngineering, Linkoping University, 581 83, Linkoping, Sweden (e-mail:{umut,fredrik}@isy.liu.se).
Manuscript received 01,2011
and AOA [9, 10]. More recently, a localization approach thatuses a combination of the mentioned measurements has beenproposed in [11]. Such hybrid techniques guarantee a higherlocalization accuracy. Most of the conventional localizationmethods have been developed to operate under line-of-sight(LOS) propagation conditions. However, due to the electro-magnetic propagation properties especially in urban areas, thenon-line-of-sight (NLOS) errors are very likely to corruptthe original signal. A number of methods have been usedto mitigate the NLOS errors [12]. Some techniques exploitthe multipath characteristics of the environment, such as theFingerprinting [13–16] (See [17] for a very recent example).All the mentioned techniques above require some adjustmentor modification (adding some hardware or software) to beimplemented in the SS or BS. It is apparent that the accuracyand the required adjustments are tightly related. The higher therequired accuracy is, the more adjustments that are required,which means additional cost and more computational burden.From this point of view, despite its low accuracy [18, 19],Cell-ID positioning is the first positioning method that hasbeen used by GSM operators to provide LBSs. Its simplicityand low cost made it the most preferable way to positiona network user when the obtained accuracy is enough forthe required application. The Cell-IDs are transmitted overthe control channel and easy to obtain with no extra cost.It is enough to associate the Cell-ID of the serving basestation with its location (which is known to the system) tohave a positioning system. This explains why this methodis cheap, fast and suitable for applications requiring highcapacity. The “low accuracy” has always been a characteristicof the Cell-ID positioning due to the relatively large cell sizein GSM networks, especially in rural areas. Some publicationsproposed using enhanced Cell-ID positioning, which uses thetiming advance (TA) value to reduce the cell size, and hence,improving the accuracy [20].
WiMAX networks started to be widely deployed providingthe infrastructure for LBSs. The mobile WiMAX standard,which is expected to be finalized in the near future (the end of2010), will be providing LBSs to WiMAX users. This meansthat the need for simple, cheap and preferably network depen-dent ways to locate mobile and fixed modems is becomingmore urgent. In this paper, the Cell-ID localization problemis solved by an approach that is not restricted to the servingBS Cell-ID only, but it makes use of all the detected Cell-IDsby an MS at a certain time instant, with an HMM filter tolocate the users. The method can be implemented either asnetwork-centric or mobile-centric, with different requirements
IEEE TRANSACTIONS ON VEHICULAR TECHNOLOGY, VOL. X, NO. X, MONTH YEAR 2
on the mobile’s activity. In the former case, the base stationcan force the mobile to make and send measurement reportsas long as the phone is on, it has not to be active. In thelatter case, the mobile can always decide this. We presentour results along with remarks on WiMAX networks whichwere the main motivation and the illustrative case study forthis research. However, it must be emphasized that our resultsequally apply to other types of networks. The importance ofthe contributions of this paper can be summarized as follows:• The method proposed in this paper makes use of all the
available Cell-IDs to the user in the localization, whichis contrary to the current methods that utilize only thatof the serving BS.
• A simple but practical way to form an HMM modelfrom a database obtained by measurement campaigns isproposed and illustrated on a real life example.
The rest of the paper is organized as follows. Section IIdiscusses the discretization of the area under study and thedatabase construction both of which are quite important whenone works with HMMs. Both the HMM model and the filter,which form the main contribution of this paper, are detailed inSection III. The results with localization accuracy assessmentand comparison with other techniques are provided in SectionIV which also presents some experimental studies investigatingthe effects of different algorithm parameter selections. Sec-tion V draws some conclusions which finalizes the paper.
II. AREA DISCRETIZATION AND DATABASECONSTRUCTION
A. Area Discretization
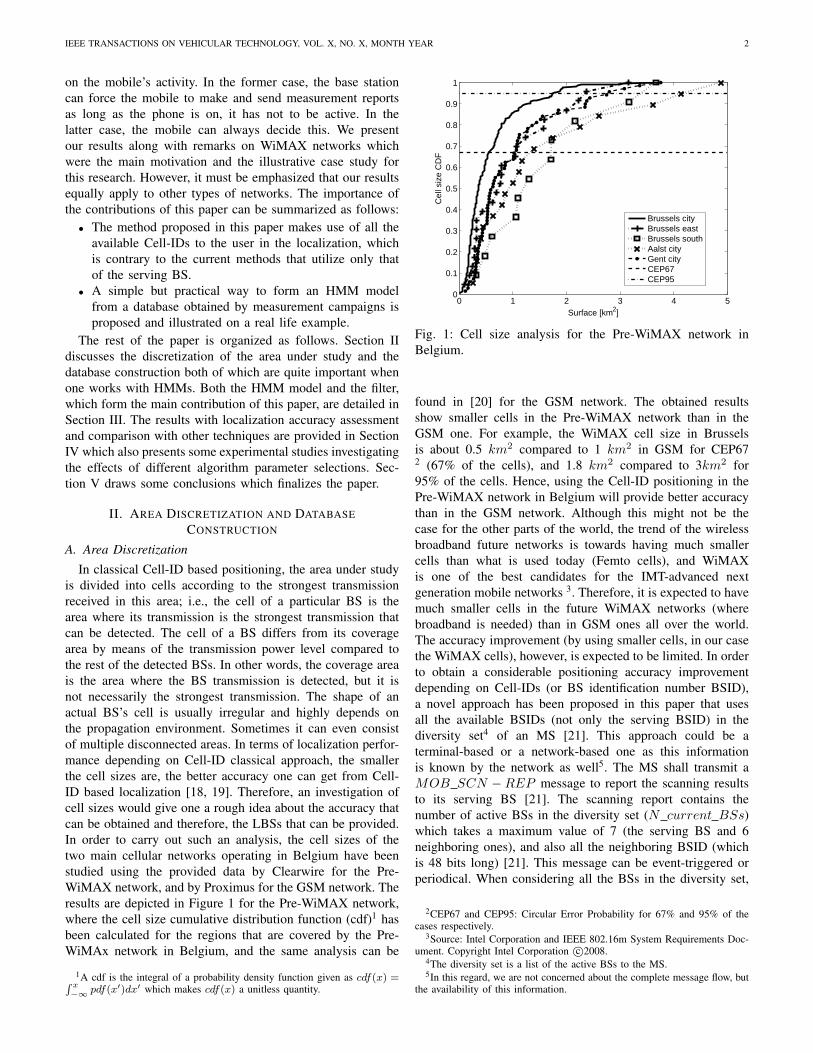
In classical Cell-ID based positioning, the area under studyis divided into cells according to the strongest transmissionreceived in this area; i.e., the cell of a particular BS is thearea where its transmission is the strongest transmission thatcan be detected. The cell of a BS differs from its coveragearea by means of the transmission power level compared tothe rest of the detected BSs. In other words, the coverage areais the area where the BS transmission is detected, but it isnot necessarily the strongest transmission. The shape of anactual BS’s cell is usually irregular and highly depends onthe propagation environment. Sometimes it can even consistof multiple disconnected areas. In terms of localization perfor-mance depending on Cell-ID classical approach, the smallerthe cell sizes are, the better accuracy one can get from Cell-ID based localization [18, 19]. Therefore, an investigation ofcell sizes would give one a rough idea about the accuracy thatcan be obtained and therefore, the LBSs that can be provided.In order to carry out such an analysis, the cell sizes of thetwo main cellular networks operating in Belgium have beenstudied using the provided data by Clearwire for the Pre-WiMAX network, and by Proximus for the GSM network. Theresults are depicted in Figure 1 for the Pre-WiMAX network,where the cell size cumulative distribution function (cdf)1 hasbeen calculated for the regions that are covered by the Pre-WiMAx network in Belgium, and the same analysis can be
1A cdf is the integral of a probability density function given as cdf(x) =∫ x−∞ pdf(x′)dx′ which makes cdf(x) a unitless quantity.
0 1 2 3 4 50
0.1
0.2
0.3
0.4
0.5
0.6
0.7
0.8
0.9
1
Surface [km2]
Cel
l siz
e C
DF
Brussels cityBrussels eastBrussels southAalst cityGent cityCEP67CEP95
Fig. 1: Cell size analysis for the Pre-WiMAX network inBelgium.
found in [20] for the GSM network. The obtained resultsshow smaller cells in the Pre-WiMAX network than in theGSM one. For example, the WiMAX cell size in Brusselsis about 0.5 km2 compared to 1 km2 in GSM for CEP672 (67% of the cells), and 1.8 km2 compared to 3km2 for95% of the cells. Hence, using the Cell-ID positioning in thePre-WiMAX network in Belgium will provide better accuracythan in the GSM network. Although this might not be thecase for the other parts of the world, the trend of the wirelessbroadband future networks is towards having much smallercells than what is used today (Femto cells), and WiMAXis one of the best candidates for the IMT-advanced nextgeneration mobile networks 3. Therefore, it is expected to havemuch smaller cells in the future WiMAX networks (wherebroadband is needed) than in GSM ones all over the world.The accuracy improvement (by using smaller cells, in our casethe WiMAX cells), however, is expected to be limited. In orderto obtain a considerable positioning accuracy improvementdepending on Cell-IDs (or BS identification number BSID),a novel approach has been proposed in this paper that usesall the available BSIDs (not only the serving BSID) in thediversity set4 of an MS [21]. This approach could be aterminal-based or a network-based one as this informationis known by the network as well5. The MS shall transmit aMOB SCN −REP message to report the scanning resultsto its serving BS [21]. The scanning report contains thenumber of active BSs in the diversity set (N current BSs)which takes a maximum value of 7 (the serving BS and 6neighboring ones), and also all the neighboring BSID (whichis 48 bits long) [21]. This message can be event-triggered orperiodical. When considering all the BSs in the diversity set,
2CEP67 and CEP95: Circular Error Probability for 67% and 95% of thecases respectively.
3Source: Intel Corporation and IEEE 802.16m System Requirements Doc-ument. Copyright Intel Corporation c©2008.
4The diversity set is a list of the active BSs to the MS.5In this regard, we are not concerned about the complete message flow, but
the availability of this information.
IEEE TRANSACTIONS ON VEHICULAR TECHNOLOGY, VOL. X, NO. X, MONTH YEAR 3
0 200 400 600 800 1000 1200 1400 16000
200
400
600
800
1000
1200
1400
1600
1800
X coordinates[m]
Y c
oord
inat
es[m
]
site1 (BS1,BS2)site2 (BS3,BS4,BS5)site3 (BS6,BS7)measurement point
1 2 3 4 5 6 7
8 9 10 11 12 14
15 16 17 18 19 20 21
22 23 24 25 26 27 28
29 30 31 32 33
34 35 36
Spot number
13
37 38
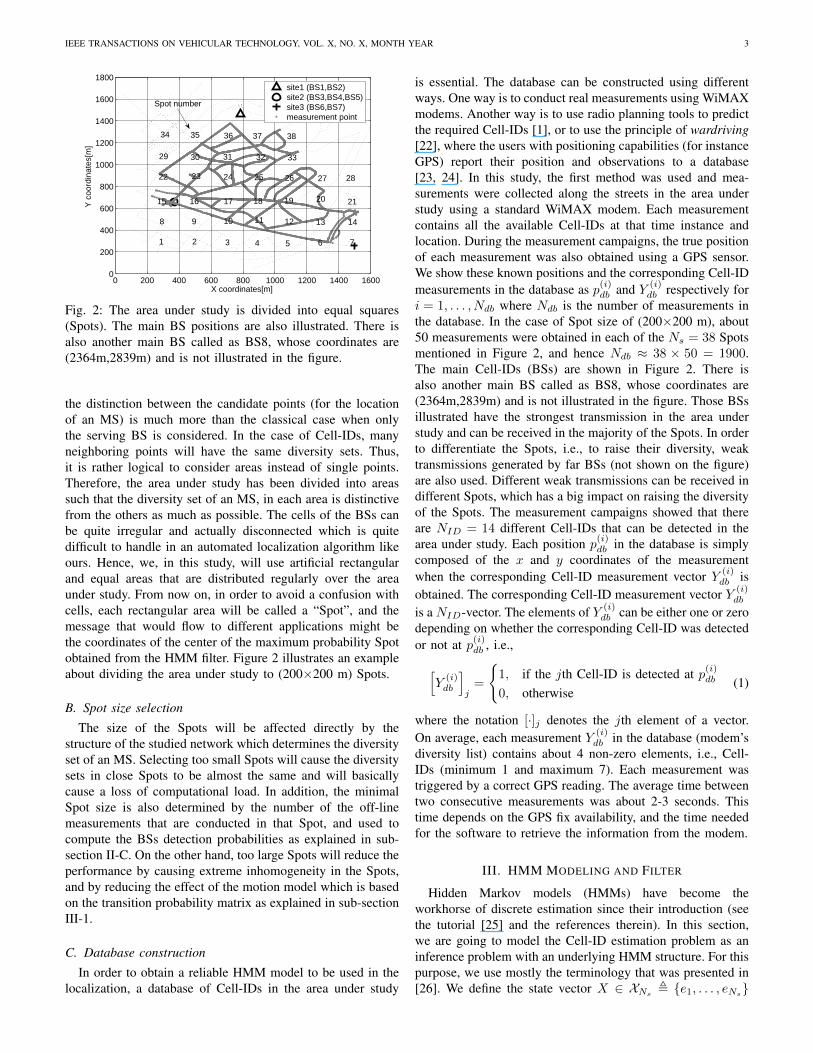
Fig. 2: The area under study is divided into equal squares(Spots). The main BS positions are also illustrated. There isalso another main BS called as BS8, whose coordinates are(2364m,2839m) and is not illustrated in the figure.
the distinction between the candidate points (for the locationof an MS) is much more than the classical case when onlythe serving BS is considered. In the case of Cell-IDs, manyneighboring points will have the same diversity sets. Thus,it is rather logical to consider areas instead of single points.Therefore, the area under study has been divided into areassuch that the diversity set of an MS, in each area is distinctivefrom the others as much as possible. The cells of the BSs canbe quite irregular and actually disconnected which is quitedifficult to handle in an automated localization algorithm likeours. Hence, we, in this study, will use artificial rectangularand equal areas that are distributed regularly over the areaunder study. From now on, in order to avoid a confusion withcells, each rectangular area will be called a “Spot”, and themessage that would flow to different applications might bethe coordinates of the center of the maximum probability Spotobtained from the HMM filter. Figure 2 illustrates an exampleabout dividing the area under study to (200×200 m) Spots.
B. Spot size selection
The size of the Spots will be affected directly by thestructure of the studied network which determines the diversityset of an MS. Selecting too small Spots will cause the diversitysets in close Spots to be almost the same and will basicallycause a loss of computational load. In addition, the minimalSpot size is also determined by the number of the off-linemeasurements that are conducted in that Spot, and used tocompute the BSs detection probabilities as explained in sub-section II-C. On the other hand, too large Spots will reduce theperformance by causing extreme inhomogeneity in the Spots,and by reducing the effect of the motion model which is basedon the transition probability matrix as explained in sub-sectionIII-1.
C. Database construction
In order to obtain a reliable HMM model to be used in thelocalization, a database of Cell-IDs in the area under study
is essential. The database can be constructed using differentways. One way is to conduct real measurements using WiMAXmodems. Another way is to use radio planning tools to predictthe required Cell-IDs [1], or to use the principle of wardriving[22], where the users with positioning capabilities (for instanceGPS) report their position and observations to a database[23, 24]. In this study, the first method was used and mea-surements were collected along the streets in the area understudy using a standard WiMAX modem. Each measurementcontains all the available Cell-IDs at that time instance andlocation. During the measurement campaigns, the true positionof each measurement was also obtained using a GPS sensor.We show these known positions and the corresponding Cell-IDmeasurements in the database as p(i)
db and Y (i)db respectively for
i = 1, . . . , Ndb where Ndb is the number of measurements inthe database. In the case of Spot size of (200×200 m), about50 measurements were obtained in each of the Ns = 38 Spotsmentioned in Figure 2, and hence Ndb ≈ 38 × 50 = 1900.The main Cell-IDs (BSs) are shown in Figure 2. There isalso another main BS called as BS8, whose coordinates are(2364m,2839m) and is not illustrated in the figure. Those BSsillustrated have the strongest transmission in the area understudy and can be received in the majority of the Spots. In orderto differentiate the Spots, i.e., to raise their diversity, weaktransmissions generated by far BSs (not shown on the figure)are also used. Different weak transmissions can be received indifferent Spots, which has a big impact on raising the diversityof the Spots. The measurement campaigns showed that thereare NID = 14 different Cell-IDs that can be detected in thearea under study. Each position p(i)
db in the database is simplycomposed of the x and y coordinates of the measurementwhen the corresponding Cell-ID measurement vector Y (i)
db isobtained. The corresponding Cell-ID measurement vector Y (i)
db
is a NID-vector. The elements of Y (i)db can be either one or zero
depending on whether the corresponding Cell-ID was detectedor not at p(i)
db , i.e.,[Y
(i)db
]j
=
{1, if the jth Cell-ID is detected at p(i)
db
0, otherwise(1)
where the notation [·]j denotes the jth element of a vector.On average, each measurement Y (i)
db in the database (modem’sdiversity list) contains about 4 non-zero elements, i.e., Cell-IDs (minimum 1 and maximum 7). Each measurement wastriggered by a correct GPS reading. The average time betweentwo consecutive measurements was about 2-3 seconds. Thistime depends on the GPS fix availability, and the time neededfor the software to retrieve the information from the modem.
III. HMM MODELING AND FILTER
Hidden Markov models (HMMs) have become theworkhorse of discrete estimation since their introduction (seethe tutorial [25] and the references therein). In this section,we are going to model the Cell-ID estimation problem as aninference problem with an underlying HMM structure. For thispurpose, we use mostly the terminology that was presented in[26]. We define the state vector X ∈ XNs , {e1, . . . , eNs}
IEEE TRANSACTIONS ON VEHICULAR TECHNOLOGY, VOL. X, NO. X, MONTH YEAR 4
where ei are unit vectors in RNs which has all zero elementsexcept the ith element which is unity. The integer Ns repre-sents the number of Spots present. Notice that, with this statevector, the event Xk = ei represents the case where the targetis in the ith Spot at time k. We assume that the sequence {Xk}is Markov and we have the equality
E[Xk+1|Xk] = ΠTXk (2)
where Π , [πij ] is the so-called probability transition matrixof size Ns ×Ns with
πij , P (Xk+1 = ej |Xk = ei). (3)
We define the measurement vector Y ∈ RNID similarly todatabase measurement vectors Y
(i)db defined in the previous
section. Notice that the classical HMM framework allows onlyone element of Y to be unity and the others should be all zero.However, in our work, since we can collect multiple Cell-IDs at the same time, we allow multiple nonzero elements.We assume that the elements of the measurement Yk areindependent given the state Xk, where k represents the timeinstant that the measurement Yk is collected and we have theequality
E[Yk|Xk] = HXk (4)
where the matrix H , [hij ] of size NID × Ns has theprobabilities hij defined as
hij = P ([Yk]i = 1|Xk = ej). (5)
At this point, we have another distinction from the classicalHMM framework which is, the probabilities hij do not haveto satisfy
∑NID
i=1 hij = 1 (more on this in the modeling sub-section III-2).
The Cell-ID estimation problem related to this frameworkcan be stated as finding the state estimate
Xk|k = E[Xk|Y0:k] (6)
where Y0:k denotes all the measurement obtained between time0 and k, i.e., Y0:k , {Y0, Y1, . . . , Yk}. Notice here that thesolution Xk|k might not be in the original (discrete) statespace XNs but it satisfies
∑Ns
i=1 [Xk|k]i
= 1 and hence theelements [Xk|k]
iof the estimate can be interpreted as the
posterior probabilities P (Xk = ei|Y0:k) i.e., the probabilitythat the target is in the ith Spot given all the measurements.
The recursive solution of the problem (6) is given by theso called HMM-filter [25, 26]. This algorithm is summarizedbelow.
Algorithm 1 (HMM Filter):
1) Initialization: Select an initial estimate X0|0 = X . Setk = 1.
2) Prediction update: Predict the state estimate using themodel (2) as
Xk|k−1 = ΠTXk−1|k−1 (7)
3) Measurement update: Calculate the measurement up-dated estimate Xk|k from the predicted estimate Xk|k−1
using the model (4) and the measurement Yk as
Xk|k =LYk� Xk|k−1∑Ns
i=1
[LYk� Xk|k−1
]i
(8)
where the likelihood vector LYk∈ RNs is defined with
the elements
[LYk]i , P (Yk|Xk = ei) (9)
and the sign � denotes the Hadamard product (element-wise multiplication) of the vectors.
4) If a location (Spot) estimate ck is to be found, oneselects the Spot corresponding to the maximum elementof Xk|k, i.e.,
ck = arg maxi
[Xk|k]i. (10)
5) If there is a measurement Yk+1, set k = k + 1 and goto step 2. Otherwise, stop.
Having defined the HMM filtering, in the following parts ofthis section, we are going to concentrate on the modeling partand examine how the model parameter matrices Π, H and thelikelihood vector LYk
are to be formed.1) Transition Probability Matrix Π: The transition proba-
bility matrix used in the prediction step of the HMM filteris constructed using the road network properties. Once thetarget is in a specific Spot, it is much more probable that itis going to stay in the same Spot rather than moving intoanother one. This property results in a diagonally dominanttransition probability matrix. The probabilities of Spot-to-Spottransitions can be arranged using the road network informationor Spot proximities when one lacks the road information. Itis generally a reasonable idea to reduce the transition prob-abilities when the corresponding Spots get farther. Very farSpots could be assigned zero transition probabilities. However,this would make the algorithm not be able to recover fromwrong estimates due to highly noisy measurements. Hence itis reasonable that the lower bound of the probabilities canbe selected to be slightly larger than zero so that every Spottransition is possible (although with a very low probability)and the HMM filter can make quick corrections to its estimatedSpot via measurements. Overall we use the following simplealgorithm for this purpose.
Algorithm 2 (Transition Probability Selection): For eachSpot i,
1) Determine the set of neighbor Spots Λi ={λ1, λ2, . . . , λ|Λi|} using the road network and/orSpot proximity. Here the integer |Λi| denotes thecardinality of the set Λi i.e., the number of neighborsof Spot i.
2) Select two probabilities 0 < p1, p2 < 1 such that
p1 > |Λi|p2 and p1 + |Λi|p2 < 1. (11)
IEEE TRANSACTIONS ON VEHICULAR TECHNOLOGY, VOL. X, NO. X, MONTH YEAR 5
3) Assign the probabilities {πij}Nsj=1 as
πij =
p1 j = i
p2 j ∈ Λi1−p1−|Λi|p2
Ns−|Λi|−1 otherwise. (12)
Notice that in the above algorithm, the probabilities cor-responding to the neighbor Spots were selected all equal(as p2) for the sake of simplicity but each neighbor canactually have a different probability based on the road networkinformation if available6. In such a case the terms |Λi|p2 in(11) and (12), which stand for the total probability mass ofthe neighbor Spots should be replaced with the summation∑
j∈Λipj2 where pj2 denotes the specific probability assigned
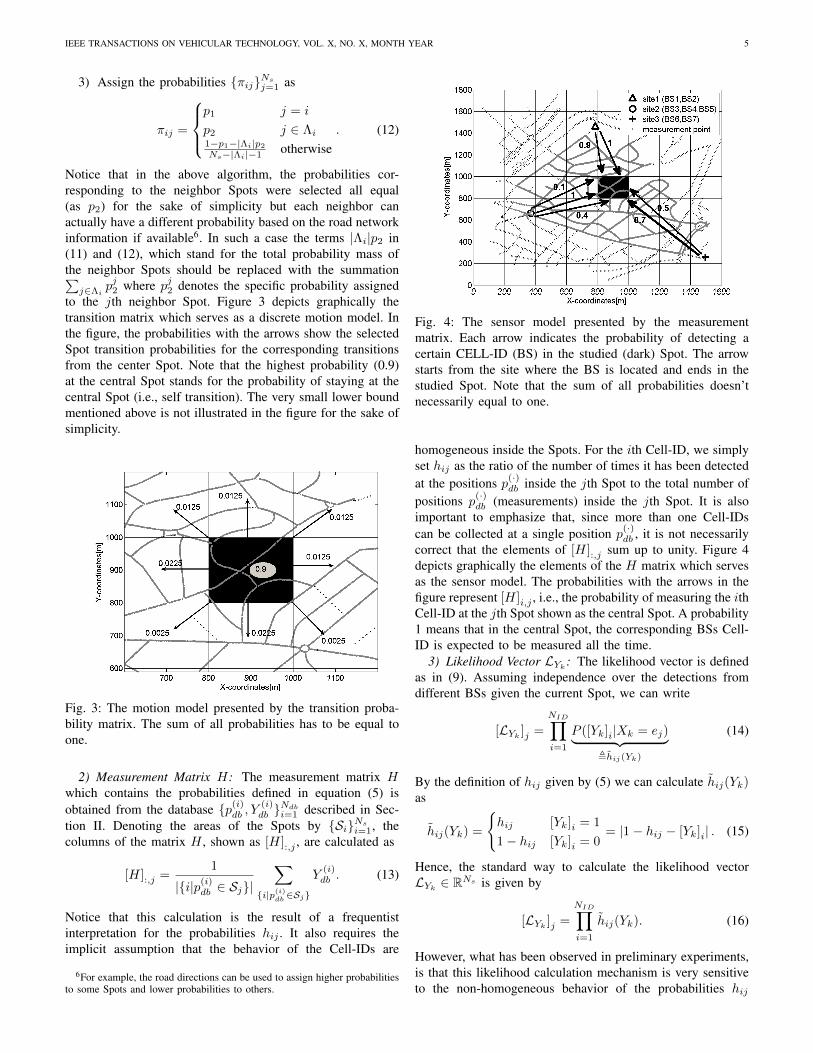
to the jth neighbor Spot. Figure 3 depicts graphically thetransition matrix which serves as a discrete motion model. Inthe figure, the probabilities with the arrows show the selectedSpot transition probabilities for the corresponding transitionsfrom the center Spot. Note that the highest probability (0.9)at the central Spot stands for the probability of staying at thecentral Spot (i.e., self transition). The very small lower boundmentioned above is not illustrated in the figure for the sake ofsimplicity.
Fig. 3: The motion model presented by the transition proba-bility matrix. The sum of all probabilities has to be equal toone.
2) Measurement Matrix H: The measurement matrix Hwhich contains the probabilities defined in equation (5) isobtained from the database {p(i)
db , Y(i)db }
Ndbi=1 described in Sec-
tion II. Denoting the areas of the Spots by {Si}Nsi=1, the
columns of the matrix H , shown as [H]:,j , are calculated as
[H]:,j =1
|{i|p(i)db ∈ Sj}|
∑{i|p(i)
db ∈Sj}
Y(i)db . (13)
Notice that this calculation is the result of a frequentistinterpretation for the probabilities hij . It also requires theimplicit assumption that the behavior of the Cell-IDs are
6For example, the road directions can be used to assign higher probabilitiesto some Spots and lower probabilities to others.
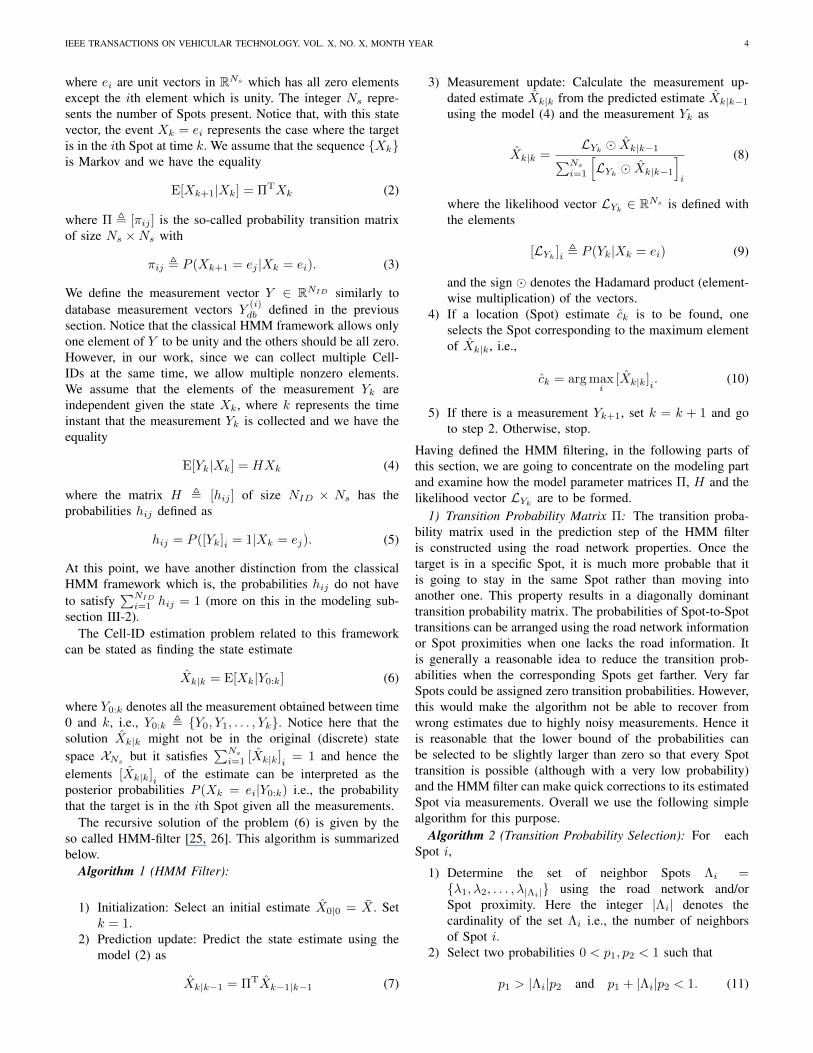
Fig. 4: The sensor model presented by the measurementmatrix. Each arrow indicates the probability of detecting acertain CELL-ID (BS) in the studied (dark) Spot. The arrowstarts from the site where the BS is located and ends in thestudied Spot. Note that the sum of all probabilities doesn’tnecessarily equal to one.
homogeneous inside the Spots. For the ith Cell-ID, we simplyset hij as the ratio of the number of times it has been detectedat the positions p(·)
db inside the jth Spot to the total number ofpositions p(·)
db (measurements) inside the jth Spot. It is alsoimportant to emphasize that, since more than one Cell-IDscan be collected at a single position p(·)
db , it is not necessarilycorrect that the elements of [H]:,j sum up to unity. Figure 4depicts graphically the elements of the H matrix which servesas the sensor model. The probabilities with the arrows in thefigure represent [H]i,j , i.e., the probability of measuring the ithCell-ID at the jth Spot shown as the central Spot. A probability1 means that in the central Spot, the corresponding BSs Cell-ID is expected to be measured all the time.
3) Likelihood Vector LYk: The likelihood vector is defined
as in (9). Assuming independence over the detections fromdifferent BSs given the current Spot, we can write
[LYk]j =
NID∏i=1
P ([Yk]i|Xk = ej)︸ ︷︷ ︸,hij(Yk)
(14)
By the definition of hij given by (5) we can calculate hij(Yk)as
hij(Yk) =
{hij [Yk]i = 1
1− hij [Yk]i = 0= |1− hij − [Yk]i| . (15)
Hence, the standard way to calculate the likelihood vectorLYk∈ RNs is given by
[LYk]j =
NID∏i=1
hij(Yk). (16)
However, what has been observed in preliminary experiments,is that this likelihood calculation mechanism is very sensitiveto the non-homogeneous behavior of the probabilities hij
IEEE TRANSACTIONS ON VEHICULAR TECHNOLOGY, VOL. X, NO. X, MONTH YEAR 6
0 100 200 300 400 500 600 7000
2
4
6
8
10
12
14
15
Time index [k]
BS
No.
(Cel
l ID
)
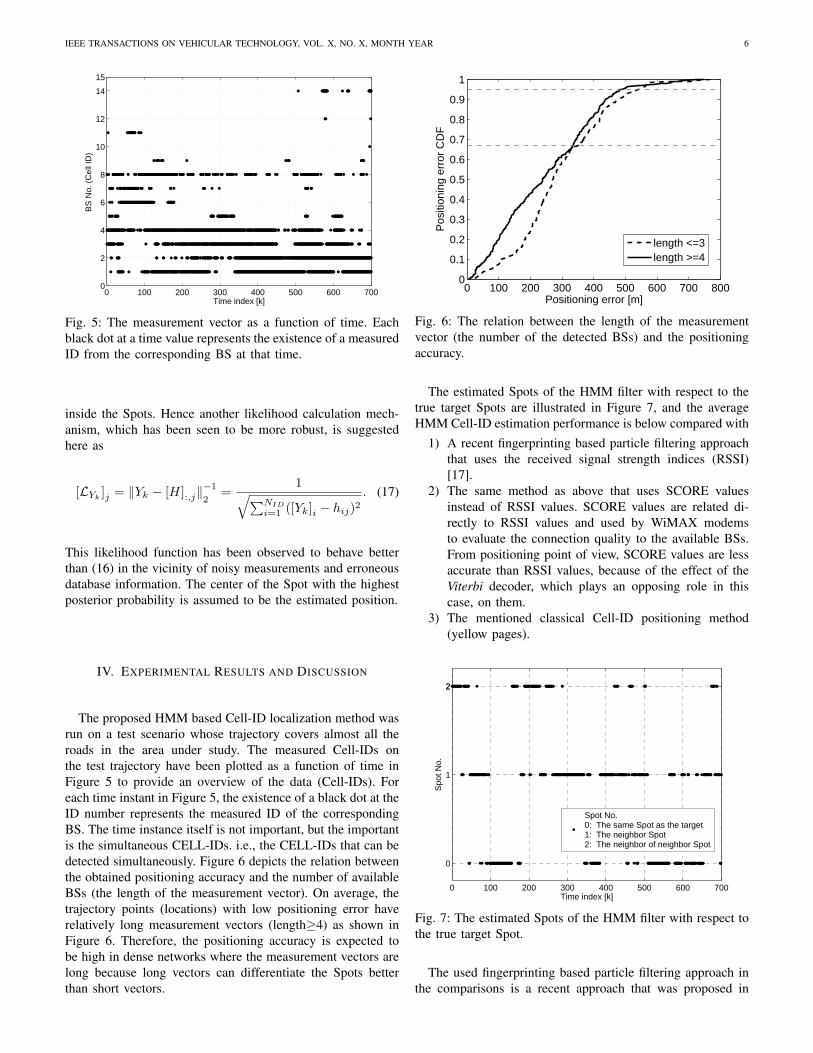
Fig. 5: The measurement vector as a function of time. Eachblack dot at a time value represents the existence of a measuredID from the corresponding BS at that time.
inside the Spots. Hence another likelihood calculation mech-anism, which has been seen to be more robust, is suggestedhere as
[LYk]j = ‖Yk − [H]:,j‖
−1
2=
1√∑NID
i=1 ([Yk]i − hij)2
. (17)
This likelihood function has been observed to behave betterthan (16) in the vicinity of noisy measurements and erroneousdatabase information. The center of the Spot with the highestposterior probability is assumed to be the estimated position.
IV. EXPERIMENTAL RESULTS AND DISCUSSION
The proposed HMM based Cell-ID localization method wasrun on a test scenario whose trajectory covers almost all theroads in the area under study. The measured Cell-IDs onthe test trajectory have been plotted as a function of time inFigure 5 to provide an overview of the data (Cell-IDs). Foreach time instant in Figure 5, the existence of a black dot at theID number represents the measured ID of the correspondingBS. The time instance itself is not important, but the importantis the simultaneous CELL-IDs. i.e., the CELL-IDs that can bedetected simultaneously. Figure 6 depicts the relation betweenthe obtained positioning accuracy and the number of availableBSs (the length of the measurement vector). On average, thetrajectory points (locations) with low positioning error haverelatively long measurement vectors (length≥4) as shown inFigure 6. Therefore, the positioning accuracy is expected tobe high in dense networks where the measurement vectors arelong because long vectors can differentiate the Spots betterthan short vectors.
0 100 200 300 400 500 600 700 8000
0.1
0.2
0.3
0.4
0.5
0.6
0.7
0.8
0.9
1
Positioning error [m]
Pos
ition
ing
erro
r CD
F
length <=3length >=4
Fig. 6: The relation between the length of the measurementvector (the number of the detected BSs) and the positioningaccuracy.
The estimated Spots of the HMM filter with respect to thetrue target Spots are illustrated in Figure 7, and the averageHMM Cell-ID estimation performance is below compared with
1) A recent fingerprinting based particle filtering approachthat uses the received signal strength indices (RSSI)[17].
2) The same method as above that uses SCORE valuesinstead of RSSI values. SCORE values are related di-rectly to RSSI values and used by WiMAX modemsto evaluate the connection quality to the available BSs.From positioning point of view, SCORE values are lessaccurate than RSSI values, because of the effect of theViterbi decoder, which plays an opposing role in thiscase, on them.
3) The mentioned classical Cell-ID positioning method(yellow pages).
0 100 200 300 400 500 600 700
0
1
22
Time index [k]
Spo
t No.
Spot No.0: The same Spot as the target1: The neighbor Spot2: The neighbor of neighbor Spot
Fig. 7: The estimated Spots of the HMM filter with respect tothe true target Spot.
The used fingerprinting based particle filtering approach inthe comparisons is a recent approach that was proposed in
IEEE TRANSACTIONS ON VEHICULAR TECHNOLOGY, VOL. X, NO. X, MONTH YEAR 7
0 200 400 600 800 1000 1200 1400 16000
0.1
0.2
0.3
0.4
0.5
0.6
0.7
0.8
0.9
1
Positioning error [m]
Pos
ition
ing
erro
r C
DF
HMM filter using Cell IDFingerprinting using RSSIFingerprinting using SCOREClassical Cell ID (yellow pages)
Fig. 8: Positioning accuracy assessment. A comparison be-tween the proposed approach, Fingerprinting (using RSSI andSCORE) and the classical Cell-ID approach.
[17]. The classical fingerprinting, which involves comparingthe online measurement vectors with a previously obtaineddatabase to make localization, is known for a long time[16]. The method derived in [17] gives an integration of thefingerprinting, which is well-known to be able to model themulti-path effects and fast fading sufficiently, with the particlefilters (PFs) [27, 28] yielding much better results than thePFs equipped only with classical log-power model (called asOkumura-Hata model in the literature [29, 30]).
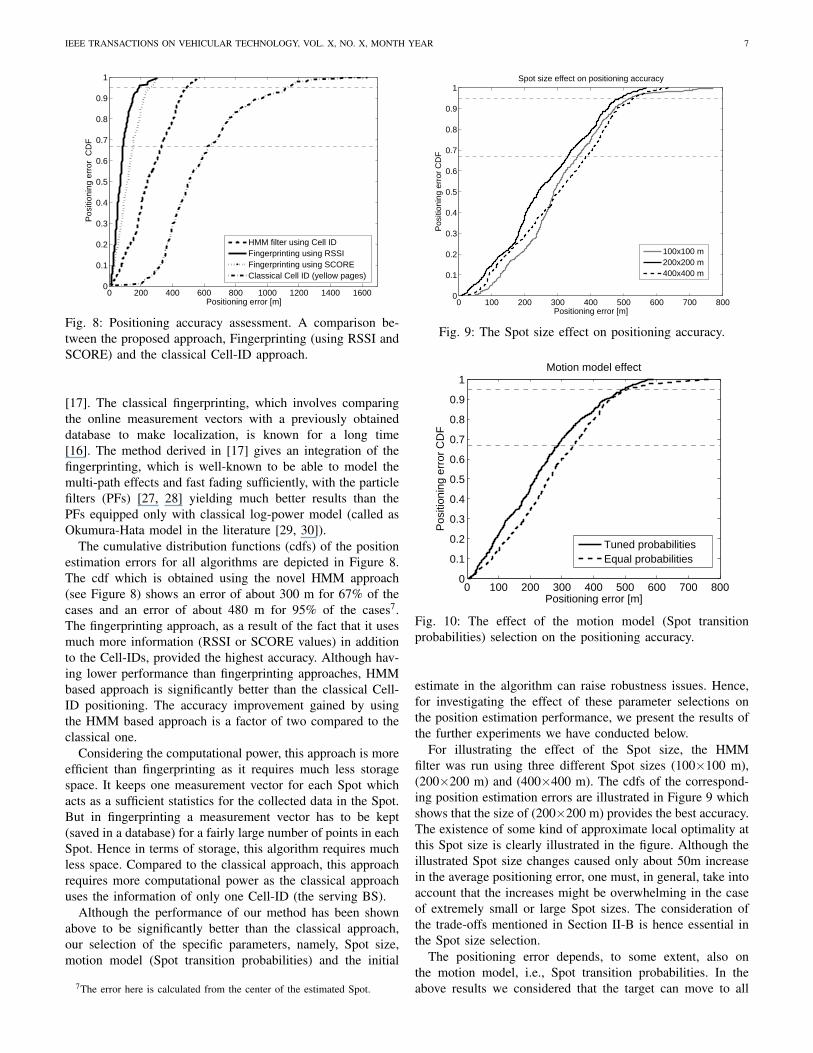
The cumulative distribution functions (cdfs) of the positionestimation errors for all algorithms are depicted in Figure 8.The cdf which is obtained using the novel HMM approach(see Figure 8) shows an error of about 300 m for 67% of thecases and an error of about 480 m for 95% of the cases7.The fingerprinting approach, as a result of the fact that it usesmuch more information (RSSI or SCORE values) in additionto the Cell-IDs, provided the highest accuracy. Although hav-ing lower performance than fingerprinting approaches, HMMbased approach is significantly better than the classical Cell-ID positioning. The accuracy improvement gained by usingthe HMM based approach is a factor of two compared to theclassical one.
Considering the computational power, this approach is moreefficient than fingerprinting as it requires much less storagespace. It keeps one measurement vector for each Spot whichacts as a sufficient statistics for the collected data in the Spot.But in fingerprinting a measurement vector has to be kept(saved in a database) for a fairly large number of points in eachSpot. Hence in terms of storage, this algorithm requires muchless space. Compared to the classical approach, this approachrequires more computational power as the classical approachuses the information of only one Cell-ID (the serving BS).
Although the performance of our method has been shownabove to be significantly better than the classical approach,our selection of the specific parameters, namely, Spot size,motion model (Spot transition probabilities) and the initial
7The error here is calculated from the center of the estimated Spot.
0 100 200 300 400 500 600 700 8000
0.1
0.2
0.3
0.4
0.5
0.6
0.7
0.8
0.9
1
Positioning error [m]
Pos
ition
ing
erro
r CD
F
Spot size effect on positioning accuracy
100x100 m200x200 m400x400 m
Fig. 9: The Spot size effect on positioning accuracy.
0 100 200 300 400 500 600 700 8000
0.1
0.2
0.3
0.4
0.5
0.6
0.7
0.8
0.9
1
Positioning error [m]
Pos
ition
ing
erro
r CD
F
Motion model effect
Tuned probabilitiesEqual probabilities
Fig. 10: The effect of the motion model (Spot transitionprobabilities) selection on the positioning accuracy.
estimate in the algorithm can raise robustness issues. Hence,for investigating the effect of these parameter selections onthe position estimation performance, we present the results ofthe further experiments we have conducted below.
For illustrating the effect of the Spot size, the HMMfilter was run using three different Spot sizes (100×100 m),(200×200 m) and (400×400 m). The cdfs of the correspond-ing position estimation errors are illustrated in Figure 9 whichshows that the size of (200×200 m) provides the best accuracy.The existence of some kind of approximate local optimality atthis Spot size is clearly illustrated in the figure. Although theillustrated Spot size changes caused only about 50m increasein the average positioning error, one must, in general, take intoaccount that the increases might be overwhelming in the caseof extremely small or large Spot sizes. The consideration ofthe trade-offs mentioned in Section II-B is hence essential inthe Spot size selection.
The positioning error depends, to some extent, also onthe motion model, i.e., Spot transition probabilities. In theabove results we considered that the target can move to all
IEEE TRANSACTIONS ON VEHICULAR TECHNOLOGY, VOL. X, NO. X, MONTH YEAR 8
0 100 200 300 400 500 600 700 800 9000
0.1
0.2
0.3
0.4
0.5
0.6
0.7
0.8
0.9
1
Positioning error [m]
Pos
ition
ing
erro
r CD
FInitial error effect
820 m556 m66 m
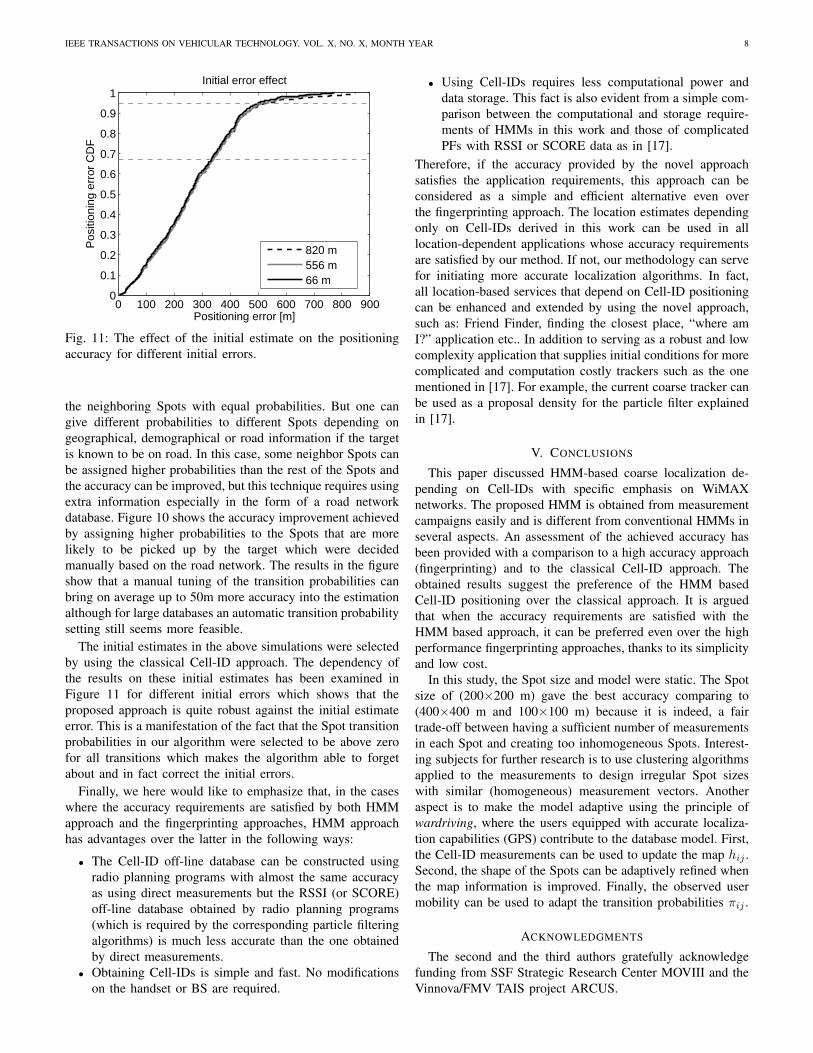
Fig. 11: The effect of the initial estimate on the positioningaccuracy for different initial errors.
the neighboring Spots with equal probabilities. But one cangive different probabilities to different Spots depending ongeographical, demographical or road information if the targetis known to be on road. In this case, some neighbor Spots canbe assigned higher probabilities than the rest of the Spots andthe accuracy can be improved, but this technique requires usingextra information especially in the form of a road networkdatabase. Figure 10 shows the accuracy improvement achievedby assigning higher probabilities to the Spots that are morelikely to be picked up by the target which were decidedmanually based on the road network. The results in the figureshow that a manual tuning of the transition probabilities canbring on average up to 50m more accuracy into the estimationalthough for large databases an automatic transition probabilitysetting still seems more feasible.
The initial estimates in the above simulations were selectedby using the classical Cell-ID approach. The dependency ofthe results on these initial estimates has been examined inFigure 11 for different initial errors which shows that theproposed approach is quite robust against the initial estimateerror. This is a manifestation of the fact that the Spot transitionprobabilities in our algorithm were selected to be above zerofor all transitions which makes the algorithm able to forgetabout and in fact correct the initial errors.
Finally, we here would like to emphasize that, in the caseswhere the accuracy requirements are satisfied by both HMMapproach and the fingerprinting approaches, HMM approachhas advantages over the latter in the following ways:
• The Cell-ID off-line database can be constructed usingradio planning programs with almost the same accuracyas using direct measurements but the RSSI (or SCORE)off-line database obtained by radio planning programs(which is required by the corresponding particle filteringalgorithms) is much less accurate than the one obtainedby direct measurements.
• Obtaining Cell-IDs is simple and fast. No modificationson the handset or BS are required.
• Using Cell-IDs requires less computational power anddata storage. This fact is also evident from a simple com-parison between the computational and storage require-ments of HMMs in this work and those of complicatedPFs with RSSI or SCORE data as in [17].
Therefore, if the accuracy provided by the novel approachsatisfies the application requirements, this approach can beconsidered as a simple and efficient alternative even overthe fingerprinting approach. The location estimates dependingonly on Cell-IDs derived in this work can be used in alllocation-dependent applications whose accuracy requirementsare satisfied by our method. If not, our methodology can servefor initiating more accurate localization algorithms. In fact,all location-based services that depend on Cell-ID positioningcan be enhanced and extended by using the novel approach,such as: Friend Finder, finding the closest place, “where amI?” application etc.. In addition to serving as a robust and lowcomplexity application that supplies initial conditions for morecomplicated and computation costly trackers such as the onementioned in [17]. For example, the current coarse tracker canbe used as a proposal density for the particle filter explainedin [17].
V. CONCLUSIONS
This paper discussed HMM-based coarse localization de-pending on Cell-IDs with specific emphasis on WiMAXnetworks. The proposed HMM is obtained from measurementcampaigns easily and is different from conventional HMMs inseveral aspects. An assessment of the achieved accuracy hasbeen provided with a comparison to a high accuracy approach(fingerprinting) and to the classical Cell-ID approach. Theobtained results suggest the preference of the HMM basedCell-ID positioning over the classical approach. It is arguedthat when the accuracy requirements are satisfied with theHMM based approach, it can be preferred even over the highperformance fingerprinting approaches, thanks to its simplicityand low cost.
In this study, the Spot size and model were static. The Spotsize of (200×200 m) gave the best accuracy comparing to(400×400 m and 100×100 m) because it is indeed, a fairtrade-off between having a sufficient number of measurementsin each Spot and creating too inhomogeneous Spots. Interest-ing subjects for further research is to use clustering algorithmsapplied to the measurements to design irregular Spot sizeswith similar (homogeneous) measurement vectors. Anotheraspect is to make the model adaptive using the principle ofwardriving, where the users equipped with accurate localiza-tion capabilities (GPS) contribute to the database model. First,the Cell-ID measurements can be used to update the map hij .Second, the shape of the Spots can be adaptively refined whenthe map information is improved. Finally, the observed usermobility can be used to adapt the transition probabilities πij .
ACKNOWLEDGMENTS
The second and the third authors gratefully acknowledgefunding from SSF Strategic Research Center MOVIII and theVinnova/FMV TAIS project ARCUS.
IEEE TRANSACTIONS ON VEHICULAR TECHNOLOGY, VOL. X, NO. X, MONTH YEAR 9
REFERENCES
[1] F. Gustafsson and F. Gunnarsson, “Possibilities andfundamental limitations of positioning using wirelesscommunication networks measurements,” IEEE SignalProcess. Mag., vol. 22, pp. 41–53, 2005.
[2] Revision of the commissions rules to ensure compatibilitywith enhanced 911 emergemcy calling systems, Washing-ton DC, RM-8143, CC Docket 94-102, U.S. FCC, 1996.
[3] W. D. Wang and Q. X. Zhu, “RSS-based Monte Carlolocalisation for mobile sensor networks,” IET Communi-cations, vol. 2, pp. 673–681, 2008.
[4] A. Heinrich, M. Majdoub, J. Steuer, and K. Jobmann,“Real-time path-loss position estimation in cellular net-works,” in Proceedings of International Conference onWireless Networks (ICWN’02), Jun. 2002.
[5] J. Shirahama and T. Ohtsuki, “RSS-based localization inenvironments with different path loss exponent for eachlink,” Vehicular Technology Conference, pp. 1509–1513,2008.
[6] L. Mihaylova, D. Angelova, S. Honary, D. Bull, N. Cana-garajah, and B. Ristic, “Mobility Tracking in CellularNetworks Using Particle Filtering,” IEEE Trans. WirelessCommunications, vol. 6, no. 10, pp. 672–681, 2007.
[7] X. Wang, Z. Wang, and B. O’Dea, “A TOA-BasedLocation Algorithm Reducing the Error Due to Non-Line-of-Sight (NLOS) Propagation,” IEEE Trans. Veh.Technol., vol. 52, no. 1, pp. 112–116, Jan. 2003.
[8] J. J. Caffery and G. L. Stuber, Wireless Location inCDMA Cellular Radio Systems. Norwell, MA: Kluwer,1999.
[9] S. Sakagami, S. Aoyama, K. Kuboi, S. Shirota, andA. Akeyama, “Vehicle position estimates by multi-beamantennas in multipath environment,” IEEE Trans. Veh.Technol., vol. 41, pp. 63–67, Feb. 1992.
[10] R. Klukas and M. Fattouche, “Line-of-sight angle ofarrival estimation in the outdoor multipathenvironment,”IEEE Trans. Veh. Technol., vol. 47, pp. 342–351, Feb.1998.
[11] S. Venkatraman and J. J. Caffery, “Hybrid TOA/AOAtechniques for mobile location in non-line-of-sight en-vironments,” IEEE Wireless Communication NetworkingConf, WCNC 2004, vol. 1, pp. 274–278, 2004.
[12] Y. Qi, H. Kobayashi, and H. Suda, “Analysis of wirelessgeolocation in a non-line-of-sight environment,” IEEEtrans. Wireless Commun., vol. 5, no. 3, pp. 672–681,2003.
[13] O. Sallent, R. Agusi, and X. Cavlo, “A mobile locationservice demonstrator based on power measurements,”Vehicular Technology Conference, vol. 6, no. 1, pp.4096–4099, Sep. 2004.
[14] C. Takenga and K. Kyamakya, “Mobile positioning basedon pattern matching and tracking approaches,” ISASTTransactions on Communications and Networking, vol. 1,no. 1, pp. 42–51, 2007.
[15] A. Taok, N. Kandil, S. Affes, and S. Georges, “Fin-gerprinting localization using ultra-wideband and neuralnetworks,” Signals, Systems and Electronics, vol. 54,
no. 4, pp. 529–532, Aug. 2007.[16] M. Meurer, S. Heilman, D. Reddy, and P. Baier, “A sig-
nature based localization technique relying on covariancematrices of channel impulse responses,” in Proceedingsof Workshop on Positioning, Navigation and Communi-cation (WPNC), 2005.
[17] M. Bshara, U. Orguner, F. Gustafsson, and L. Van Biesen,“Fingerprinting localization in wireless networks basedon received-signal-strength measurements: A case studyon wimax networks,” IEEE Trans. Veh. Technol., vol. 59,no. 1, pp. 283–294, jan. 2010.
[18] Cello consortium report. [Online]. Available:http://www.telecom.ntua.gr/cello/documents/CELLO-WP2-VTT-D03-007-Int.pdf
[19] E. Trevisani and A. Vitaletti, “Cell-ID location technique,limits and benefits: anexperimental study,” Proceedingsof the Sixth IEEE Workshop on Mobile Computing Sys-tems and Applications, pp. 51–60, 2004.
[20] N. Deblauwe, “GSM-based Positioning: Techniques andApplication,” Ph.D. dissertation, Vrije Universiteit Brus-sel, 2008.
[21] IEEE Standard for Local and metropolitan area networksPart 16: Air Interface for Broadband Wireless AccessSystems, IEEE Std. 802.16-2009, 2009.
[22] K. Jones and L. Liu, “What where wi: An analysisof millions of wi-fi access points,” IEEE InternationalConference on Portable Information Devices, May 2007.
[23] K. Jones, L. Liu, and F. Alizadeh-Shabdiz, “Improv-ing wireless positioning with look-ahead map-matching,”Fourth Annual International Conference on Mobile andUbiquitous Systems: Networking & Services, Aug. 2007.
[24] S. Byers and D. Kormann, “802.11b access point map-ping,” Communications of the ACM, vol. 46, no. 5, pp.41–46, May 2003.
[25] L. Rabiner, “A tutorial on hidden Markov models andselected applications in speech recognition,” Proceedingsof the IEEE, vol. 77, no. 2, pp. 257–286, Feb 1989.
[26] R. J. Elliott, L. Aggoun, and J. B. Moore, Hidden MarkovModels: Estimation and Control. NY, USA: Springer-Verlag, 1994.
[27] A. Doucet, S. J. Godsill, and C. Andrieu, “On sequentialsimulation-based methods for Bayesian filtering,” Statis-tics and Computing, vol. 10, no. 3, pp. 197–208, 2000.
[28] A. Doucet, N. de Freitas, and N. Gordon, SequentialMonte Carlo Methods in Practice. Springer Verlag,2001.
[29] Y. Okumura, E. Ohmori, T. Kawano, and K. Fukuda,“Field strength and its variability in VHF and UHF land-mobile radio service,” Rev. Elec. Commun. Lab., vol. 16,pp. 9–10, 1968.
[30] M. Hata, “Empirical formula for propagation loss inland mobile radio services,” IEEE Trans. Veh. Technol.,vol. 29, no. 3, pp. 317–325, Aug. 1980.
IEEE TRANSACTIONS ON VEHICULAR TECHNOLOGY, VOL. X, NO. X, MONTH YEAR 10
Mussa Bshara received his Bachelor Degree inelectrical engineering from Damascus University,Damascus, Syria, and the M.Sc. degree in signal pro-cessing and information security from Beijing Uni-versity of Posts and Telecommunications (BUPT),Beijing. He obtained the Doctoral degree (Ph.D.)from the Vrije Universiteit Brussel (VUB), Brusselsin 2010.
His research interests include localization, nav-igation and tracking in wireless networks, signalprocessing, wireless communications, power line
communications and xDSL technologies.
Umut Orguner received B.S., M.S. and Ph.D. de-grees all in electrical engineering from Middle EastTechnical University, Ankara, Turkey in 1999, 2002and 2006 respectively. Between 1999 and 2007, hewas with the Department of Electrical and Electron-ics Engineering of the same university as a teachingand research assistant. Since January 2007 he hasbeen working as a postdoctoral associate in Divisionof Automatic Control, Department of Electrical En-gineering, Linkping University, Linkoping, Sweden.
His research interests include estimation theory,multiple-model estimation, target tracking and information fusion.
Fredrik Gustafsson is professor in Sensor In-formatics at Department of Electrical Engineering,Linkoping University, since 2005. He received theM.Sc. degree in electrical engineering 1988 and thePh.D. degree in Automatic Control, 1992, both fromLinkoping University. During 1992-1999 he heldvarious positions in automatic control, and 1999-2005 he had a professorship in Communication Sys-tems. His research interests are in stochastic signalprocessing, adaptive filtering and change detection,with applications to communication, vehicular, air-
borne, and audio systems. His work in the sensor fusion area involvesdesign and implementation of nonlinear filtering algorithms for localization,navigation and tracking of all kind of platforms, including cars, aircraft,spacecraft, UAV’s, surface and underwater vessels, cell phones and filmcameras for augmented reality. He is a co-founder of the companies NIRADynamics and Softube, developing signal processing software solutions forautomotive and music industry, respectively.
He was an associate editor for IEEE Transactions of Signal Processing2000-2006 and is currently associate editor for EURASIP Journal on AppliedSignal Processing and International Journal of Navigation and Observation.In 2004, he was awarded the Arnberg prize by the Royal Swedish Academyof Science (KVA) and in 2007 he was elected member of the Royal Academyof Engineering Sciences (IVA).
Leo Van Biesen received the degree of Electro-Mechanical Engineer from the Vrije UniversiteitBrussel (VUB), Brussels in 1978, and the Doctoraldegree (PhD) from the same university in 1983.Currently he is a full senior professor. He teachescourses on fundamental electricity, electrical mea-surement techniques, signal theory, computer con-trolled measurement systems, telecommunication,physical communication and information theory.
His current interests are signal theory, PHY-layerin communication, time domain reflectometry, wire-
less communications, xDSL technologies, and expert systems for intelligentinstrumentation. He has been chairman of IMEKO TC-7 from 1994-2000 andPresident Elect of IMEKO for the period 2000-2003 and the liaison Officerbetween the IEEE and IMEKO. Prof. Dr. Ir. Leo Van Biesen has been presidentof IMEKO from 2003 to September 2006, and he is now chairman of theAdvisory Board of IMEKO as immediate Past–President. He is also memberof the board of FITCE Belgium and of USRSI Belgium.