tsunami hazard assessment of canada
TRANSCRIPT
ORI GIN AL PA PER
Tsunami hazard assessment of Canada
Lucinda J. Leonard • Garry C. Rogers • Stephane Mazzotti
Received: 2 June 2013 / Accepted: 18 July 2013 / Published online: 24 August 2013� Her Majesty the Queen in Right of Canada 2013
Abstract We present a preliminary probabilistic tsunami hazard assessment of Canadian
coastlines from local and far-field, earthquake, and large submarine landslide sources.
Analyses involve published historical, palaeotsunami and palaeoseismic data, modelling,
and empirical relations between fault area, earthquake magnitude, and tsunami run-up. The
cumulative estimated tsunami hazard for potentially damaging run-up (C1.5 m) of the
outer Pacific coastline is *40–80 % in 50 years, respectively one and two orders of
magnitude greater than the outer Atlantic (*1–15 %) and the Arctic (\1 %). For larger
run-up with significant damage potential (C3 m), Pacific hazard is *10–30 % in 50 years,
again much larger than both the Atlantic (*1–5 %) and Arctic (\1 %). For outer Pacific
coastlines, the C1.5 m run-up hazard is dominated by far-field subduction zones, but the
probability of run-up C3 m is highest for local megathrust sources, particularly the Cas-
cadia subduction zone; thrust sources further north are also significant, as illustrated by the
2012 Haida Gwaii event. For Juan de Fuca and Georgia Straits, the Cascadia megathrust
dominates the hazard at both levels. Tsunami hazard on the Atlantic coastline is dominated
by poorly constrained far-field subduction sources; a lesser hazard is posed by near-field
continental slope failures similar to the 1929 Grand Banks event. Tsunami hazard on the
Arctic coastline is poorly constrained, but is likely dominated by continental slope failures;
Electronic supplementary material The online version of this article (doi:10.1007/s11069-013-0809-5)contains supplementary material, which is available to authorized users.
L. J. Leonard (&) � G. C. RogersGeological Survey of Canada, Natural Resources Canada, 9860 West Saanich Road, P.O. Box 6000,Sidney, BC V8L 4B2, Canadae-mail: [email protected]
Present Address:L. J. LeonardSchool of Earth and Ocean Sciences, University of Victoria, PO Box 1700 Station CSC, Victoria, BCV8W 2Y2, Canada
S. MazzottiGeosciences Montpellier, UMR 5243, Universite Montpellier 2, Montpellier, France
123
Nat Hazards (2014) 70:237–274DOI 10.1007/s11069-013-0809-5
a hypothetical earthquake source beneath the Mackenzie delta requires further study. We
highlight areas susceptible to locally damaging landslide-generated tsunamis, but do not
quantify the hazard.
Keywords Tsunami � Probabilistic hazard analysis � Canada � Earthquake �Landslide
1 Introduction
The occurrence of several major tsunamis globally within the past decade (notably Sumatra
in 2004, Chile in 2010, and NE Japan in 2011), accompanied by catastrophic loss of life,
highlights the need for coastal nations to assess and mitigate their tsunami hazard. This is
particularly true for Canada, which has a longer coastline than any other country and is at
risk from tsunamis generated in three oceans (Fig. 1). Previous studies concern various
historical tsunamis, and the threat that future tsunamis may pose (references in Leonard
et al. 2010). This analysis presents a first attempt to quantify the tsunami hazard on each
coast, from both near- and far-field sources. Earthquakes represent the greatest and most
easily quantified tsunami source; we also consider hazard contributions from mass
movement sources. We do not assess tsunami hazard along inland waterways, although
several historical occurrences involving landslide sources have caused damage and fatal-
ities (e.g. Evans 2001). We exclude the likely common regional hazard of meteorological
tsunamis (e.g. Stephenson and Rabinovich 2009), which result from atmospheric rather
than geologic phenomena and are likely ubiquitous rather than having a distinct source
area. We also omit the potentially devastating but very rare hazard posed by asteroid
impact tsunamis (e.g. Gisler et al. 2011).
This assessment, based on currently available constraints, is intended for use as a starting
point to establish priorities for future work. Identification of poorly constrained sources with
potentially high hazard highlights the need to better quantify both source potential and
tsunami impact. The probabilities determined here will require revision as more data are
collected regarding: the occurrence, frequency, and size of past tsunamis; constraints on
potentially tsunamigenic faults; stability assessments of potential landslide sources; tsunami
modelling of a wide range of potential sources from tsunamigenesis to propagation and
inundation, incorporating fine-resolution bathymetry and coastal topography.
2 Tsunami hazard analysis: methods
Probabilistic tsunami hazard analysis (e.g. Geist and Parsons 2006) involves estimation of
the probability of exceeding specific tsunami wave heights (or run-up) at given locations
from any source, on the basis of either numerical tsunami simulations or empirical analysis
of past tsunami heights (Geist et al. 2009).
2.1 Recurrence and probabilities
If the annual rate, k, of tsunami run-up height Hr0 is known, the probability of exceeding
that run-up at least once in a time period T is given by:
PðHr [ Hr0; TÞ ¼ 1� e�kT ð1Þ
238 Nat Hazards (2014) 70:237–274
123
assuming a Poisson process (Geist and Parsons 2009). For multiple sources with inde-
pendent rates (k1, k2, k3 …) of Hr0, the combined probability of exceedance in time T is
given by:
PðHr [ Hr0; TÞ ¼ 1� e�kcT ð2Þ
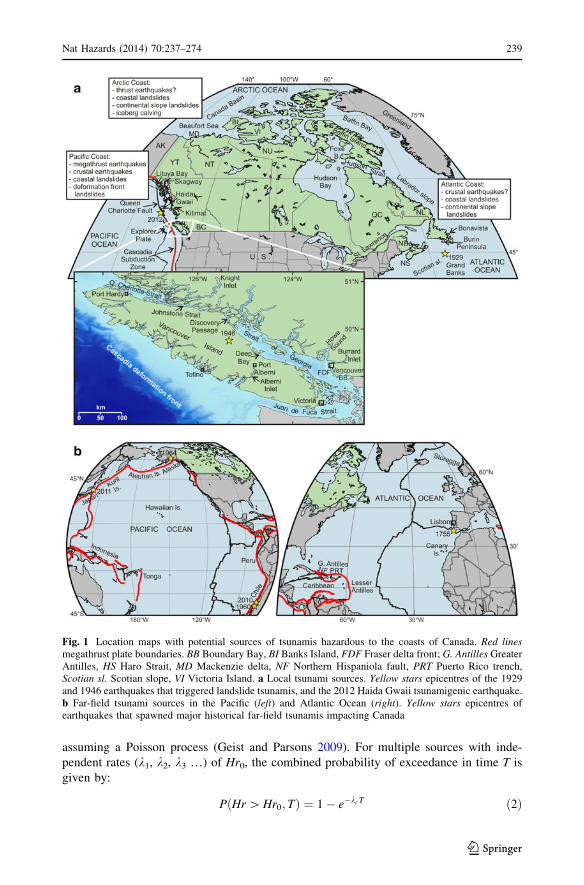
Fig. 1 Location maps with potential sources of tsunamis hazardous to the coasts of Canada. Red linesmegathrust plate boundaries. BB Boundary Bay, BI Banks Island, FDF Fraser delta front; G. Antilles GreaterAntilles, HS Haro Strait, MD Mackenzie delta, NF Northern Hispaniola fault, PRT Puerto Rico trench,Scotian sl. Scotian slope, VI Victoria Island. a Local tsunami sources. Yellow stars epicentres of the 1929and 1946 earthquakes that triggered landslide tsunamis, and the 2012 Haida Gwaii tsunamigenic earthquake.b Far-field tsunami sources in the Pacific (left) and Atlantic Ocean (right). Yellow stars epicentres ofearthquakes that spawned major historical far-field tsunamis impacting Canada
Nat Hazards (2014) 70:237–274 239
123
where kc is the cumulative annual rate. For each tsunami source, we estimate annual rates
of run-up of 1.5 and 3 m in each hazard zone (Fig. 2) and probabilities of exceeding those
values in a 50-year period (Eq. 1). Minimum and maximum values do not represent
specific probabilities (e.g. standard deviations) but the combined effect of uncertainties on
the source parameterisation (e.g. tsunami propagation, earthquake magnitude). For mul-
tiple sources, we estimate the cumulative best annual rate (kc_best) as the sum of the best
values of each source:
kc best ¼XN
i¼1
ki best ð3Þ
Uncertainty (upper and lower bounds) of the combined rates is estimated using a standard
geometric sum of the uncertainty on each source, taking into account that all sources are
independent:
kc min ¼ kc best �
ffiffiffiffiffiffiffiffiffiffiffiffiffiffiffiffiffiffiffiffiffiffiffiffiffiffiffiffiffiffiffiffiffiffiffiffiffiffiffiffiffiffiffiXN
i¼1
ðki best � ki minÞ2vuut ð4Þ
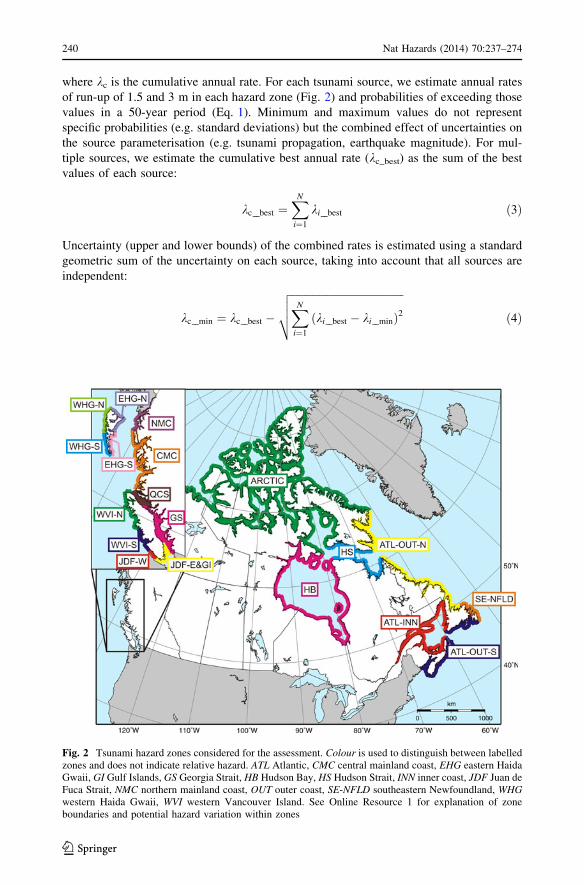
Fig. 2 Tsunami hazard zones considered for the assessment. Colour is used to distinguish between labelledzones and does not indicate relative hazard. ATL Atlantic, CMC central mainland coast, EHG eastern HaidaGwaii, GI Gulf Islands, GS Georgia Strait, HB Hudson Bay, HS Hudson Strait, INN inner coast, JDF Juan deFuca Strait, NMC northern mainland coast, OUT outer coast, SE-NFLD southeastern Newfoundland, WHGwestern Haida Gwaii, WVI western Vancouver Island. See Online Resource 1 for explanation of zoneboundaries and potential hazard variation within zones
240 Nat Hazards (2014) 70:237–274
123
kc max ¼ kc best þ
ffiffiffiffiffiffiffiffiffiffiffiffiffiffiffiffiffiffiffiffiffiffiffiffiffiffiffiffiffiffiffiffiffiffiffiffiffiffiffiffiffiffiffiffiXN
i¼1
ðki best � ki maxÞ2vuut ð5Þ
2.2 Tsunami wave height threshold for potential damage
Wave height or amplitude is defined as the zero-to-peak wave amplitude (height above the
state of tide). Mean run-up height (Hr), which determines inundation extent, is approxi-
mately double the wave height or equivalent to the peak-to-trough amplitude (Abe 1995).
Based on historical Pacific tsunamis, damage to boats, docks, and swimmers may occur
due to strong currents for a 0.5-m minimum tsunami amplitude or run-up; more severe
damage and inundation is likely at a 1.5–2-m minimum (Whitmore et al. 2008). We
therefore choose a tsunami run-up (Hr) threshold of 1.5 m (equivalent to 1.5 m peak-to-
trough amplitude or *0.75 m wave height) for potential coastal damage. We also assess a
run-up threshold of 3 m, defined here as having significant damage potential, i.e. major
damage expected that may be geographically extensive.
2.3 Assessment of subduction earthquake sources
Modelling of the many tsunami sources with the potential to impact Canadian coasts is
beyond the scope of this study. Various scenario fault sources have been modelled to assess
their tsunami impact, often with historical constraints; we use the results, along with
palaeoseismic or geodetic recurrence intervals, for preliminary probabilistic analysis. For
Pacific far-field sources, we use a century-long tide gauge dataset for an empirical analysis.
For unconstrained potentially tsunamigenic faults, we use a series of empirical relations to:
(1) derive an estimate of earthquake magnitude and probability based on fault area and
convergence rate, (2) derive the corresponding tsunami run-up in each zone, and (3)
integrate the source event probability with the estimated run-up to provide probabilities of
potentially damaging (C1.5 m) and significant (C3 m) tsunami run-up in each zone (see
Online Resource 2 for complete description and equations).
2.4 Assessment of landslide sources
In contrast to large earthquake tsunamis, significant far-field attenuation occurs during
propagation of landslide tsunamis, so generally only local/regional landslide sources need
to be considered (e.g. Geist and Parsons 2009). However, modelling suggests that very
large failures (e.g. volcanic flank collapses) may result in damaging run-up at transoceanic
distances. Like other natural systems, landslides are generally considered to follow an
inverse power-law frequency–size relationship (e.g. Korup and Clague 2009). With suf-
ficient identification and dating of past slides, the frequency of large events may be
estimated and can be used, along with tsunami modelling, to approximate the probability of
potentially damaging run-up. However, for smaller failures, empirical data are difficult to
collect. Failures are often triggered by earthquakes, and the earthquake statistics of an area
may be used to aid landslide tsunami hazard analysis where slope stability data are
available (e.g. ten Brink et al. 2009); such analyses are beyond the scope of this study.
Coastal landslide tsunamis are typically triggered by failure of steep subaerial slopes or
submarine delta fronts, resulting from ground shaking, rainfall, construction, or other
factors. Isolated cases are noted in Canada (e.g. Leonard et al. 2012a), but without a long-
Nat Hazards (2014) 70:237–274 241
123
term history, the probability of landslide-generated waves cannot be estimated. Instead, we
identify coastlines that may be at risk, based on the landslide susceptibility map of Bo-
browsky and Dominguez (2012), who assessed various factors including topography,
geology, vegetation, and precipitation to divide the Canadian landscape into susceptibility
classes ranging from 1 (lowest) to 6 (highest). We consider coastal areas in classes 5 and 6
to be at risk from landslide-generated waves, as well as neighbouring coastlines that may
also be affected. We also highlight Arctic coastlines that may be susceptible to local waves
from iceberg calving or jokulhlaup events (catastrophic releases of water from a glacier).
3 Pacific coast
In historical time (written) on the British Columbia coast (*150 years of local newspa-
pers), most recorded tsunamis have been far-field events (e.g. Stephenson et al. 2007). The
most damaging were triggered by giant (M [ 9) megathrust earthquakes in Alaska (1964)
and Chile (1960; Fig. 1); the largest since 1964 were the Mw 8.8 2010 Chile and Mw 9.0
2011 Japan events. The only known tsunami fatality in BC resulted from a local landslide
tsunami during a Ms7.3 crustal earthquake on Vancouver Island (1946; Fig. 1). However, a
massive local earthquake and tsunami are known to have occurred in 1700 CE (e.g.
Atwater et al. 2005). On 27 October 2012, a tsunami triggered by an Mw 7.7 thrust
earthquake off Haida Gwaii (formerly the Queen Charlotte Islands) impacted western
Haida Gwaii, with run-up over 8 m above the state of tide documented at several locations.
3.1 Far-field tsunamis from Pacific subduction zones
The most complete tsunami record is provided by the tide gauge at Tofino (western
Vancouver Island; Fig. 1), with 61 tsunamis identified from 1906 to 2009 (Wigen 1983;
Stephenson and Rabinovich 2009; WCATWC 2009a, b). Since a 1998 instrument upgrade,
the record contains a few small local/regional earthquake and meteorological tsunamis
(Stephenson and Rabinovich 2009), but it is dominated by far-field events and can be used
to assess their frequency. The Tofino tsunami frequency–amplitude plot (Fig. 3) is a
power-law distribution from which the recurrence of large events can be predicted. For
most of the record, tsunamis down to 6 cm (peak-to-trough) are consistently identified; this
lowers to 3 cm after 1998. From 1975 to 1980 and possibly the early 1980s, the tide gauge
was compromised due to sediment build-up (Stephenson and Rabinovich 2009). We
assume that no tsunamis could be detected from 1975 to 1980, but 1980–1985 was a
quiescent time with no events recorded at tsunami-sensitive Crescent City, CA (Dengler
and Magoon 2006). The shape of the curve at high amplitudes (important for the frequency
of large events) depends on the assumed maximum amplitude. The 1964 Alaska tsunami
(2.4 m peak to trough at Tofino) represents a near maximum, although previous Alaskan
events may have involved longer ruptures (Shennan et al. 2009). We assign a maximum
height of 3.0 ± 0.5 m for far-field tsunamis at Tofino (Fig. 3).
The frequencies of tsunami run-up exceeding 1.5 and 3 m at Tofino are given in
Table 1; uncertainties are propagated from those of the recurrence parameters and maxi-
mum amplitude (Fig. 3). The results only strictly apply to the Tofino tide gauge site; other
sites exhibit different responses for the same event, e.g. Port Alberni usually experiences
larger amplitudes ([5 m in 1964) due to resonance amplification in the Alberni Inlet (Fine
et al. 2009). Response ratios between specific sites tend to be similar for far-field events;
maximum amplitudes at Victoria are typically *0.6 of those at Tofino (Leonard et al.
242 Nat Hazards (2014) 70:237–274
123
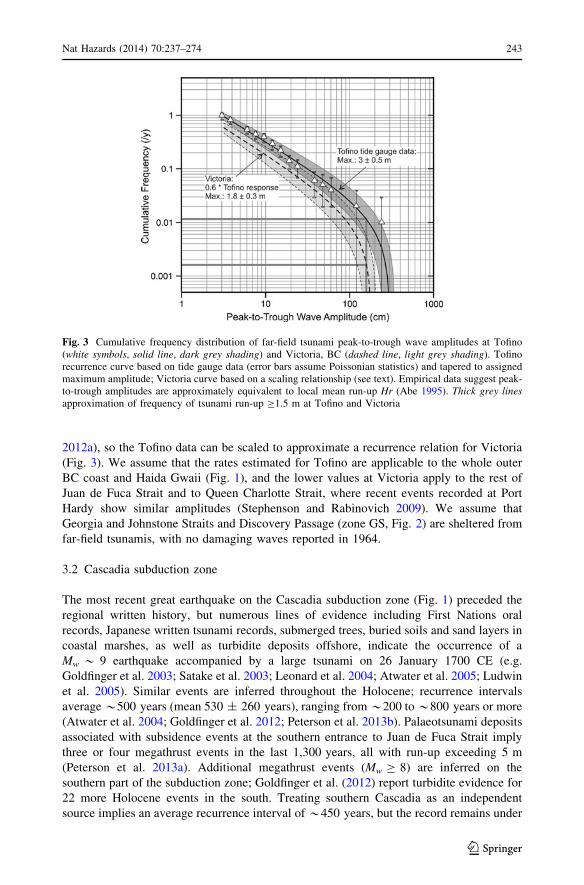
2012a), so the Tofino data can be scaled to approximate a recurrence relation for Victoria
(Fig. 3). We assume that the rates estimated for Tofino are applicable to the whole outer
BC coast and Haida Gwaii (Fig. 1), and the lower values at Victoria apply to the rest of
Juan de Fuca Strait and to Queen Charlotte Strait, where recent events recorded at Port
Hardy show similar amplitudes (Stephenson and Rabinovich 2009). We assume that
Georgia and Johnstone Straits and Discovery Passage (zone GS, Fig. 2) are sheltered from
far-field tsunamis, with no damaging waves reported in 1964.
3.2 Cascadia subduction zone
The most recent great earthquake on the Cascadia subduction zone (Fig. 1) preceded the
regional written history, but numerous lines of evidence including First Nations oral
records, Japanese written tsunami records, submerged trees, buried soils and sand layers in
coastal marshes, as well as turbidite deposits offshore, indicate the occurrence of a
Mw * 9 earthquake accompanied by a large tsunami on 26 January 1700 CE (e.g.
Goldfinger et al. 2003; Satake et al. 2003; Leonard et al. 2004; Atwater et al. 2005; Ludwin
et al. 2005). Similar events are inferred throughout the Holocene; recurrence intervals
average *500 years (mean 530 ± 260 years), ranging from *200 to *800 years or more
(Atwater et al. 2004; Goldfinger et al. 2012; Peterson et al. 2013b). Palaeotsunami deposits
associated with subsidence events at the southern entrance to Juan de Fuca Strait imply
three or four megathrust events in the last 1,300 years, all with run-up exceeding 5 m
(Peterson et al. 2013a). Additional megathrust events (Mw C 8) are inferred on the
southern part of the subduction zone; Goldfinger et al. (2012) report turbidite evidence for
22 more Holocene events in the south. Treating southern Cascadia as an independent
source implies an average recurrence interval of *450 years, but the record remains under
Fig. 3 Cumulative frequency distribution of far-field tsunami peak-to-trough wave amplitudes at Tofino(white symbols, solid line, dark grey shading) and Victoria, BC (dashed line, light grey shading). Tofinorecurrence curve based on tide gauge data (error bars assume Poissonian statistics) and tapered to assignedmaximum amplitude; Victoria curve based on a scaling relationship (see text). Empirical data suggest peak-to-trough amplitudes are approximately equivalent to local mean run-up Hr (Abe 1995). Thick grey linesapproximation of frequency of tsunami run-up C1.5 m at Tofino and Victoria
Nat Hazards (2014) 70:237–274 243
123
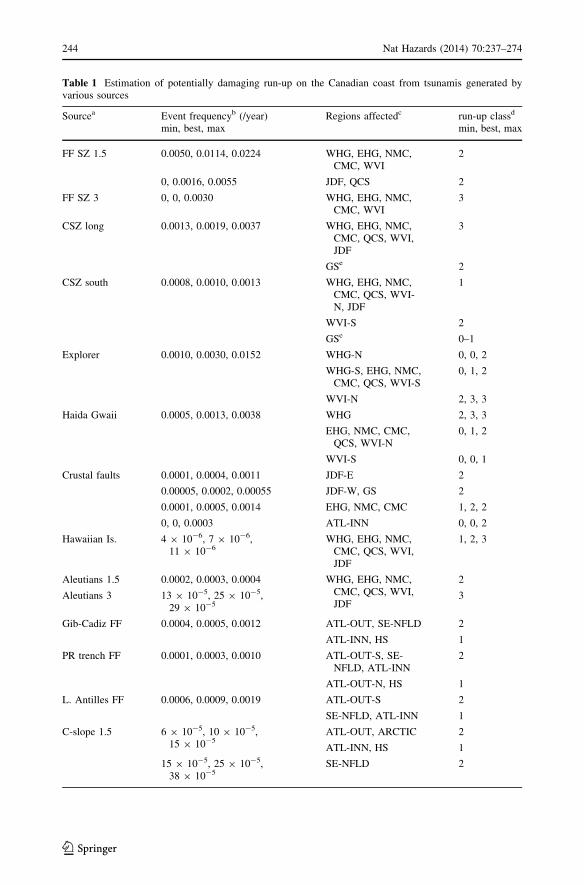
Table 1 Estimation of potentially damaging run-up on the Canadian coast from tsunamis generated byvarious sources
Sourcea Event frequencyb (/year) Regions affectedc run-up classd
min, best, max min, best, max
FF SZ 1.5 0.0050, 0.0114, 0.0224 WHG, EHG, NMC,CMC, WVI
2
0, 0.0016, 0.0055 JDF, QCS 2
FF SZ 3 0, 0, 0.0030 WHG, EHG, NMC,CMC, WVI
3
CSZ long 0.0013, 0.0019, 0.0037 WHG, EHG, NMC,CMC, QCS, WVI,JDF
3
GSe 2
CSZ south 0.0008, 0.0010, 0.0013 WHG, EHG, NMC,CMC, QCS, WVI-N, JDF
1
WVI-S 2
GSe 0–1
Explorer 0.0010, 0.0030, 0.0152 WHG-N 0, 0, 2
WHG-S, EHG, NMC,CMC, QCS, WVI-S
0, 1, 2
WVI-N 2, 3, 3
Haida Gwaii 0.0005, 0.0013, 0.0038 WHG 2, 3, 3
EHG, NMC, CMC,QCS, WVI-N
0, 1, 2
WVI-S 0, 0, 1
Crustal faults 0.0001, 0.0004, 0.0011 JDF-E 2
0.00005, 0.0002, 0.00055 JDF-W, GS 2
0.0001, 0.0005, 0.0014 EHG, NMC, CMC 1, 2, 2
0, 0, 0.0003 ATL-INN 0, 0, 2
Hawaiian Is. 4 9 10-6, 7 9 10-6,11 9 10-6
WHG, EHG, NMC,CMC, QCS, WVI,JDF
1, 2, 3
Aleutians 1.5 0.0002, 0.0003, 0.0004 WHG, EHG, NMC,CMC, QCS, WVI,JDF
2
Aleutians 3 13 9 10-5, 25 9 10-5,29 9 10-5
3
Gib-Cadiz FF 0.0004, 0.0005, 0.0012 ATL-OUT, SE-NFLD 2
ATL-INN, HS 1
PR trench FF 0.0001, 0.0003, 0.0010 ATL-OUT-S, SE-NFLD, ATL-INN
2
ATL-OUT-N, HS 1
L. Antilles FF 0.0006, 0.0009, 0.0019 ATL-OUT-S 2
SE-NFLD, ATL-INN 1
C-slope 1.5 6 9 10-5, 10 9 10-5,15 9 10-5
ATL-OUT, ARCTIC 2
ATL-INN, HS 1
15 9 10-5, 25 9 10-5,38 9 10-5
SE-NFLD 2
244 Nat Hazards (2014) 70:237–274
123
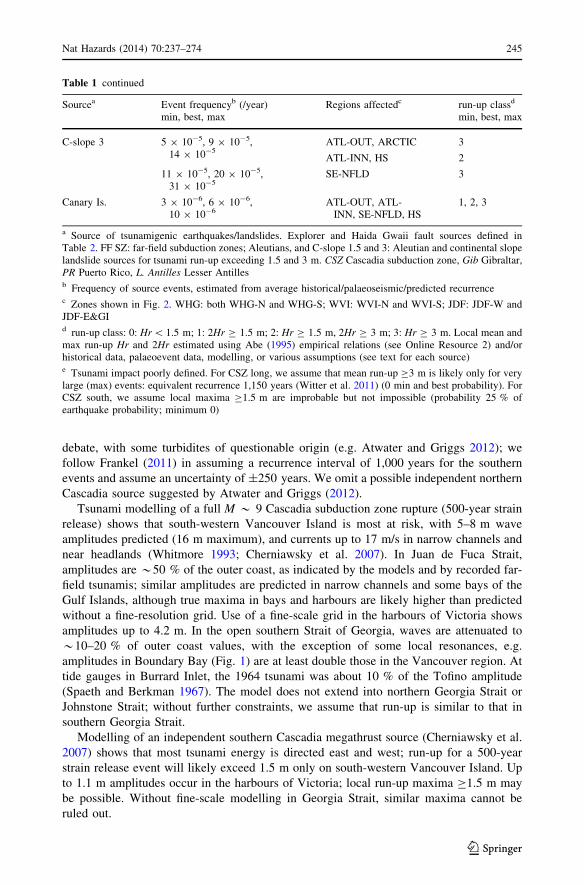
debate, with some turbidites of questionable origin (e.g. Atwater and Griggs 2012); we
follow Frankel (2011) in assuming a recurrence interval of 1,000 years for the southern
events and assume an uncertainty of ±250 years. We omit a possible independent northern
Cascadia source suggested by Atwater and Griggs (2012).
Tsunami modelling of a full M * 9 Cascadia subduction zone rupture (500-year strain
release) shows that south-western Vancouver Island is most at risk, with 5–8 m wave
amplitudes predicted (16 m maximum), and currents up to 17 m/s in narrow channels and
near headlands (Whitmore 1993; Cherniawsky et al. 2007). In Juan de Fuca Strait,
amplitudes are *50 % of the outer coast, as indicated by the models and by recorded far-
field tsunamis; similar amplitudes are predicted in narrow channels and some bays of the
Gulf Islands, although true maxima in bays and harbours are likely higher than predicted
without a fine-resolution grid. Use of a fine-scale grid in the harbours of Victoria shows
amplitudes up to 4.2 m. In the open southern Strait of Georgia, waves are attenuated to
*10–20 % of outer coast values, with the exception of some local resonances, e.g.
amplitudes in Boundary Bay (Fig. 1) are at least double those in the Vancouver region. At
tide gauges in Burrard Inlet, the 1964 tsunami was about 10 % of the Tofino amplitude
(Spaeth and Berkman 1967). The model does not extend into northern Georgia Strait or
Johnstone Strait; without further constraints, we assume that run-up is similar to that in
southern Georgia Strait.
Modelling of an independent southern Cascadia megathrust source (Cherniawsky et al.
2007) shows that most tsunami energy is directed east and west; run-up for a 500-year
strain release event will likely exceed 1.5 m only on south-western Vancouver Island. Up
to 1.1 m amplitudes occur in the harbours of Victoria; local run-up maxima C1.5 m may
be possible. Without fine-scale modelling in Georgia Strait, similar maxima cannot be
ruled out.
Table 1 continued
Sourcea Event frequencyb (/year) Regions affectedc run-up classd
min, best, max min, best, max
C-slope 3 5 9 10-5, 9 9 10-5,14 9 10-5
ATL-OUT, ARCTIC 3
ATL-INN, HS 2
11 9 10-5, 20 9 10-5,31 9 10-5
SE-NFLD 3
Canary Is. 3 9 10-6, 6 9 10-6,10 9 10-6
ATL-OUT, ATL-INN, SE-NFLD, HS
1, 2, 3
a Source of tsunamigenic earthquakes/landslides. Explorer and Haida Gwaii fault sources defined inTable 2. FF SZ: far-field subduction zones; Aleutians, and C-slope 1.5 and 3: Aleutian and continental slopelandslide sources for tsunami run-up exceeding 1.5 and 3 m. CSZ Cascadia subduction zone, Gib Gibraltar,PR Puerto Rico, L. Antilles Lesser Antillesb Frequency of source events, estimated from average historical/palaeoseismic/predicted recurrencec Zones shown in Fig. 2. WHG: both WHG-N and WHG-S; WVI: WVI-N and WVI-S; JDF: JDF-W andJDF-E&GId run-up class: 0: Hr \ 1.5 m; 1: 2Hr C 1.5 m; 2: Hr C 1.5 m, 2Hr C 3 m; 3: Hr C 3 m. Local mean andmax run-up Hr and 2Hr estimated using Abe (1995) empirical relations (see Online Resource 2) and/orhistorical data, palaeoevent data, modelling, or various assumptions (see text for each source)e Tsunami impact poorly defined. For CSZ long, we assume that mean run-up C3 m is likely only for verylarge (max) events: equivalent recurrence 1,150 years (Witter et al. 2011) (0 min and best probability). ForCSZ south, we assume local maxima C1.5 m are improbable but not impossible (probability 25 % ofearthquake probability; minimum 0)
Nat Hazards (2014) 70:237–274 245
123
Estimated tsunami hazard from Cascadia megathrust ruptures (Table 1) is based on a
combination of modelling (Cherniawsky et al. 2007), empirical relations (for areas north of
the model; equations in Online Resource 2), and palaeoseismic recurrence. Long ruptures
could produce run-up exceeding 1.5 m for all zones and generally C3 m for all regions
except Georgia Strait, where run-up exceeding 3 m is assumed to occur only in the largest
events (recurrence *1,150 years; Witter et al. 2011). Southern ruptures could lead to run-
up generally exceeding 1.5 m (local maxima C3 m) only along south-western Vancouver
Island, with all other areas susceptible only to local maxima C1.5 m.
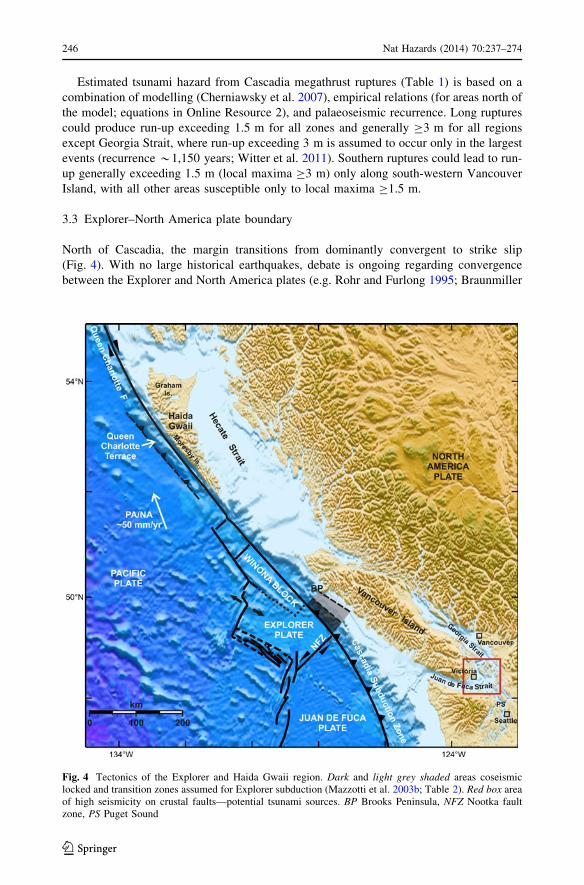
3.3 Explorer–North America plate boundary
North of Cascadia, the margin transitions from dominantly convergent to strike slip
(Fig. 4). With no large historical earthquakes, debate is ongoing regarding convergence
between the Explorer and North America plates (e.g. Rohr and Furlong 1995; Braunmiller
Fig. 4 Tectonics of the Explorer and Haida Gwaii region. Dark and light grey shaded areas coseismiclocked and transition zones assumed for Explorer subduction (Mazzotti et al. 2003b; Table 2). Red box areaof high seismicity on crustal faults—potential tsunami sources. BP Brooks Peninsula, NFZ Nootka faultzone, PS Puget Sound
246 Nat Hazards (2014) 70:237–274
123
and Nabelek 2002), with contrasting implications for tsunamigenic potential. Despite the
significant internal deformation (e.g. Rabinovich et al. 2008), the existence of an inde-
pendent Explorer plate is supported by GPS data (Mazzotti et al. 2003b), offshore sediment
deformation (Davis and Hyndman 1989), and earthquake slip vectors (Braunmiller and
Nabelek 2002). A subducted slab is present beneath Vancouver Island as far north as
Brooks Peninsula (Cassidy et al. 1998); active subduction is implied by the occurrence of
Episodic Tremor and Slip (Kao et al. 2009). Relative motion of *20 mm/year across the
Nootka fault (Willoughby and Hyndman 2005) suggests *20–25 mm/year convergence at
the southern end of the Explorer–North America boundary, consistent with GPS data
(Mazzotti et al. 2003b). Evidence for active subduction of the Winona block (northern
Explorer) is inconclusive; GPS data cannot discriminate between oblique subduction and
permanent crustal deformation (Mazzotti et al. 2003b). The absence of a subducted slab
north of Brooks Peninsula (Cassidy et al. 1998) implies either a lack of subduction or slow,
recent subduction (Braunmiller and Nabelek 2002).
Here, we treat the Explorer subduction as an independent source, but it is possible that
subduction could occur as an extension of a megathrust earthquake on the rest of the
Cascadia system to the south. Assuming subduction of the Explorer plate (slip tapering to
zero through the Winona block) and a seismogenic zone consistent with GPS and thermal
data (Mazzotti et al. 2003b; Fig. 4; Table 2), we calculate that Mw 7.7 ± 0.3 megathrust
events may occur with an average recurrence interval of *333 years (112–1,005 years).
We also assess a smaller rupture scenario (Winona block excluded); for Mw * 7.4 events,
we calculate an average recurrence interval of *200 years (Table 2). Mw 7.7 events could
produce up to 7 m run-up on north-western Vancouver Island, but on the south-western
coast, northern mainland coast, and southern Haida Gwaii, only local maxima C1.5 m are
likely (Table 1). Larger events could produce run-up consistently exceeding 1.5 m over
these areas, and smaller ones would have a far more localised impact.
3.4 Haida Gwaii margin
Pacific–North America relative plate motion at the Haida Gwaii margin (Fig. 4) is pri-
marily strike slip, accommodated on the near-vertical Queen Charlotte fault, but is
increasingly oblique southward. The 1949 M 8.1 mainly strike-slip event produced only a
small tsunami with reported amplitudes mostly *0.5 m; a reported *3 m wave was likely
landslide-related. A 2001 Mw 6.1 thrust event near the southern Queen Charlotte fault
caused a larger than expected tsunami (up to 23 cm on Vancouver Island; Rabinovich et al.
2008), demonstrating the potential tsunami hazard.
Convergence increases from *8 to 15 mm/year from northern to southern Haida Gwaii
(Mazzotti et al. 2003a). Two end-member models are proposed: (1) subduction of the
Pacific plate beneath Haida Gwaii (e.g. Hyndman and Ellis 1981); (2) internal deformation
of both plates (e.g. Rohr et al. 2000). GPS data infer *5 mm/year shortening within the
North America plate, but the 6–10 mm/year residual convergence may be explained by
either underthrusting or shortening of the Pacific plate (Mazzotti et al. 2003a). The sub-
duction model is supported by bathymetry (trench; accretionary prism), receiver function
analysis showing a dipping slab, and by gravity and heat flow data (e.g. Bustin et al. 2007).
We assume subduction on a fault dipping at 28� (Bustin et al. 2007) to calculate an
average recurrence interval of *760 years for megathrust earthquakes of Mw * 7.8
(7.5–8.2; Table 2). Some parameters are constrained over a relatively small area and likely
are not uniform along strike, e.g. dip angle varies with the age of oceanic crust. Also, the
convergence rate used implies a lack of internal deformation of the Pacific plate, e.g.
Nat Hazards (2014) 70:237–274 247
123
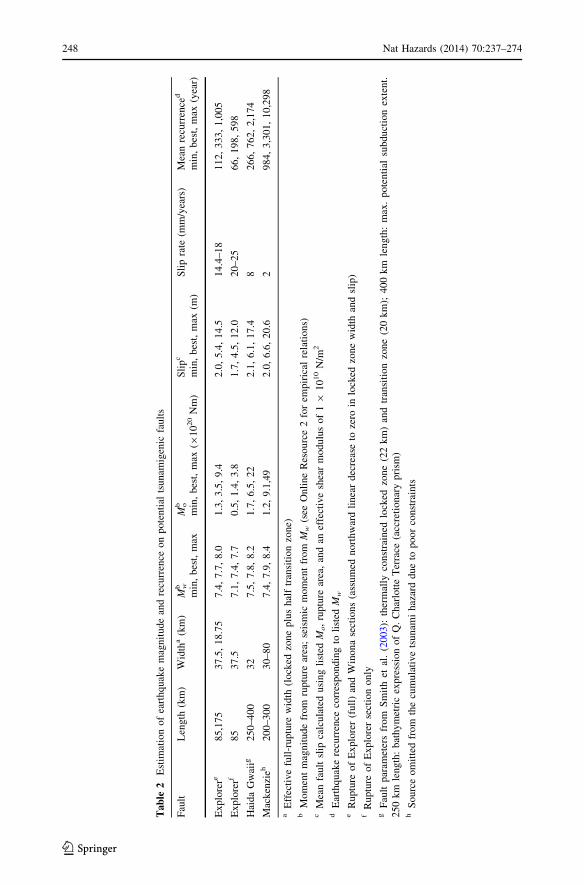
Tab
le2
Est
imat
ion
of
eart
hquak
em
agnit
ude
and
recu
rren
ceon
pote
nti
alts
unam
igen
icfa
ult
s
Fau
ltL
eng
th(k
m)
Wid
tha
(km
)M
wb
min
,b
est,
max
Mob
min
,b
est,
max
(91
020
Nm
)S
lip
c
min
,b
est,
max
(m)
Sli
pra
te(m
m/y
ears
)M
ean
recu
rren
ced
min
,b
est,
max
(yea
r)
Ex
plo
rere
85
,17
53
7.5
,1
8.7
57
.4,
7.7
,8
.01
.3,
3.5
,9
.42
.0,
5.4
,1
4.5
14
.4–
18
11
2,
33
3,
1,0
05
Ex
plo
rerf
85
37
.57
.1,
7.4
,7
.70
.5,
1.4
,3
.81
.7,
4.5
,1
2.0
20
–2
56
6,
19
8,
59
8
Hai
da
Gw
aiig
25
0–4
00
32
7.5
,7
.8,
8.2
1.7
,6
.5,
22
2.1
,6
.1,
17
.48
26
6,
76
2,
2,1
74
Mac
ken
zieh
20
0–3
00
30
–8
07
.4,
7.9
,8
.41
.2,
9.1
,49
2.0
,6
.6,
20
.62
98
4,
3,3
01
,1
0,2
98
aE
ffec
tiv
efu
ll-r
up
ture
wid
th(l
ock
edzo
ne
plu
sh
alf
tran
siti
on
zon
e)b
Mo
men
tm
agn
itu
de
from
rup
ture
area
;se
ism
icm
om
ent
from
Mw
(see
Onli
ne
Res
ourc
e2
for
empir
ical
rela
tions)
cM
ean
fault
slip
calc
ula
ted
usi
ng
list
edM
o,
ruptu
rear
ea,
and
anef
fect
ive
shea
rm
odulu
sof
19
10
10
N/m
2
dE
arth
quak
ere
curr
ence
corr
espondin
gto
list
edM
w
eR
up
ture
of
Ex
plo
rer
(fu
ll)
and
Win
on
ase
ctio
ns
(ass
um
edn
ort
hw
ard
lin
ear
dec
reas
eto
zero
inlo
cked
zon
ew
idth
and
slip
)f
Ru
ptu
reo
fE
xp
lore
rse
ctio
no
nly
gF
ault
par
amet
ers
fro
mS
mit
het
al.
(20
03):
ther
mal
lyco
nst
rain
edlo
cked
zon
e(2
2k
m)
and
tran
siti
on
zon
e(2
0k
m);
40
0k
mle
ngth
:m
ax.
po
ten
tial
sub
du
ctio
nex
ten
t.2
50
km
len
gth
:b
ath
ym
etri
cex
pre
ssio
no
fQ
.C
har
lott
eT
erra
ce(a
ccre
tio
nar
yp
rism
)h
So
urc
eo
mit
ted
from
the
cum
ula
tiv
ets
un
ami
haz
ard
du
eto
po
or
con
stra
ints
248 Nat Hazards (2014) 70:237–274
123
2 mm/year intraplate shortening would increase recurrence intervals by *30 %. On
western Haida Gwaii, tsunami run-up may exceed 3 m from local Mw 7.8–8.2 thrust
earthquakes; Mw 7.5 events may result in local maxima of that size (Table 1). run-up is
unlikely to be damaging to the northern mainland and north-western Vancouver Island
from Mw 7.5 events, but may exceed 1.5 m (locally 3 m) in larger events. On south-
western Vancouver Island, local maxima C1.5 m are likely only for the largest events.
Eastern Haida Gwaii may be sheltered; we assume run-up similar to the northern mainland,
but modelling is required.
The occurrence of an Mw 7.7 thrust earthquake off Moresby Island, Haida Gwaii on 27
October 2012 implies that a significant part of the convergence is accommodated by sub-
duction, as in model (1) above (James et al. 2013; Lay et al. 2013). Tsunami impacts docu-
mented on the west coast of Haida Gwaii (e.g. Leonard et al. 2012b) provide a validation of
our empirical methods of tsunami hazard assessment. Although this part of the coast is
unpopulated and there were no witnesses, evidence of tsunami run-up (often exceeding 5 m)
was observed at the heads of many inlets and bays along more than 200 km of coastline.
3.5 Local crustal earthquakes
In the Cascadia forearc (southern Puget Sound to southernmost Georgia Strait; Fig. 4), GPS,
seismicity and palaeoseismic data indicate that *3 mm/year of long-term margin-parallel
shortening is accommodated by crustal earthquakes (e.g. Sherrod et al. 2008). The seismicity
recurrence relation predicts one M C 7 earthquake every*400 years (Hyndman et al. 2003).
None have occurred in the last 150 years, but there is evidence for a tsunamigenic M C 7
thrust earthquake on the Seattle fault*1.1 ka; modelling of an Mw 7.6 source results in[3 m
tsunami waves at Seattle and\1 m in Juan de Fuca Strait (Koshimura et al. 2002). Further
north, the Holocene palaeoseismic record (likely incomplete) includes several events since
*4 ka; mapped fault lengths could produce earthquakes up to M * 7.5 in eastern Juan de
Fuca Strait (e.g. Johnson et al. 2001). In southern Georgia Strait, seafloor offsets indicate
active faulting (Mosher et al. 2000), but displacements are less clear further north. No tsunami
deposits are confirmed around the Canadian Strait of Georgia (e.g. Clague et al. 2000), but
deposits from tsunamis with run-up\3 m are unlikely to be preserved, especially in high-
rainfall regions (Szczucinski 2012).
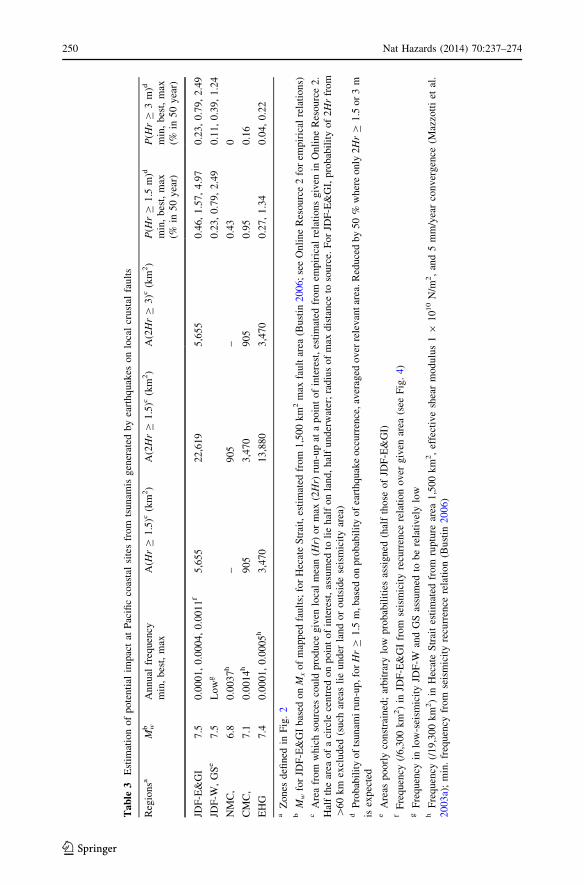
We outline an approach to assess the tsunami hazard from crustal submarine faults. Based
on the earthquake recurrence relation of a *80 km by 80 km region (box in Fig. 4), we
calculate that Mw 7.5 events may occur every *2,830 years (Table 3), 7.5 being the maxi-
mum magnitude estimated on the Devil’s Mountain fault, which shows Quaternary offsets
offshore Victoria, BC (Hayward et al. 2006). Assuming a uniform frequency of earthquakes
per unit area, we estimate potential tsunami impacts (Table 3). An Mw 7.5 thrust earthquake
can produce mean run-up C1.5 m (locally C3 m) up to 60 km from the source and local
maxima C1.5 m up to 120 km (empirical relations in Online Resource 2). Thus, for any
coastal point, the expected frequency of mean run-up C1.5 m is about half the frequency of
Mw 7.5 earthquakes in a 60-km radius, assuming that roughly 50 % of these earthquakes occur
underwater. Compared with the area discussed above, seismicity rates in the northern and
central Strait of Georgia and western Juan de Fuca Strait are much lower. The related tsunami
hazard is presumably also lower; we assign probabilities that are half those of eastern Juan de
Fuca Strait (Table 3). We include the whole Strait of Georgia in this lower-hazard zone,
because significant seismicity occurs only at the southernmost end.
Another concentration of crustal seismicity occurs in Hecate Strait (location in Fig. 4);
earthquake mechanisms are a combination of thrust and strike slip (Ristau et al. 2007). The
Nat Hazards (2014) 70:237–274 249
123
Ta
ble
3E
stim
atio
no
fp
ote
nti
alim
pac
tat
Pac
ific
coas
tal
site
sfr
om
tsu
nam
isg
ener
ated
by
eart
hq
uak
eso
nlo
cal
cru
stal
fau
lts
Reg
ionsa
Mwb
An
nu
alfr
equen
cyA
(Hr
C1
.5)c
(km
2)
A(2
Hr
C1
.5)c
(km
2)
A(2
Hr
C3
)c(k
m2)
P(H
rC
1.5
m)d
P(H
rC
3m
)d
min
,b
est,
max
min
,b
est,
max
(%in
50
yea
r)m
in,
bes
t,m
ax(%
in5
0y
ear)
JDF
-E&
GI
7.5
0.0
00
1,
0.0
00
4,
0.0
01
1f
5,6
55
22
,61
95
,65
50
.46,
1.5
7,
4.9
70
.23
,0
.79
,2
.49
JDF
-W,
GS
e7
.5L
ow
g0
.23,
0.7
9,
2.4
90
.11
,0
.39
,1
.24
NM
C,
6.8
0.0
03
7h
–9
05
–0
.43
0
CM
C,
7.1
0.0
01
4h
90
53
,470
90
50
.95
0.1
6
EH
G7
.40
.00
01
,0
.000
5h
3,4
70
13
,88
03
,47
00
.27,
1.3
40
.04
,0
.22
aZ
on
esd
efined
inF
ig.
2b
Mw
for
JDF
-E&
GI
bas
edo
nM
xo
fm
app
edfa
ult
s;fo
rH
ecat
eS
trai
t,es
tim
ated
fro
m1
,500
km
2m
axfa
ult
area
(Bu
stin
20
06;
see
On
lin
eR
esou
rce
2fo
rem
pir
ical
rela
tio
ns)
cA
rea
fro
mw
hic
hso
urc
esco
uld
pro
duce
giv
enlo
cal
mea
n(H
r)o
rm
ax(2
Hr)
run-u
pat
apoin
tof
inte
rest
,es
tim
ated
from
empir
ical
rela
tions
giv
enin
Onli
ne
Res
ourc
e2.
Hal
fth
ear
eao
fa
circ
lece
ntr
edo
np
oin
to
fin
tere
st,
assu
med
toli
eh
alf
on
lan
d,
hal
fu
nd
erw
ater
;ra
diu
so
fm
axd
ista
nce
toso
urc
e.F
or
JDF
-E&
GI,
pro
bab
ilit
yo
f2
Hr
fro
m[
60
km
excl
ud
ed(s
uch
area
sli
eu
nd
erla
nd
or
ou
tsid
ese
ism
icit
yar
ea)
dP
rob
abil
ity
of
tsun
ami
run
-up
,fo
rH
rC
1.5
m,b
ased
on
pro
bab
ilit
yo
fea
rth
quak
eo
ccu
rren
ce,av
erag
edo
ver
rele
van
tar
ea.R
edu
ced
by
50
%w
her
eo
nly
2H
rC
1.5
or
3m
isex
pec
ted
eA
reas
po
orl
yco
nst
rain
ed;
arbit
rary
low
pro
bab
ilit
ies
assi
gn
ed(h
alf
tho
seo
fJD
F-E
&G
I)f
Fre
quen
cy(/
6,3
00
km
2)
inJD
F-E
&G
Ifr
om
seis
mic
ity
recu
rren
cere
lati
on
over
giv
enar
ea(s
eeF
ig.
4)
gF
req
uen
cyin
low
-sei
smic
ity
JDF
-Wan
dG
Sas
sum
edto
be
rela
tiv
ely
low
hF
req
uen
cy(/
19
,30
0k
m2)
inH
ecat
eS
trai
tes
tim
ated
from
rup
ture
area
1,5
00
km
2,
effe
ctiv
esh
ear
modulu
s1
91
010
N/m
2,
and
5m
m/y
ear
con
ver
gen
ce(M
azzo
tti
etal
.2
00
3a)
;m
in.
freq
uen
cyfr
om
seis
mic
ity
recu
rren
cere
lati
on
(Bust
in2
00
6)
250 Nat Hazards (2014) 70:237–274
123
long-term strain rate from GPS is significantly larger than that inferred from seismicity,
due to either aseismic/postseismic deformation or infrequent large earthquakes (Bustin
2006). Assuming the latter (parameters in Table 3), earthquakes up to Mw * 7.1 may be
expected every *728 years on average (Table 3). Taking the approach described above
for Juan de Fuca Strait, we estimate the potential tsunami impact on the coasts of eastern
Haida Gwaii and the adjacent mainland (Table 3).
The approach outlined here estimates the maximum probability of potentially damaging
tsunami run-up resulting from submarine crustal earthquakes. Uncertainties remain,
especially in areas of transpression. Fault motion with a strike-slip component will result in
a smaller tsunami than from a pure thrust earthquake of the same magnitude; consequently,
tsunami run-up will be overestimated.
3.6 Local landslides
Locally destructive waves result from landslides on the Pacific coast, with fjords partic-
ularly at risk due to potential failure of their steep walls or submarine delta fronts; rela-
tively small failures can produce high run-up in these long narrow basins. Historical
tsunami sources on the coast of BC and Alaska (Fig. 1) include rockfalls in Knight Inlet
(*16 century and 1999: Bornhold et al. 2007; van Zeyl 2009) and Lituya Bay (1958:
Miller 1960) and submarine slides at Deep Bay (1946: Mosher et al. 2004), Kitimat Arm
(1975: Skvortsov and Bornhold 2007), and Skagway (1994: Kulikov et al. 1996). Some
were triggered by ground shaking (Lituya Bay and Deep Bay) and others by overloading of
sediments at low tide (Kitimat and Skagway); many caused fatalities. Modelling of
potential Fraser River delta foreslope failures suggests that damaging waves could result in
Georgia Strait (Rabinovich et al. 2003). With no frequency–size data available for
potentially tsunamigenic local landslides, we cannot include these sources in the analysis,
but we consider all Pacific coastlines at risk (Sect. 2.4).
3.7 Continental slope landslides
Infrequent ‘‘super-scale’’ slumps offshore Oregon may have produced huge tsunamis
(Goldfinger et al. 2000). Off Vancouver Island, numerous slope failures up to at least 5 km
wide along the Cascadia deformation front appear to be fault controlled and pre-condi-
tioned to fail by strength contrasts between gas-charged and overlying gas hydrate-
cemented sediments (Lopez et al. 2010). Failures are most likely during strong ground
shaking; those that coincide with megathrust seafloor displacement could locally amplify
tsunamis as suggested for the 2004 Sumatra event (Tappin et al. 2007). Slope stability
analysis is needed to determine whether tsunamigenic failures may be triggered by smaller
earthquakes. If continental slope failures were assumed to occur at a similar rate as we
estimate for the Atlantic margin (Sect. 4.5), the hazard is negligible compared to other
Pacific tsunami sources. Making the assumption that failures will only occur during
Cascadia megathrust earthquakes, we omit them as an independent source; they should be
incorporated into probabilistic tsunami hazard analyses of the subduction zone.
3.8 Hawaiian Islands landslides
Palaeotsunami data inferring up to *400 m run-up on the south-eastern Hawaiian Islands
are consistent with dating and modelling of debris avalanches off Mauna Loa (Moore et al.
Nat Hazards (2014) 70:237–274 251
123
1994; McMurtry et al. 2004). Based on tsunami modelling of a *5,000-km3 deposit, Ward
(2001) suggests that a volcanic flank collapse could lead to *20 m run-up on the Pacific
coast of North America. However, dispersion was neglected in Ward’s analysis; significant
attenuation is likely to occur over *4,000 km of propagation (Pararas-Carayannis 2002).
For example, more realistic models of Canary Island flank collapses result in wave
amplitudes of *1–3 m after similar propagation in the Atlantic (e.g. Mader 2001), i.e.
*10 % of the Ward (2001) values. Without further constraints, but consistent with the
above models, we assume that large failures could lead to mean tsunami run-up C1.5 m on
the west coast of Canada, but mean run-up C3 m could only result from north-eastern flank
failures, where the main energy would be directed towards Pacific Canada.
Eleven giant Hawaiian submarine landslides have occurred since 1 Ma (McMurtry
et al. 2004). We take the average recurrence interval (*91 ky) as a minimum for local
run-up maxima C1.5 m on the Pacific coast (Table 1). Assuming that failures are equally
likely on all three flanks of the islands, and that western flank slides are the least
hazardous due to wave scattering through the Hawaiian Islands, provides a best estimate
of *136 ky recurrence for mean run-up C1.5 m. We calculate a maximum recurrence
interval of *272 ky with the possibility that only failures on the north-eastern flanks
may present a tsunami hazard for Canada; we choose this value as a minimum recur-
rence for mean run-up C3 m. Thus, the Pacific coast tsunami hazard from Hawaiian
landslides is negligible. Without detailed modelling, we assume that Georgia Strait
would be protected from hazardous waves, but we apply equal hazard to all other Pacific
coastal zones (Table 1).
3.9 Aleutian Islands landslides
Waythomas et al. (2009) modelled eight hypothetical submarine failures
(160–1,440 km3) off the Aleutian margin (Fig. 1). Results suggest a threshold volume of
*400 km3 for slides that may result in tsunami run-up C1.5 m on the Canadian Pacific
coast; run-up greater than *3 m appears possible for failures exceeding *500 km3 in
the central Aleutian arc and *800 km3 in the west. The region has not been surveyed at
a resolution adequate to constrain either the size or frequency of large failures in the
past; Waythomas et al. (2009) use a probabilistic approach developed by Watts (2004) to
calculate an average recurrence interval of *2 ky for failures C100 km3 that could be
triggered by Mw 5.1–8.9 earthquakes. Without further constraints (P. Watts, personal
communication 2011), we assume approximate best estimates of 3 ky (2.5–5 ky) and 4
ky (3.5–8 ky) for the recurrence of mean tsunami run-up exceeding 1.5 and 3 m,
respectively. Without detailed modelling, we assume that Georgia Strait would be pro-
tected from potentially damaging waves, but we apply equal hazard to all other Pacific
coastal zones (Table 1).
4 Atlantic coast
Potential tsunami sources for the east coast of Canada include a few compressive plate
boundaries around the Atlantic Ocean (e.g. 1755 Lisbon tsunami generated offshore south-
western Portugal and observed in Newfoundland; Caribbean subduction), local landslide
sources (e.g. 1929 Grand Banks event), and far-field landslide sources in the eastern
Atlantic Ocean.
252 Nat Hazards (2014) 70:237–274
123
4.1 Gibraltar-Cadiz plate boundary
The catastrophic 1755 Mw * 8.5–9 Lisbon earthquake triggered a damaging tsunami with
many fatalities in western Europe and Morocco (Solares and Arroyo 2004; Muir-Wood and
Mignan 2009). Far-field waves occurred in Brazil and the Caribbean; at Bonavista,
Newfoundland, the harbour drained and then flooded, as did adjacent meadows (Tocque
1846; Ruffman 2006). The source of the earthquake is still under debate, but it must lie in
the region of the diffuse Africa-Eurasia plate boundary off south-western Iberia (e.g.
Baptista et al. 2003; Fig. 1). Of several proposed faults, only the Gibraltar-Cadiz thrust
(GCT) is large enough for an Mw 8.5 event, and an additional source to the northwest may
be required to match all the observations (Gutscher et al. 2009). We assess a range of
possibilities where large earthquakes occur on one or more dip-slip faults; source attri-
butes, slip, and recurrence time required for Mw 8.5 earthquakes are listed in Table 4.
In deep-sea basins offshore the south-western Iberian peninsula, turbidite deposits
dating from the last *9 ky (correlated up to *175 km) probably result from shaking in
large earthquakes (e.g. Gracia et al. 2010). Since 7 ka, all widespread turbidites but one
correlate with tsunami deposits on the coasts of south-western Spain and Portugal (Luque
et al. 2002; Baptista and Miranda 2009); the youngest likely represents the M 8.0 1969
Horseshoe earthquake that triggered only a small tsunami (Gracia et al. 2010). Assuming
that the remaining six extensive turbidite events in the last *9 ky (or five if one had a
climatic trigger) were sourced by events similar to the 1755 event, and that the record is
complete for M * 8.5 events, provides a mean recurrence interval of *1,730 years (or
*2,130 years). This is broadly compatible with proposed fault sources (Table 4).
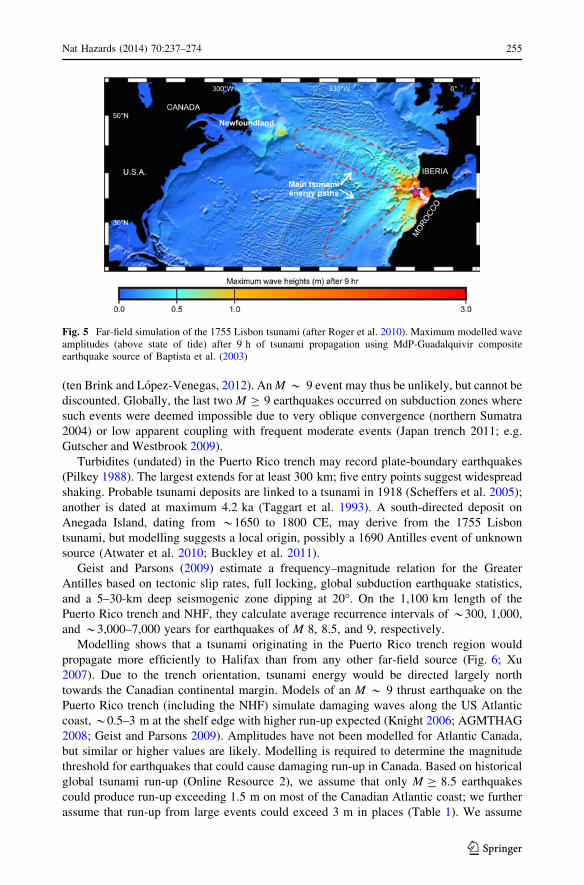
Observations of relative wave amplitudes in 1755 are matched by modelling of the Mar-
ques de Pombal-Guadalquivir (MdP-G) source (Roger et al. 2010, 2011) or a source oriented
*NNE-SSW such as the GCT (Barkan et al. 2009; Muir-Wood and Mignan 2009). For the
former, tsunami energy is directed towards Newfoundland and South America (Fig. 5). Using
high-resolution bathymetric and topographic grids, run-up exceeds 1.5 m along much of the
south-eastern Newfoundland coast and matches historical accounts of inundation on the
Bonavista peninsula (up to 2.5 m or more; Roger et al. 2010). We consider both the MdP-G
(Baptista et al. 2003) and GCT faults (e.g. Thiebot and Gutscher 2006) viable sources of
‘‘Lisbon-type’’ events, capable of producing run-up in excess of 1.5 m in Atlantic Canada and
possibly greater than 3 m in places (Table 1). We assume that the inner coastlines would be
relatively sheltered, with only local maxima C1.5 m.
4.2 Puerto Rico trench
At the Greater Antilles margin (Fig. 1), convergence is very oblique, with *5 mm/year
compression on the Northern Hispaniola fault (NHF) and*22 mm/year left-lateral strike slip
on the Septentrional and Enriquillo faults (Calais et al. 2002). A 1946–1953 earthquake series
on the NHF included an Ms 8.1 event that spawned up to 5-m tsunami waves, killing 1,790
people in the Dominican Republic (Lander et al. 2002). Further east, strain partitioning is less
apparent. The North America plate subducts obliquely at the Puerto Rico trench beneath
Puerto Rico and the Virgin Islands (relative motion *17 mm/year; Jansma et al. 2000), but
left-lateral slip is likely on offshore faults (LaForge and McCann 2005). Interface slip is
generally oblique, but some events are more orthogonal (e.g. 1943 Mw 7.8; Doser et al. 2005).
No observable tsunami occurred in 1943 or from a 1787 M * 8 event likely on the Puerto
Rico trench (McCann 1985). In addition, modelling of GPS data from Puerto Rico and the
Virgin Islands suggests little or no trench-perpendicular compressional strain accumulation
Nat Hazards (2014) 70:237–274 253
123
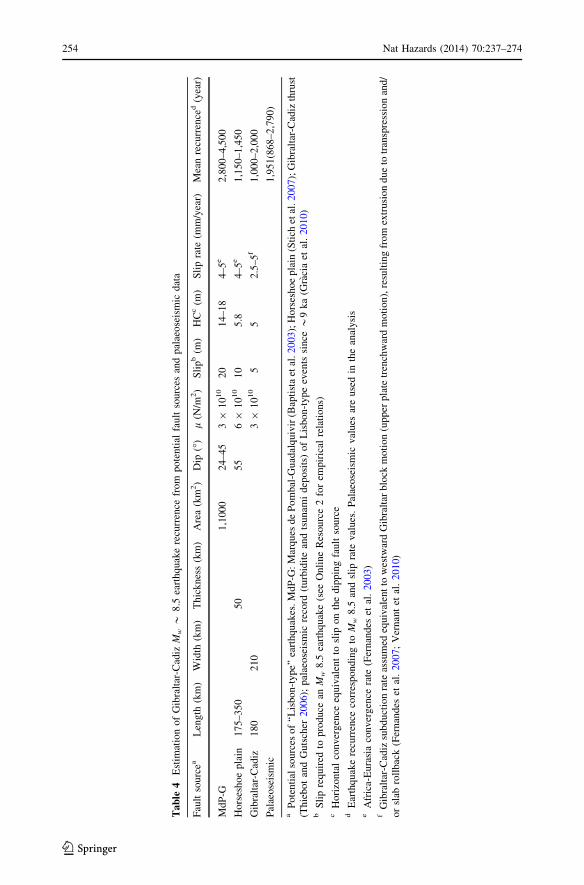
Ta
ble
4E
stim
atio
no
fG
ibra
ltar
-Cad
izM
w*
8.5
eart
hquak
ere
curr
ence
from
pote
nti
alfa
ult
sourc
esan
dpal
aeose
ism
icdat
a
Fau
ltso
urc
eaL
eng
th(k
m)
Wid
th(k
m)
Th
ick
nes
s(k
m)
Are
a(k
m2)
Dip
(�)
l(N
/m2)
Sli
pb
(m)
HC
c(m
)S
lip
rate
(mm
/yea
r)M
ean
recu
rren
ced
(yea
r)
Md
P-G
1,1
00
02
4–
45
39
10
10
20
14
–1
84
–5
e2
,80
0–
4,5
00
Ho
rses
ho
ep
lain
17
5–3
50
50
55
69
10
10
10
5.8
4–
5e
1,1
50
–1
,45
0
Gib
ralt
ar-C
adiz
18
02
10
39
10
10
55
2.5
–5
f1
,00
0–
2,0
00
Pal
aeo
seis
mic
1,9
51
(86
8–
2,7
90
)
aP
ote
nti
also
urc
eso
f‘‘
Lis
bo
n-t
yp
e’’
eart
hq
uak
es.M
dP
-G:
Mar
qu
esd
eP
om
bal
-Gu
adal
qu
ivir
(Bap
tist
aet
al.2
00
3);
Ho
rses
hoe
pla
in(S
tich
etal
.2
00
7);
Gib
ralt
ar-C
adiz
thru
st(T
hie
bo
tan
dG
uts
cher
20
06);
pal
aeose
ism
icre
cord
(turb
idit
ean
dts
unam
idep
osi
ts)
of
Lis
bon-t
ype
even
tssi
nce
*9
ka
(Gra
cia
etal
.2
01
0)
bS
lip
req
uir
edto
pro
duce
anM
w8.5
eart
hquak
e(s
eeO
nli
ne
Res
ourc
e2
for
empir
ical
rela
tions)
cH
ori
zon
tal
con
ver
gen
ceeq
uiv
alen
tto
slip
on
the
dip
pin
gfa
ult
sou
rce
dE
arth
qu
ake
recu
rren
ceco
rres
po
nd
ing
toM
w8.5
and
slip
rate
val
ues
.P
alae
ose
ism
icval
ues
are
use
din
the
anal
ysi
se
Afr
ica-
Eu
rasi
aco
nv
erg
ence
rate
(Fer
nan
des
etal
.2
00
3)
fG
ibra
ltar
-Cad
izsu
bd
uct
ion
rate
assu
med
equ
ival
ent
tow
estw
ard
Gib
ralt
arb
lock
mo
tio
n(u
pp
erp
late
tren
chw
ard
moti
on
),re
sult
ing
fro
mex
tru
sio
ndue
totr
ansp
ress
ion
and/
or
slab
roll
bac
k(F
ern
and
eset
al.
20
07;
Ver
nan
tet
al.
20
10)
254 Nat Hazards (2014) 70:237–274
123
(ten Brink and Lopez-Venegas, 2012). An M * 9 event may thus be unlikely, but cannot be
discounted. Globally, the last two M C 9 earthquakes occurred on subduction zones where
such events were deemed impossible due to very oblique convergence (northern Sumatra
2004) or low apparent coupling with frequent moderate events (Japan trench 2011; e.g.
Gutscher and Westbrook 2009).
Turbidites (undated) in the Puerto Rico trench may record plate-boundary earthquakes
(Pilkey 1988). The largest extends for at least 300 km; five entry points suggest widespread
shaking. Probable tsunami deposits are linked to a tsunami in 1918 (Scheffers et al. 2005);
another is dated at maximum 4.2 ka (Taggart et al. 1993). A south-directed deposit on
Anegada Island, dating from *1650 to 1800 CE, may derive from the 1755 Lisbon
tsunami, but modelling suggests a local origin, possibly a 1690 Antilles event of unknown
source (Atwater et al. 2010; Buckley et al. 2011).
Geist and Parsons (2009) estimate a frequency–magnitude relation for the Greater
Antilles based on tectonic slip rates, full locking, global subduction earthquake statistics,
and a 5–30-km deep seismogenic zone dipping at 20�. On the 1,100 km length of the
Puerto Rico trench and NHF, they calculate average recurrence intervals of *300, 1,000,
and *3,000–7,000 years for earthquakes of M 8, 8.5, and 9, respectively.
Modelling shows that a tsunami originating in the Puerto Rico trench region would
propagate more efficiently to Halifax than from any other far-field source (Fig. 6; Xu
2007). Due to the trench orientation, tsunami energy would be directed largely north
towards the Canadian continental margin. Models of an M * 9 thrust earthquake on the
Puerto Rico trench (including the NHF) simulate damaging waves along the US Atlantic
coast, *0.5–3 m at the shelf edge with higher run-up expected (Knight 2006; AGMTHAG
2008; Geist and Parsons 2009). Amplitudes have not been modelled for Atlantic Canada,
but similar or higher values are likely. Modelling is required to determine the magnitude
threshold for earthquakes that could cause damaging run-up in Canada. Based on historical
global tsunami run-up (Online Resource 2), we assume that only M C 8.5 earthquakes
could produce run-up exceeding 1.5 m on most of the Canadian Atlantic coast; we further
assume that run-up from large events could exceed 3 m in places (Table 1). We assume
Fig. 5 Far-field simulation of the 1755 Lisbon tsunami (after Roger et al. 2010). Maximum modelled waveamplitudes (above state of tide) after 9 h of tsunami propagation using MdP-Guadalquivir compositeearthquake source of Baptista et al. (2003)
Nat Hazards (2014) 70:237–274 255
123
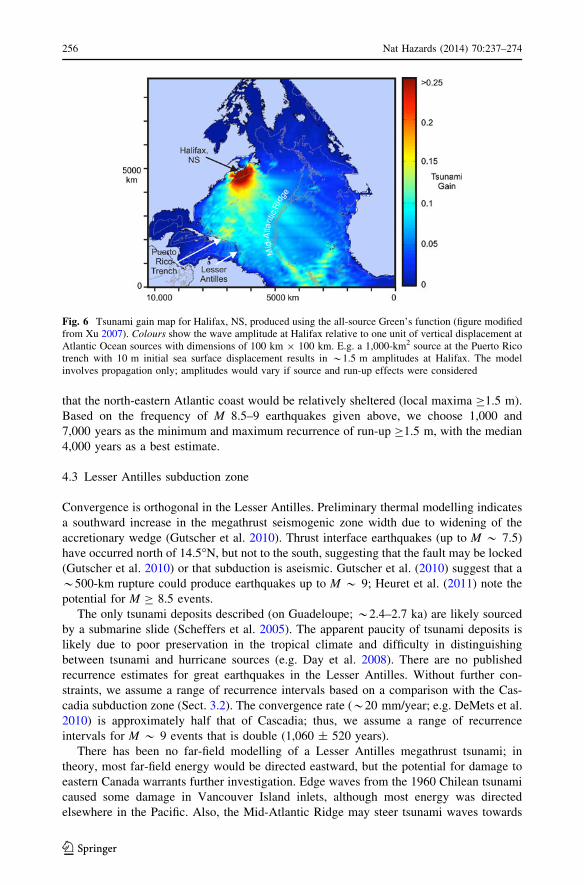
that the north-eastern Atlantic coast would be relatively sheltered (local maxima C1.5 m).
Based on the frequency of M 8.5–9 earthquakes given above, we choose 1,000 and
7,000 years as the minimum and maximum recurrence of run-up C1.5 m, with the median
4,000 years as a best estimate.
4.3 Lesser Antilles subduction zone
Convergence is orthogonal in the Lesser Antilles. Preliminary thermal modelling indicates
a southward increase in the megathrust seismogenic zone width due to widening of the
accretionary wedge (Gutscher et al. 2010). Thrust interface earthquakes (up to M * 7.5)
have occurred north of 14.5�N, but not to the south, suggesting that the fault may be locked
(Gutscher et al. 2010) or that subduction is aseismic. Gutscher et al. (2010) suggest that a
*500-km rupture could produce earthquakes up to M * 9; Heuret et al. (2011) note the
potential for M C 8.5 events.
The only tsunami deposits described (on Guadeloupe; *2.4–2.7 ka) are likely sourced
by a submarine slide (Scheffers et al. 2005). The apparent paucity of tsunami deposits is
likely due to poor preservation in the tropical climate and difficulty in distinguishing
between tsunami and hurricane sources (e.g. Day et al. 2008). There are no published
recurrence estimates for great earthquakes in the Lesser Antilles. Without further con-
straints, we assume a range of recurrence intervals based on a comparison with the Cas-
cadia subduction zone (Sect. 3.2). The convergence rate (*20 mm/year; e.g. DeMets et al.
2010) is approximately half that of Cascadia; thus, we assume a range of recurrence
intervals for M * 9 events that is double (1,060 ± 520 years).
There has been no far-field modelling of a Lesser Antilles megathrust tsunami; in
theory, most far-field energy would be directed eastward, but the potential for damage to
eastern Canada warrants further investigation. Edge waves from the 1960 Chilean tsunami
caused some damage in Vancouver Island inlets, although most energy was directed
elsewhere in the Pacific. Also, the Mid-Atlantic Ridge may steer tsunami waves towards
Fig. 6 Tsunami gain map for Halifax, NS, produced using the all-source Green’s function (figure modifiedfrom Xu 2007). Colours show the wave amplitude at Halifax relative to one unit of vertical displacement atAtlantic Ocean sources with dimensions of 100 km 9 100 km. E.g. a 1,000-km2 source at the Puerto Ricotrench with 10 m initial sea surface displacement results in *1.5 m amplitudes at Halifax. The modelinvolves propagation only; amplitudes would vary if source and run-up effects were considered
256 Nat Hazards (2014) 70:237–274
123
Canada (Fig. 6), as occurred during the 2004 Indian Ocean tsunami (Thomson et al. 2007).
We assume that M * 9 events could produce run-up C1.5 m (locally C3 m) along the
outer coasts of Nova Scotia, southern Newfoundland, and New Brunswick, that run-up
C1.5 m is possible but less likely for the inner coasts and south-eastern Newfoundland, and
that the north-eastern Atlantic coast is sheltered from such waves (Table 1).
4.4 St. Lawrence estuary
Seismicity along the St. Lawrence estuary, Quebec (Fig. 1), likely occurs as a result of
compressional reactivation of Palaeozoic normal faults (Iapetan rift zone) under the
present-day stress field, which is affected by postglacial rebound (e.g. Mazzotti et al.
2005). Earthquake focal mechanisms mostly reflect oblique thrust faulting; tectonic tsu-
namis could result from displacement of the river/estuary floor.
Tsunami modelling of tectonic and landslide sources in the estuary simulates local wave
amplitudes up to 5 m or more; larger sources lead to 1–2 m waves propagating for at least
30 km (El-Sabh et al. 1988; Poncet et al. 2010). Numerous failures are noted along the
estuarine banks and submarine slopes; many relate to the 1663 M * 7–7.5 Charlevoix
earthquake (Locat et al. 2003; Ebel 2011). In the Betsiamites delta region (lower St.
Lawrence), at least three large failures occurred in the last *10 ky, one of which correlates
with the 1663 event (Cauchon-Voyer et al. 2011), suggesting an average recurrence
equivalent to that of M * 7.2–7.8 events in the Charlevoix seismic zone.
With few constraints, we assume that the tectonic tsunami hazard in the St. Lawrence
estuary (inner Atlantic zone; Fig. 2) is negligible, but we take a conservative approach. For
the maximum level of hazard, we assume that run-up C1.5 m (locally exceeding 3 m) may
occur with a return period of *3,300 years (equivalent to the return period of large failures
and presumably large earthquakes, in the lower St. Lawrence). The estuary is also high-
lighted as susceptible to landslide-triggered waves. The shorelines of the Great Lakes
(particularly Lakes Ontario and Erie) may also be subject to tsunami hazard from tectonic
and landslide sources (e.g. Dineva et al. 2004), but inland waterways are outside the scope
of this marine coastline assessment.
4.5 Continental slope landslides
The only historical landslide tsunami on the east coast of North America, triggered by
earthquake shaking at the Grand Banks in 1929 (Fig. 1), caused 28 deaths in Newfound-
land (Heezen and Ewing 1952; Fine et al. 2005). Failures much larger than the 1929 slide
have been mapped (e.g. Piper and McCall 2003; Mosher et al. 2010). Many factors may be
important in tsunamigenesis and propagation (see Online Resource 3), but landslide vol-
ume is a primary control and the only one that can be approximated from available data.
Tsunami modelling of selected Atlantic margin slides and observations from 1929 (details
in Online Resource 3) provide a basis for estimating the threshold size for damaging
tsunamigenic failures. We estimate that tsunami run-up exceeding 1.5 and 3 m may result
from failures that exceed volumes of 40 and 55 km3, respectively. These thresholds may
vary along the coast due to factors such as varying shelf width or the presence of inlets
where resonance amplification may occur.
The frequency of continental slope landslides has varied through the Quaternary, higher
at times of glaciation and deglaciation; on the south-eastern Canadian margin, recurrence
intervals have been estimated at *5 ky for ‘‘small’’ failures and [200 ky for ‘‘large’’
failures (Piper et al. 2003; Piper 2005). High-resolution studies have identified more
Nat Hazards (2014) 70:237–274 257
123
failures in some areas including Flemish Pass and Orphan Basin off south-eastern New-
foundland (Online Resource 3), where recurrence relations can be approximated using
along-slope extent as a proxy for failure size (Fig. 7). However, for most of the margin, the
record of smaller failures closer to the threshold size is incomplete. For the little-studied
Labrador margin (Fig. 1), preliminary data indicate a similar failure distribution to the
Scotian Slope and Orphan Basin (Piper 2007).
To estimate the frequency of potentially damaging tsunami run-up, it is first necessary
to calculate the failure extent associated with a 40-km3 volume. We assume a failure style
similar to the Grand Banks slide. Shallow retrogressive failures (see Online Resource 3)
typically involve the upper 10–20 m of sediment; downdip length likely scales with along-
slope extent. For US Atlantic margin slides, Chaytor et al. (2009) calculate a relation
between volume V and area A: V = 0.0163A1.1. The Grand Banks slide is estimated at
150–200 km3 with an area of *10,000 km2 (Fine et al. 2005; Mosher and Piper 2007),
suggesting a similar relation, V = 0.02A. Relating the volume to the *250 km length
(L) provides V = 0.8L; thus, a failure with a 40-km3 volume has a predicted along-slope
extent of *50 km and a 55-km3 failure an extent of *70 km.
For the outer Atlantic coast, we assume that mean run-up exceeding 1.5 and 3 m could
result from failures with along-slope extents exceeding 50 and 70 km, respectively (only
local maxima for inner coastlines; Table 1). In Orphan Basin, the expected frequency of
slides C50 km in extent is *0.1/ky (Fig. 7), equating to an average recurrence interval of
*10 ky. Similar failures in Flemish Pass have an estimated mean recurrence time of *21
ky. Slope failures with extent C70 km occur every *11.5 ky in Orphan Basin and *45 ky
in Flemish Pass. In the absence of adequate data, we assume that the event frequencies
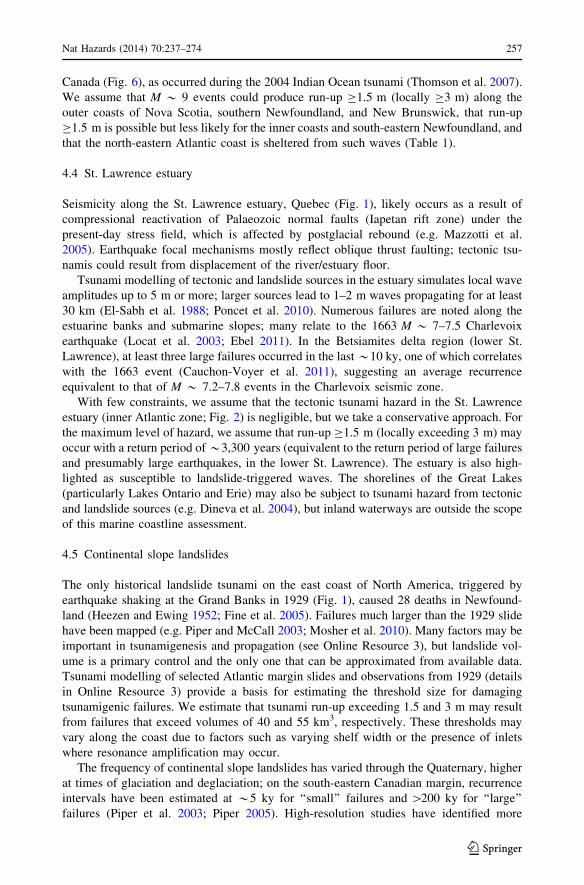
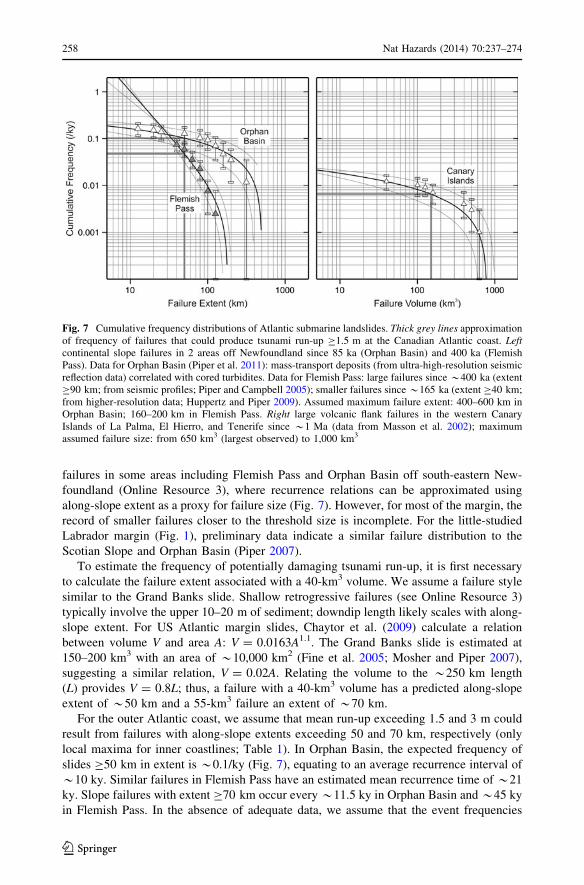
Fig. 7 Cumulative frequency distributions of Atlantic submarine landslides. Thick grey lines approximationof frequency of failures that could produce tsunami run-up C1.5 m at the Canadian Atlantic coast. Leftcontinental slope failures in 2 areas off Newfoundland since 85 ka (Orphan Basin) and 400 ka (FlemishPass). Data for Orphan Basin (Piper et al. 2011): mass-transport deposits (from ultra-high-resolution seismicreflection data) correlated with cored turbidites. Data for Flemish Pass: large failures since *400 ka (extentC90 km; from seismic profiles; Piper and Campbell 2005); smaller failures since *165 ka (extent C40 km;from higher-resolution data; Huppertz and Piper 2009). Assumed maximum failure extent: 400–600 km inOrphan Basin; 160–200 km in Flemish Pass. Right large volcanic flank failures in the western CanaryIslands of La Palma, El Hierro, and Tenerife since *1 Ma (data from Masson et al. 2002); maximumassumed failure size: from 650 km3 (largest observed) to 1,000 km3
258 Nat Hazards (2014) 70:237–274
123
estimated for Orphan Basin are representative of the entire Canadian Atlantic margin. For
events close to threshold size, most coastal sites are assumed at risk from only one source
section of the continental slope. However, due to the bend in the margin off south-eastern
Newfoundland and the likely landward tsunami travel paths, this zone is considered at risk
from landslide-generated tsunamis from three source areas: Orphan Basin, Flemish Pass,
and the Salar Basin (Online Resource 3). Modelling is required to test this assumption.
4.6 Puerto Rico trench landslides
Large landslides north of Puerto Rico may present a tsunami hazard to the Atlantic coast of
Canada, with an expected directionality similar to tsunamis triggered by earthquakes on the
Puerto Rico trench (Fig. 6). With long estimated recurrence intervals ([200 ky; ten Brink
et al. 2006) and the assumption that such landslides would occur at the same time as
megathrust earthquakes, we omit them as an independent source.
4.7 Canary Islands landslides
Landslide deposits off the western Canary Islands (Fig. 1) suggest major volcanic flank
collapses, although the presence of turbidite sub-units may infer several smaller stages for
each collapse (Masson et al. 2002; Wynn and Masson 2003). Modelling of a western flank
failure of La Palma produces catastrophic tsunami waves at the North American coast
(10–25 m amplitudes for a 500-km3 slide; Ward and Day 2001). However, dispersion
effects were omitted; more realistic models (Mader 2001; Gisler et al. 2006) produce far-
field waves on the North American east coast of no more than 1 or 3 m, with damaging
run-up possible.
Twelve flank failures (\50 to *650 km3) since *1 Ma are identified, the most recent
aged *15 ka (Masson et al. 2002). A 500-km3 slide is expected every *590 ky (Fig. 7).
We choose a threshold volume of 150 km3 (recurrence interval *160 ky; *97–313 ky),
for which Ward and Day (2001) model 3–8-m tsunami waves; we assume that a more
realistic model would yield amplitudes an order of magnitude smaller that may reach 1.5 m
run-up in Atlantic Canada. Although the models of Ward and Day (2001, 2005) overes-
timate amplitudes for a Canary Islands tsunami, they do reveal the relative impact of such
an event along the Canadian Atlantic coast. Focussing by the Laurentian Channel may lead
to amplitudes at some inner coastlines as large as those on the exposed outer coast. Thus,
we apply equal hazard to all susceptible zones, assuming that events with a 160 ky
recurrence could result in mean run-up C1.5 m, 313 ky events could produce mean run-up
C3 m, and 97 ky events could produce only local maxima C1.5 m (Table 1).
4.8 Storegga landslides
Massive landslides have occurred offshore Norway; the Storegga slide complex (Fig. 1)
has failed every *100 ky. For the latest and largest slide (*3,500 km3; *8.1 ka; Solheim
et al. 2005), 3 to [20 m run-up is inferred from tsunami deposits within *900 km
(Bondevik et al. 2005). However, coastal wave run-up in the western Atlantic would not
likely exceed 1.5 m due to attenuation over the[3,000-km distance and wave scattering by
Iceland and the Faroe Islands. Also, the Storegga area is considered currently stable, with
another glacial cycle required to lead to failure (Bryn et al. 2005). Thus, we exclude this
source from the tsunami hazard assessment.
Nat Hazards (2014) 70:237–274 259
123
5 Arctic coast
The Canadian Arctic has only recent tide gauge monitoring, a short written and poorly
recorded oral history; the only potential tsunami account concerns the disappearance of an
Inuit hunting party at the time of a strong earthquake in the 1860s (Ruffman and Murty
2006). Along the Beaufort Sea coast, deposits are linked to observed storm surges in 1944
and 1970 (Reimnitz and Maurer 1978); it can be impossible to distinguish between tsunami
and storm surge deposits (e.g. Shanmugam 2011), so some similar layers may instead
record tsunamis.
Given the lack of subduction zones, Arctic tsunami hazard is probably low, but locally
damaging waves may be generated by landslides, iceberg calving, or jokulhlaups. Far-field
tsunami damage is unlikely. Local tectonic tsunamis are improbable; no tsunamigenic
structures are defined by earthquake concentrations, which relate to postglacial extensional
faulting on eastern Baffin Island and mainly strike-slip faulting in Baffin Bay (Bent 2002).
Deep seismicity beneath the Beaufort Sea slope (Fig. 8) is interpreted as extensional
faulting due to sediment loading (Hasegawa et al. 1979). However, we do consider a
possible fault source beneath the Mackenzie delta (Beaufort Sea). We do not account for
ice effects; ice breakup and transport could increase the potential for near-field damage, but
significant wave attenuation is likely further afield, based on contrasting phenomena during
storm surge events in periods of low versus high ice cover (e.g. Reimnitz and Maurer
1978).
5.1 Mackenzie thrust
GPS data show that the northern Cordillera is moving to the north-northeast relative to the
craton to the east; this is partly taken up by thrust and strike-slip faulting in the Mackenzie
and Richardson Mountains (Leonard et al. 2007; Fig. 8), with a probable *2 mm/year
northward residual motion. A lack of seismicity in the Mackenzie delta region indicates
that either infrequent large thrust earthquakes or aseismic deformation may occur. A thin-
skinned fold-and-thrust belt formed from Palaeocene–Eocene compression; local Holocene
deformation is apparent (Lane 2002). A possible outcome of the ongoing compression is
thrusting of the delta sediments and underlying continental crust northward over the
oceanic crust on a decollement (Hyndman et al. 2005).
In the hypothesis that large tsunamigenic earthquakes may occur on such a locked thrust
fault (Fig. 8), a reasonable range of fault dimensions would indicate Mw 7.9 (7.4–8.4)
events with an average recurrence interval of *3,300 years (Table 2). In the southern
Canada Basin, sediment cores dating back to *8 ka contain four distal turbidites with a
composition consistent with a provenance of Pleistocene–Holocene Mackenzie delta
sediments; Grantz et al. (1996) suggest an origin of earthquake-triggered shallow sub-
marine slides. An average turbidite recurrence interval of *2 ky is consistent with
hypothetical Mackenzie thrust events, but also with the statistical recurrence of M * 7
earthquakes from historical Beaufort Sea seismicity.
An Mw 8.4 Mackenzie thrust earthquake could lead to tsunami run-up C3 m along the
coasts of Yukon and western Northwest Territories, with localised run-up C1.5 m possible
at Banks and Victoria Islands, and north-western Nunavut (Fig. 1). Smaller events could
produce only local maxima C1.5 m. Given the extremely poor constraints, further research
is required before the Mackenzie thrust can be considered a known hazard; thus, we
exclude it from the tsunami hazard assessment.
260 Nat Hazards (2014) 70:237–274
123
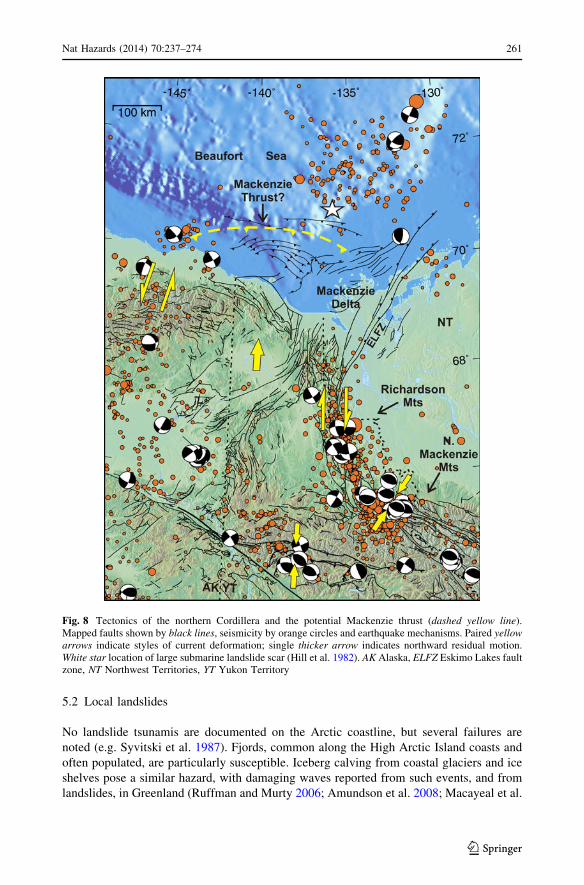
5.2 Local landslides
No landslide tsunamis are documented on the Arctic coastline, but several failures are
noted (e.g. Syvitski et al. 1987). Fjords, common along the High Arctic Island coasts and
often populated, are particularly susceptible. Iceberg calving from coastal glaciers and ice
shelves pose a similar hazard, with damaging waves reported from such events, and from
landslides, in Greenland (Ruffman and Murty 2006; Amundson et al. 2008; Macayeal et al.
Fig. 8 Tectonics of the northern Cordillera and the potential Mackenzie thrust (dashed yellow line).Mapped faults shown by black lines, seismicity by orange circles and earthquake mechanisms. Paired yellowarrows indicate styles of current deformation; single thicker arrow indicates northward residual motion.White star location of large submarine landslide scar (Hill et al. 1982). AK Alaska, ELFZ Eskimo Lakes faultzone, NT Northwest Territories, YT Yukon Territory
Nat Hazards (2014) 70:237–274 261
123
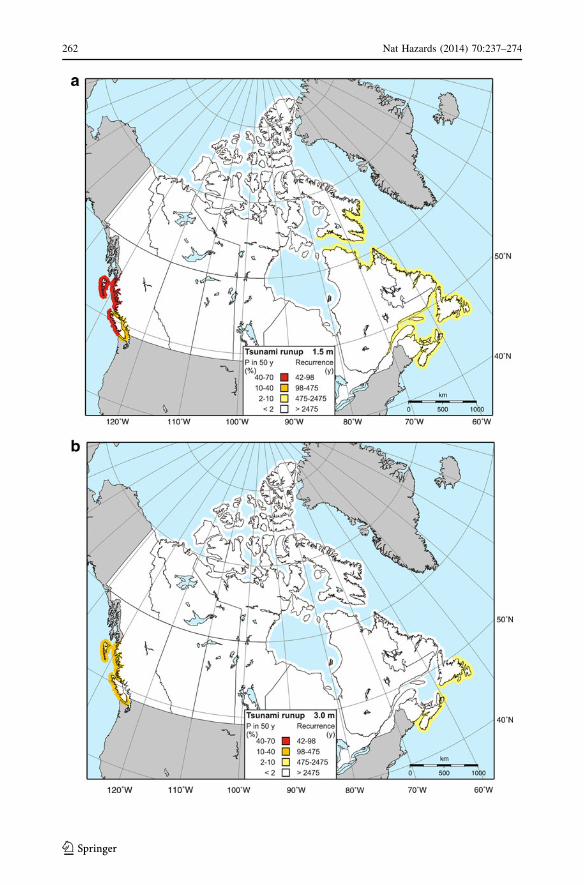
262 Nat Hazards (2014) 70:237–274
123
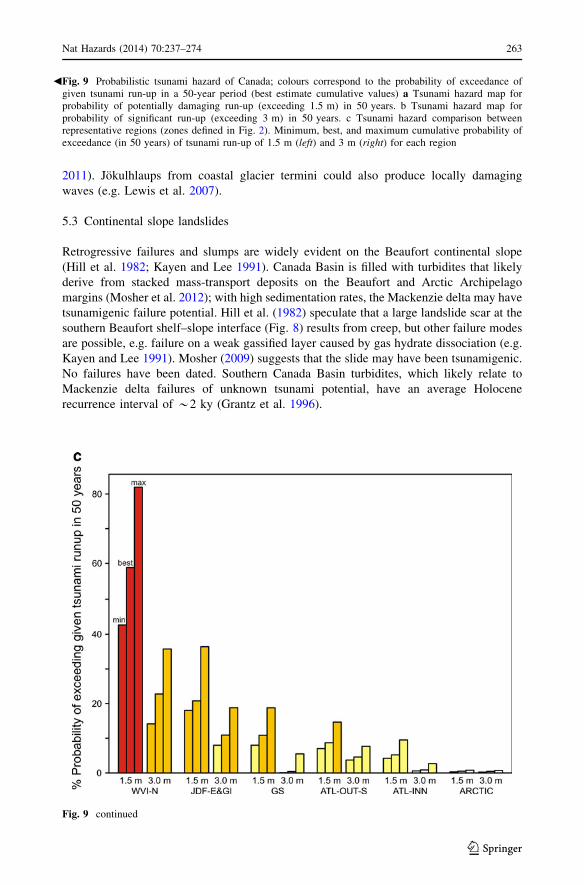
2011). Jokulhlaups from coastal glacier termini could also produce locally damaging
waves (e.g. Lewis et al. 2007).
5.3 Continental slope landslides
Retrogressive failures and slumps are widely evident on the Beaufort continental slope
(Hill et al. 1982; Kayen and Lee 1991). Canada Basin is filled with turbidites that likely
derive from stacked mass-transport deposits on the Beaufort and Arctic Archipelago
margins (Mosher et al. 2012); with high sedimentation rates, the Mackenzie delta may have
tsunamigenic failure potential. Hill et al. (1982) speculate that a large landslide scar at the
southern Beaufort shelf–slope interface (Fig. 8) results from creep, but other failure modes
are possible, e.g. failure on a weak gassified layer caused by gas hydrate dissociation (e.g.
Kayen and Lee 1991). Mosher (2009) suggests that the slide may have been tsunamigenic.
No failures have been dated. Southern Canada Basin turbidites, which likely relate to
Mackenzie delta failures of unknown tsunami potential, have an average Holocene
recurrence interval of *2 ky (Grantz et al. 1996).
Fig. 9 Probabilistic tsunami hazard of Canada; colours correspond to the probability of exceedance ofgiven tsunami run-up in a 50-year period (best estimate cumulative values) a Tsunami hazard map forprobability of potentially damaging run-up (exceeding 1.5 m) in 50 years. b Tsunami hazard map forprobability of significant run-up (exceeding 3 m) in 50 years. c Tsunami hazard comparison betweenrepresentative regions (zones defined in Fig. 2). Minimum, best, and maximum cumulative probability ofexceedance (in 50 years) of tsunami run-up of 1.5 m (left) and 3 m (right) for each region
b
Fig. 9 continued
Nat Hazards (2014) 70:237–274 263
123
Debris flow deposits on the Baffin margin (Aksu and Piper 1987) may result from
gradual glaciogenic processes or potentially tsunamigenic failures. The turbidite record
from an abyssal plain site suggests at least eight events of unknown origin in the last *50
ky (Benetti 2006); further studies are needed to constrain the history of slope failures. No
disturbances are apparent in the epicentral region of the 1933 Mw 7.4 Baffin Bay earth-
quake (Li et al. 2010).
Earthquake shaking may be necessary to trigger large continental slope failures, but the
sediment may be pre-conditioned to fail by various factors (e.g. Mosher et al. 1994). A
similar seismic hazard level is calculated for the Arctic and Atlantic margins (Halchuk and
Adams 2008). In the absence of better constraints, we assume that potentially damaging
tsunami run-up due to continental slope landslides may occur along the margins of Canada
Basin and Baffin Bay at a rate similar to that calculated for the Atlantic margin (Table 1).
Without constraints on how the Arctic coastline may be affected, we apply a uniform
hazard to the entire zone, although some coastlines are undoubtedly sheltered from slope
failure tsunamis, particularly when ice cover is high (most of the year); hazard will be
higher at times of lower ice extent.
6 Cumulative tsunami hazard of the Canadian coastline
The estimated cumulative tsunami hazard is given for each zone in Fig. 9 in terms of probability
of exceedance of 1.5 and 3 m run-up in a 50-year period (Online Resource 4 also shows the
maximum run-up expected within 100 to 2,500-year time periods). Regions with apparent
negligible hazard may still be vulnerable to local landslide-generated waves (Fig. 10). Tsunami
hazard on the outer Pacific coast (P(Hr C 1.5) & 40–80 %; R & 30–100 years equivalent
mean recurrence interval) is, respectively, one and two orders of magnitude greater than the outer
Atlantic (P(Hr C 1.5) & 1–15 %; R & 300–1,700 years) and Arctic (P(Hr C 1.5) \ 1 %;
R & 6,500–17,000 years). For run-up exceeding 3 m, the Pacific hazard (P(Hr C 3) &10–30 %; R & 150–560 years) is significantly higher than both the Atlantic (P(Hr C 3) &1–5 %; R & 650–4,000 years) and Arctic (P(Hr C 3) \1 %; R & 7,000–20,000 years). On
the outer Pacific coast, the 1.5 m? hazard is dominated by far-field subduction zones; the
3 m? hazard is almost entirely contributed by local megathrust faults (Fig. 11). For inner Pacific
coasts (Juan de Fuca and Georgia Straits), the Cascadia subduction zone contributes most hazard
at both levels. Tsunami hazard on the Atlantic coast is dominated by poorly constrained far-field
subduction zone sources at both the 1.5? and 3 m? run-up levels. Tsunami hazard on the Arctic
coastline remains uncertain, but this region is assumed to be sheltered from far-field tsunamis; the
hazard is provided by local landslide sources.
7 Discussion and recommendations
The assessment presented here quantifies the tsunami hazard from potential sources in a
simplified probabilistic way to estimate probabilities of run-up at two levels (C1.5 and
3 m), but we do not assess the probabilities of larger run-up (critical for emergency/land-
use guidelines, etc.). An improved probabilistic hazard assessment will require quantifi-
cation of a wide range of source scenarios, as well as tsunami modelling using fine-
resolution bathymetry and onland topography.
Representing the greatest overall tsunami hazard, improved tsunami models of the
Cascadia subduction zone are needed that involve a greater range of source models and
264 Nat Hazards (2014) 70:237–274
123
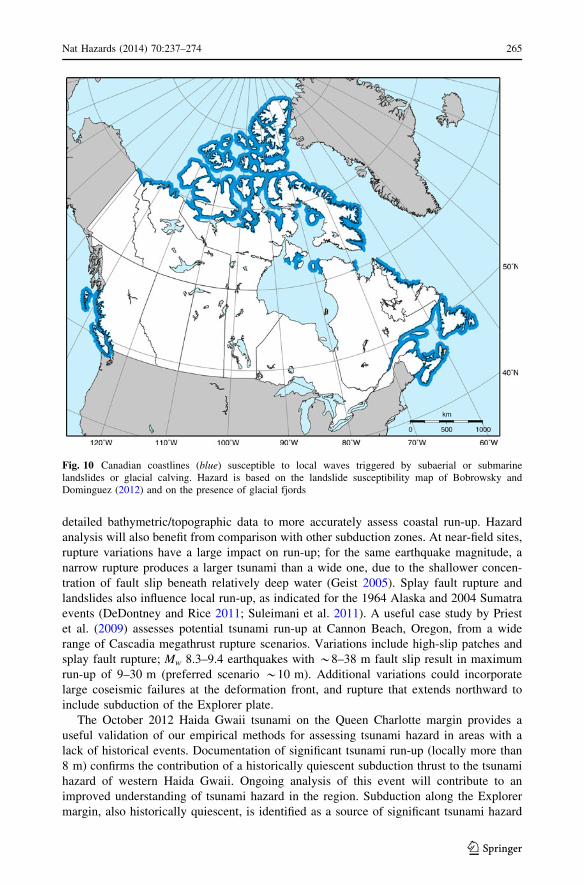
detailed bathymetric/topographic data to more accurately assess coastal run-up. Hazard
analysis will also benefit from comparison with other subduction zones. At near-field sites,
rupture variations have a large impact on run-up; for the same earthquake magnitude, a
narrow rupture produces a larger tsunami than a wide one, due to the shallower concen-
tration of fault slip beneath relatively deep water (Geist 2005). Splay fault rupture and
landslides also influence local run-up, as indicated for the 1964 Alaska and 2004 Sumatra
events (DeDontney and Rice 2011; Suleimani et al. 2011). A useful case study by Priest
et al. (2009) assesses potential tsunami run-up at Cannon Beach, Oregon, from a wide
range of Cascadia megathrust rupture scenarios. Variations include high-slip patches and
splay fault rupture; Mw 8.3–9.4 earthquakes with *8–38 m fault slip result in maximum
run-up of 9–30 m (preferred scenario *10 m). Additional variations could incorporate
large coseismic failures at the deformation front, and rupture that extends northward to
include subduction of the Explorer plate.
The October 2012 Haida Gwaii tsunami on the Queen Charlotte margin provides a
useful validation of our empirical methods for assessing tsunami hazard in areas with a
lack of historical events. Documentation of significant tsunami run-up (locally more than
8 m) confirms the contribution of a historically quiescent subduction thrust to the tsunami
hazard of western Haida Gwaii. Ongoing analysis of this event will contribute to an
improved understanding of tsunami hazard in the region. Subduction along the Explorer
margin, also historically quiescent, is identified as a source of significant tsunami hazard
Fig. 10 Canadian coastlines (blue) susceptible to local waves triggered by subaerial or submarinelandslides or glacial calving. Hazard is based on the landslide susceptibility map of Bobrowsky andDominguez (2012) and on the presence of glacial fjords
Nat Hazards (2014) 70:237–274 265
123
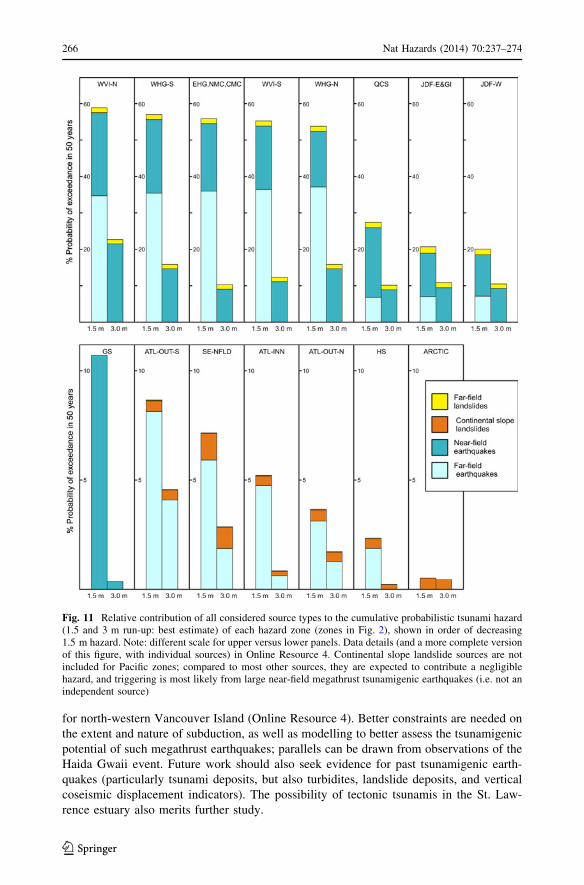
for north-western Vancouver Island (Online Resource 4). Better constraints are needed on
the extent and nature of subduction, as well as modelling to better assess the tsunamigenic
potential of such megathrust earthquakes; parallels can be drawn from observations of the
Haida Gwaii event. Future work should also seek evidence for past tsunamigenic earth-
quakes (particularly tsunami deposits, but also turbidites, landslide deposits, and vertical
coseismic displacement indicators). The possibility of tectonic tsunamis in the St. Law-
rence estuary also merits further study.
Fig. 11 Relative contribution of all considered source types to the cumulative probabilistic tsunami hazard(1.5 and 3 m run-up: best estimate) of each hazard zone (zones in Fig. 2), shown in order of decreasing1.5 m hazard. Note: different scale for upper versus lower panels. Data details (and a more complete versionof this figure, with individual sources) in Online Resource 4. Continental slope landslide sources are notincluded for Pacific zones; compared to most other sources, they are expected to contribute a negligiblehazard, and triggering is most likely from large near-field megathrust tsunamigenic earthquakes (i.e. not anindependent source)
266 Nat Hazards (2014) 70:237–274
123
Far-field subduction zones are potentially significant sources of tsunami hazard on the
Atlantic coast (Fig. 11). Events similar to the 1755 Lisbon tsunami have a relatively well-
constrained frequency. Nova Scotia may be sheltered from this source (Fig. 5), but a
greater hazard may be posed by the north-eastern Caribbean, where further research and
modelling is required to constrain potential megathrust events and their tsunami impact.
For the Arctic coasts of Yukon and Northwest Territories, the hypothetical Mackenzie
thrust may present the highest tsunami hazard, but at present, we consider the uncertainties
too great to include this source in the national hazard map. Future studies need to constrain
the parameters and tsunamigenic potential of this fault and to search for tsunami deposits.
Our analysis of Atlantic and Arctic continental slope failures similar to the 1929 Grand
Banks event involves a number of simplistic assumptions that should be tested with
modelling and additional data. These include: (1) the recurrence relation of failures in
Orphan Basin is applicable to other parts of the margin; (2) the threshold volume of
damaging tsunamigenic failures is 40 km3, and this value applies for the whole Atlantic
(and Arctic) margin; (3) most sites are at risk from only one source area directly offshore.
The continental margin is far from uniform; future studies should model a wide range of
landslide parameters and source areas to ascertain coastal sites that may be susceptible to
damaging waves from relatively small failures.
The inner Pacific coast, especially Georgia Strait, is sheltered from most tsunami
sources. For this and many Atlantic and Arctic areas, landslide tsunamis are likely the
greatest hazard, but are difficult to quantify (Fig. 10). Probabilistic analyses will require (1)
identification of potential sources; (2) evidence for past tsunamigenic events to establish
recurrence relations and/or slope stability analyses that incorporate seismic hazard; (3)
tsunami modelling of a wide range of failures. In the Arctic, locally damaging waves are
also likely from glacial sources, a hazard that may increase with climate warming. Tsunami
modelling should take sea ice into account; it may increase the hazard locally but decrease
it further afield; seasonal hazard variations are likely.
Acknowledgments We acknowledge helpful discussions and input from John Adams, Jan Bednarski,Calvin Campbell, Josef Cherniawsky, Scott Dallimore, Isaac Fine, Phil Hill, Sabine Hippchen, Roy Hy-ndman, Carmel Lowe, Brian MacLean, David Mazzucchi, David Mosher, David Piper, Alexander Rabi-novich, Alan Ruffman, Franck Saint-Ange, Fred Stephenson, and Kelin Wang. The manuscript wasimproved by useful comments from three anonymous reviewers. Several figures were prepared with the aidof GMT software (Wessel and Smith 1995). This is Earth Sciences Sector contribution 20130130.
References
Abe K (1995) Estimate of tsunami run-up heights from earthquake magnitudes. In: Tsuchiya Y, Shuto N(eds) Tsunami: progress in prediction, disaster prevention and warning. Advances in technologicalhazards research, vol 4. Kluwer, The Netherlands, pp 21–35
Aksu AE, Piper DJW (1987) Late Quaternary sedimentation in Baffin Bay. Can J Earth Sci24(9):1833–1846
Amundson JM, Truffer M, Luthi MP, Fahnestock M, West M, Motyka RJ (2008) Glacier, fjord, and seismicresponse to recent large calving events, Jakobshavn Isbræ, Greenland. Geophys Res Lett35(22):L22501. doi:10.1029/2008GL035281
Atlantic and Gulf of Mexico Tsunami Hazard Assessment Group (AGMTHAG) (2008) Evaluation oftsunami sources with the potential to impact the US Atlantic and Gulf coasts—a report to the NuclearRegulatory Commission. US Geological Survey Administrative Report, 300 pp
Atwater BF, Griggs GB (2012) Deep-sea turbidites as guides to Holocene earthquake history at the Cascadiasubduction zone—alternative views for a seismic-hazard workshop. US Geological Survey Open-FileReport 2012-1043, 58 pp
Nat Hazards (2014) 70:237–274 267
123
Atwater BF, Tuttle MP, Schweig ES, Rubin CM, Yamaguchi DK, Hemphill-Haley E (2004) Earthquakerecurrence inferred from paleoseismology. In: Gillespie AR, Porter SC, Atwater BF (eds) The qua-ternary period in the United States. Elsevier Science, New York, pp 331–350
Atwater BF, Musumi-Rokkaku S, Satake K, Tsuji Y, Ueda K, Yamaguchi DK (2005) The orphan tsunami of1700—Japanese clues to a parent earthquake in North America. US Geological Survey ProfessionalPaper 1707, 144 pp
Atwater BF, ten Brink US, Buckley M, Halley RS, Jaffe BE, Lopez-Venegas AM, Reinhardt EG, Tuttle MP,Watt W, Wei Y (2010) Geomorphic and stratigraphic evidence for an unusual tsunami or storm a fewcenturies ago at Anegada, British Virgin Islands. Nat Hazards. doi:10.1007/s11069-010-9622-6
Baptista MA, Miranda JM (2009) Revision of the Portuguese catalog of tsunamis. Nat Hazards Earth SystSci 9(1):25–42
Baptista MA, Miranda JM, Chierici F, Zitellini N (2003) New study of the 1755 earthquake source based onmulti-channel seismic survey data and tsunami modeling. Nat Hazards Earth Syst Sci 3(5):333–340
Barkan R, ten Brink U, Lin J (2009) Far field tsunami simulations of the 1755 Lisbon earthquake: impli-cations for tsunami hazard to the US east coast and the Caribbean. Mar Geol 264(1–2):109–122
Benetti S (2006) Late Quaternary sedimentary processes along the western North Atlantic margin. Ph.D.thesis, University of Southampton, U.K. 188 p
Bent AL (2002) The 1933 Ms = 7.3 Baffin Bay earthquake: strike-slip faulting along the northeasternCanadian passive margin. Geophys J Int 150:724–736
Bobrowsky PT, Dominguez MJ (2012) Landslide susceptibility map of Canada. Geological Survey ofCanada, Open File 7228, scale 1:6 million. doi:10.4095/291902
Bondevik S, Løvholt F, Harbitz C, Mangerud J, Dawson A, Svendsen JI (2005) The Storegga Slidetsunami—comparing field observations with numerical simulations. Mar Pet Geol 22(1–2):195–208
Bornhold BD, Harper JR, McLaren D, Thomson RE (2007) Destruction of the First Nations village ofKwalate by a rock avalanche-generated tsunami. Atmos Ocean 45(2):123–128
Braunmiller J, Nabelek J (2002) Seismotectonics of the explorer region. J Geophys Res 107(B10):2208.doi:10.1029/2001JB000220
Bryn P, Berg K, Forsberg CF, Solheim A, Kvalstad TJ (2005) Explaining the storegga slide. Mar Pet Geol22:11–19
Buckley ML, Wei Y, Jaffe BE, Watt SG (2011) Inverse modeling of velocities and inferred cause ofoverwash that emplaced inland fields of boulders at Anegada, British Virgin Islands. Nat Hazards.doi:10.1007/s11069-011-9725-8
Bustin AMM (2006) The crustal structure, deformation from GPS, and seismicity related to oblique con-vergence along the Queen Charlotte margin, British Columbia. Ph.D. thesis, University of Victoria,Canada. 226 pp
Bustin AMM, Hyndman RD, Kao H, Cassidy JF (2007) Evidence for underthrusting beneath the QueenCharlotte margin, from teleseismic receiver function analysis. Geophys J Int 171:1198–1211
Calais E, Mazabraud Y, Mercier de Lepinay B, Mann P, Mattioli G, Jansma P (2002) Strain partitioning andfault slip rates in the northeastern Caribbean from GPS measurements. Geophys Res Lett 106:1–9
Cassidy JF, Ellis RM, Karavas C, Rogers GC (1998) The northern limit of the subducted Juan de Fuca platesystem. J Geophys Res 103(B11):26949–26961
Cauchon-Voyer G, Locat J, Leroueil S, St-Onge G, Demers D (2011) Large-scale subaerial and submarineHolocene and recent mass movements in the Betsiamites area, Quebec, Canada. Eng Geol 121:28–45
Chaytor JD, ten Brink US, Solow AR, Andrews BD (2009) Size distribution of submarine landslides alongthe US Atlantic margin. Mar Geol 264(1–2):16–27
Cherniawsky JY, Titov VV, Wang K, Li J-Y (2007) Numerical simulations of tsunami waves and currentsfor southern Vancouver Island from a Cascadia megathrust earthquake. Pure Appl Geophys164(2–3):465–492
Clague JJ, Bobrowsky PT, Hutchinson I (2000) A review of geological records of large tsunamis atVancouver Island, British Columbia, and implications for hazard. Quat Sci Rev 19(9):849–863
Davis EE, Hyndman RD (1989) Accretion and recent deformation of sediments along the northern Cascadiasubduction zone. Geol Soc Am Bull 101(11):1465–1480
Day S, Kilburn C, McGuire B (2008) Tectonic threats in the Caribbean. Issues in Risk Science 8, BenfieldUCL Hazard Research Centre, London, 32 p
DeDontney N, Rice JR (2011) Tsunami wave analysis and possibility of splay fault rupture during the 2004Indian Ocean earthquake. Pure Appl Geophys. doi:10.1007/s00024-011-0438-4
DeMets C, Gordon RG, Argus DF (2010) Geologically current plate motions. Geophys J Int 181:1–80Dengler LA, Magoon OT (2006) Reassessing Crescent City, California’s tsunami risk. Proceedings of the
8th US national conference on earthquake engineering, San Francisco, California, Paper 1451, 10 pp
268 Nat Hazards (2014) 70:237–274
123
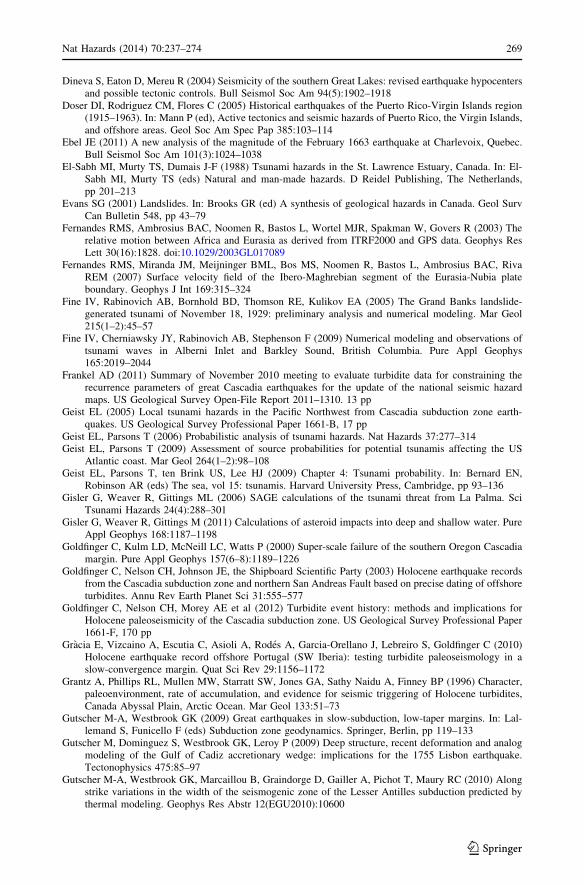
Dineva S, Eaton D, Mereu R (2004) Seismicity of the southern Great Lakes: revised earthquake hypocentersand possible tectonic controls. Bull Seismol Soc Am 94(5):1902–1918
Doser DI, Rodriguez CM, Flores C (2005) Historical earthquakes of the Puerto Rico-Virgin Islands region(1915–1963). In: Mann P (ed), Active tectonics and seismic hazards of Puerto Rico, the Virgin Islands,and offshore areas. Geol Soc Am Spec Pap 385:103–114
Ebel JE (2011) A new analysis of the magnitude of the February 1663 earthquake at Charlevoix, Quebec.Bull Seismol Soc Am 101(3):1024–1038
El-Sabh MI, Murty TS, Dumais J-F (1988) Tsunami hazards in the St. Lawrence Estuary, Canada. In: El-Sabh MI, Murty TS (eds) Natural and man-made hazards. D Reidel Publishing, The Netherlands,pp 201–213
Evans SG (2001) Landslides. In: Brooks GR (ed) A synthesis of geological hazards in Canada. Geol SurvCan Bulletin 548, pp 43–79
Fernandes RMS, Ambrosius BAC, Noomen R, Bastos L, Wortel MJR, Spakman W, Govers R (2003) Therelative motion between Africa and Eurasia as derived from ITRF2000 and GPS data. Geophys ResLett 30(16):1828. doi:10.1029/2003GL017089
Fernandes RMS, Miranda JM, Meijninger BML, Bos MS, Noomen R, Bastos L, Ambrosius BAC, RivaREM (2007) Surface velocity field of the Ibero-Maghrebian segment of the Eurasia-Nubia plateboundary. Geophys J Int 169:315–324
Fine IV, Rabinovich AB, Bornhold BD, Thomson RE, Kulikov EA (2005) The Grand Banks landslide-generated tsunami of November 18, 1929: preliminary analysis and numerical modeling. Mar Geol215(1–2):45–57
Fine IV, Cherniawsky JY, Rabinovich AB, Stephenson F (2009) Numerical modeling and observations oftsunami waves in Alberni Inlet and Barkley Sound, British Columbia. Pure Appl Geophys165:2019–2044
Frankel AD (2011) Summary of November 2010 meeting to evaluate turbidite data for constraining therecurrence parameters of great Cascadia earthquakes for the update of the national seismic hazardmaps. US Geological Survey Open-File Report 2011–1310. 13 pp
Geist EL (2005) Local tsunami hazards in the Pacific Northwest from Cascadia subduction zone earth-quakes. US Geological Survey Professional Paper 1661-B, 17 pp
Geist EL, Parsons T (2006) Probabilistic analysis of tsunami hazards. Nat Hazards 37:277–314Geist EL, Parsons T (2009) Assessment of source probabilities for potential tsunamis affecting the US
Atlantic coast. Mar Geol 264(1–2):98–108Geist EL, Parsons T, ten Brink US, Lee HJ (2009) Chapter 4: Tsunami probability. In: Bernard EN,
Robinson AR (eds) The sea, vol 15: tsunamis. Harvard University Press, Cambridge, pp 93–136Gisler G, Weaver R, Gittings ML (2006) SAGE calculations of the tsunami threat from La Palma. Sci
Tsunami Hazards 24(4):288–301Gisler G, Weaver R, Gittings M (2011) Calculations of asteroid impacts into deep and shallow water. Pure
Appl Geophys 168:1187–1198Goldfinger C, Kulm LD, McNeill LC, Watts P (2000) Super-scale failure of the southern Oregon Cascadia
margin. Pure Appl Geophys 157(6–8):1189–1226Goldfinger C, Nelson CH, Johnson JE, the Shipboard Scientific Party (2003) Holocene earthquake records
from the Cascadia subduction zone and northern San Andreas Fault based on precise dating of offshoreturbidites. Annu Rev Earth Planet Sci 31:555–577
Goldfinger C, Nelson CH, Morey AE et al (2012) Turbidite event history: methods and implications forHolocene paleoseismicity of the Cascadia subduction zone. US Geological Survey Professional Paper1661-F, 170 pp
Gracia E, Vizcaino A, Escutia C, Asioli A, Rodes A, Garcia-Orellano J, Lebreiro S, Goldfinger C (2010)Holocene earthquake record offshore Portugal (SW Iberia): testing turbidite paleoseismology in aslow-convergence margin. Quat Sci Rev 29:1156–1172
Grantz A, Phillips RL, Mullen MW, Starratt SW, Jones GA, Sathy Naidu A, Finney BP (1996) Character,paleoenvironment, rate of accumulation, and evidence for seismic triggering of Holocene turbidites,Canada Abyssal Plain, Arctic Ocean. Mar Geol 133:51–73
Gutscher M-A, Westbrook GK (2009) Great earthquakes in slow-subduction, low-taper margins. In: Lal-lemand S, Funicello F (eds) Subduction zone geodynamics. Springer, Berlin, pp 119–133
Gutscher M, Dominguez S, Westbrook GK, Leroy P (2009) Deep structure, recent deformation and analogmodeling of the Gulf of Cadiz accretionary wedge: implications for the 1755 Lisbon earthquake.Tectonophysics 475:85–97
Gutscher M-A, Westbrook GK, Marcaillou B, Graindorge D, Gailler A, Pichot T, Maury RC (2010) Alongstrike variations in the width of the seismogenic zone of the Lesser Antilles subduction predicted bythermal modeling. Geophys Res Abstr 12(EGU2010):10600
Nat Hazards (2014) 70:237–274 269
123
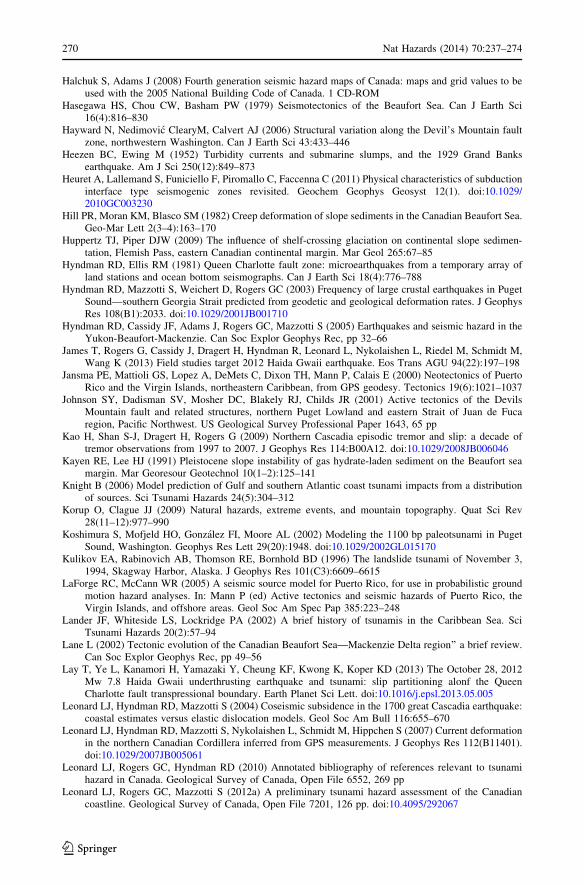
Halchuk S, Adams J (2008) Fourth generation seismic hazard maps of Canada: maps and grid values to beused with the 2005 National Building Code of Canada. 1 CD-ROM
Hasegawa HS, Chou CW, Basham PW (1979) Seismotectonics of the Beaufort Sea. Can J Earth Sci16(4):816–830
Hayward N, Nedimovic ClearyM, Calvert AJ (2006) Structural variation along the Devil’s Mountain faultzone, northwestern Washington. Can J Earth Sci 43:433–446
Heezen BC, Ewing M (1952) Turbidity currents and submarine slumps, and the 1929 Grand Banksearthquake. Am J Sci 250(12):849–873
Heuret A, Lallemand S, Funiciello F, Piromallo C, Faccenna C (2011) Physical characteristics of subductioninterface type seismogenic zones revisited. Geochem Geophys Geosyst 12(1). doi:10.1029/2010GC003230
Hill PR, Moran KM, Blasco SM (1982) Creep deformation of slope sediments in the Canadian Beaufort Sea.Geo-Mar Lett 2(3–4):163–170
Huppertz TJ, Piper DJW (2009) The influence of shelf-crossing glaciation on continental slope sedimen-tation, Flemish Pass, eastern Canadian continental margin. Mar Geol 265:67–85
Hyndman RD, Ellis RM (1981) Queen Charlotte fault zone: microearthquakes from a temporary array ofland stations and ocean bottom seismographs. Can J Earth Sci 18(4):776–788
Hyndman RD, Mazzotti S, Weichert D, Rogers GC (2003) Frequency of large crustal earthquakes in PugetSound—southern Georgia Strait predicted from geodetic and geological deformation rates. J GeophysRes 108(B1):2033. doi:10.1029/2001JB001710
Hyndman RD, Cassidy JF, Adams J, Rogers GC, Mazzotti S (2005) Earthquakes and seismic hazard in theYukon-Beaufort-Mackenzie. Can Soc Explor Geophys Rec, pp 32–66
James T, Rogers G, Cassidy J, Dragert H, Hyndman R, Leonard L, Nykolaishen L, Riedel M, Schmidt M,Wang K (2013) Field studies target 2012 Haida Gwaii earthquake. Eos Trans AGU 94(22):197–198
Jansma PE, Mattioli GS, Lopez A, DeMets C, Dixon TH, Mann P, Calais E (2000) Neotectonics of PuertoRico and the Virgin Islands, northeastern Caribbean, from GPS geodesy. Tectonics 19(6):1021–1037
Johnson SY, Dadisman SV, Mosher DC, Blakely RJ, Childs JR (2001) Active tectonics of the DevilsMountain fault and related structures, northern Puget Lowland and eastern Strait of Juan de Fucaregion, Pacific Northwest. US Geological Survey Professional Paper 1643, 65 pp
Kao H, Shan S-J, Dragert H, Rogers G (2009) Northern Cascadia episodic tremor and slip: a decade oftremor observations from 1997 to 2007. J Geophys Res 114:B00A12. doi:10.1029/2008JB006046
Kayen RE, Lee HJ (1991) Pleistocene slope instability of gas hydrate-laden sediment on the Beaufort seamargin. Mar Georesour Geotechnol 10(1–2):125–141
Knight B (2006) Model prediction of Gulf and southern Atlantic coast tsunami impacts from a distributionof sources. Sci Tsunami Hazards 24(5):304–312
Korup O, Clague JJ (2009) Natural hazards, extreme events, and mountain topography. Quat Sci Rev28(11–12):977–990
Koshimura S, Mofjeld HO, Gonzalez FI, Moore AL (2002) Modeling the 1100 bp paleotsunami in PugetSound, Washington. Geophys Res Lett 29(20):1948. doi:10.1029/2002GL015170
Kulikov EA, Rabinovich AB, Thomson RE, Bornhold BD (1996) The landslide tsunami of November 3,1994, Skagway Harbor, Alaska. J Geophys Res 101(C3):6609–6615
LaForge RC, McCann WR (2005) A seismic source model for Puerto Rico, for use in probabilistic groundmotion hazard analyses. In: Mann P (ed) Active tectonics and seismic hazards of Puerto Rico, theVirgin Islands, and offshore areas. Geol Soc Am Spec Pap 385:223–248
Lander JF, Whiteside LS, Lockridge PA (2002) A brief history of tsunamis in the Caribbean Sea. SciTsunami Hazards 20(2):57–94
Lane L (2002) Tectonic evolution of the Canadian Beaufort Sea—Mackenzie Delta region’’ a brief review.Can Soc Explor Geophys Rec, pp 49–56
Lay T, Ye L, Kanamori H, Yamazaki Y, Cheung KF, Kwong K, Koper KD (2013) The October 28, 2012Mw 7.8 Haida Gwaii underthrusting earthquake and tsunami: slip partitioning alonf the QueenCharlotte fault transpressional boundary. Earth Planet Sci Lett. doi:10.1016/j.epsl.2013.05.005
Leonard LJ, Hyndman RD, Mazzotti S (2004) Coseismic subsidence in the 1700 great Cascadia earthquake:coastal estimates versus elastic dislocation models. Geol Soc Am Bull 116:655–670
Leonard LJ, Hyndman RD, Mazzotti S, Nykolaishen L, Schmidt M, Hippchen S (2007) Current deformationin the northern Canadian Cordillera inferred from GPS measurements. J Geophys Res 112(B11401).doi:10.1029/2007JB005061
Leonard LJ, Rogers GC, Hyndman RD (2010) Annotated bibliography of references relevant to tsunamihazard in Canada. Geological Survey of Canada, Open File 6552, 269 pp
Leonard LJ, Rogers GC, Mazzotti S (2012a) A preliminary tsunami hazard assessment of the Canadiancoastline. Geological Survey of Canada, Open File 7201, 126 pp. doi:10.4095/292067
270 Nat Hazards (2014) 70:237–274
123
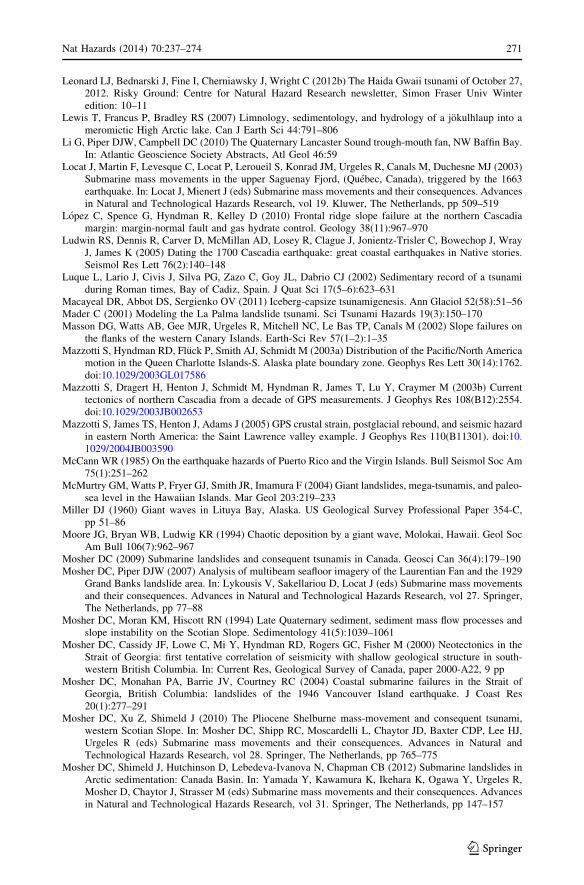
Leonard LJ, Bednarski J, Fine I, Cherniawsky J, Wright C (2012b) The Haida Gwaii tsunami of October 27,2012. Risky Ground: Centre for Natural Hazard Research newsletter, Simon Fraser Univ Winteredition: 10–11
Lewis T, Francus P, Bradley RS (2007) Limnology, sedimentology, and hydrology of a jokulhlaup into ameromictic High Arctic lake. Can J Earth Sci 44:791–806
Li G, Piper DJW, Campbell DC (2010) The Quaternary Lancaster Sound trough-mouth fan, NW Baffin Bay.In: Atlantic Geoscience Society Abstracts, Atl Geol 46:59
Locat J, Martin F, Levesque C, Locat P, Leroueil S, Konrad JM, Urgeles R, Canals M, Duchesne MJ (2003)Submarine mass movements in the upper Saguenay Fjord, (Quebec, Canada), triggered by the 1663earthquake. In: Locat J, Mienert J (eds) Submarine mass movements and their consequences. Advancesin Natural and Technological Hazards Research, vol 19. Kluwer, The Netherlands, pp 509–519
Lopez C, Spence G, Hyndman R, Kelley D (2010) Frontal ridge slope failure at the northern Cascadiamargin: margin-normal fault and gas hydrate control. Geology 38(11):967–970
Ludwin RS, Dennis R, Carver D, McMillan AD, Losey R, Clague J, Jonientz-Trisler C, Bowechop J, WrayJ, James K (2005) Dating the 1700 Cascadia earthquake: great coastal earthquakes in Native stories.Seismol Res Lett 76(2):140–148
Luque L, Lario J, Civis J, Silva PG, Zazo C, Goy JL, Dabrio CJ (2002) Sedimentary record of a tsunamiduring Roman times, Bay of Cadiz, Spain. J Quat Sci 17(5–6):623–631
Macayeal DR, Abbot DS, Sergienko OV (2011) Iceberg-capsize tsunamigenesis. Ann Glaciol 52(58):51–56Mader C (2001) Modeling the La Palma landslide tsunami. Sci Tsunami Hazards 19(3):150–170Masson DG, Watts AB, Gee MJR, Urgeles R, Mitchell NC, Le Bas TP, Canals M (2002) Slope failures on
the flanks of the western Canary Islands. Earth-Sci Rev 57(1–2):1–35Mazzotti S, Hyndman RD, Fluck P, Smith AJ, Schmidt M (2003a) Distribution of the Pacific/North America
motion in the Queen Charlotte Islands-S. Alaska plate boundary zone. Geophys Res Lett 30(14):1762.doi:10.1029/2003GL017586
Mazzotti S, Dragert H, Henton J, Schmidt M, Hyndman R, James T, Lu Y, Craymer M (2003b) Currenttectonics of northern Cascadia from a decade of GPS measurements. J Geophys Res 108(B12):2554.doi:10.1029/2003JB002653
Mazzotti S, James TS, Henton J, Adams J (2005) GPS crustal strain, postglacial rebound, and seismic hazardin eastern North America: the Saint Lawrence valley example. J Geophys Res 110(B11301). doi:10.1029/2004JB003590
McCann WR (1985) On the earthquake hazards of Puerto Rico and the Virgin Islands. Bull Seismol Soc Am75(1):251–262
McMurtry GM, Watts P, Fryer GJ, Smith JR, Imamura F (2004) Giant landslides, mega-tsunamis, and paleo-sea level in the Hawaiian Islands. Mar Geol 203:219–233
Miller DJ (1960) Giant waves in Lituya Bay, Alaska. US Geological Survey Professional Paper 354-C,pp 51–86
Moore JG, Bryan WB, Ludwig KR (1994) Chaotic deposition by a giant wave, Molokai, Hawaii. Geol SocAm Bull 106(7):962–967
Mosher DC (2009) Submarine landslides and consequent tsunamis in Canada. Geosci Can 36(4):179–190Mosher DC, Piper DJW (2007) Analysis of multibeam seafloor imagery of the Laurentian Fan and the 1929
Grand Banks landslide area. In: Lykousis V, Sakellariou D, Locat J (eds) Submarine mass movementsand their consequences. Advances in Natural and Technological Hazards Research, vol 27. Springer,The Netherlands, pp 77–88
Mosher DC, Moran KM, Hiscott RN (1994) Late Quaternary sediment, sediment mass flow processes andslope instability on the Scotian Slope. Sedimentology 41(5):1039–1061
Mosher DC, Cassidy JF, Lowe C, Mi Y, Hyndman RD, Rogers GC, Fisher M (2000) Neotectonics in theStrait of Georgia: first tentative correlation of seismicity with shallow geological structure in south-western British Columbia. In: Current Res, Geological Survey of Canada, paper 2000-A22, 9 pp
Mosher DC, Monahan PA, Barrie JV, Courtney RC (2004) Coastal submarine failures in the Strait ofGeorgia, British Columbia: landslides of the 1946 Vancouver Island earthquake. J Coast Res20(1):277–291
Mosher DC, Xu Z, Shimeld J (2010) The Pliocene Shelburne mass-movement and consequent tsunami,western Scotian Slope. In: Mosher DC, Shipp RC, Moscardelli L, Chaytor JD, Baxter CDP, Lee HJ,Urgeles R (eds) Submarine mass movements and their consequences. Advances in Natural andTechnological Hazards Research, vol 28. Springer, The Netherlands, pp 765–775
Mosher DC, Shimeld J, Hutchinson D, Lebedeva-Ivanova N, Chapman CB (2012) Submarine landslides inArctic sedimentation: Canada Basin. In: Yamada Y, Kawamura K, Ikehara K, Ogawa Y, Urgeles R,Mosher D, Chaytor J, Strasser M (eds) Submarine mass movements and their consequences. Advancesin Natural and Technological Hazards Research, vol 31. Springer, The Netherlands, pp 147–157
Nat Hazards (2014) 70:237–274 271
123
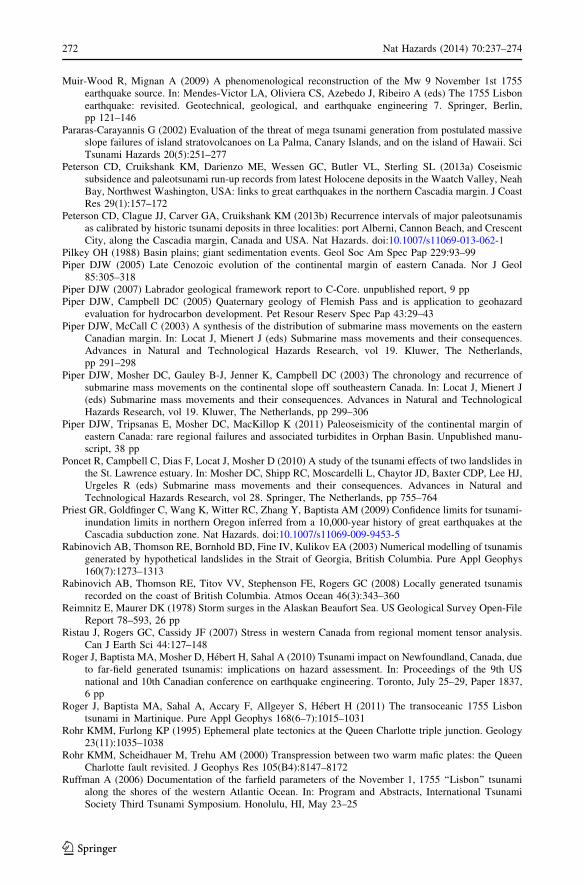
Muir-Wood R, Mignan A (2009) A phenomenological reconstruction of the Mw 9 November 1st 1755earthquake source. In: Mendes-Victor LA, Oliviera CS, Azebedo J, Ribeiro A (eds) The 1755 Lisbonearthquake: revisited. Geotechnical, geological, and earthquake engineering 7. Springer, Berlin,pp 121–146
Pararas-Carayannis G (2002) Evaluation of the threat of mega tsunami generation from postulated massiveslope failures of island stratovolcanoes on La Palma, Canary Islands, and on the island of Hawaii. SciTsunami Hazards 20(5):251–277
Peterson CD, Cruikshank KM, Darienzo ME, Wessen GC, Butler VL, Sterling SL (2013a) Coseismicsubsidence and paleotsunami run-up records from latest Holocene deposits in the Waatch Valley, NeahBay, Northwest Washington, USA: links to great earthquakes in the northern Cascadia margin. J CoastRes 29(1):157–172
Peterson CD, Clague JJ, Carver GA, Cruikshank KM (2013b) Recurrence intervals of major paleotsunamisas calibrated by historic tsunami deposits in three localities: port Alberni, Cannon Beach, and CrescentCity, along the Cascadia margin, Canada and USA. Nat Hazards. doi:10.1007/s11069-013-062-1
Pilkey OH (1988) Basin plains; giant sedimentation events. Geol Soc Am Spec Pap 229:93–99Piper DJW (2005) Late Cenozoic evolution of the continental margin of eastern Canada. Nor J Geol
85:305–318Piper DJW (2007) Labrador geological framework report to C-Core. unpublished report, 9 ppPiper DJW, Campbell DC (2005) Quaternary geology of Flemish Pass and is application to geohazard
evaluation for hydrocarbon development. Pet Resour Reserv Spec Pap 43:29–43Piper DJW, McCall C (2003) A synthesis of the distribution of submarine mass movements on the eastern
Canadian margin. In: Locat J, Mienert J (eds) Submarine mass movements and their consequences.Advances in Natural and Technological Hazards Research, vol 19. Kluwer, The Netherlands,pp 291–298
Piper DJW, Mosher DC, Gauley B-J, Jenner K, Campbell DC (2003) The chronology and recurrence ofsubmarine mass movements on the continental slope off southeastern Canada. In: Locat J, Mienert J(eds) Submarine mass movements and their consequences. Advances in Natural and TechnologicalHazards Research, vol 19. Kluwer, The Netherlands, pp 299–306
Piper DJW, Tripsanas E, Mosher DC, MacKillop K (2011) Paleoseismicity of the continental margin ofeastern Canada: rare regional failures and associated turbidites in Orphan Basin. Unpublished manu-script, 38 pp
Poncet R, Campbell C, Dias F, Locat J, Mosher D (2010) A study of the tsunami effects of two landslides inthe St. Lawrence estuary. In: Mosher DC, Shipp RC, Moscardelli L, Chaytor JD, Baxter CDP, Lee HJ,Urgeles R (eds) Submarine mass movements and their consequences. Advances in Natural andTechnological Hazards Research, vol 28. Springer, The Netherlands, pp 755–764
Priest GR, Goldfinger C, Wang K, Witter RC, Zhang Y, Baptista AM (2009) Confidence limits for tsunami-inundation limits in northern Oregon inferred from a 10,000-year history of great earthquakes at theCascadia subduction zone. Nat Hazards. doi:10.1007/s11069-009-9453-5
Rabinovich AB, Thomson RE, Bornhold BD, Fine IV, Kulikov EA (2003) Numerical modelling of tsunamisgenerated by hypothetical landslides in the Strait of Georgia, British Columbia. Pure Appl Geophys160(7):1273–1313
Rabinovich AB, Thomson RE, Titov VV, Stephenson FE, Rogers GC (2008) Locally generated tsunamisrecorded on the coast of British Columbia. Atmos Ocean 46(3):343–360
Reimnitz E, Maurer DK (1978) Storm surges in the Alaskan Beaufort Sea. US Geological Survey Open-FileReport 78–593, 26 pp
Ristau J, Rogers GC, Cassidy JF (2007) Stress in western Canada from regional moment tensor analysis.Can J Earth Sci 44:127–148
Roger J, Baptista MA, Mosher D, Hebert H, Sahal A (2010) Tsunami impact on Newfoundland, Canada, dueto far-field generated tsunamis: implications on hazard assessment. In: Proceedings of the 9th USnational and 10th Canadian conference on earthquake engineering. Toronto, July 25–29, Paper 1837,6 pp
Roger J, Baptista MA, Sahal A, Accary F, Allgeyer S, Hebert H (2011) The transoceanic 1755 Lisbontsunami in Martinique. Pure Appl Geophys 168(6–7):1015–1031
Rohr KMM, Furlong KP (1995) Ephemeral plate tectonics at the Queen Charlotte triple junction. Geology23(11):1035–1038
Rohr KMM, Scheidhauer M, Trehu AM (2000) Transpression between two warm mafic plates: the QueenCharlotte fault revisited. J Geophys Res 105(B4):8147–8172
Ruffman A (2006) Documentation of the farfield parameters of the November 1, 1755 ‘‘Lisbon’’ tsunamialong the shores of the western Atlantic Ocean. In: Program and Abstracts, International TsunamiSociety Third Tsunami Symposium. Honolulu, HI, May 23–25
272 Nat Hazards (2014) 70:237–274
123
Ruffman A, Murty T (2006) Tsunami hazards in the Arctic regions of North America, Greenland and theNorwegian Sea. In: Program and Abstracts, International Tsunami Society Third Tsunami Symposium.Honolulu, HI, May 23–25
Satake K, Wang K, Atwater BF (2003) Fault slip and seismic moment of the 1700 Cascadia earthquakeinferred from Japanese tsunami descriptions. J Geophys Res 108(B11):2535. doi:10.1029/2003JB002521
Scheffers A, Scheffers S, Kelletat D (2005) Paleo-tsunami relics on the southern and central Antillean Islandarc. J Coast Res 21(2):263–273
Shanmugam G (2011) Process-sedimentological challenges in distinguishing paleo-tsunami deposits. NatHazards. doi:10.1007/s11069-011-9766-z
Shennan I, Bruhn R, Plafker G (2009) Multi-segment earthquakes and tsunami potential of the Aleutianmegathrust. Quat Sci Rev 28(1–2):7–13
Sherrod BL, Mazzotti S, Haugerud R (2008) Comparison of geodetic and paleoseismic rates of deformationin the Puget Sound-Georgia Basin, Pacific Northwest. Eos Trans Am Geophys Union 89(53):AbstractT21B-1953
Skvortsov A, Bornhold B (2007) Numerical simulation of the landslide-generated tsunami in Kitimat Arm,British Columbia, Canada, 27 April 1975. J Geophys Res 112(F02028). doi:10.1029/2006JF000499
Smith AJ, Hyndman RD, Cassidy JF, Wang K (2003) Structure, seismicity, and thermal regime of the QueenCharlotte transform margin. J Geophys Res 108(B11):2539. doi:10.1029/2002JB002247
Solares JMM, Arroyo AL (2004) The great historical 1755 earthquake: effects and damage in Spain.J Seismol 8(2):275–294
Solheim A, Berg K, Forsberg CF, Bryn P (2005) The Storegga Slide complex: repetitive large scale slidingwith similar cause and development. Mar Pet Geol 22:97–107
Spaeth MG, Berkman SC (1967) The tsunami of March 28, 1964, as recorded at tide stations. Coast andGeodetic Survey Technical Bulletin 33, US Department of Commerce, 86 pp
Stephenson FE, Rabinovich AB (2009) Tsunamis on the Pacific coast of Canada recorded in 1994–2007.Pure Appl Geophys 166(1–2):177–210
Stephenson F, Rabinovich AB, Solovieva ON, Kulikov EA, Yakovenko OI (2007) Catalogue of tsunamis,British Columbia, Canada: 1700–2007. P.P. Shirshov Institute of Oceanology, Moscow
Stich D, Mancilla F, Pondrelli S, Morales J (2007) Source analysis of the February 12th 2007, Mw 6.0Horseshoe earthquake: implications for the 1755 Lisbon earthquake. Geophys Res Lett 34:L12308.doi:10.1029/2007GL030012
Suleimani E, Nicolsky DJ, Haeussler PJ, Hansen R (2011) Combined effects of tectonic and landslide-generated tsunami runup at Seward, Alaska during the Mw 9.2 1964 earthquake. Pure Appl Geophys168:1053–1074
Syvitski JPM, Burrell DC, Skei JM (1987) Chapter 5: Subaqueous slope failure. In: Fjords: processes andproducts. Springer, New York, pp 175–209
Szczucinski W (2012) The post-depositional changes of the onshore 2004 tsunami deposits on the AndamanSea coast of Thailand. Nat Hazards 60(1):115–133
Taggart BE, Lundberg J, Carew JL, Mylroie JE (1993) Holocene reef-rock boulders on Isla de Mona, PuertoRico transported by a hurricane or seismic sea wave. Geol Soc Am Abstr with Programs 25(6):A–A61
Tappin DR, McNeil LC, Henstock T, Mosher D (2007) Mass wasting processes–offshore Sumatra. In:Lykousis V, Sakellariou D, Locat J (eds) Submarine mass movements and their consequences.Advances in Natural and Technological Hazards Research, vol 27. Springer, The Netherlands,pp 327–336
ten Brink US, Lopez-Venegas AM (2012) Plate interaction in the NE Caribbean subduction zone fromcontinuous GPS observations. Geophys Res Lett 39:L10304. doi:10.1029/2012GL051485
ten Brink US, Geist EL, Lynett P, Andrews, B (2006) Submarine slides north of Puerto Rick and theirtsunami hazard. In: Mercado-Irizarry, A, Liu P (eds) Caribbean Tsunami Hazard, Proceedings of theNSF Caribbean tsunami workshop. World Scientific Publishing Co. Pte. Ltd., pp 67–90
ten Brink US, Lee HJ, Geist EL, Twichell D (2009) Assessment of tsunami hazard to the US east coast usingrelationships between submarine landslides and earthquakes. Mar Geol 264(1–2):65–73
Thiebot E, Gutscher M-A (2006) The Gibraltar Arc seismogenic zone (part 1): constraints on a shallow eastdipping fault plane source for the 1755 Lisbon earthquake provided by seismic data, gravity andthermal modeling. Tectonophysics 426:135–152
Thomson RE, Rabinovich AB, Krassovski MV (2007) Double jeopardy: concurrent arrival of the 2004Sumatra tsunami and storm-generated waves on the Atlantic coast of the United States and Canada.Geophys Res Lett 34:L15607. doi:10.1029/2007GL030685
Tocque P (1846) Wandering thoughts, or solitary hours. Thomas Richardson and Son, London
Nat Hazards (2014) 70:237–274 273
123
van Zeyl DP (2009) Evaluation of subaerial landslide hazards in Knight Inlet and Howe Sound, BritishColumbia. MSc. thesis, Simon Fraser University, Vancouver, Canada. 199 pp
Vernant P, Fadil A, Mourabit T, Ouazar D, Koulali A, Davila JM, Garate J, McClusky S, Reilinger R (2010)Geodetic constraints on active tectonics of the Western Mediterranean: implications for the kinematicsand dynamics of the Nubia-Eurasia plate boundary zone. J Geodyn 49:123–129
Ward SN (2001) Landslide tsunami. J Geophys Res 106(6):11201–11215Ward SN, Day S (2001) Cumbre Vieja Volcano—potential collapse and tsunami at La Palma,Canary
Islands. Geophys Res Lett 28(17):3397–3400Ward SN, Day S (2005) Tsunami thoughts. CSEG Recorder, December 2005. pp 38–44Watts P (2004) Probabilistic predictions of landslides tsunamis off southern California. Mar Geol
203(3–4):281–301Waythomas CF, Watts P, Shi F, Kirby JT (2009) Pacific Basin tsunami hazards associated with mass flows
in the Aleutian arc of Alaska. Quat Sci Rev 28(11–12):1006–1019WCATWC (West Coast and Alaska Tsunami Warning Center) (2009a) Amplitudes for the September 29,
2009 Samoa tsunami. http://wcatwc.arh.noaa.gov/previous.events/09-29-09-Samoa/09-29-09.htmWCATWC (West Coast and Alaska Tsunami Warning Center) (2009b) Amplitudes for the October 7, 2009
Torres Islands, Vanuatu tsunami. http://wcatwc.arh.noaa.gov/previous.events/10-07-09/10-07-09.htmWessel P, Smith WHF (1995) New version of the generic mapping tools released. EOS Trans Am Geophys
Union 76(33):329. doi:10.1029/95EO00198Whitmore PM (1993) Expected tsunami amplitudes and currents along the North American coast for
Cascadia subduction zone earthquakes. Nat Hazards 8:59–73Whitmore P, Benz H, Bolton M et al (2008) NOAA/West Coast and Alaska tsunami warning center Pacific
Ocean response criteria. Sci Tsunami Hazards 27(1):1–21Wigen SO (1983) Historical study of tsunamis at Tofino, Canada. In: Iida K, Iwasaki T (eds) Tsunamis—
their science and engineering. Terra Scientific Publishing, Tokyo, pp 105–119Willoughby EC, Hyndman RD (2005) Earthquake rate, slip rate, and the effective seismic thickness for
oceanic transform faults of the Juan de Fuca plate system. Geophys J Int 160:855–868Witter RC, Zhang Y, Wang K, Priest GR, Goldfinger C, Stimely LL, English JT, Ferro PA (2011) Simu-
lating tsunami inundation at Bandon, Coos County, Oregon, using hypothetical Cascadia and Alaskaearthquake scenarios. Oregon Dept of Geology and Mineral Industries Special Paper 43, 57 pp
Wynn RB, Masson DG (2003) Canary Islands landslides and tsunami generation: can we use turbiditedeposits to interpret landslide processes. In: Locat J, Mienert J (eds) Submarine mass movements andtheir consequences. Advances in Natural and Technological Hazards Research, vol 19. Kluwer, TheNetherlands, pp 325–332
Xu Z (2007) The all-source Green’s function and its application to tsunami problems. Sci Tsunami Hazards26(1):59–69
274 Nat Hazards (2014) 70:237–274
123