theimf's statistical systems - imf elibrary - international
TRANSCRIPT

THEIMF'S STATISTICAL
SYSTEMS in Context of Revision of the United Nations'
A System of National Accounts
As of May 1,1991, while this book was in press, the IMF's Bureau of Statistics became the Statistics Department of the Fund. Consequently, all references to the Bureau of Statistics herein should be understood to refer to the Statistics Department.
THEIMF'S STATISTICAL
SYSTEMS in Context of Revision of the United Nations'
A System of National Accounts
Statistics Department
Edited by Vicente Galbis
International Monetary Fund Washington, D.C. • 1991
© 1991 International Monetary Fund Reprinted May 1995
Library of Congress Cataloging-in-Publication Data
The IMP's statistical systems in context of revision of the United Nations' A system of national accounts I Statistics Department; edited by Vicente Galbis
p. em. "A selection of papers presented at three expert group meetings
sponsored by the Fund in 1987-88" -Foreword. Includes bibliographical references. ISBN 1-55775-159-5 1. National income-Accounting. I. Galbis, Vicente, 1942-
ll. International Monetary Fund. Statistics Dept. lll. International Monetary Fund. HC79.15144 1991 339.3'2'015195- dc20 91-2489
Both this book's cover and its interior were designed by the IMF Graphics Section.
The following symbols have been used throughout this book:
to indicate that data are not available;
CIP
to indicate that the figure is zero or less than half the final digit shown, or that the item does not exist;
Between years or months (e.g., 1991-92 or January-June) to indicate the years or months covered, including the beginning and ending years or months;
Between years (e.g., 1991/92) to indicate a crop or fiscal (financial) year.
"Billion" means a thousand million.
Details may not add to totals shown because of rounding.
The term "country," as used in this book, does not in all cases refer to a territorial entity that is a state as understood by international law and practice; the term also covers some territorial entities that are not states but for which statistical data are maintained and provided internationally on a separate and independent basis.
Price: US$35.00 Address orders to:
External Relations Department, Publication Services International Monetary Fund, Washington D.C. 20431, U.S.A.
Telephone: (202) 623-7430 Telefax: (202) 623-7201 Cable: Interfund
internet: publications @imf.org
recycled paper
Foreword
T HE INTERNATIONAL MONETARY FUND has always attached considerable importance to the development of appropriate meth
odologies in its work in balance of payments, government finance, and monetary statistics. The Fund's contribution to the development of international statistics also takes other forms, including a system of statistical communications with member countries, technical assistance to member countries on statistical matters, cooperation in these matters with other international organizations, and compilation of its own statistical publications.
The role of the IMF within the international statistical community has allowed the Fund to participate actively in the ongoing revision of the United Nations' A System of National Accounts (SNA), last revised in 1968. The work on revision of the SNA may be seen as part of the Fund's commitment to achieve a greater degree of coordination in the statistical field with other international agencies. The Fund has also begun to revise the fourth edition of its Balance of Payments Manual, issued in 1977, and to refine further its methodology for monetary statistics, based on the draft of A Guide to Money and Banking Statistics. A Manual on Government Finance Statistics was published by the Fund in 1986. The Fund hopes that these efforts will not only lead to methodological improvements and a greater consistency in national statistics but will also promote harmonization of these statistical systems among themselves and with the SNA.
This volume contains a selection of papers presented at three expert group meetings sponsored by the Fund in 1987-88 for the revision of the SNA. These meetings dealt with issues in the balance of payments, government finance, and monetary statistics and were part of a sequence of expert group meetings organized by the interested international organizations to oversee the revision process. The papers place the Fund's statistical methodologies in the context of revision of the SNA and explain the contr;bution that the Fund has made, and can make, to the process of harmonization.
Although the papers represent the views of individual contributors
v

vi FOREWORD
and not necessarily those of their respective institutions, I trust that they will be of interest to those whose task it is to compile macroeconomic statistics and to develop new ideas to cope with the challenges of the interrelation, simplification, and evolution of these statistics.
MICHEL CAMDESSUS
Managing Director International Monetary Fund
Preface
A T ITS TWENTY-FIRST session in 1981 the Statistical Commission of the United Nations discussed proposals for improvement of the
United Nations' A System of National Accounts (SNA), last published in 1968. Following this, an Expert Group Meeting on the Review and Development of the SNA, held in New York in March 1982, recommended that a long-term review of the SNA be undertaken to produce a revised SNA. To assist in this process, the Intersecretariat Working Group on National Accounts-a group comprising representatives of the UN, the Organization for Economic Cooperation and Development (OECD), the European Community (EC), the World Bank, the IMF and the five UN Regional Economic Commissionswas established. The main goals set for the revision of the SNA were to simplify the 1968 SNA so that it will be more directly relevant to the needs of member countries; to resolve methodological issues and internal inconsistencies noted since publication of the 1968 SNA; and to harmonize the SNA as much as possible with related statistical systems, especially the Fund's systems and methodologies relating to balance of payments, government finance, and monetary statistics.
The revision process has centered on a series of meetings of expert groups composed of national experts and the members of the Intersecretariat Working Group. In 1987 and 1988 the Fund sponsored three of these expert group meetings. They dealt with external sector transactions (March 23-April2, 1987), public sector accounts Oanuary 25-29, 1988), and financial flows and balances (September 6-15, 1988).
This volume contains a selection of the papers prepared for the expert group meetings sponsored by the Fund. The structure of the volume has three parts, corresponding to the issues discussed at each of the three meetings. In all, 32 papers are presented, most of them short. A brief introduction has been provided by the editor. Some of the papers have been modified for publication, with certain material, especially annexes and appendices, deleted to simplify and shorten the presentation or to avoid unnecessary repetition. The papers have
vii
viii PREFACE
not been revi<:ed, however, to reflect discussion during the expert group meetings. Thus, the contents of this volume should in no way pre-empt or prejudice the views expressed by participants at those meetings, the conclusions and recommendations of the meetings, or the solutions that may eventually prevail in achieving harmony between the revised SNA and the Fund's statistical methodologies. Rather, I would hope that these papers are viewed as research material that is interesting for its analytical approaches to some longstanding issues, and to new methodological issues in the field of economic statistics. The papers therefore represent solely the views of the authors and not the official views of the Fund or of other organizations.
Finally, I would like to thank the contributors to this volume not only for preparing the papers but also for their cooperation with the editor in the thankless task of streamlining the presentation by deleting some material, as noted above; this made it possible to publish the papers in a single volume without reducing their substance. I would also like to thank James McEuen of the Fund's External Relations Department for painstakingly reviewing the draft papers and for making many useful editorial suggestions at various stages of production of this volume.
JoHN B. McLENAGHAN
Director Statistics Department
International Monetary Fund
Contents
Foreword Michel Camdessus • v
Preface John B. McLenaghan • vii
Introduction Vicente Galbis • xiii
- PART I-
EXTERNAL SECTOR TRANSACTIONS
1. Residents of an Economy Arie C. Bouter • 3
2. Treatment of International Organizations Gerard G. Raymond • 20
3. Change of Ownership and Time of Recording in the National Accounts
Robert McColl • 26
4. Conversion of Balance of Payments Transactions as a Source of Valuation Changes: Problems,
Principles, and Practical Solutions Pierre Luigi Parcu • 41
ix
X CONTENTS
5. Currency Conversion in a Multiple Exchange Rate System Marianne Schulze-Ghattas • 51
6. Treatment of Exchange Rate Differentials in the National Accounts
Jan van Tongeren • 63
7. Harmonization of the Classification of External Current Account Transactions
Arie C. Bouter and Jan van Tongeren • 85
8. Proposed Treatment of Reinvested Earnings on Direct Investment
Geoffrey J. Robertson • 106
9. Classification of International Transactions in Services, Income, and Unrequited Current Transfers
Arie C. Bouter • 119
10. Measurement of a Nation's Terms of Trade Effect and Real National Disposable Income
Within a National Accounting Framework Mick Silver and Khashayar Mahdavy • 123
11. Classification of Capital Account Transactions Mahinder S. Gill• 154
12. Classification of Corporate Enterprises D. Keith McAlister • 175
13. New Financial Instruments and the Balance of Payments George H. Hoezoo • 181
14. Classification of Transactions in Zero-Coupon Bonds, Junk Bonds, and Indexed Bonds
in the Balance of Payments Robert McColl• 195
15. Some Issues in the Balance of Payments Presentation of Arrears and Debt Reorganization
John E. Thornton • 201
CONTENTS
-PART II-
PUBLIC SECTOR ACCOUNTS
16. A Discussion of Public Sector Accounts Jonathan Levin, Jan van Tongeren,
Brian Newson, and Derek Blades • 217
17. An Example of Progress in Delineating Relationships Between Government Finance Statistics and National Accounts Concepts
Jonathan Levin and Jan van Tongeren • 276
18. Overall Relationships Between the IMF' s Government Finance Statistics and A System of National Accounts
Jonathan Levin • 278
19. Derivation of System of National Accounts Value from Government Finance Statistics Data
Jan van Tongeren and Irene Tsao • 286
20. Sectorization of Social Security Funds Teresa Villacres • 325
-PART III
FINANCIAL FLOWS AND BALANCES
21. Flow-of-Funds Accounts, A System of National Accounts, and Developing Countries
John C. Dawson • 375
22. The Financial Sector Edward W. Saunders • 413
23. Monetary Concepts and Definitions Emmanuel 0. Kumah • 427
24. Repurchase Agreements and Financial Analysis Marta Castello-Branco • 442
25. Recording of Financial and Operational Leases and of Income on Zero- and Low-Coupon Bonds
Balance of Payments Division, IMF Bureau of Statistics • 460
xi

xii
26. Financial Leasing Brian Newson • 467
CONTENTS
27. Treatment of Deep-Discounted and Index-Linked Bonds in the National Accounts
Brian Newson and Soren Brodersen • 483
28. Principles of Valuation and Reconciliation Items in the IMF' s Money and Banking Statistics
and A System of National Accounts Keith G. Dublin • 505
29. Treatment of Output in the Banking Industry Abul Siddique • 520
30. A Further Look at the Treatment of Insurance in A System of National Accounts
Andre Vanoli • 530
31. How to Treat Nonproduced Assets and Exceptional Events in the National Accounts? Considerations
on the Variations in Wealth Accounting Jean-Paul Milot, Pierre Teillet, and Andre Vanoli • 554
32. Fixed Capital Formation by Owner and User Heinrich Lutze[ • 590
Contributors • 595
Abbreviations • 597
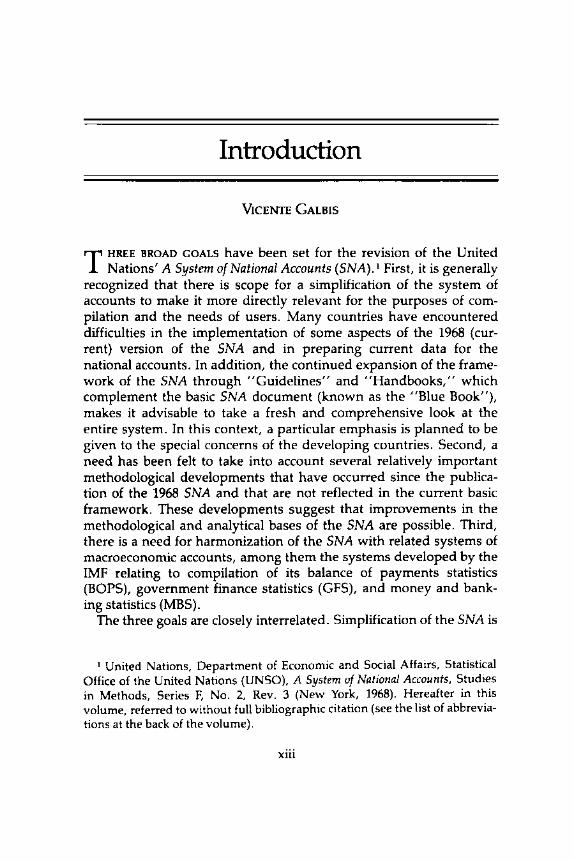
Introduction
VICENTE GALBIS
T HREE BROAD GOALS have been set for the revision of the United Nations' A System of National Accounts (SNA). 1 First, it is generally
recognized that there is scope for a simplification of the system of accounts to make it more directly relevant for the purposes of compilation and the needs of users. Many countries have encountered difficulties in the implementation of some aspects of the 1968 (current) version of the SNA and in preparing current data for the national accounts. In addition, the continued expansion of the framework of the SNA through "Guidelines" and "Handbooks," which complement the basic SNA document (known as the "Blue Book"), makes it advisable to take a fresh and comprehensive look at the entire system. In this context, a particular emphasis is planned to be given to the special concerns of the developing countries. Second, a need has been felt to take into account several relatively important methodological developments that have occurred since the publication of the 1968 SNA and that are not reflected in the current basic framework. These developments suggest that improvements in the methodological and analytical bases of the SNA are possible. Third, there is a need for harmonization of the SNA with related systems of macroeconomic accounts, among them the systems developed by the IMF relating to compilation of its balance of payments statistics (BOPS), government finance statistics (GFS), and money and banking statistics (MBS).
The three goals are closely interrelated. Simplification of the SNA is
1 United Nations, Department of Economic and Social Affairs, Statistical Office of the United Nations (UNSO), A System of National Accounts, Studies in Methods, Series F, No. 2, Rev. 3 (New York, 1968). Hereafter in this volume, referred to without full bibliographic citation (see the list of abbreviations at the back of the volume).
xiii
xiv INTRODUCTION
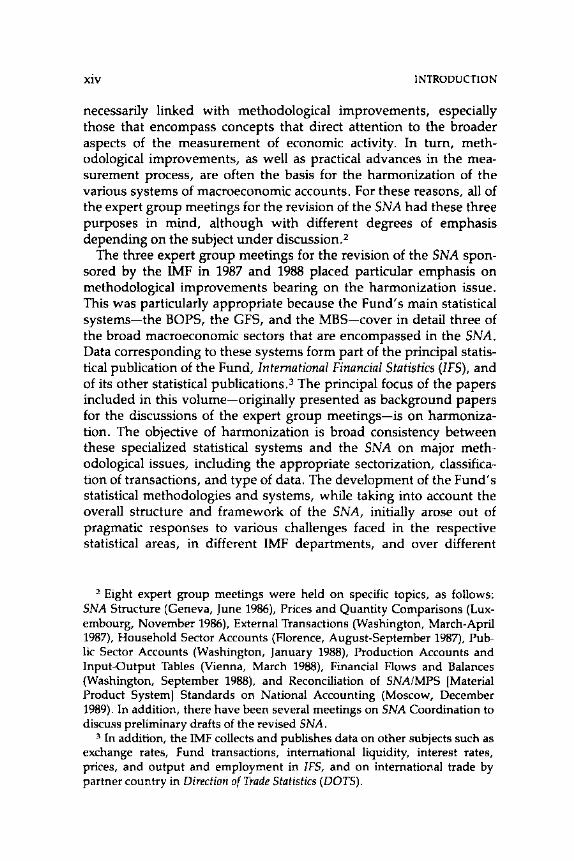
necessarily linked with methodological improvements, especially those that encompass concepts that direct attention to the broader aspects of the measurement of economic activity. In turn, methodological improvements, as well as practical advances in the measurement process, are often the basis for the harmonization of the various systems of macroeconomic accounts. For these reasons, all of the expert group meetings for the revision of the SNA had these three purposes in mind, although with different degrees of emphasis depending on the subject under discussion.2
The three expert group meetings for the revision of the SNA sponsored by the IMF in 1987 and 1988 placed particular emphasis on methodological improvements bearing on the harmonization issue. This was particularly appropriate because the Fund's main statistical systems-the BOPS, the GFS, and the MBS-cover in detail three of the broad macroeconomic sectors that are encompassed in the SNA. Data corresponding to these systems form part of the principal statistical publication of the Fund, International Financial Statistics (IFS), and of its other statistical publications.J The principal focus of the papers included in this volume-originally presented as background papers for the discussions of the expert group meetings-is on harmonization. The objective of harmonization is broad consistency between these specialized statistical systems and the SNA on major methodological issues, including the appropriate sectorization, classification of transactions, and type of data. The development of the Fund's statistical methodologies and systems, while taking into account the overall structure and framework of the SNA, initially arose out of pragmatic responses to various challenges faced in the respective statistical areas, in different IMF departments, and over different
2 Eight expert group meetings were held on specific topics, as follows: SNA Structure (Geneva, June 1986), Prices and Quantity Comparisons (Luxembourg, November 1986), External Transactions (Washington, March-April 1987), Household Sector Accounts (Aorence, August-September 1987), Public Sector Accounts (Washington, January 1988), Production Accounts and Input-Output Tables (Vienna, March 1988), Financial Aows and Balances (Washington, September 1988), and Reconciliation of SNA/MPS [Material Product System] Standards on National Accounting (Moscow, December 1989). In addition, there have been several meetings on SNA Coordination to discuss preliminary drafts of the revised SNA.
3 In addition, the IMF collects and publishes data on other subjects such as exchange rates, Fund transactions, international liquidity, interest rates, prices, and output and employment in IFS, and on international trade by partner country in Direction of Trade Statistics (DOTS).
INTRODUCTION XV
periods. 4 For this reason, as well as for complex issues of substance, there are a number of outstanding issues, of both form and method, for the process of harmonization. The papers included in this volume have served, as much as anything, to direct the efforts of the groups of experts in their deliberations on outstanding methodological issues with a view to bringing about the desired harmonization.s They have also provided a basis for a discussion of methodological adaptations and innovations for possible incorporation in the SNA as well as in the revised Fund methodologies.
The IMF's Balance of Payments Manual (BPM) incorporates a conceptual framework relating the balance of payments to the external sector accounts of the SNA (BPM, Chapter 2, Section 6, paragraphs 44-51, and Appendix C). Although in principle the relationship between the two systems of accounts is clear-cut, the BPM (Appendix C) notes that there are many practical problems that are substantial enough to discourage the task of harmonization. Fortunately, however, this pessimistic view has been superseded by recent developments; for instance, a more recent examination of this issue suggests that "these two systems are consistent and interrelated. " 6 A harmonized presentation is planned to be provided in the revised SNA, as well as in the fifth edition of the BPM; harmonization issues will also be taken into account in the Balance of Payments Compilation Guide, which is being prepared by the Fund's Bureau of Statistics (now the Statistics Department). 7 The essays in this volume should serve to illustrate many of the outstanding issues on which substantial progress in this area has been made.
The Fund's A Manual on Government Finance Statistics (GFSM) discusses in detail the relationships between the GFS and the govern-
4 The IMF's Balance of Payments Manual (BPM), first issued in 1948, was last revised in 1977 (the fourth edition). A Manual on Government Finance Statistics (GFSM) was issued in draft in 1974 and was published in 1986. An internal Fund document in draft, A Guide to Money and Banking Statistics in International Financilll Statistics (MBS Guide), was produced in 1984.
s The reports of the expert group meetings are being used to guide the authors charged with drafting the revised SNA.
6 The World Bank, International Monetary Fund, Bank for International Settlements (BIS), and Organization for Economic Cooperation and Development (OECD), External Debt: Definitions, Statistical Coverage and Methodology (Paris, 1988), p. 17.
7 It is planned that the Balance of Payments Compilation Guide will also serve as a "Handbook of National Accounting on External Sector Transactions," to be published by UNSO.
xvi INTRODUCTION
ment sector of the SNA.B To facilitate the compilation of national accounts for the government sector of the SNA from the GFS, the GFSM presents detailed "bridge tables" between the two data systems. 9 This is possible because the underlying building blocks included in both systems should in principle agree. The main differences between the two systems are that the SNA records transactions on an accrual basis, has three separate but interrelated accounts, and classifies taxes and subsidies according to whether or not they are incurred in the course of production. The GFSM, on the other hand, provides for the presentation of accounts on a cash basis, organized into a single balanced account; taxes are classified by their base. Many of these differences and suggested ways of harmonization are discussed in the essays included in the present volume.
Although the current draft of A Guide to Money and Bankmg Statistics in International Financial Statistics (MBS Guide) does not contain a separate section on the relationships between the MBS and the SNA, many references are made in the text, as appropriate, to these relationships. The essays in this volume further elucidate these relationships and suggest that both the revised SNA and the draft MBS Guide, which is also planned for revision, will develop explicit principles for their harmonization.
The basic interrelationships between the Fund's main statistical systems and the SNA are clearly perceived from the perspective of the flow-of-funds (FOF) accounts, which may be viewed as a component of the broader SNA. The FOF accounts contain a closed system of financial flows among transactors by type of financial transaction and also connect financial flows to the overall surpluses (net savings) and deficits (net borrowing) resulting from the sectoral (nonfinancial) production, income, and outlay accounts of the SNA.1o Furthermore, by a coordinated approach to the sectorization of the SNA and the FOF accounts, it can be shown that the Fund's main statistical systems correspond to three macrosectors into which the economy may be disaggregate at the first level of disaggregation of the SNA, including as a component the FOF accounts (that is, the government, financial, and rest-of-world sectors; the remaining macrosectors comprise, in essence, households and corporations). This reinforces the interest in
8 GFSM (1986, Chapter 5). 9 Similar tables are included in UNSO, Handbook of National Accounting,
Public Sector Accounts, Studies in Methods, Series F, No. 50 (New York, 1988). 10 The FOF system, like the broader SNA, is a closed (self-contained) sys
tem of accounts in the sense that it can in the aggregate be specified as a complete set of equations.
INTRODUCTION xvii
the harmonization of these systems (see Chapter 21 in this volume). The benefits of relating the Fund's main systems to the SNA should be seen in eliminating unnecessary discrepancies, as well as duplicative efforts in compiling statistics. In fact, the Fund's statistical systems should be able to provide much of the data required for the construction of the SNA and related FOF accounts; data for the SNA, BOPS, and GFS are largely in the form of flows and, therefore, comparable in principle. Although the MBS data are mainly stock data, financial flow data can be derived from stock data by adjusting changes in stock data to eliminate elements of revaluation changes and other reconciliation factors.
A main challenge, therefore-and the one addressed by the papers in this volume-is to harmonize as much as possible the sectoral information from the SNA (and FOF) with the corresponding sectors covered by the IMF's main statistical systems. Successful efforts in the harmonization process will be of great benefit to compilers and users of macroeconomic statistics.
I. External Sector Transactions
The first six papers in Part I of this volume deal with some general methodological principles in compilation of statistics on the external sector of the SNA and the balance of payments.
The crucial concept of the residents of an economy-a concept needed to distinguish external (rest-of-world) from domestic transactions-is the subject of the papers by Bouter and Raymond. Bouter (Chapter 1) presents a comprehensive review of the residency criteria given in the SNA and the BPM; he shows that, although the main concepts regarding the territory of an economy and the "center of economic interest" of a given entity remain valid, some supplementary rules of thumb are required to pin down the criteria in special cases-for example, when the entity changes territory, especially when it does so frequently, and when it remains permanently outside the territory of any national economy. He goes on to specify in some detail the entities that are to be considered residents of an economy. Broad economic groups are examined for this purpose: the general government, private nonprofit bodies serving individuals, enterprises, and international organizations. The specific issues raised by the treatment of the last of these are discussed in greater detail by Raymond (Chapter 2). After reviewing the criteria in the SNA and the BPM, Raymond advocates a more refined definition of an international organization as one whose authority derives directly from the
xviii INTRODUCTION
authority of its member countries and that has a sovereign status (that is, the laws and regulations of the country or countries in which it is located do not apply to it). However, the decision to treat an entity as an international organization for statistical purposes can only be made on a case-by-case basis. International organizations are not considered residents of any national economy; each is treated as a separate economy. The only resident entity of an economy comprising an international organization is that organization itself.
The change-of-ownership principle, which is used to determine whether a transaction has in fact taken place, and the time for recording a transaction are discussed by McColl (Chapter 3). He first points out that ownership is presumed to be identical to legal ownership except in three cases: when legal ownership cannot be granted, as in the case of illegal transactions; when the transactions are between two transactors that are part of the same legal entity; and when the resource is provided under a financing arrangement (including financial leasing) that transfers economic control and most of the risks of ownership of the asset to another party without transferring legal ownership. Other proper accounting requirements are that the two sides to a transaction must be recorded simultaneously by the two transactors and that the time of recording must have economic significance (that is, it must refer to the change of control or ownership over economic resources). McColl concludes that the only accounting framework to meet these criteria is accrual accounting, whereas cash accounting recognizes only one transaction-payment-that may not be concomitant with the transfer of economic control and o~nership. He goes on to apply accrual accounting methods to the recording of transactions between affiliate companies, financial leases, interest income (particularly in the case of deep-discounted bonds), and overdue obligations.
Issues of conversion and exchange rate differentials in balance of payments statistics and the SNA are the focus of the papers by Parcu, Schulze-Ghattas, and van Tongeren. The conversion of transactions denominated in different currencies into a common valuation currency is the specific subject discussed by Parcu (Chapter 4). This is a subject of considerable interest-and controversy-in recording external transactions in the SNA and the balance of payments because the increased variability of exchange rates since the introduction of the floating exchange rate system has made the problem of conversion more difficult. The analogy between valuation changes resulting from price changes and those stemming from exchange rate changes clarifies the nature of the analytical problem for statistical recording. The general recommendation has been to choose for conversion the
INTRODUCTION xix
exchange rate prevailing at the date of the contract. Unfortunately, the practical applicability of this principle is severely limited by lack of adequate statistical information. For this reason, in practice, transaction values are usually converted into the unit of account at an average rate for the period in which the transaction occurs. Parcu suggests that this practice inevitably distorts the statistics and makes them less reliable, the more so the wider the fluctuations in exchange rates. The difficulties for statistical recording are even more severe in countries with a multiple exchange rate system-as discussed by SchulzeGhattas (Chapter 5). In principle, two possible methods of conversion may be applied in the presence of multiple rates: conversion of each individual transaction at the exchange rate at which it was effected, or conversion of all transactions at a unitary conversion rate. The latter method has the merit that it ensures the recording of the taxes or subsidies that are implicit in a multiple exchange rate system. The main practical problem, however, is the determination of the appropriate unitary conversion rate. A reasonable proxy may be a weighted average of the different exchange rates observed in a multiple exchange rate system, the weights being the shares of the transactions effected at each particular rate.
A different set of issues on the treatment of exchange rate differentials is raised by van Tongeren (Chapter 6). Focusing not only on the external accounts but also on other sectors of the national accounts and on the effects on gross domestic product (GOP) and its components, he proposes a distinction between three components of exchange rate differentials: bank service charges, capital gains or losses, and taxes or subsidies. His conclusions are in line with those of Schulze-Ghattas in that a unitary exchange rate is proposed in circumstances of multiple exchange rate regimes that generate taxes or subsidies. However, van Tongeren suggests that no adjustments are indicated for changes in exchange rates over time, with the valuation of purchases and sales of foreign currency being recorded at their actual exchange rates. Revenues derived from those changes should be treated as capital gains or losses and included in the revaluation account.
The nine remaining papers in Part I deal with the classification of transactions in both the external sector of the SNA and the balance of payments, and taken together they cover both current and capital account transactions as well as new financial instruments. In their joint paper, Bouter and van Tongeren (Chapter 7) focus on the harmonization of current account transactions between the SNA and the balance of payments. They first identify outstanding issues for harmonization by reference to the characteristics of the standard compo-
XX INTRODUCTION
nents of the current account in the SNA and the BPM and the relationships between them. Next, they discuss the results of a survey of the practices of selected countries, issue by issue, pointing out the differences between the SNA and the BPM components and, where necessary, suggesting modifications of the components that would result in a closer harmonization of the two systems. The main outstanding issues identified are that the SNA deviates in some respects from the change-of-ownership principle, whereas the BPM is consistent in its application; that reinvested earnings of direct-investment enterprises that have foreign branches or subsidiaries are not included in the SNA, but are included in the BPM; that imports are valued on a c.i.f. (cost, insurance, freight) basis in the SNA and on an f.o.b. (free on board) basis in the BPM; that monetary and nonmonetary gold are treated differently in the two systems; that the SNA has a separate identification of labor and property income received by factors of production, but the BPM does not; and that the SNA requires various imputations for insurance transactions that are not made in the BPM. In Chapter 8, Robertson discusses the need to include reinvested earnings of direct-investment enterprises in the SNA-as is already done in the BPM-exemplifying very well one of the harmonization issues raised by Bouter and van Tongeren.
In a separate paper on the treatment of services, income, and unrequited transfers (Chapter 9), Bouter proposes a revised classification of the standard components for these current account items (42 in the BPM), taking into account the need to make improvements without substantially increasing the number of components and the desirable harmonization of the underlying transactions between the BPM and the SNA. One of his main proposals is to separate investment income into interest income and dividends, a breakdown indispensable for compiling debt service ratios.
In contrast to the other papers, Silver and Mahdavy (Chapter 10) focus on a specific statistical issue related to the current account-the measurement of the terms of trade in real terms-and its implication for the measurement of real national disposable income. They show that the measurement of real values is dependent on the price indices on which the terms of trade are based and that the results are therefore subjective. The diverse implications of different price deflators for the terms of trade effect are shown.
The paper by Gill (Chapter 11) turns to the general classification of capital account transactions and reviews the criteria for compilation of this complex part of the balance of payments. The author concludes that a substantial modification of the structure of the capital account would be required to serve the IMF' s analytical and operational
INTRODUCTION xxi
needs, to harmonize the balance of payments with the rest-of-world sector of the SNA, and to promote harmonization between the Fund's systems for balance of payments, government finance, and money and banking statistics, among other purposes. One of the amendments proposed by Gill is to distinguish between current and capital transfers in the balance of payments, as is currently done in the SNA. Another amendment would consist in merging portfolio investment, currently a separate item, into other (nonreserve and nondirect investment) capital movements and to distinguish the relevant capital flows in terms of the domestic sector of the creditor or the debtor instead of following an instrument-by-instrument approach. This revision would facilitate reconciliation with related bodies of economic statistics, provide better material for a variety of economic analyses, and facilitate the link between stock and flow data. In the new order, the current classifications of capital movements-by long term and short term and by financial instrument-would be relegated to secondary distinctions. This shift would recognize the lesser roles now played by these concepts, as secondary markets make the longshort distinction less relevant and the differences between instruments blur as a result of financial innovations. It is, however, proposed that the sectorization follow the functional approach of the GFSM and the draft MBS Guide, instead of the institutional approach espoused in the SNA.
The paper by McAlister on the classification of corporate enterprises (Chapter 12) deals with criteria for distinguishing between resident-owned and foreign-owned enterprises, particularly in relation to the definition of direct investment, a separate component of the capital account. Specifically, the paper examines the notion of foreign ownership with reference to the concept of direct investment as currently formulated in the BPM.
The papers by Hoezoo, McColl, and Thornton elaborate on the proposed reclassification of the capital account of the balance of payments suggested by Gill. Hoezoo (Chapter 13) reviews the treatment of new financial instruments in the balance of payments-including note issuance facilities, swaps, options and futures, and Eurobondsand shows that their classification can be handled within the methodological guidelines provided by the current BPM. The issues arising from the securitization of debt and off-balance-sheet transactions and debt capitalization are also discussed and suggestions made for their treatment within the parameters of the BPM. A more specific discussion of the treatment of zero-coupon bonds, junk bonds, and indexed bonds in the balance of payments is provided by McColl (Chapter 14). His main conclusion in this respect is the same as that of
xxii INTRODUCTION
Hoezoo: that all of these bonds, although very different from each other and different from standard bonds, do not exhibit any features for which the BPM does not already contain appropriate recommendations for proper classification. Finally, Thornton (Chapter 15) provides a framework for the presentation of arrears and debt reorganization in the balance of payments. Building on the general methodology of the BPM to this effect, he shows that a proper treatment requires the use of accrual rather than cash accounting to allow for the identification of arrears and debt reorganization transactions. This new treatment requires an increase in the detail given in the accounts beyond the current list of standard components in order to identify these transactions, which constitute part of the II exceptional financing'' of the balance of payments recorded ''below the line.''
II. Public Sector Accounts
Part II of the volume contains five papers that are quite different in size and content but cover most of the issues of harmonization between the government sector of the SNA and the GFSM. The first paper (Chapter 16)-the result of efforts by staff members of four international agencies-reviews most of the outstanding harmonization issues in this field; it served as a basic discussion paper and an annotated agenda for the Expert Group Meeting on Public Sector Accounts held in January 1988. The other papers address specific issues included in the group's agenda.
The discussion paper begins with an examination of the different objectives served by the government sector of the SNA and the GFSM and concludes that, although further harmonization would be useful, it is unlikely that either system can be entirely replaced by the other. The GFS is a system directly derived from government accounting records needed for operational purposes, and is largely a cash-based system. The SNA, on the other hand, requires the government sector to be treated symmetrically with other sectors of the economy and uses accrual accounting. In addition, there are many minor conceptual differences between the two systems, as well as data discrepancies arising from different compilation procedures.
The discussion paper deals next with the coverage of transactors, with special emphasis on borderline issues between the government sector and other institutional sectors and within subsectors of the government sector. Among the most difficult external borderline issues are those concerning the treatment of government departmental enterprises and ancillary enterprises as belonging to either the
INTRODUCTION xxiii
enterprise sector or the general government; the attribution of community production of capital goods to the sector responsible for their upkeep; the rerouting of central and commercial banking activities performed by government to the financial sector, a practice supported by both the GFSM and the draft MBS Guide but not indicated by the SNA; the attribution of government employees' pension funds and welfare schemes to either the financial sector or the government; the assignment of nonprofit institutions to various institutional sectors; and the appropriate classification of supranational authorities and other international organizations. The main intrasectoral issues concern the classification of central, state, local, and other government levels; and the treatment of social security funds, which are consolidated with the corresponding level of government in the GFSM but constitute a separate subsector in the SNA.
Another section of Chapter 16 deals with various issues in the registration of transactions, including the choice of accrual versus cash accounting, procedures for consolidation of the accounts, gross versus net recording of entries, and imputations and rerouting. The analytical framework of the government accounts, focusing in particular on the distinction between current and capital accounts, and the definitions of government saving and overall deficit or surplus are discussed next. The final section of the paper deals with selected classification issues, including the treatment of taxes, social security contributions, fees, property income, indexation payments, and the functions of government.
A concise historical account of the main efforts to date on the harmonization between the GFSM and the SNA, with special attention to the "bridge tables" between the two systems and the further links sought through joint country questionnaires, is provided in the joint paper by Levin and van Tongeren (Chapter 17).
The overall relationships between the GFSM and the SNA are the subject of the next paper, Chapter 18, by Levin. Apart from the rerouting of some government monetary authority and deposittaking functions to the financial sector in the GFSM, there are some other major differences between the two systems, namely (1) the classification of government lending together with expenditures "above the line" in the GFSM, while government lending is "below the line" (that is, in the finance account) in the public sector accounts of the SNA, mainly because of the need for symmetry with the treatment of other sectors; (2) the consolidation of social security funds in the GFSM with the level of government at which they operate, while the SNA groups all social security funds into a single subsector of the government; (3) the cash basis of GFS data, in contrast to the accrual
xxiv INTRODUCTION
basis of .the SNA, which covers some transactions not reflected in cash payments as well as some imputations.
The paper by van Tongeren and Tsao (Chapter 19) on the derivation of SNA value from GFS data is important for the harmonization issue because it shows how GFS data can be adjusted to obtain estimates of the public sector accounts of the SNA.
The differences of treatment of the sectorization of social security funds between the GFSM and the SNA continue to be a matter of controversy. Villacres (Chapter 20) discusses this issue in light of comprehensive statistics on the operations of such funds in different countries and concludes that both classifications are useful. A separate compilation of statistics on social security funds, as in the SNA, may serve to examine, among other things, the financial health of these institutions. At the same time, because national social security funds have reached significant proportions in many countries, their consolidation with central government data, as in the GFSM, can provide a more comprehensive view of the influence of central government policies on the economy.
III. Financial Flows and Balances
The papers in Part III of the volume cover much ground on the relationships between the Fund's MBS and the SNA. 11 Dawson sets the stage for the analysis of these relationships by means of presenting an overview (Chapter 21) of the financial accounts of the SNA and a useful analytical framework for the study of the relationship between the FOF, conceived as an element of the SNA, and other SNA elements. As noted earlier, Dawson shows, by an appropriate sectorization of the economy, that the three main statistical systems of the Fund provide most of the information needed to compile a simplified but useful FOF accounts and to relate these accounts to other elements of the SNA. This finding reinforces the interest in the harmonization among all these interrelated statistical systems, and therefore between the MBS and the SNA.
The appropriate sectorization of the financial sector is the specific
11 The term MBS is used here to describe the Fund's system of money and banking statistics and the methodology associated with that system as currently practiced by the IMF staff. This practice does not necessarily coincide in all cases with the draft MBS Guide (not available to the public), which in some respects has been superseded by developments in financial instruments and innovations.
INTRODUCTION XXV
subject of the paper by Saunders (Chapter 22), who discusses the precise coverage of the MBS and contrasts it with that of the fin<mcial sector of the SNA. A primary difference is the inclusion, in the central bank subsector of the MBS, of financial activities encompassing monetary authority functions carried out by government, whereas such functions are retained in the government sector of the SNA. This rerouting is done to identify certain key financial aggregates. Other differences relate to the subsectorization of the accounts within the financial sector. In both cases a harmonization is contemplated in the revision of the SNA and the draft MBS Guide.
Kumah (Chapter 23) describes the evolution of monetary concepts and definitions and shows the shift of emphasis, from narrow definitions of money to broader monetary aggregates, that has taken place in many countries over the years. This has reflected both the relatively faster growth of other financial intermediaries in relation to deposit money banks and the development of new financial instruments-by both bank and nonbank financial intermediariesthat are close substitutes for money.
The statistical treatment of selected new financial instruments is examined in four papers that deal respectively with repurchase agreements (by Castello-Branco), financial leases and zero- and lowcoupon bonds (by the Balance of Payments Division of the IMF' s Bureau of Statistics), deep-discounted and indexed bonds (by Newson and Brodersen), and financial leases (by Newson); the last three overlap to some extent. Repurchase agreements ("repos") involve the sale of a financial asset or group of assets, with the agreement to reverse the transaction at some specified date in the future. Castello-Branco (Chapter 24) proposes that repos be treated in the SNA as a new financial instrument, similar to a collateralized loan, following the current practice in the MBS. However, this treatment would not be consistent with that in the BPM, which treats repos as a direct transfer of ownership of the underlying securities.
The treatment of leases has long been a subject of controversy because of the wide variety of legal and financial arrangements covered under this instrument, but in general a distinction is made between financial and operational leases. As pointed out in the paper by the Balance of Payments Division (Chapter 25), the BPM defines a financial lease as an arrangement that provides for the recovery by the lessor of all (or substantially all) of the cost of the goods, together with carrying charges. The BPM also indicates that, in practice, a recovery of three fourths of the cost of the goods together with the carrying charges is taken as evidence that a change in ownership from lessor to lessee is intended. All other leases that do not meet these
xxvi INTRODUCTION
requirements are considered to be operational leases implying that the legal owner retains control over the assets. In financial leasing, by contrast, such control passes effectively to the lessee, who for statistical purposes becomes the owner. In this way the "ownership concept" is broadened for financial leases to encompass an element of control over the assets. However, Newson (Chapter 26) suggests new qualitative rather than quantitative criteria to differentiate between the two types of leases.
With respect to the recording of income on zero- and low-coupon bonds, the accrual method of accounting is proposed by the Balance of Payments Division; this method results in interest being imputed periodically over the life of the debt while the value of the principal reflects the increasing debt associated with accumulating interest. By contrast, cash accounting would attribute all interest (or capital gain) to the last period. However, there are other problems that affect classification-for instance, the difficulty of distinguishing interest from capital gain when bonds issued at deep discount, as in the case of low- or zero-coupon bonds, are traded in secondary markets or when indexing contracts are involved. A method to deal with these issues is presented in the paper by Newson and Brodersen (Chapter 27).
The principles of valuation and reconciliation in the MBS and the SNA are discussed by Dublin (Chapter 28). Changes in balance sheets over time include not only all transactions that have taken place during the period but also nontransaction items such as changes in the valuation of assets and liabilities (revaluation), changes in classification, and errors and omissions in the recording of transactions. All these nontransaction items are collectively assigned to the reconciliation accounts in the SNA. The valuation principles for recording transaction and nontransaction flows, as they apply to financial instruments, are now similar for both the SNA and the MBS, emphasizing the symmetrical treatment of assets and liabilities. Short-term instruments are recorded at book value, long-term domestic currency assets and liabilities at market prices, and foreign currency assets and liabilities at the prevailing exchange rate. The practices for the derivation of transaction flows from balance-sheet positions in the absence of direct transactions data are also illustrated.
A miscellaneous group of papers, dealing with some of the most difficult and controversial issues raised on money and banking statistics, completes this volume. Both Siddique and Vanoli deal with the treatment of financial intermediaries from the point of view of their contribution to output and incpme in the SNA. Siddique (Chapter 29) discusses the issue of the treatment of output in the banking industry,
INTRODUCTION xxvii
comparing current SNA practice with some proposals for change. Alternative methods of deriving banking output are reviewed, and an illustration from data for Luxembourg is provided. As opposed to the current practice in the SNA of allocating banking services to depositors only, the paper proposes allocating such services to both borrowers and depositors, highlighting thereby the intermediation function of the banking industry. Siddique also addresses an important issue concerning the allocation of imputed banking services between intermediate and final demand-in contrast to the present SNA, which allocates all imputed bank service charges to intermediate demand. Moreover, although Siddique's paper refers to "banks," its analysis applies equally well to all other financial intermediaries except for insurance entities, for whom a specific treatment is necessary. The appropriate treatment of insurance in the SNA is the subject of Vanoli's paper (Chapter 30), which proposes that insurance services should be defined as gross premiums earned, plus net investment income, less technical charges, the last of these being computed as the claims due plus the changes in technical reserves.
General insights into broader concepts of the SNA that help clarify the relationships between flows and stocks are provided in the papers by Milot, Teillet, and Vanoli and by Liitzel. Understanding of these relationships is needed to relate the real sector SNA flows to the balance sheets, which necessarily comprise both real and financial assets in the same account. Milot, Teillet, and Vanoli (Chapter 31) provide an analysis of various factors, besides real and financial transactions, that explain variations in wealth, including nonproduced assets, such as land, forests, and rivers, and exceptional events, such as earthquakes.
Liitzel' s paper on the treatment of fixed capital formation by owner and user (Chapter 32}, deals with the issue of allocating fixed capital formation (or fixed assets) to investing sectors (producers). The conclusion that emerges is that whether the owner or the user concept should be applied for recording fixed capital formation by investors should depend on the intended purpose of the data. Thus, although preference should be given to the ownership concept in the SNA, the user concept should also be included as an additional recording devise in some cases. An application is suggested to the issue of recording financial leasing, which, as noted earlier, has gained considerable importance. Liitzel's principles suggest that the revised SNA should consider financial leasing as an acquisition of a fixed asset on long-term credit. The relevant commodity should therefore be shown as part of the fixed capital of the borrower, who would be treated for statistical purposes as an owner.


Part I
EXTERNAL SECTOR
TRANSACTIONS

1
Residents of an Economy
ARIE C. BoUTER
I N CONNECTION with the forthcoming revision of the United Nations' A System of National Accounts (SNA), a question has arisen
about whether the definition of the residents of an economy,1 given in the 1968 version of the SNA and in the 1977 edition of the IMF's Balance of Payments Manual (BPM) can continue to serve as the basis for compiling national accounts and balance of payments statistics that provide the users of these statistics-the central authorities of the compiling economy and the international organizations-the information they need for policy purposes. That question is discussed in Section I of this chapter. The concept underlying the definition given there is virtually the same as that underlying the definition of residents in the 1968 version of the SNA. Therefore, measures of gross domestic product (GOP) and gross national product (GNP) based on the definition given in Section I should be similar, if not the same, as those based on the 1968 definition of the residents of an economy. The continuity of the existing time series would thus be maintained.
The residency status of the general government, individuals, private nonprofit bodies serving individuals, and enterprises of an econ-
1 In this paper, an "economy" refers to a sovereign state, a part of a sovereign state, a combination of two or more sovereign states, or an international organization. In this context an international organization is defined as an organization that derives its authority from the central authorities in its member countries, who have relinquished part of their authority. Except for an economy that is an international organization, the "residents of an economy" comprise the general government, individuals, private nonprofit bodies serving households, and enterprises. The residents of an economy that is an international organization do not comprise individuals, private nonprofit bodies serving households, and enterprises; in such an economy, the role of the international organization is comparable to that of the general government in other economies.
3
4 EXTERNAL SECTOR TRANSACTIONS
omy is discussed in Sections II through V; the residency status of international organizations, which are not considered to be residents of any national economy, including the economy in which they are located or conduct their affairs, is discussed in Section VI. Brief conclusions are given in Section VII.
I. Policy Needs of the Authorities
The government of an economy sets policy and makes the laws and regulations that apply to it. These laws and regulations affect, in principle, all entities-those physically or legally present in that economy ("residents"), as well as those physically or legally present in the rest of the world ("nonresidents").2 The enforcement of these laws and regulations as they affect residents differs considerably, however, from their enforcement with respect to nonresidents. For residents of the given economy, enforcement of the laws and regulations is straightforward because it derives from the government's authority in that economy. In contrast, because the government of the given economy lacks the authority to enforce its laws and regulations in the rest of the world, enforcement of· those laws and regulations with respect to nonresidents is not practicable. If at all, enforcement on nonresidents comes about only when the government of the given economy can exert pressure on entities in the rest of the world through affiliated entities in the given economy. Moreover, nonresidents are, more than anything else, subject to the possibly contradictory policies of the authorities in the rest of world and, therefore, may not be able to comply with the laws and regulations of the given economy. Thus, it appears that for statistical, analytical, and policy purposes the residents of a given economy can best be defined in terms of their presence in the territory of that economy-the home economy. In this context, the territory of an economy is defined to include its territorial seas and air space, as well as those international
2 For example, a potential exporter of a commodity in the rest of the world is affected by the laws and regulations of a given economy when the residents of that economy decide not to import that commodity in light of the laws and regulations of the economy. A transaction that takes place notwithstanding those laws and regulations is an illegal transaction for the importing economy. For the exporting economy, however, it is a legal transaction that should be recorded in the national accounts and balance of payments statistics of both economies, despite the fact that the transaction is illegal for the importing economy. Failure to record the transaction in the importing economy has caused imbalances in the global accounts.
RESIDENTS OF AN ECONOMY 5
waters beyond its territorial seas and the international air space beyond its territorial air space over which the economy has or claims to have exclusive jurisdiction.
The strict application of this concept of residence to a given entity that temporarily enters or leaves the territory of a given economy would affect the classification of the transactions of that entity during that time and would require the recording, both in the national accounts and in the balance of payments, of the two successive changes in the international investment position that result from that entity's temporary change of residence. This change in recording would be particularly bothersome in extreme situations-for example, when an individual leaves the territory of the home economy for a one-day vacation, or when an enterprise installs equipment in the territory of an economy other than the home economy. If a vacationing individual continued to be a resident of the home economy, that individual's expenditures on goods and services for use during his vacation should be classified under travel (direct purchases abroad). If, however, a vacationing individual temporarily became a resident of the host economy, these same expenditures should be classified under private unrequited transfers (other capital transfers by private sector, denoting a change in net worth). Similarly, for an enterprise installing equipment in the territory of an economy other than the home economy, the recording and classification of the various transactions would depend on the residency status of that enterprise. For example, any payment for wages to residents of the host economy would be recorded as labor income, and the proceeds from the installation services should be recorded as services (miscellaneous commodities) if the enterprise continued to be a resident of the home economy. The net proceeds from the installation services (gross proceeds from the installation services minus payments for wages), however, should be recorded as investment income (entrepreneurial income) if the enterprise temporarily became a resident of the host economy.
In addition, the strict application of that concept of residence would require the recording, both in the national accounts and in the balance of payments, of the two successive changes in the international investment position that result from an entity's temporary absence from the home economy. An entity's claims on and liabilities to other residents of the home economy would, for one day, become that economy's foreign liabilities and claims, whereas an entity's claims on and liabilities to residents of the rest of the world would become, again for one day, the rest of the world's domestic liabilities and assets. Thus, if an entity were defined in terms of its presence in the
6 EXTERNAL SECTOR TRANSACTIONS
territory of an economy, a good deal of information would be required to implement the existing accounting rules.
In view of these considerations, it appears that there would seem to be justification for defining the residents of an economy as the entities that may be expected to consume goods and services, participate in production, or engage in other economic activities in the territory of an economy on other than a temporary basis. Under this approach, however, questions would arise about the length of time an entity can remain outside the territory of the home economy and about the activities in which it can engage during that time without the entity undergoing a change in its residency status.
Obviously, the longer an entity stays outside the territory of the home economy and the more an entity is integrated in the economy where it is temporarily located (the host economy), the more reason there is for treating that entity as a resident of the host economy. Entities whose stay in the territory of a host economy is brief and whose integration in the host economy is tenuous-as in the examples cited above-should not be considered residents of that economy during that period. In contrast, entities whose stay in the territory of the host economy is indefinite and whose integration in the host. economy is substantial should clearly be considered residents of that economy.
An approach to determining residency that is based on the length of stay and on the degree of integration in the host economy, however, cannot be adopted. For one thing, ranking of entities according to these criteria is not a feasible undertaking. Furthermore, even if such ranking were made, it would still be a matter of judgment to decide exactly how long and for what purpose an entity would have to be in the territory of the host economy to become a resident; that is, where the borderline between residents and nonresidents should be drawn. Therefore, a supplementary rule of thumb for determining the residency status of entities that temporarily remain outside the home economy would seem to be needed. Moreover, because little information on the activities of entities that temporarily remain outside the territory of the home economy is commonly available, there would seem to be justification for expressing that rule in terms of a period of time during which an entity can remain outside the territory of its home economy without undergoing a change in its residency status.
Because the introduction of such a rule would affect both the compilation and the analytical usefulness of the data, it is important that the rule represent the best possible trade-off between these two aspects. Therefore, such a rule might be that entities entering the
RESIDENTS OF AN ECONOMY 7
territory of an economy for less than one year would not become residents of that economy, and that entities leaving the territory of an economy for less than one year would continue to be residents of that economy.
The one-year time span of an entity's presence in a given economy as the basis for identifying resident and nonresident entities is not in itself sacrosanct. One could argue for a period longer than one year. What is important is that, from a statistical and analytical standpoint, an objective criterion rather than a vague reference to some concept of ''center of economic interest'' be adopted for demarcating resident and nonresident entities. Although the length of the period to be used for identifying resident and nonresident entities could certainly be a point for discussion in any reappraisal of the existing guidelines on residence, consideration of maintaining continuity in the time series would favor retention of the present one-year rule.
Under this approach, however, a problem of principle would arise for entities that, after a point in time, remain permanently outside the territory of any national economy (that is, in international waters or air space) or that move frequently between the territories of two or more economies, thus posing a problem similar to that of entities remaining permanently in international waters or air space. As a matter of principle, such an entity should be attributed to a single economy on the basis of that entity's being subject to the laws, regulations, and protection of that economy. But because information for such attribution is generally not available, still another supplementary rule of thumb to deal with both of these cases would have to be provided. Such a rule might suggest that until the time an entity that is physically or legally present in more than one national territory during the course of a year, or outside any national territory, has established residency elsewhere, it continues to be a resident of the economy of which it was a resident before it left its territory. In this connection, it should be recognized that failure to attribute an entity to any economy has caused asymmetries in the global accounts.
The analytical and statistical considerations discussed in this section point to the need for formulation of guidelines on residence such as those described in Sections II-VI.
II. General Government
The general government agencies that are residents of an economy include all departments, establishments, and bodies of its central, state, and local governments located in its territory and the embas-
8 EXTERNAL SECTOR TRANSACTIONS
sies, consulates, military establishments, and other entities of its general government located elsewhere.
The general government of an economy comprises all agencies of the public authorities not classified elsewhere:
• Government departments, offices, and other bodies, whether covered in ordinary or extraordinary budgets or in extra budgetary funds, that engage in administration, defense, and regulation of the public order, promotion of economic growth and welfare and technological development, provision of education, health, cultural, recreational, and other social and community services free of charge or at sales prices that do not fully cover their costs of production
• Other nonprofit organizations serving individuals or business enterprises that are wholly, or mainly, financed and controlled by the public authorities and nonprofit organizations primarily serving government bodies themselves
• Social security arrangements for large sections of the community imposed, controlled, or financed by the government, including voluntary social security arrangements for certain sections of the community and pension funds that are considered to be part of the public social security schemes
• Unincorporated government enterprises that mainly produce goods and services for the government itself or that primarily sell goods and services to the public, but that operate on a small scale
• Public saving and lending bodies that are financially integrated with a government or that lack the authority to acquire financial assets or incur liabilities in the capital market.
Because embassies, consulates, military establishments, and other entities of a general government are subject mainly to the laws and regulations of the economy they represent, they are considered to be residents of that economy and not of the economy in which they are physically located.
III. Individuals
In this section a general concept of residence for individuals is proposed and a classification of individuals whose stay in a given economy is to be considered temporary is drawn. Implications of the general definition are then discussed.
RESIDENTS OF AN ECONOMY 9
General Definition
The concept of residence adopted for individuals is designed to encompass all persons who may be expected to stay in the territory of a given economy on other than a temporary basis, including residents who leave the territory of that economy for whatever period of time but do not establish residency elsewhere. For individuals other than government employees and employees of international organizations, a temporary basis is defined to be a period of less than one year. Because they are subject mainly to the laws and regulations of that economy, government employees are always considered to be residents of the country employing them. In a somewhat analogous manner, employees of international organizations are always considered to be residents of the economy in which either the headquarters or the regional offices of their employer are physically located.
For purposes of the application of this definition, the following types of individual are considered to be in a given economy on a temporary basis:
• Visitors (tourists)-that is, persons in the given economy for less than one year, specifically for reasons of recreation or holiday, medical care, religious observances, family matters, participation in international sports events and conferences or other meetings, and study tours or other student programs
• Crew members of vessels, aircraft, or other types of mobile equipment who do not live in the given economy but are stopping off or laying over there
• Commercial and business travelers who are to be in the given economy for less than one year and employees of nonresident enterprises who have come to the economy for less than one year to perform a given task, such as installing machinery or equipment purchased from their employer
• Seasonal workers-that is, persons who are, and will be, in the given economy explicitly for the purpose of seasonal employment only-and other workers hired by resident entities for less than one year
• Official diplomatic and consular representatives, members of the armed forces, and other government personnel of a foreign economy (together with their dependents), regardless of the length of stay in the given economy
• Employees of international organizations (together with their dependents) who are outside the economy in which their
10 EXTERNAL SECTOR TRANSACTIONS
employer is physically located, regardless of the length of stay in the given economy; employees in the regional offices of such organizations would be considered residents of the economy in which the regional office is located
• Border workers-that is, persons who cross the border between two economies daily (or slightly less frequently, but regularly) because they work in the given economy but have their abode in another economy.
Special Implications of the Definition of an Individual
Some clarification might be helpful with regard to the residence of government personnel. It is suggested that all government personnel (together with their dependents) who are outside the home economy should be treated uniformly. In particular, this means that technical assistance personnel should be treated as nonresidents of the host economy.
Technical assistance personnel are employees of the donor government who are either hired specifically for the technical assistance assignment or are existing employees reassigned to provide technical assistance. The salaries (and allowances) of these personnel are paid by the donor government, although some local costs may be borne by the recipient economy. Most assignments of this kind would be, perhaps, for 18 months to two years, although some assignments could extend for many years. The donor economy considers these employees as its residents and considers that it has "stationed" these employees in the recipient economy. If, however, a donor country gave a cash grant to a recipient economy, which uses the funds to hire a foreign expert, the situation would be different. In that case, the foreign expert would be considered to be a resident of the recipient economy, according to the general rule of residence.
The determination of residence according to an individual's length of stay in an economy would mean that the following individuals would be deemed to be residents of the economy where they are staying: workers, including expatriate businessmen, who expect to be in the economy for one year or more; illegal aliens; and refugees.
Workers Who Expect to Be in a Given Economy for One Year or More
It is suggested that all individuals who enter the territory of a given economy with the intention of staying there for at least one year should
RESIDENTS OF AN ECONOMY 11
be treated as residents of that economy, with the exception of employees of foreign governments and of international organizations that are physically located in another economy. Residents of the given economy would, therefore, include all long-term workers, no matter the circumstances in which they are accommodated, the ties they maintain with their countries of origin, or the level of salaries they earn.
It has also been suggested by some analysts that nationals of an economy who work on contract in another economy for varying periods (so-called migrant workers or guest-workers) be regarded as residents of the home economy regardless of their length of stay abroad. It has been argued that these workers have employment contracts (sometimes renewable) typically of one to two years in duration and that they invariably return to their home country when their contracts have expired. Often, during their period of employment abroad, the guest-workers leave their families behind in their home countries. The argument is made that these workers continue to have their economic association with their home countries. For this reason, some analysts would suggest that they be considered residents of their home economies rather than of the host economies. The argument against this line of reasoning is that, with the exception of government employees and employees of international organizations, the same thinking could be applied to all other categories of individuals-including students who are domiciled abroad for varying lengths of time, depending on the duration of their study programs. It would not seem appropriate to single out the category of migrant workers or guest-workers as an exception to the general rules of residence. Furthermore, as pointed out in Section I, for statistical purposes one needs an objective yardstick, preferably with reference to some observable characteristic such as length of stay, to distinguish between resident and nonresident entities.
Illegal Aliens and Refugees
Because the length of stay of illegal aliens and refugees in a given economy is often indeterminate and there is no other economy to which their residence can be more meaningfully assigned, it is suggested that these individuals should be treated as residents of the economy where they are staying.
Individuals who are permanently moving from one economy to another-for example, some members of ships' crews and international travelers-also have to be assigned to an economy. The definition of residence given above accommodates these individuals by
12 EXTERNAL SECTOR TRANSACTIONS
assigning them to the economy where they had established residence before moving from one economy to another.
lV. Private Nonprofit Bodies Serving Individuals
All private nonprofit bodies classed as serving individuals are resident economic entities of the economy in whose territory the bodies are located or conduct their affairs. Such bodies are not entirely, or mainly, financed and controlled by organs of general government, and they furnish educational, health, cultural, recreational, and other social and community services to individuals either free of charge or at sales prices that do not fully cover the costs of production.
V. Enterprises
As in Section III, here a general definition is proposed and then qualified.
General Definition
Resident enterprises of a given economy are the actual or notional units that engage in (1) production of goods and services on the territory of that economy, (2) transactions in land located within the territory of that economy, or (3) transactions in leases, rights, concessions, patents, copyrights, and similar nonfinancial intangible assets issued by the government of that economy.
Special Implications of the Definition of an Enterprise
The definition of a resident enterprise holds special implications for transactions in land and nonfinancial intangible assets, the breakup of single legal entities, mobile equipment, enterprises engaged in installation of machinery or equipment, agents of enterprises, and leased goods. These implications are explored in the following paragraphs.
Transactions in Land and Nonfinancial Intangible Assets
Unlike other real assets used in the production of goods and services, land can be used in such production only in the territory of the economy where it is located. Nonfinancial intangible assets, such as

RESIDENTS OF AN ECONOMY 13
leases, rights, concessions, patents, and copyrights, can be used in the production of goods and services in the territory of an economy other than the one where they are issued only through a licensing arrangement with the holder of the asset, a resident enterprise of the economy in which the asset was issued. Furthermore, unlike the owners of real assets other than land and nonfinancial intangible assets, the owners of land and nonfinancial intangible assets are permanently subject to the laws and regulations of the economy in whose territory that land is located and whose authorities have issued those assets, respectively. In view of the unique and strong ties between these assets and the territory where they are located or issued, there is justification for establishing a notional enterprise in the economy in whose territory the land is located and whose authorities have issued the nonfinancial intangible assets whenever ownership of these assets is acquired by a nonresident entity. At that time, the ownership of these assets is imputed to that notional enterprise, and the ownership of that notional enterprise is imputed to the nonresident owner of the assets. Any income from the land and the nonfinancial intangible assets will accrue to the nonresident owners in the form of investment income (withdrawals of entrepreneurial income) from the notional enterprise.
Breakup of Single Entities
The general rule governing the determination of the residence of enterprises often makes it necessary to divide a single legal entity (for example, a parent company operating in one economy and its unincorporated branch operating in another economy) or a single establishment (for example, a pipeline or railway spanning the territory of two or more economies) into two or more separate enterprises. Each of these enterprises is to be regarded as a resident of the economy on whose territory its operations are carried out. The costs and proceeds of the separate units are to be calculated as if the units are bought and sold at market prices, even though some, most, or all of what they receive from, or transfer to, the other units of the complex to which they belong may be omitted from their records or entered only at nominal value. The balance of payments and external sector presentations should reflect the allocation, to each member of the complex, of an appropriate share of any common operating costs (including head office expenses and charges with respect to mobile equipment). The net income of the units should be shown as accruing to the economy where the head office is located.
14 EXTERNAL SECTOR TRANSACTIONS
The practice described in the previous paragraph is to be followed also for so-called offshore enterprises. These enterprises, which are typically owned by residents of an economy other than the economy in whose territory the enterprise is engaging in the production of goods and services,3 benefit from laws and regulations designed to attract export-oriented assembly and manufacturing companies, international trading companies, banks, and insurance companies. Offshore enterprises are subject to the policies of the authorities of the economy where they are engaged in production of goods and services. For that reason, they should be considered to be residents of that economy, even though they may be located in specially designated areas of the territory of that economy, may be exempt from that economy's customs and exchange regulations, may receive fiscal or other incentives from that economy, or may be subject to restrictions with respect to transactions with other entities residing in the territory of that economy.
Nonetheless, for analytical purposes, in balance of payments and external sector presentations the international transactions (including the capital and income flows) of offshore or similar enterprises could be distinguished from those of other residents of the reporting economy. It should be recognized, however, that the failure to include the international transactions of offshore enterprises in balance of payments and external sector presentations-either on a gross or on a net basis-has caused global asymmetries when those transactions are included in similar presentations for the rest of the world.
The registration of ships or other mobile equipment in a so-called open-registry country4 for the purpose of obtaining the right to fly the flag of that country refers to the acquisition of still another nonfinan-
3 The residence status of the owner of an enterprise operating in the territory of an economy does not affect the residence status of that enterprise.
4 An open-registry country has been described by the Rochdale Committee as having the following features: (1) the country of registry allows ownership or control (or both) of its merchant vessels by noncitizens; (2) access to the registry is easy (a ship may usually be registered at a Consul's office abroad; equally important, transfer from the registry at the owner's option is not restricted); (3) taxes on the income from the ships are not levied locally or are low (a registry fee and an annual fee, based on tonnage, are normally the only charges made; a guarantee or acceptable understanding regarding future freedom from taxation may also be given); (4) the country of registry is a small power with no national requirement under any foreseeable circumstances for all the shipping registered (but receipts from very small charges on a large tonnage may produce a substantial effect on its national income and balance of payments); (5) manning of ships by non-nationals is freely
RESIDENTS OF AN ECONOMY 15
cial intangible asset. The acquisition of such an asset also requires establishment of a notional enterprise. Unlike the offshore enterprises discussed in the preceding paragraphs, an enterprise that has acquired the right to fly the flag of the flag-of-convenience country generally does not have any assets other than the right to fly that flag. The ship or the other mobile equipment itself typically is owned by an enterprise located in a country other than the flag-of-convenience country. More important, the ship or other mobile equipment that is flying that flag typically is used in production outside the territory of any economy. Therefore, production of the notional enterprise owning the right to fly the flag of the flag-of-convenience country is represented by the service it renders to the owner of the ship or other mobile equipment. The value of that service presumably is equal to the registration fee that the notional enterprise pays to the government of the flag-of-convenience country.
Mobile Equipment
Situations involving mobile equipment-for instance, aircraft, ships, highway and railway rolling stock, fishing vessels, and gas and oil drilling rigs-often seem to present problems of residence. These problems, however, can be somewhat illusory: it is the residence of the operator that uses the equipment in its productive activities that is to be decided. The resident status of all enterprises is in fact to be governed by the same rule, whether the capital equipment used is immovable or mobile: an enterprise is a resident of the economy on whose territory it engages in production.
Mobile equipment thus presents a problem of principle-in the sense that the residence of the enterprise operating such equipment cannot logically be inferred from the above rule-only when it is used in production outside the territory of any national economy (that is, in international waters or air space). Mobile equipment that merely moves between the territories of two or more economies should, in accordance with the general rule, be regarded as being operated by a separate enterprise in each of the economies where it is used in pro-
permitted; and (6) the country of registry has neither the power nor the administrative machinery to impose any government or international regulations effectively, nor has the country the wish or the power to control the companies themselves. See Committee of Inquiry into Shipping, Report (London: Her Majesty's Stationery Office, Cmnd. 4337, 1970), p. 51.
16 EXTERNAL SECTOR TRANSACTIONS
duction. As a practical matter, however, equipment that moves frequently between the territories of various economies also poses a problem similar to that of equipment used in international waters or air space. Therefore, a supplementary rule of thumb to deal with both of these cases is needed. This rule is that mobile equipment that is operated on more than one national territory during the course of a year, or outside any national territory, is to be attributed to a single enterprise with a determinate residence. That enterprise is considered to be the operator of the aircraft, ships, highway and railway rolling stock, fishing vessels, gas and oil drilling rigs, or other mobile equipment that is not used for production primarily on the territory of any one economy for as much as a year or is used in international waters or air space.
In deciding the residence of an enterprise in accord with this rule, attention should be given to such attributes as the flag of registration of the equipment, the economy where the company directing operations is incorporated, the residence of the owners of that company, and, for an unincorporated enterprise, the residence of the entity responsible for its operations. In addition, such circumstances as the fact that the equipment is subject to the laws, regulations, and protection of a particular economy, or that it is linked more closely to one economy than to others, should be taken into account.
In rare instances, such considerations could indicate more than one economy as the residence of the enterprise operating, say, a transportation system or fishing fleet. In the case of an enterprise of this sort that is jointly organized and owned by residents of more than one economy, transactions should be attributed to enterprises in the economies of each of its owners in proportion to the owner's share in the financial capital of the joint enterprise.
Residence of Enterprises Engaged in Installation
Problems of defining the residence of an enterprise are encountered where employees of a resident enterprise of an economy go abroad to install machinery or equipment that the enterprise has sold to nonresidents. In these instances, the installation services should be considered to be services that have been provided by the resident enterprise to a nonresident if the work of installation is carried out entirely, or primarily, by the employees in question and if they complete the installation in less than one year. However, if a significant portion of the work of installation is performed by residents of the economy where the machinery or equipment is installed, the work of
RESIDENTS OF AN ECONOMY 17
installation is likely to be substantial and will probably take a significant time to complete. Such services should then, in principle, be attributed to an enterprise that is a resident of that economy.
Agents
Without exception, a transaction should be attributed to the economy of the principal on whose behalf a transaction is undertaken and not to the economy of the agent representing or acting on behalf of that principal. Services rendered by the agent to the enterprise he represents, however, should be attributed to the economy of which the agent is a resident.
Leased Goods
The general rule determining the residence of an enterprise applies whether it is using its own or leased capital equipment. If such goods have been obtained under a financial leasing arrangement that provides for the recovery of all, or substantially all, of the cost of the goods, together with the carrying charges, that arrangement is to be taken as presumptive evidence that a change of ownership is intended.
VI. International Organizations
An international organization (see also Chapter 2) is defined as an organization that is not legally subject to the control of any higher or external national authority-that is, an organization that derives its own authority directly from the authorities of its independent member states. Governments, as supreme authorities of sovereign states, may have delegated part of their responsibilities and authority to national agencies, such as central banks, and may also have relinquished part of their authority to international organizations. Several international organizations have been created to foster international cooperation in political, administrative, financial, technical, 5 health, labor, economic, and social fields.
An international organization is sovereign because it is not under the jurisdiction of any single government and has definite functions, privileges, and powers that are usually set forth in the constitution or
5 Such as postal, communications, and meteorological services.
18 EXTERNAL SECTOR TRANSACTIONS
charter of the organization. For example, the Articles of Agreement of the IMF provide the purposes, functions, and limits under which the Fund operates. The Fund possesses full juridical personality, is immune from judicial process, is immune from any form of seizure by executive or legislative actions, is free from restrictions, regulations, controls, and moratoria of any nature, and is immune from all taxation and customs duties. In addition, officers and employees of the Fund are immune from legal process with respect to acts performed by them in their official capacity, a protection similar to diplomatic immunity.
The treatment of an entity as an international organization is done on an ad hoc basis. The test to apply in order to determine if an entity is an international organization is twofold. First, it must have authority derived directly from the authorities of its members. Second, it must have sovereign status-that is, the laws and regulations of the economy where the international organization is located do not apply to the organization. In this respect, enterprises and nonprofit institutions that are jointly owned by governments or other residents from more than one economy are not treated as international organizations but are, like other enterprises, considered to be residents of the economies on whose territories they operate. The transactions of such entities are allocated to a resident enterprise of each country in proportion to the ~hare of its owners in the financial capital of the entity or in relation to other formulas determined by the owners. For example, Air Afrique, which is engaged in the provision of international air transportation services, is owned by the governments of ten states. It received its authority to provide such services directly from the governments of the ten states (that is, from the supreme authorities of those independent states). However, Air Afrique is a nonfinancial enterprise and must comply with the laws and regulations of the economies where it is located and where it operates. For that reason, it should not be treated as an international organization but as a resident enterprise of the ten countries.
International organizations, including supranational organizations, are not considered residents of any national economy, including that in which they are located or from which they conduct their affairs. The employees of these organizations are, nevertheless, residents of a national economy-specifically, of the economy in which they are expected to have their abode for one year or more. That economy will be the one in which the given international unit is located. It follows that the wages and salaries paid by the international organizations to their own employees are payments to residents of the economy in which those organizations are physically located; the only resident
RESIDENTS OF AN ECONOMY 19
entity in the economy that constitutes an international organization is the international organization itself.
VII. Conclusions
For the purpose of making policy decisions, the authorities of a given economy need data that reflect the transactions of the residents of that economy-that is, of the entities that are subject to the laws and regulations of that economy. So that these authorities might collect such data, this paper defines the residents of a given economy as the entities that may be expected to consume goods and services, participate in production, or engage in other economic activities in the territory of an economy on other than a temporary basis, including entities that leave the territory of that economy but do not establish residence elsewhere. The concept underlying this definition of residents is very much, if not completely, the same as that underlying the definition of residents in the SNA.
The attraction of maintaining unchanged the concept underlying the definition of the residents of an economy did not, however, play a role in drafting the definition offered in this paper. The main focus of attention was at all times on the factors that determine an entity's residence. Nevertheless, throughout the course of defining the residents of an economy, it was clear that the definition of the residents of an economy determines the size of GOP and GNP and that the definition should not be determined by considerations about how this definition might affect the size of GOP and GNP. But, although the definition of the residents of an economy determines the size of GOP and GNP, it cannot be said to distort the size of these economic aggregates. Distortions in GOP and GNP can come about only as a result of the incorrect application of the definition of residents of an economy, whatever that definition may be.
2
Treatment of International Organizations
GERARD G. RAYMOND
T HE STATISTICAL TREATMENT of international organizations in balance of payments methodology is examined. In particular, the
paper reviews the current methodology and the practical application of the concept of what constitutes the residents of an economy with respect to international and regional organizations for national accounts and balance of payments statistics. Section I provides a compendium of the current methodology according to the United Nations' A System of National Accounts (SNA) and the IMF's Balance of Payments Manual (BPM). Section II presents a revised definition of the concept of international organizations. Section III covers a number of practical considerations in the application of this concept, and Section IV presents conclusions.
I. Current Methodology for International and Regional Organizations
In a strict sense, an international organization can be defined as one that involves two or more countries; a regional organization, similarly, is one that pertains to a given geographic region. A regional organization involving two or more countries would also be an international organization. A more precise definition of these two statements is needed, however, to narrow down the criteria for defining international organizations.
The BPM (paragraph 57) states that "international bodies that do not qualify as enterprises ... , comprising most political, administrative, economic, social, or financial institutions in which the members are governments . . . are not considered residents of any national economy, including that in which they are located or conduct their
20
INTERNATIONAL ORGANIZATIONS 21
affairs." Similarly, the SNA (paragraph 5.113) states that "international bodies, such as political, administrative, economic, social or financial institutions, in which the members are governments, are not considered residents of the country in which they are located or operate." These statements stipulate the two conditions that have been used to define international organizations:
• International bodies that comprise most political, administrative, economic, social, or financial institutions in which the members are governments (this condition identifies the types of organizations, in which members have to be governments, that are treated as international organizations)
• International bodies that do not qualify as enterprises (this restrictive condition stipulates that enterprises are not treated as international organizations).
II. Proposals for a Revised Definition
The application of the conditions above has not always yielded satisfactory results. For example, difficulties of interpretation have arisen with regard to some international entities, such as the Bank for International Settlements (BIS), that have members that are not governments but are closely related to the official sector. In addition, the restrictive condition stipulating that international bodies should not qualify as enterprises has also created problems of interpretation because most financial institutions are part of the enterprise sector. These issues are of sufficient importance to warrant a revised definition of the concept of international organizations in the SNA and BPM (see Chapter 1 in this volume).
An international organization can be defined as an organization that is not legally controlled by any higher or external authority-that is, an organization that derives its authority directly from the authority of its members-in other words, from the authority of independent states. The supreme authority of any sovereign state is its government.1 Governments may delegate part of their responsibility and authority in specific fields to national entities or agencies-for example, the central bank-and in addition may confer on international
1 "As applied to international relations, the legal theory of sovereign states has been considered to mean the right of a state to manage all its affairs, whether external or internal, without control from other states"; S.S. Goodspeed, The Nature and Function of International Organizations (Oxford and New York: Oxford University Press, 1959), p. 10.
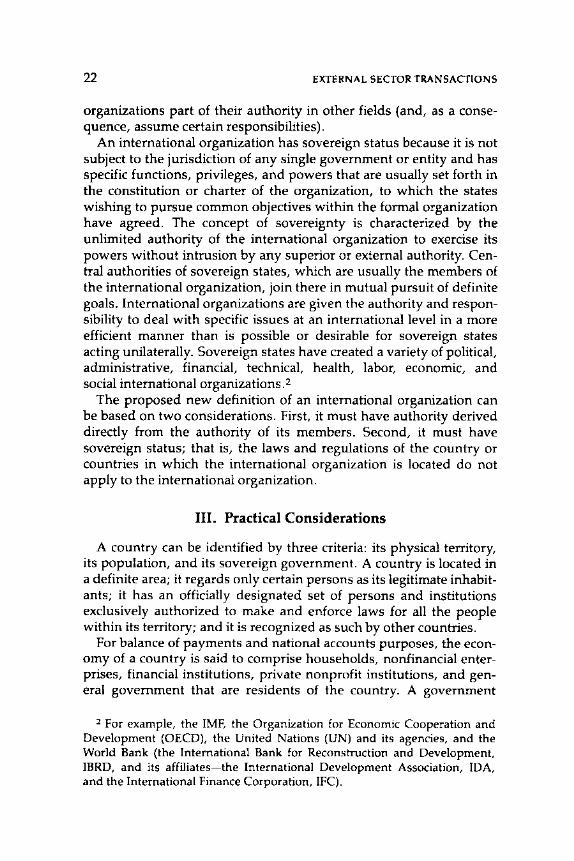
22 EXTERNAL SECTOR TRANSACTIONS
organizations part of their authority in other fields (and, as a consequence, assume certain responsibilities).
An international organization has sovereign status because it is not subject to the jurisdiction of any single government or entity and has specific functions, privileges, and powers that are usually set forth in the constitution or charter of the organization, to which the states wishing to pursue common objectives within the formal organization have agreed. The concept of sovereignty is characterized by the unlimited authority of the international organization to exercise its powers without intrusion by any superior or external authority. Central authorities of sovereign states, which are usually the members of the international organization, join there in mutual pursuit of definite goals. International organizations are given the authority and responsibility to deal with specific issues at an international level in a more efficient manner than is possible or desirable for sovereign states acting unilaterally. Sovereign states have created a variety of political, administrative, financial, technical, health, labor, economic, and social international organizations. 2
The proposed new definition of an international organization can be based on two considerations. First, it must have authority derived directly from the authority of its members. Second, it must have sovereign status; that is, the laws and regulations of the country or countries in which the international organization is located do not apply to the international organization.
III. Practical Considerations
A country can be identified by three criteria: its physical territory, its population, and its sovereign government. A country is located in a definite area; it regards only certain persons as its legitimate inhabitants; it has an officially designated set of persons and institutions exclusively authorized to make and enforce laws for all the people within its territory; and it is recognized as such by other countries.
For balance of payments and national accounts purposes, the economy of a country is said to comprise households, nonfinancial enterprises, financial institutions, private nonprofit institutions, and general government that are residents of the country. A government
2 For example, the IMF, the Organization for Economic Cooperation and Development (OECD), the United Nations (UN) and its agencies, and the World Bank (the International Bank for Reconstruction and Development, IBRD, and its affiliates-the International Development Association, IDA, and the International Finance Corporation, IFC).
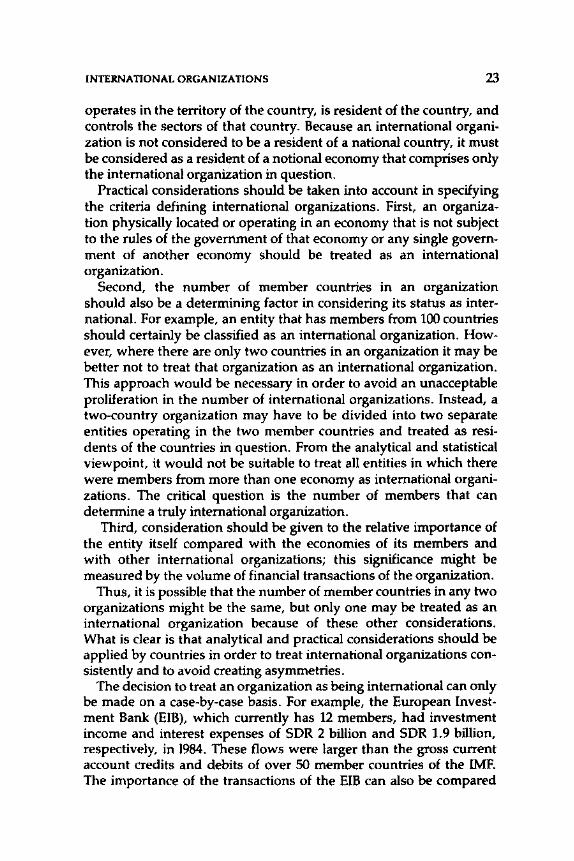
INTERNATIONAL ORGANIZATIONS 23
operates in the territory of the country, is resident of the country, and controls the sectors of that country. Because an international organization is not considered to be a resident of a national country, it must be considered as a resident of a notional economy that comprises only the international organization in question.
Practical considerations should be taken into account in specifying the criteria defining international organizations. First, an organization physically located or operating in an economy that is not subject to the rules of the goverrtment of that economy or any single government of another economy should be treated as an international organization.
Second, the number of member countries in an organization should also be a determining factor in considering its status as international. For example, an entity that has members from 100 countries should certainly be classified as an international organization. However, where there are only two countries in an organization it may be better not to treat that organization as an international organization. This approach would be necessary in order to avoid an unacceptable proliferation in the number of international organizations. Instead, a two-country organization may have to be divided into two separate entities operating in the two member countries and treated as residents of the countries in question. From the analytical and statistical viewpoint, it would not be suitable to treat all entities in which there were members from more than one economy as international organizations. The critical question is the number of members that can determine a truly international organization.
Third, consideration should be given to the relative importance of the entity itself compared with the economies of its members and with other international organizations; this significance might be measured by the volume of financial transactions of the organization.
Thus, it is possible that the number of member countries in any two organizations might be the same, but only one may be treated as an international organization because of these other considerations. What is clear is that analytical and practical considerations should be applied by countries in order to treat international organizations consistently and to avoid creating asymmetries.
The decision to treat an organization as being international can only be made on a case-by-case basis. For example, the European Investment Bank (EIB), which currently has 12 members, had investment income and interest expenses of SDR 2 billion and SDR 1.9 billion, respectively, in 1984. These flows were larger than the gross current account credits and debits of over 50 member countries of the IMF. The importance of the transactions of the Em can also be compared
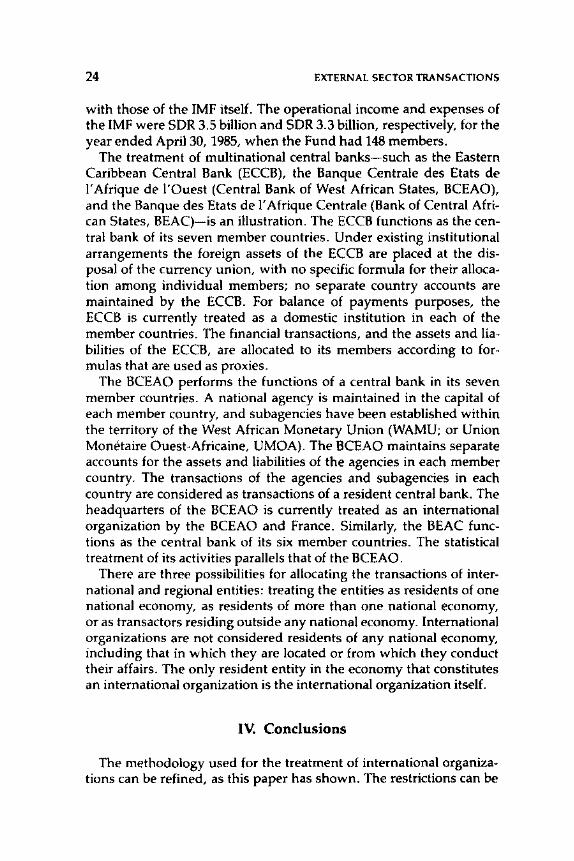
24 EXTERNAL SECTOR TRANSACTIONS
with those of the IMF itself. The operational income and expenses of the IMF were SDR 3.5 billion and SDR 3.3 billion, respectively, for the year ended April30, 1985, when the Fund had 148 members.
The treatment of multinational central banks-such as the Eastern Caribbean Central Bank (ECCB), the Banque Centrale des Etats de 1' Afrique de l'Ouest (Central Bank of West African States, BCEAO), and the Banque des Etats de 1' Afrique Centrale (Bank of Central African States, BEAC)-is an illustration. The ECCB functions as the central bank of its seven member countries. Under existing institutional arrangements the foreign assets of the ECCB are placed at the disposal of the currency union, with no specific formula for their allocation among individual members; no separate country accounts are maintained by the ECCB. For balance of payments purposes, the ECCB is currently treated as a domestic institution in each of the member countries. The financial transactions, and the assets and liabilities of the ECCB, are allocated to its members according to formulas that are used as proxies.
The BCEAO performs the functions of a central bank in its seven member countries. A national agency is maintained in the capital of each member country, and subagencies have been established within the territory of the West African Monetary Union (WAMU; or Union Monetaire Ouest-Africaine, UMOA). The BCEAO maintains separate accounts for the assets and liabilities of the agencies in each member country. The transactions of the agencies and subagencies in each country are considered as transactions of a resident central bank. The headquarters of the BCEAO is currently treated as an international organization by the BCEAO and France. Similarly, the BEAC functions as the central bank of its six member countries. The statistical treatment of its activities parallels that of the BCEAO.
There are three possibilities for allocating the transactions of international and regional entities: treating the entities as residents of one national economy, as residents of more than one national economy, or as transactors residing outside any national economy. International organizations are not considered residents of any national economy, including that in which they are located or from which they conduct their affairs. The only resident entity in the economy that constitutes an international organization is the international organization itself.
IV. Conclusions
The methodology used for the treatment of international organizations can be refined, as this paper has shown. The restrictions can be

INTERNATIONAL ORGANIZATIONS 25
narrowed down, and the application of the concept of an international organization can be more precisely defined. Even with the refinements, however, there is no final determination about where to draw the line between international entities that, for accounting purposes, have to be split up into separate entities operating in the member countries of the entity and international entities that have to be treated as separate economies. Resolution of this problem might be assisted by a comprehensive review of country practices in this area.
3
Change of Ownership and Time of Recording
in the National Accounts
RoBERT McCoLL
T HE ONGOING REVISION of the United Nations' A System of National Accounts (SNA) may change the boundary of production, modify
concepts and definitions used in identifying transactors and transactions, and develop improved methodologies for approximating transactions. It will not, however, change the nature of the SNA from an integrated set of economic accounts depicting the economy of a nation through the aggregation and categorization of its stocks and of the transactions (and revaluations) that give rise to changes in those stocks. Therefore, the recording of transactions in the external accounts cannot be considered in isolation from the rest of these integrated accounts.
Section I examines the analytic needs to be served by the changeof-ownership concept, whereas Section II reviews the concept of ownership and develops criteria for approximating that concept. Section III reviews the issue of when to record changes of ownership inthe national accounts. Specific problems in implementing the principle in the external accounts are taken up in Section rv, to highlight the need for a careful consideration of the rules to be applied to external transactions in order to ensure consistency with the overall aims of analytical usefulness and symmetry. Brief conclusions are offered in Section V.
I. Analytic Needs to Be Served by the Change-of-Ownership Concept
The government of an economy will wish to formulate macroeconomic policy so as to influence both the availability of goods and
26
CHANGE OF OWNERSHIP AND TIME OF RECORDING 27
services to the residents of that economy and the allocation of those resources among different economic sectors.l Access to the consumption of those goods and services will depend on the economy's command over the factors of production, both domestically and internationally. In deciding whether any policy initiatives are necessary or desirable to promote its residents' access to material wealth, a government would be aided by a knowledge of the state of such access and the historical trends that culminated in that state. Continued observation would be necessary to monitor the outcome of those initiatives and to dictate any necessary changes.
In a purely subsistence economy where the producing and consuming units are identical, the economic policy problem is precise. Consumption equals production, and expanding consumption requires greater use of the factors of production, such as land and labor, or a change in the production function. Measuring consumption and measuring production represent the same task. Promoting production promotes consumption. Under these circumstances the change of ownership is an irrelevant concept.2
More complex economies, where the producing and consuming units are not the same, require correspondingly more complex analysis and policy action. Promoting production in a complex economy may increase the income accruing to nonresident owners of the factors of production; promoting consumption may not expand production but instead may run down economic wealth, with consequent adverse effects on future production capacity, income, and, therefore, future consumption. It is in these more complex economies that the identification and classification of transactors and transactions become important and that the change-of-ownership concept is of paramount importance.
Ownership is a crucial concept for determining to which economies, and to which residents in those economies, the income from the application of the factors of production will accrue, and whether that income is expended by its recipients on goods and services. Unless the ownership of the factors of production can be uniquely determined, the income accruing from the application of those factors cannot be unambiguously allocated. Unless the ownership of goods
1 See Chapter 1 in this volume. The concepts and definitions discussed in that paper are assumed here.
2 "Change of ownership" is here used in a broad sense and is intended to imply economic, rather than legal, control. The nature of ownership is dealt with more fully in Section II.
28 EXTERNAL SECTOR TRANSACTIONS
and services can be identified, and changes of ownership measured, the various stages of the production process will not be identifiable.
II. What Is Ownership?
In the preceding section it was argued that, for governments to recognize the production and consumption process and to influence their development, it is necessary to identify the ownership of capital and labor used in production, as well as the ownership of the goods and services produced. It was not determined how such ownership could be identified.
The nature of ownership is the capacity that it provides to the owner to determine the disposition of an asset. Only the owners control whether assets are employed or remain idle, whether assets are passed to another, and whether assets are consumed or destroyed. The existence of such control usually exposes the owners to the risk of changes in the price of their assets and, in general, to regulatory strictures and other economic forces. Without such exposure, the intervention of governments in the market could do little to alter economic behavior.
In most cases legal ownership is equivalent to physical or economic control as described above. In our organized world the rule of law is generally applicable, and the legal owner can be said to exercise control over his assets. Labor is the most compelling example. The laborer is unambiguously the owner of his labor, which is to be employed at his discretion and the income from which will accrue to the owner. But legal title need not always imply control and, therefore, the economic responsiveness required for the analytic purposes outlined in Section I of this paper. The following three examples illustrate the need for an ownership concept that is broader than legal ownership.
Illegal Transactions
Where both the production and consumption of certain goods violate the laws of an economy, trade may occur and involve changes in possession without a change in legal ownership taking place. Neither the trafficker nor the user of illicit drugs is in a position to enforce ownership title in a court of law or to prosecute for nonpayment. In other instances the trade may be illegal for only one of the transactors. In either case, however, the principle of "change of ownership"
CHANGE OF OWNERSHIP AND TIME OF RECORDING 29
exists and is recognized, but without its legal aspects: claims to control are normally sufficient evidence of such control. Certainly, the transactors respond to economic forces as would legal owners, but the illegality of the trade removes them from the application of legislative control.
Transfers of Resources Between Parts of a Single Legal Entity
In Chapter 1 the definition of an enterprise recognized branches located in one economy belonging to head offices located elsewhere. Whether actual or notional, these branches hold assets and engage in economic activity.
In analyzing the activities of, and formulating the policies for, the residents of their economies, governments of the economies where these branches are located will view the economic activities of these branches as falling under their sway and as quite distinct from the activities of the head offices, over which their influence will be tenuous at best. For such analysis, the assets of the branch must be separated from the assets of other entities, including those of the head office. Where an asset passes between a branch and its head office, however, legal title cannot change, since only one legal entity is involved in the transaction. Nevertheless, if all aspects of control pass from an entity located in one economy to an entity located in another economy, the absence of a change in legal title is not relevant. Ownership has changed when control over the asset has changed.
The above argument applies irrespective of where the branch and its head office are located. Thus, for the purpose of any industry classification, or functional or institutional sectoring, branches (or establishments) and other quasi-corporate enterprises are accorded the status of transactors, distinct from the status of their owners.
Financial Leases and Similar Financing Arrangements
Financial leases and similar financing arrangements have many of the hallmarks of a legal change of ownership because they pass control of an asset to the user, although they preserve legal title to the asset with a financing entity. These arrangements are, in a purely statistical sense, similar to illegal transactions and transfers of resources between parts of a single legal entity in that legal ownership is different from economic control. But they also differ, respectively, by virtue of the legality of the arrangements and the existence of legally distinct transactors.
30 EXTERNAL SECTOR TRANSACTIONS
A financial lease is a well-known financing arrangement whereby economic control is passed from the legal owner to the lessee by means of the lease. Other financing arrangements may use forms such as management contracts, which provide an entity with the control of an asset and the risks of ownership normally borne by a legal owner. For such transactions, the criteria used in approximating economic control must be sufficiently broad. Otherwise the creativity of the legal and accounting professions has the potential to render successive editions of national accounting standards, incorporating more narrowly defined criteria, obsolete before their final drafting and dissemination is effected. In view of these considerations, the change-of-ownership principle must be retained as the principle for recognizing transactions, but the criteria for identifying ownership could be stated as follows. Ownership is presumed to be identical to legal ownership, with the following exceptions:
• When legal ownership cannot be granted (as in the case of illicit drugs) or cannot be established (as in the case of smuggled goods normally available in the legal market). In these circumstances, the entity that has control over the disposition of the asset is taken to be the owner.
• When the transactions are between two transactors that are part of the same legal entity, in which case the transfer of the control over the resources between the parties is recognized as being accompanied by a change of ownership. Where resources are physically moved without a change in control over those resources, no change of ownership is assumed. For example, agency arrangements, such as arrangements with representative and sales offices, involve the sale of goods and the receipt of monies by a branch not for its own account but as an agent for its parent. The relationship between the branch and its parent is subsidiary to the agent-principal relationship. Similarly, where goods are moved for repair or processing by an enterprise to its branch, the presumption of a change of ownership is not required. Control over the goods has not been transferred; rather, a service is being provided.
• When the resource is provided under a financing arrangement (including financial leasing) that transfers economic control and most of the risks of ownership of the asset to another party without transferring legal ownership. The transfer of the risks of ownership and control over the asset would normally arise through a noncancelable financing arrangement that lasts for the residual economic life of the asset. It may also arise through a financing
CHANGE OF OWNERSHIP AND TIME OF RECORDING 31
arrangement that lasts for a shorter period but is coupled with a disposal agreement that significantly shifts the risk of holding the asset from the legal owner to the user. The adoption of the third exception with as broad a specification as possible should enable evolving types of financing to be captured without regard to their outward form.
III. Timing: When Is Change of Ownership Recorded?
This section deals with the implications that the above criteria for ownership have for the time of recording changes in economic ownership. If governments are to analyze the processes of production, consumption, and accumulation, the statistics produced for that purpose must reflect all resource flows, including the financing aspects of those resource flows. The time of recording changes in ownership is critical for that purpose.
A change in ownership typically arises from an exchange of resources. Through the double-entry system of accounting, both sides of the exchange-that is, the provision of one resource in exchange for the receipt of another-are reflected in the accounts. The two sides of such exchanges should not be confused, however, with the two stages that such exchanges may entail: first, the provision of one resource, financed by the acquisition of a financial claim on the recipient of that resource; second, the provision of the other resource, financed by the extinguishing of that claim.
The analysis of the nature of transactions applies to all exchanges, whether of real resources for financial resources, real resources for real resources (barter), or financial resources for financial resources. (Where a resource is provided without any quid pro quo, the doubleentry system requires the introduction of an entry for unrequited transfers in order to offset the recording of the change in ownership of the transferred resource.) In choosing just when to record the two sides of each transaction, the following criteria must be observed.
• The two sides to a transaction must be recorded simultaneously in an economy's accounts. The omission of either side (for example, the running down of one real resource through exports without any offsetting increase in another real or financial resource, or an unrequited transfer) would create asymmetry. Such asymmetry would be reflected as a statistical discrepancy in the accounts and would reduce their analytic value.
• The two transactors in a transaction must record the two entries simultaneously. Otherwise, the same physical or financial
32 EXTERNAL SECTOR TRANSACTIONS
resource might be recorded as owned either by both or by neither transactor, and asymmetry would be the result. For example, production would not be matched by consumption or accumulation; the disposal of an asset by one sector would not be matched by its acquisition by another sector; or income would be generated but not attributed to factors of production.
• The time of recording of the transactions must have economic significance and be broadly appropriate for the economic analysis to be applied to the data. The macroeconomic analysis of, and intervention in, economies by governments rests on the exercise of control or ownership over economic resources. The time of recording must, therefore, reflect changes in ownership of those resources.
It follows from a government's need for information about the resources (real and financial) at the disposal of its residents and the changes (including the flows) in these resources that the national accounts must, at least in concept, comply with the above three criteria. Adherence to these criteria will also generate statistics that display intertemporal and interspacial consistency.
The only accounting framework to meet each of the three criteria listed above is accrual accounting. It provides for the recording of all transactions and captures all resource flows resulting from a change of ownership between economies and between sectors within an economy. Such an accoun.ting system recognizes that, in any transaction process, the change in ownership is the critical event at which to record the flow of resources, whether of real or financial resources, from factor markets to product markets.
However, as discussed above, transactions typically involve a process incorporating several critical events. These cover the contract, the delivery of a resource, and the payment for that resource. Whereas the accrual approach regards this process as entailing two transactions, each involving a delivt>ry and financing aspect, payments-based accounting recognizes only one transaction. Under this accounting regime, transactions will be recorded only when a payment of cash is involved, and such transactions will be recorded when that payment is made. Neither transactions covering the supply of resources without cash payments, nor the financing (or credit) associated with transactions that involve cash payments, will be recorded. In a world in which transfers between economies are significant, barter and financing transactions are voluminous, and the many forms of financing are of concern to governments, the coverage and timing characteristics of a payments- or cash-based system of
CHANGE OF OWNERSHIP AND TIME OF RECORDING 33
accounting make its application unsuitable for meaningful national accounting compilation.
The time of contract might also be considered an interesting piece of information. Contracts can be used for planning purposes, to meet delivery targets, to muster financial resources, and to project resource flows. By its very nature, however, a contract is contingent. Resource flows do not accompany the creation of a contract; rather, the parameters for subsequent resource flows are set by the contract. The time of the contract itself is, therefore, of no analytic value, but the informational content of a contract (prices, volumes, delivery dates, and the like) is relevant.
IV. Implementation of the Change-of-Ownership Principle
The rules contained in the fourth edition of the BPM closely approximate the broader principle of ownership described in Section II. This section discusses possible improvements to some of these rules to match the time of recording more closely to the general principle (the first three subsections below), together with some discussion of particular issues for which the application of the rules may not be obvious (the fourth and fifth subsections below).
Transactions Between Affiliates
Goods and services passing between components of the same legal entity should be recorded when control of the goods passes from one component to another. The capital account entries reflecting the financing of the goods and services should be recorded simultaneously.
However, the data sources often used for balance of payments compilation (that is, the customs and the exchange records) may not achieve the correct timing or may omit the transactions completely. Therefore, asymmetries may develop because recording of the goods and services flows is not matched by the recording of the corresponding financial flows or because the two transacting economies record the transactions at different times. (These problems also arise when transactions are to be recorded on the basis of the legal change of ownership.) Because it is likely that the transacting entities' records will reflect the principle of change in control, data from those entities should either replace the data from the customs and the exchange records or should be used to adjust them for the more significant transactions. The time of recording under this recommendation is
34 EXTERNAL SECTOR TRANSACTIONS
obviously associated with the general principle and may be different from the rule of thumb currently recommended (that is, the crossing of the exporter's customs frontier).
Financial Leases and Similar Arrangements
Goods transferred under a financial lease present a problem similar to that for affiliated enterprises. Because legal change of ownership does not occur, a point for recording must be chosen that most closely approximates the change in control.
As with goods transferred under a legal change of ownership and those transferred between affiliates, trade and exchange record data will not necessarily reflect a change in control. Control will pass, in the case of financial leases, at the commencement of the lease. Data sources from enterprises, used either for compiling or for adjusting other sources, should reflect this point in time.
For arrangements similar to financial leases, a suitable trigger that identifies the change of ownership or control must be sought. Because of the variety of forms these financing arrangements may take, the guidelines cannot be specific. A long-term purchase contract or a management contract might provide evidence of a shift in control and of the risks of ownership. If so, then the commencement of these contracts would indicate the change of ownership. In other circumstances, different vehicles might be used, and the point that most closely approximates the change in ownership should be used for recording the transactions. Again, these points need not accord with the existing rule of thumb, which recommends the crossing of the exporter's customs frontier as the point at which entries are recorded.
Time of Recording for Income
The currently recommended rule of thumb for recording interest in the national accounts is on a due-for-payment basis. This rule, however, can produce some anomalous entries in the balance of payments and reconciliation accounts of an economy. Consider the following example of a bond issued on day 1 of year 1, by economy A to economy B. The face value of the bond is 100 currency units, bearing annual interest coupons worth 12 units. The passage of time between coupon dates will result in economy B's holding an additional asset, accrued interest. Such an asset must be recognized, but no flow can be recorded to explain its emergence because the income, which gives rise to the asset, cannot be recorded until the coupon date. The recon-
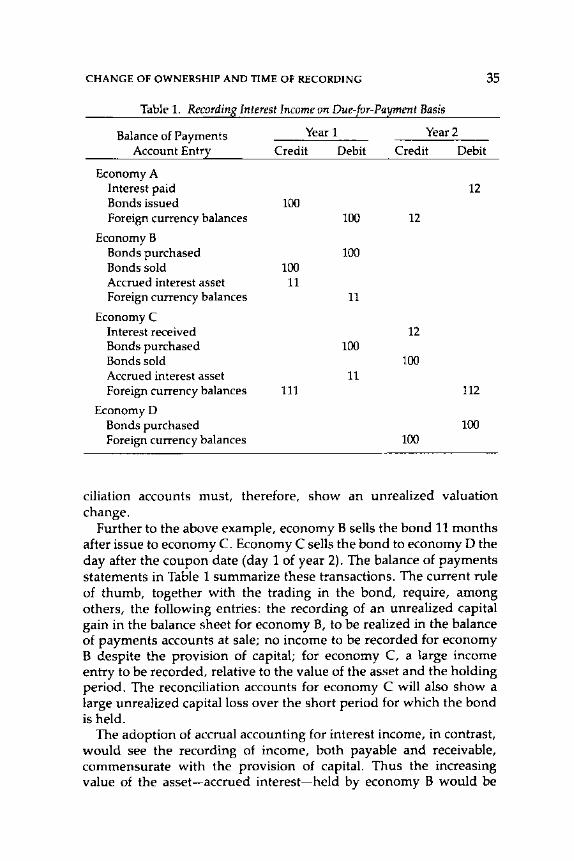
CHANGE OF OWNERSHIP AND TIME OF RECORDING 35
Table 1. Recording_ Interest Income on Due-[or-Pa~ment Basis
Balance of Payments Year1 Year2
Account Entr;r Credit Debit Credit Debit
Economy A Interest paid 12 Bonds issued 100 Foreign currency balances 100 12
EconomyB Bonds purchased 100 Bonds sold 100 Accrued interest asset 11 Foreign currency balances 11
EconomyC Interest received 12 Bonds purchased 100 Bonds sold 100 Accrued interest asset 11 Foreign currency balances 111 112
EconomyD Bonds purchased 100 Foreign currency balances 100
ciliation accounts must, therefore, show an unrealized valuation change.
Further to the above example, economy B sells the bond 11 months after issue to economy C. Economy C sells the bond to economy D the day after the coupon date (day 1 of year 2). The balance of payments statements in Table 1 summarize these transactions. The current rule of thumb, together with the trading in the bond, require, among others, the following entries: the recording of an unrealized capital gain in the balance sheet for economy B, to be realized in the balance of payments accounts at sale; no income to be recorded for economy B despite the provision of capital; for economy C, a large income entry to be recorded, relative to the value of the asset and the holding period. The reconciliation accounts for economy C will also show a large unrealized capital loss over the short period for which the bond is held.
The adoption of accrual accounting for interest income, in contrast, would see the recording of income, both payable and receivable, commensurate with the provision of capital. Thus the increasing value of the asset-accrued interest-held by economy B would be
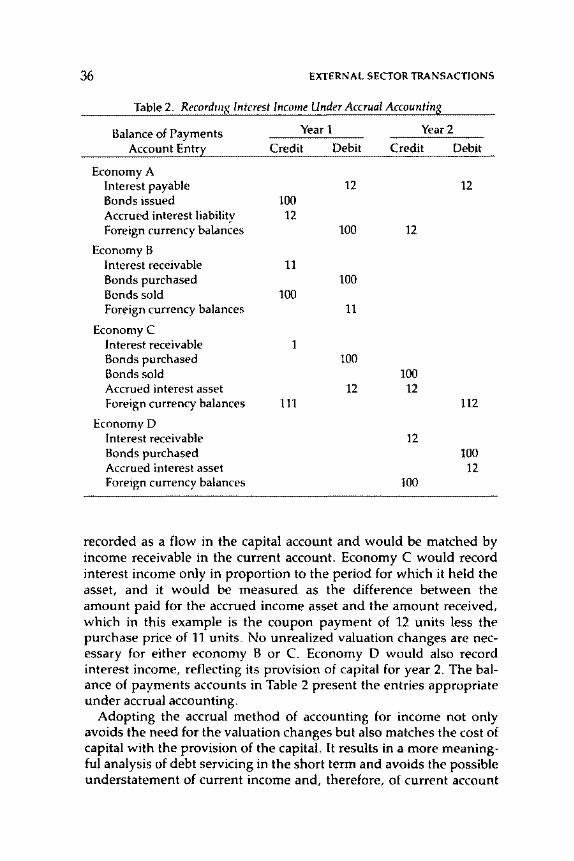
36 EXTERNAL SECTOR TRANSACTIONS
Table 2. Record1ng Interest Income Under Accrual Accounting
Balance of Payments Account Entry
Economy A Interest payable Bonds issued Accrued interest liability Foreign currency balances
EconomyB Interest receivable Bonds purchased Bonds sold Foreign currency balances
EconomyC Interest receivable Bonds purchased Bonds sold Accrued interest asset Foreign currency balances
Economy D Interest receivable Bonds purchased Accrued interest asset Foreign currency balances
Year1 Year2
Credit Debit Credit Debit
12 100 12
100
11 100
100 11
1 100
12 111
12
100 12
12
100
12
112
100 12
recorded as a flow in the capital account and would be matched by income receivable in the current account. Economy C would record interest income only in proportion to the period for which it held the asset, and it would be measured as the difference between the amount paid for the accrued income asset and the amount received, which in this example is the coupon payment of 12 units less the purchase price of 11 units. No unrealized valuation changes are necessary for either economy B or C. Economy D would also record interest income, reflecting its provision of capital for year 2. The balance of payments accounts in Table 2 present the entries appropriate under accrual accounting.
Adopting the accrual method of accounting for income not only avoids the need for the valuation changes but also matches the cost of capital with the provision of the capital. It results in a more meaningful analysis of debt servicing in the short term and avoids the possible understatement of current income and, therefore, of current account
CHANGE OF OWNERSHIP AND TIME OF RECORDING 37
surpluses that, under a due-for-payment basis, could be achieved through judicious acquisition and disposal policies timed to avoid coupon dates.
A particular distortion arises in the case of deep-discounted bonds. These are issued with zero-coupon or low-coupon rates and at a discount that, on bonds with maturities of ten years or longer, can be 70 percent or more of the face value of the bond. The due-forpayment basis requires reporting this interest at maturity.
An argument for recording interest on a due-for-payment basis is that some instruments are not negotiable, and the income cannot be realized before the coupon date. This is analogous to recording wages only on payday or goods transactions according to payment terms. Another argument is that data are only available for contract terms. This is unlikely, given modern commercial accounting standards and practices.
Adopting the accrual method would result in interest being matched to the life of the debt while the capital account would reflect the increasing debt associated with accumulating interest. Stock data, incorporating the accrued interest (and dissected by maturity) would better reflect the liability of the debtor and the causes of that liability. Any asymmetry in current account measures of interest paid and received because of the inability of economies to report interest earned or accrued would be matched, and possibly be identifiable, by the asymmetry in the interest liability and asset reflected in the capital account.
Where royalty and other property income payments are also payable at discrete points in time and where such payments represent the use of an intangible asset over a number of time periods, again the accrual basis, rather than the due-for-payment basis, would result in a proper matching of the use of an asset and the cost of that use.
Provision and Time of Recording for Financial Items
The BPM (paragraph 360) defines transactions in financial items to involve, in general, change in legal ownership. The exceptions it allows to legal change of ownership are the substitution of an imputed financial claim for (1) immovable assets held abroad and nonfinancial intangible assets issued abroad; (2) assets attributed to a notional branch; and (3) goods transferred under a financial lease. In these instances real resources are deemed to have changed control, and a financing transaction is imputed as the balancing entry in the accounts.
38 EXTERNAL SECTOR TRANSACTIONS
It is useful to consider what legal change of ownership of a financial claim means in general. Must the claim be legally enforceable? Outstanding claims for payment of smuggled goods might not be legally enforceable but certainly should be recognized, as noted earlier, if the change of ownership of the physical asset has been recognized. For that matter, the claims to contraband might not be legally enforceable but, as noted above, the present analysis recognizes claims to ownership of goods as sufficient. The corollary is similarly to recognize claims to financial claims. (Analogous problems will apply to the valuation of claims, where the parallel market price may not be legally enforceable but will be honored.)
Contingent claims and liabilities are an area of possible confusion. For example, a transactor A expects to recognize a liability to another party B, but subject to the latter's having fulfilled certain terms and conditions of a contract. Presumably the liability is not legally enforceable until those terms are met. Such contingent liabilities will, in the normal course of events, be replaced by actual liabilities, and the recognition or otherwise of the contingent liability might be regarded largely as an issue of timing. In the above example, a buyer A enters into a purchase contract. At the time of the contract he recognizes a contingent liability to pay and arranges his finances accordingly. On delivery from B (or whenever stipulated by the contract), a legal liability is generated to replace the contingent liability. The accounts of buyer A might be as shown in Table 3.
The first four account entries in Table 3 represent useful planning and budgeting information. They do not, however, represent flows of real resources, nor do they represent the financing of resource flows or financial assets that can be used in final consumption or traded for assets that could be so used. Doubtless, the information is useful, but it does not find a place in the national accounts, which are designed to capture events, not anticipations. The appropriate time of recording is at the creation of the actual liabilities.
Overdue Obligations
The failure to deliver real resources according to contractual arrangements will not be recorded in the balance of payments. Shipping delays, production stoppages or other impediments to supply, or the refusal of buyers to take contracted tonnages are obvious concerns for balance of payments managers, but they do not represent transactions. No real resource has changed ownership. Although not representative of a change of ownership, the failure to meet financial
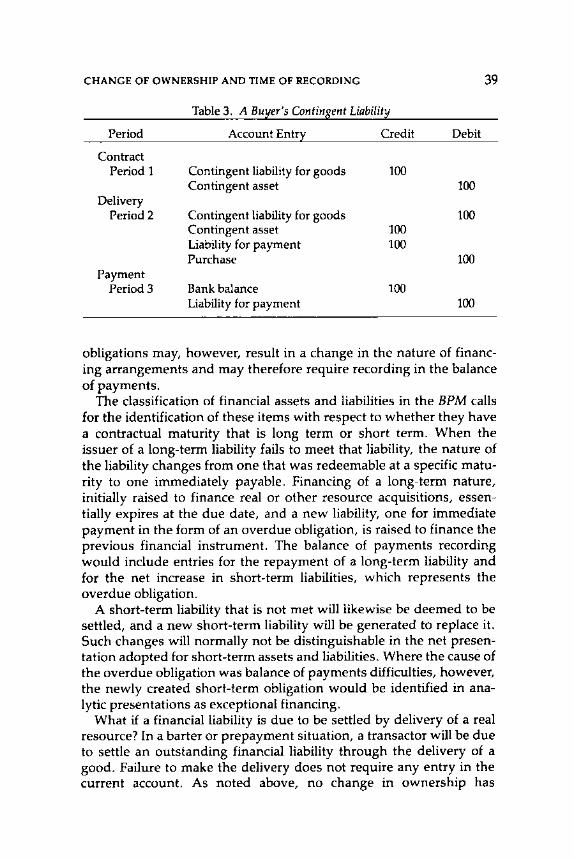
CHANGE OF OWNERSHIP AND TIME OF RECORDING 39
Table 3. A Bu~er's Contins.ent Liabilit~
Period Account Entr~ Credit Debit
Contract Period 1 Contingent liability for goods 100
Contingent asset 100 Delivery
Period2 Contingent liability for goods 100 Contingent asset 100 Liability for payment 100 Purchase 100
Payment Period3 Bank balance 100
Liability for payment 100
obligations may, however, result in a change in the nature of financing arrangements and may therefore require recording in the balance of payments.
The classification of financial assets and liabilities in the BPM calls for the identification of these items with respect to whether they have a contractual maturity that is long term or short term. When the issuer of a long-term liability fails to meet that liability, the nature of the liability changes from one that was redeemable at a specific maturity to one immediately payable. Financing of a long-term nature, initially raised to finance real or other resource acquisitions, essentially expires at the due date, and a new liability, one for immediate payment in the form of an overdue obligation, is raised to finance the previous financial instrument. The balance of payments recording would include entries for the repayment of a long-term liability and for the net increase in short-term liabilities, which represents the overdue obligation.
A short-term liability that is not met will likewise be deemed to be settled, and a new short-term liability will be generated to replace it. Such changes will normally not be distinguishable in the net presentation adopted for short-term assets and liabilities. Where the cause of the overdue obligation was balance of payments difficulties, however, the newly created short-term obligation would be identified in analytic presentations as exceptional financing.
What if a financial liability is due to be settled by delivery of a real resource? In a barter or prepayment situation, a transactor will be due to settle an outstanding financial liability through the delivery of a good. Failure to make the delivery does not require any entry in the current account. As noted above, no change in ownership has
40 EXTERNAL SECTOR TRANSACTIONS
occurred. Rather, the financial liability-financing an earlier delivery of goods (barter) or cash (prepayment) for which a specific maturity applied-has been replaced by a new obligation that calls for immediate settlement. The same treatment accorded long- and short-term financial obligations discussed above will apply in these instances.
V. Conclusions
Accounting systems can and have been designed to monitor a vast array of activities. Each such system has its purposes-for example, personnel management, cost control, work performance reporting. The national accounts are designed to monitor the economic performance of economies (and subsets of economies) by means of analysis of the real and financial stocks held by the economies and the flows of these resources.
Any consideration of accounting regimes for the external accounts and the balance of payments in isolation may involve a system of commitment or contingency recordings to provide plausible forecasting scenarios, a cash-based recording to monitor not financial but cash flows, or a transactions-based system designed to record real and financial resource flows. The choice of any such system is obviously at the discretion of the authorities.
But the choice of a balance of payments accounting system that is in harmony with the goals and objectives of national accounting implies correlation between the balance of payments and the external accounts of the SNA. To achieve such harmonization, it is necessary that the time of recording transactions within the system is consistently applied, so that:
• Ownership (however approximated) is the measure of economic wealth
• Ownership is uniquely determined for any occurrence
• The real and financial aspects of any transaction must be consis-tently recorded.
Without the first condition, the usefulness of the accounts for their stated purpose would be diminished or lost. The absence of the second condition could result in asymmetry, with transactors disparately recognizing transactions. Lack of the final condition could lead to asymmetry as the articulated nature of the accounts breaks down.
4
Conversion of Balance of Payments Transactions as a Source
of Valuation Changes: Problems, Principles, and Practical Solutions
PIERRE LUIGI P ARCU
C OMPILING A couNTRY's economic accounts requires the recording of a large number of transactions, many of which will be
expressed in a currency other than the unit of those accounts. For all such transactions, it will be necessary to convert the original values into the unit of account. When improperly conducted, however, conversion will introduce misleading information into the accounts. This problem can surface in compiling domestic transactions, but it will be most prevalent in compiling international transactions.
The first section of this paper discusses the concept of valuation change in order to clarify the nature of the problems encountered by compilers; it also examines the specific role of conversion in introducing valuation changes in the accounts. Section II discusses the theoretical solution to the conversion problem. Section III identifies some practical difficulties that any attempt to apply rigorous principles will unavoidably face and also develops some practical suggestions. Section IV discusses the conversion of resident-resident transactions. The final section briefly summarizes findings and offers some concluding remarks.
I. Valuation Changes and Conversion as a Source of Such Changes
Balance of payments and other external sector accounts are statistical statements that primarily record the value of transactions effec-
41
42 EXTERNAL SECTOR TRANSACTIONS
tively concluded between the residents of an economy and the rest of the world. A transaction should be recorded using the market price at which a good is acquired and disposed of by the parties involved in the transaction. This essential rule of recording implies that changes in the price of a good that occur before or after the moment at which the transaction price is defined in a contract are irrelevant for the compilation of the accounts. This point deserves clarification. The price of a good fluctuates over time as a result of changes in demand and supply for that good. From the point of view of the transactors and the compilers of the accounts, however, only the price specified in a given contract is relevant. As a consequence, any change in the price of the good being transacted-between the time the contract is concluded and the time of the acquisition and disposal of the good-is not part of the transaction but represents a valuation change. By convention, the accounts exclude all valuation changes unless and until they are realized under a new contract.
Some corollaries to the concept of valuation change deserve illustration. Valuation changes derive from the fact that, at the moment a contract is closed, the party acquiring a good assumes a valuation risk. The assumption of this risk is independent from, and antecedent to, the assumption of legal ownership of the asset and of the risks connected with it. For example, if cars being transported to a U.S. importer were lost, perhaps through a shipping accident, the importer would not be exposed to any loss if ownership of the cars still resided with the exporter. Figure 1 helps to distinguish between these two kinds of risks. The lower part of the figure shows how the ownership risk extends from the moment an economic entity receives delivery of an asset to the moment in which that entity delivers that asset to another entity. The upper part of the figure shows that the valuation risk for that asset starts at the moment an entity contracts to acquire that asset and ends when it enters into another contract to dispose of it.
As the price of an asset is fixed in a contract, the party disposing of the asset has no economic interest in price fluctuations for that particular asset once the contract is closed. From that point on, the party acquiring the asset bears the full economic burden of any change in its price. The shift of the valuation risk is full and immediate, a circumstance that gives added importance to the choice of the contract price as the price at which to record the transaction in the balance of payments and external sector accounts. A contract may not, however, specify a price for the transaction in question but may, instead, specify the basis on which to determine the contract price-for example, by reference to prices quoted on commodity markets at the time of delivery.
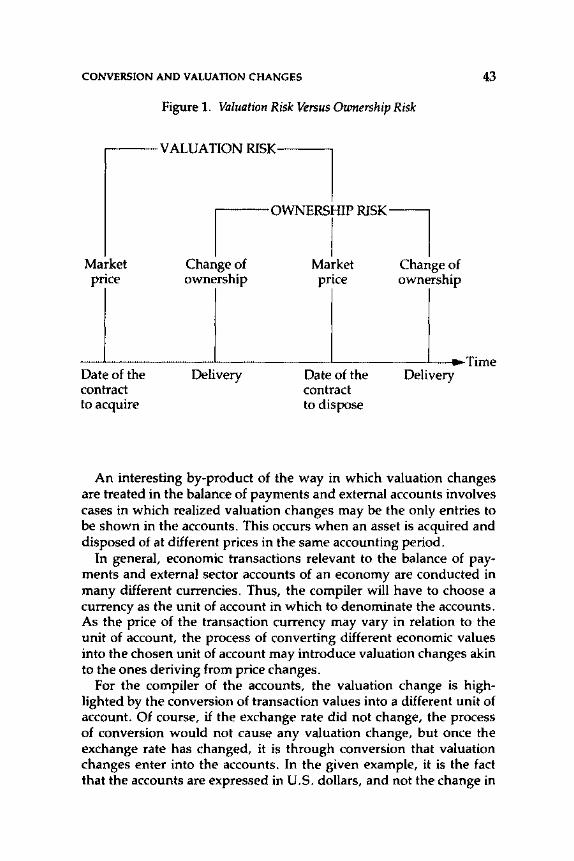
CONVERSION AND VALUATION CHANGES 43
Market
T Date of the contract to acquire
Figure 1. Valuation Risk Versus Ownership Risk
VALUATION RISK!
1 0WNERSr RffiK1 Change of Market Change of 0
~rip pr 0
~r: Time Delivery Date of the Delivery
contract to dispose
An interesting by-product of the way in which valuation changes are treated in the balance of payments and external accounts involves cases in which realized valuation changes may be the only entries to be shown in the accounts. This occurs when an asset is acquired and disposed of at different prices in the same accounting period.
In general, economic transactions relevant to the balance of payments and external sector accounts of an economy are conducted in many different currencies. Thus, the compiler will have to choose a currency as the unit of account in which to denominate the accounts. As the price of the transaction currency may vary in relation to the unit of account, the process of converting different economic values into the chosen unit of account may introduce valuation changes akin to the ones deriving from price changes.
For the compiler of the accounts, the valuation change is highlighted by the conversion of transaction values into a different unit of account. Of course, if the exchange rate did not change, the process of conversion would not cause any valuation change, but once the exchange rate has changed, it is through conversion that valuation changes enter into the accounts. In the given example, it is the fact that the accounts are expressed in U.S. dollars, and not the change in
44 EXTERNAL SECTOR TRANSACTIONS
the exchange rate per se that produces the valuation change in the statistics.
When transactions are expressed in different currencies, and exchange rates between currencies fluctuate widely, a second source of valuation changes acquires significance. When compiling a country's economic accounts in its preferred unit of account, the conversion of transactions originally expressed in a currency other than the unit of account may require the explicit inclusion of an account for valuation changes in the statistical statement.
II. The Solution in Principle
The analogy between valuation changes resulting from price changes and those stemming from exchange rate changes clarifies the nature of the problem for balance of payments and external sector accounting and also points to a theoretical solution. For changes in asset prices expressed in the transaction currency, the solution for ensuring that unrealized valuation changes are not included in the statistics has been to use the transaction price as defined in the contract. The advantage of this practice, besides its theoretical merits, is that it allows statisticians to adopt a consistent procedure for identifying a unique price at which to record a transaction. Price changes that occur after the contract is entered into should not affect the price at which the transaction is recorded, unless the contract allows for this possibility. Thus, irrespective of the market price when the change of ownership occurs, the accounts record the transaction at the contract price.
Similarly, the exchange rate that will establish a uniquely defined value for recording a foreign transaction denominated in a currency other than the unit of account is the exchange rate existing at the contract date. If this method is not applied, the market value in terms of a unit other than the transaction currency would not have to be a single, determinate value but could vary. This principle is set out in paragraph 123 of the IMP's Balance of Payments Manual (BPM).
In principle, subsequent conversions from the domestic unit of account to other currencies or units used as a standard for international comparison would not present further difficulty. As long as the conversion-directly from the original transaction currency or indirectly from the domestic unit of accounts-is made by using the exchange rate in existence on the day of the contract, no unrealized valuation change would be included in the statistics.
Restated, then, the principle is that only one exchange rate and one

CONVERSION AND VALUATION CHANGES 45
price exclude all kinds of unrealized valuation changes from the accounts: these are the exchange rate prevailing on the date of the contract and the price specified in the contract.
Although the principle of choosing the exchange rate prevailing at the date of the contract follows the logical analogy between the two kinds of valuation changes, it is useful to examine the limits of this analogy to appreciate better why the conversion problem is more difficult than that of pricing foreign transactions when conversion is not necessary.
Section I reviewed the question of who bears the risk of priceinduced valuation changes in the market value of assets that are exchanged and during the period that risk is borne. It should be reemphasized here that the market price that prevails when the valuation risk shifts is the one relevant for the definition of the contract price. For valuation changes stemming from a change in the price of the transaction currency, the situation is identical, irrespective of whether the transaction currency and the unit of account are the same. Such valuation changes do not show up in the accounts, however, unless the unit of account differs from the transaction currency, and conversion from the latter into the unit of account is necessary.
III. The Solution in Practice
Although the theoretical solution for avoiding the introduction of conversion-related valuation changes is clearly stated, its practical applicability, unfortunately, is severely limited by the lack of statistical information. The principle for conversion discussed in the previous section requires knowledge of the date of the contract of each transaction. But contract dates usually are not reported in documents available to the compilers. Furthermore, even in the rare instances in which the date of the contract is available, it would be extremely difficult to identify all the phases of a transaction that need to be converted using the exchange rate of the date of the contract.
Not surprisingly, a much simpler method is generally applied in practice. Transaction values are usually converted into the unit of account at an average rate for the period in which the transaction occurs. This commonly used method of conversion introduces unrealized valuation changes and also incorrectly eliminates some realized ones, as shown in the following example. Assume that, say, on a Monday a U.S. investor contracts to acquire a German bond for the price of OM 1,000, and that the deutsche mark-dollar exchange rate is OM 3 = US$1. The asset is delivered and paid for on, say, the Friday
46 EXTERNAL SECTOR TRANSACTIONS
of the same week when the exchange rate is OM 2 = US$1, and on that same day is sold for OM 1,000 to a German bank with the OM 2 = US$1 exchange rate still in force.l There are two transactions. Following the principle of conversion at the rate prevailing on the contract date, the U.S. accounts should show a debit entry of $333.3 for the acquisition of the bond and a credit entry of $500 for its sale. (Actually, because of net recording, only a net credit of $166.7 stemming from the realized valuation change should appear in the statistics.)
If in practice both transactions are converted at the period average rate for the week of, say, OM 2.5 = US$1, the debit entry for the purchase of the bond will be $400. This entry, when compared with the theoretically correct value of $333.3, introduces into the accounts an unrealized valuation change of $66.7. The sale of the bond, also converted at the weekly average rate, will result in a credit entry of $400, which, compared with the "correct" credit entry of $500, introduces another valuation error by excluding the realized valuation change.
Thus, the practical solution of using average exchange rates distorts the statistics. The degree of distortion will vary with several factors: the volatility of the exchange rates, the extension and variability of the time lag between the contracts and their realization, and the degree of dispersion of a country's transactions in many different currencies. At one extreme, exchange rate stability, the rapid execution of contracts, and a high concentration of transactions in the currency used as the unit of account are the conditions that minimize statistical distortions. At the other extreme, widespread exchange rate instability, marked variability in the pattern of trade, and dispersion in currency invoicing all add to the distortions.
There seems to be no doubt that the increased volatility of exchange rates in recent years has rendered the problem of conversion more severe and the practical compromise of using period average rates less reliable.
There may be additional practical compilation difficulties resulting from the necessity of converting from the domestic unit into another currency or unit of account used for international comparison. Because this further conversion should be implemented by applying the principle expounded in this paper, it would be necessary to maintain and use information on the date of contract to convert either directly, from the transaction currency to the international standard,
1 The price of the bond in deutsche mark does not change during the week under examination.
CONVERSION AND VALUATION CHANGES 47
or indirectly, from the transaction currency through the domestic unit into the unit of account used for the international standard.
Moreover, when the compiler has only aggregated data, it would not be feasible to apply anything but an average rate for the second stage of the conversion, even if the first stage of the conversion had been done at the correct exchange rate. This kind of practical difficulty, however, applies no matter which uniquely specified conversion method is used.
Any solution using a period average for conversion is a compromise dictated by considerations of statistical feasibility. Therefore, conceptually more satisfactory criteria for conversion should be used whenever possible. One good example is the recording of large transactions, such as the sale of a ship or an aircraft. In this case the source of information may be different from the trade returns and very likely will be sophisticated enough to allow the identification of the date of the contract.
Another case in which conversion at an average rate should be avoided is when stocks of assets at two balance-sheet dates are being compared. In the balance of payments this is particularly important when a compiler wants to calculate total changes in reserves. Conversion is necessary because the composition of reserves will, at least to some extent, reflect the composition of a country's trade, so that it is unlikely that any country will keep all of its reserves in the currency chosen as the unit of account. If a compiler wants to identify total changes in reserves between two balance-sheet dates, he cannot use period average exchange rates for conversion. Instead the compiler has to use the exchange rates at the beginning and end of each period and compute the difference between the two levels.
An example will help to clarify further the drawbacks of using period average rates. Assume that a country holds a part of its reserves in dollars and compiles the accounts in its own currency (OC). Assume, furthermore, that the stock of dollars the country holds is $1 million and, for the sake of simplicity, that these holdings do not change from the beginning to the end of the period. Consider now a case where the exchange rate between the country's domestic currency and the dollar changes during the period from US$1 per OC 1 to US$1 per OC 3. Conversion of the stock of dollars at the exchange rates in force at the beginning and end of the period will indicate a change (increase) of OC 2 million in the value of reserves. Applying the period average rate for converting the opening and closing balances would lead to the wrong conclusion: that is, that there had not been any change in the value of reserves when expressed in the unit of account. The problem here stems from the fact that stocks are
48 EXTERNAL SECTOR TRANSACTIONS
measurable only at precise points in time. Therefore, the use of a period average exchange rate (a "flow" rate) is clearly misleading.
lV. Conversion of Resident-Resident Transactions
The choice of the correct exchange rate for converting international transactions expressed in a currency other than the unit of account used to compile the balance of payments and external sector accounts is based on a clear principle. This section discusses how that principle extends to transactions among residents of the same economy that have to be included in the external accounts.
The accounts are not restricted to exchanges between residents of the compiling economy and nonresidents. Indeed, the accounts for the compiling economy should also include exchanges of financial claims on another economy between residents that do not belong to one and the same sector of the compiling economy.
The number of such transactions is quite large, since most international transactions trigger a related resident-resident transaction. For example, when an exporter sells foreign exchange acquired through his transactions with the rest of the world to a commercial bank or to the monetary authority in his economy, or an importer does the opposite, a transaction between residents of that economy is to be recorded in the accounts. Furthermore, there may be residentresident transactions that are not directly related to an international transaction. For instance, the private sector's acquisition (or disposal) of foreign exchange for speculative purposes, when contracted with another sector of the same economy, must be entered into the accounts. Often, however, such resident-resident transactions are expressed in the national currency and, therefore, will not present a conversion problem.
The conversion of resident-resident transactions can be best explained by reference to the transactions of an importer who is acquiring a foreign good and is paying for it in foreign exchange. For this purpose, it is assumed that the conclusion of the contract, the delivery, and the payment are all simultaneous and that at the time the contract is concluded the importer owns the foreign exchange for concluding the transaction (for example, in the form of a deposit in a foreign bank) and, hence, does not have to procure it. In such a case, the international transaction calls for a debit in the merchandise account, to reflect the import, and a credit in the account for shortterm assets of the private sector, to reflect the reduction in foreign assets. In principle, the compiler should convert the transaction at the
CONVERSION AND VALUATION CHANGES 49
market spot rate of the day of the transaction when expressing the accounts in national currency.
H, instead, the importer does not own the foreign exchange but contracts with a domestic commercial bank to make the payment in foreign currency on the day he contracts to acquire the import, the accounts should again show a debit entry for the merchandise import, but the credit entry should reflect the reduction in the shortterm assets of the commercial bank. The resident-resident transaction, which transfers the ownership of an amount of foreign exchange from the commercial bank to the private sector, will not show up in the accounts because the holdings of the private sector, which increase as a result of the purchase of foreign exchange from the commercial bank, are immediately brought back to their initial position by the payment abroad of the foreign exchange. The effect of the resident-resident transaction, albeit real, is offset immediately, and the accounts show only the entries for the merchandise import and the reduction in the commercial bank holdings. Even in this case, the resident-resident transaction does not create conversion problems.
When the time of the contract to buy the merchandise differs, however, from the time of the contract to buy the foreign exchange, conversion is more complex. If, for example, it is assumed that cars are paid for at delivery and the importer contracts to buy foreign exchange to pay for the cars on the day of delivery, the presence of a transaction between the importer and his commercial bank brings out any capital gain (or loss) the importer experiences, in terms of national currency, as a result of the lapse of time between the contract to buy the cars and the contract to buy foreign exchange. The exchange rate applied to the resident-resident transaction-the spot market rate at which the importer buys the foreign exchange from his commercial bank-is the correct one for that transaction, but it is not necessarily the rate to be used in converting into national currency and recording in the accounts the price contracted for the cars. The correct exchange rate for converting that price is the one prevailing when the purchase contract was concluded. In this example, the accounts should record the importer's realized capital gain (or loss) by an entry in the account of the private sector. The role of the resident-resident transaction is that of making explicit the loss or gain of the investor.
The point to be emphasized is that a conversion problem emerges only if there is a time lapse between the conclusion of a contract and its realization. Furthermore, the presence of a resident-resident transaction involving a foreign asset will make explicit, in terms of the national currency, the values to be attached to the entries in the accounts.
50 EXTERNAL SECTOR TRANSACTIONS
In summary, it can be said that in cases in which time plays a significant role-because of exchange rate changes between the contract of the international transaction and the contract of the related resident-resident transaction-a resident-resident transaction will bring out any capital gain or loss induced by the international transaction. Incidentally, the necessity of putting different values on the international transaction and the resident-resident transaction (that is, the need to convert them at different exchange rates) makes clear, in contrast with the case when there is no lapse of time between contracts or a lapse of time does not matter (because the exchange rate does not change), that the two transactions should be considered separately. Although an international transaction often triggers a resident-resident transaction, there are in fact two distinct transactions. The resident-resident transaction should not be seen as part of the contract concluded between the resident and the nonresident.
V. Conclusions
Converting different transaction currencies into a single unit of account tends to introduce valuation changes into the balance of payments and external sector accounts. This paper has argued that these valuation changes should be excluded from the statistics and that only one principle-conversion at the exchange rate prevailing at the date of the contract-completely guarantees this result.
An analysis of the widespread practical difficulties in correctly implementing this principle has led to a search for possible compromises between theory and statistical feasibility. In practice, the most commonly applied technique is to convert at the average market rate prevailing during the period in which the transaction occurred. The type of average (arithmetic or geometric) that should be used for this purpose is not a matter of great significance, since inexact results will be achieved by any practical method of conversion.
5
Currency Conversion in a Multiple Exchange Rate System
MARIANNE 5cHUIZE-GHAITAS
B ECAUSE DATA on economic transactions are frequently expressed in a variety of national currencies and, occasionally, in other units
of account such as the SDR, they can only be compared and aggregated if they are converted into a single unit of account. In a unitary exchange rate system, currency conversion is essentially a matter of determining the time period to which the conversion rate should relate. In contrast, in a multiple exchange rate system, currency conversion is complicated by the fact that at any time, the national currency is exchanged against any other currency at different rates, depending on the type of transaction or transactor (or both) involved. 1 In these circumstances compilers of national accounts and balance of payments statistics have to determine not only the time period to which the conversion rate, or rates, should relate but also the exchange rate at which a given transaction should be converted.
1 Although in a unitary exchange rate system buying and selling rates for foreign currencies differ by certain margins, these margins usually reflect normal costs and risks of exchange transactions and do not constitute separate exchange rates. Based on a standard of reasonableness for such margins, the IMF' s Executive Board has adopted the view that a multiple currency practice exists if, as a result of official action, spreads between buying and selling rates for spot foreign exchange exceed 2 percent, unless such spreads reflect additional costs and risks, or midpoint spot exchange rates for other members' currencies deviate by more than 1 percent and for more than one week from the corresponding rates derived from the spot exchange rates for these currencies in their principal markets. See Executive Board Decision No. 6790-(81/43), March 20, 1981, reprinted in Joseph Gold, SDRs, Currencies, and Gold: Sixth Suroey of New Legal Developments, Pamphlet Series, No. 40 (Washington: International Monetary Fund, 1983), pp. 107-08.
51
52 EXTERNAL SECTOR TRANSACTIONS
In a multiple exchange rate system there are, in principle, two possible methods for converting transactions denominated in foreign currencies into the national currency: conversion of each individual transaction at the exchange rate at which it was effected or conversion of all transactions at a unitary conversion rate. This paper examines these conversion methods in view of existing guidelines for the compilation of national accounts and balance of payments statistics. More specifically, it examines which of these methods agrees with the general principles of valuation and conversion underlying these guidelines and which method ensures that, for statistical purposes, the taxes and subsidies implicit in a multiple exchange rate system are treated like corresponding explicit taxes and subsidies in a unitary rate system. The main conclusion of the paper is that, given these criteria, conversion of all transactions at a unitary exchange rate is the appropriate conversion method in a multiple exchange rate system.
Multiple exchange rate systems can take various forms, ranging from relatively simple dual exchange rate systems, in which an official fixed rate for selected transactions coexists with another rate, fixed or floating, for the remaining transactions, to more complex systems with a large number of rates differentiated according to the type of transaction or transactor (or both). For the conversion problems arising in a multiple exchange rate system, these are differences of degree, not of substance. Moreover, it is also immaterial whether all exchange rates in a multiple exchange rate system are officially recognized. 2 Consequently, the arguments developed in this paper apply to multiple exchange rate systems in general, regardless of the form a particular system takes.
The paper is organized as follows. Section I briefly examines whether the conversion problems arising in a multiple exchange rate system can be avoided if national statistics are expressed in a unit of account other than the national currency. It argues that, under the circumstances most likely to prevail, compilers of national statistics will confront conversion problems no matter which unit of account they choose. Section II discusses the alternative conversion methods outlined above in view of the general principles of valuation and conversion underlying existing guidelines for the compilation of
2 In contrast, from the Fund's perspective, this distinction is crucial because the Fund's jurisdiction does not apply to multiple exchange rates arising from illegal markets for foreign exchange, unless these are officially recognized.
MULTIPLE EXCHANGE RATES 53
national accounts and balance of payments statistics. Section III focuses on the implications of each conversion method for the treat ment of the taxes and subsidies implicit in a multiple exchange rate system. Section IV discusses problems relating to the determination of a unitary conversion rate. Finally, the conclusions summarize main findings of the paper.
I. Can a Judicious Choice of Unit of Account Avoid Conversion Problems?
Because of the difficulties associated with determining the appropriate exchange rate for converting a given transaction from foreign into national currency in an economy that maintains a multiple exchange rate system, compilers of national accounts and balance of payments statistics may find it preferable to try to avoid conversion problems by expressing national statistics in a unit of account other than the national currency. This is possible when a country's economic transactions are exclusively denominated in one or more foreign currencies. When a country's transactions are not exclusively but predominantly denominated in foreign currencies, using a foreign currency as the unit of account does not avoid conversion problems, but it does reduce the errors that result if an inappropriate conversion method is applied.
Some countries maintaining multiple exchange rates have chosen to express the balance of payments in a unit of account other than the national currency. This option is also suggested in the fourth edition of the IMP's Balance of Payments Manual (BPM). The majority of transactions between residents of a country, however, are likely to be denominated in domestic currency. Thus, using a unit of account other than the national currency may avoid conversion problems in the case of balance of payments statistics, but it will do so by compounding these problems for the national accounts statistics-if these are expressed in the same unit of account-or by losing comparability between balance of payments and national accounts statistics, if the latter are expressed in national currency. Hence, compilers of national accounts and balance of payments statistics who wish to ensure the comparability of both systems will generally not be able to avoid or even substantially reduce the conversion problems arising from a multiple exchange rate system by expressing statistics in a unit of account other than the national currency.
54 EXTERNAL SECTOR TRANSACTIONS
II. Choice of Conversion Method: General Principles of Valuation and Conversion
Because current methodologies for national accounts3 and balance of payments statistics (for example, the BPM) establish general principles for the valuation and conversion of transactions, it appears appropriate to consider the application of these principles to the special conversion problems that arise in a system of multiple exchange rates. More specifically, the choice between the alternative conversion methods-between conversion of each individual transaction denominated in foreign currency into national currency at the rate at which it was effected, or conversion of all transactions at a unitary rateshould be based on these general principles.
To determine the value of a given transaction, generally an exchange of real or financial assets, compilers of economic statistics have to determine at least one, and frequently two, prices: the price of the good, service, or financial asset exchanged in terms of the currency in which the transaction was originally expressed, and, if this currency differs from the chosen unit of account, the price of that currency in terms of the unit of account. However, neither the price of a real or financial asset nor the price of a currency or unit of account in terms of another is a unique concept. Guidelines for the compilation of economic statistics, therefore, define the price that is to be used to determine the value of a given transaction in terms of the currency or unit of account in which it was originally expressed, as well as the exchange rate that is to be used to convert a transaction from one national currency or unit of account into another.
In the SNA and in the BPM, the recommendations about the valuation of transactions are based on the market price principle. The BPM (paragraph 76), following the United Nations' Provisional Guidelines (paragraph 6.5), defines a market price as "the amount of money that a willing buyer pays to acquire something from a willing seller, when such an exchange is one between independent parties into which nothing but commercial considerations enter.'' This definition neither implies that a market price is the price applicable to a set of supposedly identical transactions nor presupposes a certain market structure. Instead, it views a specific market price as relating to one spe-
3 The United Nations' A System of National Accounts (SNA) and Provisional International Guidelines on the National and Sectoral Balance-Sheet and Reconciliation Accounts of the System of National Accounts, Statistical Papers, Series M, No. 60 (New York, 1977).
MULTIPLE EXCHANGE RATES 55
cific transaction only, which may take place in any type of marketpurely competitive, monopolistic, or monopsonistic.
However, the definition of a market price outlined here draws a clear distinction between transactions carried out by independent parties and transactions that do not fulfill this criterion. The Brussels Definition of Value, 4 from which the criterion of independence is derived, stipulates that buyer and seller shall be considered independent of each other only if the price is the sole consideration relevant to a transaction and if
the price is not influenced by any commercial, financial or other relationship, whether by contract or otherwise, between the seller or any person associated in business with him and the buyer or any person associated in business with him, other than the relationship created by the sale itself . . . [and] no part of the proceeds of any subsequent resale, other disposal or use of the goods will accrue, either directly or indirectly, to the seller or any person associated in business with him.
For transactions between parties that do not fulfill the criterion of independence-for example, affiliated enterprises-the BPM (paragraph 82) suggests that any transfer prices associated with such transactions be adjusted to reflect market value equivalents.
In agreement with the principle of market price valuation, the BPM suggests that transactions should be converted from one unit of account into another at exchange rates that qualify as market prices in the above sense. More specifically, for the system of par values, the BPM (paragraph 127) recommended conversion at parity. For the currently prevailing system of floating exchange rates, the BPM (paragraph 128) suggested conversion at the exchange rate for spot delivery at the time of contract. s
In a system of multiple exchange rates, the question arises whether conversion at the rates prescribed for individual transactions agrees with the principles of valuation and conversion outlined above. Consider, for example, the following system. For a certain group of export goods, exporters have to surrender their foreign exchange proceeds at the exchange rate ev defined as the price of a foreign currency in terms of the domestic currency. For a certain group of import goods,
4 Customs Cooperation Council, General Secretariat, The Brussels Definition of Value for Customs Purposes: Its Origins, Characteristic Features, and Applications (Brussels, July 1972), Article II, p. 35.
s However, the BPM (paragraphs 131-33) recognizes that balance of payments compilers may find it difficult to determine the contract date of a transaction, and that, in practice, average spot rates for the period in which the transaction is recorded may have to be used for conversion.
56 EXTERNAL SECTOR TRANSACTIONS
importers purchase foreign exchange at the same rate. All remaining current and capital account transactions are settled at the rate e2,
which is floating freely. At e2 the domestic currency is more depreciated than at e1; that is, e1 < e2 • The question then is whether the exchange rate e1 qualifies as a market price in the sense of the BPM.
As emphasized earlier, the definition of market prices adopted in the BPM does not presuppose the existence of a unique price for a group of supposedly identical transactions. Therefore, the fact that, in a system of multiple exchange rates, foreign exchange transactions take place at different rates does not violate the principle of market rate conversion. However, the BPM concept of market prices presupposes independence of buyer and seller. In a system in which the seller of foreign exchange (in the above case, the exporter of those goods for which e1 is prescribed) is prevented by law from selling his foreign exchange proceeds at the most favorable available rate (that is, e2), the buyer (the government through the monetary authority or some other government institution) uses its legal authority over the seller to determine the purchase price for foreign exchange. In these circumstances, the criterion of independence of buyer and seller is not fulfilled, and the legally prescribed exchange rate e1 cannot be considered a market price.
The legally prescribed exchange rate e1 in the above example differs fundamentally from a legally prescribed unitary rate in a par value system. In a par value system it is the monetary authority that is required, by law, to buy and sell foreign exchange in order to keep the exchange rate within a given margin around par value. Private agents buy and sell foreign exchange at the existing rate because it is the current market price, not because they are prevented by law from concluding transactions at different rates. Hence, in contrast to the legally prescribed exchange rates in a multiple exchange rate system, exchange rates in a par value system qualify as market prices according to the definition outlined above. 6
If in the above example of a multiple exchange rate system the legal restrictions forcing certain sellers to sell at the rate e1 were removed, these sellers would clearly prefer to sell their foreign exchange proceeds at the higher price e2 . At the same time, buyers of foreign exchange, who previously could purchase at the preferential rate e11
6 The recommendation of the BPM (paragraph 127) regarding conversion in a par value system rests on the assumption that par values are, in fact, observed, and that the movements of the exchange rates within the margins, especially when averaged over a certain period, are sufficiently small to be neglected in conversion.
MULTIPLE EXCHANGE RATES 57
would be forced to pay a higher price. The system of multiple rates would be replaced by a unique equilibrium rate e0 • This rate qualifies as a market price, irrespective of whether it is floating freely (that is, is determined entirely by private demand for and supply of foreign exchange) or is kept within a more or less narrow band around a fixed value, because the monetary authority assumes responsibility for closing the gap between demand for and supply of foreign exchange at that rate. Hence, in a multiple exchange rate system only conversion at the equivalent of the rate e0 would be consistent with the principles of market price valuation and the conversion adopted in existing guidelines for national accounts and balance of payments statistics.
III. Choice of Conversion Method: Treatment of Taxes and Subsidies Implicit in a Multiple Exchange Rate System
In a system of multiple exchange rates, exchange regulations drive a wedge between the rates at which transactions are settled and the equilibrium exchange rate that would prevail if all transactions were carried out at a single rate.7 This creates a system of implicit taxes and subsidies.8 The following example illustrates this point.
Let q be the foreign currency price of a certain good (that is, the amount of foreign currency an exporter or importer receives or pays for that good); let p be the amount of domestic currency that an exporter or importer receives or pays for one unit of the same good; and lett denote the tax or subsidy rate. For a certain group of export and import goods, exporters or importers have to sell or buy foreign exchange at the rate e1, defined as the price of one unit of foreign
7 Note that this equilibrium exchange rate is not necessarily the free market rate that would prevail if all restrictions on foreign exchange transactions, and on international transactions such as import quotas, licenses, and so on were removed.
8 The equivalence of explicit taxes or subsidies and the taxes or subsidies implicit in a multiple exchange rate system is embodied in the Fund's concept of multiple currency practices. This concept relates to "effective exchange rates"; that is, the price of foreign exchange received or paid after allowing for taxes or subsidies that are closely related to foreign exchange transactions. However, whereas the Fund's concept of multiple currency practices considers only taxes or subsidies applying to the payments aspect of a transaction, as opposed to taxes or subsidies relating to the trade aspect, the discussion in this section applies to taxes or subsidies on international transactions in general.
58 EXTERNAL SECTOR TRANSACTIONS
currency is more appreciated than at the equilibrium rate e0 that would prevail if all current and capital account transactions were settled at the same rate, e1 < e0 • An exporter who is forced to sell his foreign exchange proceeds at the rate e1 < e0, and hence receives p = e1q = e~[l - (e0 - e1)/e0] in domestic currency for one unit of his export goods, is effectively taxed at the rate t = (e0 - e1)/e0 > 0. Similarly, an importer who is able to purchase foreign exchange at the rate e1 is effectively subsidized at the same rate. 9 In contrast, if the rate e1 were more depreciated than e0 (if e1 > e0), then exporters entitled to sell foreign exchange at the exchange rate e1 would be effectively subsidized at the rate t = (e0 - e1)/e0 < 0. Similarly, importers forced to purchase foreign exchange at the exchange rate e1
would be effectively taxed at the same rate. Depending on the exchange rate that is used to convert foreign
currency values into domestic currency, the domestic currency value of exports or imports will reflect the price the exporter or importer would receive or pay before paying or receiving the tax or subsidy implied by the exchange rate system, or it will reflect the price the exporter or importer receives or pays after paying or receiving this tax or subsidy. If, in the above example, the foreign currency value of exports is converted at the rate e1, the domestic currency value will reflect the proceeds the exporter receives after paying or receiving the implicit tax or subsidy. If, however, the foreign currency value of exports is converted at the rate e0, then the domestic currency value will reflect the proceeds that the exporter would receive before paying or receiving the implicit tax or subsidy. Similarly, if imports are converted at the rate e1, the domestic currency value will reflect the price the importer pays after receiving or paying the implicit subsidy or tax. If the same imports are converted at the rate e0, however, the domestic currency value will reflect the price the importer would pay before receiving or paying the implicit subsidy or tax.
Because the taxes and subsidies implicit in a multiple exchange rate system are equivalent to comparable explicit taxes and subsidies on international transactions in a unitary rate system, it appears appropriate to choose a conversion method that implies equal treatment of implicit and explicit taxes and subsidies. The BPM recommendations regarding the treatment of explicit taxes and subsidies on international transactions focus on the question of whether the payment or receipt of a tax or subsidy represents a resident-resident or a residentnonresident transaction. If explicit taxes or subsidies are paid or
9 Note that t > 0 implies a tax on exports and a subsidy on imports, whereas t < 0 implies a subsidy on exports and a tax on imports.
MULTIPLE EXCHANGE RATES 59
nonresident transaction. If explicit taxes or subsidies are paid or received by residents of the reporting economy, they represent resident-resident transactions, and the value of the transaction on which a given tax or subsidy is levied or granted should reflect the price that the resident of the reporting economy receives or pays before paying or receiving the tax or subsidy.
In the case of the exports in the example outlined above, the foreign importer pays q units of foreign currency for one unit of goods purchased from the domestic exporter. If the multiple exchange rate system were changed into a unitary rate system with the equilibrium rate e0, and if the implicit taxes or subsidies were replaced by explicit taxes or subsidies, the exporter would receive e~ units of domestic currency for one unit of export goods, on which he would pay or receive a tax or subsidy to or from his government equivalent to t = e~(e0 -
e1)/e0 • This tax or subsidy is a resident-resident transaction, since it is the exporter who actually pays or receives it. Consequently, the domestic currency value of the resident-nonresident transaction involved is e~; that is, the proceeds the exporter would receive before paying or receiving the tax or subsidy. Similarly, in a unitary rate system with explicit taxes or subsidies, the importer in the example outlined above would pay e~ units of domestic currency for one unit of import goods but would receive or pay a subsidy or tax equivalent to e~(e0 - e1)/e0, which would reduce or increase his cost to the equivalent of e1q. This subsidy or tax is a resident-resident transaction. Hence, the domestic currency value of the resident-nonresident transaction involved is e~; that is, the price the importer would pay before receiving or paying the subsidy or tax.
The argument outlined here can be summarized as follows. Since taxes or subsidies on exports and imports generally represent resident-resident transactions, the domestic currency value of a given export or import should reflect the domestic currency price the exporter or importer receives or pays before paying or receiving a tax or subsidy. 1o Consequently, if the taxes or subsidies implicit in a system of multiple exchange rates are to be treated like comparable explicit taxes or subsidies in a unitary rate system, the conversion method chosen must ensure that the value of exports or imports in terms of domestic currency reflects this price. As shown above, however, conversion at the exchange rates at which transactions are actu-
10 This recommendation agrees with the guidelines for valuation in international trade statistics suggested in the United Nations' International Trade Statistics: Concepts and Definitions, Department of Economic and Social Affairs, Statistical Office, Statistical Papers, Series M, No. 52 (New York, 1970), p. 43.
60 EXTERNAL SECTOR TRANSACTIONS
ally settled in a multiple exchange rate system implies that the derived value of exports or imports reflects the domestic currency price exporters or importers receive or pay after paying or receiving the taxes or subsidies implicit in the exchange rate system. Hence, conversion at the equivalent of the equilibrium exchange rate is required.
IV. Determining a Unitary Conversion Rate
The discussion in the preceding sections suggests that, from an analytical point of view, in a system of multiple exchange rates transactions denominated in currencies other than the chosen unit of account should be converted at a single conversion rate. 11 According to a recent survey, several countries maintaining multiple exchange rates have adopted unitary conversion rates at least in the area of foreign trade statistics.12 However, there is no detailed information about how this rate is defined.
In theory, the unitary rate at which transactions should be converted is the rate that would prevail if all foreign exchange transactions were carried out at the same rate. According to the BPM (paragraph 129), this "notional rate could be considered as the equivalent of either an equilibrium rate that the authorities would be able to defend under a system of fixed par values or a market rate prevailing under a regime of free floating." In practice, however, such a notional equilibrium rate cannot easily be determined. In general, the exchange rate that would prevail if all foreign exchange transactions were carried out at the same rate depends not only on the price elasticities of the different components that constitute total demand for and supply of foreign exchange but also on a whole range of potential policy measures, including compensatory financing transactions and direct central bank interventions in the foreign exchange market, designed to influence the exchange rate according to given policy objectives.
Recognizing that a notional equilibrium rate cannot be determined without detailed knowledge about the structure of the economy in question and about the policy assumptions that should reasonably be
11 For an alternative view, see International Monetary Fund, International Financial Statistics, Supplement on Exchange Rates, Supplement Series, No. 9 (Washington, 1985), p. vii.
12 Dev Kar, "Currency Invoicing and Exchange Conversion in International Trade," Papers in International Finance Statistics, PIFS/86/1 (Washington: International Monetary Fund, February 14, 1986).
MULTIPLE EXCHANGE RATES 61
made, the BPM does not provide specific recommendations for defining the appropriate single conversion rate. This lack of detailed guidelines leaves room for defining unitary conversion rates that suit the specific conditions in individual countries, but it also leaves ample scope for defining conversion rates that are not necessarily "realistic." A more standardized approach taken by the Fund staff is to construct a weighted average of the different exchange rates observed in a multiple exchange rate system, the weights being the estimated shares of the transactions effected at a particular rate. Admittedly, this is but one possible approach to approximating the notional equilibrium rate.
V. Conclusions
The major findings of this paper can be summarized as follows.
• Compilers of national accounts and balance of payments statistics who wish to ensure the comparability of these statistical systems will in general not be able to avoid conversions involving the national currency, irrespective of what unit of account they choose.
• Given the necessity to convert transactions denominated in foreign currency into domestic currency, or vice versa, compilers operating in a multiple exchange rate system have to choose between two possible conversion methods: conversion of each transaction at the exchange rate at which it was effected, or conversion of all transactions at a unitary conversion rate.
• From the point of view of existing guidelines for the valuation and conversion of transactions, which are based on the market price principle, conversion at a unitary exchange rate is preferable because the different rates at which transactions are effected in a multiple exchange rate system do not qualify as market prices according to the definition adopted in these guidelines.
• From the point of view of the taxes or subsidies implicit in a multiple exchange rate system, conversion at a unitary exchange rate is preferable because it ensures that, for statistical purposes, these implicit taxes or subsidies are treated like corresponding explicit taxes or subsidies in a unitary rate system. More specifically, conversion at a unitary exchange rate ensures that the domestic currency value of a given transaction reflects the amount the transactor would receive or pay before paying or receiving an explicit tax or subsidy.
• The unitary conversion rate at which all transactions in a multiple exchange rate system should be converted is the equilibrium
62 EXTERNAL SECTOR TRANSACTIONS
exchange rate that would prevail if all transactions were effected at the same rate. This notional equilibrium rate cannot be easily determined because it depends on the price elasticities of the different components that constitute total demand for and supply of foreign exchange, as well as potential policy measures designed to influence the exchange rate according to given policy objectives. One possible approach to approximating such a rate is to construct a weighted average of the different exchange rates observed in a multiple exchange rate system, the weights being the shares of the transactions effected at a particular rate.
6
Treatment of Exchange Rate Differentials
in the National Accounts
}AN VAN TONGEREN
T HE UNITED NATIONS' A System of National Accounts (SNA) does not explicitly deal with the question of exchange rate differentials
that is, income generated by banks and government authorities holding foreign exchange as a result of differences in the purchase and sale prices of foreign currency. This paper offers suggestions on how to deal with this question, covering three situations: stable monetary conditions, volatile changes of exchange rates over time, and multiple exchange rate regimes.
On the basis of the general principles of the SNA, and taking into account practices in a limited number of countries, the paper develops the following proposals.
• Distinctions should be made within the exchange rate differentials among three components-bank service charges, capital gains or losses, and taxes or subsidies.
• Global adjustments for bank service charges and taxes or subsidies under multiple exchange rate regimes should be included in the external account of the SNA, so that individual categories of transactions (exports, imports, and so on) reflect the actual transaction values, whereas the balances of the external account reflect the adjustments for differences between purchase and sale prices of foreign currency.
• Adjustments should be applied to all external transactions, except those in kind; these adjustments should be based on an equilibrium exchange rate that would have existed if no government monetary controls had been in effect.
63
64 EXTERNAL SECTOR TRANSACTIONS
• Taxes or subsidies, including the bank service charges on foreign exchange, should be allocated directly to the government sector; bank service charges on foreign exchange should be treated as payments by the government to banks for services received from banks in implementing the government's exchange rate policy.
• No adjustments should be made for exchange rate change over time. Revenues derived from those changes should be treated as capital gains or losses.
• Because the exchange rate differentials do not accrue only on goods and services but also on other external transactions, the adjustment for taxes or subsidies should distinguish between indirect taxes or subsidies, direct taxes (including negative direct taxes), and capital transfers.
The SNA and recent discussions during its review have focused on the role of banks in the redistribution of financial capital and on the service charges implicit in the interest flows to and from banks. Until now no concerted attention has been paid to the service charges implicit in exchange rate differentials, which derive from the difference between banks' purchase and sale prices for foreign currency. The same questions raised about the bank service charges implicit in interest flows-that is, how they are to be measured, treated, and allocated-need to be answered with regard to the role of banks in the foreign currency market. Other questions unique to exchange rate differentials also merit attention.
Until several years ago, questions about exchange rate differentials were relevant, but quantitatively unimportant, and therefore the SNA does not mention this factor explicitly. There was a difference between the purchase and sale prices of foreign currency, but the difference was very small because foreign exchange rates were generally stable over time and did not differ for transactions that took place at the same time. In addition, national accountants found it difficult to identify the differentials separately, since information was often hidden in data on other revenues of banks and allocated together with those revenues. The situation has changed considerably in recent years. Fixed exchange rates have been replaced by floating rates that, in some countries, change frequently and considerably over time, and other countries have introduced multiple exchange rate regimes that maintain different exchange rates for different transactions at the same time. As a result, substantial exchange rate differentials are affecting the profits and losses of banks or government agencies that maintain foreign currency reserves. They also influence
EXCHANGE RATE DIFFERENTIALS 65
the profits or losses and retained earnings of other nonfinancial enterprises that are engaged in the export or import of goods and services or that make or receive foreign payments for the transfer of profits, external debt, and so on.
This paper supplements two parallel papers written by staff members of the IMF: one on multiple exchange rates (Chapter 5 in this volume), and another on changes that occur in exchange rates over time (Chapter 4 in this volume). These two papers focus primarily on the exchange rate conversion of transactions in the balance of payments and external account. The present paper deals with the treatment of exchange rate differentials, not only in the external account but also in the accounts of other sectors included in the national accounts (particularly the banking sector), and with the effects on gross domestic product (GOP) and its components. The conclusions reached in the paper are in line with those of the cited papers: to use a uniform rate of exchange in circumstances of multiple exchange rate regimes (Chapter 5) and not to include changes in exchange rates over time (Chapter 4).
The remainder of the paper is organized as follows. Section I reviews country practices in foreign exchange controls and shows how they would affect the national accounts aggregates if no adjustments were made. It distinguishes among the three situations earlier identified: stable monetary conditions with minor differences between sale and purchase prices of foreign currency; considerable changes over time in the local value of foreign currency; and, finally, multiple exchange rate regimes. Section II includes proposals to adjust the national account aggregates for exchange rate differentials in order to avoid anomalies. It distinguishes among three components of exchange rate differentials that should be treated differently in the national accounts-bank service charges, taxes or subsidies, and capital gains or loses-and shows what consequences these treatments have for the valuation of stocks and flows of foreign exchange and other national account transactions that are supported by the purchase and sale of foreign currency. Section III discusses the measurement of exchange rate differentials and the derivation of a uniform or accounting exchange rate. Section IV includes a quantitative example based on adjusted 1983 national accounts data for Venezuela. This example illustrates the proposed treatment of foreign exchange differentials in the national accounts and assesses the sensitivity of GOP and other macroeconomic aggregates to different assumptions made in the national account compilation regarding the value of exchange rate differentials.
66 EXTERNAL SECTOR TRANSACTIONS
I. Foreign Exchange Policies Affecting National Account Aggregates
To date there has been limited experience with the treatment of exchange rate differentials in the national accounts. The experiences of three countries-El Salvador, Colombia, and Jamaica-have been described by Pinot de Libreros in two papers. 1 A fourth experience was described by officials from Venezuela, also in the context of review of the SNA.2
The four practices, which refer to the mid-1980s, are different and can be summarized as follows.
• El Salvador had three exchange rates: an official rate, a free bank rate, and a black market rate. The government had direct control over the first two. The official rate of the U.S. dollar was the lowest and was fairly stable. The free bank rate was higher and varied according to the supply of and the demand for foreign currency for transactions that the government allowed to take place in the foreign currency market. The black market rate varied considerably over time, and the government had very little control over it.
• In Colombia, two rates were in effect: an official rate controlled by the Banco de la Republica and a black market rate. The official rate was flexible and had changed considerably over time, resulting in a peso value of the dollar that was, by the mid-1980s, more than ten times higher than it was in 1970. As a result of the flexible central bank exchange rate policy, the black market rate was not significantly different from the official rate.
• In Jamaica, according to Pinot de Libreros' description, three rates
1 Marion Pinot de Libreros, "Effects of Devaluation on the Calculation of How of Funds Accounts," paper presented at the Nineteenth General Conference of the International Association for Research in Income and Wealth (IARIW), Noordwijkerhout, Netherlands, August 1985; and "Los mercados multiples de cambio y su tratamiento en Cuentas Nacionales" (Multiple Exchange Rate Markets and Their Treatment in the National Accounts), paper presented at the Regional Seminar on National Accounts, UN Economic Commission for Latin America and the Caribbean (ECLAC), Santiago, Chile, April1986.
2 Banco Central de Venezuela, "Experiencias y dificultades de Venezuela en el tratamiento de los cambios multiples en el Sistema de Cuentas Nacionales" (Experiences and Difficulties in Venezuela in the Application of Multiple Exchange Rates in the SNA), paper presented at the Regional Seminar on National Accounts, ECLAC, Santiago, Chile, April1986.
EXCHANGE RATE DIFFERENTIALS 67
existed in the mid-1980s: two official rates-one for trade with Caribbean Community (CARICOM) countries and another for foreign exchange transactions with other countries-and a free or black market rate. Subsequently, the government abandoned the official rates and tried to control the market rate through a system of auctions for foreign exchange.
• Venezuela had a dual market for foreign exchange. The first was a low rate for the U.S. dollar, which was fully controlled by the government. This rate held for the exchange of dollars obtained from oil exports and for the use of those dollars by the oil industry and some other sectors importing essential goods. It also was used by the government and public enterprises to repay the foreign debt principal and interest and to provide education grants for studies abroad. The dollars obtained from, or needed for, these transactions were directly sold to or purchased from the central bank. A higher exchange rate for the dollar held for the remaining transactions, which could be either exports of industries that the government tried to stimulate or imports that it wanted to discourage. The higher dollar rate was not a black market rate. In effect, the Central Bank of Venezuela was the main supplier of dollars, providing private banks and other foreign exchange dealers with dollars in order to influence the free market price.
If no adjustments were made, there would be three main effects on the local currency value of external transactions and on other national account aggregates as a result of multiple exchange rate regimes, rapid changes of exchange rates over time, and regular differences between the purchase and sale prices of foreign currency.
The first effect is on the foreign trade balance. If expressed in local currency,it may be smaller or larger than the balance in foreign currency relative to the size of exports or imports. The same may hold for the current balance of the external account. It may show that the current surplus that supplements domestic savings in financial capital formation is lower or higher in terms of local currency than the value of current revenues from or disbursements to other countries, when this relative value is compared with its foreign currency equivalent. When the difference between purchase and sale values of foreign currency is large, the foreign trade or current external balance may even have a different sign when expressed in foreign exchange units compared with the balance in local currency units. This may occur when imports or other disbursements to the rest of the world take place at exchange rates that are much higher in terms of local currency than the exchange rates used for the local currency conversion
68 EXTERNAL SECTOR TRANSACTIONS
of exports or other revenues. Under multiple exchange rate regimes, this effect on the foreign trade balance may be a direct consequence of the government's foreign exchange policy. In the case of rapid changes over time in the rates of exchange for foreign currencies, the effect may happen because export revenues and other revenues may be received at the beginning of the year, when the exchange rates are still low, whereas import payments or other disbursements abroad may be made toward the end of the accounting period, when exchange rates have already increased considerably.
Another effect is on the value added in industries that export or import goods and services and on the profits and retained earnings of enterprises that pay interest, dividends, and other property income to nonresidents or receive revenues on investments abroad. The value added, profits, and retained earnings calculated in local currency are affected by the same discrepancies between the value at which foreign exchange receipts are converted to local currency and the value at which foreign currency is purchased in order to import goods and services and to pay dividends, interest, and so on to nonresidents.
Finally, the exchange rate differentials may cause inconsistencies in the national accounts. One reason would be because the accounts of the central bank or any other government authority that holds foreign currency would record exchange rate differentials as a revenue, while there is no explicit counterpart in accounts of other sectors in the national accounts. A further inconsistency may arise because the foreign exchange authority calculates the exchange rate differentials by using a valuation of foreign exchange balances that is different from the stock valuation measures used by other sectors in the national accounts or recommended in the national accounts.
II. Components of Foreign Exchange Rate Differentials
Exchange rate differentials refer to the income accruing to banks or government agencies holding foreign currency reserves that arises from differences between the sale and purchase prices of foreign exchange. More precisely, exchange rate differentials are an aggregate of three components: a bank service charge, a tax or subsidy, and a capital gain or loss. The three components can be associated with the three types of exchange rate circumstances cited earlier in this paper. The distinction among the three components is necessary, since each refers to transactions that are treated differently in the SNA.
EXCHANGE RATE DIFFERENTIALS 69
Bank Service Charges
The bank service charge is based on the difference between sale and purchase values of foreign currency; the charge is always maintained, even under circumstances of monetary stability. Under stable conditions, the difference between sale and purchase values is generally small and includes only the implicit bank service charge. This was the situation in most countries before the fixed exchange rate regime was abandoned.
The implicit service charge is imposed in the domestic territory by resident financial institutions. Implicit charges are reflected in all foreign exchange transactions: a higher price is charged for foreign exchange to those that need to make payments to entities abroad and a lower rate is applied to those who receive foreign currency from abroad. This implies that receipts from abroad expressed in local currency are net of the implicit bank charges, whereas payments to entities abroad expressed in local currency include the charges that banks impose through their higher sale rate for foreign currency. Because exports are valued f.o.b. (free on board) in the national accounts and imports are recorded ci.f. (cost, insurance, freight), however, the implicit bank service charges thus imposed by domestic institutions should not be deducted from exports and should not be included in imports. For reasons of consistency, a similar treatment should be accorded to other receipts from and payments to other countries. The implication of this suggestion is that payments to and receipts from abroad should be recorded at the same rate of exchange if the bank service charge is the only difference between the purchase and sale values of the foreign exchange. This uniform exchange rate will be referred to here as the "accounting exchange rate."
Taxes or Subsidies
The tax or subsidy component exists under multiple exchange rate regimes when the central bank or government monetary authorities stipulate that different rates of exchange must be paid or received for different transactions, favoring some sectors and discouraging transactions carried out by other sectors. The exchange rate differential caused by multiple exchange rate regimes should be considered a tax or subsidy because the exchange rate policy influences the prices or values of transactions that are expressed in local currency.
The tax or subsidy component should be calculated in a way similar to the treatment of the implicit bank service charge, described above. Assuming that there are no exchange rate changes over time and no
70 EXTERNAL SECTOR TRANSACTIONS
explicit bank service charges, the total tax or subsidy component should be based on the difference between the sale and purchase values of the foreign currency. The difference with the bank service charge is that, under multiple exchange rates, the banks' sale prices of foreign currency for some imports and other payments to entities abroad might be low because the government considers these transactions essential, whereas the banks' purchase prices of foreign currency for some exports and other receipts from abroad, which the government wants to promote, might be high. The government's total tax receipts may even be negative, and thus turn into a subsidy, when the external receipts and payments based on "promotional" exchange rates dominate the external transactions of the country. Because the government is a domestic institution that imposes the tax or grants the subsidy, the implicit taxes and subsidies should not affect the foreign trade and other balances of the external account for the same reasons that held for bank service charges. This implies that exports and other receipts from abroad should be recorded in the external account before taxes are deducted or subsidies are granted, and that imports and other payments to entities abroad should be registered net of taxes to be imposed or subsidies to be granted.
Several complications should be considered before this treatment is adopted. One question that needs to be resolved is how to treat the exchange rate differential caused by foreign currency purchases and sales that are not channeled through the central bank or other government exchange authority but are carried out by private banks and foreign exchange dealers. For exarr.ple, in Venezuela during the period of multiple rates in the mid-1980s the private banks operating in the free exchange market purchased dollars at a much higher rate than the Central Bank. To stimulate production in selected industries, the government allowed certain exporters to change their dollars in private banks at the much higher rates. This implied a subsidy for these exporters, and the local currency price of those exports is thus a consequence of a government policy. Similarly, importers of nonessential goods were forced by the government to purchase their dollars in the free exchange market. Those imports were thus implicitly taxed. The difficulty was that private banks cannot really impose taxes or grant subsidies. But the problem seems more difficult than it really is. First of all, the private banks do not pay the subsidy or receive the indirect tax because they establish only a small difference between purchase and sale prices of foreign currency and generally maintain small foreign exchange balances. Implicit indirect taxes and subsidies therefore cancel out. If, however, banks would benefit from the exchange rate policies and would not have to transfer a part of the
EXCHANGE RATE DIFFERENTIALS 71
differentials to the government, a subsidy would have to be imputed from the government to the private banks, which would reflect the extra benefits such banks receive from the government's exchange rate policy.
The second problem concerns the taxes and benefits (subsidies) that are a consequence of the government's policy. In the example above, it was assumed that only exports and imports were affected. In practice, however, the policy also affected other external transactions. In Venezuela, it also affected payments of the external public debt principal and interest, and foreign currency grants for Venezuelans studying abroad. This immediately raises the question of whether all implicit taxes and benefits should be considered indirect taxes and subsidies. There are three ways of approaching this matter.
One way would be to channel implicit taxes and benefits through the bank service charge. Doing this would imply that the government's exchange rate policy affects the market value of bank services and, through those services, the prices of exports and imports and the value of other transactions in foreign currency. The consequence of this treatment is that all taxes and benefits could be considered indirect taxes and subsidies, since they would be levied or granted on (bank) services. With this treatment, however, the value of bank services could become negative, particularly if the service charges were allocated to sectors. This is so because the size of subsidies in some sectors might be much higher than the value of the foreign exchange bank service charges excluding the subsidies. Hence this alternative is not very attractive.
Another possibility is to deal with bank services and taxes and benefits separately and to allocate the taxes minus benefits directly to the government. The consequence is that taxes and benefits levied or granted on external transactions other than exports or imports of goods and services cannot be considered indirect taxes or subsidies. They are levied or granted on other revenue or expenditure components that do not form part of the production cost, and those taxes and benefits therefore do not immediately affect the prices of goods and services. It is suggested that they be treated as direct taxes when levied on transactions of the income and outlay account (for example, payment of interest on the public debt or the transfer of education grant funds) or as capital transfers when they are levied on transactions of the capital (accumulation or finance) account (for example, repayment of the public debt principal). There are some disadvantages to this treatment. Contrary to what is now recommended in the SNA, one would have to deal with negative direct taxes when implicit benefits are paid on transactions in the income and outlay accounts.
72 EXTERNAL SECTOR TRANSACTIONS
Such a concept, however, is not completely unknown at present, because some countries (for example, the United States) have introduced tax systems whereby explicit tax benefits are paid to taxpayers when their income is below a minimum level. The SNA may therefore have to be revised on this point.
A third possibility is to allocate the taxes minus benefits, including the bank service charge, to the government. This treatment implies that foreign exchange bank services are charged to the government, since banks help the government to implement the exchange rate policy. This treatment has several advantages: the bank services need not be allocated to sectors, and thus the problem of measuring those services for each sector is avoided. Negative bank service charges could not occur, and one also avoids changes in the actual values of external transactions as a result of the inclusion of the implicit bank service charges.
The last question that should· be dealt with here is the allocation of the implicit taxes and subsidies to the activity or institutional sectors of the economy that are affected by the exchange rate policy of the government. There is much analytical and policy interest in this allocation. From an accounting point of view, however, there are some disadvantages of trying to build the allocation into the national accounting framework. One would be that all transaction values in the external account would be changed, and the change is dependent on the accounting exchange rate selected. Also, input-output rela tions would be distorted, since both gross output and intermediate consumption of those sectors that are involved in the export or import of goods and services would be changed by the amount of indirect taxes minus subsidies. Because these sectors base their costing procedures on the actual prices that they pay or receive in local currency, the analysis of technical behavior of those industries would be distorted.
To avoid the distortions, it is preferable to treat the adjustments for taxes and benefits as global adjustments in the external account and to allocate foreign exchange bank service charges directly to the government sector, as suggested above. For analytical uses, the global adjustments could be supplemented, however, by an alternative presentation of data in which the taxes and benefits and bank service charges are allocated to activities and sectors.
Capital Gains or Losses
With the abandonment of the fixed exchange rate regime, exchange rates started to fluctuate, and in some countries they rose or fell
EXCHANGE RATE DIFFERENTIALS 73
continuously over time. Thus banks accrued revenues that were in fact realized capital gains net of losses. The capital gains or losses should not be included in the flow accounts of the SNA, however, but should be dealt with in the reconciliation accounts, where all valuation changes in assets are recorded.
Before this treatment in the SNA accounts is illustrated, an explanation is needed about what is meant by capital gains and losses, which are only summarily treated in the SNA (paragraph 6.109) or defined in the Provisional Guidelines (paragraph 6.21) on balance sheets.3 The explanation is given with the help of Table 1. The table presents an illustrative example showing the bank's balances (b) of U.S. dollar holdings at the end of 1985, the purchases (p) and sales (s) that took place during 1986, and the final balance of U.S. dollar holdings at the end of that year. The transaction value of balances, purchases, and sales is presented in U.S. dollars in the second column of the table. This information is converted to local currency values in the third column using the actual exchange rates at which dollars are purchased and sold during the year, as shown in the fourth column. It is assumed here that there is no difference between the sale and purchase values of U.S. dollars and that there is therefore no implicit bank service charge. The capital gains accruing to the banks are calculated each time dollars are purchased or sold, and they are presented in the last column of the table. For example, the capital gains of 1,160 accruing on March 3, 1986, are calculated as the change in the value of the balances of U.S. dollar holdings before the purchase on that date, as a result of changes in the exchange rate between February 1 and March 3, 1986 (1, 160 = 290 (9 - 5)). The subtotals of capital gains and net purchases minus sales in terms of U.S. dollars and local currency are presented at the bottom of the table. The net total of the capital gains (5,350) is equal to the difference between the closing and opening values of the stock of U.S. dollar holdings converted to local currency at the beginning and end of 1986 (4,900 = 6,000 - 1,100) minus the difference between purchases and sales of foreign currency ( -450) valued in local currency at the subsequent exchange rates at which sales and purchases were carried out. Capital gains and losses defined in this manner are consistent with the valuation of purchases and sales of foreign currency at their actual exchange rates.
This example illustrates a situation whereby the net purchases of foreign currency by the central bank in terms of U.S. dollars is posi-
3 United Nations, Provisional International Guidelines on the National and Sectoral Balance-Sheet and Reconciliation Accounts of the System of National Accounts, Statistical Papers, Series M, No. 60 (New York, 1977).
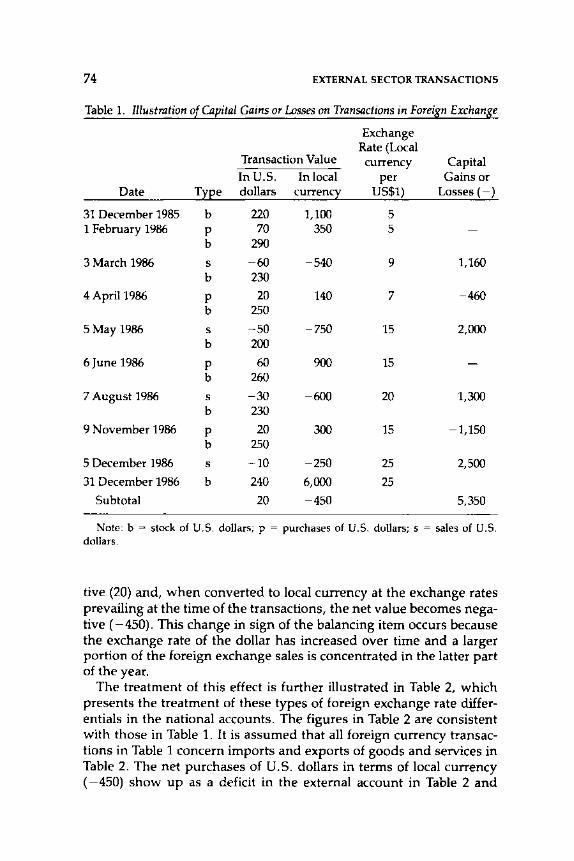
74 EXTERNAL SECTOR TRANSACTIONS
Table 1. Illustration o[ Capital Gains or Losses on Transactions in Foreiz.n Exchanz.e
Exchange Rate (Local
Transaction Value currency Capital In U.S. In local per Gains or
Date T:n~e dollars currenc;t US$1) Losses(-)
31 December 1985 b 220 1,100 5 1 February 1986 p 70 350 5
b 290
3March 1986 s -60 -540 9 1,160 b 230
4 April1986 p 20 140 7 -460 b 250
SMay 1986 s -50 -750 15 2,000 b 200
6June 1986 p 60 900 15 b 260
7 August 1986 s -30 -600 20 1,300 b 230
9 November 1986 p 20 300 15 -1,150 b 250
5 December 1986 s -10 -250 25 2,500
31 December 1986 b 240 6,000 25
Subtotal 20 -450 5,350
Note: b = stock of U.S. dollars; p = purchases of U.S. dollars; s = sales of U.S. dollars.
tive (20) and, when converted to local currency at the exchange rates prevailing at the time of the transactions, the net value becomes negative ( -450). This change in sign of the balancing item occurs because the exchange rate of the dollar has increased over time and a larger portion of the foreign exchange sales is concentrated in the latter part of the year.
The treatment of this effect is further illustrated in Table 2, which presents the treatment of these types of foreign exchange rate differentials in the national accounts. The figures in Table 2 are consistent with those in Table 1. It is assumed that all foreign currency transactions in Table 1 concern imports and exports of goods and services in Table 2. The net purchases of U.S. dollars in terms of local currency ( -450) show up as a deficit in the external account in Table 2 and
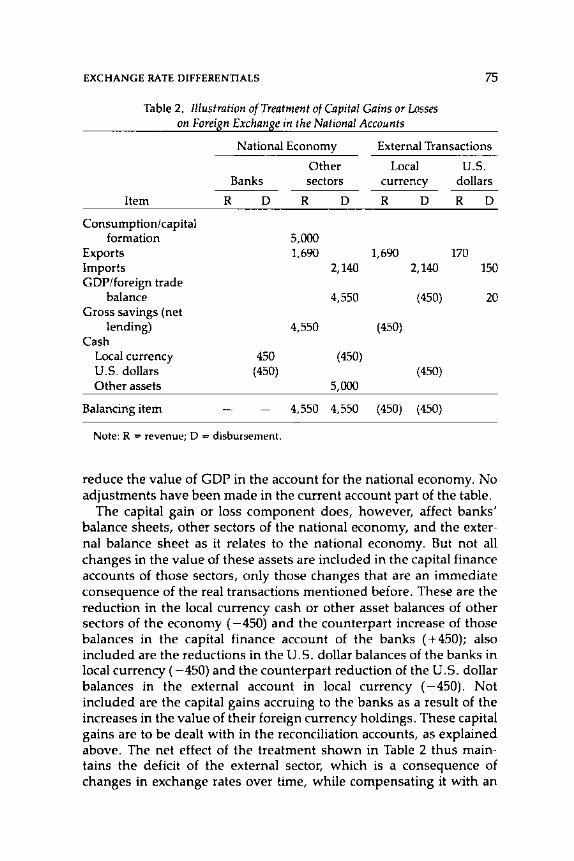
EXCHANGE RATE DIFFERENTIALS 75
Table 2. Illustration of Treatment of Capital Gains or Losses on Foreis_n Exchans_e in the National Accounts
National Economy External Transactions
Other Local u.s. Banks sectors currency dollars
Item R D R D R D R D
Consumption/capital formation 5,000
Exports 1,690 1,690 170 Imports 2,140 2,140 150 GOP/foreign trade
balance 4,550 (450) 20 Gross savings (net
lending) 4,550 (450) Cash
Local currency 450 (450) U.S. dollars (450) (450) Other assets 5,000
Balancing item 4,550 4,550 (450) (450)
Note: R = revenue; D = disbursement.
reduce the value of GOP in the account for the national economy. No adjustments have been made in the current account part of the table.
The capital gain or loss component does, however, affect banks' balance sheets, other sectors of the national economy, and the external balance sheet as it relates to the national economy. But not all changes in the value of these assets are included in the capital finance accounts of those sectors, only those changes that are an immediate consequence of the real transactions mentioned before. These are the reduction in the local currency cash or other asset balances of other sectors of the economy ( -450) and the counterpart increase of those balances in the capital finance account of the banks ( +450); also included are the reductions in the U. 5. dollar balances of the banks in local currency ( -450) and the counterpart reduction of the U.S. dollar balances in the external account in local currency ( -450). Not included are the capital gains accruing to the banks as a result of the increases in the value of their foreign currency holdings. These capital gains are to be dealt with in the reconciliation accounts, as explained above. The net effect of the treatment shown in Table 2 thus maintains the deficit of the external sector, which is a consequence of changes in exchange rates over time, while compensating it with an
76 EXTERNAL SECTOR TRANSACTIONS
adjustment factor in the external capital finance account and in the capital finance account of banks.
III. Measurement Issues
The three components of exchange rate differentials rarely exist in isolation. Only under stable monetary conditions might one expect to find the implicit bank service charge for foreign currency transactions alone. Under the present conditions of volatile movements of exchange rates over time, however, capital gains and losses and bank service charges are included in the exchange rate differentials. Furthermore, many countries that have multiple exchange rate regimes also experience considerable changes in exchange rates over time, so that under these circumstances all three components of exchange rate differentials are present: bank service charges, capital gains or losses, and taxes or subsidies.
To separate the three components, one would first need to determine the accounting exchange rate, or a series of accounts exchange rates if there are considerable changes in the exchange rates over time. On the basis of these accounting exchange rates, a distinction can be made between bank service charges and taxes or subsidies on the one hand and capital gains or losses on the other. The next step is to determine the bank service charge to be imputed to the government as a cost of the exchange rate policy.
The accounting exchange rate-which can only be approximated because the actual value is not recorded-is an equilibrium rate that would exist at one point in time if there were no government control of part or all of the foreign currency market. The equilibrium rate should exclude the bank service charges. On the basis of this general criterion, the different possibilities of measurement will be reviewed under conditions varying from stable exchange rates to multiple exchange rate regimes combined with changes in the exchange rates over time.
Stable Monetary Conditions
The simplest situation would be one in which there are fairly stable rates over time and, correspondingly, only minor operating margins charged by banks. Under these circumstances one might assume that there is an equilibrium between supply and demand and that purchasers and sellers of foreign exchange share the operating cost equally. The accounting exchange rate might be estimated as the
EXCHANGE RATE DIFFERENTIALS 77
unweighted average of the purchase and sale prices of foreign exchange.
Changing Exchange Rates Over Time
The approximation of an accounting rate is more difficult when the foreign currency value is fluctuating over time or increases or decreases all the time. This is the most common situation at present. Under those circumstances information will be available on the margin between the purchase and sale prices of the foreign currency, but the margin may actually be much larger than in the case of stable monetary conditions because it not only reflects the operating cost but also includes a compensation for past and expected future losses in the value of foreign currency between the moments of purchase and sale. The difference attributable to the latter factor, if realized, is a capital loss and should in principle not be incorporated in the bank service charge. Because the separation of the capital loss element is, however, difficult to carry out in practice, the actual margin at one time between the purchase and sale values may be taken as an approximation of the bank service charge-that is, the accounting value for conversion will again be the unweighted average of purchase and sale values. Under these circumstances there would not be one accounting rate but a time series that reflects fluctuations in rates over time.
Multiple Exchange Rates
The situation would be more difficult to deal with in national accounts when there are multiple exchange rates existing for different transactions that might take place at the same time. Most countries that have introduced these multiple rates are also faced with exchange rate changes over time.
If there is a free or parallel (black) market, it may be possible to observe the differences between the purchase and sale values of foreign currency, which might be taken as an approximation of the bank service charges. It should be noted, however, that as in the previous case, in which exchange rates change over time, the margin may include compensation for realized and expected losses in the value of foreign exchange over time. Furthermore, the estimated margin may refer only to a small market where the margin between the sale and purchase values of foreign exchange is not representative for margins in other foreign currency markets that are government controlled.
78 EXTERNAL SECTOR TRANSACTIONS
Several considerations should be taken into account in determining the accounting or equilibrium rate under multiple exchange rate conditions. The accounting exchange rate should probably be somewhere between the lower rates, generally controlled by the government, and the much higher rates, which dominate the free or parallel market. Presumably, if the government did not control the market, some who purchased foreign exchange at the low official rates would not exercise their demand; this would increase the supply of foreign exchange at the free market, which might then reduce the free market rate. A reasonable approximation of the accounting rate might be the weighted average of actual rates-after the estimated bank service charges are deducted. The weights would be the foreign currency values of all external transactions that took place during the period of account, including exports and imports as well as other transactions registered in the external account.
In determining this average, one should be aware that the external account includes some transactions that are actually carried out without any foreign currency. These include loans tied to purchases of goods and services from the country providing the loan at a prearranged exchange rate, or current and capital grants-in-kind for which not even an explicit foreign exchange conversion is considered. These transactions should be excluded from the weighted average.
Two approaches for deriving an estimate of the accounting exchange rate, suggested by Pinot de Libreros, are less appropriate. One suggestion is to choose an actual exchange rate as the rate that would come closest to the equilibrium accounting rate.4 Such a choice would be reasonable only if the amount of foreign exchange transactions through this market were a very large percentage of all foreign exchange transactions. It is not sufficient, as Pinot de Libreros suggested, that the selected exchange rate be determined in a free market without government intervention because, although the government does not explicitly enter this market, it does influence the price in that market through a foreign currency market of its own that has attracted foreign exchange transactions otherwise channeled through the free market.
Pinot de Libreros also suggests that, under multiple exchange rate conditions, the accounting exchange rate should be determined on the basis of the foreign exchange revenues, which the central bank says that it has accumulated as a result of the foreign exchange controls.5 The weakness of this approach is that the central bank can only
4 Pinot de Libreros, "Los mercados multiples de cambio," pp. 9-11. 5 Pinot de Libreros, "Effects of Devaluation," pp. 14-16.
EXCHANGE RATE DIFFERENTIALS 79
determine these revenues on the basis of an accounting exchange rate, and in a manner similar to that illustrated in Table 1. This accounting rate may be different from the one that should be used in the national accounts calculations, and this therefore makes it difficult to use the central bank calculations as a point of departure for the national accounts conversion.
IV. A Quantitative Example
The following quantitative example of the treatment of multiple exchange rates is intended to illustrate and clarify the previous discussion and proposals. The example is based on national accounts data for Venezuela for 1983. Because no unpublished, detailed national accounts information was available at the time this study was written, aggregate data as published by the United Nations in its annual national accounts publication6 were used and somewhat modified to fit the adjustments for exchange rate differentials.
The Venezuelan national accounts figures are presented in Table 3 in the T-account format. The table is divided into two groups of accounts: one account for the national economy (the first two columns), and three alternative accounts covering external transactions in three modes of valuation-U.S. dollars (the last two columns), local currency based on the conversion using actual unadjusted (transaction) exchange rates (the third and fourth columns), and local currency based on the conversion using an accounting rate of exchange (the fifth and sixth columns). Each account has a revenue (R) and disbursement (D) side.
The transaction breakdown presented in the table covers the main aggregates-GOP, gross savings, and net lending-together with the external transactions equivalents-foreign trade surplus or deficit, current surplus, and net lending. The transactions in the external accounts are recorded from the point of view of the national economy; that is, exports are presented as revenues, imports as disbursements, and so on.
The accounting exchange rate used in the table is 10 local currency units per US$1. It was calculated as the weighted average of actual exchange rates, using the U.S. dollar values of the transactions presented in the last two columns as weights. All external transactions are included in the weights, except for the balancing items. By using
6 United Nations, National Accounts Statistics: Major Aggregates and Detailed Tables (New York, 1984).
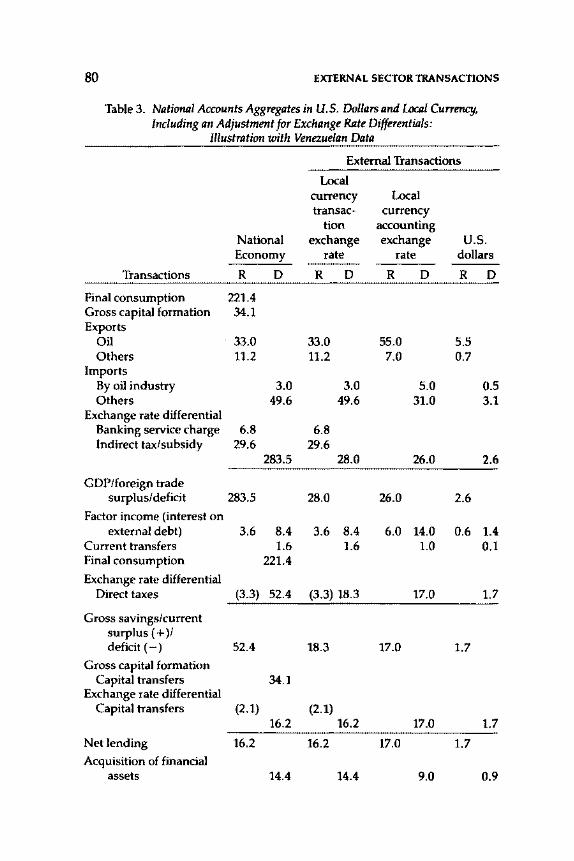
80 EXTERNAL SECTOR TRANSACTIONS
Table3. National Accounts Aggregates in U.S. Dollars and Local Currency, Including an Adjustment for Exchange Rate Differentials:
Illustration with Venezuelan Data
External Transactions
Local currency Local transac- currency
tion accounting National exchange exchange u.s. Economy rate rate dollars
Transactions R D R D R D R D
Final consumption 221.4 Gross capital formation 34.1 Exports
Oil 33.0 33.0 55.0 5.5 Others 11.2 11.2 7.0 0.7
Imports By oil industry 3.0 3.0 5.0 0.5 Others 49.6 49.6 31.0 3.1
Exchange rate differential Banking service charge 6.8 6.8 Indirect tax/subsidy 29.6 29.6
283.5 28.0 26.0 2.6
GOP/foreign trade surplus/deficit 283.5 28.0 26.0 2.6
Factor income (interest on external debt) 3.6 8.4 3.6 8.4 6.0 14.0 0.6 1.4
Current transfers 1.6 1.6 1.0 0.1 Final consumption 221.4
Exchange rate differential Direct taxes (3.3) 52.4 (3.3) 18.3 17.0 1.7
Gross savings/current surplus ( + )/ deficit (-) 52.4 18.3 17.0 1.7
Gross capital formation Capital transfers 34.1
Exchange rate differential Capital transfers (2.1) (2.1)
16.2 16.2 17.0 1.7
Net lending 16.2 16.2 17.0 1.7 Acquisition of financial
assets 14.4 14.4 9.0 0.9
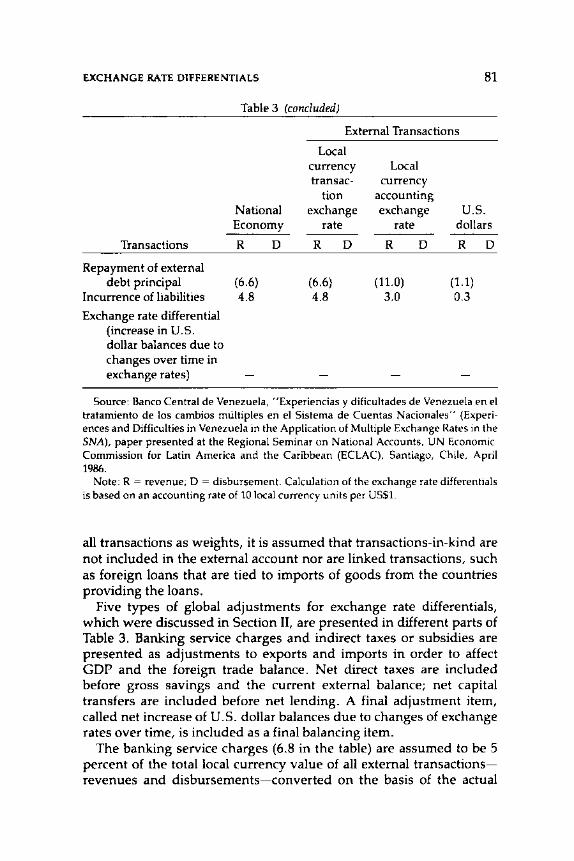
EXCHANGE RATE DIFFERENTIALS 81
Table 3 (concluded)
External Transactions
Transactions
Repayment of external debt principal
Incurrence of liabilities
Exchange rate differential (increase in U.S. dollar balances due to changes over time in exchange rates)
National Economy
R D
(6.6) 4.8
Local currency transac-
tion exchange
rate
R D
(6.6) 4.8
Local currency
accounting exchange u.s.
rate dollars
R D R D
(11.0) (1.1) 3.0 0.3
Source: Banco Central de Venezuela, "Experiencias y dificultades de Venezuela en el tratamiento de los cambios multiples en el Sistema de Cuentas Nacionales" (Experiences and Difficulties in Venezuela in the Application of Multiple Exchange Rates in the SNA), paper presented at the Regional Seminar on National Accounts, UN Economic Commission for Latin America and the Caribbean (ECLAC), Santiago, Chile, April 1986.
Note: R = revenue; D = disbursement. Calculation of the exchange rate differentials is based on an accounting rate of 10 local currency units per US$1.
all transactions as weights, it is assumed that transactions-in-kind are not included in the external account nor are linked transactions, such as foreign loans that are tied to imports of goods from the countries providing the loans.
Five types of global adjustments for exchange rate differentials, which were discussed in Section II, are presented in different parts of Table 3. Banking service charges and indirect taxes or subsidies are presented as adjustments to exports and imports in order to affect GOP and the foreign trade balance. Net direct taxes are included before gross savings and the current external balance; net capital transfers are included before net lending. A final adjustment item, called net increase of U.S. dollar balances due to changes of exchange rates over time, is included as a final balancing item.
The banking service charges (6.8 in the table) are assumed to be 5 percent of the total local currency value of all external transactionsrevenues and disbursements-converted on the basis of the actual
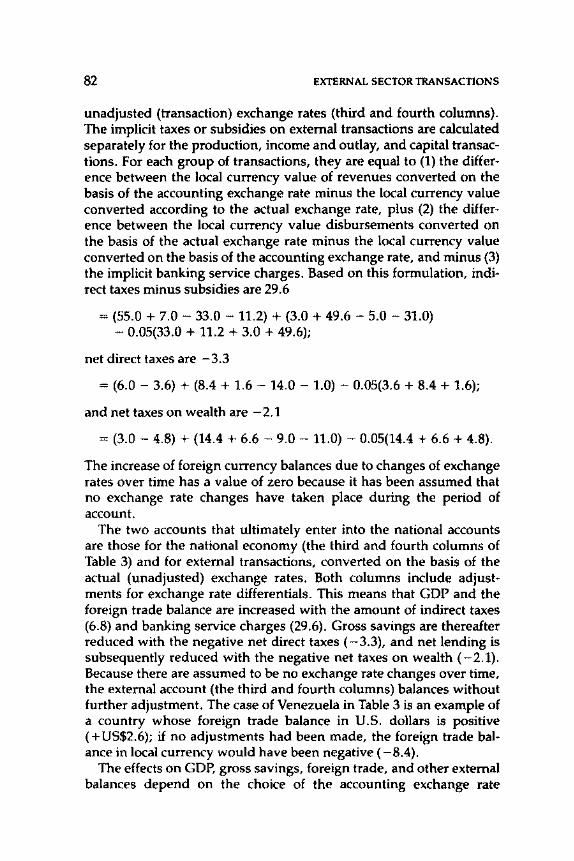
82 EXTERNAL SECTOR TRANSACTIONS
unadjusted (transaction) exchange rates (third and fourth columns). The implicit taxes or subsidies on external transactions are calculated separately for the production, income and outlay, and capital transactions. For each group of transactions, they are equal to (1) the difference between the local currency value of revenues converted on the basis of the accounting exchange rate minus the local currency value converted according to the actual exchange rate, plus (2) the difference between the local currency value disbursements converted on the basis of the actual exchange rate minus the local currency value converted on the basis of the accounting exchange rate, and minus (3) the implicit banking service charges. Based on this formulation, indirect taxes minus subsidies are 29.6
= (55.0 + 7.0- 33.0 - 11.2) + (3.0 + 49.6- 5.0- 31.0) - 0.05(33.0 + 11.2 + 3.0 + 49.6);
net direct taxes are -3.3
= (6.0 - 3.6) + (8.4 + 1.6 - 14.0 - 1.0) - 0.05(3.6 + 8.4 + 1.6);
and net taxes on wealth are -2.1
= (3.0 - 4.8) + (14.4 + 6.6 - 9.0 - 11.0) - 0.05(14.4 + 6.6 + 4.8).
The increase of foreign currency balances due to changes of exchange rates over time has a value of zero because it has been assumed that no exchange rate changes have taken place during the period of account.
The two accounts that ultimately enter into the national accounts are those for the national economy (the third and fourth columns of Table 3) and for external transactions, converted on the basis of the actual (unadjusted) exchange rates. Both columns include adjustments for exchange rate differentials. This means that GOP and the foreign trade balance are increased with the amount of indirect taxes (6.8) and banking service charges (29.6). Gross savings are thereafter reduced with the negative net direct taxes ( -3.3), and net lending is subsequently reduced with the negative net taxes on wealth (-2.1). Because there are assumed to be no exchange rate changes over time, the external account (the third and fourth columns) balances without further adjustment. The case of Venezuela in Table 3 is an example of a country whose foreign trade balance in U.S. dollars is positive ( + US$2.6); if no adjustments had been made, the foreign trade balance in local currency would have been negative ( -8.4).
The effects on GOP, gross savings, foreign trade, and other external balances depend on the choice of the accounting exchange rate
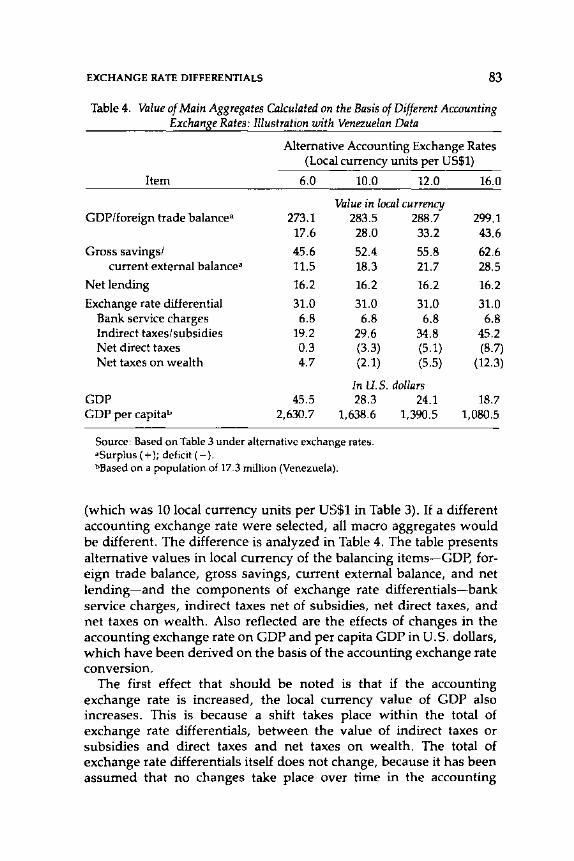
EXCHANGE RATE DIFFERENTIALS 83
Table 4. Value of Main Aggregates Calculated on the Basis of Different Accounting Exchange Rates: Illustration with Venezuelan Data
Alternative Accounting Exchange Rates (Local currency units per US$1)
Item 6.0 10.0 12.0
Valueinlocalcurrency GOP/foreign trade balance• 273.1 283.5 288.7
17.6 28.0 33.2
Gross savings/ 45.6 52.4 55.8 current external balance• 11.5 18.3 21.7
Net lending 16.2 16.2 16.2
Exchange rate differential 31.0 31.0 31.0 Bank service charges 6.8 6.8 6.8 Indirect taxes/subsidies 19.2 29.6 34.8 Net direct taxes 0.3 (3.3) (5.1) Net taxes on wealth 4.7 (2.1) (5.5)
In U.S. dollars GOP 45.5 28.3 GOP per capitab 2,630.7 1,638.6
Source: Based on Table 3 under alternative exchange rates. •Surplus ( + ); deficit (- ). bBased on a population of 17.3 million (Venezuela).
24.1 1,390.5
16.0
299.1 43.6
62.6 28.5
16.2
31.0 6.8
45.2 (8.7)
(12.3)
18.7 1,080.5
(which was 10 local currency units per US$1 in Table 3). If a different accounting exchange rate were selected, all macro aggregates would be different. The difference is analyzed in Table 4. The table presents alternative values in local currency of the balancing items-GOP, foreign trade balance, gross savings, current external balance, and net lending-and the components of exchange rate differentials-bank service charges, indirect taxes net of subsidies, net direct taxes, and net taxes on wealth. Also reflected are the effects of changes in the accounting exchange rate on GOP and per capita GOP in U.S. dollars, which have been derived on the basis of the accounting exchange rate conversion.
The first effect that should be noted is that if the accounting exchange rate is increased, the local currency value of GOP also increases. This is because a shift takes place within the total of exchange rate differentials, between the value of indirect taxes or subsidies and direct taxes and net taxes on wealth. The total of exchange rate differentials itself does not change, because it has been assumed that no changes take place over time in the accounting
84 EXTERNAL SECTOR TRANSACTIONS
exchange rate. Gross savings also increase, but net lending remains the same because of the unchanged total of exchange rate differentials. The shift toward indirect taxes or subsidies when the accounting exchange rate increases can be clearly observed from the trend.in the breakdown of the total exchange rate differentials in the table.
Another effect of the change in the accounting exchange rate is on GOP and per capita GOP in U.S. dollars. Assuming that the accounting exchange rate is the most appropriate one for converting local currency GOP to U.S. dollars/ the U.S. dollar data are much more sensitive to a change in the accounting exchange rate than is the local currency GOP. The change in the U.S. dollar value of GOP is the result of two opposite effects. On the one hand, an increased accounting exchange rate increases GOP in local currency through the conversion of exports and imports; on the other hand, it decreases GOP and per capita GOP when converted back into U.S. dollars. The net effect is a considerable decrease in the U.S. dollar value of GOP and per capita GOP.
7 The adjustments to the exchange rates suggested in the present paper make the accounting exchange rate more attractive than any other exchange rate for the conversion to U.S. dollars of GOP and per capita GDP. However, not all limitations in the use of exchange rates are removed through the suggested adjustment procedure to arrive at an equilibrium rate, as the equilibrium rate applies in principle only to external transactions and remains less appropriate for the conversion of domestic transactions.
7
Harmonization of the Classification of External Current Account Transactions
ARIE C. SoUTER AND }AN VAN TONGEREN
T HE STUDY DESCRIBED here responds to repeated recommendations by the United Nations Statistical Commission that statistical stan
dards for related but specialized fields of statistics be harmonized, to the extent possible, with the present guidelines of A System of National Accounts (SNA). 1 This recommendation was taken up again by the 1982 Expert Group Meeting on the SNA, which initiated a review of the SNA and made harmonization one of the main themes of revision of the SNA.
With regard to the IMF's Balance of Payments Manual (BPM), this focus on the review of the SNA is a continuation of the orientation already reflected in the 1977 edition of the BPM, which includes an appendix on the relation between the BPM and the SNA. 2 Several discrepancies between the two have remained, however, because at the time of the 1977 edition of the BPM it was thought to be neither statistically feasible nor analytically useful to incorporate in the BPM all details of the external account of the SNA.
The first phase of the present harmonization project was finalized in 1981, when a reconciliation between the components of the external account of the SNA and the BPM was drawn up. A discussion of the differences between the SNA and the BPM took place at the 1982
1 An earlier version of this study was prepared for the Nineteenth General Conference of the International Association for Research in Income and Wealth (IARIW), Noordwijkerhout, Netherlands, August 25-31, 1985.
2 "Comparison of Balance of Payments Classification with External Transactions in SNA," Appendix C in International Monetary Fund, Balance of Payments Manual, Fourth Edition (Washington, 1977), pp. 177-80.
85
86 EXTERNAL SECTOR TRANSACTIONS
SNA expert group meeting. Unfortunately, little was accomplished in terms of harmonization. The present phase of the project, which was initiated in 1983 in close cooperation between the UN Statistical Office (UNSO) and the IMF Bureau of Statistics, tries to revive the discussion and narrow the gap between the components by studying the availability of data in selected countries and identifying the explicit or implicit links between them.
This paper reports on the results of the country studies carried out until October 1985, draws conclusions, and makes proposals for the adaptation of the SNA and BPM components that would be compatible with further harmonization. Because the survey was restricted to current account transactions, the analysis is limited to that part of the SNA and BPM only.
The characteristics of the present SNA and BPM components and the relations between them, as reflected in the present reconciliation, are briefly reviewed in Section I of the paper. Section II discusses the survey of selected countries and summarizes results. Section III takes up issues reflecting the differences between the SNA and BPM components and discusses them one by one. For each of the issues the section includes a brief summary of the present SNA and BPM practices, the results of the survey (if available), and, where necessary, the proposed modifications of SNA and BPM components that would result in further harmonization of the two systems. This section also includes a description of the modified reconciliation, after incorporation of the proposed modifications of the components.
I. Present Reconciliation of SNA and BPM Components
The differences between the components of the external account of the SNA and the BPM can be seen from two perspectives.3 The first defines BPM components in terms of details-"building blocks"that are needed to derive the SNA components; the second defines the SNA components in terms of the same building blocks, which are in turn needed to reconstruct the BPM components. Some of the BPM components are not covered in the SNA, while other building blocks are not included in the BPM because of differences in the coverage of transactions in the two systems. The reconciliation, although quite complex, provides all the elements needed to derive the components of both the SNA and the BPM and, thus, offers a guide to national
3 Two reconciliation tables, omitted from this volume, are available from the authors on request.
CURRENT ACCOUNT TRANSACTIONS 87
compilers who want to derive the data for one system from that in the other.
The number of differences is large, although the majority constitutes discrepancies that are quantitatively small and often ignored by national compilers, as will be seen in the discussion in Sections II and III. The main differences can be summarized briefly, however. Both the SNA and the BPM use the change-of-ownership principle for recording transactions. The SNA deviates from this principle in several instances, whereas the BPM is consistent in its application. For example, for the recording of merchandise transactions, the SNA follows the physical movement basis in line with foreign trade statistics and includes an adjustment item in the external account in order to bring this account in line with the other accounts of the SNA. Another difference concerns the treatment of reinvested earnings of directinvestment enterprises with foreign branches or subsidiaries, which are not included in the SNA but are included in the BPM, in conformity with the change-of-ownership principle. Other differences include the valuation of imports, which are valued on a c.i.f. (cost, insurance, freight) basis in the SNA and on an f.o.b. (free on board) basis in the BPM; the treatment of monetary and nonmonetary gold; the separate identification of labor and property income received by factors of production, which is made in the SNA but not in the BPM; and, finally, the treatment of insurance transactions, for which the SNA requires various imputations that are not made in the BPM.
II. The SNA-BPM Questionnaire on the Availability of Separate Data or Estimates for Building Blocks
Following the completion of the conceptual reconciliation of the two classifications of international transactions, the UN and the IMF proceeded to collect information from a small but representative group of national compilers on the current and future availability of separate data for each of the approximately 150 building blocks that are needed for the link. Two questionnaires were designed, based on the two reconciliation tables prepared earlier. One questionnaire, listing the building blocks in the order of the BPM components, was sent by the IMF to compilers of balance of payments statistics; a second questionnaire, seeking identical information but structured according to the SNA components, was sent by the UN to compilers of national accounts statistics in the same countries. Follow-up visits were made by staff of both institutions to some of the selected countries in order to obtain clarification and additional information. Nine countries had
88 EXTERNAL SECTOR TRANSACTIONS
completed the questionnaires by the time this study was prepared: Australia, Canada, France, Germany, the Republic of Korea, the Netherlands, Turkey, the United Kingdom, and the United States. The analysis and conclusions reached in this and the following sections are based on these responses.
The information obtained from the UN and IMF questionnaires is summarized in the matrix shown in Table 1, which reproduces, in an alternative form, the present link between the current and capital account transactions of the SNA (rows) and the BPM (columns). The information presented in the matrix shows whether or not separate data or estimates for the building blocks are available in the majority of countries that have responded until now. When separate data or estimates for a given building block or component are available, the matrix shows an "A," whereas for other building biocks or components the notation is a dash(-). For instance, the BPM component "travel" needs to be broken down into separate building blocks for expenditures reimbursable by resident and nonresident employers, which are treated in the SNA as miscellaneous commodities or direct purchases by government; other travel expenditures, which are included in the SNA in direct purchases by households; rent on land, which is property income in the SNA; passport, visa fees, and airport taxes, which are included in SNA transfers; and the value of free goods and services acquired by and provided to travelers, which are not included in the SNA. The dashes in the BPM column for travel show that sufficient detail for these building blocks was not available in the responding countries. A similar analysis of the SNA details, required to derive the BPM components, may be carried out along the rows of the matrix.
Further information on the availability of detailed data will be provided in the next section, where country practices are analyzed in detail. A general impression obtained from the survey was that the number of individual building blocks for which separate data or estimates are available in more than half of the responding countries is small and that the composition of the smallest available combinations of building blocks comes closer to the composition of the BPM components than to the composition of the components of the SNA.
The survey results on data availability and country practices have been important elements in drawing up the proposals made below. They are not, however, the only justification for either amending or not amending the present guidelines. Coverage, concepts, and classifications in both systems are governed by underlying principles and analytical usefulness, which in some instances have been used as
CURRENT ACCOUNT TRANSACTIONS 89
justification for making recommendations that differ from what may have been implied by the survey results.
III. Proposals to Harmonize SNA and BPM Classifications of International Transactions
This section includes three proposals to harmonize the composition of the components of the SNA and the BPM; the proposals are based on the survey results and also take into account the underlying principles of both systems. The first is a proposal to consolidate the components of the external account of the present SNA into fewer, more aggregated components representing the essential transaction categories of the SNA that have counterparts in other sector accounts of the SNA. The second recommendation is to apply more consistently the change-of-ownership principle in the SNA in order to bring it more in line with the BPM. The third set of recommendations refers to other changes in the composition of the components of the SNA and the BPM that would bring the composition of the two systems in line with data availability.
Consolidation of Goods and Services Components of the SNA
The classification of goods and services flows in the SNA and the BPM differs considerably. The SNA external transactions account distinguishes between exports (imports) of merchandise and services; it includes a further breakdown of services into transport and insurance services, and direct purchases abroad by resident units, and in the reporting economy by nonresident entities, including those of households and governments. The BPM distinguishes between merchandise, shipment, passenger services, other transportation, and travel and has, furthermore, components for other goods and services (including income) broken down by interofficial, other resident official, other foreign official, and other goods and services. The considerable divergence between the breakdowns of the two systems requires a very large number of detailed building blocks to link the SNA and BPM components.
The survey shows that the commodity detail required by the SNA is generally not available in countries and that countries instead accommodate unadjusted BPM components in single or combined SNA categories. It is therefore proposed to eliminate this commodity detail from the SNA. This can be done without affecting the SNA, since
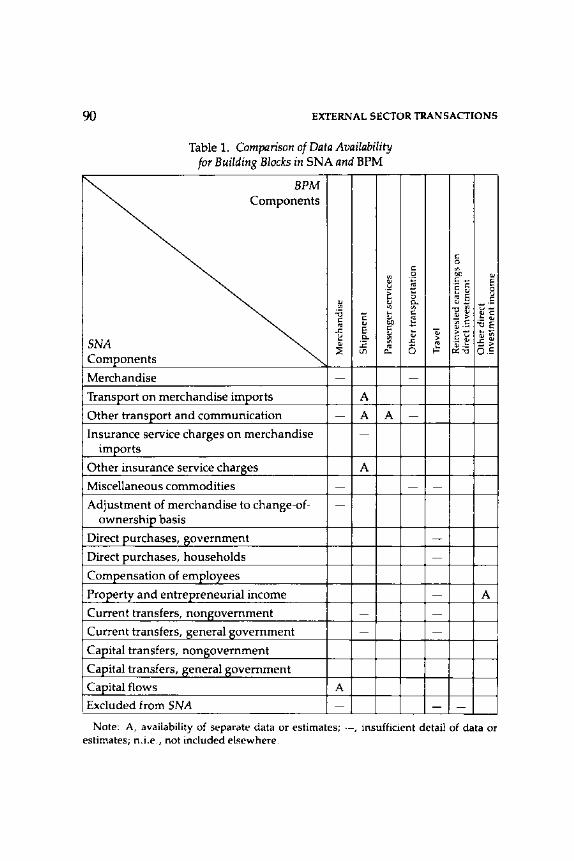
90 EXTERNAL SECTOR TRANSACTIONS
Table 1. Comparison of Data Availability for Building Blocks in SNA and BPM
BPM Components
"' 01 -~ e:
01 01
"' "' :a c ... c 01
01 00 "' E c ..c: 01 ~ Q., "' SNA 01 :.c "' "' ~ til c.
Com_I>onents
Merchandise -
Transport on merchandise imports A
Other transport and communication - A A
Insurance service charges on merchandise -imports
Other insurance service charges A
Miscellaneous commodities -
Adjustment of merchandise to change-of- -ownership basis
Direct purchases, government
Direct purchases, households
Compensation of employees
Property and entrepreneurial income
Current transfers, nongovernment -Current transfers, general government -Capital transfers, nongovernment
Capital transfers, general government
Capital flows A Excluded from SNA -
c 0
c "' .!2 00 01
~ c- E ·- c c 01 0
C) Iii E v c Q., 01- -·-"' -o"' u-c ~~ !: c !l :a~ <nC
01·-... .... >- ... -01 > c u 01"' ..c: "' ·a:;.~ ,.cOl
0 ~ ->
0::"0 0.5
-
-
- -
--
- A
--
- -
Note: A, availability of separate data or estimates; -, insufficient detail of data or estimates; n.i.e., not included elsewhere.
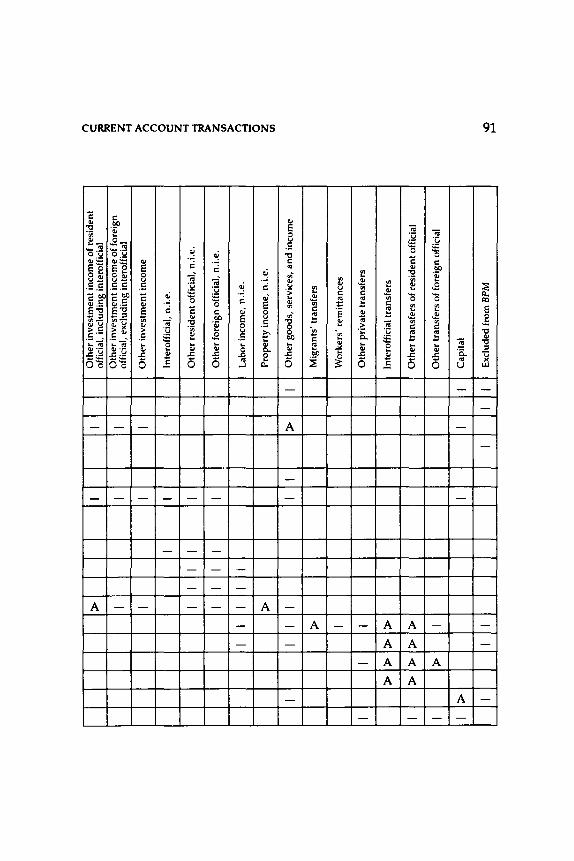
> I I
I
I I
I I
I I
I I
I I
I I
I
>
I I
I I
> I
I I
I
> >
> >
I
> >
> >
I
>
I
I >
I I
I
I I
I I
I I
I I I I I
>
I
I I
I
I I
I
Oth
er in
vest
men
t inc
ome
of r
esid
ent
offi
cial
, in
clud
ing
inte
roff
icia
l O
ther
inv
estm
ent
inco
me
of f
orei
gn
offi
cial
, ex
clud
ing
inte
roff
icia
l
Oth
er in
vest
men
t inc
ome
lnte
roff
icia
l, n.
i.e.
Oth
er r
esid
ent o
ffic
ial,
n.i.
e.
Oth
er fo
reig
n of
fici
al,
n.i.
e.
Lab
or i
ncom
e, n
.i.e
.
Pro
pert
y in
com
e, n
.i.e
.
Oth
er g
oods
, se
rvic
es,
and
inc
ome
Mig
rant
s' t
rans
fers
Wor
kers
' rem
itta
nces
Oth
er p
riva
te tr
ansf
ers
lnte
roff
icia
l tra
nsfe
rs
Oth
er tr
ansf
ers
of r
esid
ent o
ffic
ial
Oth
er tr
ansf
ers
of fo
reig
n of
fici
al
Cap
ital
Exc
lude
d fr
om B
PM
n ~ ~ >
n n 0 c:: ~ ~ z ~ n :::!
0 z trl
\0
~
92 EXTERNAL SECTOR TRANSACTIONS
none of the commodity details appears in any of the other sector accounts and is, therefore, not strictly needed for internal consistency of the national accounting framework. 4
If the present commodity detail of the SNA is reduced, and only exports and imports of goods and services are distinguished, a muchsimplified reconciliation with the BPM results. The following building blocks can then be eliminated from the reconciliation: migrants' effects and gifts in kind; transport services performed by nonresidents on imports; stores and fuel for carriers; repair of transportation equipment; travel expenditures reimbursable by resident government; travel expenditures reimbursable by an employer other than the government; net purchase or sales of capital goods for own use by government; net purchases or sales of goods, other than capital goods, and services for own use by government bodies stationed abroad; personal expenditures of diplomats and troops stationed abroad; and expenditures, other than rent on land, passport, visa fees, and airport taxes, by individuals working abroad.
The Change-of-Ownership Principle
According to paragraph 1.36 of the SNA, a balance sheet for an economy shows both the written-down value of tangible assets held (plus the excess of financial claims held as assets over financial claims issued as liabilities) and the net worth. Net assets at the end of a period are equal to net assets at the beginning, plus net investment in the period, plus revaluations needed to adjust assets previously acquired or liabilities previously issued to the prices prevailing at the closing date.
In line with that definition, paragraph 6.130 of the SNA defines exports and imports of goods and services as transactions between residents of a given country and those in the rest of the world, which, according to paragraph 6.131 of the SNA, in principle should be recorded in the national accounts at the moment at which the ownership of (legal title to) the goods in question passes or the services are rendered. This principle is also used for recording net acquisitions of financial assets and net incurrence of financial liabilities in the external transactions account as well as for recording transactions in the other accounts of the SNA (that is, in the production, consumption, and accumulation accounts).
4 "The SNA as a Framework for Statistical Co-ordination (Note by the United Nations Statistical Office)," DES/NI/85.3 (Paris: Organization for Economic Cooperation and Development (OECD), 1985).
CURRENT ACCOUNT TRANSACTIONS 93
Any deviation from this principle for recording transactions in goods and services would require a corresponding deviation for recording the related financial transactions. Thus, for example, if goods were recorded in the national accounts at the moment they crossed the border of a country, as in external trade statistics, rather than at the moment at which ownership passed, any credit extended (received) in connection with the sale of the goods would also have to be recorded at the moment the goods crossed the border, rather than at the moment the financial asset was acquired (the financial liability was incurred). Any advantage of a purely statistical nature that might be derived from recording goods at the moment they cross the border would be offset, therefore, by a corresponding disadvantage resulting from the need for making an offsetting recording in the financial items. In other words, any advantage that might be derived from not having to adjust to the change-of-ownership basis for the recording of the goods would be offset by a corresponding disadvantage resulting from the need for making an offsetting adjustment to the bordercrossing basis for the recording of the related financial item. In the SNA the change-of-ownership principle is generally applied to all domestic sector transactions, but some deviations occur in the external account. These instances, which constitute differences between the SNA and the BPM, are examined in the remaining paragraphs of this section and are evaluated on the basis of country practices.
Transactions Not Involving a Change of Ownership
Goods for Processing. The recommendation of the BPM is that the change-of-ownership rule be observed for goods for processing and re-export. That recommendation applies to goods transferred between affiliates, as well as to those transferred between unaffiliated parties. Thus, when goods for processing and re-export are not accompanied by a change of ownership, the goods should be excluded from merchandise, and the difference in the value of the goods before and after processing should be recorded as an export or import of a service. In contrast, when a change of ownership does occur in connection with processing transactions, entries should be made in the merchandise account to record the market values of the goods before processing and afterward, and no entry should be made in the services account. In that case, however, entries in the capital account should offset the entries in the merchandise account.
If it is assumed that the data are based on foreign trade statistics, which will frequently determine the approach to recording goods for
94 EXTERNAL SECTOR TRANSACTIONS
processing in the external account, the SNA does not identify separately goods for processing from other exports and imports of goods and services. Country practices vary. Some countries for which the processing activity is important try to identify and measure separately the flows of goods sent or received for processing. These countries generally follow the BPM treatment and include the value added by processing in imports or exports of services. Other countries, for which the item is less important, do not make the distinction. Given these practices, it is proposed to align the SNA treatment with that of theBPM.
Goods for Sale on Consignment. Goods for sale on consignment-that is, goods intended for sale that have not actually been sold at the time they cross the frontier-are customarily recorded in the trade statistics. As in the case of goods for processing, the SNA recommends imputation of a change of ownership, whereas the BPM prefers to adhere to the change-of-ownership principle.
Approximately half of the countries responding to the questionnaire were able to distinguish goods for sale on consignment. Given these practices and the advantages, mentioned above, of adhering to the change-of-ownership principle, which also apply in the case of goods sold on consignment, it is recommended to modify the SNA treatment and bring it in line with the recommendation in the BPM. This would also introduce further consistency with the treatment of goods sent for repair and rent, which are to be excluded from but recorded separately in international trade statistics and are to be excluded from the SNA.
Transportation and Insurance Services Performed by Residents on Imports. The external transactions account of the national accounts and the balance of payments are defined to cover transactions between residents of a given country and those in the rest of the world. Transportation and insurance services performed by residents on imports, therefore, should not be recorded in the national accounts and the balance of payments if the goods at the time these transportation and insurance services are being performed are owned by residents of the importing country.
Compiling countries often find it difficult, if not impossible, however, to ascertain whether merchandise imports are actually owned by a resident or by a nonresident at the time these transportation and insurance services are being performed. But any necessity for trying to relate changes of ownership of merchandise to these transportation and insurance services can be avoided by adopting a convention for constructing the entries that refer to these services on the compiling country's imports beyond the customs frontier of the exporting coun-
CURRENT ACCOUNT TRANSACTIONS 95
try. Under a convention of this kind, certain offsetting transactions between residents and foreigners may in effect be netted against each other and so may not be included in a statement of international transactions, whereas certain transactions between residents or between foreigners may be recorded in the accounts as both a credit and a debit. The use of such a convention thus entails a departure from the general rule for the service items of showing gross flows between residents and foreigners. The problems of compilation are greatly simplified, however, because the entries required represent identifiable types of service performed by residents or foreigners, without regard to whether the merchandise in question is actually owned by a resident or a foreigner at the precise time when those services are being performed.
Under the convention adopted in the SNA, transportation and insurance services on the compiling country's merchandise beyond the customs frontier of the exporting country are always treated as if they were services performed for residents of the importing country by residents of countries other than the importing country. One of the advantages of this convention is that the combination of the debit entries for transportation and insurance services and those for imports is equivalent to the value of imports valued on a c.i.f. basis, on which many trade statistics for imports are compiled.
Under the convention adopted in the BPM, transportation and insurance services on the compiling country's merchandise beyond the customs frontier of the exporting country are always treated as if they were services performed for residents of the importing country, whether by residents of that country or of any other country. This method has the advantage of eliminating any offsetting flows between residents, although for countries operating international carriers it may also bring about the exclusion of offsetting flows between residents and foreigners. Those exclusions, however, accord with the economic reality that, in the. final analysis, the cost of shipment is borne by the importing country, whatever the arrangements for shipping the goods may have been. For that reason, this convention is analytically more meaningful than the convention currently recommended by the SNA.
Write-offs of Bad Debts. A write-off of a bad debt refers to an event not involving a change of ownership. The market value equivalent of a claim may be notionally reduced by the presumed unwillingness or inability of the debtor to make full repayment in settlement of the claim. When the creditor chooses to regard part or all of such a claim as having been canceled, the claim is said to have been written off as a bad debt. A write-off, including the write-off of an asset that has been
96 EXTERNAL SECTOR TRANSACTIONS
expropriated without compensation, is equivalent to a change in valuation and not to a grant involving a change of ownership, since no contract with another party has been made to dispose of the claim.
Write-offs of bad debts are not included in the BPM. The SNA, in contrast, treats write-offs of bad debts as a sale of a financial asset with a counterpart in current transfers.
The country survey shows that data on write-offs are generally not included in the transactions accounts. Based on these practices and the theoretical considerations mentioned above, it is recommended to bring the SNA in line with the BPM and to include write-offs of bad debts in the reconciliation accounts of the system.
Transactions Involving a Change of Ownership
Free Goods and Services Provided to Travelers. Travelers may acquire goods and services against payment or free of charge. The external transactions account in the SNA covers only the goods and services acquired by travelers against payment, whereas the BPM covers both categories. Although data on goods and services acquired free of charge by travelers are generally not available, it appears that, for the sake of consistency in the balance-sheet account, the transactions account, and the reconciliation account of the SNA, it would be better if the transactions account covered goods and services acquired free of charge by travelers, as it does for goods and services that have been acquired free of charge by nontravelers.
Transactions for Which a Change of Ownership Should Be Imputed
Financial Leasing. In the BPM, financial lease arrangements refer to arrangements that provide for the recovery of all, or substantially all, of the cost of the equipment that is being leased, together with carrying charges. Under such arrangements the possession of the equipment passes from the lessor (the owner) to the lessee (the user) without a change of ownership. The BPM recommends that the basic nature of these transactions-the transfer of the economic risk from the lessor to the lessee-be given precedence over their legal form. Therefore, as a rule of thumb, a lease arrangement expected to cover at least three fourths of the cost of the equipment, together with the carrying charges, is taken as presumptive evidence that a change of ownership is intended. At the time the possession of the equipment passes from the lessor to the lessee, a change of ownership of the equipment from the lessor to the lessee is imputed, and the full equiv-
CURRENT ACCOUNT TRANSACTIONS 97
alent of the market value of the equipment (not the cumulative total of the expected lease payments) is recorded as merchandise, with an offsetting entry made in the capital account to record the imputed credit received by the nominal owner. The so-called lease payments to the actual legal owner thereafter are construed as investment income payments and repayment of the financial obligation that was in effect created when possession of the equipment passed from the lessor to the lessee.
Unlike the BPM, the SNA does not refer to such an arrangement and, therefore, does not distinguish between financial and other lease arrangements. In the SNA, lease arrangements refer to the service provided by the owner in leasing his equipment to the enterprise that operates it. Because there is no change of ownership, the market value of the equipment is not recorded in the merchandise and capital accounts, and the lease payment is recorded in the service account.
Information derived from the survey suggests that most national compilers do not manage to follow either recommendation. Data on the market value of the equipment is recorded indistinguishably in the trade returns when, as is often the case, customs officials do not have a way of distinguishing between goods under financial lease arrangements and other goods; the capital account typically does not include an offsetting entry. At the same time, national compilers often record the lease payments in the service account, thus duplicating the market value of the equipment that is recorded in the merchandise account.
For that reason, it appears that analytical considerations rather than the current recording practices should be used for determining the method for recording financial lease arrangements. Because the national compilers, who were asked for their preferences, appeared to favor the methodology recommended in the BPM, that methodology has been incorporated in the proposed classification. In order to be able to implement that methodology for recording lease arrangements, national compilers should ask entities reporting payments of lease fees for information that will enable the identification of financial lease arrangements and facilitate the appropriate recording of the "lease" payments.
In this connection, the SNA suggests that in the case of hirepurchase arrangements the purchase is considered to have occurred at the time that the contract concerning the arrangement is signed or, if there is no formal agreement, at the time the goods are delivered. Thus, the recording of financial lease arrangements in the BPM is similar to the recording of hire-purchase arrangements in the SNA.
Furthermore, the recording of financial lease arrangements in the
98 EXTERNAL SECTOR TRANSACTIONS
transactions account, as proposed, would call for a corresponding recording of those arrangements in the balance-sheet account.
Finally, it is worth mentioning that the national compilers in the OECD countries also have recommended that a change of ownership be imputed for lease arrangements.
Goods Shipped Between Affiliates. The definition of residence adopted for the SNA and the BPM has implications for the coverage of merchandise as determined by the change-of-ownership principle. Specifically, although enterprises are always considered residents of the economy where they operate, enterprises in different economies may be under the same management. Such affiliation may result in transactions between enterprises that are not subject to the legal changes of ownership that would have occurred had the enterprises been independently managed. Transactions between a parent company and a direct-investment branch (an unincorporated enterprise) might never involve a legal change of ownership in the literal sense, since both partners are part of the same legal entity. Moreover, although a parent company and a direct-investment subsidiary (an incorporated enterprise) constitute separate legal entities, a different balance of payments treatment for the transactions between the two enterprises that take the form of a legal change of ownership and those that do not would scarcely seem desirable. Therefore, it is recommended that-with the exception of transactions in goods for processing, for repair, or for rent-all transactions between direct-investment enterprises and their parent or other related enterprises be recorded as if a change in ownership had occurred.
The BPM follows the above-mentioned principle and includes in exports and imports of merchandise any shipments of goods to and from affiliated enterprises. The SNA does recognize affiliated enterprises in different countries as separate quasi-corporate enterprises, but it does not include the flows of merchandise to and from these affiliates in exports and imports. In country practices, the BPM treatment generally is followed, mainly for practical reasons, because countries are not able to identify separately within the foreign trade statistics the merchandise flows between the affiliates. It is proposed, therefore, to adopt in the SNA the present BPM recommendations, which would bring the SNA more in line with data availability in countries and would remove the above-mentioned internal inconsistency from the SNA.
Reinvested Earnings on Direct Investment. Reinvested earnings in the BPM cover the earnings of branches and other unincorporated directinvestment enterprises (excluding any part that can be identified as having been remitted) and the direct investor's portion of earnings of
CURRENT ACCOUNT TRANSACTIONS 99
incorporated direct investment enterprises that are not formally distributed. They are conceived as providing additional capital to the enterprise, thus increasing the value of an economy's stock of foreign assets and liabilities. In the recording of such earnings in the balance of payments, therefore, entries should be made both for directinvestment income and for direct-investment capital. For example, the reinvested earnings of a foreign direct-investment enterprise attributable to a resident direct investor should be entered as a credit in the current account category for investment income and as a debit in the capital account category for direct investment.
This approach is followed for a variety of reasons. First, it can be said that a direct investor has control over the policies of the directinvestment enterprise. If the direct-investment enterprise reinvests any of its income, this can be regarded as reflecting a conscious decision by the direct investor to increase his direct investment in the enterprise by not taking out some of the income that would otherwise be payable to him. Hence, it would be useful to reflect these two conceptually separate decisions in the statistics by showing the reinvested income accruing to the direct investor both as income and as a capital flow. This argument is supported by the fact that taxation of income may influence the decision of the direct investor with respect to the form he chooses for increasing his capital in the directinvestment enterprise.
In addition, one might argue that reinvested income is comparable to the credit extended-by the direct investor to the direct-investment enterprise-for commodities that are not paid for at the time these commodities are delivered. By analogy, the reinvested income would refer to a credit extended by the direct investor for the use of capital that is not paid for during the period in which the capital was made available.
The present SNA guidelines do not recommend that reinvested earnings be included in the external transactions accounts and, thus, suggest by implication that reinvested earnings be treated as additions to the net worth of the subsidiary and not to that of the parent company. The UN Provisional Guidelines (paragraph 6.43) for balance sheets,s however, differ from the SNA recommendations by stating that
5 United Nations, Provisional International Guidelines on the National and Sectoral Balance-Sheet and Reconciliation Accounts of the System of National Accounts, Statistical Papers, Series M, No. 60 (New York, 1977).
100 EXTERNAL SECTOR TRANSACTIONS
Unlike the usual stockholders, the parent company can take possession of the net worth of the subsidiaries by selling its interest in them. Furthermore, the parent company controls the magnitude of subsidiaries' net worth as it determines the amount of dividends that they pay and thus fixes the amount of saving that they retain. It is therefore appropriate to consider that the subsidiaries do not have any independent net worth and that the value of the parents' equity securities in the subsidiaries is equivalent to the difference between the total value of the subsidiaries' assets less the total value of the subsidiaries' liabilities, including only the value of any minority interest in the case of corporate equity securities.
Even though the survey shows that data on reinvested earnings are generally not available, it appears that including them in the harmonized classification would still be advisable: not only would it lead to harmonization between the SNA and the BPM, but it also would result in a reconciliation between the SNA and the UN balance-sheet guidelines.
Other Reconciliation Issues
The remaining issues mainly concern differences in the composition of the components of the SNA and the BPM. They generally do not involve important principles of either of the two systems, and reconciliation therefore can be carried out on the basis of data availability. This implies that either the SNA or the BPM components should be adjusted.
Monetary Gold
According to the BPM, monetary gold is gold owned by the central authorities (or others subject to their effective control, under institutional arrangements that sometimes exist) that is held to finance payments imbalances directly or to manage the size of such imbalances by intervening to influence the exchange rate for the national currency. Changes in holdings of monetary gold come about as a result of transactions of the central authorities either with central authorities in another country or with entities other than central authorities.
According to both the BPM and the SNA, transactions between the central authorities in a given country and the central authorities of another country should be recorded in the capital account. Acquisitions by resident central authorities of newly refined gold from other residents, even though such acquisitions do not represent international transactions, are, according to the SNA, to be recorded as an
CURRENT ACCOUNT TRANSACTIONS 101
export of merchandise. According to the BPM, however, data on such acquisitions are to be provided, as supplementary information, in the capital account. Acquisitions from or sales to nonresidents other than central authorities by resident central authorities are, according to the SNA, to be recorded as increases or decreases in financial assets. According to the BPM, they are to be recorded as an import or export of merchandise (with an additional pair of entries in the capital account, reflecting the change in the holdings of monetary gold and the monetization or demonetization of the gold).
Because information on acquisitions or sales of monetary gold by resident central authorities usually is available, harmonization of the classification of the transactions of resident authorities with other residents or with nonresidents other than central authorities can be achieved quite easily. It is suggested that this be done by changing the SNA methodology to that of the BPM, since changes in monetary gold are relatively unimportant for national accounts purposes but are of considerable importance in the context of balance of payments statistics.
Gold Other Than Monetary Gold
Gold other than monetary gold (nonmonetary gold) owned by any entity, including the central authorities that also own monetary gold, is treated in the BPM as any other commodity. In the SNA, nonmonetary gold is further broken down into gold for industrial use and gold for use as a financial asset. Information on international transactions in gold for use as a financial asset is available in about half of the countries surveyed. Information on changes in financial gold holdings arising from the reclassification of newly refined gold by residents other than the central authorities, which in the national accounts is part of merchandise exports, is generally not available. For that reason, there seems to be no justification, for national accounts or balance of payments purposes, for distinguishing international transactions in financial gold from those in industrial gold and, therefore, for distinguishing international transactions in nonmonetary gold from those in other commodities.
Arbitrage in Financial Assets
In instances where a transactor intends to dispose of a financial asset at virtually the same time that ownership of the asset is nominally acquired, the BPM recommends that any profit or loss resulting
102 EXTERNAL SECTOR TRANSACTIONS
from the two changes of ownership of the asset be regarded as the realization of a capital gain or loss. Like any other realization of a capital gain or loss, it should be entered in the capital account item that refers to the asset concerned. The SNA specifically recommends that gains or losses incurred in the purchase and sale of financial assets be recorded in the aggregate called miscellaneous commodities.
The implementation of the recommendation comes about as a result of the recording of purchases and sales of financial items at transaction prices, so that, when a pair of purchases and sales are recorded at different transaction prices, the difference between the two prices reflects the capital gain or loss on the purchase and sale, without any regard to the fact that the item may have been owned only very briefly. Such recording also brings about symmetry in the capital account of the global balance of payments statistics.
Country practices show that no explicit information is available on arbitrage profits or losses. Purchases and sales of financial assets, however, are recorded at different transaction prices, which implies that the difference between the two prices is dealt with as a realized capital gain or loss. Based on these country practices, it is therefore recommended that the SNA treatment be aligned with the standards of the BPM. This would also remove the internal SNA conflict between the treatment of arbitrage transactions, mentioned above, and the SNA recommendation that purchases and sales of financial assets be recorded at transaction values.
Insurance Seroices
In the BPM, insurance covers the difference between premiums paid and claims disbursed, which is taken to represent the insurance service charge. This treatment ignores (1) that the service charge the insurer takes into account in setting premiums during a given period (the "normal" service charge) may not be the same as the difference between the premiums and the claims payable during that period; (2) that losses may be greater or less than are expected in the longer run; (3) that claims may not yet be payable on losses that have already occurred; and (4) that premiums may have been paid in advance on risks to which the insurer has not yet been exposed. Therefore, in principle, the difference between premiums paid and claims disbursed may reflect not only a service charge but also capital gains (losses) and prepayments (postpayments).
CURRENT ACCOUNT TRANSACTIONS 103
In the SNA, the insurance premium is broken down into a service charge, a net premium (which is a payment for the coverage of the insurance risk), and, for pension and life insurance schemes, a savings element assigned to the household sector (to which an interest charge is also imputed).
The survey has shown that the SNA details are generally not available and, if information can be obtained or estimates made, the information is often available only for merchandise insurance, other casualty insurance, and life insurance combined. These experiences, together with similar information on country practices in other sectors (the government and the household sectors) may be a sufficient reason for reconsidering the present SNA treatment, simplifying it and bringing it more in line with country practices and data availability. Although no principal decision has been taken with regard to a modified treatment of insurance transactions in the present paper, a modified classification is proposed that identifies only two types of insurance transactions-premiums and claims-and does not distinguish anymore between the different types of insurance mentioned above.
Travel
In the BPM, travel covers the goods and services acquired-for personal use or to give away-from an economy by individuals defined as travelers during their stay in that economy. Travel covers the following components: expenditures reimbursable by the traveler's government or his or her employer; rent on land; passport, visa fees, and airport taxes; direct purchases by households; and the value of free goods and services. Except for the value of free goods and services, these components are included in the following categories of the SNA: goods and services; property and entrepreneurial income; current transfers to general government; and current transfers of other sectors.
The survey of country practices shows that the SNA detail is generally not available in the basic statistics of countries. The quoted breakdown is so essential for the SNA, however, that it cannot be eliminated. Practical solutions that allow for the estimation of the required detail on the basis of additional data or fairly reliable assumptions need to be found. Such estimates, together with the more aggregate information available from balance of payments statistics, would then be applied for national accounts purposes.
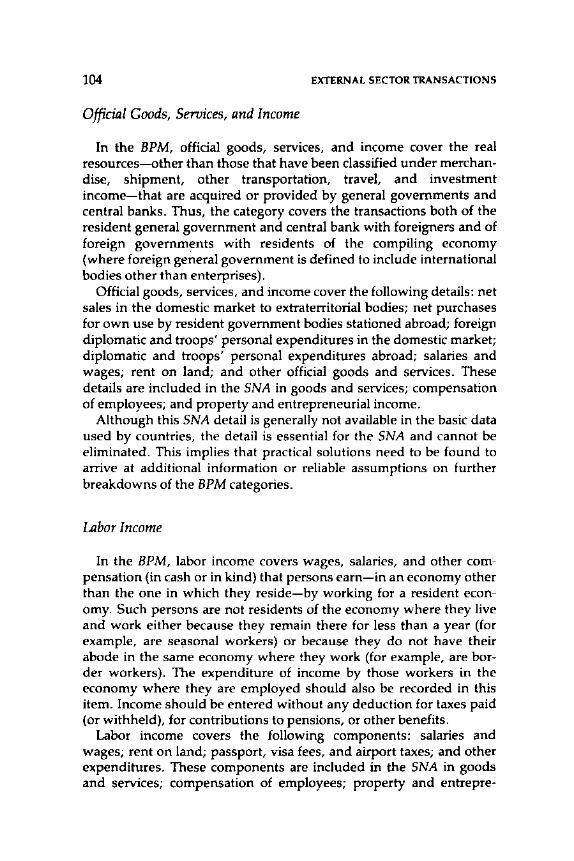
104 EXTERNAL SECTOR TRANSACTIONS
Official Goods, Services, and Income
In the BPM, official goods, services, and income cover the real resources-other than those that have been classified under merchandise, shipment, other transportation, travel, and investment income-that are acquired or provided by general governments and central banks. Thus, the category covers the transactions both of the resident general government and central bank with foreigners and of foreign governm~nts with residents of the compiling economy (where foreign general government is defined to include international bodies other than enterprises).
Official goods, services, and income cover the following details: net sales in the domestic market to extraterritorial bodies; net purchases for own use by resident government bodies stationed abroad; foreign diplomatic and troops' personal expenditures in the domestic market; diplomatic and troops' personal expenditures abroad; salaries and wages; rent on land; and other official goods and services. These details are included in the SNA in goods and services; compensation of employees; and property and entrepreneurial income.
Although this SNA detail is generally not available in the basic data used by countries, the detail is essential for the SNA and cannot be eliminated. This implies that practical solutions need to be found to arrive at additional information or reliable assumptions on further breakdowns of the BPM categories.
Labor Income
In the BPM, labor income covers wages, salaries, and other compensation (in cash or in kind) that persons earn-in an economy other than the one in which they reside-by working for a resident economy. Such persons are not residents of the economy where they live and work either because they remain there for less than a year (for example, are seiisonal workers) or because they do not have their abode in the same economy where they work (for example, are border workers). The expenditure of income by those workers in the economy where they are employed should also be recorded in this item. Income should be entered without any deduction for taxes paid (or withheld), for contributions to pensions, or other benefits.
Labor income covers the following components: salaries and wages; rent on land; passport, visa fees, and airport taxes; and other expenditures. These components are included in the SNA in goods and services; compensation of employees; property and entrepre-
CURRENT ACCOUNT TRANSACTIONS 105
neurial income; other current transfers to general government; and other current transfers by other resident sectors.
The survey shows that information on individual components of labor income required for SNA purposes is generally not available, while at the same time the categories cannot be eliminated because essential SNA elements are involved. Harmonization is therefore not possible, but practical reconciliation can be achieved by utilizing additional information and reliable assumptions to arrive at the SNA detail, taking BPM data as a point of departure.
Reconciliation of the Harmonized Classifications and Future Developments
The modifications proposed under the previous subsections of this section have been incorporated in the reconciliation. They require much simpler links and far fewer building blocks. The proposals would also result in identical coverage in the SNA and the BPM, so that the reconciliation does not contain a separate list of building blocks that are not included in the SNA or in the BPM.6
The proposals presented above are preliminary because they reflect only a limited number of responses to the SNA and BPM questionnaire. Further observations, when they become available, may modify the harmonization proposals. The number of issues included in the paper is also limited and may be expanded when other details become available on country practices. These additional issues may result in further adaptations of the modified reconciliation. It is also envisaged that the present proposals will be discussed in various international forums and that the proposed modifications of the concepts of SNA and BPM and the proposed reconciliation may be accordingly adjusted. Discussions of other parts of the SNA system, such as the government accounts, may also have their bearing on the proposals presented here. After several rounds of discussions, the ultimate result should be a set of modified guidelines for SNA and BPM, with simple links between their concepts and classifications that take into account practical limitations of statistical measurement and analytical usefulness and that do not violate the internal consistency requirements and other underlying principles of the SNA and theBPM.
6 The resulting reconciliation, the reduced list of SNA components, and a list of BPM components are given in appendices to an unpublished version of this paper, which is available from the authors on request.
8
Proposed Treatment of Reinvested Earnings on Direct Investment
GEOFFREY J. ROBERTSON
T HE ExPERT GROUP Meeting on External Sector Transactions for the Revision of the United Nations' A System of National Accounts
(SNA) held in Washington, D.C., in March-April 1987 (hereafter referred to as the External Sector Group) drew the following conclusions with regard to reinvested earnings on direct investment:
Most members of the Group agreed that both the external and the domestic sector of the national accounts, like the balance of payments, should include international flows of reinvested earnings attributable to direct investors. Direct investment and reinvested earnings on direct investment would be as defined in the OECD "Detailed Benchmark Definition of Foreign Direct Investment." The Group, furthermore, strongly recommended that a full accounting for reinvested earnings should be prepared for consideration of other groups in the SNA review process, specifically the Group on Financial Flows and Balances, and that, in that accounting particular attention should be drawn to the implications for saving and national disposable income.
Neither for the balance of payments nor for the external sector of the national accounts is there any reason to extend this treatment to portfolio investment.
The Meeting of the Balance of Payments Compilers Group held in Paris in November 1987 (hereafter referred to as the BOP Group) reached essentially the same conclusion.
This paper, prepared in response to the above recommendation of the External Sector Group, addresses some reservations held by some experts about the inclusion of reinvested earnings on direct investment in the transactions accounts of the SNA. The paper addresses the treatment of reinvested earnings on direct investment in the current SNA, the IMF's Balance of Payments Manual (BPM), and the UN
106
REINVESTED DIRECT-INVESTMENT EARNINGS 107
Provisional Guidelines on balance sheets;1 the reasons for the proposed change to the SNA in this regard; the proposed method of calculation of reinvested earnings on direct investment; the presentation of reinvested earnings on direct investment in the revised SNA; some practical issues associated with the compilation of reinvested earnings on direct reinvestment; and offers some concluding remarks.
I. Current Treatment
The BPM recognizes and includes reinvested earnings on direct investment as transaction flows. Although the current SNA does not include such transactions, it recognizes both the importance of direct investment and reinvested earnings on direct investment. In paragraph 8.100 the SNA states:
It may also be desirable to add entries to the Accounts III in order to classify certain categories of transactions further. Additions to the items exhibited in the Accounts III which warrant consideration are indicated below ....
Saving. Where a significant number of enterprises in a country are branches or subsidiaries of non-residents, it will be valuable to sub-divide the saving, entries 3.7.1 and 5.7.1, of the relevant institutional sector(s) in order to indicate the amount of saving of (direct investment in) these corporate and quasi-corporate enterprises. The division of saving into the retained income of foreign-owned branches and subsidiaries and the saving of other corporate and quasi-corporate enterprises may be of interest in the case of financial and/or non-financial enterprises.
The SNA also states (footnote 1 to Table 26 in Annex 8.3) that
Data should also be furnished in memoranda to the table on the saving (retained income) of subsidiaries and branches of residents which are located abroad and of the resident subsidiaries and branches of nonresidents.
The UN Provisional Guidelines do not mention direct investment explicitly. In their discussion of subsidiaries (paragraph 6.43), however, they recognize that resident subsidiaries do not have a net worth independent of their nonresident parent enterprises. In this respect the UN Provisional Guidelines are closer to the BPM and are inconsistent with the SNA, which currently attributes all retained earnings of resident companies to resident corporate sector saving. It
1 United Nations, Provisional International Guidelines on the National and Sectoral Balance-Sheet and Reconciliation Accounts of the System of National Accounts, Statistical Papers, Series M, No. 60 (New York, 1977).
108 EXTERNAL SECTOR TRANSACTIONS
is useful to quote paragraph 6.43 of the UN Provisional Guidelines in full:
6.43. A special situation arises in the valuation of corporate equity securities of a parent company in its resident or non-resident subsidiaries which are not included in the same statistical unit as the parent. (It should be recalled that, by definition, the parent company should own 50 per cent or more of the corporate equity securities in each of the subsidiaries.) Unlike the usual stockholders, the parent company can take possession of the net worth of the subsidiaries by selling its interest in them. Furthermore, the parent company controls the magnitude of subsidiaries' net worth as it determines the amount of dividends that they pay and thus fixes the amount of saving that they retain. It is therefore appropriate to consider that the subsidiaries do not have any independent net worth and that the value of the parents' equity securities in the subsidiaries is equivalent to the difference between the total value of the subsidiaries' assets less the total value of the subsidiaries' liabilities, including only the value of any minority interests in the case of corporate equity securities. The value of the equity securities held by the minority interests may be determined from the market value of the shares.
Direct investment in the BPM (paragraphs 408 and 409) is defined as follows:
408. Direct investment refers to investment that is made to acquire a lasting interest in an enterprise operating in an economy other than that of the investor, the investor's purpose being to have an effective voice in the management of the enterprise. The foreign entity or group of associated entities that makes the investment is termed the direct investor. The unincorporated or incorporated enterprise-a branch or subsidiary, respectively-in which direct investment is made is referred to as a directinvestment enterprise.
409. The benefits that direct investors expect to derive from their voice in management are different from those anticipated by portfolio investors having no significant influence over the operations of the enterprises. From the viewpoint of the direct investors, enterprises often represent units in a multinational operation, the overall profitability of which depends on the advantages to be gained by deploying the various resources available to the investors in units located in different economies. Direct investors are thereby in a position to derive benefits in addition to the property income that may accrue on the capital that they invest, e.g., the opportunity to earn management fees or other sorts of income. Such extra benefits are not likely to be realizable in the short run, so that the investors' association with the enterprises can be expected to continue for a considerable period. In contrast, portfolio investors are primarily con-cerned about the safety of their capital, the likelihood of an appreciation in its value, and the return that it is bringing them. They will evaluate the
REINVESTED DIRECT-INVESTMENT EARNINGS 109
prospects separately with respect to each independent unit in which they might invest and may often shift their capital with changes in these prospects.
The BPM states (paragraph 295) that reinvested earnings on direct investment "covers the earnings of branches and other unincorporated direct-investment enterprises (excluding any part that can be identified as having been remitted) and the direct investor's portion of earnings of incorporated direct-investment enterprises that are not formally distributed." In paragraph 299 it states that "reinvested earnings of direct-investment enterprises should be recorded in the balance of payments for the period in which they are earned," because, as paragraph 300 explains, "reinvested earnings represent the net income accruing during a given period." Paragraphs 301 to 303 set out the method of calculation, which provides that earnings should be calculated net of taxes, depreciation, and capital gains or losses. That is, the method is consistent with the SNA's concept of operating surplus adjusted for the receipt of property income and current transfers and the payment of interest, taxes, and current transfers. Paragraphs 304 and 305 set out the reasons for the inclusion of retained earnings as an income flow in the current account and concurrently as an imputed capital flow in the capital account of the balance of payments. Specifically, paragraph 304 notes, among other points, that
Unremitted earnings of branches and other unincorporated direct-investment enterprises, and the direct investor's portion of earnings of incorporated direct-investment enterprises that are not formally distributed, are conceived of as providing additional capital to the enterprise, thus increasing the value of an economy's stock of foreign assets and liabilities.
An important feature of the treatment of reinvested earnings on direct investment is that reinvested earnings of an enterprise are attributable to the direct investor in proportion to the direct investor's equity share. For example, in the case of a corporation in which a direct investor owns all the ordinary shares or voting stock, all the reinvested earnings of the enterprise are attributable to the direct investor. However, if the direct investor has, say, only a 35 percent equity, then only 35 percent of the reinvested earnings are attributable to that investor. This recognizes the axiom that the influence of the direct investor increases with a higher equity share. For example, in the case of a wholly owned subsidiary, the direct investor would not need to consult other owners. Where the direct investor has a 51 percent equity, then consultation with other significant shareholders would be normal; if there were no such shareholders, the direct
110 EXTERNAL SECTOR TRANSACTIONS
investor would still need to show concern about the investment interests of portfolio shareholders. With less than a 50 percent equity, the direct investor would normally either be consulted in the operation of the enterprise or, if the direct investor had a controlling interest, would still need to be concerned about the interest of other shareholders. This proportioning of reinvested earnings to direct investors according to their equity share also allows for situations in which there are several direct investors in one enterprise.
The BPM, while providing guidelines on direct investment, does not provide a set of definitive operational rules on the borderline between direct and portfolio investment. To provide more explicit rules on this and to deal with various practical issues arising with direct investment, a "Detailed Benchmark Definition of Foreign Direct Investment" was prepared in 1983 by the Organization for Economic Cooperation and Development (OECD) Group of Financial Statisticians, at the request of the Committee on International Investment and Multinational Enterprises of the OECD.2
II. Reasons for the Proposed Change to the SNA
Users of balance of payments statistics have long recognized the importance of direct investors and have attempted, in various ways, to measure the impact of such investors on the balance of payments. The IMP's Executive Board, in discussing the Final Report of the Working Party on the Statistical Discrepancy in World Current Account Balances,3 strongly endorsed the desirability of compiling and presenting statistics on reinvested earnings on direct investment as an integral part of the balance of payments and urged countries to undertake efforts in this regard.
Because of their influence in various enterprises operating in an economy, direct investors can have a significant impact in many countries on the nature, size, and direction of current and capital account flows measured in the balance of payments. Their influence is also important in decisions that are taken concerning whether enterprises distribute or retain income earned. From a behavioral standpoint, analysts have felt that, given the influence of direct investors in this way, there appears to be little difference between a situation involving the distribution of earnings in a formal sense and their subsequent investment in the enterprise as equity capital, and the
2 OECD, "Detailed Benchmark Definition of Foreign Direct Investment," General Distribution, BOP.B2 (Paris, February 1983).
3 International Monetary Fund, September 1987.
REINVESTED DIRECT-INVESTMENT EARNINGS 111
situation in which profits are simply ploughed back into further expansion of the enterprise. From an analytical viewpoint both situations imply international flows of capital. The current BPM treatment endeavors to make explicit this aspect as it relates to the decision making of the foreign direct investor. In practice it is sometimes difficult for branches of direct investors to distinguish between remitted and unremitted profits. In these circumstances, in some countries compilers treat the total earnings (less taxes and the like) of the branch as distributed profits and then include the movement in the head-office account in relation to the branch as concomitant capital flows.
Direct investment and reinvested earnings on direct investment are also important in a national accounts context. As pointed out above, the current SNA recommends that saving should be separated into that attributable to direct-investment enterprises and that attributable to other enterprises. It also recommends that reinvested earnings on direct investment be treated as a memorandum item. The proposal to change the treatment of reinvested earnings on direct investment would take this recognition a step further. The Expert Group Meeting on Production Accounts and Input-Output Tables (Vienna, March 1988) recommended that, in the revised SNA, data for corporate enterprises should be compiled separately for foreign-owned and resident-owned enterprises. For the purposes of identifying foreignowned enterprises it recommended that reference should be made to the concept of direct investment (see Chapter 12 in this volume). Their recommendation recognizes the analytical importance of the distinction between "foreign-managed" and "domestically managed" enterprises and, if implemented, would assist in the derivation of reinvested earnings as transactions flows in the compilation of national accounts.
The proposal to measure reinvested earnings on direct investment would mean that property income from and to abroad would include these reinvested earnings. Other aggregates such as national disposable income, saving, net lending, and the like would consequently change. Saving, for example, would include reinvested earnings on direct investment from abroad but would exclude reinvested earnings on direct investment to abroad. The proposal recognizes that direct investors have a key influence on the decision whether earnings should be reinvested or repatriated. Section IV sets this out more fully.
Certain objections to the proposed change have been made in various forums on conceptual grounds. Some national accounts statisticians feel that saving as currently measured in the SNA for corporate
112 EXTERNAL SECTOR TRANSACTIONS
and quasi-corporate enterprises ought to remain intact. Furthermore, in their view, if the measure of saving is changed to include reinvested earnings on direct investment attributable to direct investors, then logically it should be further changed to include reinvested earnings that are attributable to portfolio investors. This would mean excluding reinvested earnings attributable to nonresident portfolio investors from the measurement of saving. Although this view has some merit, the current SNA treatment reflects that it is corporate enterprises and not portfolio investors who decide on the distribution and retention of income earned by enterprises. This view is retained under the proposed change. However, it recognizes that in the case of direct-investment enterprises this decision is made largely by nonresident corporate enterprises rather than domestic corporate enterprises.
Some national accounts statisticians have reservations about the proposed change because in their view it leads to inconsistent treatment of domestic investors and foreign direct investors. In some enterprises, certain resident individuals or coalitions of resident individuals own and exercise a key influence over the operations of enterprises akin to that of direct investors. To treat domestic investors consistently with foreign direct investors, it is argued that in such cases the enterprises' saving should be attributed to the household sector. In response, although some individuals control or have an effective voice in the management of certain enterprises, usually these individuals would be influenced by corporate or entrepreneurial considerations rather than household considerations. Therefore, there is no inconsistency in the proposed treatment between domestic and foreign investors.
Thus, it is reasonable to advance the proposed treatment without attributing the remaining saving either to portfolio investors (and hence households) or, in the case of certain entrepreneurs, to their households.
A further reservation that is sometimes raised is that, in particular enterprises, a direct investor's influence may be less than a resident's influence. This may be true in some enterprises, but most directinvestment enterprises are usually wholly foreign-owned or have majority foreign ownership. In any case, the reinvested earnings of direct-investment enterprises under the proposal are attributable to the direct investor in proportion to the direct investor's ownership interest. This apportioning of reinvested earnings is taken up in Section III.
Some objections have been raised to the proposal on practical grounds. Because of data limitations, not all countries have been able
REINVESTED DIRECT-INVESTMENT EARNINGS 113
to include estimates for reinvested earnings and its offset, reinvestment of earnings, in their balance of payments accounts. It should be pointed out, however, that many countries have been improving their data sources. Several of these practical issues are discussed below.
Possibly the strongest argument for the proposed change is that economists and statisticians at the national level, reflecting both their user requirements and extensive experience, have both reaffirmed that reinvested earnings on direct investment should continue to be included in balance of payment& statistics and introduced into the revised SNA. These were the conclusions of the External Sector Group and the BOP Group, although there was no unanimity of view.
III. Method of Calculation
Three issues arise here. How should reinvested earnings of directinvestment enterprises be calculated? How should reinvested earnings be apportioned between direct investment and nondirect investment? How should reinvested earnings of direct-investment enterprises that are financial enterprises be treated?
Calculation of Direct-Investment Enterprises' Reinvested Earnings
As outlined in Section I, the BPM provides guidelines on the calculation of reinvested earnings. Although all the relevant principles are enunciated in the BPM, the statement is somewhat imprecise from a national compiler's viewpoint. The OECD Benchmark Definition provides a more comprehensive statement on the calculation of reinvested earnings on direct investment; paragraph 49 provides a very useful summary of its recommendations:
As a result the Group recommends that direct-investment earnings should be defined as the operational earnings of the direct-investment enterprise after deducting provisions for depreciation and for income and corporation tax charged on these earnings. Direct-investment earnings should not include any realized or unrealized capital gains or losses made by either the direct-investment enterprise or the direct investor. However, it is recommended that supplementary information be collected on these various capital gains and losses incurred by the enterprise and the direct investor in order to reconcile, or to estimate, movements in the net asset value of the stock of direct investment between the beginning and end of the period.
114 EXTERNAL SECTOR TRANSACTIONS
The measure of earnings thus defined is consistent with the SNA's measure of operating surplus adjusted for the receipt of property income and current transfers and the payment of interest, taxes, and current transfers. Although agreeing in concept, the OECD Benchmark Definition does not explain how depreciation and transfers should be valued. The BPM (paragraph 302) notes, however, that II although depreciation should, in principle, be calculated at current replacement cost, data will often be available only on an historical cost basis. II Obviously in both the revised SNA and BPM the definition should be consistent.
Calculation of the Direct Investors' Share
As mentioned above, reinvested earnings of direct-investment enterprises are attributable to direct investors in proportion to their equity share. To explain, the following examples are provided.
Assume that enterprise A in an economy records operational earnings of US$100 million, depreciation (measured on a basis consistent with SNA principles and not merely for taxation purposes) of $40 million, corporate taxes of $20 million, and remitted profits of $25 million, leaving reinvested earnings of $15 million.
If enterprise A were a branch of a nonresident corporation or a wholly owned subsidiary of a nonresident corporation, then the entire $15 million would be attributed to reinvested earnings on direct investment.
If enterprise A were less than wholly owned by a direct investor, then only the direct investor's portion would be attributed to reinvested earnings on direct investment. If enterprise A were 51 percent owned by a direct investor, then $7.65 million would be attributed to reinvested earnings on direct investment; if it were 12 percent owned by a direct investor, then $1.8 million would be attributed to reinvested earnings on direct investment. Note that under the OECD Benchmark Definition the threshold for determining a directinvestment relationship is generally a 10 percent equity ownership.
If enterprise A had an equity interest in enterprise B, then a portion of the reinvested earnings of enterprise B should also be attributed to the direct investor if a direct-investment relationship can be established between the direct investor and enterprise B. Under the OECD Benchmark Definition, in order to determine the equity portion, the direct investor's equity share in enterprise A is multiplied by enterprise A's equity share in enterprise B. If the direct investor owns 45 percent of enterprise A, which in tum owns 25 percent of enterprise
REINVESTED DIRECT-INVESTMENT EARNINGS 115
B, the direct investor's share in enterprise B is calculated as 11.25 percent. If enterprise B has reinvested earnings of $12 million, then the reinvested earnings attributed to the direct investor would be $6.75 million with respect to enterprise A plus $1.35 million with respect to enterprise B.
Treatment of Financial Enterprises
Various financial enterprises raise some additional issues for consideration. These are briefly dealt with in the following paragraphs.
Treatment of the service charges of banks and other financial intermediaries is undergoing reconsideration as part of the SNA review. Whatever the treatment that is adopted, it is proposed that the measurement of property income received and paid by banks and similar intermediaries should in the revised SNA include reinvested earnings on direct investment, receivable and payable, respectively.
Life insurance enterprises may be direct-investment enterprises. Any calculation of reinvested earnings would obviously take place after deducting the net change in the equity of households during the period. If the life insurance enterprise is a corporation owned by shareholders, calculation of reinvested earnings on direct investment takes place in the noimal way after deducting the net change in the equity of policy holders (households). If the enterprise is a branch of a foreign mutual life insurance fund, all the changes in assets of the branch would be attributed to policy holders in the domestic economy; hence there is no reinvested earnings attributed to direct investors.
lV. Presentation of Reinvested Earnings on Direct Investment in the Revised SNA
This section illustrates how entries on reinvested earnings on direct investment would be presented in the consolidated accounts of the nation. Space considerations prevent the presentation of the actual accounts; the reader who wishes to follow the entries described below more closely should consult the "Consolidated accounts for the nation," which appear on pages 152-54 in the current SNA. To illustrate, it is assumed that in a country direct investors decide to reinvest $500 million in their direct-investment enterprises abroad, while direct investors abroad decide to reinvest $300 million in the country in a given period.
Under the proposed treatment, in the account for National Disposable Income and Its Appropriation, the entries 3.4.10 ("Property and
116 EXTERNAL SECTOR TRANSACTIONS
entrepreneurial income from the rest of the world, net") and 3.7.1 ("Saving") would each increase by $200 million, as would the totals "Appropriation of disposable income" and "Disposable income."
Similarly in the Capital Finance account, the entries 5.7.8 and 5.7.9 ("Net lending to the rest of the world") and 5.7.1 ("Saving") would increase by $200 million. In addition, entry 5.8.0 ("Net acquisition of financial assets") would increase, or entry 5.9.0 ("Net incurrence of liabilities") would decrease, by $200 million, as would the corresponding totals.
Finally, in the External Transactions account, entry 6.4.9 ("Property and entrepreneurial income from the rest of the world") would increase by $500 million, while entry 6.4.8 ("Property and entrepreneurial income to the rest of the world") would increase by $300 million. The entries 6.7.3 and 6.7.2 ("Surplus of the nation on current transactions") would increase by $200 million, while entry 6.8.0 ("Net acquisition of foreign financial assets") would increase, or entry 6.9.0 ("Net incurrence of foreign liabilities") would decrease, by $200 million. Correspondingly, the totals of this account would also change.
In supplementary tables, separate details should be provided on reinvested earnings on direct investment and other income items. It would also be useful to show the derivation of reinvested earnings on direct investment. This could be done by presenting a supplementary table on direct-investment enterprises that showed their operating profits; their depreciation; their corporate taxes; their distribution of earnings to direct investors, foreign portfolio shareholders, and domestic investors, separately; and their retained earnings attributable to their direct and other investors, separately. Data in this table when compared with data on non-direct-investment enterprises would provide a useful starting point for analyzing behavioral differences between direct-investment and other enterprises. In addition, it should also be possible to disaggregate data on direct-investment enterprises by industry of investee in the domestic economy and by country of investor. This would provide further information on the behavior of direct investors.
V. Compilation of Estimates of Reinvested Earnings on Direct Investment: Practical Issues
As mentioned earlier, not all countries currently produce estimates of reinvested earnings on direct investment for inclusion in their bal-
REINVESTED DIRECT-INVESTMENT EARNINGS 117
ance of payments accounts. This is particularly true where countries rely on administrative records of foreign exchange transactions (which are not a good source of data on direct investment) rather than on direct surveys of enterprises. More and more countries, however, are recognizing the desirability of obtaining good data on direct investment, including reinvested earnings transactions, and have been investigating or introducing surveys to collect such data. The experience of countries that have introduced surveys is that directinvestment enterprises, which often wish to be "good corporate citizens," readily cooperate with the statistical authority if data being collected are kept confidential and are used for statistical purposes only. Another potentially useful, but underrated source, is taxation data on corporate profits, which may complement survey data and allow the national statistical compiler to obtain reasonably accurate data.
From the national accounts side, many countries have seen the need to improve data on corporate profits. The link between operating surplus and reinvested earnings has been shown above; there is an obvious advantage in coordinating surveys of company profits and direct investment. By ensuring consistency between the two data sets, current balance of payments estimates of reinvested earnings on direct investment may be improved.
Because company accounts may not meet all the economic statistician's requirements, it may be necessary for certain adjustments to be carried out to ensure consistency between balance of payments and national accounts data, particularly with reference to the measurement of operating profit and depreciation.
The Fund's Bureau of Statistics has an interest in seeing improvements in the quality of national accounts and balance of payments data and intends, as part of its future work, to develop practical guidelines for balance of payments reporting, including sample questionnaires, collection forms, and the like that could be of considerable assistance to countries initiating or improving collections of data from direct-investment enterprises.
Therefore, although the data on reinvested earnings are not available in all countries, countries have been looking at ways to improve their data collections. In addition, there are links between the collection of corporate profits and direct-investment transaction data that may be exploited to improve the coordination of these data. As noted above, the Fund's Bureau of Statistics also plans an active program of assistance to help countries establish or improve appropriate balance of payments collection methodology.
118 EXTERNAL SECTOR TRANSACTIONS
VI. Conclusions
Although there may be misgivings by some experts about the introduction of reinvested earnings on direct investment into the national accounts, from an analytical standpoint it would be desirable to incorporate reinvested earnings in the transaction accounts of the SNA as outlined in Section Iv. Such a revision of current practice would provide for an alignment of the SNA with the UN Provisional Guidelines. There are some practical difficulties with implementation of the proposal, but these difficulties are being addressed at the national level and should soon be overcome. The IMF's Bureau of Statistics plans an active program of support to national compilers to facilitate this process.
9
Oassification of International Transactions in Services, Income, and Unrequited Current Transfers
ARIE c. BoUTER
D URING 1973-75 a small, representative group of national compilers was co-opted to assist, in the capacity of consultants, IMF
staff in planning the fourth edition of the Fund's Balance of Payments Manual (BPM). This group reviewed in detail the classification of international transactions in services, income, and unrequited transfers in the third edition of the BPM and carefully weighed the merits of that and similar schemes in earlier editions of the BPM against the advantages of other schemes that could be substituted for them. 1
From that review emerged the recommendations for the considerably abbreviated list of standard components set out in the fourth edition of the BPM (42 components for services, income, and unrequited transfers in the fourth edition compared with 206 components in the third edition). The recommendations were based on the suitability of the list for application by Fund member countries with different balance of payments structures, as well as disparate levels of development with respect to their statistical base. In view of those recommendations, the inability of some countries to provide separate data for even the 42 components called for in the fourth edition of the BPM, and the reductions in the budgets of some national statistical offices, the increase in the number of standard components recently requested by some users of the statistics must be carefully reviewed.
Table 1 presents a list of standard components of international
1 Because the classification of international transactions in services and income in A System of National Accounts (SNA) is less detailed than that in the BPM, this paper refers only to the latter.
119
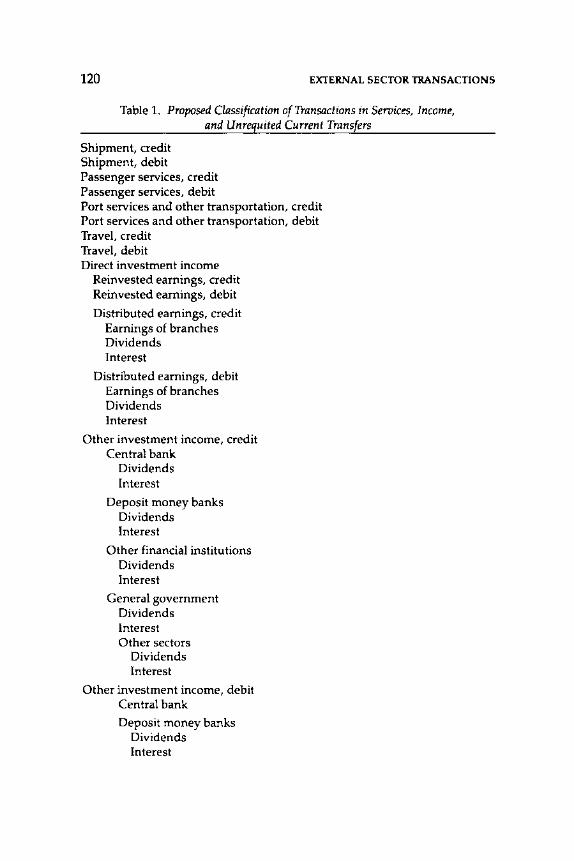
120 EXTERNAL SECTOR TRANSACTIONS
Table 1. Proposed Classification of Transactions in Seroices, Income, and Unrequited Current Transfers
Shipment, credit Shipment, debit Passenger services, credit Passenger services, debit Port services and other transportation, credit Port services and other transportation, debit Travel, credit Travel, debit Direct investment income
Reinvested earnings, credit Reinvested earnings, debit
Distributed earnings, credit Earnings of branches Dividends Interest
Distributed earnings, debit Earnings of branches Dividends Interest
Other investment income, credit Central bank
Dividends Interest
Deposit money banks Dividends Interest
Other financial institutions Dividends Interest
General government Dividends Interest Other sectors
Dividends Interest
Other investment income, debit Central bank
Deposit money banks Dividends Interest
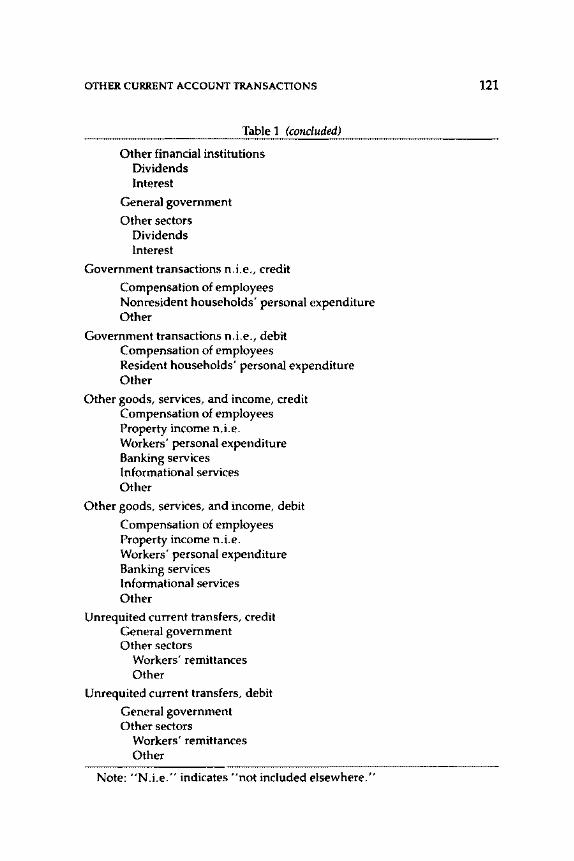
OTHER CURRENT ACCOUNT TRANSACTIONS
Table 1 (concluded)
Other financial institutions Dividends Interest
General government
Other sectors Dividends Interest
Government transactions n.i.e., credit
Compensation of employees Nonresident households' personal expenditure Other
Government transactions n.i.e., debit Compensation of employees Resident households' personal expenditure Other
Other goods, services, and income, credit Compensation of employees Property income n.i.e. Workers' personal expenditure Banking services Informational services Other
Other goods, services, and income, debit
Compensation of employees Property income n.i.e. Workers' personal expenditure Banking services Informational services Other
Unrequited current transfers, credit General government Other sectors
Workers' remittances Other
Unrequited current transfers, debit
General government Other sectors
Workers' remittances Other
Note: "N.i.e." indicates "not included elsewhere."
121
122 EXTERNAL SECTOR TRANSACTIONS
transactions in services, income, and unrequited current transfers that have been suggested by IMF staff to replace those given in the fourth edition of the BPM.2 One of the suggestions is that investment income be broken down into interest and dividends, a breakdown that is indispensable for compiling debt service ratios. In addition, to enhance the analytical usefulness of the data, other investment income should be classified by domestic rather than by foreign sectors.
The Fund staff's proposal for distinguishing between factor income and other income, as well as for separately identifying unrequited current transfers, is in line with attempts to harmonize the classification of international transactions in the BPM and the United Nations' A System of National Accounts (SNA). Moreover, the breakdown of other goods, services, and income into banking services, informational services, and other services reflects the view that the growth in banking and informational services warrants the separate recording of these two categories of services.
2 See the BPM, paragraphs 183-90, and the list of standard components of the balance of payments, p. 66. An alternative, more detailed classification of transactions in services and income was proposed by the Statistical Office of the European Communities (EUROSTAT) in "Classification of Exchanges in Invisibles (CEI)," Working Document for the Meeting of the Balance of Payments Working Party, BP 86-16, October 30-31 (Luxembourg, 1986).
10
Measurement of a Nation's Terms of Trade Effect and Real National Disposable Income
Within a National Accounting Framework
MICK SILVER AND I<HASHAYAR MAHDA VY
T HE UNITED NATIONS' 1968 A System of National Accounts (SNA) and subsequent guidelines and manuaJl include no recommendations
for the measurement of both the terms of trade effect and real national income. However, many countries have in practice introduced measures of the terms of trade effect into their accounts. 2 The
Note: This paper originally appeared in the Journal of the Royal Statistical Society, Series A (Statistics in Society}, Volume 152 (Part 1, 1989}, ·pp. 87-107, and is reprinted here, with only minor editorial modifications, by permission. It is based on a discussion document by the authors that was presented under the aegis of the IMF to the United Nations Expert Group on the SNA review (Luxembourg, 1986}. The research was conducted while the authors were consultant and summer intern, respectively, at the Fund. The authors are grateful for comments received from the meetings and from the journal's referees and to Chandrakant Patel and Simon Quinn of the Fund's Bureau of Statistics and John Muelbauer of Oxford University for their help. The views expressed are those of the authors and should not be attributed to the Fund.
1 United Nations, Guidelines on Principles of a System of Price and Quantity Statistics, Statistical Papers, Series M, No. 59 (New York, 1977}; United Nations, Manual on National Accounts at Constant Prices, Statistical Papers, Series M, No. 64 (New York, 1979}.
2 See, for example, Hibbert and Denison for an account of U.K. and U.S. practice: J. Hibbert, "Measuring Changes in a Nation's Real Income," Economic Trends, No. 255 (1975}, pp. 28-35; E.F. Denison, "International Transac-
123
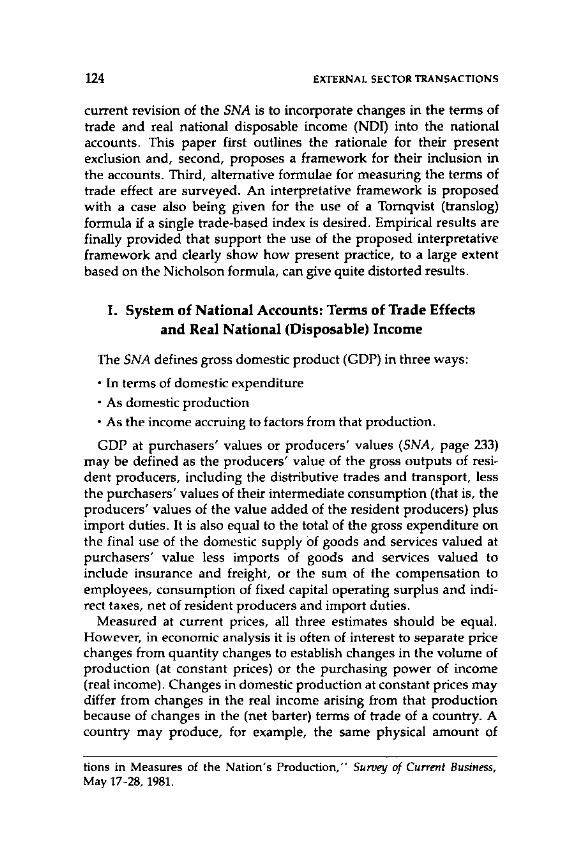
124 EXTERNAL SECTOR TRANSACTIONS
current revision of the SNA is to incorporate changes in the terms of trade and real national disposable income (NDI) into the national accounts. This paper first outlines the rationale for their present exclusion and, second, proposes a framework for their inclusion in the accounts. Third, alternative formulae for measuring the terms of trade effect are surveyed. An interpretative framework is proposed with a case also being given for the use of a Tornqvist (translog) formula if a single trade-based index is desired. Empirical results are finally provided that support the use of the proposed interpretative framework and dearly show how present practice, to a large extent based on the Nicholson formula, can give quite distorted results.
I. System of National Accounts: Terms of Trade Effects and Real National (Disposable) Income
The SNA defines gross domestic product (GOP) in three ways:
• In terms of domestic expenditure • As domestic production • As the income accruing to factors from that production.
GOP at purchasers' values or producers' values (SNA, page 233) may be defined as the producers' value of the gross outputs of resident producers, including the distributive trades and transport, less the purchasers' values of their intermediate consumption (that is, the producers' values of the value added of the resident producers) plus import duties. It is also equal to the total of the gross expenditure on the final use of the domestic supply of goods and services valued at purchasers' value less imports of goods and services valued to include insurance and freight, or the sum of the compensation to employees, consumption of fixed capital operating surplus and indirect taxes, net of resident producers and import duties.
Measured at current prices, all three estimates should be equal. However, in economic analysis it is often of interest to separate price changes from quantity changes to establish changes in the volume of production (at constant prices) or the purchasing power of income (real income). Changes in domestic production at constant prices may differ from changes in the real income arising from that production because of changes in the (net barter) terms of trade of a country. A country may produce, for example, the same physical amount of
tions in Measures of the Nation's Production," Survey of Current Business, May 17-28, 1981.
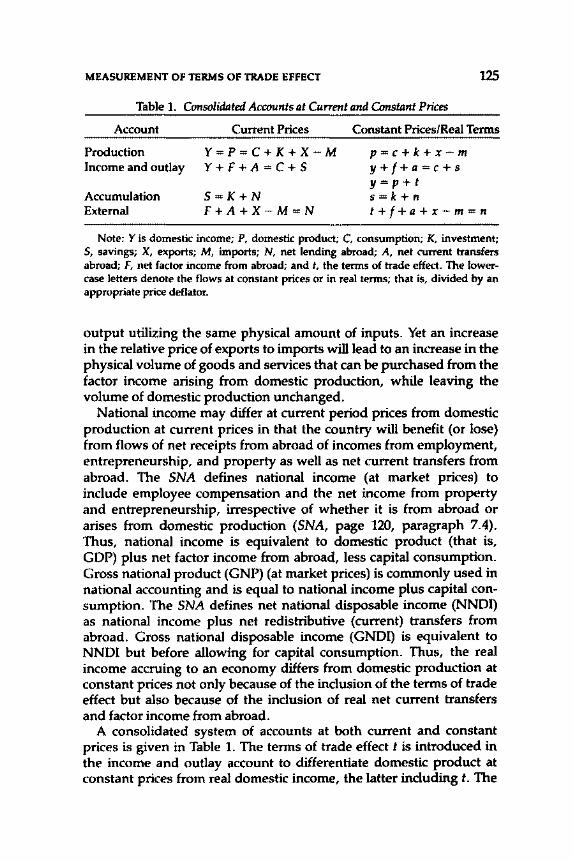
MEASUREMENT OF TERMS OF TRADE EFFECT 125
Table 1. Consolidated Accounts at Cu"ent and Constant Prices
Account
Production Income and outlay
Accumulation External
Current Prices
Y=P=C+K+X-M Y+F+A=C+S
S=K+N F+A+X-M=N
Constant Prices/Real Terms
p=c+k+x-m y+f+a=c+s y=p+t s=k+n t+f+a+x-m=n
Note: Y is domestic income; P, domestic product; C, consumption; K, investment; S, savings; X, exports; M, imports; N, net lending abroad; A, net current transfers abroad; F, net factor income from abroad; and t, the terms of trade effect. The lowercase letters denote the flows at constant prices or in real terms; that is, divided by an appropriate price deflator.
output utilizing the same physical amount of inputs. Yet an increase in the relative price of exports to imports will lead to an increase in the physical volume of goods and services that can be purchased from the factor income arising from domestic production, while leaving the volume of domestic production unchanged.
National income may differ at current period prices from domestic production at current prices in that the country will benefit (or lose) from flows of net receipts from abroad of incomes from employment, entrepreneurship, and property as well as net current transfers from abroad. The SNA defines national income (at market prices) to include employee compensation and the net income from property and entrepreneurship, irrespective of whether it is from abroad or arises from domestic production (SNA, page 120, paragraph 7.4). Thus, national income is equivalent to domestic product (that is, GOP) plus net factor income from abroad, less capital consumption. Gross natiorial product (GNP) (at market prices) is commorily used in national accounting and is equal to national income plus capital consumption. The SNA defines net national disposable income (NNDI) as national income plus net redistributive (current) transfers from abroad. Gross national disposable income (GNDI) is equivalent to NNDI but before allowing for capital consumption. Thus, the real income accruing to an economy differs from domestic production at constant prices not orily because of the inclusion of the terms of trade effect but also because of the inclusion of real net current transfers and factor income from abroad.
A consolidated system of accounts at both current and constant prices is given in Table 1. The terms of trade effect t is introduced in the income and outlay account to differentiate domestic product at constant prices from real domestic income, the latter including t. The
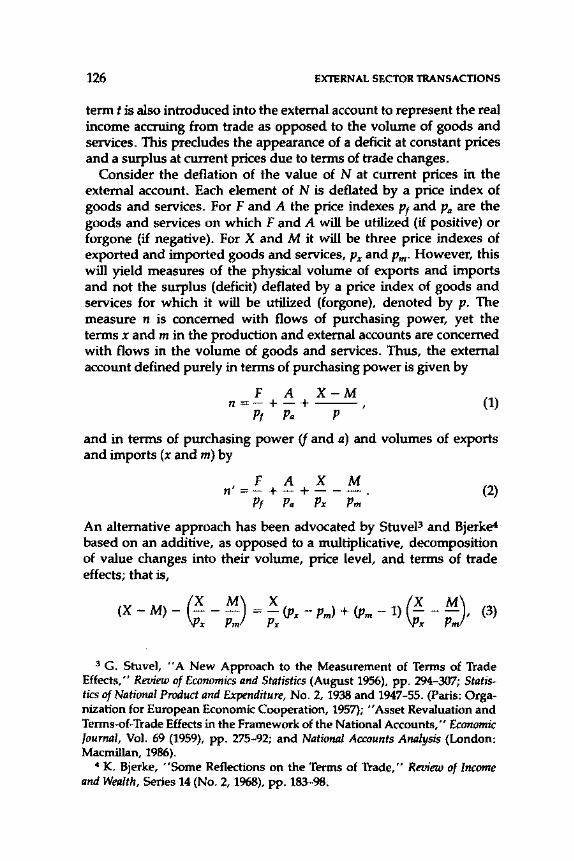
126 EXTERNAL SECTOR TRANSACTIONS
term t is also introduced into the external account to represent the real income accruing from trade as opposed to the volume of goods and services. This precludes the appearance of a deficit at constant prices and a surplus at current prices due to terms of trade changes.
Consider the deflation of the value of N at current prices in the external account. Each element of N is deflated by a price index of goods and services. For F and A the price indexes Pt and Pa are the goods and services on which F and A will be utilized (if positive) or forgone (if negative). For X and Mit will be three price indexes of exported and imported goods and services, Px and Pm· However, this will yield measures of the physical volume of exports and imports and not the surplus (deficit) deflated by a price index of goods and services for which it will be utilized (forgone), denoted by p. The measure n is concerned with flows of purchasing power, yet the terms x and m in the production and external accounts are concerned with flows in the volume of goods and services. Thus, the external account defined purely in terms of purchasing power is given by
F A X-M n=-+-+---
Pt Pa P (1)
and in terms of purchasing power (f and a) and volumes of exports and imports (x and m) by
F A X M n' =- + - + - - - .
Pt Pa Px Pm (2)
An alternative approach has been advocated by StuveP and Bjerke4 based on an additive, as opposed to a multiplicative, decomposition of value changes into their volume, price level, and terms of trade effects; that is,
~ M) X (J M) (X - M) - - - - = - (Px - Pm) + (Pm - 1) - - - , (3) x Pm Px x Pm
3 G. Stuve), "A New Approach to the Measurement of Terms of Trade Effects," Review of Economics and Statistics (August 1956), pp. 294-307; Statistics of National Product and Expenditure, No.2, 1938 and 1947-55. (Paris: Organization for European Economic Cooperation, 1957); "Asset Revaluation and Terms-of-Trade Effects in the Framework of the National Accounts," Economic Journal, Vol. 69 (1959), pp. 275-92; and National Accounts Analysis (London: Macmillan, 1986).
4 K. Bjerke, "Some Reflections on the Terms of Trade," Review of Income and Wealth, Series 14 (No. 2, 1968), pp. 183-98.
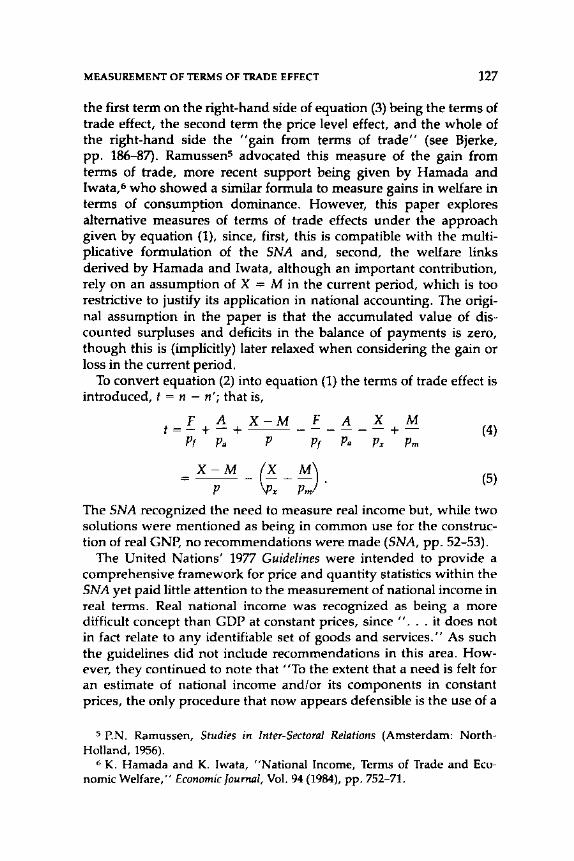
MEASUREMENT OF TERMS OF TRADE EFFECT 127
the first term on the right-hand side of equation (3) being the terms of trade effect, the second term the price level effect, and the whole of the right-hand side the "gain from terms of trade" (see Bjerke, pp. 186-87). Ramussen5 advocated this measure of the gain from terms of trade, more recent support being given by Hamada and Iwata, 6 who showed a similar formula to measure gains in welfare in terms of consumption dominance. However, this paper explores alternative measures of terms of trade effects under the approach given by equation (1), since, first, this is compatible with the multiplicative formulation of the SNA and, second, the welfare links derived by Hamada and Iwata, although an important contribution, rely on an assumption of X = M in the current period, which is too restrictive to justify its application in national accounting. The original assumption in the paper is that the accumulated value of discounted surpluses and deficits in the balance of payments is zero, though this is (implicitly) later relaxed when considering the gain or loss in the current period.
To convert equation (2) into equation (1) the terms of trade effect is introduced, t = n - n'; that is,
F A X-M F A X M t=-+-+ ------+-Pt Pa P Pt Pa Px Pm
(4)
= X - M _ (~ _ M) . P \Px Pm
(5)
The SNA recognized the need to measure real income but, while two solutions were mentioned as being in common use for the construction of real GNP, no recommendations were made (SNA, pp. 52-53}.
The United Nations' 1977 Guidelines were intended to provide a comprehensive framework for price and quantity statistics within the SNA yet paid little attention to the measurement of national income in real terms. Real national income was recognized as being a more difficult concept than GOP at constant prices, since ". . . it does not in fact relate to any identifiable set of goods and services." As such the guidelines did not include recommendations in this area. However, they continued to note that ''To the extent that a need is felt for an estimate of national income and/or its components in constant prices, the only procedure that now appears defensible is the use of a
s P.N. Ramussen, Studies in Inter-Sectoral Relations (Amsterdam: NorthHolland, 1956).
6 K. Hamada and K. Iwata, "National Income, Terms of Trade and Economic Welfare," Economic Journal, Vol. 94 (1984), pp. 752-71.
128 EXTERNAL SECTOR TRANSACTIONS
prices, the only procedure that now appears defensible is the use of a single general deflator, such as for instance the implicit deflator of the gross domestic product, for all components. "7
The United Nations' 1979 Manual provided an elaboration of issues concerned with price and quantity statistics given by the United Nations (SNA and Guidelines). However, it noted that the choice of deflator for the measurement of real income was inevitably to some degree arbitrary and subjective. As such the term "accounts at constant prices" in the SNA was recommended to apply only to identifiable flows of goods and services which could be directly factored into price and quantity components. The gains or losses to national income from terms of trade movements, while recognized as being useful for certain types of economic analysis, were held to " ... not be recorded in the accounts for purposes of international reporting. " 8
It was argued that such estimates were for the users of statistics, not the compilers, since first the choice of deflator was held to depend on the kind of analysis undertaken and, second, the judgment involved in the choice of deflator was believed to introduce a level of subjectivity beyond that acceptable in a statistical publication. This has not stopped many countries from introducing measures of the terms of trade effect into their accounts. (The United Kingdom's national accounts include an adjustment for terms of trade effects, as do those for the United States. GNP adjusted for terms of trade in the latter case is referred to as a "command (over goods and services) series." For details of U.K. and U.S. practices, respectively, along with an outline of alternative methods, see Hibbert and Denison.)9 Indeed a large variety of formulae have been proposed over the years for the measurement of terms of trade effects (these are discussed later), though none has provided a satisfactory solution to the problems discussed earlier.
One facet of the current review of the SNA is the inclusion of measures of terms of trade effects and real income in the accounts. This paper will next consider alternative frameworks for these measures, followed by the related issue of choice of deflators. Some proposals for formulae are then made along with some evidence that supports the proposals and shows the quite misleading results that would arise from present practice.
7 United Nations, Guidelines, p. 6, paragraph 28. 8 United Nations, Manual, p·. 7, paragraph 1.6. 9 See note 2, above.
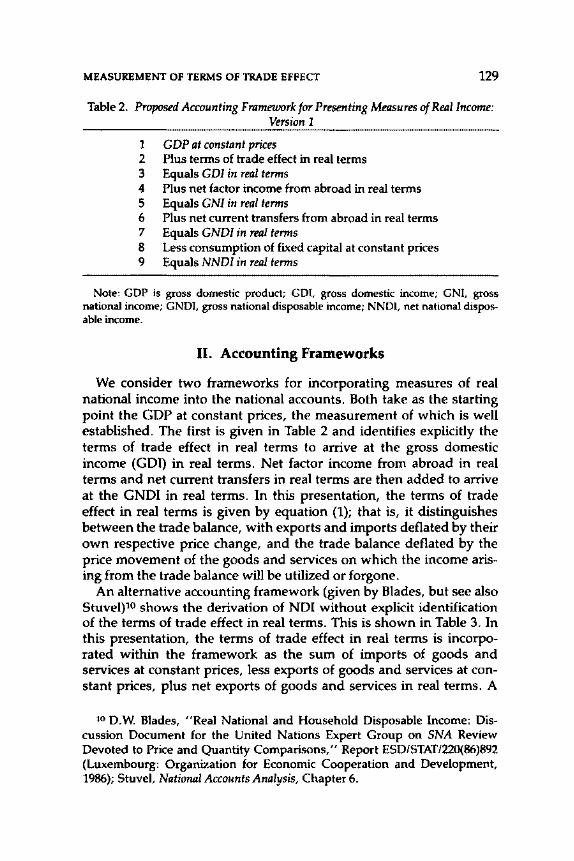
MEASUREMENT OF TERMS OF TRADE EFFECT 129
Table 2. Proposed Accounting Framework for Presenting Measures of Real Income: Version 1
1 GDP at constant prices 2 Plus terms of trade effect in real terms 3 Equals GDI in real terms 4 Plus net factor income from abroad in real terms 5 Equals GNI in real terms 6 Plus net current transfers from abroad in real terms 7 Equals GNDI in real terms 8 Less consumption of fixed capital at constant prices 9 Equals NNDI in real terms
Note: GOP is gross domestic product; GDI, gross domestic income; GNI, gross national income; GNDI, gross national disposable income; NNDI, net national disposable income.
II. Accounting Frameworks
We consider two frameworks for incorporating measures of real national income into the national accounts. Both take as the starting point the GDP at constant prices, the measurement of which is well established. The first is given in Table 2 and identifies explicitly the terms of trade effect in real terms to arrive at the gross domestic income (GDI) in real terms. Net factor income from abroad in real terms and net current transfers in real terms are then added to arrive at the GNDI in real terms. In this presentation, the terms of trade effect in real terms is given by equation (1); that is, it distinguishes between the trade balance, with exports and imports deflated by their own respective price change, and the trade balance deflated by the price movement of the goods and services on which the income arising from the trade balance will be utilized or forgone.
An alternative accounting framework (given by Blades, but see also Stuvel)1° shows the derivation of NDI without explicit identification of the terms of trade effect in real terms. This is shown in Table 3. In this presentation, the terms of trade effect in real terms is incorporated within the framework as the sum of imports of goods and services at constant prices, less exports of goods and services at constant prices, plus net exports of goods and services in real terms. A
to D.W. Blades, "Real National and Household Disposable Income: Discussion Document for the United Nations Expert Group on SNA Review Devoted to Price and Quantity Comparisons," Report ESD/STAT/220(86)892 (Luxembourg: Organization for Economic Cooperation and Development, 1986); Stuve], National Accounts Analysis, Chapter 6.
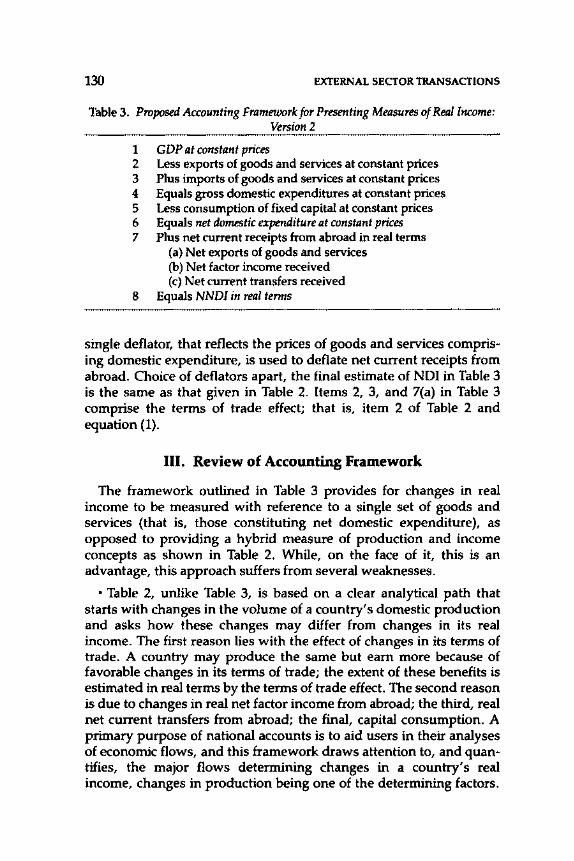
130 EXTERNAL SECTOR TRANSACTIONS
Table 3. Proposed Accounting Framework for Presenting Measures of Real Income: Version 2
1 GDP at constant prices 2 Less exports of goods and services at constant prices 3 Plus imports of goods and services at constant prices 4 Equals gross domestic expenditures at constant prices 5 Less consumption of fixed capital at constant prices 6 Equals net domestic expenditure at constant prices 7 Plus net current receipts from abroad in real terms
(a) Net exports of goods and services (b) Net factor income received (c) Net current transfers received
8 Equals NNDI in real terms
single deflator, that reflects the prices of goods and services comprising domestic expenditure, is used to deflate net current receipts from abroad. Choice of deflators apart, the final estimate of NDI in Table 3 is the same as that given in Table 2. Items 2, 3, and 7(a) in Table 3 comprise the terms of trade effect; that is, item 2 of Table 2 and equation (1).
III. Review of Accounting Framework
The framework outlined in Table 3 provides for changes in real income to be measured with reference to a single set of goods and services (that is, those constituting net domestic expenditure), as opposed to providing a hybrid measure of production and income concepts as shown in Table 2. While, on the face of it, this is an advantage, this approach suffers from several weaknesses.
• Table 2, unlike Table 3, is based on a clear analytical path that starts with changes in the volume of a country's domestic production and asks how these changes may differ from changes in its real income. The first reason lies with the effect of changes in its terms of trade. A country may produce the same but earn more because of favorable changes in its terms of trade; the extent of these benefits is estimated in real terms by the terms of trade effect. The second reason is due to changes in real net factor income from abroad; the third, real net current transfers from abroad; the final, capital consumption. A primary purpose of national accounts is to aid users in their analyses of economic flows, and this framework draws attention to, and quantifies, the major flows determining changes in a country's real income, changes in production being one of the determining factors.
MEASUREMENT OF TERMS OF TRADE EFFECT 131
Table 2 may constitute a hybrid of concepts, but this is quite meaningful within the analytical framework.
• The approach given in Table 3 does not make explicit the terms of trade effect. Indeed Blades proposed in a discussion document that the framework in Table 3 be accompanied by separate estimates of the terms of trade effect using a trade-based deflator. 11 However, in using a different deflator, different results would arise from that explicitly shown for the terms of trade effect and that implicit in the estimate of real NO I. The calculation of a terms of trade effect using a trade-based deflator was considered by Blades to be separate from, and inappropriate for, the measurement of real NDI, and regarded as a separate measurement problem. The basis for this position was the case given by the United Nations Statistical Office, which was held to argue convincingly that the index used for deflating the terms of trade effect must be trade based.12 Yet, the same paper notes that the choice between deflators can only be judged in terms of how appropriate they are for measuring II. • • how much more was earned (from production and other sources) in terms of quantities of goods and services for which this income is utilized. II There is no reason to confine the goods and services for which this income is utilized to traded ones. Real production differs from real income, in part, owing to the terms of trade effect. A case has yet to be presented for taking the terms of trade effect out of this framework. It is, in any event, implicit in any comprehensive measure of real NO I.
• The presentation of a single measure of NDI gives the distinct impression that the nation's real income is being estimated in some objective sense, whereas what is being estimated is real income contingent on a particular utilization of the income flows. The fact that a deflator is used consistently throughout the framework does not give any further credence to the use of that deflator.
IV. Alternative Deflators
Table 4 lists alternative deflators and their corresponding terms of trade effect. These deflators can be classified into two categories:
11 Ibid. 12 United Nations Statistical Office (UNSO), "The Treatment of Terms
of-Trade Effect in Measuring Economic Growth," Report ESA/SAT/AD.2714 (New York, 1986).
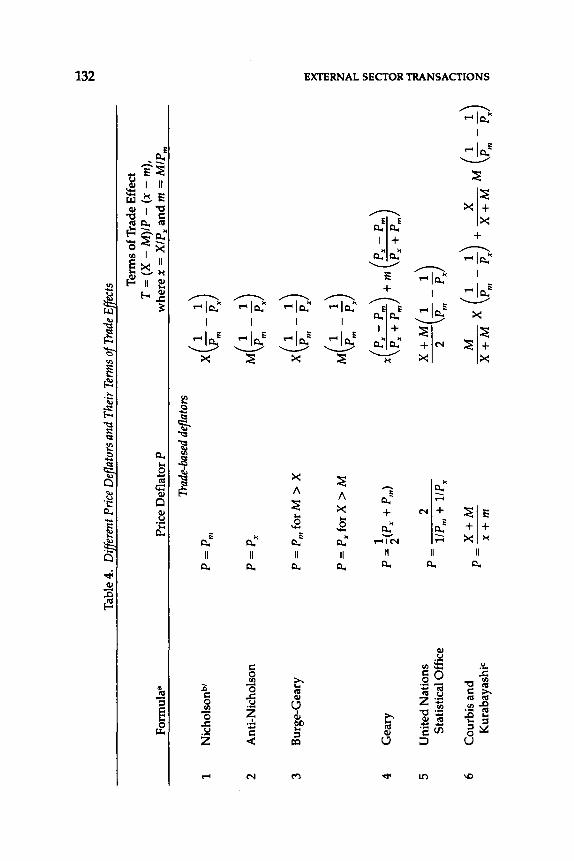
""""
w
N
Tab
le 4
. D
iff.e
rent
Pric
e D
ef!.a
tors
and
The
ir T
erm
s o[
Tra
de E
ff.ec
ts Ter
ms
of T
rade
Eff
ect
T =
(X
-M
)/P
-(x
-m
),
Form
ula a
Pr
ice
Def
lato
r P
w
here
x =
X/P
x an
d m
= M
IP,
Trad
e-ba
sed
defla
tors
Nic
hols
onb'
p
= P
, (
1 1
) 1
X---
P,
px
2 A
nti-
Nic
hols
on
p =
Px
M( _
!_-
_!_)
P,
px
3 B
urge
-Gea
ry
P =
P,f
orM
>X
(
1 1
) X
---
P,
px
1'1
M( _
!_-
_!_)
~ P
= P
xfor
X >
M
~ P
, px
>
r"
' U
l
(px
-P
,)
(Px
-P
,)
1'1
Gea
ry
1 ("
)
4 p
= 2
(Px
+ P
,)
X
Px+
P,
+m
P
x+
P,
a lG
5 U
nite
d N
atio
ns
P=
2
X+
M(1
1
) ~
Stat
istic
al O
ffic
e ------
z 1
/P,
+ 1
/Px
2 P
, Px
U
l >
(")
6 C
ourb
isan
d P
=X
+M
M
(1
1
) X
(1
1
) ::!
0
Kur
abay
ashi
c X
+ M
X
P
,-Px
+
X+
M M
P
,-Px
z
x +
m
Ul
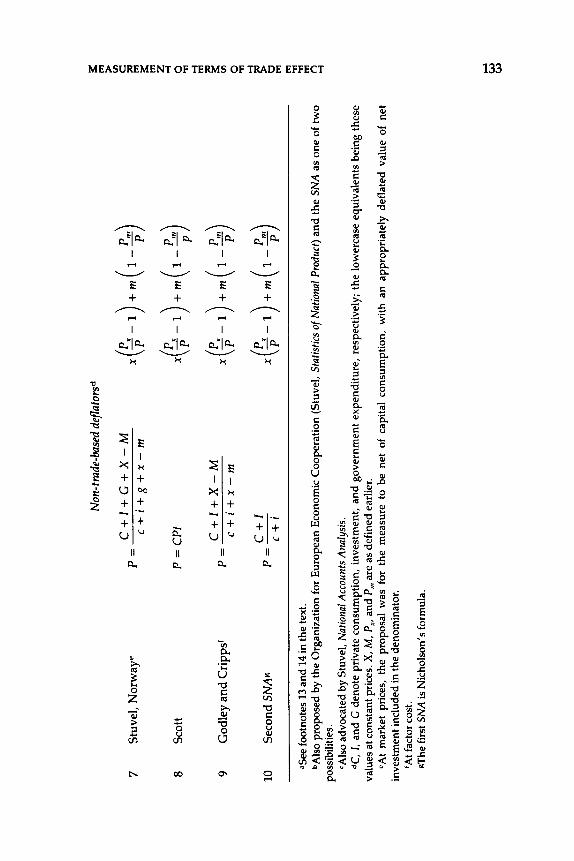
Non
-trad
e-ba
sed
defla
tors
d
Stu
ve!,
Nor
way
<>
P=
C
+l+
G+
X-M
x (;-
1) +
m ( 1
-pp)
7 c+
i+g
+x-m
8 S
cott
P
= C
PI
x(; -
1) +
m ( 1 -
P;,)
9 G
odle
y an
d C
ripp
sf
P=
C+
l+X
-M
x(i-
1) +
m ( 1-
pp)
c+
i+x-m
10 S
econ
d SN
Ag
p =
C
+I
(px
) (
pm)
c+z
x -p-
1 +
m
1---p
•See
foo
tnot
es 1
3 an
d 14
in t
he te
xt.
bAls
o pr
opos
ed b
y th
e O
rgan
izat
ion
for
Eur
opea
n E
cono
mic
Coo
pera
tion
(S
tuve
l, S
tatis
tics
of N
atio
nal
Pro
duct
) an
d t
he S
NA
as
on
e of
tw
o po
ssib
ilit
ies.
<A
lso
advo
cate
d by
Stu
vel,
Nat
iona
l A
ccou
nts
Ana
lysi
s.
dC,
I, an
d G
den
ote
priv
ate
cons
umpt
ion,
inv
estm
ent,
an
d g
over
nmen
t ex
pend
itur
e, r
espe
ctiv
ely;
the
low
erca
se e
quiv
alen
ts b
eing
the
se
valu
es a
t con
stan
t pri
ces.
X,
M,
Px,
and
P,.
are
as d
efin
ed e
arli
er.
•At
mar
ket
pric
es,
the
prop
osal
was
for
the
mea
sure
to
be n
et o
f ca
pita
l co
nsum
ptio
n, w
ith
an a
ppro
pria
tely
def
late
d va
lue
of n
et
inve
stm
ent i
nclu
ded
in t
he d
enom
inat
or.
fAt
fact
or c
ost.
KTh
e fi
rst
SNA
is
Nic
hols
on's
for
mul
a.
8:
1!1 >
en c: :Ill
1!1 8:
1!1 z ool 0 "" ;! ~ en
0 "" ~ 0 1!1
1!1 "" "" 1!1
("l
ool ,...., ~
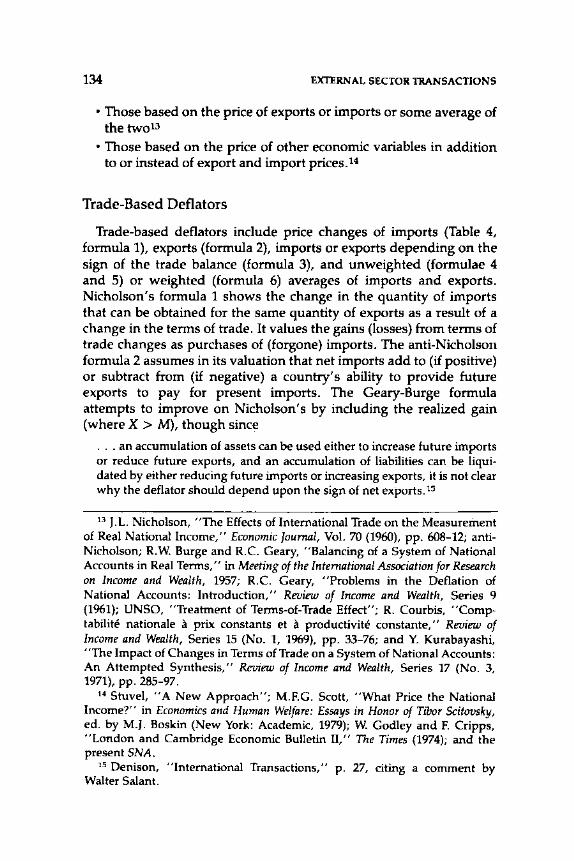
134 EXTERNAL SECTOR TRANSACTIONS
• Those based on the price of exports or imports or some average of thetwot3
• Those based on the price of other economic variables in addition to or instead of export and import prices.14
Trade-Based Deflators
Trade-based deflators include price changes of imports (Table 4, formula 1), exports (formula 2), imports or exports depending on the sign of the trade balance (formula 3), and unweighted (formulae 4 and 5) or weighted (formula 6) averages of imports and exports. Nicholson's formula 1 shows the change in the quantity of imports that can be obtained for the same quantity of exports as a result of a change in the terms of trade. It values the gains (losses) from terms of trade changes as purchases of (forgone) imports. The anti-Nicholson formula 2 assumes in its valuation that net imports add to (if positive) or subtract from (if negative) a country's ability to provide future exports to pay for present imports. The Geary-Burge formula attempts to improve on Nicholson's by including the realized gain (where X> M), though since
. . . an accumulation of assets can be used either to increase future imports or reduce future exports, and an accumulation of liabilities can be liquidated by either reducing future imports or increasing exports, it is not dear why the deflator should depend upon the sign of net exports.1s
13 J.L. Nicholson, "The Effects of International Trade on the Measurement of Real National Income," Economic Journal, Vol. 70 (1960), pp. 608-12; antiNicholson; R.W. Burge and R.C. Geary, "Balancing of a System of National Accounts in Real Terms," in Meeting of the International Association for Research on Income and Wealth, 1957; R.C. Geary, "Problems in the Deflation of National Accounts: Introduction," Review of Income and Wealth, Series 9 (1961); UNSO, "Treatment of Terms-of-Trade Effect"; R. Courbis, "Comptabilite nationale a prix constants et a productivite constante," Review of Income and Wealth, Series 15 (No. 1, 1969), pp. 33-76; and Y. Kurabayashi, "The Impact of Changes in Terms of Trade on a System of National Accounts: An Attempted Synthesis," Review of Income and Wealth, Series 17 (No. 3, 1971), pp. 285-97.
14 Stuvel, "A New Approach"; M.F.G. Scott, "What Price the National Income?" in Economics and Human Welfare: Essays in Honor of Tibor Scitovsky, ed. by M.J. Boskin (New York: Academic, 1979); W. Godley and F. Cripps, "London and Cambridge Economic Bulletin II," The Times (1974); and the present SNA.
15 Denison, "International Transactions," p. 27, citing a comment by Walter Salant.
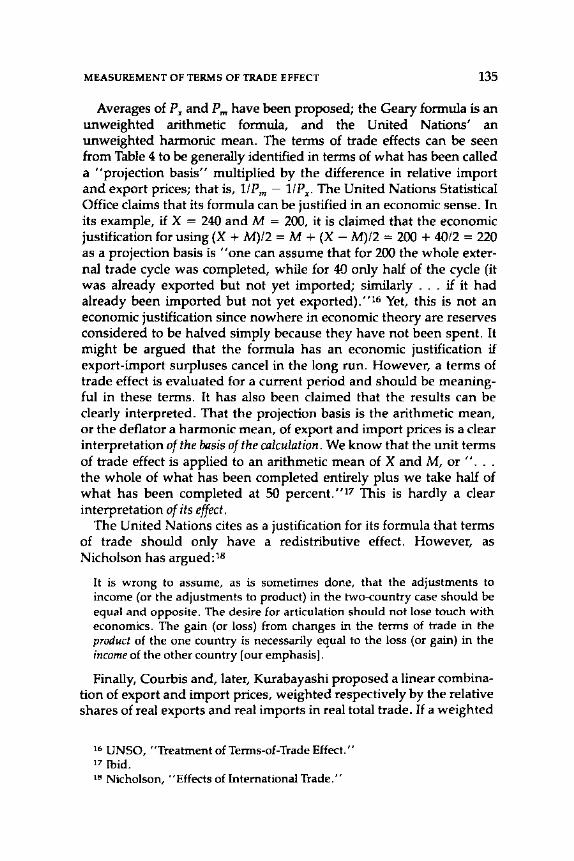
MEASUREMENT OF TERMS OF TRADE EFFECT 135
Averages of Px and P m have been proposed; the Geary formula is an unweighted arithmetic formula, and the United Nations' an unweighted harmonic mean. The terms of trade effects can be seen from Table 4 to be generally identified in terms of what has been called a "projection basis" multiplied by the difference in relative import and export prices; that is, 1/Pm- 1/Px- The United Nations Statistical Office claims that its formula can be justified in an economic sense. In its example, if X = 240 and M = 200, it is claimed that the economic justification for using (X + M)/2 = M + (X - M)/2 = 200 + 40/2 = 220 as a projection basis is "one can assume that for 200 the whole external trade cycle was completed, while for 40 only half of the cycle (it was already exported but not yet imported; similarly . . . if it had already been imported but not yet exported)."16 Yet, this is not an economic justification since nowhere in economic theory are reserves considered to be halved simply because they have not been spent. It might be argued that the formula has an economic justification if export-import surpluses cancel in the long run. However, a terms of trade effect is evaluated for a current period and should be meaningful in these terms. It has also been claimed that the results can be clearly interpreted. That the projection basis is the arithmetic mean, or the deflator a harmonic mean, of export and import prices is a clear interpretation of the basis of the Clllculation. We know that the unit terms of trade effect is applied to an arithmetic mean of X and M, or ". . . the whole of what has been completed entirely plus we take half of what has been completed at 50 percent. "17 This is hardly a clear interpretation of its effect.
The United Nations cites as a justification for its formula that terms of trade should only have a redistributive effect. However, as Nicholson has argued: IS
It is wrong to assume, as is sometimes done, that the adjustments to income (or the adjustments to product) in the two-country case should be equal and opposite. The desire for articulation should not lose touch with economics. The gain (or loss) from changes in the terms of trade in the product of the one country is necessarily equal to the loss (or gain) in the income of the other country [our emphasis].
Finally, Courbis and, later, Kurabayashi proposed a linear combination of export and import prices, weighted respectively by the relative shares of real exports and real imports in real total trade. If a weighted
16 UNSO, ''Treatment of Terms-of-Trade Effect.'' 17Jbid. 1s Nicholson, "Effects of International Trade."
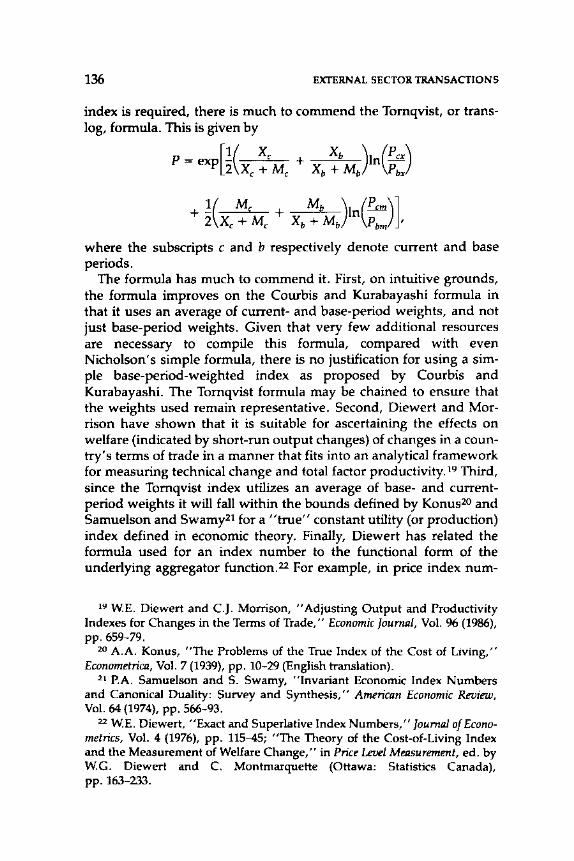
136 EXTERNAL SECTOR TRANSACTIONS
index is required, there is much to commend the Tornqvist, or translog, formula. This is given by
P [1( Xe Xb ) 1 (p ex) -exp- + n-- 2 Xe + Me Xb + Mb Pbx
+ l( Me + Mb )1n(p em)] 2 Xe +Me xb + Mb Pbm I
where the subscripts c and b respectively denote current and base periods.
The formula has much to commend it. First, on intuitive grounds, the formula improves on the Courbis and Kurabayashi formula in that it uses an average of current- and base-period weights, and not just base-period weights. Given that very few additional resources are necessary to compile this formula, compared with even Nicholson's simple formula, there is no justification for using a simple base-period-weighted index as proposed by Courbis and Kurabayashi. The Tornqvist formula may be chained to ensure that the weights used remain representative. Second, Diewert and Morrison have shown that it is suitable for ascertaining the effects on welfare (indicated by short-run output changes) of changes in a country's terms of trade in a manner that fits into an analytical framework for measuring technical change and total factor productivity. 19 Third, since the Tornqvist index utilizes an average of base- and currentperiod weights it will fall within the bounds defined by Konus20 and Samuelson and Swamy21 for a "true" constant utility (or production) index defined in economic theory. Finally, Diewert has related the formula used for an index number to the functional form of the underlying aggregator function.22 For example, in price index num-
19 W.E. Diewert and C.J. Morrison, "Adjusting Output and Productivity Indexes for Changes in the Terms of Trade," Economic Journal, Vol. % (1986), pp. 659-79.
20 A.A. Konus, "The Problems of the True Index of the Cost of Living," Econometrica, Vol. 7 (1939), pp. 10-29 (English translation).
21 P.A. Samuelson and S. Swamy, "Invariant Economic Index Numbers and Canonical Duality: Survey and Synthesis," American Economic Review, Vol. 64 (1974), pp. 566-93.
22 W.E. Diewert, "Exact and Superlative Index Numbers," Journal of Econometrics, Vol. 4 (1976), pp. 115-45; "The Theory of the Cost-of-Living Index and the Measurement of Welfare Change," in Price Level Measurement, ed. by W.G. Diewert and C. Montmarquette (Ottawa: Statistics Canada), pp. 163-233.

MEASUREMENT OF TERMS OF TRADE EFFECT 137
ber work there is an underlying utility function by which a theoretical price index can be defined with regard to maintaining a constant utility or cost of living. The Tornqvist index is exact for a translog functional form and, more importantly, is also defined as being superlative since it is exact for a flexible functional form. A flexible functional form is one that is capable of providing a second-order differential approximation to an arbitrary twice continuously differentiable linearly homogeneous aggregator (in this case utility) function. That the index provides a good approximation to a class of other functions is thus an advantage. However, it is one shared by Fisher's "ideal" index, the geometric mean of Laspeyres and Paasche, which also lies within the Konus bounds. In practice, Tornqvist and Fisher's indexes provide similar results.23
In summary, we note the following for trade-based deflators.
• The Nicholson and anti-Nicholson formulae both provide results that can be quite clearly interpreted, yet the interpretation does not provide an indicator of the objective change in real income since there is no reason to believe, for example, in the case of the Nicholson formula that a surplus will be used to buy imports at the time that it arises or in the future. It is difficult to justify one over the other since both formulae are simply different ways of viewing the same phenomena. Indeed, the Geary-Burge formula is based on the idea that P m provides a more illuminating view when there is a deficit and P x
when there is a surplus. However, the lack of consistency in the interpretation of the result, along with other difficulties, precludes the use of this formula.
• The Nicholson and anti-Nicholson formulae for the terms of trade effect will diverge as X and M diverge. It will be shown in the empirical work that the differences between the results are quite substantial for developing countries. That two formulae give substantially different results, while both being equally justified, is not unknown in the SNA (for example, Laspeyres versus Paasche). However, it is not a state of affairs that we would wish to encourage.
• An average of the two formulae is neither conceptually sound nor justifiable in economic theory. It is purely a compromise. If a weighted average is to be adopted (and the justification for this is not clear) a Tornqvist (or translog) formulation is preferable to the Courbis and Kurabayashi formula.
23 B. Hansen and E.F. Lucas, "On the Accuracy of Index Numbers," Review of Income and Wealth, Series 30 (No. 1, 1984), pp. 25-38.
138 EXTERNAL SECTOR TRANSACTIONS
Non-Trade-Based Deflators
The non-trade-based deflators (Stuvel, Scott, Godley and Cripps, and the second SNA) given in Table 4 use one or a combination of the implicit deflators of the domestic economy for deflation of the surplus or deficit. Stuvel's formula is based on the implied deflator for net domestic product at market prices, as an expression of changes in the purchasing power of money. Scott argues that the ultimate purpose of both foreign and domestic investment and trade is to meet present and future consumption. The consumer price index (CPI) is therefore advocated as the appropriate deflator. Godley and Cripps chose the implied price index for total domestic expenditure at factor cost as a deflator. The SNA, while never mentioning the effects of terms of trade, discusses two approaches. The first yields the Nicholson formula; the second
is to deflate the gross national product by a price index number of current and capital final expenditure in the domestic market. The two methods will give different results only if the balance of payments is different from zero and then only if the price index number for imports differs from the price index number of final purchases in the domestic market (SNA, paragraph 4.8, p. 53).
Choice Between Deflators
Before drawing some conclusions on alternative approaches it is worth mentioning a criterion for choice between deflators that is often cited.24 This is that the terms of trade effects should be symmetrical when viewed from the domestic earner or the rest of the world; that is, the gains in one sector should be equal to the losses in the complementary sector. The Geary-Burge, Geary, Courbis-Kurabayashi, and Tornqvist formulae appear to possess this property.25 The Nicholson and anti-Nicholson formulae do not produce symmetrical terms of trade effects; however, the Nicholson formula applied to one country and the anti-Nicholson formula to the trading partner will be symmetrical.
Too much attention should not be paid to the criterion of symmetry. As Nicholson has pointed out, symmetry is not a desirable property.
24 For example, Hibbert, "Measuring Changes," and P. Gutmann, "The Measurement of Terms of Trade Effects," Review of Income and Wealth, Series 27 (No. 4, 1981), pp. 443-53.
25 Gutmann, ''Measurement of Terms of Trade Effects.''
MEASUREMENT OF TERMS OF TRADE EFFECT 139
Nicholson's formula gives the gain (loss) in income in terms of its ability to purchase (forgo) imports:26
... The other possible adjustment to terms of trade, symmetrical to the one just described, would consist in replacing imports by the value of exports at base year prices, needed to finance the actual level of imports. The result would indicate the level of domestic product needed to meet the current level of national expenditure [that is, the anti-Nicholson formula] .... It makes sense as economics. For the same goods and services which form part of the domestic and national product of one country form the imports and hence are part of the real income of the other country. These are simply two sides of the same coin.
Thus, symmetry would not be a desirable property for the Nicholson formula since it would not make economic sense. Indeed the symmetry properties of the other formulae cited do not justify their use. A substantial positive terms of trade effect would mean that a country no longer has to export so many goods to maintain import levels. Thus, the previously exported goods can now be used for domestic consumption. The terms of trade effect is thus used to purchase home-produced goods. The price movement of the bundle of goods produced by those resources will dictate the extent of the terms of trade effect. There is now no reason to expect symmetry. If the resources are used for domestic production of chocolate as opposed to biscuits, that should not be mirrored in any calculation for the country's trading partner. ·
A similar argument applies to a factory (or industrial sector). If the price increases of what it sells are greater than what it buys in, there is a terms of trade gain. What it spends this gain on will dictate the extent of the gain. If spent on machinery, whose price increases at a faster rate than the price of the output of the factory, the gain becomes a loss. However, machinery may be regarded as a third sector, and terms of trade gains may be aggregated across sectors. As should be apparent, intersectoral terms of trade can be calculated as long as sufficiently detailed information on input-output flows (volume and price) between sectors (including the rest of the world) are available. Many of the issues discussed in this paper apply to intersectoral terms of trade effects, though see Bjerke for more details. 27
The choice between these deflators can only be judged in terms of how appropriate they are for measuring how much more was earned (from production and other sources) in terms of quantities of goods
26 Nicholson, ''Effects of International Trade.'' 27 Bjerke, "Some Reflections."
140 EXTERNAL SECTOR TRANSACTIONS
and services for which this income is utilized. A broader analytical framework is required for this. The effect on real income of a change in the terms of trade ultimately depends on what the surplus is spent on, or the nature of the response to the deficit, be it drawing on financial assets, cutting expenditure on inventories, and/or fixed capital and/or labor, exporting more or curtailing consumption of imported goods. In the case of imported goods Nicholson's formula would be the appropriate deflator. Three approaches are considered.
Approach A is to use a single deflator and to interpret it as implying one possible way of meeting a deficit or utilizing a surplus.
Approach B is to use a single deflator or set of deflators, but also to use several further deflators-for example, the CPI, implied deflator for current and/or fixed capital formation, import-export unit values. Thus, several measures are provided on the possible terms of trade effects arising, for example, from the different ways in which a trade surplus is utilized, or what is forgone when there is a deficit. If all give similar results, the single-measure formula provides a reasonable approximation to the terms of trade adjustment. If, for example, one indicator is widely divergent from the rest, the question must be asked whether this is a likely target of expenditure from the trade surplus and, if so, the bias borne in mind. Users would be warned by the very publication of several results that a reliable estimate of the objective economic change in real income may not be given in the table. The different estimates would show the real income changes under different spending scenarios. Little additional resources are required to deflate by the alternative deflators available.
Approach Cis to calculate a deflator as a weighted average of the price movements of consumption, imports, investment, expenditure, and so on. Problems inherent in calculating such a deflator include, first, that the weights should reflect the additions to consumption expenditure, investment expenditure, imports, and so on that will arise from the surplus (or be forgone due to the deficit), as opposed to the existing pattern. Second, there may be a time lag between the occurrence of the trade gap and its effect on the economy.
Approach A, as argued earlier, may be misleading; approach C has severe measurement problems. Approach B is therefore proposed. There are some advantages in proposing a single deflator that should always be used, the effect from alternative deflators also being included or being relegated to footnotes. The Nicholson formula has some clear advantages in that, first, it has a plausible explanation (reserves or surplus may be used to finance more imports or imports may be curtailed when there is a deficit), second, it is already in use and, third, it is appropriate for the terms of trade effect because it is
MEASUREMENT OF TERMS OF TRADE EFFECT 141
grounded in trade relations. However, the anti-Nicholson formula should be used along with the Nicholson formula. It may strike some readers that Nicholson's formula was rejected earlier but is being proposed here. As a trade-based deflator, the Nicholson and antiNicholson formulae can both yield very different results, yet neither can be considered theoretically superior. The use of Nicholson's formula in this context is highly problematic. However, the use of his formula within an interpretative framework, where it is clearly given as one of many options, is conceptually sound.
In summary, it is concluded that an appropriate framework should take the following points into account.
• It should be based on the use of two identifiable standard selections of goods and services; the Nicholson and anti-Nicholson formulae would be suitable for this, though others might be considered.
• Users should be clearly warned that these formulae do not provide indicators of objective economic flows, but ones contingent on particular scenarios. As such, estimates of alternative spending patterns by use of a range of further deflators are proposed as footnotes to the table of results.
• The differences between using different deflators are shown by the empirical work to be substantial in many cases and, therefore, can mislead the economist if a single measure is published.
• If a single trade-based deflator is to be used the Tornqvist index has many advantages.
Extension to Net Factor Income and Current Transfers from Abroad
It was noted in the second subsection above ("Non-Trade-Based Deflators") that a measure of real income not only requires the adjustment for terms of trade effects but also adjustment first to include net factor income and current transfers from abroad and, second, to express these aggregates in real terms. Again, the stance taken is to ask what the net factor incomes and current transfers will be spent on or, if negative, what sacrifice will be made to meet the outflow. If net factor incomes are a surplus of migrants' earnings being sent home, the deflator for consumption expenditure is applicable. If the factor income is composed of a repatriated surplus from investment abroad, and this is to be used to finance fixed capital formation, the deflator for fixed capital formation is applicable. If the transfers are to finance particular activities, appropriate deflators may
142 EXTERNAL SECTOR TRANSACTIONS
be found. If these sums are in deficit, the task is more difficult. We have to ask what has been forgone to meet the deficit and what was the price increase of these items. It is proposed that the Nicholson and anti-Nicholson approaches be extended to these items so that a systematic interpretation can be put on the GNOI. However, alternative deflators should also be applied to net factor incomes and current transfers to identify the effects from alternative scenarios. Thus, if, for example, there is a very large change in net factor income, which can be identified by the user as being from migrants' wages, then the user may use the results based on a consumer expenditure deflator.
In conclusion, we note the following.
• Net factor income and current transfers may amount to quite substantial flows in proportion to the GOP; as such, guidelines are necessary on their deflation.
• It is proposed that the interpretive framework used for measuring the terms of trade effect be extended to these items; the Nicholson and anti-Nicholson formulae would be the main deflators with the effects of using alternative deflators also shown.
Empirical Work
It has been argued that the choice of deflator may be of little practical importance since different deflators give similar results and the terms of trade effect is generally small. This has been based on the results of empirical work undertaken by Gutmann and the United Nations Statistical Office.28 Gutmann only considered seven industrialized countries and Saudi Arabia. Little difference was found for the industrialized countries, yet for Saudi Arabia one formula led to a gain from terms of trade larger than Saudi Arabia's GOP, while a different formula showed a gain of only half that size. The United Nations' study had quite an extensive coverage of countries, yet only Nicholson's and the United Nations Statistical Office's formulae were considered.
Table 5 provides results on the effects of using different deflators for measuring terms of trade effects. The study covered 50 countries (20 industrial and 30 nonindustrial). The purpose of this study was to illustrate that terms of trade effects calculated by different formulae
28 Gutmann, "Measurement of Terms of Trade Effects"; UNSO, "Growth Indices Adjusted for Terms-of-Trade Effect for Seventy-Nine Countries," Report ESA/STAT/AC.27/4, Annex 1 (New York, 1986).
MEASUREMENT OF TERMS OF TRADE EFFECT 143
may, for some years, yield substantially different results. The period chosen varied between countries, being constrained by the availability of data for each country. At best, the data set included annual figures from 1948 to 1985. The terms of trade effects were calculated with respect to a reference period of 1980 equivalent to 0.00. It is noted that the levels as well as signs of the effect would differ if another reference period were chosen. In addition, it is stressed that 1980 weights are not being applied throughout the series; in many cases, the base period may be changed every five to ten years. Some of the differences may be substantial because of the time span used for the analysis. Yet in most cases, the maximum difference fell quite close to 1980, but the differences remained marked. Space constraints precluded the presentation of results for individual years. Because the study was concerned with differences in individual years, growth rates were not used as summary measures for comparisons. The following summary measures were used.
The absolute difference between the terms of trade effects as measured by Nicholson's formula and, for example, Courbis and Kurabayashi' s formula was derived for each year and the mean, standard deviation and maximum (absolute) difference were calculated. This was repeated for each of the formulae given in Table 4. Since Nicholson's formula was used as a point of reference, its mean (absolute) value is given, as are its values for those years when the differences between Nicholson's formula and any other formula were at a maximum for the period. The results for Brazil can be used to illustrate the use of these measures. The Nicholson and anti-Nicholson measures differed most, for the period 1961-84, in 1974 by 123.5 million cruzeiros (at notional 1980 prices). Yet, as the final column shows in 1974, the terms of trade effect calculated by Nicholson's formula itself was only 167.6 million cruzeiros, the difference between the two formulae amounting to nearly three fourths of Nicholson's estimate. On average, the Nicholson formula gave an (absolute) value of 145.6 million cruzeiros. The average (absolute) difference between the Nicholson and anti-Nicholson formulae was 30.9 million cruzeiros, around one fifth of the average value for Nicholson's formula, but still substantial. The high standard deviation shows that in many years the results might be much higher than this average. The overall results show the following.
• The difference between using import and export unit value indices (Nicholson and anti-Nicholson formulae) as deflators can be substantial. The results show that for nonindustrial countries not only are the maximum differences substantial but also the means and
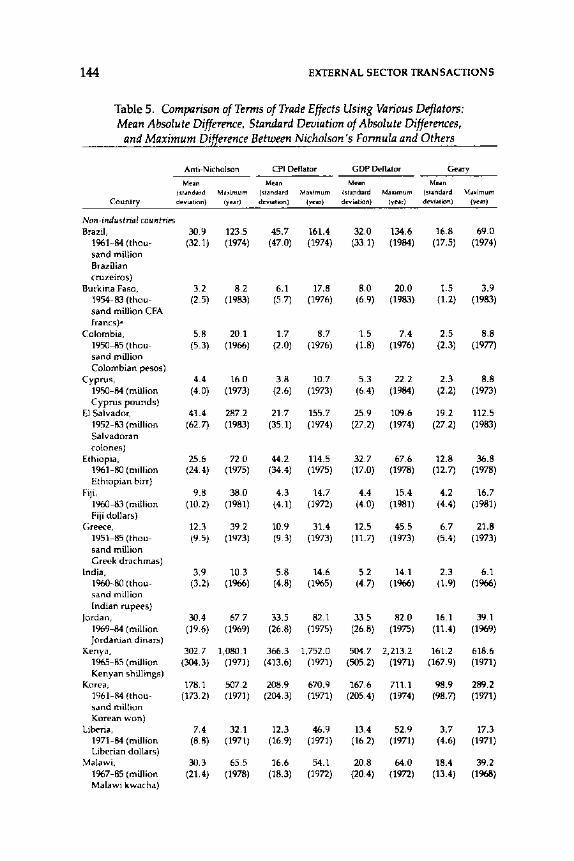
144 EXTERNAL SECTOR TRANSACTIONS
Table 5. Comparison of Terms of Trade Effects Using Various Deflators: Mean Absolute Difference, Standard Deviation of Absolute Differences,
and Maximum Difference Between Nicholson's Formula and Others
Anti-Nicholson CPI Deflator GOP Deflator Geary
Mean Mean Mean Mean
(standard Maximum (standard Maximum (standard Maximum (standard Maximum Country devYtion) (year) deviation) (year) deviation) (year) deviation) (year)
Non-industrial countries Brazil. 30.9 123.5 45.7 161.4 32.0 134.6 16.8 69.0
1961-84 (thou- (32.1) (1974) (47.0) (1974) (33.1) (1984) (17.5) (1974) sand million Brazilian cruzeiros)
Burkina Faso, 3.2 8.2 6.1 17.8 8.0 20.0 1.5 3.9 1954-83 (thou- (2.5) (1983) (5.7) (1976) (6.9) (1983) (1.2) (1983) sand million CFA francs)•
Colombia, 5.8 20.1 1.7 8.7 1.5 7.4 2.5 8.8 1950-85 (thou- (5.3) (1966) (2.0) (1976) (1.8) (1976) (2.3) (1977) sand million Colombian pesos)
Cyprus, 4.4 16.0 3.8 10.7 5.3 22.2 2.3 8.8 1950-84 (million (4.0) (1973) (2.6) (1973) (6.4) (1984) (2.2) (1973) Cyprus pounds)
El Salvador, 41.4 287.2 21.7 155.7 25.9 109.6 19.2 112.5 1952-83 (million (62.7) (1983) (35.1) (1974) (27.2) (1974) (27.2) (1983) Salvadoran colones)
Ethiopia, 25.6 72.0 44.2 114.5 32.7 67.6 12.8 36.8 1961-80 (million (24.4) (1975) (34.4) (1975) (17.0) (1978) (12.7) (1978) Ethiopian birr)
Fiji, 9.8 38.0 4.3 14.7 4.4 15.4 4.2 16.7 1960-83 (million (10.2) (1981) (4.1) (1972) (4.0) (1981) (4.4) (1981) Fiji dollars)
Greece, 12.3 39.2 10.9 31.4 12.5 45.5 6.7 21.8 1951-85 (thou- (9.5) (1973) (9.3) (1973) (11.7) (1973) (5.4) (1973) sand million Greek drachmas)
India, 3.9 10.3 5.8 14.6 5.2 14.1 2.3 6.1 1960-80 (thou- (3.2) (1966) (4.8) (1965) (4.7) (1966) (1.9) (1966) sand million Indian rupees)
jordan, 30.4 67.7 33.5 82.1 33.5 82.0 16.1 39.1 1969-84 (million (19.6) (1969) (26.8) (1975) (26.8) (1975) (11.4) (1969) Jordanian dinars)
Kenya, 302.7 1,080.1 366.3 1,752.0 504.7 2,213.2 161.2 618.6 1965-85 (million (304.3) (1971) (413.6) (1971) (505.2) (1971) (167.9) (1971) Kenyan shillings)
Korea, 178.1 507.2 208.9 670.9 167.6 711.1 98.9 289.2 1961-84 (thou- (173.2) (1971) (204.3) (1971) (205.4) (1974) (98.7) (1971) sand million Korean won)
Libt>ria, 7.4 32.1 12.3 46.9 13.4 52.9 3.7 17.3 1971-84 (million (8.8) (1971) (16.9) (1971) (16.2) (1971) (4.6) (1971) Liberian dollars)
Malawi, 30.3 65.5 16.6 54.1 20.8 64.0 18.4 39.2 1967-85 (million (21.4) (1978) (18.3) (1972) (20.4) (1972) (13.4) (1968) Malawi kwacha)
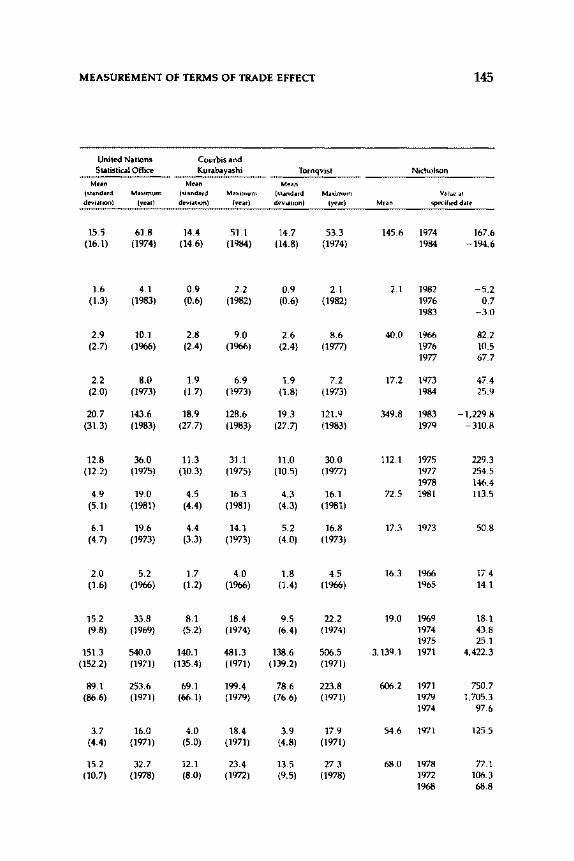
MEASUREMENT OF TERMS OF TRADE EFFECT 145
United Nations Courbisand Statistical Office Kurabayashi Tornqvist Nicholson
Mean Mean Mean (standard Maximum (standard Maximum (standard Maximum Valul'at deviation) (year) deviation) (year) deviation) (year) Mean specified dat('
15.5 61.8 14.4 51.1 14.7 53.3 145.6 1974 167.6 (16.1) (1974) (14.6) (1984) (14.8) (1974) 1984 -194.6
1.6 4.1 0.9 2.2 0.9 2.1 2.1 1982 -5.2 (1.3) (1983) (0.6) (1982) (0.6) (1982) 1976 0.7
1983 -3.0
2.9 10.1 2.8 9.0 2.6 8.6 40.0 1966 82.2 (2.7) (1966) (2.4) (1966) (2.4) (1977) 1976 10.5
1977 67.7
2.2 8.0 1.9 6.9 1.9 7.2 17.2 1973 47.4 (2.0) (1973) (1.7) (1973) (1.8) (1973) 1984 25.9
20.7 143.6 18.9 128.6 19.3 121.9 349.8 1983 -1,229.8 (31.3) (1983) (27.7) (1983) (27.7) (1983) 1979 -310.8
12.8 36.0 11.3 31.1 11.0 30.0 112.1 1975 229.3 (12.2) (1975) (10.3) (1975) (10.5) (1977) 1977 254.5
1978 146.4 4.9 19.0 4.5 16.3 4.3 16.1 72.5 1981 113.5
(5.1) (1981) (4.4) (1981) (4.3) (1981)
6.1 19.6 4.4 14.1 5.2 16.8 17.3 1973 50.8 (4.7) (1973) (3.3) (1973) (4.0) (1973)
2.0 5.2 1.7 4.0 1.8 4.5 16.3 1966 17.4 (1.6) (1966) (1.2) (1966) (1.4) (1966) 1965 14.1
15.2 33.8 8.1 18.4 9.5 22.2 19.0 1969 18.1 (9.8) (1969) (5.2) (1974) (6.4) (1974) 1974 43.8
1975 25.1 151.3 540.0 140.1 481.3 138.6 506.5 3,139.1 1971 4,422.3
(152.2) (1971) (135.4) (1971) (139.2) (1971)
89.1 253.6 69.1 199.4 78.6 223.8 606.2 1971 750.7 (86.6) (1971) (66.1) (1979) (76.6) (1971) 1979 1,705.3
1974 97.6
3.7 16.0 4.0 18.4 3.9 17.9 54.6 1971 125.5 (4.4) (1971) (5.0) (1971) (4.8) (1971)
15.2 32.7 12.1 23.4 13.5 27.3 68.0 1978 77.1 (10.7) (1978) (8.0) (1972) (9.5) (1978) 1972 106.3
1968 68.8
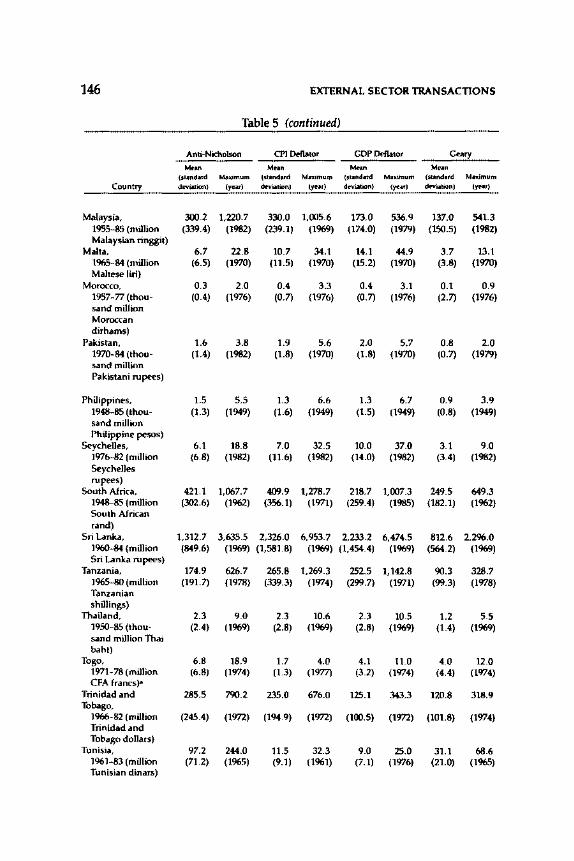
146 EXTERNAL SECTOR TRANSACTIONS
Table 5 (continued)
Anti-Nicholson CPI Deflator GOP Deflator Geary
Mean Mean Mean Mean (standard Maximum (standard Maximum (standard Maximum (standard Maximum
Country deviation) (year) deviation) (year) deviation) (year) deviation) (year)
Malaysia, 300.2 1,220.7 330.0 1,005.6 173.0 536.9 137.0 541.3 1955-85 (million (339.4) (1982) (239.1) (1969) (174.0) (1979) (150.5) (1982) Malaysian ringgit)
Malta, 6.7 22.8 10.7 34.1 14.1 44.9 3.7 13.1 1965-84 (million (6.5) (1970) (11.5) (1970) (15.2) (1970) (3.8) (1970) Maltese liri)
Morocco, 0.3 2.0 0.4 3.3 0.4 3.1 0.1 0.9 1957-77 (thou- (0.4) (1976) (0.7) (1976) (0.7) (1976) (2.7) (1976) sand million Moroccan dirhams)
Pakistan, 1.6 3.8 1.9 5.6 2.0 5.7 0.8 2.0 1970-84 (thou- (1.4) (1982) (1.8) (1970) (1.8) (1970) (0.7) (1979) sand million Pakistani rupees)
Philippines, 1.5 5.5 1.3 6.6 1.3 6.7 0.9 3.9 1948-85 (thou- (1.3) (1949) (1.6) (1949) (1.5) (1949) (0.8) (1949) sand million Philippine pesos)
Seychelles, 6.1 18.8 7.0 32.5 10.0 37.0 3.1 9.0 1976-82 (million (6.8) (1982) (11.6) (1982) (14.0) (1982) (3.4) (1982) Seychelles rupees)
South Africa, 421.1 1,067.7 409.9 1,278.7 218.7 1,007.3 249.5 649.3 1948-85 (million (302.6) (1962) (356.1) (1971) (259.4) (1985) (182.1) (1962) South African rand)
Sri Lanka, 1,312.7 3,635.5 2,326.0 6,953.7 2,233.2 6,474.5 812.6 2,296.0 1960-84 (million (849.6) (1969) (1,581.8) (1969) (1,454.4) (1969) (564.2) (1969) Sri Lanka rupees)
Tanzania, 174.9 626.7 265.8 1,269.3 252.5 1,142.8 90.3 328.7 1965-80 (million (191.7) (1978) (339.3) (1974) (299.7) (1971) (99.3) (1978) Tanzanian shillings)
Thailand, 2.3 9.0 2.3 10.6 2.3 10.5 1.2 5.5 1950-85 (thou- (2.4) (1969) (2.8) (1969) (2.8) (1969) (1.4) (1969) sand million Thai baht)
Togo, 6.8 18.9 1.7 4.0 4.1 11.0 4.0 12.0 1971-78 (million (6.8) (1974) (1.3) (1977) (3.2) (1974) (4.4) (1974) CFA francs)"
Trinidad and 285.5 790.2 235.0 676.0 125.1 343.3 120.8 318.9 Tobago,
1966-82 (million (245.4) (1972) (194.9) (1972) (100.5) (1972) (101.8) (1974) Trinidad and Tobago dollars)
Tunisia, 97.2 244.0 11.5 32.3 9.0 25.0 31.1 68.6 1961-83 (million (71.2) (1965) (9.1) (1961) (7.1) (1976) (21.0) (1965) Tunisian dinars)
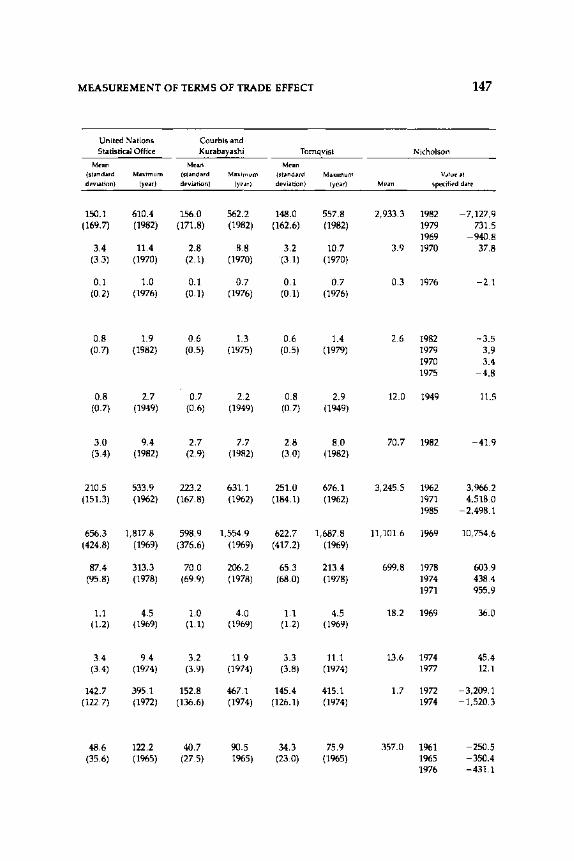
MEASUREMENT OF TERMS OF TRADE EFFECT 147
United Nations Courbisand Statistical Office Kurabayashi Tornqvist Nicholson
Mean Mean Mean (standard Mnimum (standard Maximum (standard Maximum Value at deviation) (year) deviation) (year) deviation) (year) Mean specified date
150.1 610.4 156.0 562.2 148.0 557.8 2,933.3 1982 -7,127.9 (169.7) (1982) (171.8) (1982) (162.6) (1982) 1979 731.5
1969 -940.8 3.4 11.4 2.8 8.8 3.2 10.7 3.9 1970 37.8
(3.3) (1970) (2.1) (1970) (3.1) (1970)
0.1 1.0 0.1 0.7 0.1 0.7 0.3 1976 -2.1 (0.2) (1976) (0.1) (1976) (0.1) (1976)
0.8 1.9 0.6 1.3 0.6 1.4 2.6 1982 -3.5 (0.7) (1982) (0.5) (1975) (0.5) (1979) 1979 3.9
1970 3.4 1975 -4.8
0.8 2.7 0.7 2.2 0.8 2.9 12.0 1949 11.5 (0.7) (1949) (0.6) (1949) (0.7) (1949)
3.0 9.4 2.7 7.7 2.8 8.0 70.7 1982 -41.9 (3.4) (1982) (2.9) (1982) (3.0) (1982)
210.5 533.9 223.2 631.1 251.0 676.1 3,245.5 1962 3,966.2 (151.3) (1962) (167.8) (1962) (184.1) (1962) 1971 4,518.0
1985 -2,498.1
656.3 1,817.8 598.9 1,554.9 622.7 1,687.8 11,101.6 1969 10,754.6 (424.8) (1969) (376.6) (1969) (417.2) (1969)
87.4 313.3 70.0 206.2 65.3 213.4 699.8 1978 603.9 (95.8) (1978) (69.9) (1978) (68.0) (1978) 1974 438.4
1971 955.9
1.1 4.5 1.0 4.0 1.1 4.5 18.2 1969 36.0 (1.2) (1969) (1.1) (1969) (1.2) (1969)
3.4 9.4 3.2 11.9 3.3 11.1 13.6 1974 45.4 (3.4) (1974) (3.9) (1974) (3.8) (1974) 1977 12.1
142.7 395.1 152.8 467.1 145.4 415.1 1.7 1972 -3,209.1 (122.7) (1972) (136.6) (1974) (126.1) (1974) 1974 -1,520.3
48.6 122.2 40.7 90.5 34.3 75.9 357.0 1961 -250.5 (35.6) (1965) (27.5) 1965) (23.0) (1965) 1965 -350.4
1976 -431.1
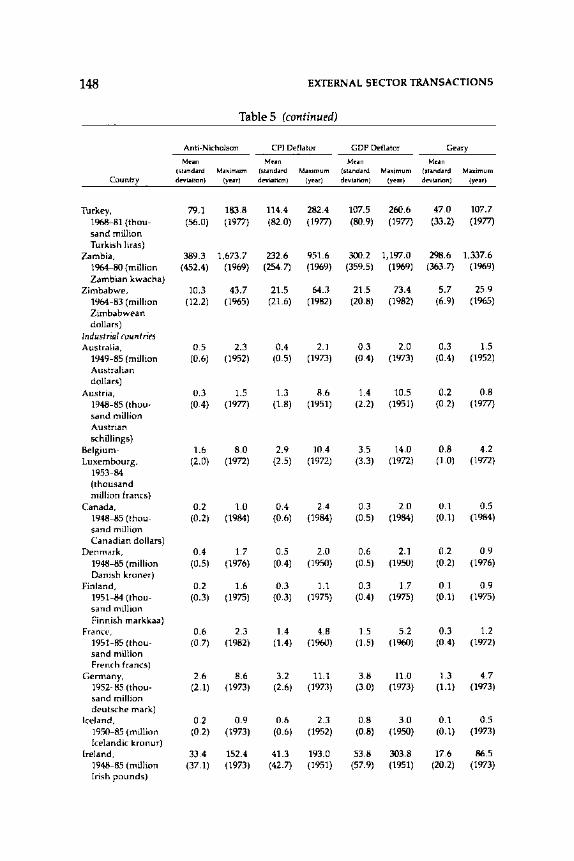
148 EXTERNAL SECTOR TRANSACTIONS
Table 5 (continued)
Anti-Nicholson CPI Deflator GOP Deflator Geary Mean Mean Mean Mean
(standard Maximum (standard Maximum (standard Maximum (standard Mnimurn Country deviation) (year) deviation) (year) deviation) (year) deviation) (year)
Turkey, 79.1 183.8 114.4 282.4 107.5 260.6 47.0 107.7 1968-81 (thou- (56.0) (1977) (82.0) (1977) (80.9) (1977) (33.2) (1977) sand million Turkish liras)
Zambia, 389.3 1,673.7 232.6 951.6 300.2 1,197.0 298.6 1,337.6 1964-80 (million (452.4) (1969) (254.7) (1969) (359.5) (1969) (363.7) (1969) Zambian kwacha)
Zimbabwe, 10.3 43.7 21.5 64.3 21.5 73.4 5.7 25.9 1964-83 (million (12.2) (1965) (21.6) (1982) (20.8) (1982) (6.9) (1965) Zimbabwean dollars)
Industrial countries Australia, 0.5 2.3 0.4 2.1 0.3 2.0 0.3 1.5
1949-85 (million (0.6) (1952) (0.5) (1973) (0.4) (1973) (0.4) (1952) Australian dollars)
Austria, 0.3 1.5 1.3 8.6 1.4 10.5 0.2 0.8 1948-85 (thou- (0.4) (1977) (1.8) (1951) (2.2) (1951) (0.2) (1977) sand million Austrian schillings)
Belgium- 1.6 8.0 2.9 10.4 3.5 14.0 0.8 4.2 Luxembourg, (2.0) (1972) (2.5) (1972) (3.3) (1972) (1.0) (1972)
1953-84 (thousand million francs)
Canada, 0.2 1.0 0.4 2.4 0.3 2.0 0.1 0.5 1948-85 (thou- (0.2) (1984) (0.6) (1984) (0.5) (1984) (0.1) (1984) sand million Canadian dollars)
Denmark, 0.4 1.7 0.5 2.0 0.6 2.1 0.2 0.9 1948-85 (million (0.5) (1976) (0.4) (1950) (0.5) (1950) (0.2) (1976) Danish kroner)
Finland, 0.2 1.6 0.3 1.1 0.3 1.7 0.1 0.9 1951-84 (thou- (0.3) (1975) (0.3) (1975) (0.4) (1975) (0.1) (1975) sand million Finnish markkaa)
France, 0.6 2.3 1.4 4.8 1.5 5.2 0.3 1.2 1951-85 (thou- (0.7) (1982) (1.4) (1960) (1.5) (1960) (0.4) (1972) sand million French francs)
Germany, 2.6 8.6 3.2 11.1 3.8 11.0 1.3 4.7 1952-85 (thou- (2.1) (1973) (2.6) (1973) (3.0) (1973) (1.1) (1973) sand million deutsche mark)
Iceland, 0.2 0.9 0.6 2.3 0.8 3.0 0.1 0.5 1950-85 (million (0.2) (1973) (0.6) (1952) (0.8) (1950) (0.1) (1973) Icelandic kronur)
Ireland, 33.4 152.4 41.3 193.0 53.8 303.8 17.6 86.5 1948-85 (million (37.1) (1973) (42.7) (1951) (57.9) (1951) (20.2) (1973) Irish pounds)
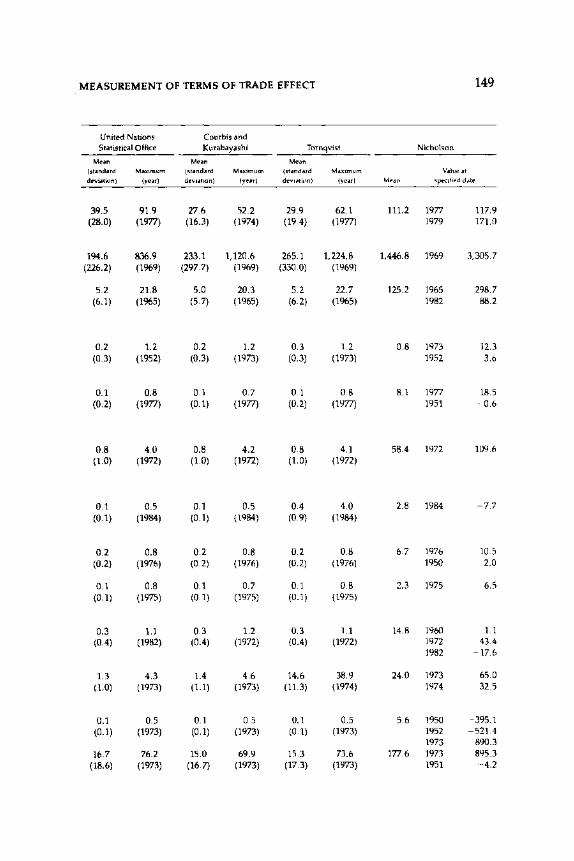
MEASUREMENT OF TERMS OF TRADE EFFECT 149
United Nations Courbisand Statistical Office Kurabayashi Tornqvist Nicholson
Mean Mean Mean
(standard Maximum (standard Maximum (standard Maximum Value at dniatiun) (year) deviation) (year) deviation) (year) Mean spedfied date
39.5 91.9 27.6 52.2 29.9 62.1 111.2 1977 117.9 (28.0) (1977) (16.3) (1974) (19.4) (1977) 1979 171.0
194.6 836.9 233.1 1,120.6 265.1 1,224.8 1,446.8 1969 3,305.7 (226.2) (1969) (297.7) (1969) (330.0) (1969)
5.2 21.8 5.0 20.3 5.2 22.7 125.2 1965 298.7 (6.1) (1965) (5.7) (1965) (6.2) (1965) 1982 88.2
0.2 1.2 0.2 1.2 0.3 1.2 0.8 1973 12.3 (0.3) (1952) (0.3) (1973) (0.3) (1973) 1952 3.6
0.1 0.8 0.1 0.7 0.1 0.8 8.1 1977 18.5 (0.2) (1977) (0.1) (1977) (0.2) (1977) 1951 -0.6
0.8 4.0 0.8 4.2 0.8 4.1 58.4 1972 109.6 (1.0) (1972) (1.0) (1972) (1.0) (1972)
0.1 0.5 0.1 0.5 0.4 4.0 2.8 1984 -7.7 (0.1) (1984) (0.1) (1984) (0.9) (1984)
0.2 0.8 0.2 0.8 0.2 0.8 6.7 1976 10.5 (0.2) (1976) (0.2) (1976) (0.2) (1976) 1950 2.0
0.1 0.8 0.1 0.7 0.1 0.8 2.3 1975 6.5 (0.1) (1975) (0.1) (1975) (0.1) (1975)
0.3 1.1 0.3 1.2 0.3 1.1 14.8 1960 1.1 (0.4) (1982) (0.4) (1972) (0.4) (1972) 1972 43.4
1982 -17.6
1.3 4.3 1.4 4.6 14.6 38.9 24.0 1973 65.0 (1.0) (1973) (1.1) (1973) (11.3) (1974) 1974 32.5
0.1 0.5 0.1 0.5 0.1 0.5 5.6 1950 -395.1 (0.1) (1973) (0.1) (1973) (0.1) (1973) 1952 -521.4
1973 890.3 16.7 76.2 15.0 69.9 15.3 73.6 177.6 1973 895.3
(18.6) (1973) (16.7) (1973) (17.3) (1973) 1951 -4.2
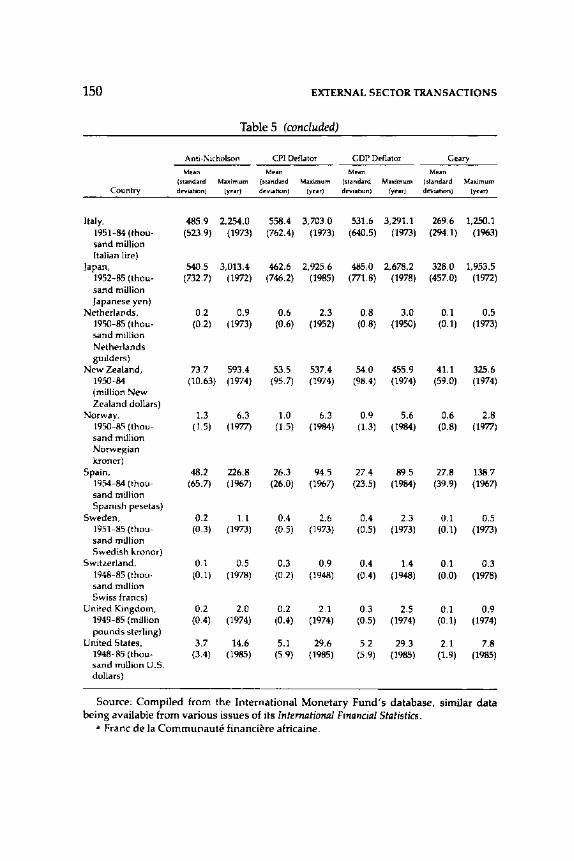
150 EXTERNAL SECTOR TRANSACTIONS
Table 5 (concluded)
Anti-Nicholson CPI Deflator GOP Deflator Geary Mean Mean Mean Mean
(standard Maximum (standard Maximum (standard Maximum (standard Maximum Country deviation) (year) deviation) (year) deviation) (year) deviation) (year)
Italy, 485.9 2,254.0 558.4 3,703.0 531.6 3,291.1 269.6 1,250.1 1951-84 (thou- (523.9) (1973) (762.4) (1973) (640.5) (1973) (294.1) (1963) sand million Italian lire)
Japan, 540.5 3,013.4 462.6 2,925.6 485.0 2,678.2 328.0 1,953.5 1952-85 (thou- (732.7) (1972) (746.2) (1985) (771.8) (1978) (457.0) (1972) sand million Japanese yen)
Netherlands, 0.2 0.9 0.6 2.3 0.8 3.0 0.1 0.5 1950-85 (thou- (0.2) (1973) (0.6) (1952) (0.8) (1950) (0.1) (1973) sand million Netherlands guilders)
New Zealand, 73.7 593.4 53.5 537.4 54.0 455.9 41.1 325.6 1950-84 (1G.63) (1974) (95.7) (1974) (98.4) (1974) (59.0) (1974) (million New Zealand dollars)
Norway, 1.3 6.3 1.0 6.3 0.9 5.6 0.6 2.8 1950-85 (thou- (1.5) (1977) (1.5) (1984) (1.3) (1984) (0.8) (1977) sand million Norwegian kroner)
Spain, 48.2 226.8 26.3 94.5 27.4 89.5 27.8 138.7 1954-84 (thou- (65.7) (1967) (26.0) (1967) (23.5) (1984) (39.9) (1967) sand million Spanish pesetas)
Sweden, 0.2 1.1 0.4 2.6 0.4 2.3 0.1 0.5 1951-85 (thou- (0.3) (1973) (0.5) (1973) (0.5) (1973) (0.1) (1973) sand million Swedish kronor)
Switzerland, 0.1 0.5 0.3 0.9 0.4 1.4 0.1 0.3 1948-85 (thou- (0.1) (1978) (0.2) (1948) (0.4) (1948) (0.0) (1978) sand million Swiss francs)
United Kingdom, 0.2 2.0 0.2 2.1 0.3 2.5 0.1 0.9 1949-85 (million (0.4) (1974) (0.4) (1974) (0.5) (1974) (0.1) (1974) pounds sterling)
United States, 3.7 14.6 5.1 29.6 5.2 29.3 2.1 7.8 1948-85 (thou- (3.4) (1985) (5.9) (1985) (5.9) (1985) (1.9) (1985) sand million U.S. dollars)
Source: Compiled from the International Monetary Fund's database, similar data being available from various issues of its International Financial Statistics.
• Franc de Ia Communaute financiere africaine.
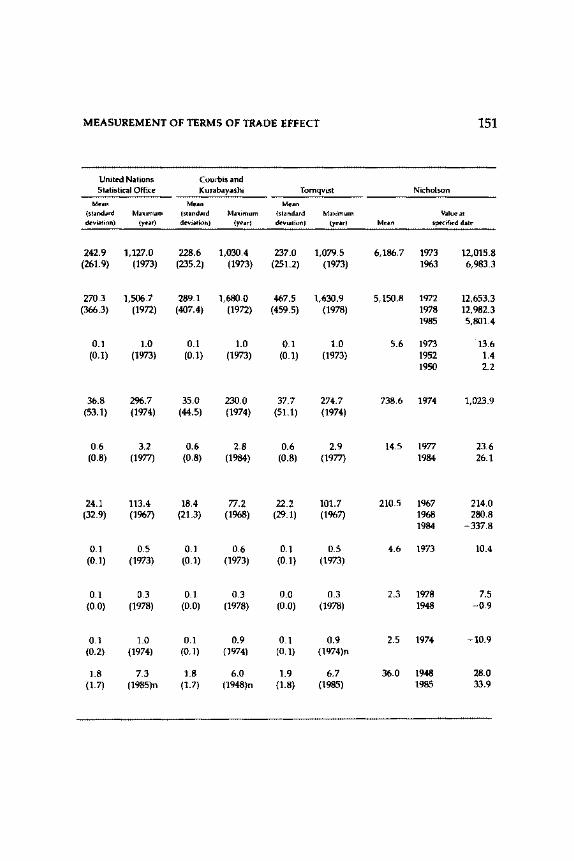
MEASUREMENT OF TERMS OF TRADE EFFECT 151
United Nations Courbisand Statistical Office Kurabayashi Tornqvist Nicholson
Mean Mean Mean (standard Maximum (standard Maximum (standard Maximum Value at deviation) (year) deviation) (year) deviation) (year) Mean specified datP
242.9 1,127.0 228.6 1,030.4 237.0 1,079.5 6,186.7 1973 12,015.8 (261.9) (1973) (235.2) (1973) (251.2) (1973) 1963 6,983.3
270.3 1,506.7 289.1 1,680.0 467.5 1,630.9 5,150.8 1972 12,653.3 (366.3) (1972) (407.4) (1972) (459.5) (1978) 1978 12,982.3
1985 5,801.4
0.1 1.0 0.1 1.0 0.1 1.0 5.6 1973 13.6 (0.1) (1973) (0.1) (1973) (0.1) (1973) 1952 1.4
1950 2.2
36.8 296.7 35.0 230.0 37.7 274.7 738.6 1974 1,023.9 (53.1) (1974) (44.5) (1974) (51.1) (1974)
0.6 3.2 0.6 2.8 0.6 2.9 14.5 1977 23.6 (0.8) (1977) {0.8) {1984) {0.8) (1977) 1984 26.1
24.1 113.4 18.4 77.2 22.2 101.7 210.5 1967 214.0 {32.9) {1967) {21.3) {1968) {29.1) {1967) 1968 280.8
1984 -337.8
0.1 0.5 0.1 0.6 0.1 0.5 4.6 1973 10.4 {0.1) {1973) (0.1) {1973) {0.1) {1973)
0.1 0.3 0.1 0.3 0.0 0.3 2.3 1978 7.5 (0.0) {1978) {0.0) {1978) {0.0) {1978) 1948 -0.9
0.1 1.0 0.1 0.9 0.1 0.9 2.5 1974 -10.9 {0.2) {1974) {0.1) (1974) (0.1) (1974)n
1.8 7.3 1.8 6.0 1.9 6.7 36.0 1948 28.0 (1.7) (1985)n (1.7) (1948)n {1.8) {1985) 1985 33.9
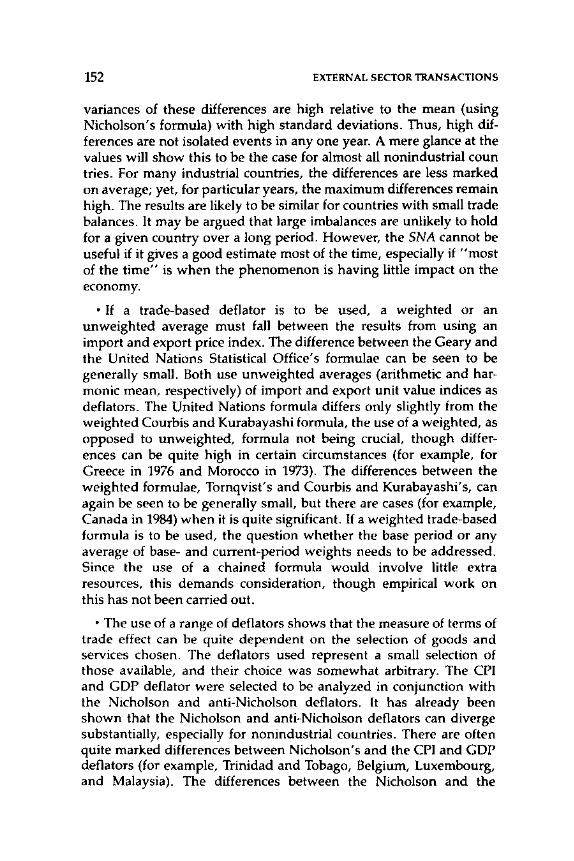
152 EXTERNAL SECTOR TRANSACTIONS
variances of these differences are high relative to the mean (using Nicholson's formula) with high standard deviations. Thus, high differences are not isolated events in any one year. A mere glance at the values will show this to be the case for almost all nonindustrial coun tries. For many industrial countries, the differences are less marked on average; yet, for particular years, the maximum differences remain high. The results are likely to be similar for countries with small trade balances. It may be argued that large imbalances are unlikely to hold for a given country over a long period. However, the SNA cannot be useful if it gives a good estimate most of the time, especially if "most of the time" is when the phenomenon is having little impact on the economy.
• If a trade-based deflator is to be used, a weighted or an unweighted average must fall between the results from using an import and export price index. The difference between the Geary and the United Nations Statistical Office's formulae can be seen to be generally small. Both use unweighted averages (arithmetic and harmonic mean, respectively) of import and export unit value indices as deflators. The United Nations formula differs only slightly from the weighted Courbis and Kurabayashi formula, the use of a weighted, as opposed to unweighted, formula not being crucial, though differences can be quite high in certain circumstances (for example, for Greece in 1976 and Morocco in 1973). The differences between the weighted formulae, Tornqvist's and Courbis and Kurabayashi' s, can again be seen to be generally small, but there are cases (for example, Canada in 1984) when it is quite significant. If a weighted trade-based formula is to be used, the question whether the base period or any average of base- and current-period weights needs to be addressed. Since the use of a chained formula would involve little extra resources, this demands consideration, though empirical work on this has not been carried out.
• The use of a range of deflators shows that the measure of terms of trade effect can be quite dependent on the selection of goods and services chosen. The deflators used represent a small selection of those available, and their choice was somewhat arbitrary. The CPI and GDP deflator were selected to be analyzed in conjunction with the Nicholson and anti-Nicholson deflators. It has already been shown that the Nicholson and anti-Nicholson deflators can diverge substantially, especially for nonindustrial countries. There are often quite marked differences between Nicholson's and the CPI and GDP deflators (for example, Trinidad and Tobago, Belgium, Luxembourg, and Malaysia). The differences between the Nicholson and the
MEASUREMENT OF TERMS OF TRADE EFFECT 153
implicit GOP deflator and the CPI are not as pronounced as between the Nicholson and anti-Nicholson deflators owing to the interrelationship between import price changes, consumer price changes, and the implicit GOP deflator. Yet, what is apparent is that the four results in many cases can be quite different but become more meaningful when viewed together.
V. Conclusions
This paper has argued for an analytical framework for the measurement of terms of trade effects and NNDI that was based on separately identifying the GOP at constant prices and separately ascertaining the effects of terms of trade movements, net factor income, and net current transfers from abroad. Several possible deflators were surveyed, and empirical work has been provided to show that the measurement of terms of trade effects are very sensitive to the choice of deflator. Since there is no single deflator that is appropriate to all countries in all circumstances, an interpretive framework has been proposed. Under this framework the economist can ascertain changes in real income based on different spending scenarios. This may be unique in national accounting, but so is the problem of measuring real income flows. Countries that continue to use a single measure may, as shown by the empirical work, provide economists with seriously misleading results if the assumptions implicit in a different formula are more likely to apply at that time. The United Nations Expert Group on the SNA Review was sympathetic to the case presented for the adoption of the framework given in Table 2 but has, at the time of writing, yet to propose a recommended choice of deflator.
11
Oassification of Capital Account Transactions
MAHINDER 5. GILL
T HIS PAPER proposes some revisions in the structure and classification of the capital account of the balance of payments. Since the
publication of the fourth edition of the IMF' s Balance of Payments Manual (BPM) in 1977, innovations have occurred in a range of financial instruments and transactions, necessitating a reappraisal of the existing classification scheme for the capital account. A related consideration is the ongoing work on the revision of the United Nations' A System of National Accounts (SNA), one of the goals of which is to harmonize it with related standards on balance of payments, government finance, and money and banking statistics. Although some of the other papers in this volume focus on the special features of newly introduced financial instruments, this paper essentially addresses the need for modifications in the existing BPM classification of capital account items1 that would facilitate links between the classification of the capital account of the balance of payments, on the one hand, and the corresponding classification as reflected in the SNA, on the other.
The structure of the capital account as proposed in this paper reflects (1) the Fund's analytical and operational needs; (2) the need to devise a classification scheme for financial assets and liabilities that would not only permit links between flow and stock data but would also facilitate comparison of data on stocks of assets and liabilities with data on the associated income flows as portrayed in the current account; (3) the need for harmonization between the balance of payments classification of capital account transactions and the corresponding classification of external transactions used in the SNA; and
1 See the BPM, paragraphs 191-97 and the list of standard components of the capital account on pp. 67-69.
1 1:\d.
CAPITAL ACCOUNT TRANSACTIONS 155
(4) the need to promote compatibility between the Fund's systems on balance of payments, government finance, and money and banking statistics. The revised classification scheme proposed for the capital account of the balance of payments is presented in Table 1.2
Section I discusses the content of the capital account of the balance of payments, whereas Sections II and III examine the classification of financial assets and liabilities and its application to the different capital account categories that are distinguished. Section IV discusses the desirability of countries, furnishing supplementary information on certain transactions that are deemed to constitute balance of payments financing transactions. Some concluding remarks and points for discussion are offered in Section V.
I. Coverage of the Capital Account
The capital account of the balance of payments is defined to cover the receipts and payments of capital transfers; transactions in foreign financial assets and liabilities; and valuation changes (including reconciliations and reclassifications) affecting the stock of reserves, together with their counterparts.
Capital Transfers
In contrast to the existing BPM, this paper proposes that a differentiation be made between current and capital transfers and that the latter be shown as part of the capital account of the balance of payments. The separation of current from capital transfers is required to compile measures of national and sectoral saving. The distinction between current and capital transfers is to be made according to the criteria described in paragraphs 7.60 and 7.74-7.77 of the SNA.
Although the guidelines for distinguishing between current and capital transfers are reasonably clear, problems are encountered in applying them in the context of international transactions, in particular because both the donor and the recipient are required to treat a transfer payment or receipt as current or capital. The distinction may be clear in domestic transactions, but statisticians do not always have all the relevant facts for international transactions. This consideration led previous editions of the BPM to refrain from differentiating
2 The proposed scheme contrasts with that of the fourth edition of the BPM and the one for external transactions in the SNA.
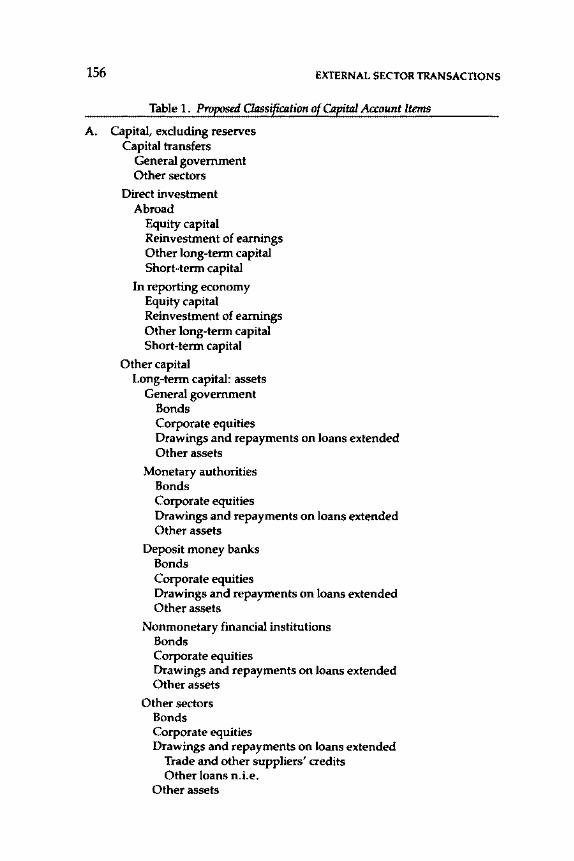
156 EXTERNAL SECTOR TRANSACTIONS
Table 1. Proposed CIJlssification of Capital Account Items
A. Capital, excluding reserves Capital transfers
General government Other sectors
Direct investment Abroad
Equity capital Reinvestment of earnings Other long-term capital Short-term capital
In reporting economy Equity capital Reinvestment of earnings Other long-term capital Short-term capital
Other capital Long-term capital: assets
General government Bonds Corporate equities Drawings and repayments on loans extended Other assets
Monetary authorities Bonds Corporate equities Drawings and repayments on loans extended Other assets
Deposit money banks Bonds Corporate equities Drawings and repayments on loans extended Other assets
Nonmonetary financial institutions Bonds Corporate equities Drawings and repayments on loans extended Other assets
Other sectors Bonds Corporate equities Drawings and repayments on loans extended
Trade and other suppliers' credits Other loans n.i.e.
Other assets
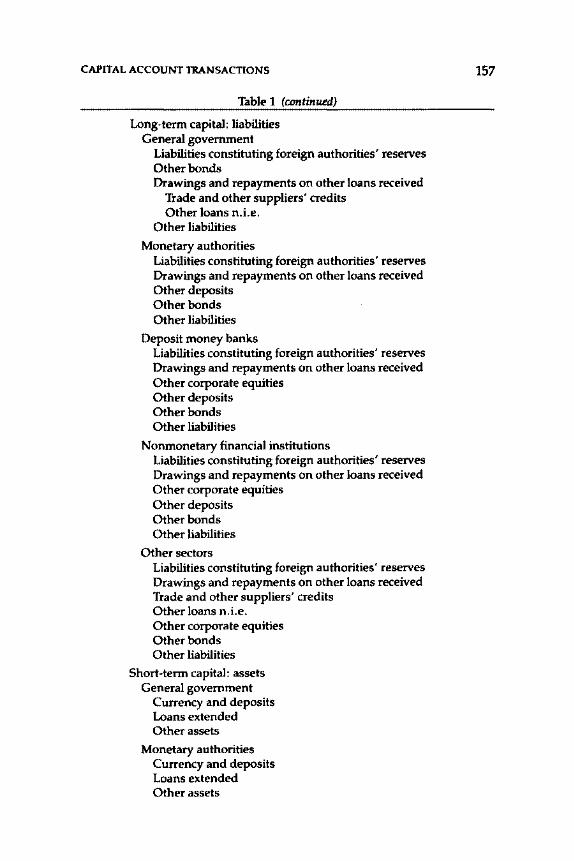
CAPITAL ACCOUNT TRANSACTIONS
Table 1 (continued)
Long-term capital: liabilities General government
Liabilities constituting foreign authorities' reserves Other bonds Drawings and repayments on other loans received
Trade and other suppliers' credits Other loans n.i.e.
Other liabilities
Monetary authorities Liabilities constituting foreign authorities' reserves Drawings and repayments on other loans received Other deposits Other bonds Other liabilities
Deposit money banks Liabilities constituting foreign authorities' reserves Drawings and repayments on other loans received Other corporate equities Other deposits Other bonds Other liabilities
Nonmonetary financial institutions Liabilities constituting foreign authorities' reserves Drawings and repayments on other loans received Other corporate equities Other deposits Other bonds Other liabilities
Other sectors Liabilities constituting foreign authorities' reserves Drawings and repayments on other loans received Trade and other suppliers' credits Other loans n.i.e. Other corporate equities Other bonds Other liabilities
Short-term capital: assets General government
Currency and deposits Loans extended Other assets
Monetary authorities Currency and deposits Loans extended Other assets
157
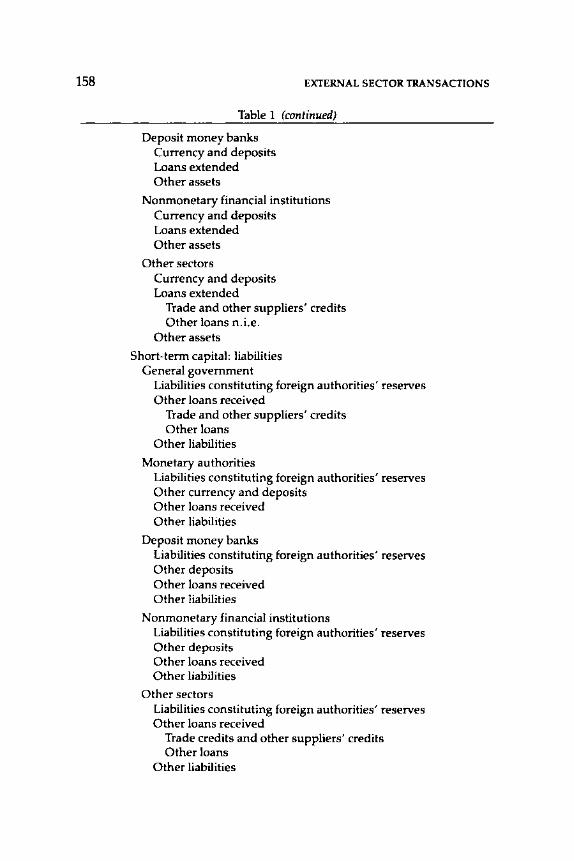
158 EXTERNAL SECTOR TRANSACTIONS
Table 1 (continued)
Deposit money banks Currency and deposits Loans extended Other assets
Nonmonetary financial institutions Currency and deposits Loans extended Other assets
Other sectors Currency and deposits Loans extended
Trade and other suppliers' credits Other loans n.i.e.
Other assets
Short-term capital: liabilities General government
Liabilities constituting foreign authorities' reserves Other loans received
Trade and other suppliers' credits Other loans
Other liabilities
Monetary authorities Liabilities constituting foreign authorities' reserves Other currency and deposits Other loans received Other liabilities
Deposit money banks Liabilities constituting foreign authorities' reserves Other deposits Other loans received Other liabilities
Nonmonetary financial institutions Liabilities constituting foreign authorities' reserves Other deposits Other loans received Other liabilities
Other sectors Liabilities constituting foreign authorities' reserves Other loans received
Trade credits and other suppliers' credits Other loans
Other liabilities
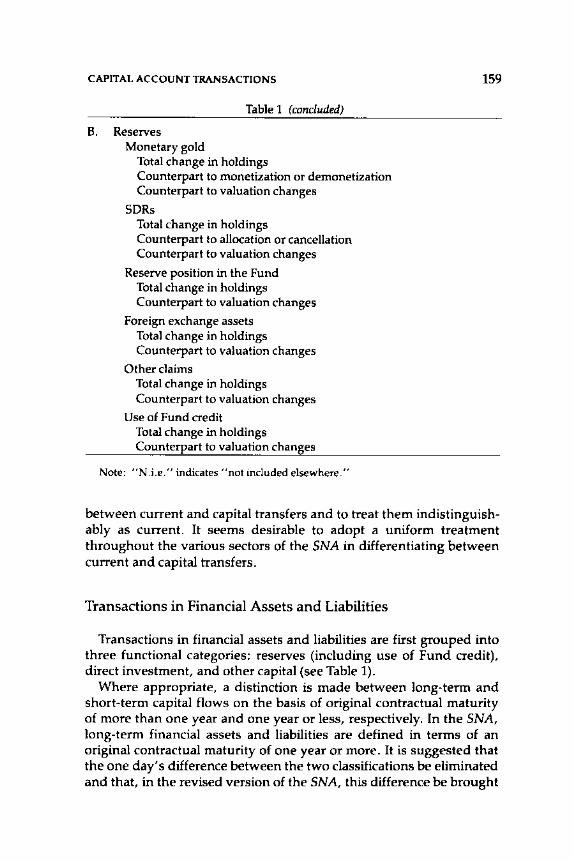
CAPITAL ACCOUNT TRANSACTIONS
Table 1 (concluded)
B. Reserves Monetary gold
Total change in holdings Counterpart to monetization or demonetization Counterpart to valuation changes
SDRs Total change in holdings Counterpart to allocation or cancellation Counterpart to valuation changes
Reserve position in the Fund Total change in holdings Counterpart to valuation changes
Foreign exchange assets Total change in holdings Counterpart to valuation changes
Other claims Total change in holdings Counterpart to valuation changes
Use of Fund credit Total change in holdings Counterpart to valuation changes
Note: "N.i.e." indicates "not included elsewhere."
159
between current and capital transfers and to treat them indistinguishably as current. It seems desirable to adopt a uniform treatment throughout the various sectors of the SNA in differentiating between current and capital transfers.
Transactions in Financial Assets and Liabilities
Transactions in financial assets and liabilities are first grouped into three functional categories: reserves (including use of Fund credit), direct investment, and other capital (see Table 1).
Where appropriate, a distinction is made between long-term and short-term capital flows on the basis of original contractual maturity of more than one year and one year or less, respectively. In the SNA, long-term financial assets and liabilities are defined in terms of an original contractual maturity of one year or more. It is suggested that the one day's difference between the two classifications be eliminated and that, in the revised version of the SNA, this difference be brought
160 EXTERNAL SECTOR TRANSACTIONS
into line so that long-term capital is defined in terms of an original contractual maturity of more than one year.
A distinction is drawn between assets and liabilities, and the residual functional category of "other capital" is also broken down by sector. The next level of disaggregation suggested is by financial instrument.
Reseroes
Reserves constitute a separate category owing to their characteristic as assets that are conceived of as available for use by an economy's central authorities in meeting a balance of payments need. Availability is not necessarily closely linked in principle to formal criteria such as ownership, currency of denomination, or maturity of assets. The coverage of this group derives from an analytic concept rather than from precise definitions based on observable characteristics possessed by the financial items concerned. In contrast to nonreserve capital flows, the list of standard components of the capital account calls for supplementary information on the total change in holdings of reserve assets and on the counterpart of any portion of that change that is not the result of a transaction between two parties. For these counterpart items, a separate entry is shown for the monetization or demonetization of gold, the allocation or cancellation of SDRs, and valuation changes (defined to include reclassifications as well as fluctuations in market values). Experience has shown that, for thecategory of reserves, information on the total change in holdings and on the counterpart to changes not due to transactions provides for the construction of a variety of analytic presentations of the balance of payments, including the identification of a performance balance in addition to a payments imbalance whose magnitude is explained by the change in the stock of reserves. Furthermore, data on the total change in holdings of reserves are generally available on a monthly basis; thus, in the absence of other data, information on the total change in the stock of reserves provides a preliminary assessment of the payments imbalance.
In the present SNA, gold is classified both as a commodity and as a financial asset. Under the conventions of the SNA, gold could be held as a financial asset not only by the central authorities (that is, the central bank and the central government) but also by other sectors of the economy. Any reclassification of commodity gold to a financial asset is recorded as an export or import and as an increase oi decrease in holdings of gold as a financial asset. Furthermore, any interna-
CAPITAL ACCOUNT TRANSACTIONS 161
capital account. In the BPM, however, gold is classified either as a commodity or as a monetary asset (monetary gold) when held or controlled (owned by other entities, such as commercial banks) by the central authorities. When gold is held, supposedly as a financial asset, by entities other than the central authorities, it is classified as a commodity or nonfinancial asset under the conventions of the BPM. Consequently, any reclassification of gold-that is, a monetization or demonetization-is recorded in the reserves category in the capital account of the balance of payments with a counterpart entry (also in the same category) denoting the monetization or demonetization. In addition, international purchases or sales of gold held as a financial asset by entities other than the central authorities are recorded as commodity transactions under imports or exports.
With a view to aligning the SNA and the BPM, the BPM treatment of gold transactions should be adopted in a revised version of the SNA because this would obviate the need for making entries under exports or imports when gold is reclassified from a nonmonetary to a monetary asset and would thereby avoid asymmetries both in the current account and in the capital account of the balance of payments. Furthermore, the joint UN-IMF questionnaire sent to a sample of countries during 1983/84 and the follow-up discussions that took place on the countries' responses revealed that few countries had data on holdings of financial gold by the nonfinancial sector, although in a few countries (for example, Germany and the United Kingdom) the practice was to classify gold as a financial asset if held by the commercial banks.
Since 1970, the Fund has issued SDRs at intervals to its member countries as a means of augmenting international reserves. Because for the recipient country the SDR allocation has the effect of increasing the authorities' international means of payment, and because the issuance of SDRs is not construed as a transaction in the sense of a change of ownership between two parties, a counterpart entry denoting the allocation of SDRs is reflected in the balance of payments statement.
A change in the level of reserves held in the form of foreign exchange may come about through the assumption or relinquishment of effective control by the monetary authorities over asset holdings of, say, the commercial banks. Because a transaction is not involved in this case, the BPM convention is to make a counterpart entry denoting the change in reserves stemming from the process of the assumption or relinquishment of control by the authorities.
To make the balance of payments statement responsive to a variety of analytical needs, the BPM extends the strict notion of a transaction
162 EXTERNAL SECTOR TRANSACTIONS
(that is, provision of economic values by one transactor to another) to encompass changes in reserves stemming from gold monetization or demonetization, allocation or cancellation of SDRs, and reclassification of reserves to nonreserve assets and vice versa. In a related vein, the BPM also includes valuation changes (together with their counterpart entries) in reserve assets.
Direct Investment
Direct investment, identified as a separate category in the capital account because of its distinctive behavior, is made to acquire a longterm interest in an enterprise operating in an economy other than that of the investor, the investor's purpose being to have an effective voice in the management of the enterprise. The foreign entity or group of associated entities that makes the investment is called the direct investor. The unincorporated or incorporated enterprise-a branch or subsidiary, respectively-in which the direct investment is made is referred to as a direct-investment enterprise. At the request of the Committee on International Investment and Multinational Enterprises of the Organization for Economic Cooperation and Development (OECD), the OECD Group of Financial Statisticians undertook a study during 1981-82 to expand the Fund's definition of direct investment and make it more operational. The OECD Group's report was approved by the Committee in June 1982.3 Although concurring with the BPM's definition of the concept of direct investment, the OECD Group recommended (paragraph 13, page 7) that
... A direct-investment enterprise be defined as an incorporated or unincorporated enterprise in which a single foreign investor ... either:
(a) controls 10 percent or more of the ordinary shares or voting power of an incorporated enterprise or the equivalent of an unincorporated enterprise, unless it can be established that this does not allow the investor an effective voice in the management of the enterprise; or
(b) controls less than 10 percent (or none) of the ordinary shares or voting power of the enterprise but has an effective voice in the management of the enterprise.
The OECD Group's report recognized that the stipulation of 10 percent equity participation would have to be applied flexibly to encompass marginal cases of a direct-investment relationship. In
3 See OECD, "Detailed Benchmark Definition of Foreign Direct Investment," General Distribution, BOP.B2 (Paris, February 1983).
CAPITAL ACCOUNT TRANSACTIONS 163
encompass marginal cases of a direct-investment relationship. In such cases the OECD Group's report proposed that evidence of a direct-investment relationship could be suggested by such factors as (1) representation on board of directors, (2) participation in the policymaking process, (3) interchange of managerial personnel, (4) provision of technical information, and (5) provision of a long-term loan that bears no relationship to the existing market rates.
It is interesting to note that, whereas the BPM (paragraph 410) states that "foreign influence that is not accompanied by at least some ownership of voting stock is rarely, if ever, seen as constituting direct investment," the OECD Group's report recognizes that, in exceptional circumstances, an effective voice in the management of an enterprise could be exerted without any equity participation, such as through the provision of vital technical know-how.
Because there is general concordance between the BPM's and the OECD Group's "Benchmark Definition" of the concept of direct investment, the adoption of the Group's elaboration of the concept in a future revision of the BPM should be considered.
The scope and classification of direct-investment capital flows discussed in this paper remain the same as in the present BPM and in the OECD Group's "Benchmark Definition." A distinction is made between direct investment abroad and direct investment in the reporting economy rather than strictly in terms of assets and liabilities. Consequently, any flows between affiliated enterprises should be reported on a net basis without regard to whether certain flows pertain to changes in assets or in liabilities, since the direct investor and the enterprise in question may have claims on each other. Both categories of direct investment are broken down into equity capital, reinvestment of earnings, other long-term capital, and other short-term capital. As in the current edition of the BPM, it is also suggested that flows of short-term capital between monetary institutions and their direct-investment affiliates be allocated to the "other" category of capital rather than to direct investment, on the grounds that the flows presumably reflect the regular business activities of those institutions more than the direct-investment relationship.
Other Capital
In contrast to the approach taken in the BPM, this paper proposes that portfolio investment be merged with other capital movements and that the relevant capital flows be distinguished in terms of the
164 EXTERNAL SECTOR TRANSACTIONS
domestic sector of the creditor or debtor. In the context of the Fund's operational and analytical work, a sectoral approach to analyzing nonreserve and nondirect investment flows appears to be generally favored over the strict functional approach. Furthermore, a sectoral specification of capital flows not only facilitates reconciliation with related bodies of economic statistics-for example, money and banking, government finance, and external debt-but also lends itself to a variety of economic analyses, such as the extent of financing provided by the domestic banking system, and the construction and analyses of flow-of-funds (FOF) accounts. In addition, since the compilation of balance-sheet data is done on a sectoral basis, it would facilitate the link between flow and stock data.
The use of sectorization as the primary organization principle for the presentation of statistics on nonreserve and nondirect investment capital flows does not preclude the derivation of data on portfolio investment that may be needed in a particular analytical context. Indeed, the sector specification, in conjunction with the proposed breakdown of financial claims by instrument, could yield the desired measures through a "building block" approach.
In the interest of not overextending the list of standard components of the capital account, only the following sectors are distinguished: general government, monetary authorities, deposit money banks, nonmonetary financial institutions, and a residual category representing other sectors. These sectors are deemed, from a global perspective, to be the most important transactors in external financial assets and liabilities. Individual countries may find it necessary, for their presentation of data, to modify the sectoral classification somewhat to reflect varying circumstances with regard to the quantitative importance of the capital account transactions of the groups of transactors. For example, it may be useful in particular circumstances to highlight the external borrowing transactions of the public nonfinancial enterprises within the category "other sectors."
The proposed BPM coverage of sectors-in particular, general government, monetary authorities, deposit money banks, and other nonmonetary financial institutions-represents a slight departure from the SNA, which emphasizes an institutional approach. Thus, the scope of general government is intended to be identical with that defined in the SNA except for the exclusion of monetary authority functions-for example, issue of currency, management and holdings of international reserves, and transactions with the Fund. These functions are classified under the monetary authorities sector. At the same time, the monetary authorities classification differs from one centering on the central bank through the inclusion of certain governmental
CAPITAL ACCOUNT TRANSACTIONS 165
units that perform monetary functions, such as an exchange equalization fund and governmental entities in charge of the currency issue. In principle, any commercial banking activity undertaken through a separate department in the central bank is excluded from the coverage of the monetary authorities sector and included under deposit money banks. Conceptually, the functional approach is also applied to the other subsectors of the financial system; that is, deposit money banks and other nonmonetary financial institutions. To facilitate a reconciliation of balance of payments data on external financial claims with related statistical systems on government finance and money and banking data, this paper follows the principle of sectorization as reflected in the Fund's draft of A Guide to Money and Banking Statistics in International Financial Statistics (MBS Guide) rather than the strict institutional approach espoused in the SNA.
II. Classification of Financial Instruments
The following types of financial instruments are separately identified in the capital account: monetary gold, SDRs, reserve position in the Fund, use of Fund credit, bonds, corporate equities, loans (distinguishing between trade and suppliers' credits and other loans), currency and deposits, and reinvested earnings.
Monetary Gold
Monetary gold covers gold owned by the authorities (or gold owned by others that is effectively subject to the control of the authorities) that is held as a financial asset.
SDRs
SDRs are unconditional reserve assets created by the IMF to supplement existing reserve assets. They are allocated to Fund members, in proportion to their quotas, that are participants in the Fund's SDR Department. Six SDR allocations totaling SDR 21.4 billion have been made by the Fund (in January 1970, January 1971, January 1972, January 1979, January 1980, and January 1981).
Entities authorized to conduct transactions in SDRs are the Fund itself, participants in the Fund's SDR Department, and prescribed "other holders." SDRs can be used for a wide range of transactions and operations-for instance, to acquire other members' currencies,
166 EXTERNAL SECTOR TRANSACTIONS
settle financial obligations, make donations, and extend loans. They may also be used in swap arrangements and as security for performance in meeting financial obligations. Forward as well as spot transactions may be conducted in SDRs.
Reserve Position in the Fund
A member's reserve position in the Fund is determined by its reserve tranche position and the creditor position under the various borrowing arrangements (except for lending with a maturity of less than three and one-half years under the policy on enlarged access to Fund resources). 4 A reserve tranche position in the Fund arises from the payment of part of a member's subscription in reserve assets and from the Fund's net use of the member's currency. Usually, a member's reserve tranche position is equal to its quota less the adjusted Fund holdings of its currency, less subscription receivable, and less the balances held in the administrative accounts of the Fund to the extent that they do not exceed 0.1 percent of a member's quota, if positive.
Use of Fund Credit
Use of Fund credit is the sum of a member's outstanding drawings ("purchases") and the Fund's net operational receipts and expenditures in that currency that increase the adjusted Fund holdings above the member's quota. This item measures the amount that a member is obligated to repay to (to repurchase from) the Fund. Outstanding purchases are equal to purchases other than reserve tranche purchases, less repurchases, less other members' purchases of that member's currency, and less any other use by the Fund of that member's currency (except administrative expenditures) that the member wishes to attribute to specific purchases.
Bonds
Bonds, debentures, and similar instruments cover those securities that give the holder an unconditional right to a money income (that
4 Loans extended to the Fund under its enlarged access policy involving a maturity of less than three and one-half years, and also involving the issuance of negotiable bearer notes by the Fund, are classified as part of foreign exchange reserves.
CAPITAL ACCOUNT TRANSACTIONS 167
is, an income in the form of interest, which is not dependent on the earnings of the debtor), and they are usually issued and traded in organized markets. Bonds, except for perpetual bonds, also give the holder the unconditional right to a stated fixed sum on a specified date or dates. Bonds are considered to include negotiable certificates of deposit, preference shares (except participating preference shares), and marketable promissory notes. Mortgages are not classified as bonds.
Corporate Equities
Corporate equities, including capital participation, refer to instruments and records acknowledging claims to the residual value and residual income of incorporated enterprises after the claims of all creditors have been met. Ownership of equity is usually evidenced by shares, stocks, participation, or similar documents.
Loans
Trade and other suppliers' credits refer to loans between the principals in the change of ownership of merchandise as well as transactions in services that are directly related to these flows. In the present SNA, trade and other suppliers' credits are not defined precisely, although short- and long-term loans are. Hence, one can infer that the coverage of trade and suppliers' credits would be restricted to open-book accounts and that any suppliers' credits financed through trade bills drawn on the importer would be classified as short-term bills and bonds. Country practices in the compilation of statistics suggest, however, that trade and other suppliers' credits encompass credits on open-book accounts as well as those financed through trade bills. Therefore, in conformity with country practices, trade and other suppliers' credits should be defined to include both open-book accounts and trade bills, except those negotiated by banks.
Other loans n.i.e. (not included elsewhere) refer to direct transactions between a borrower and a lender, when the lender either does not receive any security (for example, a bill, bond, or corporate equity) evidencing the transaction or else receives a nonnegotiable instrument, such as a lien or mortgage created as a surety.
Currency and Deposits
Currency refers to notes and coins, other than coins primarily of numismatic value. Deposits refer to claims on financial institutions
168 EXTERNAL SECTOR TRANSACTIONS
that are represented by evidence of deposit, including shares in small denominations or similar evidence of deposit issued by savings and loan associations, building societies, credit unions, and the like that are legally, or in practice, redeemable on demand or on relatively short notice.
Reinvested Earnings
The reinvestment of earnings by direct-investment enterprises represents the counterpart entry to the amounts reflected in the current account with respect to undistributed earnings of direct-investment enterprises. Any portion of the earnings of direct-investment enterprises that is not formally distributed and is attributable to the direct investors is conceived of as providing additional capital to the enterprises, thus increasing the value of an economy's stock of foreign assets and liabilities.
III. Application of the Breakdown of Instruments
The classification of financial assets and liabilities is not uniformly applied in each functional category of capital movement (that is, reserves, direct investment, and other capital). Instead, it is applied selectively to each category of capital movement in order to highlight those flows that would contribute to an analysis of balance of payments developments and to keep the list of standard components manageable. In other analytical contexts, such as the construction of FOF accounts, there undoubtedly would be a need for not only a uniform application of the breakdown of instruments but also, in certain cases, for a further specification.
In the category of reserves, the breakdown of instruments covers only monetary gold, SDRs, reserve position in the Fund, and use of Fund credit. The standard component "foreign exchange" covers the claims that are shown as the foreign exchange component of the series for "international liquidity" published in the IMP's International Financial Statistics (IFS). It includes monetary authorities' claims on foreigners in the form of bank deposits, treasury bills, short- and long-term government securities, and other claims usable in the event of a balance of payments deficit, including nonmarketable claims arising from intercentral bank and intergovernmental arrangements whether or not the claim is denominated in the currency of the debtor
CAPITAL ACCOUNT TRANSACTIONS 169
or the creditor. Other claims cover any additional claims that constitute reserve assets. In the cases of foreign exchange and other reserve claims, the emphasis is on their availability for balance of payments financing rather than on formal criteria, such as maturity or the nature of the underlying financial instrument.
In the case of direct investment,. all flows other than equity capital and the reinvestment of earnings are grouped together as other shortterm or other long-term capital. This classification recognizes that, given the special relationship between the direct investor and the direct-investment enterprise, there is considerable similarity in the nature of financial flows, so that any further specification of instruments would not contribute materially to an analysis of the behavior of direct-investment capital flows.
In the case of other capital flows, a standard component is provided within each sector's liabilities for identifying liabilities that constitute foreign authorities' reserves. In the rearrangement of standard components of the balance of payments for the purpose of constructing analytic presentations, users of statistics may wish to group with reserve assets those liabilities that perform a function similar to reserves in the context of the approach that analysts are following. For example, although a country may freely draw on its reserve position in the Fund when it has a balance of payments need, it may use Fund credit only if it pursues policies designed to overcome its problem; this distinction is not usually seen as relevant in measuring the size of the deficit that has been financed by the authorities. Therefore, the use of Fund credit-construed as a liability for the member-is customarily included with changes in reserve assets in analytic presentations, a practice that has been followed by setting out the functional category for reserves in the BPM.
Relationships between most other liabilities and reserve assets, however, are not as straightforward. First, reserve assets may be viewed as performing more than one function, and the liabilities that may be related to them in each of those functions could be somewhat different. Second, the underlying cause of changes in particular liabilities may be impossible to assign with any reasonable degree of assurance. Liabilities classified in the category for direct-investment capital would never be regarded as constituting a close substitute for reserve assets, but the same does not necessarily hold true for other types of liability.
It is not easy to find objective criteria that would help to single out liabilities to be identified as building blocks for an analytic presentation of the balance of payments that focuses on some version
170 EXTERNAL SECTOR TRANSACTIONS
of an "overall" balance. A reasonable approach is to specify that any liabilities that constitute reserve assets when seen from the side of the creditor are to be shown as separate standard components, even though the compiling country itself (the debtor) may not actually regard some or any of them as a supplementary means of financing its payments imbalance or as an offset to its own reserves.
How the behavior of liabilities of this kind is to be interpreted will depend on the purpose of the analysis and the factors that brought about the changes recorded in the balance of payments. The figuresalong with those for reserves, of course-clearly do not purport to be a satisfactory measure under all circumstances, either of the means that a country's authorities may have used to finance a payments imbalance or, thus, of the size of that imbalance. Moreover, the figures may be difficult to interpret. For example, a shift in holdings of claims on deposit money banks in a reserve-currency country, from a foreign central bank to foreign private deposit money banks, may or may not be taken as an indication of strength in the reserve-currency country's own payments position. Nevertheless, changes in the liabilities that are the counterpart of another economy's reserve assets may aid one's understanding of the global process of reserve creation or destruction.
Because identifying certain assets as reserves is not always clearcut, even for their holders, the problem of identification is likely to be even more complicated for the debtor, who presumably has less access to the facts on which to base judgment. In many cases, the only practicable procedure will be for the compiler in the debtor country to adopt a rule of thumb.
In formulating such a rule, the compiler should bear in mind that a foreign creditor will probably classify as reserve assets any liability of the compiling country that is (1) repayable on demand or in the short run, marketable, or that the debtor is in fact prepared to redeem on short notice; (2) repayable in an asset that the debtor would regard as a reserve asset; (3) owed to a central bank, central government, or other agency of the central authority except a public nonmonetary enterprise.
Although each of the sectors distinguished under the category of other capital could conceivably incur liabilities that would constitute foreign authorities' reserves, data reported to the Fund's Bureau of Statistics suggest that the bulk of such liabilities are likely to be shortterm liabilities of the monetary institutions (that is, the monetary authorities and deposit money banks).
CAPITAL ACCOUNT TRANSACTIONS
IV. Supplementary Information on Balance of Payments Financing Transactions
171
Although the classification of transactions in financial assets and liabilities, as shown in Table 1, provides for the identification of reserves (including use of Fund credit) and liabilities constituting foreign authorities' reserves, categories of instruments that are generally conceived of as instruments typically used by a country's authorities to meet a payments imbalance, the authorities may in certain circumstances engage in other financial transactions to meet a balance of payments need. The Fund has had a particular interest in eliciting information on these transactions, with a view to constructing and publishing analytic presentations for countries that show, "below the line," all forms of transactions undertaken in balance of payments support. In the Fund's IFS and Balance of Payments Statistics (BOPS), three categories of balance of payments financing transactions are distinguished: reserves, liabilities constituting foreign authorities' reserves, and exceptional financing. The term "exceptional" in the context of balance of payments financing transactions simply represents a shorthand descriptor for all forms of balance of payments financing, other than use of reserves and liabilities constituting foreign authorities' reserves, that the authorities have either engaged in themselves or have encouraged other sectors to conduct. As with reserves, the coverage of this group of financing transactions derives from an analytic concept rather than from precise definitions.
The following types of transactions are usually deemed to be motivated by balance of payments considerations: (1) accrual of payments arrears; (2) rescheduling of existing debt; (3) borrowing (including bond issues) by the government or the central bank for balance of payments support (for example, from foreign commercial banks); (4) borrowing (including bond issues) by other sectors of the economy that is induced by the authorities with some kind of exchange rate guarantee or interest subsidy; (5) deferment of loan repayments pending negotiations with creditors for debt rescheduling; and (6) grants received for balance of payments financing-for example, from the Fund's Subsidy Accounts, the Stabilization System for Export Earnings (STABEX) under the Lome Convention, and other intergovernmental grants. Given their importance for analyzing balance of payments developments, the question arises whether these types of transactions should be introduced as standard components within the category for "unrequited capital transfers" and "other capital"

172 EXTERNAL SECTOR TRANSACTIONS
movements. This would entail further expanding the standard components that are listed in Table 1. In light of this concern, it is suggested that, instead of introducing additional standard components, countries furnish supplementary information on all balance of payments financing transactions other than the use of reserves (including use of Fund credit) and the incurrence of liabilities constituting foreign authorities' reserves. A suggested format for the provision of such supplementary information in this regard is provided in Table 2.
V. Conclusions
This paper has put forth proposals for revising the structure of the capital account of the balance of payments reflecting the IMF' s analytical and operational needs and the need for harmonization with the classification of financial transactions in the external transactions account of the SNA. Consistent with the structure of the rest of the capital finance accounts, the external sector account of the SNA is structured almost exclusively in terms of a classification of financial transactions by instrument. The classification scheme proposed in this paper advocates combining characteristics relating to capital flows: functional role, sectorization, and instrument specification. A review of data reported for publication in the Yearbook of National Accounts Statistics suggests that only 9 countries report data in the format of the capital account of the external transactions account of the SNA, but more than 100 countries furnish information on the capital account of the balance of payments for publication in the Fund's BOPS. In light of this finding, the classification scheme proposed in this paper may be considered as a point of departure for the external transactions account of the SNA. Alternatively, if only a breakdown by financial instrument along the lines of Table 26 of the present SNA is desired for national accounts purposes, one may wish to consider further expansion in the breakdown of instruments in the context of compiling balance of payments statistics either as standard components or as supplementary information, bearing in mind the need to limit the list of standard components to a manageable number. Additional points for consideration are the following.
• Should the BPM reclassification of commodity gold to a monetary asset and vice versa (gold monetization or demonetization) be adopted in the SNA? In addition, should gold holdings be viewed as financial assets only when they are either held as financial assets by
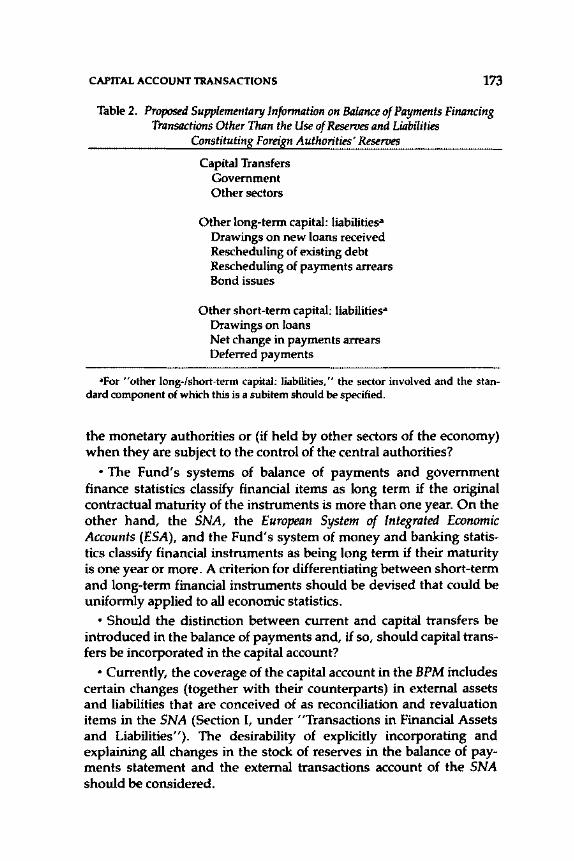
CAPITAL ACCOUNT TRANSACTIONS 173
Table 2. Proposed Supplementary lnformlltion on Balance of Payments Financing Transactions Other Than the Use of Reseroes and Liabilities
Constituting Foreign Authorities' Reserves
Capital Transfers Government Other sectors
Other long-term capital: liabilities• Drawings on new loans received Rescheduling of existing debt Rescheduling of payments arrears Bond issues
Other short-term capital: liabilities• Drawings on loans Net change in payments arrears Deferred payments
•For "other long-/short-term capital: liabilities," the sector involved and the standard component of which this is a subitem should be specified.
the monetary authorities or (if held by other sectors of the economy) when they are subject to the control of the central authorities?
• The Fund's systems of balance of payments and government finance statistics classify financial items as long term if the original contractual maturity of the instruments is more than one year. On the other hand, the SNA, the European System of Integrated Economic Accounts (ESA), and the Fund's system of money and banking statistics classify financial instruments as being long term if their maturity is one year or more. A criterion for differentiating between short-term and long-term financial instruments should be devised that could be uniformly applied to all economic statistics.
• Should the distinction between current and capital transfers be introduced in the balance of payments and, if so, should capital transfers be incorporated in the capital account?
• Currently, the coverage of the capital account in the BPM includes certain changes (together with their counterparts) in external assets and liabilities that are conceived of as reconciliation and revaluation items in the SNA (Section I, under "Transactions in Financial Assets and Liabilities"). The desirability of explicitly incorporating and explaining all changes in the stock of reserves in the balance of payments statement and the external transactions account of the SNA should be considered.

174 EXTERNAL SECTOR TRANSACTIONS
• Should standard components be introduced with respect to balance of payments financing transactions (other than reserves and liabilities constituting foreign authorities' reserves) or should information on these flows be collected as supplementary details, as proposed in this paper?
12
Oassification of Corporate Enterprises
D. I<Erm McAusTER
T HE EXPERT GROUP on Production Accounts and Input-Output Tables suggested that the revised version of the United Nations'
A System of National Accounts (SNA) include a recommendation that the accounts for the corporate enterprise sector be prepared separately for private and government-owned as well as for resident- and foreign-owned enterprises. (In this connection it is presumed that the terms resident-owned and foreign-owned refer to enterprises that are, more accurately, resident-controlled or foreign-controlled in that an enterprise can have both resident and foreign ownership of its voting equity; thus, although such an enterprise cannot be said to be wholly resident-owned or foreign-owned, its control can be assigned.) The Group further suggested that a paper describing the criteria used for distinguishing between resident-owned and foreignowned enterprises, particularly in relation to the definition of direct investment, be prepared.
The desire to distinguish between resident-owned and foreignowned enterprises stems from the perception that there may be discernible quantitative differences in such attributes as value added, profitability, level of investment, and employment, and that statistics that differentiate between foreign and domestic ownership of enterprises would be useful for analytical purposes. This paper examines the notion of foreign ownership with reference to the concept of direct investment as currently formulated in the fourth edition of the IMF's Balance of Payments Manual (BPM) and further elaborated in the "Benchmark Definition" of direct investment of the Organization for Economic Cooperation and Development (OECD).l
1 OECD, "Detailed Benchmark Definition of Foreign Direct Investment," General Distribution, BOP.B2 (Paris, February 1983).
175
176 EXTERNAL SECTOR TRANSACTIONS
I. Definition of Dired Investment
In the BPM, "direct investment" refers to investment that is made to acquire a lasting interest in an enterprise operating in an economy other than that of the investor, the investor's purpose being to have an effective voice in the management of the enterprise. The foreign entity or group of associated entities that makes the investment is called the direct investor. The unincorporated or incorporated enterprise-a branch or subsidiary, respectively-in which direct investment is made is referred to as a direct-investment enterprise.
With a view to making the definition of a direct-investment enterprise more operational, the OECD "Benchmark Definition" (paragraph 13, page 7) suggests that
... A direct-investment enterprise be defined as an incorporated or unincorporated enterprise in which a single foreign investor ... either:
(a) controls 10 percent or more of the ordinary shares or voting power of an incorporated enterprise or the equivalent of an unincorporated enterprise, unless it can be established that this does not allow the investor an effective voice in the management of the enterprise; or
(b) controls less than 10 percent (or none) of the ordinary shares or voting power of the enterprise but has an effective voice in the management of the enterprise. ·
The single foreign (direct) investor may be an individual, an incorporated or unincorporated public or private enterprise, a government, a group of related individuals, or a group of related incorporated or unincorporated enterprises. An effective voice in the management of an enterprise implies only that the direct investor is able to influence or participate in the management of the enterprise and does not imply control. In some countries, studies are produced to compare foreign- and resident-controlled enterprises, in which control is defined more narrowly than direct investment. For example, the threshold for defining control may be higher, and the enterprise may be considered to be domestically controlled if there is a larger domestic than foreign investor participating in the enterprise. In practice, however, most direct-investment enterprises would be considered foreign controlled.
The OECD "Benchmark Definition" (paragraph 21) subdivides direct-investment enterprises into branches, subsidiaries, and associate companies.
A branch is an unincorporated ("quasi-corporate" in current SNA terminology) enterprise in the host country that
CORPORATE ENTERPRISES 177
• Is a permanent establishment or office of a foreign direct investor or
• Is an unincorporated partnership or joint venture between a foreign direct investor and third parties or
• Is land or structures (except those owned by foreign government entities) in the host country directly owned by a foreign resident or
• Is mobile equipment (such as ships, aircraft, and gas and oil drilling rigs) that operates within an economy for at least one year (considered to be direct investment in a notional enterprise in the host country).
A resident company X is a subsidiary of a foreign enterprise N if the latter
• Controls more than half of the shareholders' or members' voting power in X or
• Is a shareholder in or member of X and has the right to appoint or remove a majority of the members of X's administrative, management, or supervisory body or
• Has a subsidiary company Y of which X is a subsidiary.
A resident company K is an associate of the foreign enterprise N if
• N and its subsidiaries control between 10 percent and 50 percent of the shareholders' voting power inK and this allows N to have an effective voice in K' s management or
• N and its subsidiaries control less than 10 percent of K but have an effective voice inK's management.
Because the Expert Group on External Sector Transactions suggested that the OECD "Benchmark Definition" be used in a revised BPM, the relationship between foreign ownership and direct investment, which is discussed in the following section, is examined with reference to that definition.
II. Foreign Ownership and Direct Investment
In terms of the categories of direct-investment enterprises described in the preceding section, branches and subsidiary companies of foreign enterprises would be viewed as either wholly or majority foreign-owned. For associate companies, several situations are possible. First, the direct investor could hold, say, 10 percent of the voting stock, while nonresident portfolio investors who are
178 EXTERNAL SECTOR TRANSACTIONS
widely dispersed and unrelated could collectively hold, say, 41 percent. Thus, in the aggregate, foreign ownership comprising the direct investors' share and the portfolio investors' shares could characterize the direct-investment enterprise as being majority foreign-owned. Second, the foreign direct investor could hold, say, 49 percent of the voting stock while residents hold the remainder. In this case, a directinvestment enterprise as defined in the preceding section would not necessarily be a foreign-owned enterprise. In exceptional cases, the foreign portfolio investors may account for more than 50 percent of the voting stock of an enterprise in which there is no direct investor; such an enterprise may be deemed to be foreign-owned although not a direct-investment enterprise.
Should foreign ownership of a resident enterprise reflect mainly foreign ownership of capital invested in the enterprise, or should it be interpreted as ability to affect its management? Because the purpose of the classification is to categorize the statistics of enterprises, presumably to see if discernible differences exist based on ownership, it would be analytically more appropriate to identify those enterprises whose management is characterized by foreign influence. Foreign rather than local management is likely to contribute to differences in the economic performance of direct-investment enterprises, on the one hand, and of all other resident enterprises, on the other. This effect is particularly likely in large corporations that engage in multinational operations because a small, organized group of stockholders may well have an influence in management that is proportionately greater than its share in the equity capital. Such large corporations also often contribute technical know-how that can make for differences in productivity between a direct-investment enterprise and other resident enterprises.
III. Availability of Data
Currently in the balance of payments accounts, direct investment and portfolio investment are separate functional categories, although some of the direct-investment and portfolio investment flows could conceivably be directed to the same direct-investment enterprise. By extension to the international investment position accounts, data on balance sheets distinguish between stocks of foreign direct investment and foreign portfolio investment. In several countries that compile data on the stock of direct investment, a further disaggregation is provided in the form of an abbreviated industry breakdown, often in terms of the International Standard Industrial Classification (ISiq at the
CORPORATE ENTERPRISES 179
one- or two-digit level.2 Data based on direct-investment enterprises rather than strictly on majority foreign ownership by direct investors are likely to be available, especially in countries compiling extensive data on direct-investment flows and stocks.
In light of the foregoing considerations, and in view of the heightened interest in the transactions taking place between affiliated enterprises, it is suggested that, where applicable, data on enterprises distinguish between direct-investment enterprises and other resident enterprises. Because direct-investment enterprises encompass the activities of their subsidiaries, these criteria would also apply to the domestic subsidiaries of direct-investment enterprises. For example, if a chain of subsidiaries of a direct-investment enterprise is operating in a different industry and if over 50 percent of the voting stock of each subsidiary is owned by a parent enterprise, all these enterprises should be considered foreign-owned for the purpose of the enterprise classification. The domestic parent-the direct-investment enterprise-is clearly foreign-owned according to the preceding definition of foreign ownership. These relations are illustrated in Figure 1.
The application of the criteria for foreign ownership to the disparate units of an enterprise group and the production of separate statistics for each unit rather than a consolidated total for the enterprise group will ensure that the industry statistics being classified are as meaningful as possible.
In sum, the main question is whether experts agree that resident corporate enterprises should be classified as direct-investment enterprises and non-direct-investment enterprises rather than as foreignowned and domestically owned enterprises (as determined by majority ownership of equity).
2 United Nations, International Standard Industrial Classification of All Economic Activities, Statistical Papers, Series M, No.4, Rev. 3 (New York, 1986).
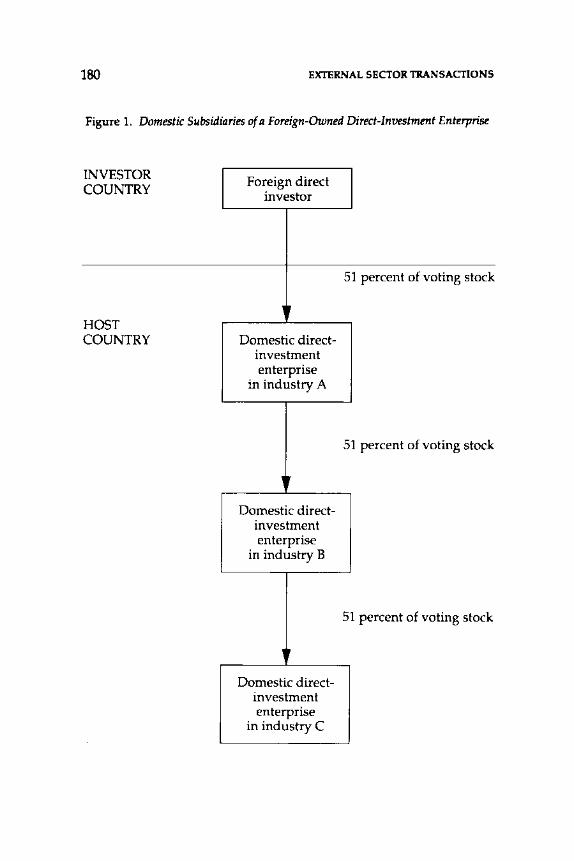
180 EXTERNAL SECTOR TRANSACTIONS
Figure 1. Domestic Subsidiaries of a Foreign-Owned Direct-Investment Enterprise
INVESTOR Foreign direct COUNTRY investor
51 percent of voting stock
,, HOST COUNTRY Domestic direct-
investment enterprise
in industry A
51 percent of voting stock
•• Domestic direct-
investment enterprise
in industry B
51 percent of voting stock
r
Domestic direct-investment enterprise
in industry C
13
New Financial Instruments and the Balance of Payments
GEORGE H. HoEzoo
M AJOR CHANGES have taken place in the international financial markets during the past few years. Not only has the volume of
international transactions increased sharply, but a plethora of financial instruments has appeared, some of which are now commonplace but barely existed a decade ago.1 For balance of payments compilers, this process of innovation has given rise to problems of how to classify and value transactions in these instruments appropriately and how to surmount the increasing difficulties in collecting data on such transactions. The purpose of this paper is to examine the implications of these developments for the recording and classification of these financial instruments in light of the guidelines recommended in the IMF's current Balance of Payments Manual (BPM).
It would be impractical to examine every new instrument that has recently become available. Therefore, this paper will focus on the characteristics of the most important new financial instruments (Section I) because variations in these characteristics are more likely to differ in form than in substance. Section II details the implications of these characteristics for balance of payments recording. Section III offers some considerations on the extent that the present BPM could be elaborated to increase its usefulness as a guide for the balance of payments compiler in coping with continuing changes in the international financial markets. Finally, Section IV presents some conclusions.
1 See Bank for International Settlements, Recent Innovations in International Banking (Basle: 815, April1986).
181
182 EXTERNAL SECTOR TRANSACTIONS
I. Characteristics of Financial Instruments
The most important new financial instruments at present are note issuance facilities, swaps, options and futures, forward rate agreements, Eurobonds of various types, and other bonds. This section provides an overview of the main characteristics of these instruments.
Note Issuance Facilities
A note issuance facility (NIF) is a contractual commitment by a bank or group of banks to fund any notes that a borrower issues in his own name and the bank is unable to sell to a third party. The commitment is typically for five to seven years, during which the participating banks are obliged to purchase the unsold notes or to provide stand-by credits. The notes themselves are short term, with maturities of up to one year. The borrower pays an underwriting fee as long as the facility is not drawn. This facility is in effect a revolving credit, which enables a borrower to obtain financing according to his needs and, at times, favorable to the borrower. The paper issued under these facilities is known as a promissory note or, more commonly, as a Euronote, except where the borrower is a bank. In the latter case, the bank's liability is known as a certificate of deposit. The participating banks obtain the notes at a discount, which the banks themselves can hold or distribute to other investors.
Several techniques have been developed to enhance the attractiveness of the NIF. For instance, under the technique known as the revolving underwriting facility (RUF) a lead manager is solely responsible for placing the notes. This technique is attractive to banks because they are virtually assured of making a profit. Under the tender panel technique, a group of banks join together to bid for any notes that are issued. The underwriters, which are separate from the panel but might include banks participating in the tender panel, then take up any notes not bid for or extend loans for the amounts not bid for. A third technique is known as the multiple component facility. This facility allows the borrower to draw funds in a variety of forms instead of in one form, usually Euronotes. The choices available include short-term advances, bankers' acceptances, and "swing lines." Swing lines are facilities for short-term funds that can be drawn at short notice to cover the period between the offer of notes and the receipt of funds.
Increasingly, a number of additional facilities have been arranged that either are not, or are only partly, underwritten. The nonunder-
NEW FINANCIAL INSTRUMENTS 183
written facilities, also known as Eurocommercial paper programs, typically take the form of a general undertaking by banks to place the notes for the borrower, if ever required.
Swaps
Swaps are transactions in which two parties agree to an exchange of a stream of payments over a period of time. The streams of payments subject to the exchange usually are interest payments (interest rate swaps) or include both interest payments and amortization of principal (currency swaps). Currency swaps differ from the swap arrangements undertaken for purposes of monetary or exchange rate policy, in which the sale of one currency is arranged against the sale of another currency with the understanding that the transaction be reversed at a future date.
Interest Rate Swaps
Interest rate swaps involve the exchange of interest payments only; the principal remains unaffected over the entire period of the exchange. The exchange of interest payments could involve the use of different currencies, as well as interest payments calculated at fixed or flexible interest rates. All streams of payments, however, are exchanged according to predetermined rules and are calculated on the basis of an underlying "notional principal" amount. Three main types of swap are distinguished.
Coupon Swaps. Under this arrangement a stream of fixed-rate interest payments is exchanged against a stream of floating-rate interest payments. Both are denominated in the same currency.
Basis Swaps. Under this arrangement, c>ne stream of floating-rate interest payments is exchanged against another stream of different floating-rate interest payments. For example, interest payments based on a Eurodollar London interbank offered rate (LffiOR) are exchanged for interest payments based on the U.S. commercial paper composite rate. No exchange of currencies is involved.
Cross-Currency Interest Rate Swaps. This arrangement involves the exchange of interest payments in different currencies as well as different interest rate bases. In general, this transaction involves the exchange of nondollar interest payments at a fixed rate against dollar payments at a floating rate, but an exchange on the basis of two different floating rates is also possible. Arrangements such as these are usually treated as a single transaction, but separating the transac-
184 EXTERNAL SECTOR TRANSACTIONS
tion into an interest rate component and a cross-currency component also occurs.
Currency Swaps
A currency swap refers to a transaction in which two parties exchange with each other specific amounts of two different currencies at the outset and repay over time according to a predetermined rule. The repayments reflect both interest payments and amortization of principal. In these contracts, fixed interest rates are normally used. In some cases, there is no exchange of principal either initially or at maturity.
Options and Futures
An option can be defined as a contract that provides the purchaser with the right, but not the obligation, to buy or sell a specified amount of an underlying asset at a specified price within a given period. The underlying asset could cover a wide range of items, which might include equities, foreign currencies, interest rate instruments, commodities, and the like. The seller (or writer) has the obligation to complete the transaction if the buyer (or holder) exercises the option. In a typical transaction, the buyer of the option generally pays a premium (the price of the option) to the seller for his commitment to sell or buy the underlying instrument when demanded by the buyer. Options are either listed on an exchange or traded "over the counter" (not traded on organized exchanges). The latter type of trading usually involves negotiations among parties on all details of the transaction or some agreement on certain simplifying market conventions. One can further distinguish the American-style option, which permits the buyer to exercise his right to buy or sell at any time before the expiry date, and the European-style option, which may be exercised only at the expiry date.
Options are divided into two categories: "call" options and "put" options. For instance, under a contract to purchase a foreign currency, a call option provides the buyer with the right to buy an agreed amount of foreign currency at a specified price. The writer thus has the obligation to deliver the foreign currency if a call option is exercised. In contrast, a put option provides the purchaser of the option with the right to sell an agreed amount of foreign currency at a specified price, and the writer is therefore under obligation to take delivery of the foreign currency. The specified price is called the strike price.
NEW FINANCIAL INSTRUMENTS 185
In contrast to options, a futures transaction is a contract that provides the buyer with the obligation to take delivery of, and the seller with the obligation to deliver, a specified amount of an underlying asset at a fixed price at a set future date. A futures or forward contract thus entails a binding obligation, irrespective of subsequent changes in prices, exchange rates, and the like. The parties to a futures contract can, however, transfer their obligations to others by trading in the futures market.
Forward Rate Agreements
A forward (future) rate agreement is an agreement between two parties who wish to protect themselves against interest rate movements during a specified period. To this end, both parties agree on an interest rate covering a notional amount of principal. Neither party is committed to lend or borrow this amount of principal. At the end of the agreed period, on the settlement date, only the difference between the agreed interest rate of the agreement and the then current interest rate is paid. If the then current interest rate is higher than the agreed rate, the party wishing to protect itself against a rise in the interest rate, being the buyer of the forward rate agreement, receives payment of the difference from the counterparty. Vice versa, a party wishing to protect itself against a fall in interest rates (the seller of the forward rate agreement) receives payment from the counterparty when the then current interest rate is lower than the agreed rate of interest of the forward rate agreement.
Eurobonds
A Eurobond is an international bond issued and sold through a syndicate of banks or other financial institutions in various national capital markets on behalf of a foreign corporation, a foreign government, or an international agency. These bonds are usually issued as an unsecured obligation of the borrower. As a result, only borrowers of good quality are able to issue such bonds, so that in some cases state enterprises and municipalities require a government guarantee. Six main types of Eurobonds are distinguished.
Straight (Fixed-Rate) Bonds
Straight bonds carry a fixed rate of interest, normally paid annually, with maturities ranging from 3 years to as long as 25 years.
186 EXTERNAL SECTOR TRANSACTIONS
Eurobonds with maturities shorter than 5 years are often known as notes.
Floating-Rate Bonds
In response to rising inflation and often volatile rates of interest in the international financial markets, a growing number of Eurobonds have been and are being issued at a variable rate of interest. The rate of interest depends on the conditions in the market and is usually set at some margin over the prevailing LffiOR, depending on the quality of the borrower. This rate applies to a predetermined period (normally six months), with the interest usually payable semiannually. The rate of interest changes when LffiOR changes, but the margin remains the same.
Convertible Eurobonds
Convertible Eurobonds carry a fixed interest rate but are convertible in the sense that they give the holder the right to convert these bonds into equity shares (common stock) of the issuing company. The bonds carry fixed redemption dates, but the conversion right stipulates that bonds may be converted into stock either on a series of given dates or at any time in the future between specified dates. The price at which equity may be purchased through conversion is normally fixed at a premium over the share price prevailing at the time of issue. Convertible bonds are attractive to the borrower because the rates of interest are usually lower than those paid on straight bonds. In addition, the borrower may receive cash for the shares to be issued when the bond holder uses his or her option to convert. Convertible bonds usually specify conversion features in terms of the number of shares into which the bond is convertible.
Eurobonds with Warrants
Eurobonds with warrants are similar to convertible Eurobonds, except that it is not the Eurobond itself but the warrant that can be used to purchase shares of the borrowing company. The warrants are physically separate from the bonds, may be detached from them, and can be traded as securities in their own right. The warrant therefore represents an option to purchase rather than to convert into shares, since additional cash must be advanced if the warrants are exercised.
NEW FINANCIAL INSTRUMENTS 187
The value of the warrant is usually only a small fraction of the share price but is highly dependent on changes in the share price. In addition, warrants can also be issued independently by a borrower, giving the investor the opportunity to buy a wide range of securities.
Option Eurobonds
Option Eurobonds are essentially straight Eurobonds that provide the bond holder with the option to receive interest or principal (or both) in a currency that differs from that in which the bond is denominated. The rate of exchange at which interest is paid is normally determined by the exchange rate prevailing a few days before interest is due.
Zero-Coupon Bonds
Zero-coupon bonds are bonds on which no interest payments are made during the lifetime of the loan but which are issued at a substantial discount from their par value. The difference between the value at which the bond is issued and the par value is usually considered as income accruing to the investor over the life of the bond. In some countries this income is regarded as a capital gain rather than as regular income. Deep-discounted bonds are similar to zero-coupon bonds except that they carry a very low rate of interest instead of a zero rate of interest.
Other Bonds
In addition to the categories of Eurobonds mentioned above, two other types of bond merit description.
Junk Bonds
Junk bonds are high-yielding bonds that are rated below investment grade. Investment-grade securities are generally rated at or above "Baa" by Moody's Investors Services or "BBB" by Standard & Poor's Corporation. At times, junk bonds have been used as an instrument in corporate takeovers or buy-outs.
188 EXTERNAL SECTOR TRANSACTIONS
Indexed Bonds
Indexed bonds are debt securities, the redemption value or the interest (or both) of which are linked to some price index in order to defend the debt against inflationary depreciation.
II. Classification and Recording of Financial Instruments
The diversity of the financial instruments now available in the international capital markets and the enormous increase in transactions in these instruments has confronted the compiler of balance of payments statistics with two problems: that of classification, and that of obtaining data. Guidelines for the classification of these transactions are clearly needed. This section therefore explores how these instruments fit into the classification system of the present BPM. A detailed discussion of problems encountered in the collection of data for transactions in these instruments would be beyond the scope of the paper. Occasionally, however, suggestions will be made about what type of data should be collected in order to conform to the recommendations in the BPM.
Note Issuance Facilities
For a balance of payments compiler, three aspects of a NIF are of concern: the payment of interest, the payment of fees associated with the operation of the NIF, and the issuance of the notes and their repayment by the borrower. The BPM recommends that fee payments be classified in the account for other goods, services, and income; therefore, the classification of fees associated with the NIF in this account would be appropriate because these payments are made for the service of operating the NIF.
As far as the issuance of the notes and their repayments are concerned, the BPM recommends that entries accounting for these transactions should be recorded in the balance of payments, to reflect actual changes in the assets and liabilities of the transactors. But no entries should be made for the contractual commitments of participating banks. Only when this commitment is called upon and the notes have actually been sold to the banks that have underwritten the NIF, or to other investors, should the transaction be recorded as a balance of payments transaction. The sale of the notes will appear both as a liability in the balance sheet of the borrower and as an asset in the
NEW FINANCIAL INSTRUMENTS 189
balance sheets of the banks (if held by the banks themselves) or of other investors.
Another important problem associated with the recording of NIFs is the valuation of the notes acquired by the participating banks at a discount. The BPM recommends that, for debt securities (such as bonds and notes) originally issued at a value different from the stated fixed sum received by the holder unconditionally at maturity, the premium or discount should be regarded as negative interest or interest, respectively, rather than as a capital loss or gain. This treatment would seem to be appropriate for notes acquired by banks at the time of issue and held in their own portfolio, but when notes are placed with investors other than the banks that have underwritten the NIF, the difference between what those investors pay and the amount received by the issuer represents a fee earned by the banks.
Finally, because the original term to maturity usually is less than one year and the BPM recommends the classification of securities as portfolio investment only if they have an original contractual maturity of more than one year, it would seem appropriate to classify transactions in these instruments in the category of short-term capital movements.
Swaps
In principle, the classification of swap transactions should pose no problems for a balance of payments compiler. Streams of interest payments should be recorded in the current account, and streams of principal payments in the capital account, irrespective of the currency or the rate of interest at which these flows are paid or recorded. In the case of an interest rate swap, where typically the two interest payments that have been swapped are made on the same day, entries should be made for the flows of interest only. To the extent that the dates do not match, there will presumably be an amount due from one transactor to the other that will entail an entry in the capital account. In the case of a currency swap, where an exchange of both interest and principal takes place, and again assuming that payments are matched, entries should be made for the flows of interest as well as the repayments of principal.
The appropriate entries in the balance of payments also depend on whether the transactor is acting for his or her own account, and making a profit, or acting as an agent, and earning a fee.
The flows between the two parties engaged in a swap agreement do not represent interest payments, but an exchange of capital items
190 EXTERNAL SECTOR TRANSACTIONS
and, to the extent the flows are not equal, a payment for a service. Assuming that the capital flows take place at the same time, the capital account entries would net out.
Options
For options, two aspects are important for a balance of payments compiler: the premium to be paid at the signing of the contract and the acquisition of the underlying security, valued at the strike price, if and when an option is exercised.
Because options are marketable, it would seem that trading in options, as well as the payment of the premium for the acquisition of an option, should be recorded in the capital account. But the seller of an option does not incur a financial liability, so an option represents a real, not a financial, asset. Therefore, the acquisition of the option and subsequent trading in the option should be recorded in the current account.
At any rate, if the option is exercised, the purchase of the underlying financial instrument should be entered in the capital account. If commodities instead of a financial instrument are acquired, however, the acquisition of the goods should be entered in the merchandise account.
For the valuation of options, it is recognized that, from the time of the purchase of the option to the date of its exercise, the option represents an asset for the holder. For instance, an investor has purchased an American call option on £10,000 with an exercise price of US$1.20, giving him the right to buy £10,000 at the rate of US$1.20 per £1 anytime between the signing of the contract and the expiration date. If during this period a strengthening of the pound sterling had taken place and the market price of sterling had risen above the exercise price, the holder of the option would have benefited because his option would have increased in value. Even though an option represents an asset that might change in value, the underlying commitment should be viewed as a contingent asset for the purchaser of the option and a contingent liability for the seller, until the option is exercised. Only entries for premium payments, and subsequent trading in the options, would be recorded in the balance of payments, unless and until the options are exercised.
NEW FINANCIAL INSTRUMENTS 191
Forward Rate Agreements
Balance of payments entries associated with forward rate agreements are limited to current account transactions only, as principal amounts are never exchanged. However, the recording of the difference between the agreed rate of interest of the forward rate agreement and the prevailing interest rate is a problem. In essence, this difference does not represent interest but is more like an insurance premium or some other service.
The flows in the balance of payments associated with a forward rate agreement are illustrated in the following example. Suppose a bank commits itself to extend a 9 percent loan to be drawn sometime in the future. It covers itself by entering into a forward rate agreement at 8112 percent with a nonresident. If at the time of the extension of the loan the prevailing interest rate is 11 percent, the bank will receive from the seller of the agreement the difference between the prevailing rate of 11 percent and the forward rate of 81/2 percent. In the balance of payments the receipt of that amount should be recorded as a credit in one of the current account items, as discussed in the preceding paragraph.
Eurobonds
The classification of Eurobonds does not pose problems within the existing framework of the BPM. Because these bonds are issued with an original maturity of more than one year, they should be classified as portfolio investment. In the case of convertible Eurobonds, the conversion of bonds into equity does not change their character as portfolio investment. The BPM provides for the explicit showing of these conversions as changes in both bonds and equities separately. The valuation of transactions in which bonds are exchanged for equities should be at market values. Although different approaches are possible, warrants appear to be similar in nature to options and therefore might be classified in the same way.
Other Bonds
Considerations pertaining to the treatment in the balance of payments of junk bonds, indexed bonds, and zero-coupon bonds are provided in Chapter 14 of this volume.
192 EXTERNAL SECTOR TRANSACTIONS
III. Methodological Implications
From this review of the emergence of the new financial instruments, two features of importance to a balance of payments compiler can be observed. One is the movement away from syndicated bank loans to the securitization2 of debt, and the other is the increasing importance of off-balance-sheet transactions.3 In addition, although not related to the emergence of a new financial instrument, attention has been focused increasingly on debt capitalization programs under which debt is converted into equity. This section offers some considerations that might be taken into account if it is deemed necessary to review the classification framework of the balance of payments.
Securitization of Debt
Bonds and floating-rate notes are the most common examples of securitized long-term credits, and NIFs are the main facility in which short-term credits are securitized. At present, the BPM classifies longterm bonds and corporate equities, other than those included in direct investment and reserves, as portfolio investment. Bonds are defined to have an original maturity of more than one year. Therefore, transactions in securities identified separately in the balance of payments are limited to long-term instruments. Transactions in securities that are originally short-term are at present indistinguishably included in categories other than portfolio investment.
The question arises as to whether transactions in securities originally issued as short-term should be identified separately. Specifically, it can be argued that sales and purchases of securities, both long-term and short-term, are influenced by more or less the same factors. Under the present recommendations of the BPM, transactions in short-term securities can only be made explicit as a nonstandard component. In the balance of payments statements of some industrial countries, however, transactions in short-term instruments are identified separately.
Securitization has also resulted in an increase in the negotiability of the banks' conventional assets. These efforts are focused mainly in two areas: the outright sale of loans (with or without recourse) and
2 The term most often used to denote the process by which bank assets, mainly loans or mortgages, are converted into negotiable securities.
3 A widely used term to refer to banking activities that do not involve booking assets and taking deposits.
NEW FINANCIAL INSTRUMENTS 193
the converting of loans (notably mortgages) into marketable instruments. From the standpoint of classification, the question is whether these instruments should be classified in the portfolio investment account: should the securitization of loans, for instance, continue to be classified as drawings and repayments of loans, or should these transactions be classified as portfolio investments?
Off-Balance-Sheet Transactions
Off-balance-sheet transactions can best be described as transactions in which one party is committed to act when called upon, but the need for action is uncertain at the time the contract is made. For instance, under a NIF, a group of banks might be called upon to fund whatever notes they were not able to sell for a corporate borrower. Similarly, in an option, the seller faces the obligation to act if the buyer exercises his option. In all these cases, the action to purchase notes by the banks or the honoring of the option by the seller is uncertain at the time the contract is made. The question therefore arises whether a contract to undertake possible future action should be considered as a transaction appropriate for inclusion in the balance of payments. As defined in the BPM, transactions refer to any exchanges of assets that by convention are to be shown in the balance of payments. Other than the payments of fees, premiums, and the like, it cannot be said that an actual exchange has taken place at the time the contract was entered into. Therefore no capital transaction, in the sense of the BPM, could have occurred. Capital transactions will be recorded when, in the case of NIFs, the notes are placed with investors or purchased by the banks for their own accounts or when, in the case of options, the purchaser exercises his or her rights.
Debt Capitalization
Debt capitalization is not a new development, but recently its use has become more widespread as a result of mounting difficulties faced by many developing countries in servicing their external debt. Typical of debt capitalization is the conversion of external debts, payable in foreign currencies, into equity capital, denominated in local currency. The framework in the BPM for the classification of transactions that convert external debt into equity is fully adequate and poses no problem. The main problem associated with these conversions is the valuation of the transactions.
The BPM recommends that transactions in debt instruments be
194 EXTERNAL SECTOR TRANSACTIONS
recorded at their market value. It is likely that, at the time a debt capitalization program is being negotiated, part of the loans or bonds to be converted are already being sold or traded at a value below their face value. The loans or bonds that are being converted into equity should therefore be recorded in the balance of payments at their reduced value. This treatment regards the difference between the market value and the face value as a realized capital loss from the creditor's point of view and as a realized reduction in the value of a debt from the debtor's point of view. The value of the equity capital should, of course, be the same as the value at which the loan or bond is considered to be repaid or redeemed.
I'V. Conclusions
In recent years innovations in the international financial markets have brought into being a multitude of financial instruments. The emergence of these instruments has led to uncertainties about the collection of data for transactions in these instruments and about their classification. In general, it can be said that the guidelines for classification under the present BPM are sufficient to ensure a proper classification of these instruments. The shift away from syndicated loans to securitization of debt, however, raises some questions about the analytical usefulness of the present definition of portfolio investment in the BPM. In addition, the BPM definitions of long-term and shortterm capital have tendeq to become less important from an analytical point of view because of the increased marketability of these financial instruments. To market participants, the original term to maturity has become less important. Instead, other considerations prevail, such as hedging interest rate exposures, the possibilities of earning fees, the management of interest rate risks, the remaining term to maturity, and so forth. In addition, the distinction between temporary, reversible movements and more permanent, less volatile movements has become more difficult as long-term instruments have become subject to volatile movements and reversals.
14
Oassification of Transactions in Zero-Coupon Bonds, Junk Bonds,
and Indexed Bonds in the Balance of Payments
RoBERT McCoLL
S INCE PUBLICATION of the fourth edition of the IMF's Balance of Payments Manual (BPM) in 1977, the international capital markets
have seen a burgeoning in the variety of financial instruments in use. Either because these instruments did not exist or were not of significance before 1977, they were not expressly mentioned in the BPM. This paper will examine three such instruments-zero-coupon bonds, junk bonds, and indexed bonds-for which the application of the BPM's recommendations with regard to the classification of transactions may not, at first glance, be clear-cut.
Section I of the paper briefly reviews the BPM's recommendations for the separation of transactions in financial instruments into those that constitute the extension or redemption of principal and those that constitute income payable for the provision of that capital. Sections II-IV deal, in order, with each of the new financial instruments listed in the previous paragraph, highlighting any unusual features of those instruments and identifying and applying the relevant recommendations as outlined in Section I. Section V brings together the observations about the nature of the instruments chosen for analysis and concludes that they can be accommodated within the framework oftheBPM.
I. Income and Principal in the Balance of Payments
Transactions in foreign financial assets can be thought of as having three possible components: (1) the extension of principal and its sub-
195
1% EXTERNAL SECTOR TRANSACTIONS
sequent repayment; 1 (2) income; and (3) capital gains and losses (from the realization of valuation changes).
Together, components 1 and 2 reflect the exchange of a sum to be delivered in one or more installments, the principal, against another sum to be delivered in one or more installments, covering the principal plus the positive or negative income over that principal. Thus, the principal refers to the amount originally advanced by the creditor and, with the exception of perpetual bonds, is equal to the sum required at maturity to redeem the debt. Any additional (positive or negative) amount expended at the time the debt is redeemed, at maturity, constitutes income generated by the asset.
Investment income is generally regarded as a gain or recurrent benefit derived from the ownership of capital. In the balance of payments, it is income derived from the ownership of foreign financial assets.
Component 3 reflects two transactions, a purchase and a sale, at different prices. Capital gains and losses present the realization, through a change in ownership, of a change in the value of a financial asset because of general interest rate changes, a change in the creditworthiness of the issuer of the debt, and so on. Such capital gains should not be confused with income, which accrues because of the passage of time. Unrealized valuation changes, including write-offs, although of importance in generating balance-sheet data, do not represent transactions and are omitted from the flow accounts.
Any debt security will provide a return that can be considered to have three components: an income component to compensate the owner of the capital for providing its use to others; an inflationary component to compensate for any decline in purchasing power of the capital advanced; and a risk component to compensate for exposure to the possibility of a failure by the debtor to return the funds advanced. All such compensations form the return or income on the security.
It would seem that the identification of principal is easily made. Once a credit has been extended, that amount continues to reflect the principal. For example, where securities are issued "at a value different from the stated fixed sum that their holder has the unconditional right to receive when the obligations mature" (BPM, paragraph 293)-that is, the principal-that difference is to be regarded as· income and recorded when payable. Such discounts or premiums might range from small adjustments to coupon bonds (to take ac-
1 Perpetual bonds or loans by definition do not call for repayment of principal.
ZERO-COUPON, JUNK, AND INDEXED BONDS 197
count of minor fluctuations in the market interest rate between the time the prospectus specifying the coupon rate is issued and the bonds are sold), to large adjustments to those securities that bear no coupon and provide their holders with a return solely in the form of a discount.
When such instruments are traded after they have been issued, separating income from capital gains (losses) becomes more difficult. Then, any difference between the price at which the instrument was initially sold and the price at which it was purchased (at the time of issue or thereafter) does not represent income but a realized valuation gain (loss), to be recorded in the capital account.
In the following three sections the above general principles and specific recommendations will be applied to the three instruments chosen for analysis to determine the appropriate classification of transactions in these securities.
II. Zero-Coupon Bonds
Zero-coupon bonds are debt securities that pay no coupon interest during the life of the bond, so that the income is composed solely of the difference (or discount) between its redemption price and its issuance price. Such bonds, therefore, represent the extreme situation for discount income and, as described in the previous section, according to the BPM this discount is recorded as income at the time that it is due for payment. The principal is the value for which the bond is issued. At redemption (at maturity), the transactions will involve the repayment of principal (equivalent to the issue value) and the payment of accrued income (equivalent to the redemption price less the issue price). If the security is traded before maturity, the transaction price may include, in addition to accrued income, a realized valuation change for the seller of the asset. That valuation change will appear in the capital account by recording purchases and sales of the bonds at market prices.
An obvious problem in accounting for zero-coupon bonds is that, because the entire income is generated through the discount, the cost of providing the capital is not appropriately matched to the periods for which the capital is provided. Minor inconsistencies for discounts or premiums that represent adjustments to coupon issues become major distortions for zero-coupon bonds. Accruing the income over the life of the bond, as recommended in Chapter 3 of this volume, would eliminate the distortion.
198 EXTERNAL SECTOR TRANSACTIONS
III. Junk Bonds
Junk bonds, also referred to as high-yielding or speculative bonds, are debt securities that yield a significantly higher rate of return than top-grade bonds because these issues are perceived to be high-risk ventures.
A junk bond differs from other bonds in that the risk component of the rate of return is large compared with the other elements in that rate. Nonetheless, the composite rate is still income, just as high nominal interest rates drawn in periods of high real interest rates or of high inflation are income. The degree to which any element within the composite interest rate may be dominant is irrelevant. For example, in any economy there will be a wide divergence in the risk assessments awarded the various debtors in the capital markets. Government-guaranteed debt might be trading at interest rates substantially below a high-quality corporate or "prime" rate for similar maturities. The difference is in the magnitude of the risk component. New debtors to the market will pay considerably more than the prime rate, again because of the higher risk assessment associated with their issues. The junk bond represents an extreme in which the risk component is very large indeed.
To consider the exceptional risk component of the interest rate applicable to a junk bond as capital being returned to the investor would require all interest on all securities to be reassessed and a new notion of income to be derived to exclude that risk element. Some threshold level of risk would have to be set arbitrarily, above which interest payments might be deemed to represent capital repayments. It is not obvious what analytical usefulness would be derived from such an arbitrary allocation between income and capital. A similar exercise could be required to remove the inflationary element from income when inflation is high or volatile. Such redefinitions of the basic notion of income, however, are beyond the scope of this paper.
I'V. Indexed Bonds
Indexed bonds are debt securities for which the redemption value or coupon payments (or both) are linked to a price index2 in order to
2 Although indexed bonds are usually linked to a price index of one or more commodities, there are also other types of linkage, such as linkage to the exchange rate of a currency or a basket of currencies, or to the price of a basket of shares.
ZERO-COUPON, JUNK, AND INDEXED BONDS 199
protect the holders of the bonds against a depreciation in terms of purchasing power of the asset. These two types of indexing, of the redemption value or of the coupon payments, will be considered separately to facilitate their analysis.
Bonds whose coupon payments are indexed are essentially floating-rate bonds. The intention may be to accommodate only changes attributable to inflation, but the choice of the target may actually alter the income component by over- or undercompensating for inflation. It would appear, therefore, that bonds carrying indexed coupons should be treated like any other variable rate bond; that is, the coupon payments are considered to be income.
Bonds for which the redemption values are indexed are essentially discount bonds, except that the conventional discount bond has the redemption value expressed in money terms. The yield or rate of return expected from the bond determines the difference between the issue price and the redemption price. For indexed bonds, the issue price is known and the "stated fixed sum" that the holder has an unconditional right to receive is a monetary amount multiplied by an index. In other words, the discount rate is determined ex post.
For bonds that have the redemption value indexed, the issue price should therefore be recorded as the principal value for the bond, with the additional indexation payment payable at maturity being the discount part of the income. Of course, the considerations with regard to accrued income for deep-discount, zero-coupon, and other bonds will also apply to bonds with the redemption value bearing an indexed return.
However, whereas the application of compound interest rate formulas may be necessary in the calculation of accrued income for other bonds, the index will provide a direct and easily applied factor for compiling the discount or indexed income over the life of the bond.
Bonds bearing a combination of indexed coupons and redemption values resemble coupon bonds issued at a discount. Each element will be separately recorded in accordance with the above discussion.
V. Conclusions
From the analyses presented here, it would appear that the three financial instruments chosen for consideration do not exhibit any features for which the BPM does not make provision in its recommendations. The apparent novelty of each of the instruments discussed lies in the magnified significance of particular standard elements contained in the more regular instruments discussed in the BPM. Zero-
200 EXTERNAL SECTOR TRANSACTIONS
coupon bonds emphasize the discount element of income to the exclusion of coupons; junk bonds emphasize the risk element contained in the interest yield on such securities; and indexed bonds simply match the rate of return, through either coupons or discounts, to some specified index in the hope of accurately setting the inflationary element in the interest rate.
15
Some Issues in the Balance of Payments Presentation of Arrears
and Debt Reorganization
}OHN E. THORNTON
T HIS PAPER addresses some methodological issues in balance of payments accounting for external debt-servicing arrears and for
debt reorganization. It attempts to clarify some of the concepts and issues involved in the balance of payments accounting procedures and to supplement the guidelines offered in the fourth edition of the IMF's Balance of Payments Manual (BPM), which was prepared before the emergence of widespread balance of payments difficulties associated with arrears and reorganization of external debt.
The paper begins with a review of the Fund's current balance of payments accounting methodology for the treatment of external arrears and debt reorganization as prescribed by the BPM and as practiced in the Fund's Balance of Payments Statistics (BOPS). It then examines how the use of accrual accounting (that is, recording entries when payment is due) rather than cash accounting (that is, recording entries when disbursement takes place) may allow the identification of arrears and debt reorganization transactions. It is argued that many of the operational problems encountered in identifying these transactions in the balance of payments accounts may be overcome by an increase in the degree of detail, and some suggestions are put forward to this end.
I. The Fund's Treatment of Arrears and Debt Reorganization in the Balance of Payments Statistics
An important purpose of balance of payments accounts is to provide an indication of the need for policy adjustment to rectify external
201
202 EXTERNAL SECTOR TRANSACTIONS
imbalance. The double-entry system used in balance of payments accounting implies that the accounts must be in balance. Therefore, arriving at a surplus or deficit in the balance of payments requires summing a subsection of all external transactions and distinguishing the transactions "above the line" from those "below the line." The decision on where to draw the line requires a judgment about the set of external transactions that best indicates the need for balance of payments adjustment. A broad approach is to place below the line only transactions undertaken to compensate for balance of payments deficit on net autonomous transactions-that is, to compensate for transactions undertaken for their own sake. This approach gives the deficit for which the central authorities have provided the financing by drawing on their reserves, by engaging in official foreign borrowing, or by inducing other residents to borrow. It therefore focuses on the use of reserves and the short-term constraints that result from the limited availability of balance of payments financing. In the aggregated presentation of the balance of payments employed in the BOPS, this deficit is covered by liabilities constituting foreign authorities' reserves, the total change in reserves, and exceptional financing.
It is exceptional financing that links the concept of balance of payments need to the accounting procedures for dealing with arrears of external debt and debt reorganization. Transactions that are considered appropriate for inclusion under exceptional financing include arrears in payments and deferments of payments of external obligations (including overdue financial obligations to the Fund) resulting from the authorities not providing foreign exchange; any rescheduling arrangements arising from arrears and deferments; drawings on loans or refinancing loans for the purpose of balance of payments support; and debt forgiveness.
In the presentation of the balance of payments, separate practices are followed for the accounting of arrears of interest and amortization, debt rescheduling, debt refinancing, and debt forgiveness. In practice, a debt reorganization package, particularly if it is a multiyear arrangement, may combine elements of each of these. The treatment of the reorganization in the balance of payments accounts may, therefore, include entries in several accounts that may be both above and below the line in the aggregated presentation. In the case of a multiyear arrangement, it is also frequently the case that a rescheduling of obligations due beyond the current accounting period is subject to certain conditions being in place when the obligations fall due. In this case, balance of payments accounting practice is to record entries only in the period when the particular conditions have been fulfilled and the debt reorganization has been concluded. No entries are made in
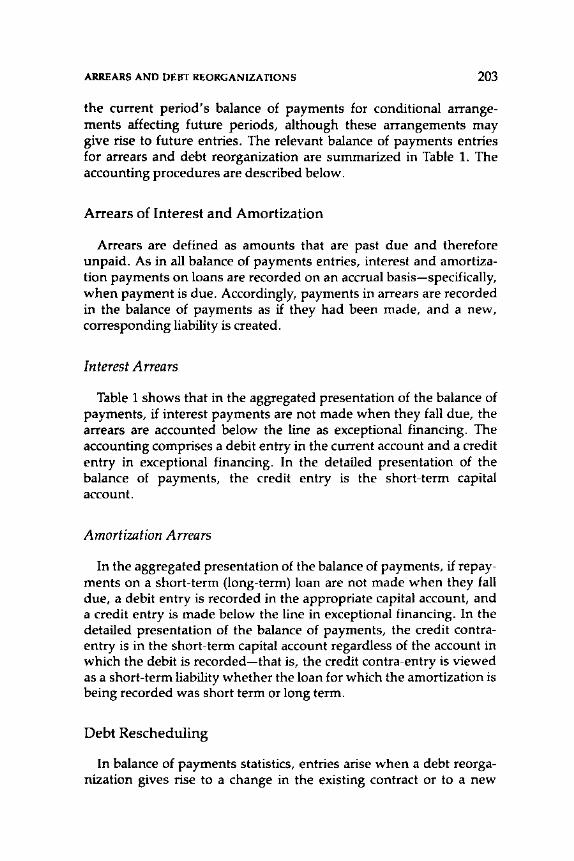
ARREARS AND DEBT REORGANIZATIONS 203
the current period's balance of payments for conditional arrangements affecting future periods, although these arrangements may give rise to future entries. The relevant balance of payments entries for arrears and debt reorganization are summarized in Table 1. The accounting procedures are described below.
Arrears of Interest and Amortization
Arrears are defined as amounts that are past due and therefore unpaid. As in all balance of payments entries, interest and amortization payments on loans are recorded on an accrual basis-specifically, when payment is due. Accordingly, payments in arrears are recorded in the balance of payments as if they had been made, and a new, corresponding liability is created.
Interesti\rrears
Table 1 shows that in the aggregated presentation of the balance of payments, if interest payments are not made when they fall due, the arrears are accounted below the line as exceptional financing. The accounting comprises a debit entry in the current account and a credit entry in exceptional financing. In the detailed presentation of the balance of payments, the credit entry is the short-term capital account.
J\mortization J\rrears
In the aggregated presentation of the balance of payments, if repayments on a short-term (long-term) loan are not made when they fall due, a debit entry is recorded in the appropriate capital account, and a credit entry is made below the line in exceptional financing. In the detailed presentation of the balance of payments, the credit contraentry is in the short-term capital account regardless of the account in which the debit is recorded-that is, the credit contra-entry is viewed as a short-term liability whether the loan for which the amortization is being recorded was short term or long term.
Debt Rescheduling
In balance of payments statistics, entries arise when a debt reorganization gives rise to a change in the existing contract or to a new
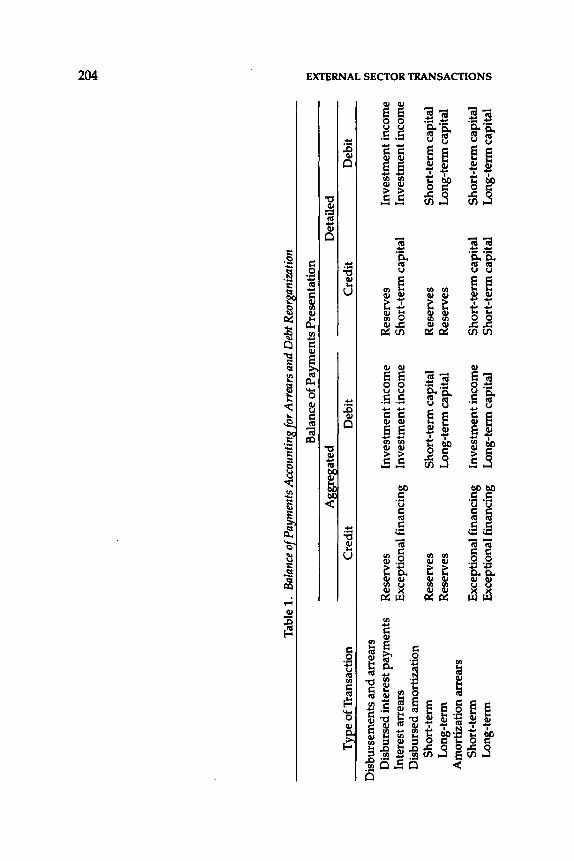
~
Tab
le 1
. Ba
lanc
e of
Pay
men
ts A
ccou
ntin
g fo
r A
rrea
rs a
nd D
ebt R
eorg
aniz
atio
n
Bal
ance
of P
a~ments P
rese
ntat
ion
Ill ~
Agg
rega
ted
Det
aile
d Il
l ~ T
ype
of T
rans
acti
on
Cre
dit
Deb
it
Cre
dit
Deb
it
>
I""
Dis
burs
emen
ts a
nd a
rrea
rs
f/1
Ill
Dis
burs
ed in
tere
st p
aym
ents
R
eser
ves
Inve
stm
ent i
ncom
e R
eser
ves
Inve
stm
ent i
ncom
e n ..
;
Inte
rest
arr
ears
E
xcep
tion
al f
inan
cing
In
vest
men
t inc
ome
Sho
rt-t
erm
cap
ital
In
vest
men
t inc
ome
0 :;.a
Dis
burs
ed a
mor
tiza
tion
~
Sho
rt-t
erm
R
eser
ves
Sho
rt-t
erm
cap
ital
R
eser
ves
Sho
rt-t
erm
cap
ital
z
Lon
g-te
rm
Res
erve
s L
ong-
term
cap
ital
R
eser
ves
Lon
g-te
rm c
apit
al
f/1 >
Am
orti
zati
on a
rrea
rs
n ::::!
Sho
rt-t
erm
E
xcep
tion
al f
inan
cing
In
vest
men
t inc
ome
Sho
rt-t
erm
cap
ital
S
hort
-ter
m c
apit
al
0 z L
ong-
term
E
xcep
tion
al f
inan
cing
L
ong-
term
cap
ital
S
hort
-ter
m c
apit
al
Lon
g-te
rm c
apit
al
f/1
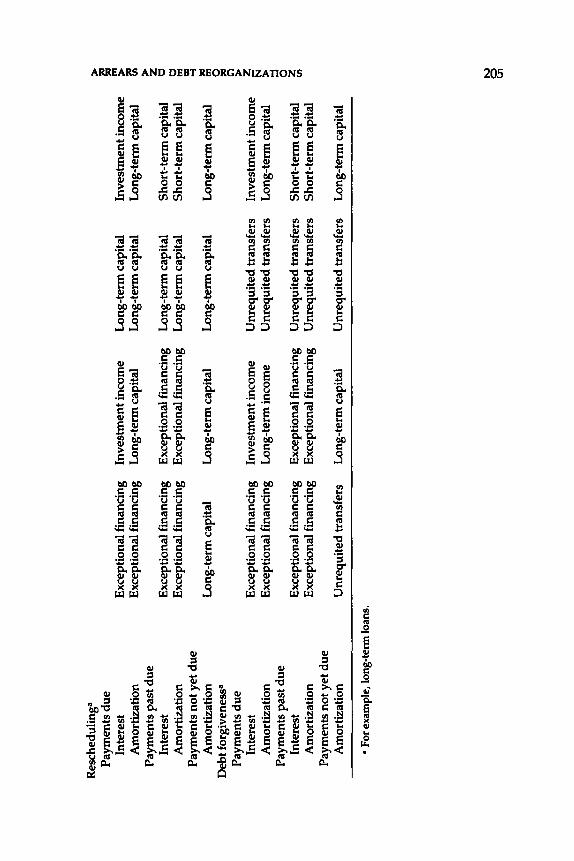
Res
ched
ulin
ga
>
Pay
men
ts d
ue
~ In
tere
st
Exc
epti
onal
fin
anci
ng
Inve
stm
ent i
ncom
e L
ong-
term
cap
ital
In
vest
men
t inc
ome
>
Am
orti
zati
on
Exc
epti
onal
fin
anci
ng
Lon
g-te
rm c
apit
al
Lon
g-te
rm c
apit
al
Lon
g-te
rm c
apit
al
:.a
Ul
Pay
men
ts p
ast d
ue
> z
Inte
rest
E
xcep
tion
al f
inan
cing
E
xcep
tion
al f
inan
cing
L
ong-
term
cap
ital
S
hort
-ter
m c
apit
al
0
Am
orti
zati
on
Exc
epti
onal
fin
anci
ng
Exc
epti
onal
fin
anci
ng
Lon
g-te
rm c
apit
al
Sho
rt-t
erm
cap
ital
0 I'l
l 1:1
11 P
aym
ents
not
yet
du
e --1
Am
orti
zati
on
Lon
g-te
rm c
apit
al
Lon
g-te
rm c
apit
al
Lon
g-te
rm c
apit
al
Lon
g-te
rm c
apit
al
:.a
I'll
Deb
t for
give
ness
a 0 ~
Pay
men
ts d
ue
>
Inte
rest
E
xcep
tion
al f
inan
cing
In
vest
men
t inc
ome
Unr
equi
ted
tran
sfer
s In
vest
men
t inc
ome
z r::l A
mor
tiza
tion
E
xcep
tion
al f
inan
cing
L
ong-
term
inco
me
Unr
equi
ted
tran
sfer
s L
ong-
term
cap
ital
>
P
aym
ents
pas
t du
e ::1
0
Inte
rest
E
xcep
tion
al f
inan
cing
E
xcep
tion
al f
inan
cing
U
nreq
uite
d tr
ansf
ers
Sho
rt-t
erm
cap
ital
z U
l
Am
orti
zati
on
Exc
epti
onal
fin
anci
ng
Exc
epti
onal
fin
anci
ng
Unr
equi
ted
tran
sfer
s S
hort
-ter
m c
apit
al
Pay
men
ts n
ot y
et d
ue
Am
orti
zati
on
Unr
equi
ted
tran
sfer
s L
ong-
term
cap
ital
U
nreq
uite
d tr
ansf
ers
Lon
g-te
rm c
apit
al
• Fo
r exa
mpl
e, l
ong-
term
loan
s.
~
206 EXTERNAL SECTOR TRANSACTIONS
contract. In the case of a debt rescheduling, the existing contract is changed to extend the maturity of payments due to lenders. A formal deferment of debt service payments takes place, and new maturities are applied to the deferred amounts. Balance of payments accounting practice with respect to debt rescheduling reflects the accounting period in which the debt service obligations fall due.
Rescheduling Obligations Past Due
Obligations past due are in arrears. When arrears are rescheduled, the accounting reflects a reduction in arrears and the creation of a new loan that is treated as a balance of payments financing item. In the aggregated presentation of the balance of payments, therefore, what is being recorded is a change in the nature of exceptional financing-the repayment of arrears and the drawing of a new loanand both the debit and credit entries appear below the line in the category of exceptional financing. In the detailed presentation of the balance of payments, the rescheduled debt payment is recorded as a debit entry in the short-term capital account (other loans received) and the credit contra-entry is recorded in the long-term capital account (drawings on loans received).
Rescheduling of Obligations Due
Interest and amortization obligations that fall due in the current accounting period and are rescheduled are viewed as paid on time and financed by the rescheduled loan. The accounting reflects the reduction of payments associated with an existing loan (that is, interest and amortization) and the creation of a new loan, which is treated as a balance of payments financing item. In the aggregated presentation of the balance of payments, the accounting entries are a debit to the current account (investment income, interest) and to the short- or long-term capital account (other loans received) according to the maturity of the original loan, and a credit to exceptional financing (debt rescheduled). In the detailed presentation, the credit entry is in the long-term capital account.
Rescheduling of Obligations Not Yet Due
When obligations that are due beyond the current accounting period are rescheduled, balance of payments entries are required to
ARREARS AND DEBT REORGANIZATIONS 207
reflect the change in maturities. Balance of payments need is not attributed to the rescheduling of obligations not yet due and, so as not to distort the measure of the current period's external performance, the entire accounting is above the line, with no distinction in the entries in the detailed and the aggregated presentations of the balance of payments. A distinction is made between a rescheduling that involves the conversion of a short-term loan into a long-term loan and one that involves extending a long-term loan. In the case of the former, a debit entry is recorded in the short-term capital account, and the credit contra-entry is in the long-term capital account. In the case of rescheduling a long-term loan, both entries are in the longterm capital account.
Sectoring
When a debt is rescheduled, it is frequently the case that some resectoring of the debt takes place, typically when private sector debt is assumed by the official sector. When one sector assumes the debt of another sector, the entries in the detailed presentation of the balance of payments are a credit to the capital account of the assuming sector, to reflect the assumption of an obligation, and a debit to the other sector's capital account, to reflect the reduction of a liability. In the aggregated presentation of the balance of payments, the credit entry is recorded as exceptional financing to the assuming sector in the case of obligations due in the current accounting period; both entries are accounted below the line, in exceptional financing, in the case of obligations past due; and there is no distinction between the treatment in the detailed and aggregated presentation in the case of obligations due beyond the current accounting period.
Debt Refinancing
When a debt is refinanced, a new loan is arranged to cover the timely payment of the original debt. Either a rollover of maturing debt obligations takes place, or existing or future debt service payments are converted to a new loan. When a debt is refinanced out of balance of payments need-for example, as part of a multiyear debt reorganization-the balance of payments entries are the same as those described for the rescheduling of obligations due in the current accounting period. That is, the debit entries are to the current account in the case of interest payments refinanced, and to the short- or longterm capital account in the case of amortization payments refinanced
208 EXTERNAL SECTOR TRANSACTIONS
(according to the maturity of the original loan); the credit entries are to exceptional financing in the aggregated presentation and to the long-term capital account in the detailed presentation.
When balance of payments need is not the motivating factor behind a debt refinancing, the entire accounting is above the line, and there is no distinction in the treatment in the aggregated and the detailed presentation of the balance of payments. The entries in the balance of payments are the same as those described earlier for the rescheduling of obligations not yet due. That is, the debit entry is in the capital account according to the maturity of the loan, and the credit entry is in the long-term capital account.
Debt Forgiveness
A creditor may forgive all, or part, of the debt of a debtor in a country that is experiencing balance of payments problems. In balance of payments accounting this act of "forgiveness" is treated as an unrequited transfer from the creditor to the debtor-that is, the accounting reflects the reduction of a liability offset by an unrequited transfer. Like other aspects of debt reorganization, the accounting treatment of debt forgiveness differs according to the accounting period in which the debt service obligations fall due.
Forgiveness of Obligations Past Due
When obligations that are in arrears are forgiven, the accounting reflects a reduction in arrears and an unrequited transfer that is treated as a balance of payments financing item. In the aggregated presentation of the balance of payments, just as in the case of the rescheduling of obligations past due, it is a change in the nature of exceptional financing that is recorded, and both the debit and the credit entries appear below the line in the category of exceptional financing. In the detailed presentation of the balance of payments, the debit entries for interest and amortization forgiven are to the short-term capital account, and the credit entries are to the current account, unrequited transfers.
Forgiveness of Obligations Due
When obligations that are due in the current accounting period are forgiven, the accounting reflects a reduction of payments associated
ARREARS AND DEBT REORGANIZATIONS 209
with an existing loan and an unrequited transfer that is treated as a balance of payments financing item. In the aggregated presentation of the balance of payments, the debit entries are to the current account (investment income, interest) in the case of interest forgiven and to the capital account (other loans received), according to maturity, in the case of amortization forgiven; the credit entries are to exceptional financing (unrequited transfers). In the detailed presentation of the balance of payments, the credit entries are to the current account (unrequited transfers).
Forgiveness of Obligations Not Yet Due
When obligations due beyond the current accounting period are forgiven, the accounting is above the line, and there is no distinction in the treatment in the aggregated and detailed presentations of the balance of payments. In this case, a debit entry is recorded in the appropriate capital account (other loans received), and the credit entry is recorded in the current account (unrequited transfers).
Debt Write-Offs
In balance of payments methodology debt forgiveness is distinguished from a debt write-off, whereby a creditor may, because of bank supervisory requirements or for prudential reasons, provision against a bad debt without extinguishing the repayment obligation of the debtor. Debt write-offs are treated in the balance of payments accounts in the same way as a valuation change, since no contract with another party disposing of the claim has been made whereby a capital loss could have been realized. Accordingly, debt write-offs are not included in the balance of payments accounts.
II. Derivation of Statistics on Arrears and Debt Reorganization from Balance of Payments Accounts
For those who wish to derive complete data on arrears and the various forms of debt reorganization from balance of payments accounts, a number of difficulties arise that are due to the level of detail at which balance of payments data are currently compiled. Balance of payments categories in which the relevant flows are recorded do not distinguish between transactions associated with arrears and debt reorganization and transactions that are autonomous.
210 EXTERNAL SECTOR TRANSACTIONS
An increase in the degree of detail presented in the aggregated and detailed presentations of the balance of payments would provide a partial remedy to these difficulties. Additional entries would enable data on arrears and debt reorganization to be directly compiled from the balance of payments accounts on an accrual basis and from other sources on a cash or disbursement basis. It is uncertain, from a practical standpoint, to what extent additional detail would be forthcoming from national compilers. With this in mind, an increase in the detail requested could be either in the debit or credit entries. For obligations past due and for obligations due in the current accounting period, the additional detail could be recorded in the capital account in the detailed presentation and in the category of exceptional financing in the aggregated presentation of the balance of payments. In the case of obligations due beyond the current accounting period, for which there are no entries in exceptional financing, the additional detail could appear in the capital account in both the detailed and the aggregated presentations. The suggestions put forward below illustrate some of the possibilities.
Detailed Presentation
National compilers could be requested to distinguish:
• Recorded capital inflows that are counterparts of interest and amortization arrears
• Credits entered to reschedule obligations due, past due, and not yet due, specifying the maturity of the obligation rescheduled
• Credits entered to refinance obligations due and not yet due, specifying maturity of the obligation refinanced
• Unrequited transfers that are counterparts of interest and amortization forgiven.
Aggregated Presentation
The aggregated presentation of the balance of payments might be expanded such that:
• For obligations past due and due in the current account period, the entries in exceptional financing would distinguish -credits that counterpart interest arrears -credits that counterpart amortization arrears -debits due to rescheduling debt obligations
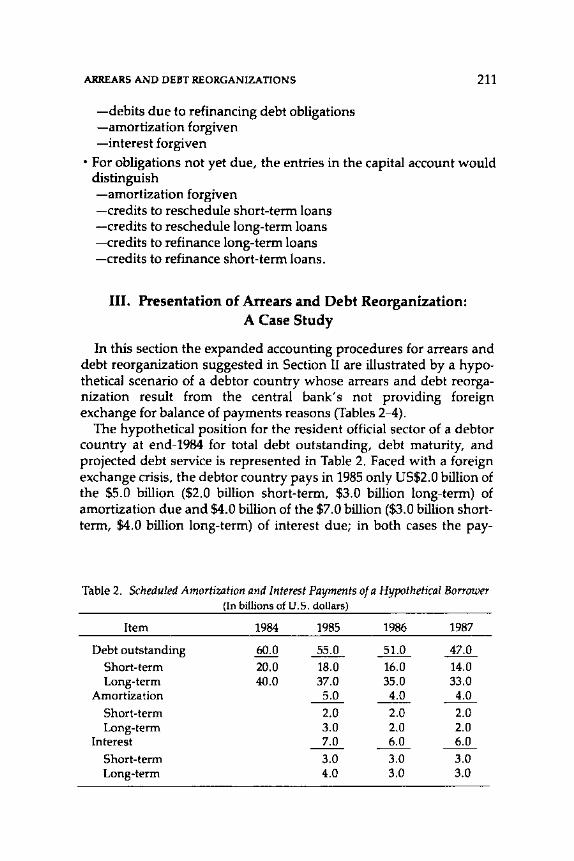
ARREARS AND DEBT REORGANIZATIONS 211
-debits due to refinancing debt obligations -amortization forgiven -interest forgiven
• For obligations not yet due, the entries in the capital account would distinguish -amortization forgiven -credits to reschedule short-term loans -credits to reschedule long-term loans -credits to refinance long-term loans -credits to refinance short-term loans.
III. Presentation of Arrears and Debt Reorganization: A Case Study
In this section the expanded accounting procedures for arrears and debt reorganization suggested in Section II are illustrated by a hypothetical scenario of a debtor country whose arrears and debt reorganization result from the central bank's not providing foreign exchange for balance of payments reasons (Tables 2-4).
The hypothetical position for the resident official sector of a debtor country at end-1984 for total debt outstanding, debt maturity, and projected debt service is represented in Table 2. Faced with a foreign exchange crisis, the debtor country pays in 1985 only US$2.0 billion of the $5.0 billion ($2.0 billion short-term, $3.0 billion long-term) of amortization due and $4.0 billion of the $7.0 billion ($3.0 billion shortterm, $4.0 billion long-term) of interest due; in both cases the pay-
Table 2. Scheduled Amortization and Interest Payments of a Hypothetical Borrower (In billions of U.S. doUars)
Item 1984 1985 1986 1987
Debt outstanding 60.0 55.0 51.0 47.0 Short-term 20.0 18.0 16.0 14.0 Long-term 40.0 37.0 35.0 33.0
Amortization 5.0 4.0 4.0 Short-term 2.0 2.0 2.0 Long-term 3.0 2.0 2.0
Interest 7.0 6.0 6.0 Short-term 3.0 3.0 3.0 Long-term 4.0 3.0 3.0
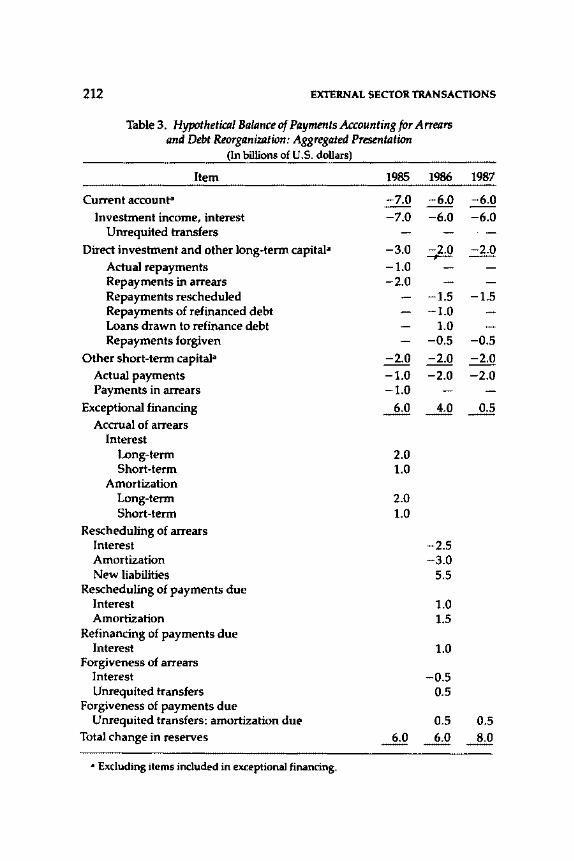
212 EXTERNAL SECTOR TRANSACTIONS
Table 3. HypothetiCill Balance of Payments Accounting for Arrears and Debt Reorganization: Aggregated Presentation
(In billions of U.S. dollars)
Item 1985 1986 1987
Current accounta -7.0 -6.0 -6.0 Investment income, interest -7.0 -6.0 -6.0
Unrequited transfers
Direct investment and other long-term capitala -3.0 -2.0 -2.0 Actual repayments -1.0 Repayments in arrears -2.0 Repayments rescheduled -1.5 -1.5 Repayments of refinanced debt -1.0 Loans drawn to refinance debt 1.0 Repayments forgiven -0.5 -0.5
Other short-term capitala -2.0 -2.0 -2.0 Actual payments -1.0 -2.0 -2.0 Payments in arrears -1.0
Exceptional financing 6.0 ~ 0.5 Accrual of arrears
Interest Long-term 2.0 Short-term 1.0
Amortization Long-term 2.0 Short-term 1.0
Rescheduling of arrears Interest -2.5 Amortization -3.0 New liabilities 5.5
Rescheduling of payments due Interest 1.0 Amortization 1.5
Refinancing of payments due Interest 1.0
Forgiveness of arrears Interest -0.5 Unrequited transfers 0.5
Forgiveness of payments due Unrequited transfers: amortization due 0.5 0.5
Total change in reserves 6.0 6.0 8.0
• Excluding items included in exceptional financing.
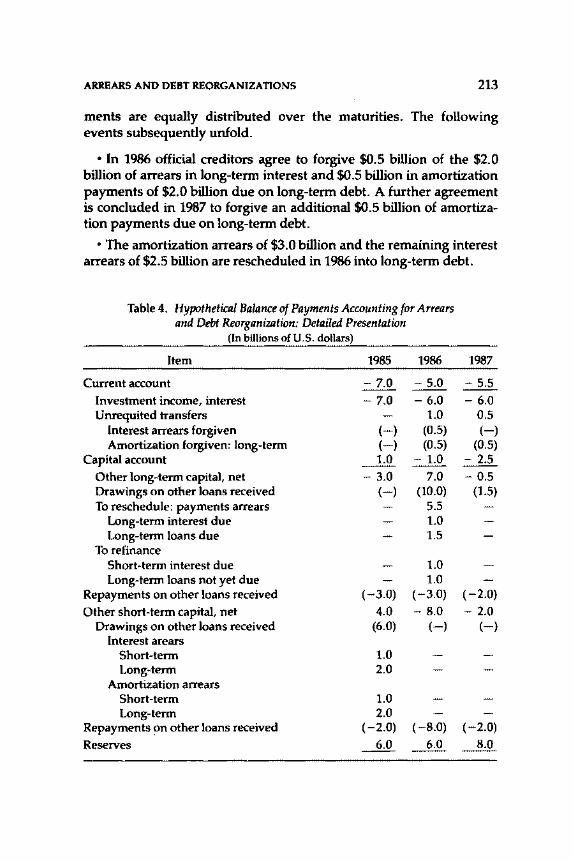
ARREARS AND DEBT REORGANIZATIONS 213
ments are equally distributed over the maturities. The following events subsequently unfold.
• In 1986 official creditors agree to forgive $0.5 billion of the $2.0 billion of arrears in long-term interest and $0.5 billion in amortization payments of $2.0 billion due on long-term debt. A further agreement is concluded in 1987 to forgive an additional $0.5 billion of amortization payments due on long-term debt.
• The amortization arrears of $3.0 billion and the remaining interest arrears of $2.5 billion are rescheduled in 1986 into long-term debt.
Table 4. Hypothetical Balance of Payments Accounting for Arrears and Debt Reorganization: Detailed Presentation
(In billions of U.S. dollars)
Item 1985 1986 1987
Current account -7.0 - 5.0 - 5.5
Investment income, interest -7.0 -6.0 -6.0 Unrequited transfers 1.0 0.5
Interest arrears forgiven (-) (0.5) (-) Amortization forgiven: long-term (-) (0.5) (0.5)
Capital account 1.0 - 1.0 -2.5
Other long-term capital, net - 3.0 7.0 - 0.5 Drawings on other loans received (-) (10.0) (1.5) To reschedule: payments arrears 5.5
Long-term interest due 1.0 Long-term loans due 1.5
To refinance Short-term interest due 1.0 Long-term loans not yet due 1.0
Repayments on other loans received ( -3.0) ( -3.0) ( -2.0)
Other short-term capital, net 4.0 -8.0 - 2.0 Drawings on other loans received (6.0) (-) (-)
Interest arears Short-term 1.0 Long-term 2.0
Amortization arrears Short-term 1.0 Long-term 2.0
Repayments !Jn other loans received ( -2.0) ( -8.0) ( -2.0)
Reserves 6.0 6.0 8.0
214 EXTERNAL SECTOR TRANSACTIONS
• In 1986 the debtor country pays $4.0 billion of the $6.0 billion of interest due, equally distributed over the maturities. In 1986 it reschedules into long-term debt the remaining $1.0 billion of ~nterest due on long-term debt and refinances, with a long-term loan, the remaining $1.0 billion of interest due on short-term debt. Interest payments resume in full in 1987.
• Of the amortization payments due in 1986 and 1987, in each year the annual payments of $2.0 billion due on short-term debt are paid, but the annual payments of $1.5 billion on long-term debt ($2.0 billion less $0.5 billion forgiven by official creditors) are rescheduled to 1988.
In addition to the negotiated debt reorganization later in 1986, to take advantage of lower market interest rates the debtor country decides to refinance $1.0 billion of long-term debt not yet due. To simplify the illustration, it is assumed that no new lending or disbursements take place during the period shown.
By way of example, Tables 3 and 4 illustrate how the case study might be treated if the aggregated and detailed presentations of the balance of payments were expanded in the manner suggested in Section II. The expanded presentation in each case overcomes the potential problems for users of balance of payments statistics that were outlined in Section II. In addition, identifying the individual items in the manner suggested would allow a full debt reorganization package to be presented as a memorandum item to the balance of payments.

Part II
PUBLIC SECTOR ACCOUNTS

16
A Discussion of Public Sector Accounts
}ONA1HAN LEVIN, }AN VAN TONGEREN, BRIAN NEWSON, AND DEREK BlADES
T HIS PAPER was prepared as a guide for discussion at the January 1988 Expert Group Meeting on Public Sector Accounts, with par
ticular reference to the structure of the present United Nations' A System of National Accounts (SNA) and its relationship to the methodology of the IMF's Manual on Government Finance Statistics (GFSM). It is organized in response to questions with respect to the main issues, as follows.
Section I examines the objectives and roles of the two data systems, the resulting structural and data relationships between them, and the principles that should guide any changes designed to clarify and strengthen these relationships. Section II considers proposals for clarifications, revisions, or additional alternatives to coverage of transactors in the light of developments over the past two decades in institutions, economic practices, and analytical needs, with a brief discussion of the statistical units used in the government sector. Section III examines data compilation procedures in both systems that may require revision and their bearing on more explicit reconciliation of the two systems. Section IV considers possible modifications to some analytical concepts and whether the addition to the SNA of several cash-based alternative concepts applicable to government but not to other sectors would enhance analytical usefulness of the SNA or generate ambiguity. Section V examines whether various previous SNA classifications should be revised to reflect general usage in fiscal analysis, national institutions, and data availability.
This paper was prepared by Jonathan Levin, except for subsections that should be attributed as follows. Jan van Tongeren: in Section I, "Data Links"; in Section II, "Community Production of Services and
217
218 PUBLIC SECTOR ACCOUNTS
Capital Goods," "Nonprofit Institutions," "Majority Ownership," "Accounts and Tables for Nonfinancial Public Enterprises and Public Financial Institutions," and "Statistical Units in the Government Sector"; in Section III, "Accrual Versus Cash Basis," "Depreciation of Government Fixed Assets," "Rent on Government-Owned Buildings," and "Debt Cancellations as Transfers"; in Section Iv, "Distinction Between Current Expenditure and Capital Formation" and "Government Operating Surplus"; in Section V, "Indirect Taxes" and "Withdrawals of Entrepreneurial Income." Jan van Tongeren and Jonathan Levin: in Section II, "Government Employees' Pension Schemes" and "Government Employees' Welfare Schemes"; in Section III, "Gross and Net Treatment." Brian Newson: in Section II, "Supranational Authorities"; in Section III, "Separate Identification"; in Section V, "Functions of Government: Revision of COFOG." Derek Blades: in Section II, "Ownership, Control, or Both"; in Section III, "Valuation in Current and Constant Prices."
I. Conceptual and Data Links Between A System of National Accounts and the IMF' s Government Finance Statistics
The structural and data relationships between the SNA and the Fund's system of government finance statistics (GFS) are discussed in this section.
Structural Relationships
Differences between the two systems-in objectives and in concepts-are discussed, and areas for reconciliation identified, in the following subsections.
Objectives
What types of data on government are needed by the Fund and member countries as a guide to fiscal and financial policies, what types of data on government are needed for the construction of national accounts, and to what extent could the objectives of either statistical system be incorporated and met by the other?
Basic differences between the SNA public sector accounts and the Fund's system of government finance statistics (GFS) arise from the development of the two systems along separate tracks, with two separate sets of objectives.
DISCUSSION 219
The GFS system codifies forty years of practice by Fund missions and Fund publications in attempting to measure and present, in a framework of financial analysis, the actions of a sector that cannot be expected to respond like other sectors to monetary and exchange rate stimuli and constraints. To meet the Fund's needs, and those of its member countries, for an immediately verifiable current record of government actions, GFS data are derivable directly from government accounts, with no reliance on estimates or imputations. Because they must be closely integrated with analyses focusing primarily on bank deposits, bank credit, and other financial targets, GFS data are based on government payments and receipts, with only secondary reference to the accrual-basis assets and liabilities generally unavailable in government bookkeeping records.
The primary aggregates of policy importance in the GFS are the overall deficit or surplus; financing from abroad, from the monetary authorities, and from deposit money banks; and aggregate revenue, grants, expenditure, and lending minus repayments. The GFS reflect the characteristic differences between the motivation and significance of government actions and those of market-oriented sectors by organizing these major aggregates differently from those in other sectors-grouping government lending with government expenditure, for example, rather than with government borrowing. Within these primary aggregates, the more detailed components also carry significance for the light they shed on the government's impact or dependence on particular groups and activities. Of limited policy significance in the framework of financial analysis within which the GFS operate are a number of aggregates of greater importance to other sectors and to the economy as a whole. These include concepts of physical output (such as the government's product or value added) as a component of gross domestic product (GOP); the concept of government consumption, as distinct from the delineation of current versus capital expenditure or of purchases of goods and services versus transfers; and the concept of change in the government's net financial position, a concept of little applicability to government units that take and give rather than purchase and sell.
The SNA public sector accounts, in contrast, focus primarily on government product and value added, government consumption, and changes in a government's financial position, as reflected in its net lending. Organization of these aggregates for government in the SNA public sector accounts is largely symmetrical with their organization for other sectors, so as to permit calculation for the entire economy as the consolidated sum of the aggregates for the sectors. To measure the physical output constituting product, and to parallel also
220 PUBLIC SECTOR ACCOUNTS
other measurements for other sectors with which they must be aggregated, the public sector accounts present the data for government operations not on the basis of payments and receipts but on an accrual basis, requiring various estimates and imputations. In addition, to facilitate use of the more readily available data on government transactions to measure the operations of transactors in other sectors, classification and timing of transactions in the public sector accounts are kept fully symmetrical with those for other sectors. The perception and timing of transactions from the government point of view (as reflected in the GFS, for example) may, however, be asymmetrical with that of the other transactors.
Given the continuing needs for both SNA measurement of government production, value added, income, consumption and capital formation, and for GFS measurement of government financial performance, it is unlikely that either statistical system can be entirely replaced by the other. Considerable saving of statistical resources and avoidance of users' confusion may be achieved, however, by closer integration of the two systems in aspects that do not face basic differences of objective and by the clarification of the relationships between the two systems' major concepts.
Most issues under consideration in the review of GFS and SNA measurements of government involve bringing both systems closer to evolving government practices. Other issues involve modification of either or both systems to bring them closer to each other without jeopardizing their basic objectives. These may be viewed as efforts at harmonization to the extent consistent with differing objectives and reconciliation to the extent feasible at a relatively aggregate level of detail.
A description of progress over the past decade in delineating the relationships between concepts in the two data systems is contained in Chapter 17 of this volume.
Changes to Facilitate Reconciliation
What principles should govern decisions to change the treatment of particular account items to provide additional or alternative groupings of existing categories in order to identify aggregates common to both the SNA and GFS?
The sources of difference between the two systems should be identified and related to the basic nature and objectives of the two systems, and possible flexibility should be considered in this context.
• Reconciliation of major items, facilitating cross-use of data with few and identified adjustments, should be attempted.
DISCUSSION 221
• Changes should not destroy or sacrifice items needed to measure other sectors or parts of either system; treatment should not be out of keeping with the system's basic principles.
• Alternative treatment could supplement, but should not replace, items needed for a system or for the building of a component of a system.
• When treatment in SNA is the result of an asymmetry in the nature of an item with respect to the government sector and the other transactor, a presentation of the item from the government standpoint for both sectors, or with different treatment and an explicit adjustment to reconcile the SNA sectoral accounts with each other, should be considered.
• Reroutings that facilitate major concepts should be favorably considered.
Identification of the major components of both GFS and SNA and of the relationships between them is the focus of Chapter 18 of this volume.
Small Conceptual Differences
What should be done about conceptual differences between the GFS and SNA that remain after conceptual reconciliation efforts, that are quantitatively tn"vial, and for which no data are available?
All data systems follow conventions on the treatment of items insignificant in magnitude and not measured by available data. A standard of reasonableness governs compilers' efforts to search out data or information permitting estimation of such items. Why, therefore, does this question arise in connection with the reconciliation or harmonization of the two data systems of SNA and GFS? Probably because in the detailed articulation of relationships between GFS and SNA tables and concepts a long list of minor, insignificant, and unmeasurable difference items emerge. This is to be expected when a general system designed to measure activities and concepts applicable to all sectors is contrasted with a particular system formulated to measure the characteristic activities of a single sector with different objectives, behavior patterns, and accounting standards. Items of significance in other sectors may have little if any bearing on government operations. For consistency in the measurement and aggregation of all sectors, however, they remain part of the concepts applied to government in the SNA.
The question of what to do with difference items between the uni-
222 PUBLIC SECTOR ACCOUNTS
versal, accrual-based, estimate-supplemented concepts of the SNA government accounts and the particular, cash-based, accountingnumber-restricted concepts of the GFS data is posed in several forms. First, does inclusion of such insignificant or unmeasurable difference items in the "bridge table" spelling out the relationship between the two data systems overemphasize differences and underemphasize basic similarities? Second, for practical purposes, would bridge tables omitting insignificant difference items provide derivation procedures more likely to encourage compilation of national accounts for government and cooperation between GFS and SNA compilers? Third, should presentation of data for SNA concepts derived from data for approximately similar, but not identical, GFS concepts require explicit qualifications that such data differ from the strict SNA standard? Clearly to be avoided is the publication of differing numbers for the same SNA concept-one based on data derived from GFS sources without adjustment for insignificant or unmeasurable differences, and the other based on GFS data but adjusted by estimates of such items. The confusion to users resulting from such practices would undermine users' confidence in the integrity of the compilation procedures. The importance of relatively simple reconciliation procedures between the two data systems may call for a revaluation in some cases of the degree of accuracy needed.
Data Links
What should be done about discrepancies that arise in the compilation of data for GFS and SNA and that are not a result of conceptual differences?
Frequently, discrepancies between GFS and SNA data are simply the result of the different compilation procedures followed for each, rather than a reflection of conceptual differences. It has been suggested that compilation of SNA and GFS data from the same sources would be preferable in preventing such discrepancies, avoiding unnecessary duplication of effort, and making explicit the subsequent adjustments required to meet the standards of each system.
This would appear to create unnecessary difficulties if there are two data sources-one on an accrual basis meeting SNA standards, and one on a cash basis meeting GFS standards. Neither standard is likely to be met completely by government sources. More frequently, other elements, unconnected with differences between the two data systems, may be encountered and may be adjusted for differently in the two compilation procedures, introducing additional, unnecessary discrepancies between their results.
DISCUSSION 223
Few countries are likely to have two complete sources of data on government operations. They are more likely to have two sources for particular parts of their operations, such as tax assessments and tax collections or payment orders and checks issued for purchases of goods and services. In these circumstances, evaluation of alternate data sources and determination of how they may best be reconciled for overall consistency would be necessary for both data systems and could be carried out uniformly with provision for explicit adjustments to meet the different standards of each system. This would facilitate a sequential compilation procedure, starting with the basic government accounts, adjusting them to GFS, and then making the additional adjustments necessary for SNA.
Procedures for the adjustment of GFS data for use in the SNA are illustrated in Chapter 19 of this volume.
II. Transactor Coverage
This section provides a discussion of coverage in the SNA and GFS of transactors at the borderline of general government, borderline transactors within general government, public sector transactors, as well as a discussion of statistical units for the government sector.
Borderline of General Government
Four classes of transactors are examined: nonfinancial enterprises, financial institutions, nonprofit institutions, and international organizations.
Nonfinancial Enterprises or Establishments
Within this category of transactor, departmental enterprises, ancillary enterprises, and community production are considered.
Departmental Enterprises and Dual Sectoring. Should departmental enterprises that sell to the public and have identifiable current costs be excluded from government and classified as quasi-corporations in the SNA and as nonfinancial enterprises in GFS, thus ending this aspect of the dual sectoring of government?
Production accounts for producers of government services differ from production accounts for enterprises in that the former have no
224 PUBLIC SECTOR ACCOUNTS
market price valuation of output, which is not sold, and instead value output by the sum of input costs and calculate no operating surplus. The two types of producers differ also in that enterprise sales proceeds are required to meet production costs, whereas government revenues (primarily taxes) approximate disposable government income available for whatever purposes governments choose. Similarly, government production costs are assignable to various government functions or purposes, whereas enterprise production costs, except to the extent that they exceed sales proceeds and are covered by subsidies, are not. To avoid the addition of government service production costs, equal to government services output, to government enterprise production costs, and to avoid the addition of enterprise sales proceeds to taxes, two choices are possible: classifying all government-owned or government-controlled enterprise activity with identifiable production costs in the enterprise sector, or leaving such activity in government but measuring its production activity in a separate production account and aggregating only the outcome of such activity-the operating surplus-with data for the producers of government services. The present SNA chooses the first alternative for government-owned or government-controlled enterprises that are incorporated or have large-scale sales to the public and the second alternative for unincorporated units with only small-scale sales to the public. Government sales to the public of industrial or commercial goods and services that have no separately identifiable costs remain in the production account for producers of government services. This sectorization is followed also in the GFS, which nets departmental enterprise sales to the public against their identifiable operating costs and aggregates with the producers of government services only the resulting cash operating surplus or deficit.
One reason for leaving in the government sector unincorporated enterprises with small-scale sales to the public may have been the difficulty in some instances of separating their income and outlay, and particularly their capital accounts, from those of the government. The proposal to classify such enterprises in the nonfinancial public enterprise sector, rather than in government, is associated with a desire to eliminate the "dual sectoring" in the production account for government. This would restrict the government sector production account to operations whose output is valued as the sum of their inputs, with no market price of output and no operating surplus derivable as the difference between their sales to the public and identifiable costs of inputs.
The effect of classification of departmental enterprises as nonfinancial public enterprises would appear to be as follows.
DISCUSSION 225
• Although GOP would be unaffected, departmental enterprises' production would be attributed to the enterprise sector rather than to government. This change would generally be small in magnitude, but it might be argued that, since departmental enterprises differ only by size and incorporation from nonfinancial public enterprises, their inclusion in enterprise production totals would be preferable to their grouping with nonmarket services provided to the public without a sales price. Classification by purpose (as in The Classification of Functions of Government, COFOG)1 of government outlays, for example, would more appropriately include only a government subsidy to cover a departmental enterprise that is operating a deficit rather than full departmental enterprise production costs.
• Classification of departmental enterprises with nonfinancial public enterprises should have little effect on government income and outlay accounts, which would continue to reflect the enterprises' operating surpluses or deficits financed by government. To the extent that interest or transfer transactions were carried out by departmental enterprises, they would be assigned to the enterprise, rather than to the government sector.
• Removal of departmental enterprises' capital accumulation account transactions from government, to the extent they are identifiable, would alter the totals for both government and enterprise sectors. A more unitary concept of capital formation would result because changes in enterprise stocks would not have to be added to the more limited concept of changes in government strategic stocks.
• Similarly, the effect of such removal on the government's capital finance account would separate any enterprise lending from the characteristically different lending undertaken by government for public policy purposes. Should such public policy lending-or any other clearly governmental activity-be undertaken by departmental enterprises, it could be attributed to government by considering it to have been carried out by the enterprise for government in an agency capacity. This would be the case with similar occurrences involving nonfinancial public enterprises or other institutions.
It must be noted also that the criterion of small-scale versus largescale sales to the public used to distinguish between nonfinancial public enterprises and departmental enterprises raises difficult problems in practice, leading those seeking to apply the standard to question its validity.
1 United Nations, The Classification of the Functions of Government, Studies in Methods, Series M, No. 70 (New York, 1980).
226 PUBLIC SECTOR ACCOUNTS
On balance, a decision on whether to classify departmental enterprises with the nonfinancial public enterprise sector rather than with government would appear to depend on whether the advantages of (1) separating market-valued output from input-valued output, changes in operating stocks from changes in strategic stocks, and commercial lending from lending for public policy purposes outweigh (2) the difficulties of separating out departmental enterprises' capital transactions from the capital transactions of government. Whichever choice is made, however, the elimination of dual sectoring in the government production account without removing departmental enterprises from government-that is, leaving departmental enterprises' gross receipts and payments to be aggregated with those of producers of government services-would exacerbate present difficulties and hinder the measurement of government activity.
Ancillary Enterprises. Should ancillary enterprises selling to other parts of government, at sales prices that cannot be taken to represent market prices, and own-account production of capital goods be treated as part of government-with their output valued, like that of the rest of government, as the sum of their inputs rather than at their sales price-thus ending this aspect of the dual sectoring of government?
Ancillary enterprises may be defined as government-owned or government-controlled (or both) industries that are primarily engaged in the provision of goods and services to other parts of government and that, because they are unincorporated and do not have large-scale sales to the public, are classified in the government sector. Under present dual sectoring practices in the government production account, the output of ancillary enterprises is valued at the prices such enterprises charge other parts of government for the goods and services the enterprises provide them, giving rise to an operating surplus or deficit as the difference from the cost of the enterprises' inputs. In practice, however, an ancillary enterprise's charge to other parts of government may differ substantially from market prices, for political or internal administrative reasons. This would undervalue or overvalue GOP, government gross output, government consumption, and capital formation under present SNA practices and misstate the enterprise's operating surplus or deficit.2 To eliminate dependence on such unrealistic internal pricing, such
2 This issue does not arise in GFS, which eliminates in consolidation transactions between departmental enterprises and producers of government services and calculates only the cash operating surplus or deficit of departmental enterprises' sales to the public.
DISCUSSION 227
ancillary enterprises could be assimilated to producers of government services and have their output valued at the cost of their inputs. Own-account capital formation within government also lacks a marketlike output sales price, since the capital formation may be carried out for the unit itself or may be carried out for another part of government at an unrealistic, administratively determined charge. More accurate valuation of such own-account capital formation could be based on the cost of inputs. This would appear to be preferable also to attempting estimates of own-account government capital formation on the basis of similar capital formation by enterprises.
Regardless of whether departmental enterprise production is measured at its market sale price in a separate (dual sectoring) production account within government or in the nonfinancial public enterprise production account outside government, measurement of ancillary enterprises' output sold to other parts of government at unrealistic prices and of own-account capital formation by government could more appropriately be carried out within the production account of producers of government services, with output valued at the cost of inputs. Although this may result in including within the production account for producers of government services some activities classified as industries by International Standard Industrial Classification (ISiq,3 the preferable criterion for inclusion in the different production accounts would appear to be not industrial character but whether output should be valued by market sale or by the cost of inputs. This need not detract, however, from the breakdown of production account information for the government sector into separate activities corresponding to !SIC categories.
Community Production of Services and Capital Goods. Should the seroices and capital goods resulting from informal community production be attributed to government or to the household sector?
Some services and capital goods resulting from informal community production are closer in character or organization to households, some to private nonprofit institutions, and some to gov:ernment. In GFS, for lack of payment transactions, there would be no registration of the services or capital goods produced. In SNA, estimating procedures for valuation of output, inputs, and consumption or capital formation would be necessary regardless of the sector to which the activity is attributed.
Consideration may be given to the character of the activity by
3 United Nations, International Standard Industrial Classification of All Economic Activities, Statistical Papers, Series M, No.4, Rev. 3 (New York, 1986).
228 PUBLIC SECTOR ACCOUNTS
which the services or capital goods are produced, to the character of the service or capital goods themselves, to control of their distribution or use, to whether depreciation of the capital goods will have to be included in future accounts, and to whether maintenance may have to come from households, nonprofit institutions, or government.
Discussion at the SNA Expert Group Meeting on the Household Sector (Florence, August 31-September 4, 1987) concluded that capital assets constructed on a communal basis should be attributed to the sector responsible for their upkeep; that sector may be different from the sector that produced the assets.
Financial Institutions
The treatment of flows originating in monetary authorities' functions, of government employees' pension schemes, and of government employees' welfare schemes is discussed in this subsection.
Monetary Authority Functions and Acceptance of Deposit Liabilities. Should flows to or from government-from the performance of monetary authorities' functions or the acceptance of demand, time, or savings deposit liabilities-be rerouted and shown as government inflows from or outflows to the financial institutions sector?
Some reroutings of transaction flows are carried out in the SNA for analytical purposes. Thus, employer contributions to pension schemes or social security schemes are rerouted through households and give rise to a corresponding increase in the compensation of employees that constitutes household income. For purposes of money and banking statistics, similarly, it is useful to gather all transaction flows constituting the acceptance of money or near-money liabilities or the management of the money supply and international reserves-including transactions with the Fund-and attribute them to the financial institutions sector and its appropriate parts. This permits money and banking statistics to keep track of the liquidity in the economy as indicated by the monetary and near-monetary liabilities of the banks. Were such activities to be attributed to the government sector directly, the coverage of money and banking statistics would have to expand to include a part of government. The task of measuring financial intermediation, liquidity, and bank credit would be possible but more difficult.
To facilitate simplification of the task of money and banking statistics, government sector statistics reroute, through the financial institutions sector, all such banking function flows reaching government. Deposit flows reaching government, therefore, are classified as flows
DISCUSSION 229
reaching government through the financial institutions sector. So long as money and banking statistics continue to group in the financial institutions sector the provision of liquidity to the economy and management of the money supply and international reserves, the reflection of this rerouting in the statistics for government is necessary for the sake of consistency. Depending on practices to be followed with other SNA reroutings, it may be found appropriate to identify such reroutings explicitly for the use of analysts who prefer the identification of all transaction flows by actual transactors. An alternative to such rerouting would be to redesign money and banking statistics to cover the banking activities of government.
Government Employees' Pension Schemes. Should government employee pension funds, invested with the employer government or elsewhere, form a part of government or of the insurance and pension fund subsector of the financial institutions sector?
For pension funds invested entirely with the employer, the present SNA provides an exception to the classification of pension funds in the financial institutions sector. Because the conduct of such pension funds is thought to follow more closely the conduct of the employer than of households or of an independent pension fund subsector, pension funds invested entirely with the employer are classified as part of the employers' sector rather than in the pension fund and insurance subsector of the financial institutions subsector. This classification is followed also by the GFS. In the case of government employee pension funds, however, the distinction drawn on the basis of investment with the employer is not so clear. Pension funds are frequently invested in government securities for reasons of prudence, whether by legal requirement or by choice, so that investment of government employee pension funds with the employer-the government-does not indicate the degree of employer control that investment with a nongovernment employer does. Classification of such government employee pension funds with the majority of other pension funds, in the financial institutions sector, may therefore be preferable. This would permit the type of analysis of government employee pension funds that can best be provided in the context of pension funds and insurance companies, including the calculation of actuarial liabilities and reserves. It would remove from government accounts several noncharacteristic actual and imputed flows, such as the imputation of household equity in pension fund reserves, and the distribution and reinvestment of interest earnings on such equity. Analysis of pension funds would thus be carried out entirely in the context of pension funds, independently of whether reserves are
230 PUBLIC SECTOR ACCOUNTS
invested entirely or partially with the securities of the employer government.
With the classification of government employee pension funds in the financial institutions sector, the separate identification of contributions to such funds would be retained. All imputations of service charges, net equity of households with pension funds, and interest on this household equity would be omitted from the government accounts and registered instead in the accounts of the financial institutions sector.
Government Employees' Welfare Schemes. Should government employee welfare funds and unfunded welfare and pension schemes for government employees be considered social security schemes, with their contributions and benefits classified as social security contributions and benefits?
For the government sector, the SNA groups together government employee welfare schemes and unfunded government employee pension schemes and distinguishes them from pension funds, social security schemes, and social assistance grants. In practice, however, the distinction with social security schemes may be rather difficult to make. Although schemes provided by employers and those imposed by government .are clearly different in the rest of the economy, they may not be readily distinguishable from each other when the government is the employer. Government employees are often not covered by the social security schemes that apply to other sectors, so that, as an examination of country practice reveals, many countries include as social security schemes the pension and welfare schemes that are exclusively for government or public sector employees.
Other countries that do cover government employees in their general social security schemes have supplementary pension and welfare schemes for government employees that may or may not be classified as social security schemes, depending on the interpretation of the SNA by the national accountant. As a result, SNA distinctions between different kinds of contributions and benefit payments are generally not applied in the prescribed detail in most countries, either because all schemes envisaged in the SNA are not relevant in all countries or because the distinctions are difficult to make. Many countries, in fact, do not distinguish between social assistance grants and unfunded employee pension and welfare benefits and make no imputations of contributions to unfunded employee welfare or pension schemes.
To simplify the prescribed breakdown in contributions and benefits, therefore, it has been suggested that in the SNA for the government sector the distinction be eliminated between social security
DISCUSSION 231
schemes and government employees' welfare funds and unfunded welfare and pension schemes. This would bring no change in the total of employee and employer contributions and of benefits registered in the SNA for the government sector, but all such contributions and benefits would be shown as social security contributions and social security benefits, respectively.
The imputation of a service charge component of contributions would not continue, since no service charge is calculated for social security contributions. The service charge component of pension and casualty insurance premiums does provide a measure of output and value added when applied outside government, but its elimination from contributions to the government would have no effect on government output and value added because these are calculated from the sum of inputs rather than sales. Elimination of the imputed service charge on contributions to government employee welfare funds and unfunded pension and welfare schemes would merely shift, to services produced for own use, the service charge amount now attributed to government sales in the production account for government.
Imputed employer contributions to unfunded pension and welfare schemes for government employees would continue to appear as part of the compensation of employees and, at the same time, as a government sector receipt from households in the income and outlay account.
As in the past, noncontributory pension or welfare benefits provided to government employees as members of the general population rather than as employees would continue to be classified as social assistance grants.
Nonprofit Institutions
Should government include nonprofit institutions that serve households or enterprises but that have majority financing and control by government? If so, should the criteria of control and finance be maintained, or should other criteria be applied?
At present, the SNA includes in the government sector all nonprofit institutions that are mainly financed and controlled by public authorities. Private nonprofit institutions that serve enterprises but that are not wholly or mainly financed and controlled by the public authorities are included in enterprises. In the present SNA, however, private nonprofit institutions serving households form a separate sector on their own that is of an equivalent status with government, enterprises, and household sectors.
The SNA Expert Group Meeting on the Household Sector in Sep-
232 PUBLIC SECTOR ACCOUNTS
tember 1987 dealt with nonprofit institutions as one group, including those to be allocated to the enterprise sector, those to be included in the household sector, and those to be incorporated with the government sector. The distinction between nonprofit institutions included in the government sector and the rest was left open for recommendations by the Public Sector Expert Group Meeting. With regard to the remaining nonprofit institutions, the Household Sector Expert Group recommended that the allocation of these to the household and enterprise sectors should be based on whom the institutions serve, not on who pays for most of their outlays. It decided, furthermore, that nonprofit institutions serving households should be included as a subsector of the household sector, and that this subsector should include all such institutions serving households regardless of the number of their employees. Also included as nonprofit institutions should be religious missions, private aid agencies, and community activities including those production activities carried out on a communal basis that result in capital assets such as roads, schools, and the like.
The present SNA criterion for inclusion of nonprofit institutions in government requires both majority government financing and government control, leaving institutions that are not controlled by government outside the government sector, regardless of their degree of dependence on government funds. This has had advantages in leaving outside government institutions that maintain operating independence and for which operating statistics would, as a consequence, be less likely to be available through government accounts. Such institutions may be quite sensitive about their separate existence outside government, moreover, and may feel with some justification that their ability to raise funds from private sources could be jeopardized by their classification as part of government.
Adoption of a criterion of majority government finance or control as a condition for including nonprofit institutions in government would also bring in institutions controlled but not majority-financed by government. Institutions that are controlled by government but are not majority-financed by government are likely to form a part of government in any case, perhaps collecting fees or compulsory levies for the greater part of their receipts. Their classification would not be affected by adopting a criterion of majority government financing or control to determine inclusion of nonprofit institutions in government.
International Organizations
Issues pertaining to the treatment of two types of international organization-supranational authorities and other international organizations-are examined in this subsection.
DISCUSSION 233
Supranational Authorities. Should general government include, as a nonresident subsector, the nonheadquarters operations of supranational authorities within the country; that is, international organizations empowered to levy taxes within the country?
Supranational authorities are defined in the GFS as those international organizations that are empowered to levy taxes within countries. Seemingly the only case that exists at the moment is the institutions of the European Community (EC).
The SNA does not discuss supranational authorities but stipulates that "international bodies, such as political, administrative, economic, social or financial institutions, in which members are governments, are not considered residents of the country in which they are located or operate" (SNA, paragraph 5.113). The European System of Integrated Economic Accounts (ESA)4 follows the same line but specifies further by showing the EC institutions separately as a subsector of the rest of the world and in specifying that taxes collected for (or subsidies paid by) Community institutions are to be recorded as direct transactions between producer units in the country and the Community institutions, without passing through the accounts of the national general government sector. Hence, for instance, total taxes paid by the resident producers are the sum of those destined for the national government and those for the Community institutions.
In the GFS the "general government" is expanded to encompass both the national general government (the SNA sector) and a nonresident subsector for the operations of supranational authorities (excluding their headquarters). This is not done, however, for other international organizations. In the GFS as in the ESA, taxes collected for Community institutions (and subsidies paid by them) are recorded as direct transactions between the producer units and the supranational authorities.
The advantage of the GFS treatment is to bring together all taxes paid in a country into one "government" receiving sector instead of two. The disadvantages from the SNA point of view are as follows.
• Nonheadquarters operations of supranational authorities, at least in the EC case, are merely an amalgam of income and outlay account transactions, not a real institutional unit at all.
• The enlarged government sector is both resident and nonresident at the same time.
• It would seem that the normal consolidation rules applied to the
4 EUROSTAT, European System of Integrated Economic Accounts-ESA, 2d ed. (Luxembourg, 1979).
234 PUBLIC SECTOR ACCOUNTS
enlarged sector would be inconsistent with both the balance of payments and the gross national product (GNP).
A rationale for the GFS treatment of supranational authorities is delineated in the following paragraphs.
Over the years since adoption of the SNA in 1968 there has been a growth of governmental activities on a supranational level not fully anticipated by the national framework of the current system. Some of these issues have been approached in the Fund's Manual on Government Finance Statistics (GFSM) and GFS Yearbook, and consideration may be given to whether review of the SNA may call for a similar approach.
The view adopted in the GFSM and GFS Yearbook is that, just because the countries of the EC have assigned several of their governmental functions to authorities that encompass several countries, there is no cause for a reduction in the measurement of overall governmental activities in these countries, as regards both taxes and governmental expenditures. This requires statistical recognition that, in these countries, government is no longer solely national and that there are transactions being carried out within the country by governmental authorities that are nonresident. The GFSM and GFS Yearbook recognize this fact by adding to the traditional resident, or national, government the activities within the country of the nonresident, supranational government authorities to reach the overall concept of general government for the country. This causes no contradiction with balance of payments concepts so long as it is recognized that, although national government is resident, general government need not be entirely resident.
The delineation of the transactions of supranational authorities from those of national government is accomplished in the GFS by defining supranational authorities as a separate level, or subsector, of ge11eral government and by using the same principles of attribution of receipts and payments-for example, between collecting and beneficiary governments-as are employed for other levels of government. Thus, particular taxes set by supranational authorities but collected for them by national governments are attributed directly to the supranational authorities and appear in neither the receipts nor expenditures of the national governments. Payments levied on the national governments by the supranational authorities without specifications as to how the funds are to be raised within each member country are registered as receipts of the supranational authorities from each national government. Both the raising of money domestically and its payment to the supranational authorities are registered in the data for
DISCUSSION 235
the national government. Similarly, expenditures paid by supranational authorities to individual and enterprise residents of a member country are registered as transactions of the supranational authorities with these residents and not as transactions with the national government of the country. Data for both national governments and supranational authorities are shown separately for ten EC countries in the GFS Yearbook. Data are also shown for general government, consolidating the data for all levels of national government and the supranational authorities and eliminating any transactions between them.
To reflect the nature of its activities and relationships, data for the supranational authorities subsector of general government exclude headquarters or central office operations-such as those in Brussels and Luxembourg and the several nuclear research centers-and are restricted to operations within the country, with all transactions abroad viewed as proceeding through headquarters. Transactions of supranational authorities with their headquarters are not viewed as giving rise to claims or liabilities but are shown as transfers that serve as balancing items, averting the calculation of any overall deficit or surplus for the supranational authorities subsector of general government that would be parallel to the deficit or surplus concept of other levels of government. All transactions of supranational authorities with nonmember countries are classified as transactions of the supranational authorities' headquarters, and no supranational authorities subsector of general government is considered to exist in nonmember countries because no governmental functions have been taken on by supranational authorities there.
Other International Organizations. Should the operations of all international organizations excluded as nonresident from all countries' national accounts be aggregated as an additional unit to complete the universe of national accounts?
Participants in the Expert Group Meeting on External Sector Transactions concluded that, for completeness and symmetry of national accounts, an additional unit embracing international organizations that are classified as nonresident everywhere they operate should be defined and measured through the compilation and consolidation of data on their activities. Such international organizations were defined to include organizations that meet three criteria: (1) authority derived directly from the authority of the organization's members, which may be independent states or other international organizations; (2) sovereign status (that is, the laws and regulations of the country or countries in which the international organization is located do not apply to
236 PUBLIC SECTOR ACCOUNTS
it); and (3) production of services that are primarily nonmarket services.
To facilitate the work of national compilers and international organizations working in the field, the expert group recommended that a list of such international organizations be drawn up. Accordingly, the Fund now collects balance of payments data from international organizations, consolidates them, and uses them to round out global totals; the results are presented in the Balance of Payments Statistics Yearbook (BOP Yearbook).
Such aggregate data for international organizations would not provide data on their activities in individual countries. This would form a part of national balance of payments data on transactions with nonresident official entities, which include both international organizations and public sector entities of other individual countries.
International organizations covered by the aggregate data would cover both organizations governmental in nature and those performing functions of financial intermediation. A strict parallelism with the distinction of government versus financial institution used in national sectorization, and any thought of aggregate governmental activity at both the national and international level, would require the preservation of subcategories for groupings of governmental and financial institutions within the overall aggregates for international organizations.
Borderline Within General Government
This subsection considers treatment of various government levels and of social security funds.
Central, State, Local, and Other Government Levels
Should state or provincial governments and local governments be shown as separate subsectors of general government when they operate as levels of government separate from central government and from each other?
Although the 1968 SNA distinguishes only between central government and local government, the significance of separate state or regional governments within the noncentral government group has led the Fund's GFS Yearbook, and more recently the revised UN-SNA questionnaire, to distinguish a separate intermediate level of government (where it exists) between central and local governments. Data for state, provincial, or regional governments are published for some
DISCUSSION 237
22 countries in the GFS Yearbook. State, provincial, or regional governments are defined in the GFSM as governmental units exercising a competence independently of central government in a part of a country's territory that encompasses a number of smaller localities-that is, that occupies an intermediate position between the central government and any independent local governments that may exist. Governments are considered to have an independent competence if they have the power to raise a substantial portion of their revenue from sources they control and if their officers are independent of external administrative control in the actual operation of the units' activities.
For some purposes, such as the usual definition of the money supply to exclude only holdings of the central government, state governments may be grouped with local governments. For other purposes, perhaps where closely coordinated central fiscal policy extends effectively through the state government level, state governments may be grouped with the central government. In other instances state governments may most fruitfully be measured alone, permitting analysis of the separate pattern of revenues and expenditures they may represent.
Although separate state or provincial governments exist in a minority of countries, they are not restricted to federal states and have been added to a number of countries in recent years to meet political conditions of regional or cultural identity. Distinguishing between state and local governments may be difficult where there are several layers of local government, such as counties and towns. Separation of all distinctive categories of government units may be warranted for analytical purposes, but identification of state or provincial governments will usually depend on their regional character and their exercise of jurisdiction over lower units of government. The benefits of separating state from local government data, where state governments exist, are most clearly evident in clarifying relations between levels of government and financial flows between them. The role of a separate level of regional government in such flows may be particularly significant, justifying separate measurement.
Social Security Funds
Should social security funds be shown as a separately identified portion (or subsubsector) of each level or subsector of government at which they operate or as a subsector separate from other levels or subsectors of government?
The SNA classifies social security funds as a separate subsector of government, whereas the GFS shows their operations separately but
238 PUBLIC SECTOR ACCOUNTS
incorporates them as a part (subsubsector) of the level of government at which they operate. This difference reflects differences in the organization of social security, both between countries and with the passage of time, and different considerations of policy and analysis.
In countries with older social security systems, early employeroperated arrangements, mutual benefit insurance, or other mechanisms came under laws governing their operations beginning in the nineteenth century. "Finally, to consolidate earlier piecemeal efforts, a particular program was codified for the first time for an industry or for the country as a whole, almost always on a compulsory basis. " 5
As separate decision-making centers managing their own finances, social security funds required separate analysis both to portray their impact on the economy and to report to participants on the stewardship of their funds.
Over the past two decades, however, broadening social concerns have extended government budgetary operations into areas previously served exclusively by social security funds. The separateness of the functions, finances, and decision-making powers of social security funds has been substantially diminished. In practice, for example, unemployment benefits have been integrated with employment services and means-tested welfare benefits; old-age benefits have been tied to universal or means-tested pension plans or awarded early to ease unemployment in recessions or in particular industries; family allowances have been adjusted to replace tax credits or exemptions; and sickness plans have been coordinated with government hospitals, clinics, or health services. (For a further discussion of these issues, see Chapter 20 in this volume.)
The financial independence of social security funds was diminished by the indexing of benefits in the face of unemployment-caused reduction of contributions, the maturing of many systems, demographic changes, and the broadening of many benefits without corresponding increases in contributipns. Increased portions of social security costs were met out of general budgetary revenues. The independent decision-making powers of social security funds diminished as central decisions were taken to integrate social security changes with other countercyclical, social, or political moves and as the financial base for independence eroded. Although the functional, financial, and decision-making independence of social security funds declined, however, recognition of their separate existence remained
5 United States, U.S. Department of Health and Human Services, Social Security Programs Throughout the World-1983, Research Report 59 (Washington: Government Printing Office, 1984), p. viii.
DISCUSSION 239
important to the confidence of their contributors in many countries and to evaluation of their financial soundness.
Against this background, although separate identification of the operations of social security funds has continued to have value, separate measurement of central government operations excluding social security funds has become increasingly inadequate. Social security contributions comprise 44 percent of combined central government budgetary and social security fund revenue in France, 55 percent in Germany, and 40 percent in the Netherlands. The impact of government on the economy and the potential weight of central countercyclical fiscal policy is not adequately measured by data for central government excluding social security funds. Separate presentations for social security funds or for central government excluding social security funds would fail also to give a complete picture of government expenditures for various functions, since some activities are carried out in combination by social security funds, by social security schemes that do not constitute funds, and by other government programs.
To meet the needs for both separate identification of social security fund operations and combined data for central government operations including social security funds, an appropriate characterization or status for social security funds is necessary, whatever words may be used. In practice, two issues need to be resolved. First is the classification of any state or local level social security funds, which are now classified as part of the social security fund sector by the SNA and as part of the state or local level of government by the GFS. Second is the working out of appropriate consolidation procedures for presentation of social security fund operations in a manner portraying both their own operations and their relations with budgetary central government. This would involve, more specifically, whether budgetary government transfers to social security funds or lending by social security funds to budgetary central government would be eliminated in showing a consolidated deficit or surplus for social security funds, with memorandum items for eliminated amounts, or would not be eliminated in showing an unconsolidated deficit or surplus for social security funds. Although alternative consolidated and unconsolidated presentations are possible, it would be useful to avoid the confusion that would result from users encountering unexplained data in the two formats.
Public Sector Questions about treatment of various public sector transactors are
addressed in this subsection: definition of the ownership of public

240 PUBLIC SECTOR ACCOUNTS
enterprises, a public-private delineation in the national accounts and supporting tables, and issues relating to the nonfinancialnonmonetary public sector.
Definition of Ownership
The distinctions between majority ownership or control by government are discussed in the following paragraphs.
Ownership, Control, or Both. Should public enterprises be defined as enterprises majority-owned or controlled by government, or both?
Because of their special relationship with government, public enterprises may be subject to different influences and motivations than private enterprises, so that their analysis in separate public enterprise groupings may serve to delineate separate patterns of behavior. Whether the relationship influencing public enterprises' behavior is the result of government ownership, government control, either, both, or a combination of factors is difficult to determine in any one country at a given time and probably cannot be determined for all countries in general. The need for general guidelines to promote comparability in the identification of public enterprises among countries and over time, however, has stimulated efforts to formulate generally applicable criteria.
The present SNA (see Table 5.1, for example) proposes that both nonfinancial enterprises and financial institutions should be divided into public and private groupings on the basis of ownership "and/or" control. This criterion for distinguishing between public and private has been criticized for lack of clarity: does "and/or" mean "and" or "or," and how is "control" to be defined?
At a national accounts meeting in May 1984, the Secretariat of the Organization for Economic Cooperation and Development (OECD) proposed that the next SNA give four necessary conditions for classifying an enterprise as "public": it is owned by government, it is controlled by govemment, it is large, and it is intended that the enterprise will be retained in public ownership on a more or less permanent basis. The Secretariat also offered suggestions about how "control" and "large" should be defined.
All participants in the May 1984 meeting agreed with the ownership criterion and recommended that, in general, all enterprises with 50 percent or more public ownership should be counted as public. Some participants noted, however, that guidance should be given for deciding borderline cases. Sometimes public ownership, although majority ownership, is split among different levels of government so
DISCUSSION 241
that the largest single block of shares is actually held by private interests. There may also be difficulties in deciding on the ownership of subsidiaries of public enterprises.
As regards the control criterion, it was argued that this was usually superfluous because ownership almost always implies control. One participant noted, however, that governments could te.mporarily acquire enterprises in rescue situations without any intention of controlling their commercial operations, and in such cases it was not helpful to classify them as public enterprises. There was also support for the view that the degree of government control could be useful in borderline cases-for example, in deciding how to classify subsidiaries of public enterprises when the extent of public ownership could not be clearly established. Moreover, in cases where government ownership was less than 50 percent, the extent of government control-through the power to appoint board members or directors, for example-might justify classifying an enterprise as public. In summary, although most participants did not object to control being regarded as a condition for classifying an enterprise as public, they felt that it would usually be superfluous.
The OECD meeting in May 1984 had suggested a size criterion on the practical grounds that the elimination of small public enterprises-usually municipal undertakings-would simplify the work of compiling accounts for the public enterprise subsector and thus encourage more countries to publish such data. Most participants in the meeting rejected the size criterion, however, because no single rule for measuring enterprise size could possibly be appropriate for countries as diverse as the United States, Japan, Iceland, and Luxembourg. Some participants also noted that, with the increasing use of central enterprise registers, all enterprises regardless of size would necessarily be classified as either public or private, so that there would be no practical advantages in eliminating small enterprises.
The fourth proposed criterion-that there should be an intention to keep the enterprise in public ownership on a permanent basis-was criticized by one participant on the grounds that statistics should record current facts rather than future intentions. Policymakers may change their intentions, or a new set of policymakers with different intentions might come to power. It would be unreasonable to expect statisticians to change their public enterprise subsector to accommodate new statements of intent. The view was also expressed that, although "intended permanency" was not a necessary condition, it would often be an important practical consideration in deciding whether or not an enterprise is to be counted as public. Under that
242 PUBLIC SECTOR ACCOUNTS
condition, government ownership and government control would also normally go together. But if the public authorities have temporarily taken possession of an enterprise with the expressed intention of returning it to the private sector at the earliest opportunity, control would normally not be intended, and it would be best to leave the enterprise in the private sector.
In light of this discussion, varying experiences and conditions in different countries, and discussions in other forums, it will be necessary to decide whether the revised SNA should retain the present ownership "and/or" control criteria or adopt a new formulation designed to encompass enterprises with behavior patterns reflecting their special relationship to government.
Majority Ownership. Should government majority ownership be defined to include units in which majority ownership is held by a parent unit in which the government holds majority ownership?
Regarding the definition of ownership, the Handbook of National Accounting: Public Sector Accounts contains the following statement:6
The owner of an enterprise is the holder of the majority of the equity or common stock. This owner should also be regarded as the owner of subsidiaries in which the enterprise holds the majority of the equity or common stock, and iteratively if subsidiaries have subsidiaries.
Accounts and Tables for Nonfinancial Public Enterprises and Public Financial Institutions
Should the next SNA provide for a public-private breakdown in the accounts or supporting tables?
The present SNA does not provide for a public-private split in the main accounts of the system although it does recommend a publicprivate breakdown in two supporting tables: "Domestic Factor Incomes According to Kind of Activity and Institutional Sector of Origin" (Table 17) and "Capital Transactions of the Private and Public Institutions" (Table 19). The UN-OECD annual questionnaire calls for the public-private split for capital formation, saving, consumption of fixed capital, and capital stocks.
6 United Nations, Handbook of National Accounting: Public Sector Accounts, Studies in Methods, Series F, No. 50 (New York, 1988).
DISCUSSION 243
Nonfinancial or Nonmonetary Public Sector
Should the revised SNA include accounts for a public sector concept and should it recognize also alternative formulations of the public sector, such as the nonfinancial public sector (excluding public financial institutions) or the nonmonetary public sector (excluding monetary public financial institutions)?
To measure not only the performance of government functions but also the commercial and financial activities carried out under government majority ownership and/or control, the present SNA suggests that in countries where the public authorities play a particularly important role in the economy it may be useful to prepare accounts for the "Public Sector" consisting of general government plus nonfinancial public enterprises and public financial institutions. 7
Thus, although the disparate nature of some government and enterprise activities poses obstacles to their aggregation, aggregates may be calculated for other aspects of their operations, such as saving, capital formation, and financing, recommended by the GFS. Because financing transactions between units included in such aggregates are eliminated in consolidation, however, analytical needs may be better served by restricting the units covered for some purposes. Consequently, the GFSM recommends consolidation of only the government and the nonfinancial public enterprises, leaving out the central bank and other public financial institutions, so as not to eliminate in consolidation their lending to the government and to nonfinancial public enterprises. This partial coverage of the public sector is referred to as the nonfinancial public sector.
In some countries, government policy is carried out extensively through nonbank lending institutions that rely heavily on borrowing from the central bank and other government-owned and/or government-controlled monetary financial institutions (that is, from institutions whose liabilities primarily constitute money). In such instances, one measure of the financial impact of government operations and government-controlled operations has focused on the nonmonetary public sector, so as not to eliminate in consolidation the borrowing from the central bank and other public monetary institutions.
7 Chapter IX of the SNA (pp. 222-25 of the English version) suggests a set of accounts for production, income and outlay, and capital finance for this "Public Sector"; separate (nonconsolidated) production accounts are shown for general government and nonfinancial public enterprises and public financial institutions, but the other accounts are shown on both a consolidated and nonconsolidated basis.
244 PUBLIC SECTOR ACCOUNTS
Recognition of the validity of such limited-coverage variations of the public sector for particular analytical purposes could add a degree of flexibility to an SNA public sector concept.
Statistical Units in the Government Sector
Two questions will be raised-one concerning statistical units in COFOG, and the second concerning the definition of an institutional unit in the government sector.
Should the unit of classification for CO FOG be in principle a transactor unit rather than a transaction unit, applicable to all government expenses? If so, should this transactor unit be the same as the establishment-type unit that is recommended in the SNA for the classification of production accounts and capital formation by economic activity?
The present SNA (paragraphs 5.86-5.90) and COFOG (pages 2 and 3) opt in principle for the transaction as the unit of classification. However, only for practical reasons, both recommend using the establishment unit for the classification of production and capital formation expenses, leaving the transaction unit as the basis for the classification of other expenses such as transfers and loans.
It could be argued that an orientation toward transaction units would not be in line with the analytical aim of COFOG, which is to analyze by purpose the government policies carried out through government expenditure programs. The expenditures are coordinated through programs, offices, or bureaus that are the focal points for government budgeting. Each program integrates a series of alternative or supplementary expenditures that serve the same purpose or the same group of purposes. For instance, education can be promoted by running public schools (production of government services for own consumption), constructing school buildings (government gross fixed capital formation), "subsidizing" private schools (current transfers), or providing funds for private school construction (capital transfers, loans). Thus, it seems inconsistent with the aim of the functional analysis for the CO FOG scheme to determine the function or purpose of each expenditure separately. Instead, the function of an outlay should be determined with regard to the function of the program as a whole.
Taking the above point of view does not mean that one has to accept that all outlays of one unit serve one function only. In the same manner that establishments produce characteristic and secondary products, a government unit may serve a primary purpose and a
DISCUSSION 245
secondary one. If the secondary purpose is important and if separate records are available, there may be a need to try to split off those expenses that serve the secondary purpose and treat them together as the expenses of another CO FOG unit.
It is not only convenient but also logical to use the same unit for CO FOG as is used for the activity breakdown of government production and capital formation. The reason is that government production cannot be analytically separated from government consumption, since the major part of government services are assumed to be consumed by the same government unit. Furthermore, government consumption is only one of the expenditure types that should be looked at in a COFOG breakdown, in addition to other types of government expenses that are registered in the SNA income and outlay and capital accounts for the government sector. Production analysis in the government sector therefore cannot be separated from analysis of other government expenses. The connection of the two types of analysis is recognized in the SNA, which defines the establishment type unit in the government sector as a unit for which separate accounting records are available on production cost, sales, capital formation, and employment and which serve in principle one purpose (SNA, paragraphs 5.31-5.34).
Using the same unit of classification for classifying government "production expenses" by COFOG and !SIC categories does not imply that the two classifications are the same. For instance, if a ministry of education has one program for the construction of schools and another to run public schools, the two units should be allocated to different !SIC categories (construction and education) but included in one purpose category (education).
The modified orientation of the statistical unit in COFOG may also help to clarify some of the questions recently raised by the Statistical Office of the EC (EUROSTAT) with respect to revision of CO FOG. The distinction suggested between administrative expenses of. a specific nature (to be included in individual consumption) and those that are directed to more general purposes (to be included in collective consumption) is the same as distinguishing between expenses that serve the purpose of the transactor unit by which they are carried out and general administrative expenses that serve a different purpose and therefore should be integrated with another COFOG unit. Also, the question of classifying subsidies by CO FOG category may be clarified; subsidies should not be classified by the purpose of the transaction itself or on the basis of the industry that receives them, but by the function served by the unit as a whole that makes the subsidy payments.
246 PUBLIC SECTOR ACCOUNTS
The second question concerns the institutional unit in the government sector.
Is there a need to clarify the definition of the institutional unit of government as a unit of decisions, control, and management, or should additional criteria be included, such as availability of separate accounting records on income and outlay and capital transactions or existence of a separate accounting or budget office, or should the unit be further restricted to be one that is funded for the majority of its expenses by its own revenues (taxes)?
The present institutional unit of government in the SNA is very broad (SNA, paragraph 5.68). The central government is taken as one unit, and various state, provincial, and local governments and individual social security schemes are each considered as separate institutional units. The units selected are those that are units of decision, control, and management.
For more refined analysis of government operations (by government subsectors, regional analysis, and the like) there is a need to have a further breakdown of the government sector, particularly of central government. Thus, it may be argued that the above definitions and coverage of government institutional units may be inadequate.
Government subsectors can only be distinguished if complete institutional sector accounts can be drawn up for the units included in each subsector. These sector accounts should cover not only expenses but also revenues. With regard to revenues, the government differs from other sectors. Its revenue generation is generally much more centralized, for example, than that of enterprises. Central government revenues usually are all channeled through a central treasury, making it impossible to consider ministries, for instance, as separate subsectors of government. There are government agencies, however, that keep separate accounts, and those are not restricted to the local government sector but also include units that generally carry out central government programs. In Latin America there are many decentralized government agencies for education, health, and so on that are separately administered and keep separate accounts.
But separate accounts do not mean that such agencies are necessarily financially independent. In fact, many at the central government level and some operating at the regional levels are funded to a major extent by central government transfers of tax revenues.
Development of these criteria for an institutional unit in the government sector might help to clarify some of the other questions raised here and assist in arriving at correct answers. For example, should the monetary function of the government be split off only if
DISCUSSION 247
complete income and outlay and capital accounts can be set up for that function? Should social security funds, government pension funds, and welfare schemes be split off from other government units only if complete and separate accounts are available or are separately funded, or both?
III. Registration of Transactions
This section considers questions regarding registration of transactions in the national accounts: accrual versus cash accounting, consolidation practices, gross and net treatment, imputation and rerouting, and valuation in current versus constant prices.
Accrual Versus Cash Basis
How should accruals be defined for various government payments and receipts, and how should they be related to cash-basis statistics?
The SNA recommends that transactions should be recorded on an accrual basis, whereas the GFS adheres to cash-basis reporting. The accrual basis used in the SNA was defined before the IMF's GFSM defined the cash basis of related transactions in the GFS. Since then various queries have arisen with regard to the difference between the basis of recording the same transactions in the GFS and SNA. Within the SNA, questions have also arisen about what should be included in the capital finance accounts in the items ''other accounts receivable and payable" and "trade credit and advances," which reflect in the SNA the difference between the cash and accrual bases.
Particular attention should be paid to the difference between the recording in the SNA and GFS with regard to the following transactions.
• Transactions in goods and services. These are to be recorded in the SNA as of the date when the legal title to the goods changes, or when the services are rendered. The only exception is capital formation in building and construction, where the transaction is deemed to occur as the work is put in place. According to the accrual principle, payments for capital goods may be made either before or after the date when the transactions should be recorded. The GFS recording of transactions in goods and services takes place when payment is made.
• Compensation of employees. The SNA records it at the time it is earned, but the GFS records it at the time when payment is made.
248 PUBLIC SECTOR ACCOUNTS
• Indirect taxes and subsidies. These are to be recorded in the SNA at the time of the production or sales transactions to which they relate; in the GFS, they are recorded when the taxes are received or the subsidies are paid by the government. A difficulty in interpreting the SNA rule occurs when tax authorities allow a period after the obligation arises during which the tax can be paid without penalty. Many enterprises take advantage of this grace period and delay their actual payments to the government as long as possible, although recording the tax in their accounts and including it in their prices at the time the obligation arises.
• Property income, direct taxes, and other transfers to or from government. These transactions are to be recorded in the SNA when due for payment without penalty; in the GFS they are to be recorded at the time of government payment or receipt.
• Transactions in financial claims. These are to be recorded in the SNA when the ownership of assets is transferred or when liabilities are incurred or liquidated. In the GFS, they are recorded at the time of government payment or receipt.
In considering the recording of the above transactions, guidance is necessary particularly with regard to whether the difference between the GFS and SNA criteria of recording should result in actual differences between what is included in each transaction item in the GFS and SNA, and if so how they should be calculated or estimated and perhaps explicitly recorded.
Additional questions arise when noncash transactions are registered on an accrual basis in the SNA but are not recorded at all in the GFS except in particular instances as memorandum items. Examples would be transactions in kind, assumption of debt, or debt cancellations. Explicit identification of such transactions is necessary for reconciliation of SNA and GFS concepts and data.
Consolidation
Should different consolidation practices be applied for different purposes in the SNA?
Consolidation consists of eliminating transactions between transactors within a group in the process of combining or aggregating the group's mutual 'transactions. In the SNA, transactions within the group are eliminated only if they appear in the same account for both transactors. Transactions within the group that appear in the production account of one transactor but in the income and outlay account of
DISCUSSION 249
the other, such as indirect taxes, are not eliminated when operations of the two transactors are combined into a single set of accounts. This limit on consolidation is necessary because elimination of such intragroup transactions would alter input costs, value added, the output of government, and, hence, GOP. The same basic consolidation rules are followed in the central framework of the ESA.
In the GFS, however, and in the ESA supplementary accounting system for analyzing general government expenditure and receipts, the objective is not to measure government production, value added, or consumption but to measure the flow of revenues, expenditures, lending, and financing between the government sector and the rest of the economy. In the GFS and the ESA supplementary accounts for general government, therefore, all transactions between transactors within the group are eliminated in consolidation. This includes the additional elimination, beyond SNA rules, of intragroup payments and receipts for indirect taxes, subsidies, and government social contributions to itself that are paid as employer but are deemed to pass through the income and outlay account of households.
The United Nation's Handbook of National Accounting: Public Sector Accounts recognizes that such further consolidation may be warranted-for example, of payments and receipts of taxes and subsidies between government units-when the object of the analysis is not the measurement of gross output but the relationship between government and the rest of the economy. The particular flows to be measured as indicators of the relationship between government and the rest of the economy are not specified in the Handbook, however, and the extent of further consolidation warranted is therefore not detailed. Whether such key sectoral indicators of relations with the rest of the economy as tax revenues, total revenues, total expenditures, lending, and the overall deficit or surplus are to be included in the SNA or left to sectoral data systems, such as GFS and the ESA supplementary analysis, remains to be resolved. In either case, however, explicit identification of the additional flows-such as intragovernmental tax payments, social security contributions, and subsidies-eliminated in calculation of such key sectoral indicators, although not in calculation of the regular SNA accounts, would be useful as memorandum items to both the SNA accounts for government and the GFS and ESA supplementary analysis for general government.
Gross and Net Treatment Should flows previously shown net in the SNA be shown gross so as to increase infonnation on actual flows?
250 PUBLIC SECTOR ACCOUNTS
When flows in opposite directions are different in nature or significance, there are advantages in showing each separately in addition to any net entry for the two entries offset against each other. In the GFS, as a general rule, all nonfinancing flows are shown gross with the exception of corrective transactions, such as refunds, and departmental enterprises' sales to the public, which are offset against corresponding operating costs.
Aside from the netting that occurs in consolidation, eliminating an intragroup transaction from the accounts of both transactors rather than offsetting against each other two transactions of the same transactor, few SNA entries are not shown gross. Entries previously shown net only for statistical convenience, such as transfers given and received, have been converted to separate gross listings in SNA questionnaires of recent years. Several concepts defined as net by nature, however, continue to be shown in the SNA without a separate listing of their gross components. These include net acquisition of fixed capital assets, which does not show separate entries for the gross acquisition or gross disposition of fixed capital assets, and the net acquisition of land and intangible assets. It includes also government final consumption, which is only shown net of any disposition of previously purchased goods registered in consumption at the time of purchase because government is deemed to carry no inventories other than strategic stocks.
The addition of separate gross entries could be useful in such cases. Thus, without prejudice to the net character of the concept of fixed capital formation as the increase in the government's stock of fixed capital assets during the period (before or after allowance for consumption of fixed capital), separate information on both the acquisition and disposition of fixed capital assets could be significant in portraying the nature of government operations. Separate information on gross flows of fixed capital assets or land may have little significance among households or enterprises, since most sales and purchases may represent both sides of the same transactions taking place within the sector. This would not be the case with government, however, for which acquisitions and dispositions of fixed capital assets or land represent significantly different activities with the rest of the economy.
A third category of flows that are not shown gross in the SNA is the capital finance account. Borrowing and amortization are not registered separately but only as net borrowing. There may be several reasons for this practice. Data may come from balance sheets, in which a combination of flows results only in changing a single entry for the stock. With liabilities of a short-term character, one year or less
DISCUSSION 251
in maturity, the turnover can result in borrowing and amortization that exceed the total amount outstanding and have little independent significance. In other cases, the automatic rollover of obligations at maturity may cast doubt on the separate identity of borrowing and amortization.
Recognizing the validity of these reservations, there may still be merit in the separate identification of borrowing and amortization, excluding if feasible both short-term maturities and automatic rollovers. The burden of debt service-amortization plus interest payments-constitutes an important aspect of economic developments, both domestically and for the balance of payments. Projections of future amortization coming due and data for past amortization payments made reflect important elements of economic policy. Data on borrowing, moreover, indicate the extent to which the government finds it necessary to enter the capital market or approach potential lenders. Therefore, the addition of separate borrowing and amortization entries, perhaps for liabilities of more than a year, may be a useful means of providing such information.
Imputations and Reroutings
In this subsection questions with respect to four issues are addressed: separate identification of imputations and reroutings, depreciation of government fixed assets, rent on government-owned buildings, and debt cancellations as transfers.
Separate Identification
Separate identification of imputations and reroutings facilitates alternate presentations, but to what extent is it feasible?
For the SNA system as a whole, the consensus of previous expert group and working party meetings has been that, in general, the present imputations and reroutings should stay in the SNA, but that they should be identified separately in order to (1) facilitate the interpretation of the accounts, (2) permit a wider range of types of analysis, and (3) allow micro-macro links.
A document entitled "Imputations and Reroutings in SNA," discussed at the SNA Expert Group Meeting on the Household Sector in September 1987, attempted a complete catalogue of all imputations and reroutings in the SNA and the repercussions in the accounts and tables of attempting to identify them all separately. The expert group concluded that it would overburden data publications if all cases of
252 PUBLIC SECTOR ACCOUNTS
imputation or rerouting were shown, and therefore that only the most important should be identified. But the expert group also agreed that it is necessary to specify all the imputations and reroutings in the manuals for the benefit of both compilers and the most sophisticated users.
For the government sector, the SNA's imputations and reroutings are the origin of many of the differences between the SNA and the GFS and are therefore already itemized in Bridge Table II of the GFSM (pages 263-73). Apart from two general differences, one of coverage (net treatment of identifiable costs of departmental enterprises in the GFS) and one of recording (cash basis in the GFS),s the imputations or reroutings that give rise to differences are as follows:
• Employer contributions imputed with respect to unfunded employee pension and welfare benefits
• Employer contributions to social security schemes at other levels of government (not consolidated in the SNA because routed through households)
• Consumption of fixed capital
• Cancellation of bad debts (capital transfer in the SNA and balance of payments)
• Casualty insurance service charge separate from net premium • Maintenance and property tax components of rent received
• Imputed interest with respect to household equity in employee pension funds' reserves with government
• Stock valuation adjustment
• Payments in kind (only memorandum items in the GFS) -compensation of employees -social security and social assistance benefits -international cooperation (aid).
Few if any of these items would be considered important enough for the economy as a whole to warrant being identified separately in statistical publications; some are even trivial for the government sector. It would, however, be difficult to modify the SNA concepts to eliminate them.
8 The SNA, however, does not follow the GFS reroutings through the financial institutions sector of government transactions involving performance of monetary authorities' functions or the acceptance of demand, time, or savings deposit liabilities by units without the authority both to acquire financial assets and to incur liabilities in the capital market.
DISCUSSION 253
One approach, which has been applied in the EC for the past ten years, is to specify some of these-the first three listed above as well as the subitems needed for consolidation-within the SNA (ESA) general government questionnaire, so that they can be eliminated to produce a budgetary presentation similar in intention, but not identical, to GFS. The other items listed above are treated in the EC's budgetary presentation in the same way as in the national accounts. EUROSTAT then publishes data in two forms: in accordance with the SNA (ESA) in the national accounts, and in the budgetary presentation in "General Government Accounts and Statistics." It would be possible, although EUROSTAT does not currently do so, to add a table showing the transition from one form to the other.
Depreciation of Government Fixed Assets
For what government fixed assets should consumption of fixed capital be calculated?
Consumption of fixed capital (or depreciation) in the present SNA is calculated for all assets that have finite lives. These include buildings, plant, machinery, and vehicles but exclude roads, dams, and bridges, which are assumed to last forever with normal maintenance.
As experience suggests, however, no matter how well the roads, dams, and bridges may be maintained, they do become obsolete and so have finite useful lives. In these circumstances, the present SNA rule will give a false picture of the total value added generated in the government sector. This view was specifically stressed in the Economic and Social Commission for Asia and the Pacific (ESCAP) Seminar on the Review and Development of National Accounts (Bangkok, July 1-7, 1986), which recommended that capital consumption estimates should be calculated for public goods such as roads.
Rent on Government-Owned Buildings
Should rent on government-owned buildings be imputed?
The present SNA does not include imputations for rent on government-owned buildings or on buildings owned by nonprofit institutions. The ESCAP seminar noted this as a serious omission, which would result in underestimation of the contribution of the government sector to GOP. This is particularly so because the contribution of this sector to GOP is based on cost, which includes only intermediate consumption, depreciation, and compensation of
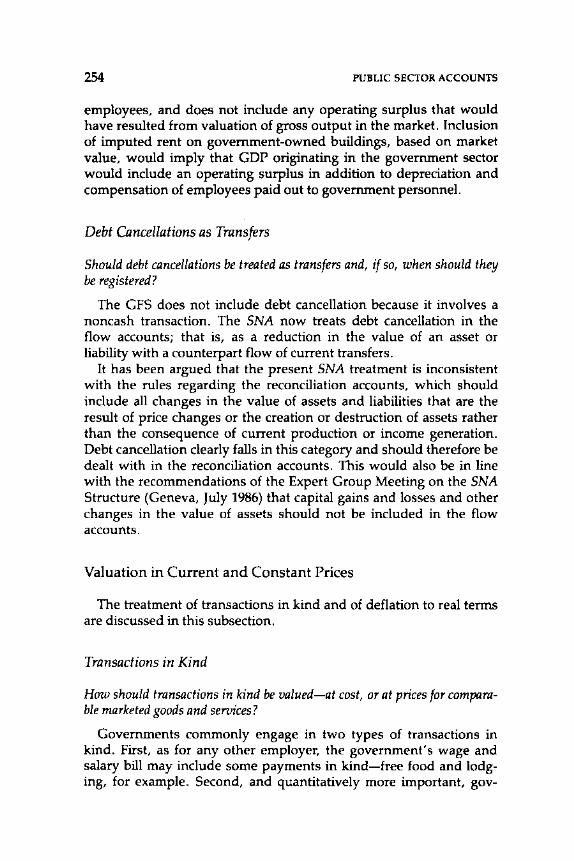
254 PUBLIC SECTOR ACCOUNTS
employees, and does not include any operating surplus that would have resulted from valuation of gross output in the market. Inclusion of imputed rent on government-owned buildings, based on market value, would imply that GOP originating in the government sector would include an operating surplus in addition to depreciation and compensation of employees paid out to government personnel.
Debt Cancellations as Transfers
Should debt cancellations be treated as transfers and, if so, when should they be registered?
The GFS does not include debt cancellation because it involves a noncash transaction. The SNA now treats debt cancellation in the flow accounts; that is, as a reduction in the value of an asset or liability with a counterpart flow of current transfers.
It has been argued that the present SNA treatment is inconsistent with the rules regarding the reconciliation accounts, which should include all changes in the value of assets and liabilities that are the result of price changes or the creation or destruction of assets rather than the consequence of current production or income generation. Debt cancellation dearly falls in this category and should therefore be dealt with in the reconciliation accounts. This would also be in line with the recommendations of the Expert Group Meeting on the SNA Structure (Geneva, July 1986) that capital gains and losses and other changes in the value of assets should not be included in the flow accounts.
Valuation in Current and Constant Prices
The treatment of transactions in kind and of deflation to real terms are discussed in this subsection.
Transactions in Kind
How should transactions in kind be valued-at cost, or at prices for comparable marketed goods and services?
Governments commonly engage in two types of transactions in kind. First, as for any other employer, the government's wage and salary bill may include some payments in kind-free food and lodging, for example. Second, and quantitatively more important, gov-
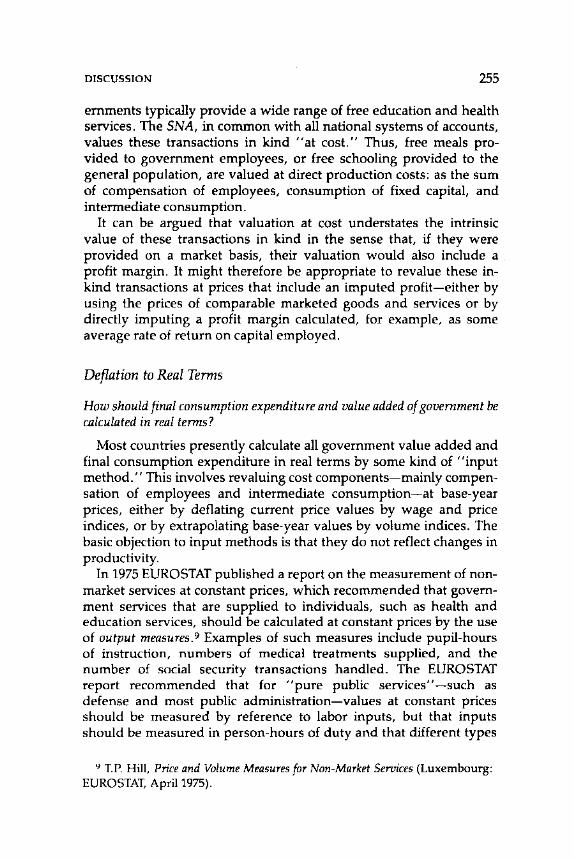
DISCUSSION 255
ernments typically provide a wide range of free education and health services. The SNA, in common with all national systems of accounts, values these transactions in kind "at cost." Thus, free meals provided to government employees, or free schooling provided to the general population, are valued at direct production costs: as the sum of compensation of employees, consumption of fixed capital, and intermediate consumption.
It can be argued that valuation at cost understates the intrinsic value of these transactions in kind in the sense that, if they were provided on a market basis, their valuation would also include a profit margin. It might therefore be appropriate to revalue these inkind transactions at prices that include an imputed profit-either by using the prices of comparable marketed goods and services or by directly imputing a profit margin calculated, for example, as some average rate of return on capital employed.
Deflation to Real Terms
How should final consumption expenditure and value added of government be calculated in real terms?
Most countries presently calculate all government value added and final consumption expenditure in real terms by some kind of "input method." This involves revaluing cost components-mainly compensation of employees and intermediate consumption-at base-year prices, either by deflating current price values by wage and price indices, or by extrapolating base-year values by volume indices. The basic objection to input methods is that they do not reflect changes in productivity.
In 1975 EUROSTAT published a report on the measurement of nonmarket services at constant prices, which recommended that government services that are supplied to individuals, such as health and education services, should be calculated at constant prices by the use of output measures. 9 Examples of such measures include pupil-hours of instruction, numbers of medical treatments supplied, and the number of social security transactions handled. The EUROSTAT report recommended that for "pure public services" -such as defense and most public administration-values at constant prices should be measured by reference to labor inputs, but that inputs should be measured in person-hours of duty and that different types
9 T.P. Hill, Price and Volume Measures for Non-Market Services (Luxembourg: EUROSTAT, April1975).
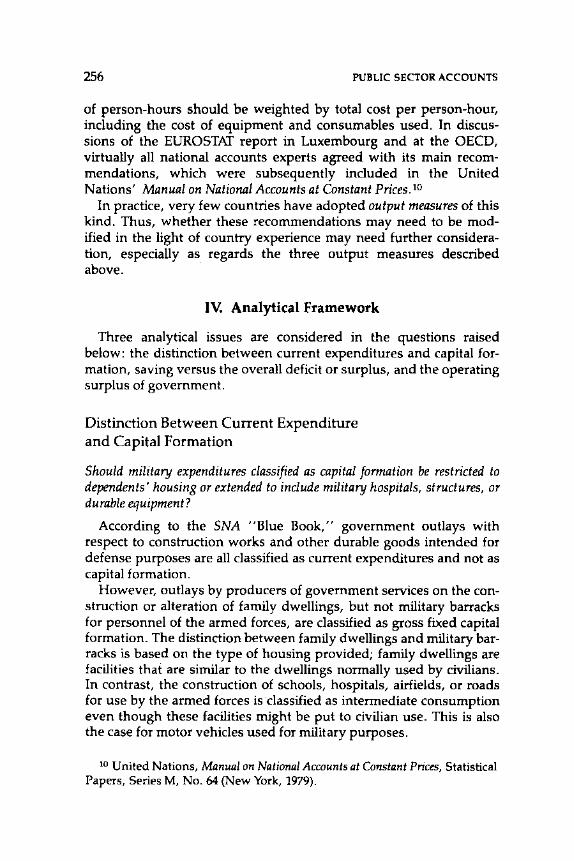
256 PUBLIC SECTOR ACCOUNTS
of person-hours should be weighted by total cost per person-hour, including the cost of equipment and consumables used. In discussions of the EUROSTAT report in Luxembourg and at the OECD, virtually all national accounts experts agreed with its main recommendations, which were subsequently included in the United Nations' Manual on National Accounts at Constant Prices.1o
In practice, very few countries have adopted output measures of this kind. Thus, whether these recommendations may need to be modified in the light of country experience may need further consideration, especially as regards the three output measures described above. ·
IV. Analytical Framework
Three analytical issues are considered in the questions raised below: the distinction between current expenditures and capital formation, saving versus the overall deficit or surplus, and the operating surplus of government.
Distinction Between Current Expenditure and Capital Formation
Should military expenditures classified as capital formation be restricted to dependents' housing or extended to include military hospitals, structures, or durable equipment?
According to the SNA "Blue Book," government outlays with respect to construction works and other durable goods intended for defense purposes are all classified as current expenditures and not as capital formation.
However, outlays by producers of government services on the construction or alteration of family dwellings, but not military barracks for personnel of the armed forces, are classified as gross fixed capital formation. The distinction between family dwellings and military barracks is based on the type of housing provided; family dwellings are facilities that are similar to the dwellings normally used by civilians. In contrast, the construction of schools, hospitals, airfields, or roads for use by the armed forces is classified as intermediate consumption even though these facilities might be put to civilian use. This is also the case for motor vehicles used for military purposes.
10 United Nations, Manual on National Accounts at Constant Prices, Statistical Papers, Series M, No. 64 (New York, 1979).
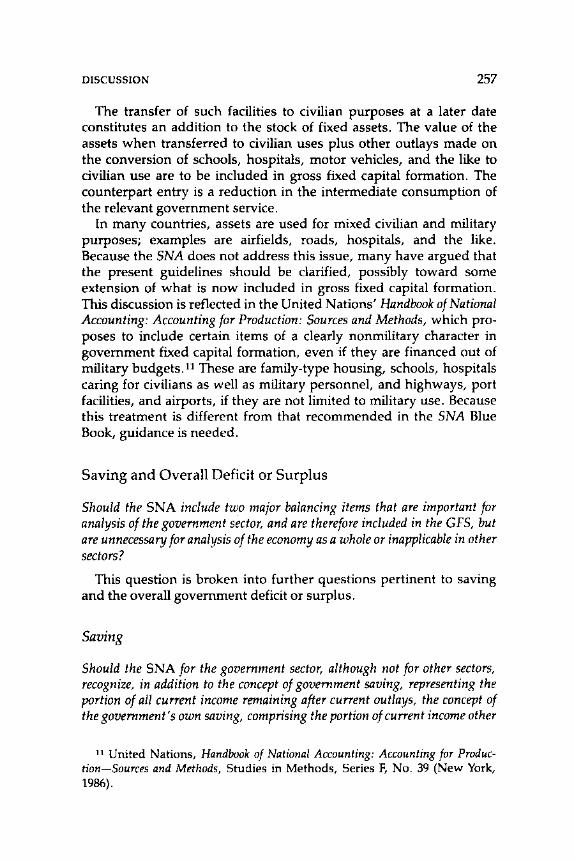
DISCUSSION 257
The transfer of such facilities to civilian purposes at a later date constitutes an addition to the stock of fixed assets. The value of the assets when transferred to civilian uses plus other outlays made on the conversion of schools, hospitals, motor vehicles, and the like to civilian use are to be included in gross fixed capital formation. The counterpart entry is a reduction in the intermediate consumption of the relevant government service.
In many countries, assets are used for mixed civilian and military purposes; examples are airfields, roads, hospitals, and the like. Because the SNA does not address this issue, many have argued that the present guidelines should be clarified, possibly toward some extension of what is now included in gross fixed capital formation. This discussion is reflected in the United Nations' Handbook of National Accounting: Accounting for Production: Sources and Methods, which proposes to include certain items of a clearly nonmilitary character in government fixed capital formation, even if they are financed out of military budgets. 11 These are family-type housing, schools, hospitals caring for civilians as well as military personnel, and highways, port facilities, and airports, if they are not limited to military use. Because this treatment is different from that recommended in the SNA Blue Book, guidance is needed.
Saving and Overall Deficit or Surplus
Should the SNA include two major balancing items that are important for analysis of the government sector, and are therefore included in the GFS, but are unnecessary for analysis of the economy as a whole or inapplicable in other sectors?
This question is broken into further questions pertinent to saving and the overall government deficit or surplus.
Saving
Should the SNA for the government sector, although not for other sectors, recognize, in addition to the concept of government saving, representing the portion of all current income remaining after current outlays, the concept of the government's own saving, comprising the portion of current income other
11 United Nations, Handbook of National Accounting: Accounting for Production-Sources and Methods, Studies in Methods, Series F, No. 39 (New York, 1986).
258 PUBLIC SECTOR ACCOUNTS
than grants from governments and international organizations remaining after current outlays?
The net saving of government, as for other sectors, is calculated as the residual in the income and outlay account. That is to say, government saving is calculated as the portion of current income remaining after current outlays, excluding capital and financial transactions from both income and outlay. As distinct from other sectors, however, in the case of government significance is found also in the measurement of saving excluding grants received from other governments or official international organizations. This concept is referred to in the GFSM as own saving. It is used to reflect the special position of grants (that is, official transfers) in government operations. Because such grants are sometimes provided as a form of budgetary support or to meet a deficit that would otherwise ensue, there is a need for measures of budgetary performance that exclude the effects of the grants themselves. It is for this reason that such official grants are identified in a separate category in the GFSM, permitting alternate calculations of both the overall deficit and of saving. Recognition of the alternate concept of government's own saving would facilitate such analysis in the SNA as well.
It must be recognized, however, that this concept is not applicable to other sectors. The distinction between the continuing, ordinary flow of tax and property income to government and the extraordinary, politically determined flow of official grants to government finds no easy parallel in the household or enterprise sectors. Nor is own saving a concept that preserves symmetry between grantreceiving and grant-making governments. While own saving is lower than saving for the receiving government, own saving is not higher than saving for the government making the grant, since current transfers paid, whether to governments or to others, would not be excluded in calculation of own saving. Grants between levels of government within a country would in any case be eliminated in consolidation of general government as a whole. It is in the measurement of the performance of individual governments, or of general government insofar as there are official grants from abroad, that the concept of own saving offers an additional measure useful in the analysis of government.
Overall Deficit or Surplus
Should the concept of government's overall deficit or surplus, met through the net incurrence of liabilities plus the net decrease in holdings of currency
DISCUSSION 259
and transferable deposits and in holdings of any other financial assets acquired for liquidity management purposes, be introduced into the SNA for the government sector, although not for other sectors?
The single measure of government performance most frequently cited in analysis and policy discussions is the overall deficit or surplus, which represents the result of current, capital, and lending operations and the consequent government financing requirement. Because it has no close parallel in other sectors, the overall deficit or surplus is not explicitly defined in the SNA and is not generally derived from SNA data on government. Whereas the SNA saving concept measures the government's current account deficit or surplus, the SNA net lending12 concept represents the balance drawn after government capital receipts and expenditures, in the capital accumulation account, but not after government lending, which is included in the SNA capital finance account.
Government lending is included in determination of the government's overall deficit or surplus, however, because the government, unlike other sectors, generally lends and acquires equity not for purposes of liquidity management or earning a return but to promote public policy objectives. In this respect, government lending is like government spending, in that whatever portion cannot be met out of government revenues, grants, or repayments of previous government lending affects the deficit or surplus and requires government borrowing or the drawing down of previously accumulated cash balances. From a policy and analytical point of view, therefore, government lending is not symmetrical with either government borrowing or the borrowing of those receiving government loans, since borrowing is undertaken for liquidity management purposes. Although this asymmetry requires care in the consolidation of two governments that have lent to or borrowed from each other, it is an essential element in the measurement of government operations in accordance with the nature of such operations. The overall government deficit or surplus concept makes it possible to measure the extent to which government spending and lending undertaken to carry out the government's policy objectives are covered by the government's tax and nontax revenues, grants, or repayments of previous government lending.
In general, the overall government deficit or surplus is met through
12 The SNA net lending concept, of course, represents the net result of government lending and repayment of previous lending, and government borrowing and amortization of previous government borrowing.
260 PUBLIC SECTOR ACCOUNTS
the net incurrence of government liabilities plus the net decrease in government holdings of currency and deposits. That is, a government deficit would normally be met from government borrowing less amortization and any drawdown of government balances. In general, this would permit calculation of the overall government deficit or surplus in the SNA as the balance drawn in the capital finance account before the net incurrence of liabilities and changes in holdings of currency and deposits. In some instances, however, governments hold assets other than currency and deposits for liquidity purposes. Sinking funds may acquire securities to match the maturities and currencies of their liabilities; social security funds may acquire financial assets for liquidity management rather than public policy purposes; and local governments may invest their temporary excess cash in the securities of higher levels of government or of corporations. Such government acquisition of financial assets, other than cash and deposits, for liquidity management purposes is usually minor in magnitude but can be quite significant. U.S. state and local government holdings of Federal government securities, for example, total about US$100 billion. Were such acquisitions for liquidity management purposes counted as a part of lending, they could seriously distort the meaning of the deficit or surplus. Accommodation of this distinction is achieved in the GFS in accordance with guidelines set out in the GFSM. Provision of a parallel distinction when required in the determination of a deficit or surplus concept in the SNA would maintain the meaning of the concept and avoid the occasional occurrence of disparate concepts for the deficit or surplus in the SNA and GFS presentations.
To accommodate instances in which government net acquisition of financial assets other than currency and transferable deposits occurs for liquidity management purposes, it would be necessary to insert an adjustment item above and below an overall deficit or surplus line for government in the SNA capital finance account. It might read "Less: financial assets (other than currency and transferable deposits) acquired for liquidity management purposes" above the overall deficit or surplus line, and "Financial assets (other than currency and transferable deposits) acquired for liquidity management purposes" below the line.
As with the consumption of fixed capital item appearing with opposite signs in the SNA production account and capital accumulation account, insertion of this adjustment item would permit calculation of the appropriate balance within the accounts. Because procedures are already carried out for the derivation of such numbers for GFS presentations in some 130 countries, determination of the
DISCUSSION 261
amounts involved for the SNA compilation should not pose significant difficulties.
The cash-based GFS concept of overall deficit or surplus has become a widely accepted standard for analysis of government operations. There may be both advantages and disadvantages, therefore, in adding an SNA-based concept of overall deficit or surplus, which may yield a result differing from the GFS-based concept and could instill ambiguity in the analysis of government operations.
Government Operating Surplus
Should the value of government output be calculated to include an element of interest payments in addition to other cost items of government inputs so as to avoid undervaluation of government output and approximate an operating surplus element in the value added of government services?
Gross output of government is defined in terms of costs, including wages, depreciation, and the purchase of goods and services, which is called intermediate consumption. Interest payments are not considered as costs in this sense because they reflect the price of borrowing money, and interest on the government debt is therefore excluded from the contribution to GOP of the government sector.
It has been suggested that at least part of the interest payment on government debt should be included as costs so as to avoid undervaluation of government output and thus approximate an operating surplus element in the value added of government services. This addition to the value added of the government sector is particularly important in order to avoid the distorting effects of the present SNA, which suggests that government output is to be valued at cost because of the lack of information on the market value of government services.
V. Classification
This section addresses possible revisions to various SNA classifications: taxes, property income, social assistance to households, and the functions of government.
Taxes
Indirect taxes, estate and gift taxes, social security contributions, and fees paid to the government are considered in the following paragraphs.
262 PUBLIC SECTOR ACCOUNTS
Indirect Taxes
Should indirect taxes be restricted to commodity taxes only, thus eliminating the need to distinguish between tax payments by business and others?
Commodity taxes are indirect taxes on commodities (that is, goods and services) or activities of an industry that are proportional to the quantity or the value of commodities produced or sold by the industry. These commodity taxes are included in indirect taxes, which in addition cover noncommodity taxes. The latter are payments by business of regulatory and administrative fees, such as court fees, business license fees, or airport taxes, that are treated as current transfers if paid by households. Noncommodity taxes also include real estate taxes if these are not levied as a replacement of income taxes.
The GFS includes a detailed breakdown of tax revenue but does not identify indirect taxes. It also does not distinguish between payments made by households and those made by business. As a result, GFS includes in some of its tax categories payments by households that are treated in the SNA as transfers (for example, motor vehicle tax) and includes in some of the nontax categories payments by business that are treated in the SNA as indirect taxes (for example, court fees).
In practice, countries do not usually make the distinction of tax payments by business or nonbusiness units when responding to the SNA. In most instances, they allocate the total tax payment of one category to either indirect taxes or current transfers, depending on the major component of the category in question. In addition, analysis of national accounts data shows that the difference between total indirect taxes and commodity taxes is very small.
Because of practical considerations and in order to facilitate the link with GFS, it has been suggested that indirect taxes be restricted to commodity taxes only. If this restriction of indirect taxes were accepted, the present noncommodity indirect taxes might be treated in the SNA as direct taxes or as other current transfers, depending on their nature.
Estate and Gift Taxes
Should estate and gift taxes, inheritance taxes, and nonrecurrent taxes on property be classified as taxes in the SNA and, if so, should they be classified as current?
The present SNA classifies estate and gift taxes and nonrecurrent
DISCUSSION 263
taxes on property not as taxes but as capital transfers to government. In contrast, the Fund's GFSM, the OECD's Revenue Statistics,n and general usage in fiscal analysis classify such taxes as taxes and classify all tax revenues as current revenue of government. Although the magnitude of such taxes is relatively small-constituting less than 1 percent of central government tax revenues in almost all countriesthis represents a significant conceptual difference between the SNA and GFS as regards tax revenues, current revenues, and saving.
Governments levy estate and gift taxes in order to raise revenue and, in some instances, to reduce inequality or help shift property to more productive uses. Although occasional to the taxpayer, such taxes are recurrent to the government, which receives a continuing flow of such payments and regards them, as it does other taxes, as current, regular, tax revenue. No connection is made in government policy between estate and gift tax receipts and government capital expenditure, and efforts are not made to earmark such receipts for particular purposes. There is no perception in government that estate and gift taxes are capital in nature or different from other tax receipts.
The perception in the household sector matches this government view of estate and gift taxes. They are viewed, as are other taxes, as a cost that must be met by a tax payment to government at specified events or occasions with no expectation that it will be used differently from other taxes. What distinguishes estate and gift taxes from other taxes is the irregular transmittal of wealth, at death or before, that occasions their payment, usually out of accumulated wealth rather than current income. When the cost of estate and gift taxes is met out of accumulated wealth rather than out of income, its payment constitutes dissaving-payment of a cost in an amount exceeding current income and resulting in either a decrease in assets or an increase in liabilities. A part of the value of a taxed estate, or of the proceeds of its sale, is viewed as unfortunately used up, lost, or "consumed" in payment of the tax to government. Payment of the tax represents a loss of previously accumulated household savings, and this is most appropriately represented as involuntary, unavoidable, household sector dissaving. If payment of estate and gift taxes brings no corresponding government capital formation, this dissaving of the household sector becomes the dissaving of the consolidated economy as a whole.
The present SNA, by classifying estate and gift taxes as capital transfers, shows the same dissaving for the consolidated economy as
13 Organization for Economic Cooperation and Development, Revenue Statistics of OECD Member Countries, 1965-1986 (Paris: OECD, 1987).

264 PUBLIC SECTOR ACCOUNTS
a whole but attributes this dissaving to government, rather than to the household sector. Given the prevailing government perception of estate and gift taxes as an indistinguishable part of total government tax revenues, with no particular tie to capital expenditures, an increase in government estate and gift tax receipts, under the present SNA calculation, is likely to lead to an increase in government dissaving. The policy implications of such a classification would tend to discourage government use of such taxes because of their negative impact on one measure of government operation-saving-although more careful analysis of the economic, social, and revenue effects of such taxes may point in the opposite direction. For household sector dissaving results not only from taxes on wealth, but also from any level of taxes that households do not meet out of current income and find it necessary to pay for by drawing down previously accumulated wealth or by borrowing.
Thus, the classification of estate and gift taxes as taxes, and their removal from consideration as capital transfers, would more closely approximate the concepts generally accepted for the measurement of government by those carrying out or analyzing government operations, as well as by the taxpayers involved.
Social Security Contributions
Should social security contributions be included in total taxes?
Social security contributions are levied on payrolls, or on a proxy for payroll in the case of the self-employed, and are earmarked for operation of a system of benefits to which the contributor, by virtue of the contribution, is admitted. Such contributions represent as much as 30 percent to 50 percent of total nationally collected government revenues in many developed countries, but less than 10 percent in most developing countries outside Europe and parts of Latin America. They are vital, therefore, to a complete portrayal of government finances.
Because they are associated with admission to a benefits system, though not vested and returned like provident fund or retirement fund contributions, social security contributions may be more readily acceptable than other tax payments. Their separate identification is often held to be important, moreover, to ensuring their dedication to social security purposes. Reflecting these characteristics, social security contributions are not classified as taxes in the SNA. Employer contributions are deemed to be routed through households as compensation of employees and simultaneously paid to government
DISCUSSION 265
by households, whereas employee contributions are collected from households.
In the OECD Committee on Fiscal Affairs (Working Party 2), after several years of deliberation on the classification of government revenue, and in regional and country discussions preparatory to publication of the GFSM, it was determined that the balance of advantages lay with classifying social security contributions as a separate category within the overall total of taxes. Given the definition of taxes as compulsory, unrequited, nonrepayable payments to government, social security contributions, other than the exceptional voluntary contributions provided for in some systems, are classified as taxes. To preserve the distinctiveness of social security contributions, they are separated from payroll taxes that are not devoted to social security. They are also distinguished from levies collected on a personalized income tax base, rather than on payroll, although they may be identified with social security, and from taxes on other bases, such as sales taxes, earmarked for social security purposes in some countries. In both the OECD Revenue Statistics beginning in 1973 and the Fund's GFS Yearbook beginning in 1977, social security contributions are separately identified as a category of taxes levied on a payroll base and devoted to social security purposes. The resulting portrayal of total taxes explicitly includes social security contributions but identifies them separately for the analytical purposes noted above. There would appear to be some advantage in maintaining such a separate identification of social security contributions within an overall total of taxes in the SNA.
Fees Paid to Government
Should fees paid to government, whether by business or others, be classified as payments for government services rather than as taxes, except for fees out of all proportion to the cost or distribution of government service provided to the payer?
At the border between taxes and sales lies the difficult-to-classify realm of administrative fees and charges. The SNA (paragraphs 7.65 and 7.66) classifies fees paid to government by households as direct taxes
... if they are not directly connected with the provision of non-regulatory service by the public authorities, and are primarily designed to raise general revenue .... However, if the service furnished is regulatory in character, the fees which households pay for the service . . . are classed as compulsory fees since they are obligatory and unavoidable in the only
266 PUBLIC SECTOR ACCOUNTS
circumstances in which they are useful. . . . The compulsory fees and duties are classed as indirect taxes when paid by producers.
In practice, these distinctions have been conceptually difficult to understand and difficult, if not impossible, for governments to apply. Practice has varied widely, and attempts to reach consensus among practitioners on the application of these criteria to specific administrative fees have encountered opinions that are sharply divided.
In these circumstances, extensive discussions were held over a period of years in the OECD Committee on Fiscal Affairs (Working Party 2) with a view to clarifying, at the borderline, the distinction between tax and nontax revenues of government. The conclusions reached are now reflected in both the OECD Guidelines and Revenue Statistics and in the Fund's GFSM. Taxes are defined as compulsory, unrequited, nonrepayable payments to government and as any collections of fees and charges out of all proportion to the cost or distribution of government service provided to the payer. Classified as taxes are business and professional licenses and, reflecting prevailing administrative practice among governments, taxes on permission to hunt, shoot, or fish, taxes on the ownership of dogs, and radio and television licenses, unless the public authorities provide general broadcasting services.
Nontax revenue, therefore, includes fees for the provision of a service, whether compulsory fees for provision of a regulatory service, such as driver's licenses, passports, or court fees, or voluntary charges for the provision of a nonregulatory service, such as museum admission fees, or school or hospital charges, unless such fees are out of all proportion to the cost or distribution of the government service provided to the payer.
In the application of this classification, a determination of whether a service is regulatory or nonregulatory or whether it benefits the payer or others is not necessary. Should it be found desirable to assign consumption of the services rendered in exchange for the fees to business or households, the distinction presently applied in the SNA to payment of fees could be continued for the more broadly defined category of fees, with treatment of the business and nonbusiness-paid components classified appropriately.
Property Income
In this subsection, questions are addressed regarding withdrawals of entrepreneurial income from quasi-corporate enterprises, operat-
DISCUSSION 267
ing deficits of departmental enterprises, and indexation payments on debt.
Withdrawals of Entrepreneurial Income
Should the category of dividends received by government be combined with withdrawals of entrepreneurial income from quasi-corporations and, in the case of GFS, with the cash operating surplus of departmental enterprises, which would thus no longer be treated separately from corporate nonfinancial public enterprises?
In the income and outlay account, the SNA includes as receipts the operating surpluses of departmental enterprises and withdrawals of entrepreneurial income from quasi-corporations; it includes interest, dividends and land rent, and royalties as both receipts and disbursements. Dividends are defined as those received only from public and private corporations (and also from cooperatives), whereas withdrawals from entrepreneurial income cover actual payments of property income made to government by quasi-corporations.
The GFS lists on the receipts side only two property income categories-cash operating surpluses of departmental enterprise sales to the public, and other property income-and on the expenditure side only cash operating deficits of departmental enterprise sales to the public and interest payments.
In practice, countries often do not make the distinction between dividends received by government from public corporations and withdrawals of entrepreneurial income from public quasi-corporations. The latter are frequently registered as dividends received.
If departmental enterprises were included as quasi-corporations in the SNA and as public enterprises in the GFS, and all own account production of capital goods were separated out as a public enterprise or quasi-corporate activity, this would eliminate the present distinction between the operating surplus of departmental enterprises and withdrawals from the entrepreneurial income of quasi-corporations. Both would then be treated as withdrawals and could be combined with dividends as suggested above.
Operating Deficits of Departmental Enterprises
Should current transfers to quasi-corporate enterprises and to cover the operating deficit of departmental enterprises be shown as subsidies in the SNA?
Current government transfers to enterprises are classified as sub-

268 PUBLIC SECTOR ACCOUNTS
sidies, which by definition permit market price to vary from factor cost. Several elements have complicated the application of this principle to departmental enterprises, however: their close relationship with government, determination of price, and inadequate data.
Because departmental enterprises are owned by government and operate within government administration and accounts, no explicit government transfer permitting sale at lower prices is generally identifiable. Instead, prices set below operating costs are reflected in an operating deficit that is met by government as an explicit subsidy payment would be. Although an operating surplus reaching government would be registered as entrepreneurial or property income, the dual role of government as owner and provider of public policy subsidies would appear to offer the alternative of classifying operating deficits as either subsidies or negative withdrawals from the entrepreneurial income of quasi-corporate enterprises. Given the basic public policy orientation of government, including its responsibility for the operation of departmental enterprises, classification of the operating deficits of such enterprises as subsidies would appear to be preferable.
When departmental enterprises sell to other parts of government at prices set administratively without regard to market price or costs, calculation of an operating deficit or surplus does not yield a realistic value of either subsidy or property income or of the enterprise's output or value added. In these circumstances, integration of such departmental enterprise activity in the production account of producers of government services, with no calculation of an operating deficit or surplus, would yield a more valid measure of government and enterprise activity, as discussed elsewhere in this chapter.
The operation of departmental enterprises within government administration and accounts frequently makes it difficult to measure the consumption of fixed capital within operating costs and, hence, the operating deficit or surplus. Thus, in the GFS, a cash operating deficit or surplus for departmental enterprises' sales to the public is calculated that does not take into account consumption of fixed capital, changes in stocks, or changes in accrued trade credits outstanding. Any resultant cash operating deficit is classified in the GFS as a government subsidy, and any cash operating surplus is classified as entrepreneurial or property income received by government. Where data for consumption of fixed capital, changes in stock, and changes in accrued trade credits are difficult to obtain, they may have to be estimated so as to calculate the fully accrual-based measure of output, value added, and the operating deficit or surplus for the SNA. This would be true in any case, whether departmental enterprises selling
DISCUSSION 269
to the public are classified within government or in the nonfinancial public enterprise sector.
Indexation Payments
Should indexation payments on debt be classified as interest paid for use of capital or as amortization paid for repayment of capital in real terms?
Although the issue of classifying indexation payments as interest or amortization goes well beyond the public sector accounts, it may be useful to note its major implications in the analysis of government.
Government debt instruments are usually of considerable magnitude in countries that find it necessary, because of price inflation, to index their liabilities. At present, indexation payments are in general classified as interest payments, both in GFS and in the SNA, where they would consequently appear in the income and outlay account rather than in the capital finance account. This classification results in lower totals for saving and net lending for the paying sector, although there is no change for the economy as a whole because debt payments abroad would usually be denominated directly in foreign exchange rather than being indexed to domestic prices. Correspondingly, classification of government indexation payments as interest rather than amortization increases a government's deficit.
Several arguments have been cited in discussions about the classification of indexation payments as interest or amortization.
• The inflation component is not separated out and treated differently for payments other than for debt.
• All adjustments for inflation should be reserved for the revaluation account.
• Because repayment of debt denominated in foreign exchange is classified as amortization, classification of indexation payments on debt denominated in local currency as interest could be viewed as inconsistent.
• Although indexation payments formally separate out the explicit inflation component, an implicit inflation component is included in interest in the absence of indexation and is treated as interest.
• Because the implicit inflation component in normal interest payments may be viewed as a return to capital, it should be classified as amortization, with a consequent reduction in the deficit of the paying government to reflect only real interest payments.
• Because a primary purpose of the compilation of both the GFS and SNA is to understand, relate, and forecast behavior and its
270 PUBLIC SECTOR ACCOUNTS
impact on the economy, determination of the appropriate classification of indexation payments should be based on the behavior of those receiving indexation payments. If lenders in an inflationary environment understand their indexation payments to constitute a return to capital to be reinvested for maintenance of their capital's value, classification of such payments as interest in the income and outlay account would tend to overstate income and saving.
Whatever the merits of these arguments, classification of indexation payments remains a contentious issue for the few countries that index debt payments. The implications are substantial for the presentation of government accounts and for treatment of the implicit inflation component in normal interest payments. Consistency of treatment will require a determination of appropriate practice.
Social Assistance to Households
Classification of two forms of social assistance to households-food coupons and welfare work assignments-is considered in the following paragraphs.
Food Coupons
Should the issuance of coupons to households for use in purchases of food or other commodities, with subsequent redemption by government, be classified as subsidies or social assistance grants to households?
Government issuance and redemption of coupons, such as food stamps, to households raises several statistical questions.
• If households are allowed to choose some of the products for which the coupons are to be used, should the overall operation be viewed as a government purchase of goods and services or as an unrequited government transfer? Proposed establishment of a category of individual consumption financed by sectors other than households would appear to affect this question in a way similar to that of government reimbursement for medical costs.
• If such operations are classified as transfers, should they be regarded as subsidies to enterprises or as social assistance grants to households? Subsidies are defined as all unrequited current transfers to enterprises that, by definition, permit them to charge lower prices
DISCUSSION 271
for their sales. It is for this reason that subsidies are added to the market price to arrive at factor cost. That enterprises are required to provide households with goods and services in exchange for the coupons makes the payments the enterprises receive from the government requited, rather than unrequited, from the enterprises' point of view. Hence, such payments would be inappropriate for classification as subsidies permitting market prices below factor costs.
• Although cash-basis GFS data can register the operations only when payment is made to enterprises redeeming the coupons, should accrual-based SNA data register the operation when the coupons are issued to households, when the households use the coupons to make purchases and receive delivery, when enterprises present their claim for payment from the government, when such payment is due some interval after presentation for payment, or when payment is actually made? The answer depends at least in part on the actions in the household or enterprise sectors that registration of the government's operation is meant to parallel and portray.
Welfare Work Assignmen~s
Should payments to welfare recipients that require performance of work assignments be classified as social assistance grants or as payments for factor services?
In some instances, to prevent malingering, to introduce welfare recipients to the work ethic or to particular kinds of work, or to provide particular services to the community, recipients of government welfare payments are required to perform work assignments. Whether such work should be included as an addition to GOP, and its performance classified as provision of factor services, may depend on whether it is viewed as contributing primarily to improving the character, motivation, or skills of the individual performing the work, or to the remainder of the community, which could be regarded as consuming the product. With the growing reform of welfare systems in some countries to include such work requirements, guidelines for their consistent classification take on greater importance.
Measurement questions arise also from the symmetrical, but opposite, phenomenon of government employees hired for incomemaintenance purpose without the performance of work assignments. These questions are usually resolved by adding the value of such employees' wages and salaries to GOP, since government output, in the absence of sales proceeds, is valued as the sum of its inputs.
272 PUBLIC SECTOR ACCOUNTS
Functions of Government: Revision of CO FOG
COFOG was produced in the late 1970s, published in 1980, and is now applied by many countries. COFOG replaces SNA Table 5.3. It is essentially a United Nations dassification, but it has also been adopted as it stands in the Fund's GFS and in the ESA. Data on the breakdown of government expenditure by function are much in demand and widely used.
Although COFOG was in many ways an improvement over SNA Table 5.3, applying it has highlighted some problems that should be examined in the SNA revision process. They relate to (1) the treatment of administrative, regulatory, and research activities; (2) the functional allocation of subsidies; and (3) relationships with the !SIC. These issues are discussed in the following subsections.
It may seem unfortunate to be proposing changes for such a classification so shortly after its introduction, but it should be borne in mind that the SNA revision will only affect data in the late 1990s. Therefore, if there are problems with COFOG, the sooner they are identified the better.
Treatment of Administrative, Regulatory, and Research Expenditures
COFOG differs from the former SNA Table 5.3 in that COFOG distributes all expenditure on general administration, regulation, and research among the headings of the classification served, down to the most detailed three-digit level.
First, and most important for the revision of the SNA, this practice creates difficulties in attempting to isolate individual consumption expenditure of general government to add to private consumption in the calculation of total or enlarged consumption of the population. The reason is that government administration is of two types:
• Local administration within units that produce services (hospitals, for example) that could be rendered by comparable private sector units (this expenditure should be included in the value of the services considered as individual consumption in order to make valuation as comparable as possible)
• General administration, regulation, and research that cannot be found in private sector institutions providing individual services (this expenditure should be considered collective consumption).
DISCUSSION 273
Functional Allocation of Subsidies
Interest in this question first arose from proposals to include the value of certain subsidies in total consumption of the population, but the question also seems to have more general aspects.
For calculating total consumption of the population, some exercises have added the value of certain social or consumption subsidies to the values, according to SNA, of household consumption and the "individual" consumption expenditure (mainly education and health) of general government and private nonprofit institutions. The reason is that these "social" subsidies are considered to have an effect similar to social benefits or direct provision of the good or service by government.
In fact, for calculating a total consumption aggregate within the main SNA accounts, the Expert Group Meeting on the Household Sector in September 1987 concluded that consumer subsidies should not be introduced as a form of final expenditure; instead, a detailed classification of subsidies by type and purpose should be developed and included as part of the SNA analysis of government expenditure. Even if adding certain subsidies to consumption in future only has the role of an alternative analysis, greater clarity of the allocation of subsidies by function is desirable.
COFOG, which is used to delimit the individual consumption expenditure of government, makes special mention of several consumption subsidies, moving them from the "economic" to the "social" categories. For example, under subgroup 07.11, "Housing affairs and services," it says that
Subsidies, grants or loans for increasing, improving or maintaining the housing stock other than rent subsidies paid to households are considered a form of income assistance and are classified to subgroup 06.15 (Family and child allowances) or 06.16 (Other social assistance to persons) as appropriate.
The precise meaning is not clear because the terminology is rather loose, since strictly a subsidy can only be paid to a market producer unit. If one retains the words "paid to households," then the text is saying either that "rent subsidies paid to households" should be considered as social benefits, not as subsidies at all, or that they should be restricted to subsidies to owner-occupiers to "charge" themselves a lower imputed rent.
Slightly clearer is the section on "Distributive trade affairs and services including storage and warehousing" (13.11), which says that
274 PUBLIC SECTOR ACCOUNTS
Food and other subsidies applicable to particular population groups or individuals (for instance, those applied to milk for babies) are considered welfare and are classified to the appropriate subgroup of 06.
The inclusion of this sentence under the distributive trades function may imply a deliberate intention to restrict this treatment to subsidies that are on goods, not services, and that are paid at the distribution stage. Alternatively, it may be intended to represent a principle applicable to other areas.
From the text of COFOG, one cannot tell whether its authors, in mentioning these cases, were simply asserting the functional nature of the classification or were anticipating a definition of consumption subsidies based on the social functions in the same way as on individual consumption. In the latter case, the problem is to determine exactly which subsidies should be singled out for such treatment, or whether a general definition of them could be given.
A problem does, however, arise in applying this solution when one comes to compile total consumption not just in aggregate but by function. For example, to show total consumption of the population on, say, transport, one needs to bring transport subsidies back out of welfare.
In fact one can ask quite generally what is the proper functional classification of a subsidy: does it depend on (1) the ministry that pays it, (2) the industry that receives it, or (3) some perhaps more subjective assessment of its purpose (for example, welfare)?
Surely the aim and spirit of a functional classification favors the last of these. Classification by receiving branch already exists elsewhere in the national accounts; classification by the ministry that pays may also be interesting for budgetary analysis, but it is not "functional." The function served is, however, not unambiguous and may ultimately be rather a matter of subjective judgment. Subsidies do, in general, bring benefits to both producers and consumers as well as in some cases to producers' employees, underdeveloped or declining regions, and so on.
This problem is recognized in the introduction to COFOG section I.C (and repeated in the GFSM on page 144), which attempts to make a distinction between purpose and function by means of certain examples. For example, a subsidy to the shipbuilding industry may have as its purpose maintaining facilities to build warships in time of need, but its function, according to COFOG, is manufacturing affairs and services.
DISCUSSION 275
Relationship with the ISIC
COFOG stipulates that "the units of classification are, in principle at least, individual transactions," but that for many types of outlays related to production of goods and services "COFOG codes will have to be assigned to agencies, offices, program units, bureaux and similar units within government departments" (pages 2-3). Exactly what those units might be in practice is not clear.
The SNA (paragraph 5.31) states that they are establishment-type units and recommends that they be the same as for the activity (!SIC) breakdown of producers of government services. This, it concludes, would allow ''transferring data classified according to kind of economic activity of the producers into data classified according to the purpose they serve.''
Even if the statistical units are the same, however, the structure and the detail of the two classifications (!SIC and COFOG) hardly seem to have been developed with this aim in mind. Some detailed improvements have been made in the recent revision of !SIC (rev. 3); for example, military schools and hospitals are now classified the same way in both the !SIC and CO FOG. But the general structure of the two systems remains very different. One feature is the different treatment of general administration (ministries), which in the !SIC is separated from the activity the ministries serve.
At a more detailed level the correspondence is not good at all: for instance, education and health services are both broken down rather differently in the two systems. Further detailed study would undoubtedly reveal other problems. Whether convergence of these two classifications is desirable and whether a detailed study should be undertaken in this area are matters for further consideration.
17
An Example of Progress in Delineating Relationships Between
Government Finance Statistics and National Accounts Concepts
}ONA1HAN LEVIN AND }AN VAN TONGEREN
H ARMONIZATION of government finance statistics, which are compiled as a guide to the conduct and analysis of the sector itself,
and the government account in the national accounts, which are compiled as an indispensable component of a statistical system analyzing the economy as a whole, should produce two kinds of benefits. It should eliminate unnecessary duplication of effort by compilers, and it should reduce confusion among users regarding the relationships between concepts in the two data systems. To reap these benefits, harmonization should delineate existing relationships between concepts in the two data systems, examine the feasibility of compiling data to measure both sets of concepts, and consider adjusting concepts to meet the essential needs of both data systems within the framework of coordinated compilation efforts.
Efforts to define the exact relations between concepts in the government accounts of the United Nations' A System of National Accounts (SNA) and in the IMF's system of government finance statistics (GFS) began soon after circulation of the draft of the Fund's Manual on Government Finance Statistics (draft GFSM) to governments and international organizations for comment in 1974. Interest in defining the relationship was expressed at the six regional seminars convened to
Note: This chapter is extracted and updated from a paper first presented by the authors at the Nineteenth General Conference of the International Association for Research in Income and Wealth, Noordevijkerhout, Netherlands, August 25-31, 1985.
276
GFS AND NATIONAL ACCOUNTS 277
discuss the draft GFSM, and joint efforts by the staffs of the Fund's Bureau of Statistics and the United Nations Statistical Office (UNSO) resulted in the issuance of the first "bridge tables" between the two data systems in 1976.
The draft GFSM, codifying Fund practice in the measurement of government operations, was developed over the previous two decades and was followed, beginning in 1977, by publication of the Fund's Government Finance Statistics Yearbook (GFS Yearbook). This publication presents detailed statistics, together with lists of institutions included in the government sector, of nonfinancial public enterprises and of public financial institutions. Until the 1989 issue, derivation tables were included that showed the national sources and adjustments utilized by correspondents within each finance ministry or central bank to compile the principal aggregates in accordance with the GFSM, which was published in 1986. The institutional tables have now been limited to show changes occurring after publication of the previous issue of the GFS Yearbook. Data on derivation and adjustments remain available, however, on request. Correspondents receive training in the application of the GFSM in annual eight-week courses held at the IMF Institute and in brief seminars thus far conducted in more than 50 countries. The 1989 GFS Yearbook presented statistics for 124 countries, with greater detail for central government than for state, local, and, consequently, general government.
To make use of the detailed, comparable government statistics contained in the GFS Yearbook, the GFS-SNA bridge tables have been applied so as to arrive at broad, albeit approximate, SNA categories covering central government operations in over 100 countries, published beginning in 1981 in the UN Statistical Yearbook.
In June 1983, following emphasis on harmonization of the SNA and related statistical systems by the United Nations Statistical Commission and by a March 1982 Expert Group Meeting on Review and Development of the SNA, the United Nations and the Fund undertook joint case studies in selected countries on the feasibility of linking SNA and GFS concepts on the basis of detailed data. Questionnaires were sent to compilers in Colombia, Finland, India, Kenya, Mexico, the Netherlands, Thailand, the Philippines, the United Kingdom, Venezuela, and Zambia. In early 1985, visits to several countries in the sample were carried out by UN and Fund staff members as a basis for further harmonization of the two data systems. The lessons from this joint work were instrumental in the preparation of the main discussion paper for the Expert Group Meeting on Public Sector Accounts in January 1988 (Chapter 16 of this volume).
18
Overall Relationships Between the llv1F' s Government Finance Statistics and A System
of National Accounts
jONATHAN LEVIN
A LTHOUGH THE DETAILED relationships between items in the United Nations' A System of National Accounts (SNA) and the IMF's gov
ernment finance statistics (GFS) have been worked out over the past decade in the bridge tables appearing in A Manual on Government Finance Statistics (GFSM) and the UN Handbook on public sector statistics1 and are explored further in Chapter 19 of this volume, it may be helpful to explore briefly the larger relationships between the two data systems and the relative significance of particular differences for their reconciliation. A useful starting point for this purpose may be the origins and purposes of the GFS system.
In both respects, the GFS system is designed to measure and forecast behavior on the basis of observed relationships of motivation and effect. The classifications of government transactions in the GFS system have sought to reflect current thinking in the field of public finance as a means of fitting the analysis and planning of government policies into overall national programs for stabilization and growth. Thousands of Fund country missions have concluded that the strategic role and motivational structure of government require an analytical and planning framework of government operations different from that for any other sector. This framework, over the years, has become the GFS system.
1 United Nations, Handbook of National Accounting: Public Sector Accounts, Studies in Methods, Series F, No. 50 (New York, 1988).
278
GFS AND THE SNA 279
In essence, this framework has called for comprehensive coverage of a government's transactions with the rest of the economy and the world, measuring primarily government payments and receipts and, secondarily, any unpaid accruing obligations. Because it focuses on past and expected future behavior, GFS is based on behavioral or motivational, rather than institutional, relationships. For the sake of such analytical, and predictive, relationships, GFS departs from institutional"integrity" when all or parts of an institution carry out economic functions that differ from its legal or institutional classification. To focus on analysis of government behavior, moreover, GFS classification of some transactions may have to differ from the perceptions of some transactors with whom the government deals.
Within its overall requirements of comprehensive coverage and the gross measurement in real time of government payments and receipts, the heart of the GFS system is the classification of all government transactions from the government's point of view by the nature of what flows. Because government accounting systems are unable to keep track of all flows of accruing liabilities and resources to and from government, these systems are based on money flows. The GFS system utilizes government accounting data, rather than estimates or imputations, of money flows, classified by the nature of what flows in the opposite direction, to construct its analytical framework of government operations.
This GFS analytical framework is represented graphically in Figure 1, which divides all flows between payments and receipts, with an undivided balancing cell at the bottom for changes in cash balances. Flows of receipts and payments are divided horizontally by what flows in the opposite direction: goods and services or resources, nothing, others' liabilities to government, and government liabilities to others. Money flows in exchange for goods and services (or nothing) are further divided by whether or not they involve capital goods-either in direct purchase or sale or in transfers for their acquisition by the recipient. Flows in exchange for others' liabilities to government are divided between those undertaken for public policy purposes-that is, government lending or equity acquisitions undertaken for the same types of goals as government spending-and those undertaken for the management of government liquidity. A further horizontal division among government receipts for which nothing flows in exchange separates grants from other governments or international organizations from flows of taxes or other transfers from nongovernmental sources.
Figure 2 illustrates the classification of various government transactions within this analytical framework. Figure 3 identifies the principal
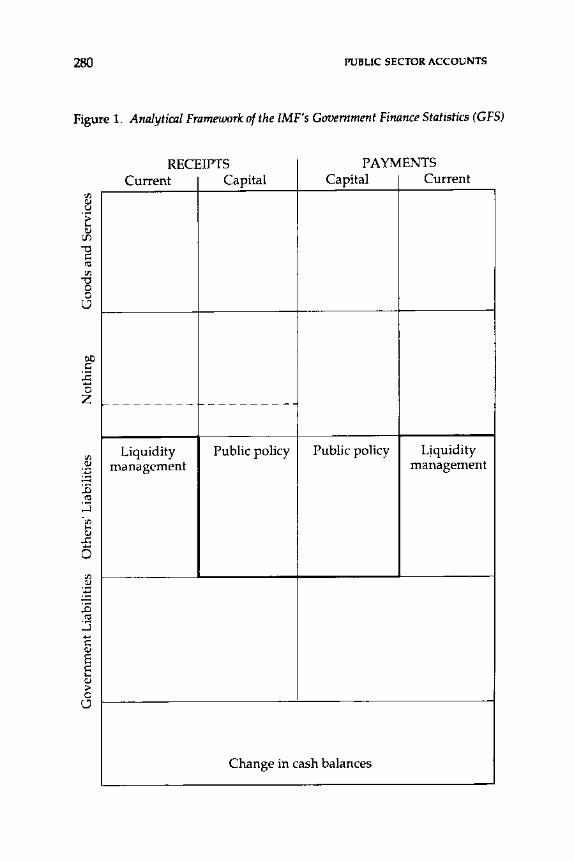
280 PUBLIC SECTOR ACCOUNTS
Figure 1. Analytical Framework of the IMF's Government Finance Statistics (GFS)
~ :E .... 0 z
RECEIPTS PAYMENTS Current Capital Capital Current
-------- --------
Liquidity Public policy Public policy qquidity management management
Change in cash balances
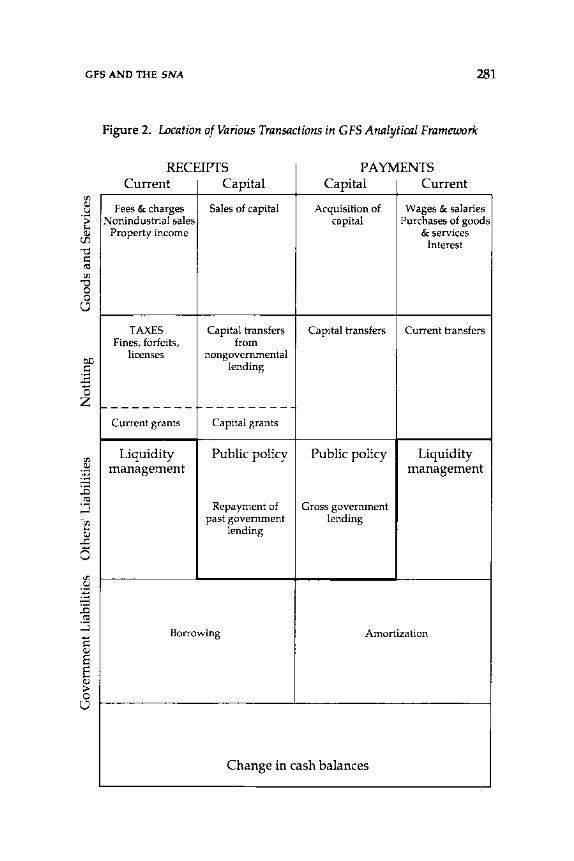
GFS AND THE SNA 281
~ :E .... 0 z
~ ..... .... ..... -~ ;.:3 .... I:: Q)
E E ~ 0
C)
Figure 2. Location of Various Transactions in GFS Analytical Framework
RECEIPTS PAYMENTS Current Capital Capital Current
Fees & charges Sales of capital Acquisition of Wages & salaries Nonindustrial sales capital Purchases of goods
Property income & services Interest
TAXES Capital transfers Capital transfers Current transfers Fines, forfeits, from
licenses nongovernmental lending
1--------- --------Current grants Capital grants
Liquidity Public policy Public policy Liquidity management management
Repayment of Gross government past government lending
lending
Borrowing Amortization
Change in cash balances
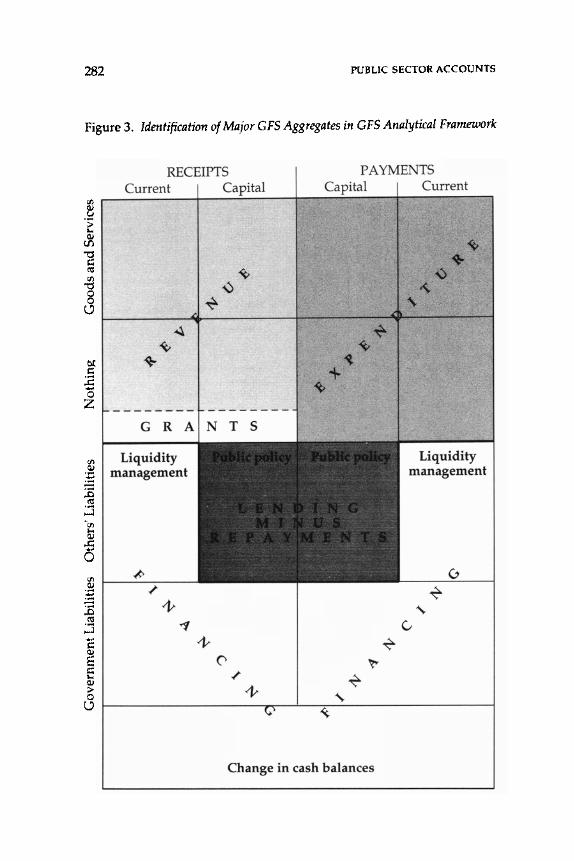
282 PUBLIC SECTOR ACCOUNTS
Figure 3. Identification of Major GFS Aggregates in GFS Analytical Framework
b() ~
:.E .... 0 z
RECEIPTS Current 1 Capital
G R A
Liquidity management
PAYMENTS Capital Current
Liquidity management
Change in cash balances
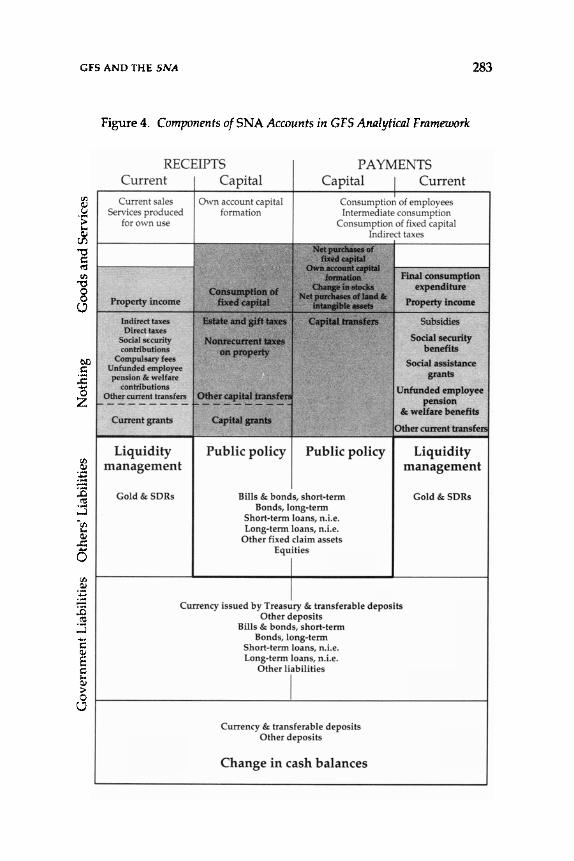
GFS AND THE SNA 283
0.0 1:
£ 0 z
Figure 4. Components ofSNA Accounts in GFS Analytical Framework
RECEIPTS PAYMENTS Current
Current sales Services produced
for own use
··-'
Property income
lndirect t.)).e~ Dired ta--.c.,
Social o;u:uri~· contributions
CompuJo;.,ary feco, Lnfunded employee pension & wt.•lfare
contribution~
Other currL·nt lr.:mo;fc~
Current ~rants
Liquidity management
Gold&SDRs
Capital Capital J Current Own account capital
formation Consumption of employees Intermediate consumption
Consumption of fixed capital Indirect taxes
Consumption of fixed capital
Estate and gift taxes
Nonrecurrent taxes on property
O~h~ .:"~~~ ~a~~!:!
Capital grants
Public policy
Net purdulses of fixed capital
Own •«ount capital formation
CJ>aase ill otocb Net pard>Ma of laud"
intangible illl8els
Capital transfers
Public policy
Bills & bonds, short-tenn Bonds, long-tenn
Short-tenn loans, n.i.e. Long-tenn loans, n.i.e.
Other fixed claim assets Equities
Final consumption expenditure
Property income
Subsidies
Social security benefits
Social assistance grants
Cnfunded employee pension
& welfare benefits
Other current transfer.;
Liquidity management
Gold&SDRs
Currency issued by Treasury & transferable deposits Other deposits
Bills & bonds, short-tenn Bonds, long-tenn
Short-tenn loans, n.i.e. Long-tenn loans, n.i.e.
Other liabilities
I Currency & transferable deposits
Other deposits
Change in cash balances
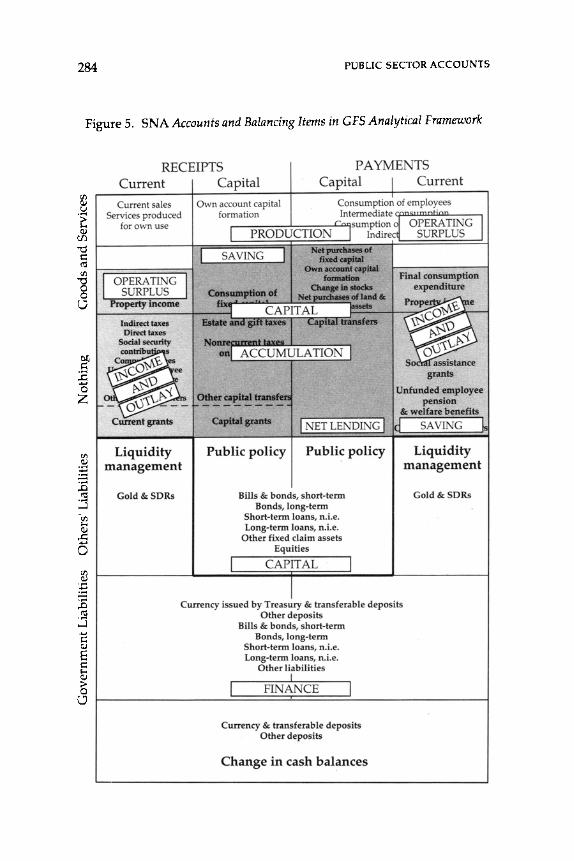
284 PUBLIC SECTOR ACCOUNTS
Figure 5. SNA Accounts and Balancing Items in GFS Analytical Framework
gp £ 0 z
RECEIPTS PAYMENTS Current Capital Capital
Current sales Own account capital Services produced formation
for own use .--------=--L...,.....__,-..t..:.&.ot PRODUCTION
' 'I 'I I' \ I I '\l -...\_ 1': 'I l .....
Property income
" \\ I '\l ,
tndilffl tun &tate Di~u-~
Current gnnts
Liquidity management
Gold&:SDRs
Capi~lgrmta I '\i : : i '\I l['\(
Public policy Public policy
Bills &: bonds, short-term Bonds, long-term
Short-term !oms, n.i.e. Long-term !oms, n.i.e.
Other fixed claim assets Equities
Current
Unfunded employee pension
&. welfue benefit•
" \\ ! '\( '
Liquidity management
Gold&:SDRs
Currency Issued by Treasury &: transferable deposits Other deposits
Bills &: bonds, short-term Bonds, long-term
Short-term !oms, n.Le. Long-term !oms, n.i.e.
Other liabilities
Currency &: transferable deposits Other deposits
Change in cash balances
GFS AND THE SNA 285
aggregates of the GFS system fitted into this analytical framework, with shading for each. As may be seen from Figure 3, Revenue plus Grants, less Expenditure and Lending Minus Repayments, equals the Deficit/Surplus, which, in tum, is equal to Financing.
To provide an approximate comparison between the GFS and the SNA, a number of SNA components are superimposed on this GFS analytical framework in Figure 4. An approximation of the SNA accounts, with shading for each account, is superimposed on the GFS framework in Figure 5, with notation also of the balancing itemsoperating surplus, saving, and net lending-carried from each account to the next. Examination of Figures 4 and 5 permits identification of several components that are classified differently in the GFS and SNA and that contribute to differences between major aggregates in the two systems. One such example is estate and gift taxes, which are classified as capital transfers in the SNA and as taxes, and hence current, in GFS, resulting in differences between the two systems' concepts of taxes, current receipts, capital receipts, and saving.
Overall comparison of the GFS and SNA in the GFS analytical framework serves also to point out similarities and differences between the two systems. The similarities are quite strong in the identical classification of most, though not all, components by the nature of the flows involved. Organization of the two systems differs, dearly, in the single, comprehensive account used by the GFS in contrast to the several accounts used in the SNA to measure separately production, income and outlay, and capital accumulation and finance. The single account structure of the GFS calls for each flow to appear only once, whereas the multiple account structure of the SNA requires the repetition of some components and the insertion of balancing items along the way. Restriction of the nonfinancial major GFS aggregates to either the receipt or payments side contrasts with the combination within some SNA components to include both receipts and payments in a single net concept.
Whatever conclusions are reached about the feasibility of closer future relations between the two data systems, it is evident from this examination of their principal features that they have developed different formats and organizational structures to serve their different objectives: the GFS for overall evaluation of fiscal performance and its impact on financial conditions, and the SNA for measurement of government production, income and outlay, capital formation, and finance as a component with other sectors in the calculation of national aggregates. The primary parameter in any prescription for possible future changes must not divert either system from its primary purpose but should strengthen each as a result of its dose relation to the other.
19
Derivation of System of National Accounts Value from Government
Finance Statistics Data
}AN VAN TONGEREN AND IRENE TSAO
I N AN EFFORT to link the two international standards covering the field of public sector statistics, the IMF' s government finance statis
tics (GFS) and the United Nations' A System of National Accounts (SNA), staff members of the Fund and the UN Statistical Office (UNSO) worked closely together and developed a set of conceptual bridge tables, which was published in the Fund's Manual on Government Finance Statistics (GFSM) in 1986 and included in the United Nations' Handbook of National Accounting: Public Sector Accounts.1
The bridge tables delineated the one-to-one item interrelations of the two systems and have added about 200 further breakdowns of the GFS data, or estimates for items not included in the GFS, in order to derive the public sector accounts according to the SNA concepts. In practical terms, this thorough conceptual consideration may lead to a formidable statistical task while treating minor theoretical differences. Questions have sometimes been raised about whether the bridge tables can actually be applied to derive one set of data from the other and about whether, on the basis of country practices, all detailed links are necessary, feasible, or significant.
I. Purpose
The present paper aims to illustrate a sequential compilation procedure for obtaining SNA government accounts from GFS data, using
1 United Nations, Handbook of National Accounting: Public Sector Accounts, Studies in Methods, Series F, No. 50 (New York, 1988).
286
DERIVING SNA VALUE FROM GFS 287
the conceptual bridge tables only for guidance in the estimation process. By giving an actual example, the paper attempts also to illustrate and quantify the effects of the differences between GFS and SNA concepts, although it should be emphasized that it does not pretend to cover the needs or circumstances of all countries by using the data sets of only one country. Furthermore, it is hoped that this exercise can provide a basis for devising a shortcut data link between the GFS and SNA from which quantitatively unimportant adjustments or considerations that are not applicable to the majority of countries can be eliminated.
II. General Description of Procedure
The procedure for the GFS-SNA conversion adopted in this paper involves two stages, as shown in Figure 1. The first stage of the conversion requires the reclassification of available GFS data to corresponding SNA categories. In the case of a combined GFS item with no breakdown, it is usually assigned to the SNA category according to the predominant component of the GFS item. This stage of conversion has, in fact, been implemented already, and the results were published for more than 100 countries in the Government Sector Statistics chapter of the UN Statistical Yearbook (1981-85 editions). It should be noted that this reclassification yields only a crude approximation of SNA categories.
The second stage represents a refinement of these approximate values by making the adjustments necessary to convert the GFS data according to SNA definitions. All the topics covering the conceptual differences of the two systems have to be considered at this stage, but only a few issues can be dealt with and adjustments applied because of the lack of information.
An example is given in Figure 1 to show the two stages of the derivation procedure. For instance, the GFS revenue item A9, "Administrative fees, charges and nonindustrial sales" is a combined item with no breakdown in the data published in the Fund's Government Finance Statistics Yearbook (GFS Yearbook). It is linked in the first stage of conversion to the SNA item "Sales" of the production account. In the second stage, adjustment is needed to deduct the portion of administrative fees and charges from the approximate SNA values. The amount of administrative fees and charges is further divided into the part paid by households and the part paid by business units, with the former rerouted to the SNA item "Fees, fines and penalties" and the latter to "Indirect taxes."
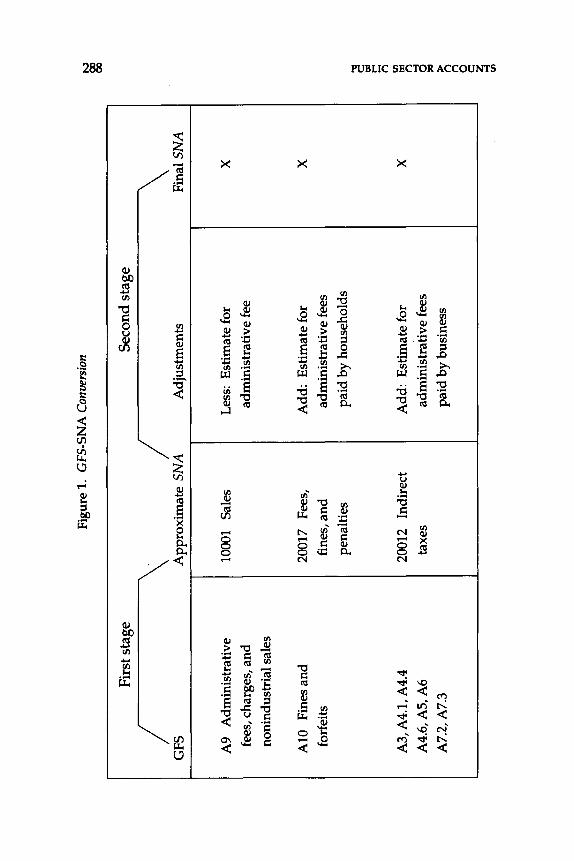
Fir
st s
tage
I G
FS
A9
Adm
inis
trat
ive
fees
, cha
rges
, and
noni
ndus
tria
l sal
es
A 10
Fi
nes
and
forf
eits
A3,
A4.
1, A
4.4
A4.
6,A
S,A
6
A7.
2,A
7.3
Figu
re 1
. G
FS-S
NA
Con
vers
ion
Sec
ond
stag
e
\ App
roxi
mat
e S
NA
A
djus
tmen
ts
1000
1 S
ales
L
ess:
Est
imat
e fo
r
adm
inis
trat
ive
fee
2001
7 Fe
es,
Add
: E
stim
ate
for
fine
s, a
nd
ad
min
istr
ativ
e fe
es
pena
ltie
s pa
id b
y ho
useh
olds
2001
2 In
dire
ct
Add
: E
stim
ate
for
taxe
s ad
min
istr
ativ
e fe
es
paid
by
busi
ness
Fin
al S
NA
X
X
X
~ ~ 1;11
t"' ;:; Ul m
t"l d , ~ t"l 0 c:: ~ Ul
DERIVING SNA VALUE FROM GFS 289
It should be noted that the first-stage approximate conversion is uniform among countries because it has been designed on the basis of internationally comparable and computerized statistics available in the GFS Yearbook. The selection of topics for adjustments in the second stage varies, however, from country to country according to circumstances and data availability.
III. Derivation of SNA Central Government Accounts of the Netherlands from GFS Data
This section presents the results of an exercise to derive the SNA central government accounts of the Netherlands from GFS data. Only the production account, the income and outlay account, and the capital accumulation account of the central government are covered because the most complete sets of data are available for these three accounts of the subsector. The exercise has been carried out with the use of Lotus spread-sheet software.
Adjustment Categories (Annex I)
Before proceeding to the explanation of the numerical derivation, it is necessary to know first which topics, among those defining the differences between GFS and SNA concepts, are dealt with in the exercise as data availability dictates. Annex I shows all the adjustments elaborated in the detailed conceptual bridge tables grouped into 12 categories of topics. Indicated in the columns are those adjustments applied (or not applied) regarding each topic in the process of making the data conform to SNA definitions. In the first stage of the approximate GFS-SNA conversion, two types of adjustments have already been incorporated because data are separately available in the GFS. They are inheritance tax treated as capital transfers in SNA and as tax in GFS (Annex I, item 6b). Sales of stocks, fixed capital assets and land, and intangible assets are treated as negative purchases of these items in the SNA and considered as revenues in the GFS (Annex I, item lOa). The major adjustments, however, are those carried out in the second stage, after the approximate GFS-SNA conversion, to refine the estimates. The adjustments applied in the second stage are own-account capital formation of departmental enterprises, the distinction of taxes paid by household or business, the separation of social security funds from other levels of government, the imputation of unfunded employee welfare contributions, consumption of fixed capital, sales of used goods treated as negative expenditures in
290 PUBLIC SECTOR ACCOUNTS
the SNA and the statistical details of the GFS items property income, casualty insurance transactions, subsidies and transfers, social transfers, and administrative fees and nonindustrial sales. Despite the adjustments listed above, many more issues have not been dealt with in the exercise because of the lack of information, such as the cash versus accrual basis of recording, operating surplus of departmental enterprises, consolidation of transactions within the government in GFS and their separate identification in the SNA, revaluation of assets and liabilities (for the capital finance account), voluntary contributions to social security funds, casualty insurance contributions, and all types of transactions in kind. Reference should be made to Annex I before the analysis of the derivation worksheet contained in Annex II.
Derivation Worksheet (Annex II)
Annex II presents the illustrative worksheet containing the twostage derivation of SNA central government accounts of the Netherlands from GFS data. In preparation for this exercise, the 1980 data for the Netherlands, as published in the GFS Yearbook (1984) and the UN National Accounts Statistics: Government Accounts and Tables (1983), were thoroughly examined to see the feasibility of recasting these data into SNA items. National publications were also used to gather information required for various estimates. From this basic information, it was determined which adjustments could be applied. For this exercise, it was possible to have estimates for the ten adjustment items shown in columns 1-10 on the right-hand side of the various panels of the worksheet (see also the preceding subsection on adjustment categories).
In the panels of the worksheet, the column of SNA categories is an exact reproduction of the UN National Accounts Questionnaire, Table 3.11, "Production Account" (part A of Annex II; code 100 in this column); Table 3.12, "Income and Outlay Account" (parts B.1,2 of Annex II, "Receipts" and "Disbursements," respectively; code 200); and Table 3.13, "Capital Accumulation Account" (part C of Annex II; code 300). Items are coded in the same order within the respective account as in the National Accounts Questionnaire. The GFS categories are shown opposite their corresponding SNA categories regardless of their original GFS order of presentation, although the GFS item codes have been retained.
First Stage
The first-stage approximate conversion constitutes several types of linking: (1) item-to-item linking (for instance, the approximate SNA
DERIVING SNA VALUE FROM GFS 291
"Sales," equal to 2.39 billion guilders, is taken from GFS item A9, "Administrative fees, charges, and nonindustrial sales"; likewise, the approximate SNA "Intermediate consumption" in the amount of 8.57 billion guilders, which is derived from the GFS item C1.3, "Other purchases of goods and services"); (2) the approximate SNA value equals the sum of several GFS items (to obtain the approximate SNA "Indirect taxes," the GFS taxes on payroll or manpower, on immovable property, on financial transactions, on goods and services, on international trade, and so on have to be added up first); (3) the difference of two GFS items gives the approximate SNA value (for example, SNA "Gross fixed capital formation" equals GFS "Purchases of fixed capital assets" minus "Sales of fixed capital assets," which represent, in fact, the adjustment of ''netting'' incorporated at this stage of conversion because data are separately available in the GFS).
After this horizontal linking is carried out, the remaining SNA items can be derived by applying the formulas that determine the interrelations of SNA items. For instance, "Services produced for own use" is a residual item equal to "Gross output" minus "Sales" and "Own account capital formation." "Final consumption expenditure" of the income and outlay accounts equals "Services produced for own use" of the production account. (Please refer to "Vertical Relationships of SNA Items," part D of Annex II, for the list of all formulas for vertical relationships.)
Second Stage
On the right-hand side of the various panels of the worksheet are entered ten columns of adjustments called for in the second stage of the procedure.2 The first column, "Social security funds," is required because GFS data represent ''consolidated central government,'' covering both central government and national social security funds net of intersectoral transactions, whereas social security funds constitute an individual subsector of general government in the SNA. Therefore, the GFS data include contributions to social security funds as income and social security funds payments to the households as outlays,
2 The space limitations of book format prevent full, horizontal spread-sheet presentation of Annex II. The adjustment columns 1-10, on the right-hand side of the worksheet, are distributed in numerical order across the panels of Annex II. The left-hand columns-for GFS and SNA categories, GFS cash basis, and approximate SNA value-are repeated for convenience in each panel; their values do not change across the panels.
292 PUBLIC SECTOR ACCOUNTS
which have to be deducted to obtain the SNA central government accounts. For this purpose, the GFS item A2, "Social security contributions," was eliminated from the receipt side, and the SNA item 20016, "Social security contributions," was left blank. Furthermore, the SNA item 20033, "Transfers to households," was reduced by 69.17 billion guilders, which represents the GFS figure of 70.91 billion guilders for social security transfers to the households minus the estimate for unfunded employee pension benefits, 1.74 billion guilders. In contrast, central government transfers to the social security funds, although netted out in the GFS, should be added back as part of SNA central government disbursements. An estimate of 11.48 billion guilders was available in the UN National Accounts Statistics, which was added to the SNA item 20032, "Transfers to government subsectors." The above adjustments reduced the SNA item 200300, "Other current transfers paid," by 57.69 billion guilders, which is reflected in the increase of the same amount in the SNA item 20040, "Net saving."
The second column shows the adjustment of "Taxes paid by business or households." In the approximate conversion, the total amount of all types of indirect taxes was assigned to SNA "Indirect taxes.'' However, the SNA considers some types of indirect taxes paid by household as direct taxes. To achieve conformity with SNA definitions, an estimate of 1.24 billion guilders for motor vehicle taxes paid by households was deducted from "Indirect taxes" and rerouted to "Direct taxes." "Own-account capital formation" (column 3) is estimated to be 0.50 billion guilders, which represents, in gross input, 0.20 billion guilders for wages and salaries paid and 0.30 billion guilders for other purchases of goods and services used in the ownaccount construction of fixed assets. The amounts for "Consumption of fixed capital formation" (0.66) and "Imputed unfunded employees' contributions" (1.74) have been estimated and entered in columns 4 and 5, respectively, and this in tum has increased gross output and related items by the same amount. In column 6, "Sales of used goods" is separated from the GFS residual item "Other nontax revenues" (assigned to SNA "Other transfers" in the approximate conversion), which is then deducted from "Intermediate consumption," since the SNA specifies the net treatment of "Purchases less sales of goods and services." As a result, gross output and related items decrease by the same amount. The rest of the adjustments-in columns 7-10, for classification details of property income, casualty insurance, subsidies, and administrative fees-are all caused by the broader GFS categories, which require breakdowns for SNA compilations.
DERIVING SNA VALUE FROM GFS 293
The figures for "Final SNA" (shown in the last column of the final panels of parts A-C of Annex II) are obtained by summing up horizontally the values in "Approximate SNA" and those in columns 1-10, where adjustments exist. The accuracy of the data in this column can be cross-checked by applying the formulas for vertical relationships (part D of Annex II).
Comparison of Results (Annex III)
Annex III compares the derived SNA values with those published in the UN National Accounts Statistics: Government Accounts and Tables.3 Given that so many adjustments have not been applied because of the lack of information, the differences between the derived values and those obtained through the UN National Accounts Questionnaire and subsequently published in the yearbook are not significant for most of the items, except for transfers and the balancing items. Furthermore, adjustments for the timing of recording (from cash basis of GFS to accrual basis of SNA) have not been attempted in this exercise, and this might account for some of the discrepancies. The usual procedure for this kind of adjustment is to study the government accounting records to calculate the average time lag between the authorization and the actual cash payment or receipt of various expenditure or revenue items, and to adjust the GFS data accordingly to convert them to an accrual basis.
IV. Uses of the Bridge Tables
The exercise described above is a simple illustration of the operational procedure to compile SNA government accounts from GFS data. Much of it could be improved if more basic information were available. Nevertheless, analysts may use the worksheet to assess the effects of eliminating conceptual differences between the GFS and SNA to harmonize further the two standards. Decisions taken on the issues raised here and in expert group discussions could simplify the bridge table. For example, if the SNA concept of "Indirect taxes" is modified to cover only "Commodity taxes," then all the adjustments for taxes paid by businesses or households can be eliminated. If the separate treatment in the SNA of inheritance taxes as capital transfers rather than as taxes is abolished and social security contributions are
3 United Nations, National Accounts Statistics: Government Accounts and Tables (New York, annual).
294 PUBLIC SECTOR ACCOUNTS
considered as taxes, then the coverage of taxes will be identical in both systems. Furthermore, harmonization of the two systems in the treatment of departmental enterprises and own-account production of capital goods will bring the content of the government sector for these activities in the SNA and GFS fully in line, and adjustments will not be required in this regard. 4
Given the decisions to modify the two standards, a shortcut for deriving SNA value from GFS data along the lines shawn in the illustration presented here can be designed. In comparison with the detailed conceptual bridge tables, the shortcut method will be more practical and easier to apply, and it will not cause much loss of information (as country practices reveal). UNSO plans to use the procedure in its Lotus format, with the cross-check mechanism installed, in technical cooperation projects to help countries to develop the government sector statistics within the national accounts framework.
4 Jonathan Levin and Jan van Tongeren, "Harmonization of International Statistical Standards on Government Finance Statistics (GFS) and System of National Accounts (SNA)," paper presented to the Nineteenth General Conference of the International Association for Research in Income and Wealth, Noordevijkerhout, Netherlands, August 25-31, 1985.
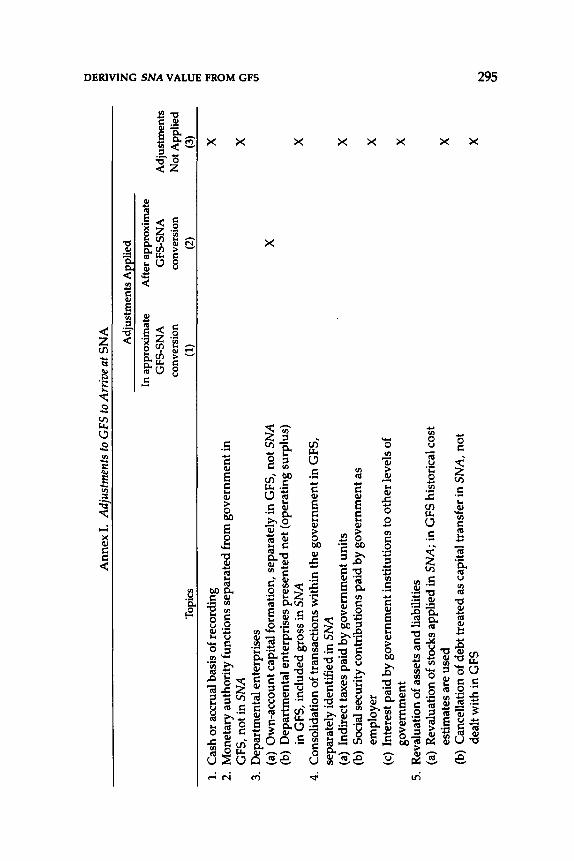
Ann
ex I.
Adj
ustm
ents
to G
FS
to A
rriv
e at
SN
A
Top
ics
1. C
ash
or a
ccru
al b
asis
of r
ecor
ding
2.
M
onet
ary
auth
orit
y fu
ncti
ons
sepa
rate
d fr
om g
over
nmen
t in
GFS
, no
t in
SN
A
3. D
epar
tmen
tal e
nter
pris
es
(a)
Ow
n-ac
coun
t cap
ital
for
mat
ion,
sep
arat
ely
in G
FS,
not
SN
A
(b)
Dep
artm
enta
l ent
erpr
ises
pre
sent
ed n
et (
oper
atin
g su
rplu
s)
in G
FS,
incl
uded
gro
ss in
SN
A
4. C
onso
lida
tion
of
tran
sact
ions
wit
hin
the
gove
rnm
ent i
n G
FS,
sepa
rate
ly id
enti
fied
in S
NA
(a
) In
dire
ct ta
xes
paid
by
gove
rnm
ent u
nits
(b
) So
cial
sec
urit
y co
ntri
buti
ons
paid
by
gove
rnm
ent a
s em
ploy
er
(c)
Inte
rest
pai
d by
gov
ernm
ent i
nsti
tuti
ons
to o
ther
leve
ls o
f go
vern
men
t 5.
R
eval
uati
on o
f ass
ets
and
liab
ilitie
s (a
) R
eval
uati
on o
f sto
cks
appl
ied
in S
NA
; in
GFS
his
tori
cal c
ost
esti
mat
es a
re u
sed
(b)
Can
cell
atio
n of
deb
t tre
ated
as
capi
tal t
rans
fer
in S
NA
, no
t de
alt w
ith
in G
FS
Adj
ustm
ents
App
lied
In a
ppro
xim
ate
GF
S-S
NA
co
nver
sion
(1
)
Aft
er a
ppro
xim
ate
GF
S-S
NA
co
nver
sion
(2
) X
Adj
ustm
ents
N
ot A
ppli
ed
(3) X
X
X
X
X
X
X
X
0 Ill 2!! < z C'
)
In ~ ~ E
Ill
'"II ~ rs::
C')
'"II
Ul ~
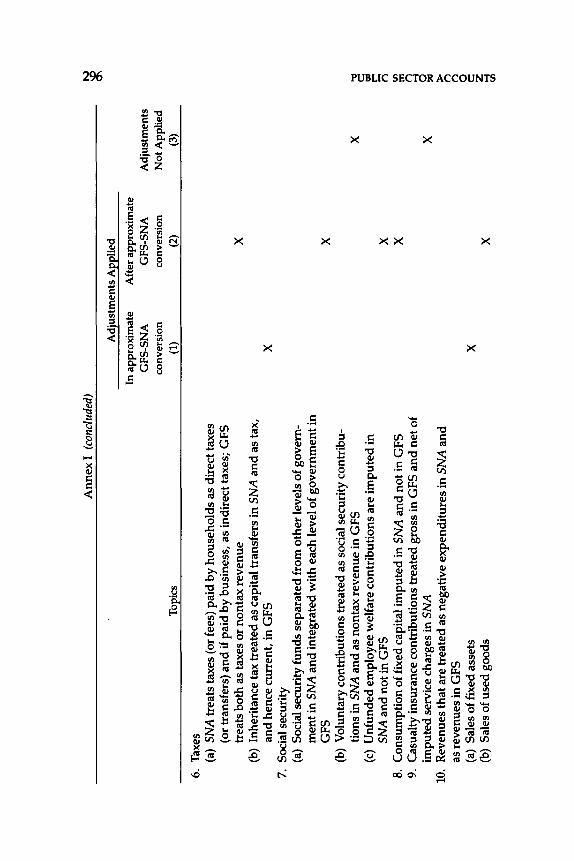
Ann
ex I
(con
clud
ed)
t..J
\0
0\
Adj
ustm
ents
A~~lied
In a
ppro
xim
ate
Afte
r app
roxi
mat
e G
FS-S
NA
G
FS-S
NA
A
djus
tmen
ts
conv
ersi
on
conv
ersi
on
Not
App
lied
Topi
cs
(1)
(2)
(3)
6.
Tax
es
(a)
SNA
tre
ats
taxe
s (o
r fe
es)
paid
by
hous
ehol
ds a
s di
rect
taxe
s (o
r tr
ansf
ers)
and
if p
aid
by b
usin
ess,
as
indi
rect
taxe
s; G
FS
tr
eats
bot
h as
taxe
s or
no
n ta
x re
venu
e X
(b
) In
heri
tanc
e ta
x tr
eate
d as
cap
ital
tran
sfer
s in
SN
A a
nd
as
tax,
an
d he
nce
curr
ent,
in
GFS
X
7.
So
cial
sec
urit
y (a
) So
cial
sec
urit
y fu
nds
sepa
rate
d fr
om o
ther
leve
ls o
f go
vern
-m
ent i
n S
NA
and
inte
grat
ed w
ith
each
leve
l of
gove
rnm
ent i
n G
FS
X
(b)
Vol
unta
ry c
ontr
ibut
ions
trea
ted
as s
ocia
l sec
urit
y co
ntri
bu-
tion
s in
SN
A a
nd a
s no
ntax
rev
enue
in G
FS
X
.., c:
(c)
Unf
unde
d em
ploy
ee w
elfa
re c
ontr
ibut
ions
are
im
pute
d in
=
!:
SN
A a
nd n
ot in
GFS
X
n
8.
Con
sum
ptio
n of
fixe
d ca
pita
l im
pute
d in
SN
A a
nd
not
in G
FS
X
In
1!
1
9.
Cas
ualt
y in
sura
nce
cont
ribu
tion
s tr
eate
d gr
oss
in G
FS
an
d n
et o
f n '"'
I
impu
ted
serv
ice
char
ges
in S
NA
X
0 "'
10.
Rev
enue
s th
at a
re t
reat
ed a
s ne
gati
ve e
xpen
ditu
res
in S
NA
and
>
n
as r
even
ues
in G
FS
n 0 (a
) Sa
les
of fi
xed
asse
ts
X
c: (b
) Sa
les
of u
sed
good
s X
z '"'
I In
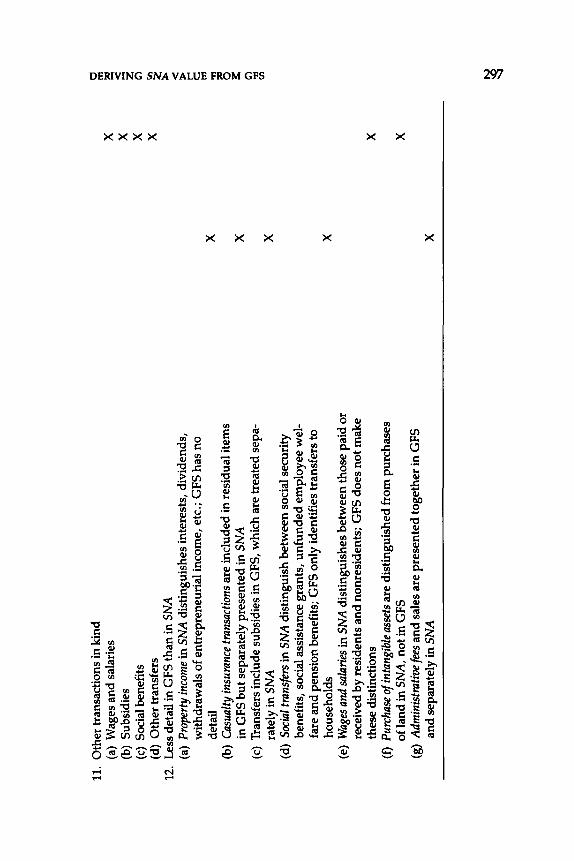
11.
Oth
er tr
ansa
ctio
ns in
kin
d 0 rr
l
(a)
Wag
es a
nd s
alar
ies
X
!!! (b
) S
ubsi
dies
X
<
z (c
) So
cial
ben
efit
s X
C
)
(d)
Oth
er tr
ansf
ers
X
tn
12.
Les
s de
tail
in G
FS t
han
in S
NA
~
(a)
Prop
erty
inco
me
in S
NA
dis
ting
uish
es in
tere
sts,
div
iden
ds,
< >
wit
hdra
wal
s of
ent
repr
eneu
rial
inco
me,
etc
.; G
FS
has
no
E
de
tail
X
rr
l -.:
1
(b)
Cas
ualty
insu
ranc
e tr
ansa
ctio
ns a
re i
nclu
ded
in r
esid
ual i
tem
s ~
in G
FS b
ut s
epar
atel
y pr
esen
ted
in S
NA
X
:::
(c)
Tra
nsfe
rs in
clud
e su
bsid
ies
in G
FS,
whi
ch a
re t
reat
ed s
epa-
C)
-.:1
rate
ly in
SN
A
X
IJl
(d)
Soci
al tr
ansf
ers
in S
NA
dis
ting
uish
bet
wee
n so
cial
sec
urit
y be
nefi
ts,
soci
al a
ssis
tanc
e gr
ants
, u
nfu
nd
ed e
mpl
oyee
wei
-fa
re a
nd p
ensi
on b
enef
its;
GF
S o
nly
iden
tifi
es tr
ansf
ers
to
hous
ehol
ds
X
(e)
Wag
es a
nd s
alar
ies
in S
NA
dis
ting
uish
es b
etw
een
thos
e pa
id o
r re
ceiv
ed b
y re
side
nts
and
nonr
esid
ents
; G
FS
doe
s n
ot m
ake
thes
e di
stin
ctio
ns
X
(f)
Purc
hase
of i
ntan
gibl
e as
sets
are
dist
ingu
ishe
d fr
om p
urch
ases
of
land
in S
NA
, no
t in
GFS
X
(g
) A
dmin
istr
ativ
e fee
s an
d sa
les
are
pres
ente
d to
geth
er in
GF
S
and
sepa
rate
ly in
SN
A
X
~
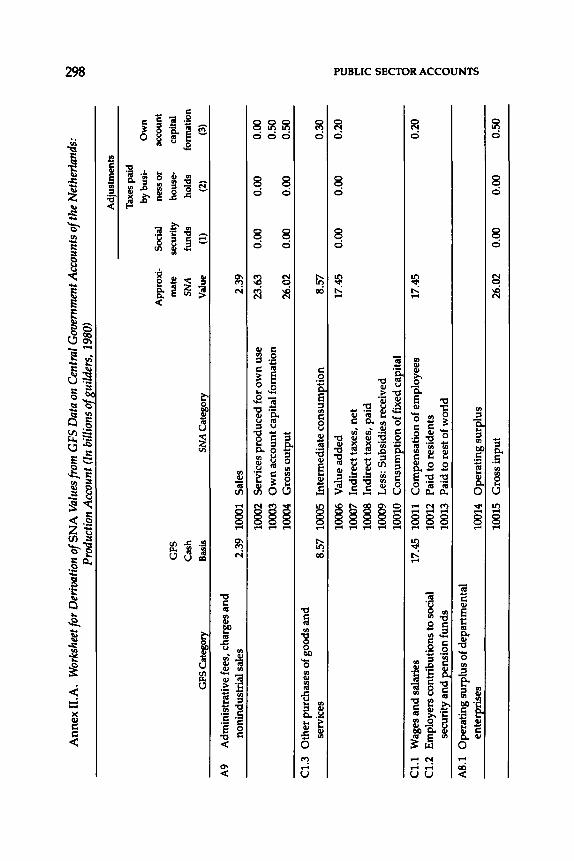
Ann
ex II
.A.
Wor
kshe
et fo
r D
eriv
atio
n of
SN
A V
alue
s fr
om G
FS
Dat
a on
Cen
tral
Gov
ernm
ent A
ccou
nts
of th
e N
ethe
rlan
ds:
~ P
rodu
ctio
n A
ccou
nt (I
n bi
llion
s of
gui
lder
s, 1
980)
Adj
ustm
ents
Taxe
s pa
id
bybu
si-
Ow
n A
ppro
xi-
Soci
al
ness
or
acco
unt
GF
S
mat
e se
curi
ty
hous
e-ca
pita
l C
ash
SN
A
fund
s ho
lds
form
atio
n
GFS
Cat
egor
y B
asis
S
NA
Cat
egor
y V
alue
(1
) (2
) (3
)
A9
Adm
inis
trat
ive
fees
, ch
arge
s an
d
noni
ndus
tria
l sal
es
2.39
10
001
Sal
es
2.39
1000
2 S
ervi
ces
pro
du
ced
for
ow
n u
se
23.6
3 0.
00
0.00
0.
00
1000
3 O
wn
acc
ount
cap
ital
for
mat
ion
0.50
10
004
Gro
ss o
utp
ut
26.0
2 0.
00
0.00
0.
50
C1.
3 O
ther
pur
chas
es o
f goo
ds a
nd
se
rvic
es
8.57
10
005
Inte
rmed
iate
co
nsu
mp
tio
n
8.57
0.
30
1000
6 V
alue
ad
ded
17
.45
0.00
0.
00
0.20
~
1000
7 In
dire
ct ta
xes,
net
1:1
11 !:
1000
8 In
dire
ct ta
xes,
pai
d l"
l
1000
9 L
ess:
Sub
sidi
es r
ecei
ved
Ill
trl
1001
0 C
on
sum
pti
on
of
fixe
d ca
pita
l l"
l 0 C
1.1
Wag
es a
nd
sal
arie
s 17
.45
1001
1 C
ompe
nsat
ion
of e
mpl
oyee
s 17
.45
0.20
~
C1.
2 E
mpl
oyer
s co
ntri
buti
ons
to s
ocia
l 10
012
Pai
d to
res
iden
ts
>
l"l
secu
rity
an
d p
ensi
on f
un
ds
1001
3 P
aid
to r
est o
f w
orld
l"
l 0 c:: A
8.1
Ope
rati
ng s
urpl
us o
f dep
artm
enta
l z ~
ente
rpri
ses
1001
4 O
per
atin
g s
urp
lus
Ill
1001
5 G
ross
in
pu
t 26
.02
0.00
0.
00
0.50
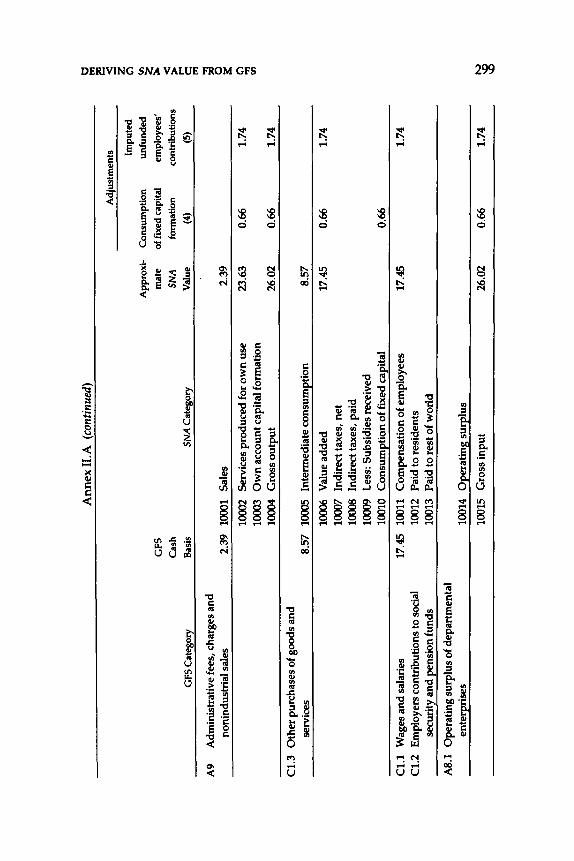
Ann
ex II
.A (
cont
inue
d)
0 1!1 2!!
Adj
ustm
ents
<
Im
pute
d z C
)
App
roxi
-C
onsu
mpt
ion
unfu
nded
In
GFS
m
ate
of fi
xed
capi
tal
empl
oyee
s' ~
Cas
h SN
A
form
atio
n co
ntri
butio
ns
<
>
Bas
is SN
A C
ateg
ory
Val
ue
(4)
(5)
!'"'
GFS
Cat
egor
y c: 1!
1
A9
Adm
inis
trat
ive
fees
, ch
arge
s an
d 'I
I ~ no
nind
ustr
ial s
ales
2.
39
1000
1 S
ales
2.
39
=:: 10
002
Ser
vice
s pr
oduc
ed fo
r o
wn
use
23
.63
0.66
1.
74
C)
'II
1000
3 O
wn
acc
ount
cap
ital
for
mat
ion
VI
1000
4 G
ross
ou
tpu
t 26
.02
0.66
1.
74
Cl.
3
Oth
er p
urch
ases
of g
oods
and
se
rvic
es
8.57
10
005
Inte
rmed
iate
con
sum
£tio
n 8.
57
1000
6 V
alue
ad
ded
17
.45
0.66
1.
74
1000
7 In
dire
ct ta
xes,
net
10
008
Indi
rect
taxe
s, p
aid
1000
9 L
ess:
Sub
sidi
es r
ecei
ved
1001
0 C
on
sum
ftio
n o
f fix
ed c
apit
al
0.66
C1.
1 W
ages
and
sal
arie
s 17
.45
1001
1 C
ompe
nsat
ion
of e
mpl
oyee
s 17
.45
1.74
C
1.2
Em
ploy
ers
cont
ribu
tion
s to
soc
ial
1001
2 P
aid
to r
esid
ents
se
curi
ty a
nd
pen
sion
fun
ds
1001
3 P
aid
to r
est o
f wor
ld
A8.
1 O
pera
ting
sur
plus
of d
epar
tmen
tal
ente
r£ri
ses
1001
4 0
£er
atin
8 su~lus
1001
5 G
ross
inpu
t 26
.02
0.66
1.
74
N :8
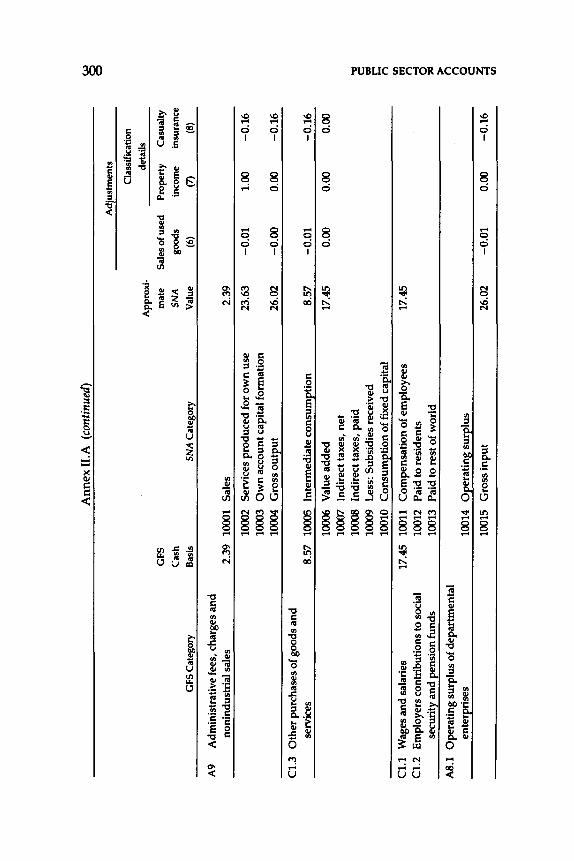
Ann
ex I
I.A
(co
ntin
ued)
8
Adj
ustm
ents
Cla
ssifi
catio
n
App
roxi
-de
tails
GFS
m
ate
Sale
s of
use
d Pr
oper
ty
Cas
ualty
C
ash
SN
A
good
s in
com
e in
sura
nce
GFS
Cat
egor
y B
asis
SN
A C
ateg
ory
Val
ue
(6)
(7)
(8)
A9
Adm
inis
trat
ive
fees
, ch
arge
s an
d
noni
ndus
tria
l sal
es
2.39
10
001
Sal
es
2.39
1000
2 S
ervi
ces
prod
uced
for
ow
n u
se
23.6
3 -0
.01
1.
00
-0.1
6
1000
3 O
wn
acc
ount
cap
ital
for
mat
ion
1000
4 G
ross
ou
tpu
t 26
.02
-0.0
0
0.00
-0
.16
C1.
3 O
ther
pur
chas
es o
f goo
ds a
nd
se
rvic
es
8.57
10
005
Inte
rmed
iate
consum~tion
8.57
-0
.01
-0
.16
1000
6 V
alue
ad
ded
17
.45
0.00
0.
00
0.00
10
007
Indi
rect
taxe
s, n
et
1000
8 In
dire
ct ta
xes,
pai
d ~
1000
9 L
ess:
Sub
sidi
es r
ecei
ved
Ill t:
1001
0 C
onsu
mpt
ion
of fi
xed
capi
tal
n C
1.1
Wag
es a
nd s
alar
ies
Ul
17.4
5 10
011
Com
pens
atio
n of
em
ploy
ees
17.4
5 rr:
l n C
1.2
Em
ploy
ers
cont
ribu
tion
s to
soc
ial
1001
2 P
aid
to r
esid
ents
d
secu
rity
and
pen
sion
fun
ds
1001
3 P
aid
to r
est o
f w
orld
!Ia
>
A8.
1 O
pera
ting
sur
plus
of d
epar
tmen
tal
n n enter~rises
1001
4 O
pera
ting
sur
plus
0 c:::
10
015
Gro
ss in
put
26.0
2 -0
.01
0.
00
-0.1
6
z o-j
Ul
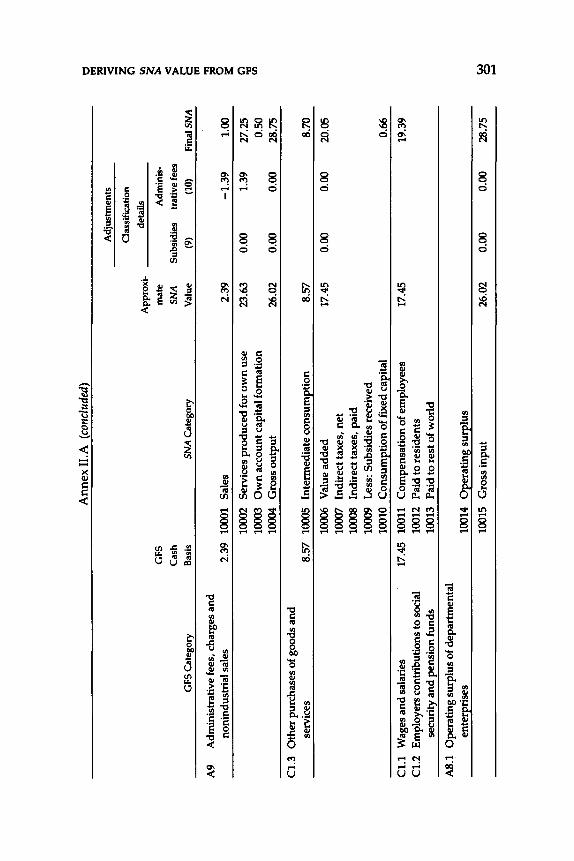
An
nex
II. A
(c
oncl
uded
) 0 1!
1
Adj
ustm
ents
2!!
<
Cla
ssifi
catio
n z C"
l A
ppro
xi-
deta
ils
1:1)
GFS
m
ate
Adm
inis
-~
Cas
h S
NA
Su
bsid
ies
trativ
e fe
es
<
>
GFS
Cat
egor
y B
asis
SN
A C
ateg
ory
Val
ue
(9)
(10)
Fi
naiS
NA
E
1!
1
A9
Adm
inis
trat
ive
fees
, ch
arge
s an
d ..., ~
noni
ndus
tria
l sal
es
2.39
10
001
Sal
es
2.39
-1
.39
1.
00
== 10
002
Ser
vice
s pr
oduc
ed fo
r o
wn
use
23
.63
0.00
1.
39
27.2
5 C"
l ..., 10
003
Ow
n a
ccou
nt c
apit
al fo
rmat
ion
0.50
U
l
1000
4 G
ross
ou
tpu
t 26
.02
0.00
0.
00
28.7
5
C1.
3 O
ther
pur
chas
es o
f goo
ds a
nd
serv
ices
8.
57
1000
5 In
term
edia
te c
onsu
met
ion
8.57
8.
70
1000
6 V
alue
add
ed
17.4
5 0.
00
0.00
20
.05
1000
7 In
dire
ct ta
xes,
net
10
008
Indi
rect
taxe
s, p
aid
1000
9 L
ess:
Sub
sidi
es re
ceiv
ed
1001
0 C
onsu
met
ion
of fi
xed
caei
tal
0.66
C1.
1 W
ages
and
sal
arie
s 17
.45
1001
1 C
ompe
nsat
ion
of e
mpl
oyee
s 17
.45
19.3
9 C
1.2
Em
ploy
ers
cont
ribu
tion
s to
soc
ial
1001
2 P
aid
to r
esid
ents
se
curi
ty a
nd
pen
sion
fun
ds
1001
3 P
aid
to r
est o
f wor
ld
A8.
1 O
pera
ting
sur
plus
of d
epar
tmen
tal
ente
!Eri
ses
1001
4 O~ratin~ s
urei
us
1001
5 G
ross
inpu
t 26
.02
0.00
0.
00
28.7
5 ~
......
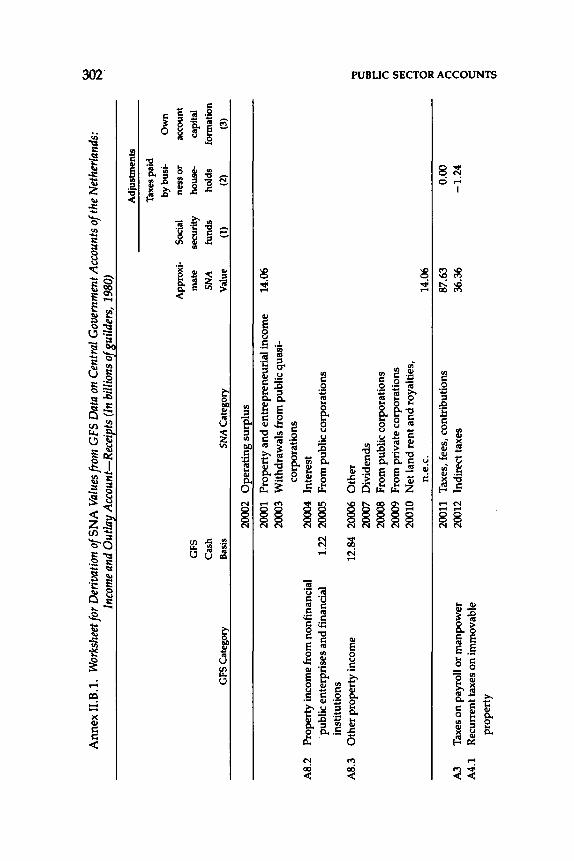
Ann
ex 1
1.8.
1.
Wor
kshe
et fo
r D
eriv
atio
n o
fSN
A V
alue
s fro
m G
FS D
ata
on C
entr
al G
over
nmen
t Acc
ount
s of
the
Net
herl
ands
: S
Inco
me
and
Out
lay
Acc
ount
-Rec
eipt
s (In
bill
ions
of g
uild
ers,
198
0)
GFS
Cat
egor
y
A8.
2 P
rope
rty
inco
me
from
non
fina
ncia
l pu
blic
ent
erpr
ises
an
d fi
nanc
ial
inst
itut
ions
A
8.3
Oth
er p
rope
rty
inco
me
A3
Tax
es o
n p
ayro
ll o
r m
anp
ow
er
A4.
1 R
ecur
rent
taxe
s o
n im
mov
able
pr
oper
ty
GF
S
Cas
h
Bas
is
SN
A C
ateg
ory
2000
2 O
per
atin
g s
urp
lus
2000
1 P
rope
rty
and
ent
repr
eneu
rial
inco
me
2000
3 W
ithd
raw
als
from
pub
lic
quas
i-co
rpor
atio
ns
2000
4 In
tere
st
1.22
20
005
Fro
m p
ubli
c co
rpor
atio
ns
12.8
4 20
006
Oth
er
2000
7 D
ivid
ends
20
008
Fro
m p
ubli
c co
rpor
atio
ns
2000
9 F
rom
pri
vate
cor
pora
tion
s 20
010
Net
lan
d r
ent
and
roy
alti
es,
n.e.
c.
2001
1 T
axes
, fe
es,
cont
ribu
tion
s 20
012
Indi
rect
taxe
s
App
roxi
-
mat
e
SN
A
Val
ue
14.0
6
14.0
6
87.6
3 36
.36
Adj
ustm
ents
Tax
es p
aid
bybu
si-
Ow
n
Soci
al
ness
or
acco
unt
secu
rity
ho
use-
capi
tal
fund
s ho
lds
form
atio
n
(1)
(2)
(3)
~ 1:111 t: n fJI
1!1 n o-1 0 :-:1
0.
00
>
n -1
.24
n 0 <:
z o-1
fJI
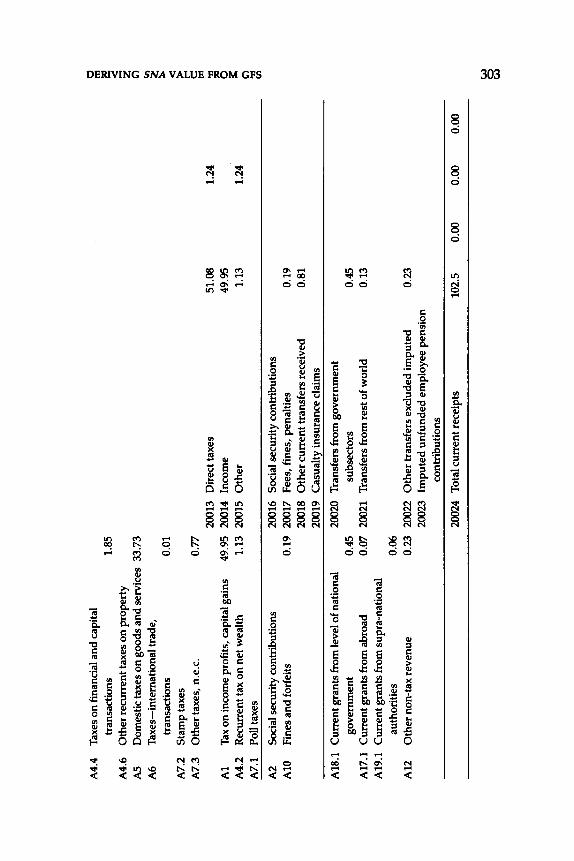
A4.
4 T
axes
on
fina
ncia
l an
d ca
pita
l 0 1!
1
tran
sact
ions
1.
85
2!! <
A4.
6 O
ther
recu
rren
t tax
es o
n p
rope
rty
z A
S D
omes
tic
taxe
s o
n g
oods
and
ser
vice
s 33
.73
C'l
A6
Tax
es-i
nter
nati
onal
trad
e,
Ill ~
tran
sact
ions
0.
01
<
A7.
2 S
tam
p ta
xes
>
A7.
3 O
ther
taxe
s, n
.e.c
. 0.
77
E
1!1
2001
3 D
irec
t tax
es
51.0
8 1.
24
'II
A1
Tax
on
inco
me
prof
its,
cap
ital
gai
ns
49.9
5 20
014
Inco
me
49.9
5 ~
A4.
2 R
ecur
rent
tax
on n
et w
ealt
h 1.
13
2001
5 O
ther
1.
13
1.24
3:
C'
l A
7.1
Poll
taxe
s 'I
I In
A2
Soci
al s
ecur
ity
cont
ribu
tion
s 20
016
Soci
al s
ecur
ity
cont
ribu
tion
s A
10
Fine
s an
d fo
rfei
ts
0.19
20
017
Fees
, fi
nes,
pen
alti
es
0.19
20
018
Oth
er c
urre
nt tr
ansf
ers
rece
ived
0.
81
2001
9 C
asua
lty
insu
ranc
e cl
aim
s
A18
.1
Cur
rent
gra
nts
from
leve
l of n
atio
nal
2002
0 T
rans
fers
fro
m g
over
nmen
t go
vern
men
t 0.
45
subs
ecto
rs
0.45
A
17.1
C
urre
nt g
rant
s fr
om a
broa
d 0.
07
2002
1 T
rans
fers
fro
m r
est o
f w
orld
0.
13
A19
.1
Cur
rent
gra
nts
from
sup
ra-n
atio
nal
auth
orit
ies
0.06
A
12
Oth
er n
on-t
ax r
even
ue
0.23
20
022
Oth
er tr
ansf
ers
excl
uded
im
pute
d 0.
23
2002
3 Im
pute
d un
fund
ed e
mpl
oyee
pen
sion
co
ntri
buti
ons
2002
4 T
otal
cur
rent
rec
eipt
s 10
2.5
0.00
0.
00
0.00
s
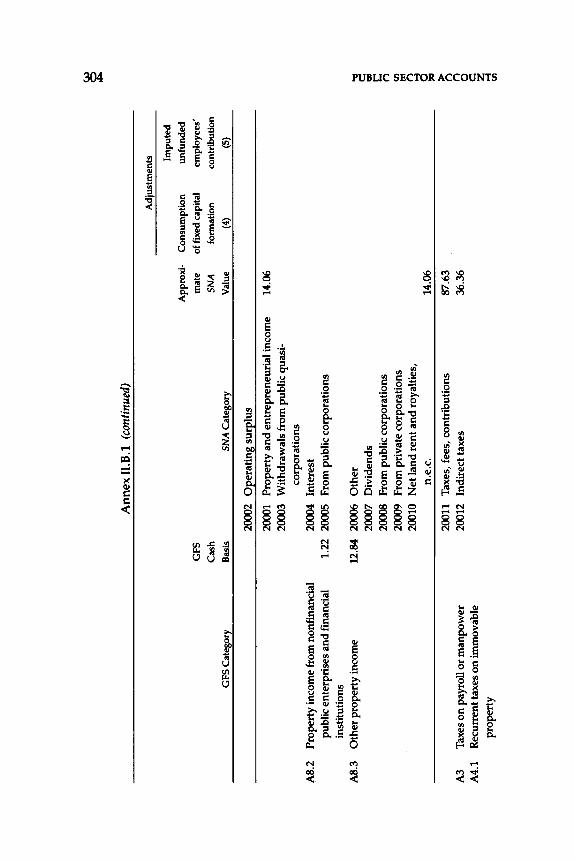
GFS
Cat
egor
y
A8.
2 P
rope
rty
inco
me
from
non
fina
ncia
l pu
blic
ent
erpr
ises
and
fina
ncia
l in
stit
utio
ns
A8.
3 O
ther
pro
pert
y in
com
e
A3
Tax
es o
n pa
yrol
l or
man
pow
er
A4.
1 R
ecur
rent
taxe
s on
imm
ovab
le
prop
erty
An
nex
11.
8.1
(con
tinue
d)
GFS
Cas
h
Bas
is
SN
A C
ateg
ory
2000
2 O
pera
ting
sur
plus
2000
1 P
rope
rty
and
ent
repr
eneu
rial
inco
me
2000
3 W
ithd
raw
als
from
pub
lic
quas
i-co
rpor
atio
ns
2000
4 In
tere
st
1.22
20
005
Fro
m p
ubli
c co
rpor
atio
ns
12.8
4 20
006
Oth
er
2000
7 D
ivid
ends
20
008
Fro
m p
ubli
c co
rpor
atio
ns
2000
9 F
rom
pri
vate
cor
pora
tion
s 20
010
Net
land
ren
t an
d ro
yalt
ies,
n.
e.c.
2001
1 T
axes
, fe
es,
cont
ribu
tion
s 20
012
Indi
rect
taxe
s
App
roxi
·
mat
e
SN
A
Val
ue
14.0
6
14.0
6
87.6
3 36
.36
Adj
ustm
ents
Impu
ted
Con
sum
ptio
n un
fund
ed
of fi
xed
capi
tal
empl
oyee
s'
form
atio
n co
ntri
buti
on
(4)
(5)
~ ~ =
!:
n (/)
r!l n 6 ~ i!; n g ~
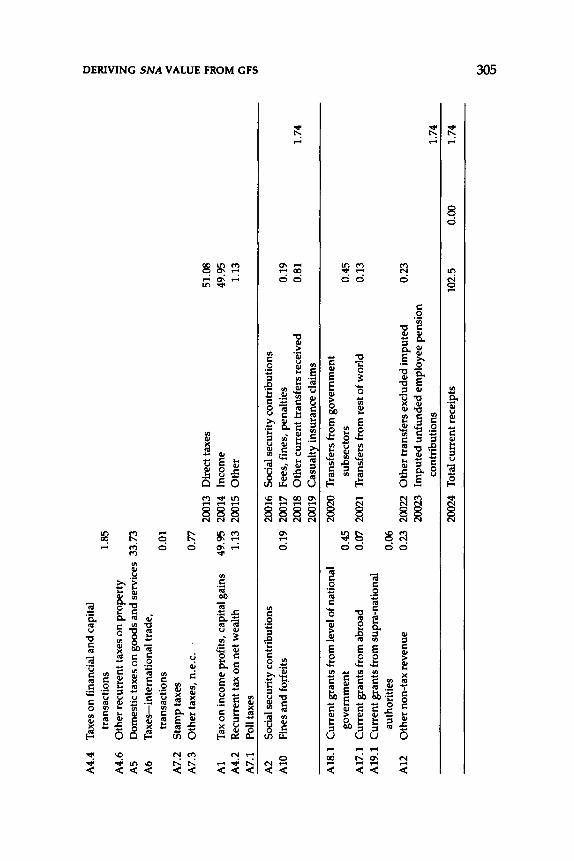
A4.
4 T
axes
on
fina
ncia
l an
d ca
pita
l 1::1
1!
1
tran
sact
ions
1.
85
2!! <
A4.
6 O
ther
rec
urre
nt ta
xes
on
pro
pert
y z
AS
Dom
esti
c ta
xes
on
goo
ds a
nd s
ervi
ces
33.7
3 C'
)
A6
Tax
es-i
nter
nati
onal
trad
e,
Ill ~
tran
sact
ions
0.
01
<
A7.
2 S
tam
p ta
xes
>
I"'
A7.
3 O
ther
taxe
s, n
.e.c
. 0.
77
c:: 1!1
2001
3 D
irec
t tax
es
51.0
8 ~
A1
Tax
on
inco
me
prof
its,
cap
ital
gai
ns
49.9
5 20
014
Inco
me
49.9
5 A
4.2
Rec
urre
nt ta
x o
n n
et w
ealt
h 1.
13
2001
5 O
ther
1.
13
== C')
A7.
1 Po
ll ta
xes
..., {II
A2
Soci
al s
ecur
ity
cont
ribu
tion
s 20
016
Soc
ial s
ecur
ity
cont
ribu
tion
s A
lO
Fin
es a
nd
for
feit
s 0.
19
2001
7 F
ees,
fin
es,
pena
ltie
s 0.
19
2001
8 O
ther
cur
rent
tran
sfer
s re
ceiv
ed
0.81
1.
74
2001
9 C
asua
lty
insu
ranc
e cl
aim
s
A 18
.1
Cur
rent
gra
nts
from
leve
l of n
atio
nal
2002
0 T
rans
fers
fro
m g
over
nmen
t go
vern
men
t 0.
45
subs
ecto
rs
0.45
A
17.1
C
urre
nt g
rant
s fr
om a
broa
d 0.
07
2002
1 T
rans
fers
fro
m r
est o
f w
orld
0.
13
A19
.1
Cur
rent
gra
nts
from
sup
ra-n
atio
nal
auth
orit
ies
0.06
A
12
Oth
er n
on-t
ax r
even
ue
0.23
20
022
Oth
er tr
ansf
ers
excl
uded
impu
ted
0.23
20
023
Impu
ted
un
fun
ded
em
ploy
ee p
ensi
on
cont
ribu
tion
s 1.
74
2002
4 T
otal
cur
rent
rec
eipt
s 10
2.5
0.00
1.
74
~
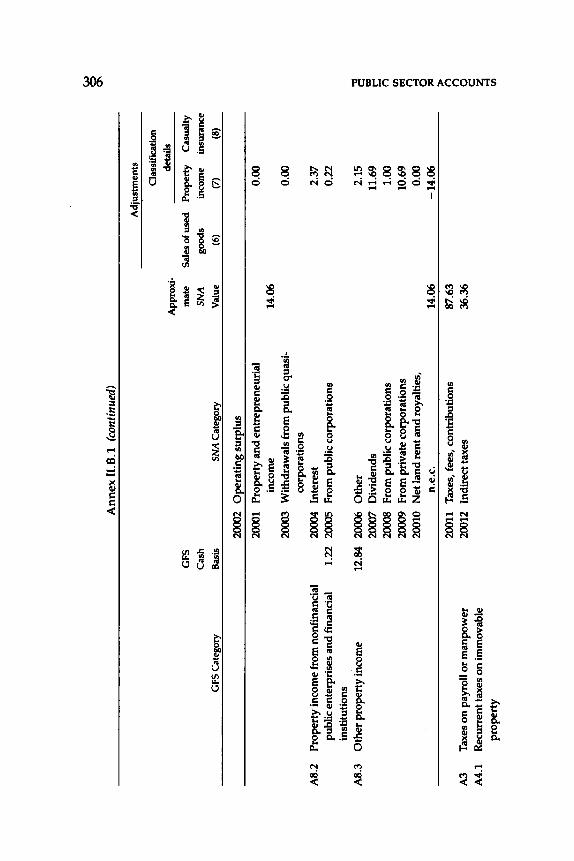
~ ~
Ann
ex 1
1.8.
1 (c
ontin
ued)
Adj
ustm
ents
Oas
sifi
cati
on
App
ro xi
· de
tail
s
GFS
m
ate
Sal
es o
f use
d P
rope
rty
Cas
ualt
y
Cas
h S
NA
go
ods
inco
me
insu
ranc
e
GFS
Cat
egor
y B
asis
S
NA
Cat
egor
y V
alue
(6
) (7
) (8
)
2000
2 O
pera
ting
sur
plus
2000
1 P
rope
rty
and
ent
repr
eneu
rial
0.
00
inco
me
14.0
6 20
003
Wit
hdra
wal
s fr
om p
ubli
c qu
asi-
0.00
co
rpor
atio
ns
A8.
2 P
rope
rty
inco
me
from
non
fina
ncia
l 20
004
Inte
rest
2.
37
publ
ic e
nter
pris
es a
nd
fina
ncia
l 1.
22
2000
5 F
rom
pub
lic
corp
orat
ions
0.
22
inst
itut
ions
A
8.3
Oth
er p
rope
rty
inco
me
12.8
4 20
006
Oth
er
2.15
~
2000
7 D
ivid
ends
11
.69
=
t:: 20
008
Fro
m p
ubli
c co
rpor
atio
ns
1.00
("
')
Ul
2000
9 F
rom
pri
vate
cor
pora
tion
s 10
.69
1!1
("')
2001
0 N
et la
nd r
ent a
nd
roy
alti
es,
0.00
d
n.e.
c.
14.0
6 -1
4.0
6
~ >
2001
1 T
axes
, fee
s, c
ontr
ibut
ions
87
.63
("')
("')
A3
Tax
es o
n p
ayro
ll o
r m
anpo
wer
20
012
Indi
rect
taxe
s 36
.36
0 c:::
A4.
1 R
ecur
rent
taxe
s o
n im
mov
able
z
prop
erty
o-
,1 Ul
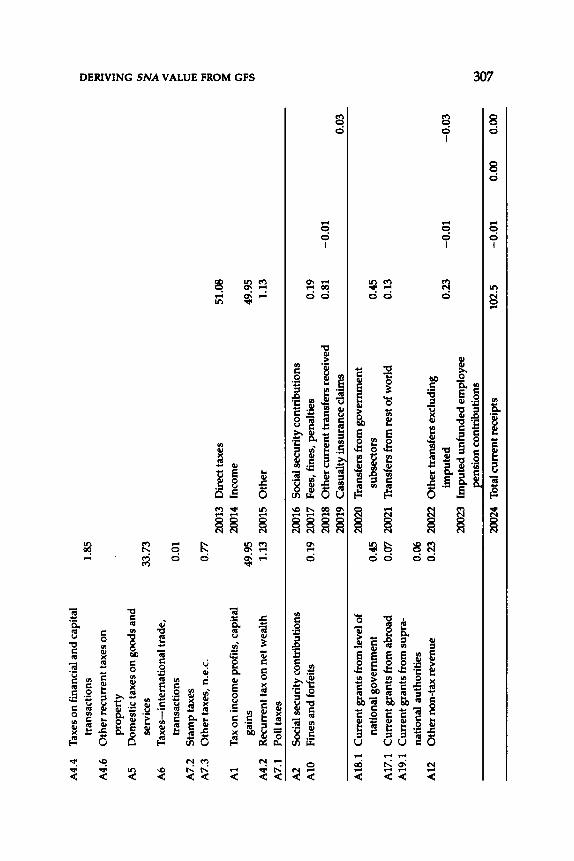
A4.
4 T
axes
on
fina
ncia
l and
cap
ital
tr
ansa
ctio
ns
1.85
0 rt
l
A4.
6 O
ther
recu
rren
t tax
es o
n
2!! <
prop
erty
z
AS
Dom
esti
c ta
xes
on
goo
ds a
nd
C1
In
serv
ices
33
.73
~ A
6 T
axes
-int
erna
tion
al tr
ade,
<
tr
ansa
ctio
ns
0.01
>
I"
' A
7.2
Sta
mp
taxe
s c:: rt
l
A7.
3 O
ther
taxe
s, n
.e.c
. 0.
77
'"II
2001
3 D
irec
t tax
es
51.0
8 ~
A1
Tax
on
inco
me
prof
its,
cap
ital
20
014
Inco
me
:: C1
gain
s 49
.95
49.9
5 '"I
I f/1
A4.
2 R
ecur
rent
tax
on
net
wea
lth
1.13
20
015
Oth
er
1.13
A
7.1
Poll
taxe
s
A2
Soci
al s
ecur
ity
cont
ribu
tion
s 20
016
Soci
al s
ecur
ity
cont
ribu
tion
s A
10
Fin
es a
nd
forf
eits
0.
19
2001
7 F
ees,
fin
es,
pena
ltie
s 0.
19
2001
8 O
ther
cur
rent
tran
sfer
s re
ceiv
ed
0.81
-0
.01
20
019
Cas
ualt
y in
sura
nce
clai
ms
0.03
A 18
.1
Cur
rent
gra
nts
from
leve
l of
2002
0 T
rans
fers
fro
m g
over
nmen
t na
tion
al g
over
nmen
t 0.
45
subs
ecto
rs
0.45
A
17.1
C
urre
nt g
rant
s fr
om a
broa
d 0.
07
2002
1 T
rans
fers
fro
m r
est o
f wor
ld
0.13
A
19.1
C
urre
nt g
rant
s fr
om s
upra
-na
tion
al a
utho
riti
es
0.06
A
12
Oth
er n
on-t
ax r
even
ue
0.23
20
022
Oth
er tr
ansf
ers
excl
udin
g im
pute
d 0.
23
-0.0
1
-0.0
3
2002
3 Im
pute
d u
nfu
nd
ed e
mpl
oyee
pe
nsio
n co
ntri
buti
ons
~
2002
4 T
otal
cur
rent
rece
ipts
10
2.5
-0.0
1
0.00
0.
00
'-J
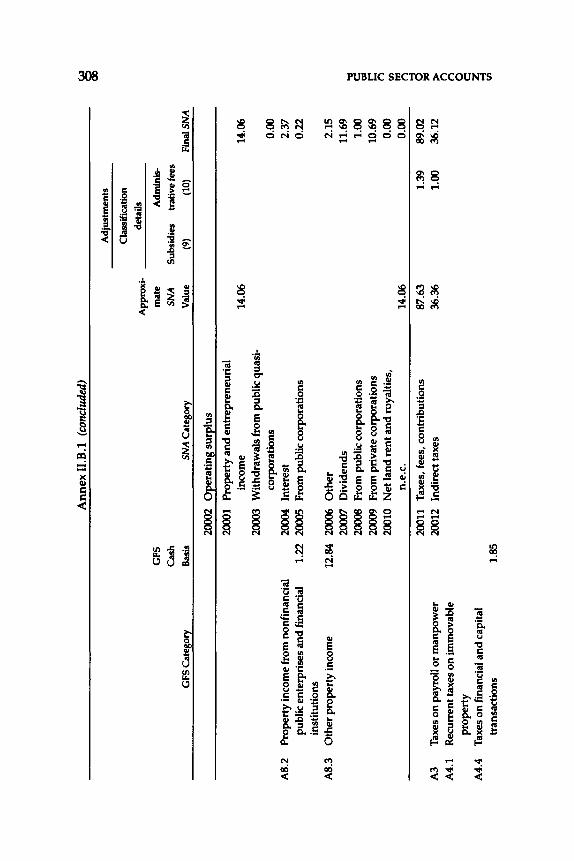
An
nex
ii.B
.l (
conc
lude
d)
~ A
djus
tmen
ts
Oas
sific
atio
n
App
roxi
-de
tails
GFS
m
ate
Adm
inis
-C
ash
SN
A
Subs
idie
s tra
tive
fees
G
FS C
ateg
ory
Bas
is S
NA
Cat
egor
y V
alue
(9
) (1
0)
Fina
lSN
A
2000
2 O
pera
ting
sur
plus
2000
1 P
rope
rty
and
ent
repr
eneu
rial
in
com
e 14
.06
14.0
6 20
003
Wit
hdra
wal
s fr
om p
ubli
c qu
asi-
corp
orat
ions
0.
00
A8.
2 P
rope
rty
inco
me
from
non
fina
ncia
l 20
004
Inte
rest
2.
37
publ
ic e
nter
pris
es a
nd fi
nanc
ial
1.22
20
005
Fro
m p
ubli
c co
rpor
atio
ns
0.22
in
stit
utio
ns
A8.
3 O
ther
pro
pert
y in
com
e 12
.84
2000
6 O
ther
2.
15
2000
7 D
ivid
ends
11
.69
2000
8 F
rom
pub
lic
corp
orat
ions
1.
00
~ 1:11
2000
9 F
rom
pri
vate
cor
pora
tion
s 10
.69
t:: 20
010
Net
land
ren
t an
d ro
yalt
ies,
0.
00
("l
(I)
n.e.
c.
14.0
6 0.
00
Ill
("l
2001
1 T
axes
, fe
es,
cont
ribu
tion
s 87
.63
1.39
89
.02
a 1:0
A3
Tax
es o
n pa
yrol
l or
man
pow
er
2001
2 ln
dire
ctta
xes
36.3
6 1.
00
36.1
2 >
A
4.1
Rec
urre
nt ta
xes
on
imm
ovab
le
("l
("l
prop
erty
0 c::
A4.
4 T
axes
on
fina
ncia
l an
d ca
pita
l z o.,
J
tran
sact
ions
1.
85
(I)
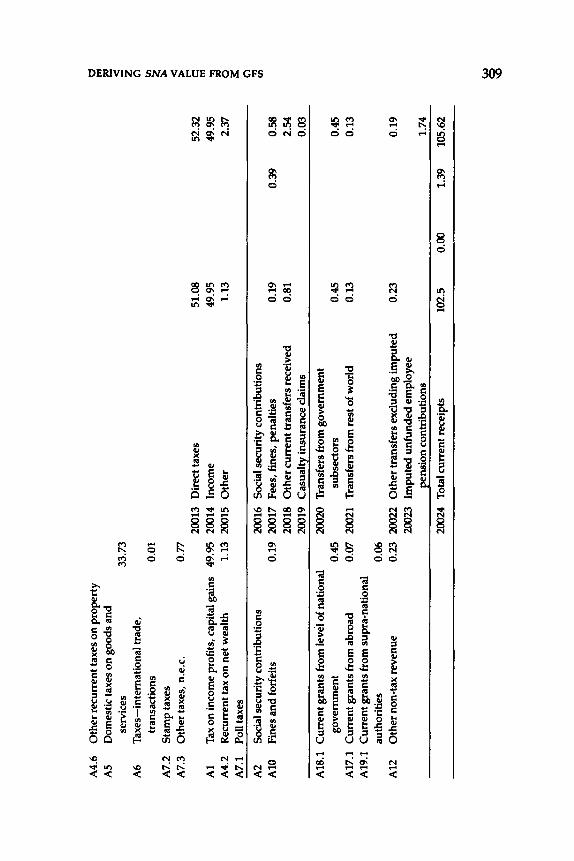
A4.
6 O
ther
recu
rren
t tax
es o
n pr
oper
ty
c !!I
AS
Dom
esti
c ta
xes
on g
oods
and
25!
se
rvic
es
33.7
3 <
z A
6 T
axes
-int
erna
tion
al tr
ade,
C'
)
tran
sact
ions
0.
01
Ill
A7.
2 S
tam
p ta
xes
~ <
A7.
3 O
ther
taxe
s, n
.e.c
. 0.
77
>
2001
3 D
irec
t tax
es
I"'
51.0
8 52
.32
c:: !!I
Al
Tax
on in
com
e pr
ofit
s, c
apit
al g
ains
49
.95
2001
4 In
com
e 49
.95
49.9
5 '"
A4.
2 R
ecur
rent
tax
on
net
wea
lth
1.13
20
015
Oth
er
1.13
2.
37
~ A
7.1
Poll
taxe
s ::: C'
)
A2
Soci
al s
ecur
ity
cont
ribu
tion
s 20
016
Soci
al s
ecur
ity
cont
ribu
tion
s '" r.n
A
10
Fine
s an
d fo
rfei
ts
0.19
20
017
Fees
, fin
es,
pena
ltie
s 0.
19
0.39
0.
58
2001
8 O
ther
cur
rent
tran
sfer
s re
ceiv
ed
0.81
2.
54
2001
9 Casualt~ i
nsur
ance
cla
ims
0.03
A 18
.1
Cur
rent
gra
nts
from
leve
l of n
atio
nal
2002
0 T
rans
fers
fro
m g
over
nmen
t go
vern
men
t 0.
45
subs
ecto
rs
0.45
0.
45
A 17
.1
Cur
rent
gra
nts
from
abr
oad
0.07
20
021
Tra
nsfe
rs fr
om r
est o
f w
orld
0.
13
0.13
A
19.1
C
urre
nt g
rant
s fr
om s
upra
-nat
iona
l au
thor
itie
s 0.
06
A12
O
ther
non
-tax
rev
enue
0.
23
2002
2 O
ther
tran
sfer
s ex
clud
ing
impu
ted
0.23
0.
19
2002
3 Im
pute
d un
fund
ed e
mpl
oyee
pe
nsio
n co
ntri
buti
ons
1.74
2002
4 T
otal
cur
rent
rece
ipts
10
2.5
0.00
1.
39
105.
62
~
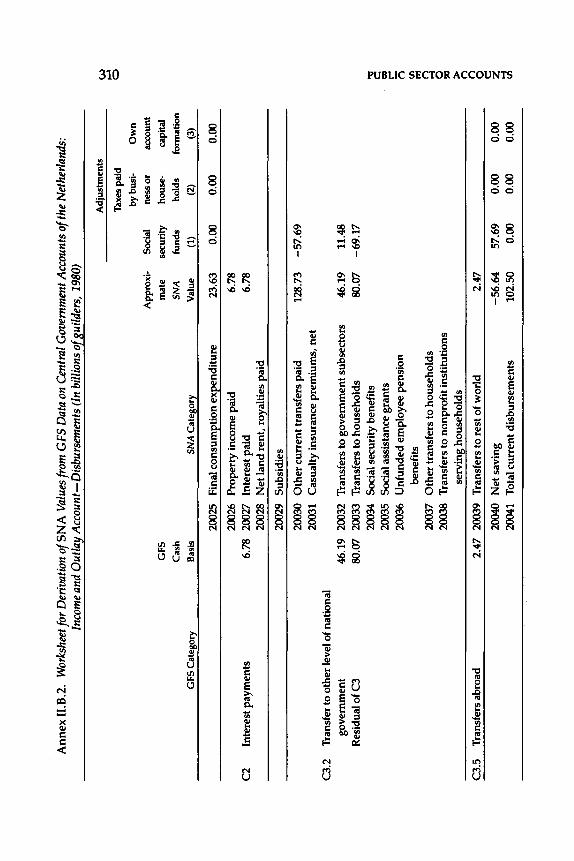
An
nex
11.
8.2.
W
orks
heet
for
Der
ivat
ion
ofS
NA
Val
ues
from
GFS
Dat
a on
Cen
tral
Gov
ernm
ent A
ccou
nts
of th
e N
ethe
rlan
ds:
Inco
me
and
Outla
'!f_
Acc
ount
-Dis
burs
emen
ts (I
n bi
llion
s o[
s.uild
ers,
1980
)
Adj
ustm
ents
V
l .....
Tax
es p
aid
0
bybu
si-
Ow
n
App
roxi
-So
cial
ne
ss o
r ac
coun
t
GFS
m
ate
secu
rity
ho
use-
capi
tal
Cas
h S
NA
fu
nds
hold
s fo
rmat
ion
GFS
Cat
egor
y B
asis
S
NA
Cat
egor
y V
alue
(1
) (2
) (3
)
2002
5 F
inal
con
sum
ptio
n ex
pend
itur
e 23
.63
0.00
0.
00
0.00
2002
6 P
rope
rty
inco
me
paid
6.
78
C2
Inte
rest
pay
men
ts
6.78
20
027
Inte
rest
pai
d 6.
78
2002
8 N
et la
nd r
ent,
roy
alti
es p
aid
2002
9 S
ubsi
dies
2003
0 O
ther
cur
rent
tran
sfer
s pa
id
128.
73
-57
.69
20
031
Cas
ualt
y in
sura
nce
prem
ium
s, n
et
C3.
2 T
rans
fer
to o
ther
leve
l of n
atio
nal
gove
rnm
ent
46.1
9 20
032
Tra
nsfe
rs to
gov
ernm
ent s
ubse
ctor
s 46
.19
11.4
8 R
esid
ual o
f C3
80.0
7 20
033
Tra
nsfe
rs to
hou
seho
lds
80.0
7 -6
9.1
7
2003
4 S
ocia
l sec
urit
y be
nefi
ts
~ 20
035
Soc
ial a
ssis
tanc
e gr
ants
=
r"
' 20
036
Un
fun
ded
em
ploy
ee p
ensi
on
n be
nefi
ts
f/1
Ill
2003
7 O
ther
tran
sfer
s to
hou
seho
lds
(") ~
2003
8 T
rans
fers
to n
onpr
ofit
inst
itut
ions
0 "'
serv
ing
hous
ehol
ds
>
(")
C3.
5 T
rans
fers
abr
oad
2.47
20
039
Tra
nsfe
rs to
res
t of w
orld
2.
47
(") 0
2004
0 N
et s
avin
g 57
.69
0.00
0.
00
c:: -5
6.6
4
z ~ 20
041
Tot
al c
urre
nt d
isbu
rsem
ents
10
2.50
0.
00
0.00
0.
00
f/1
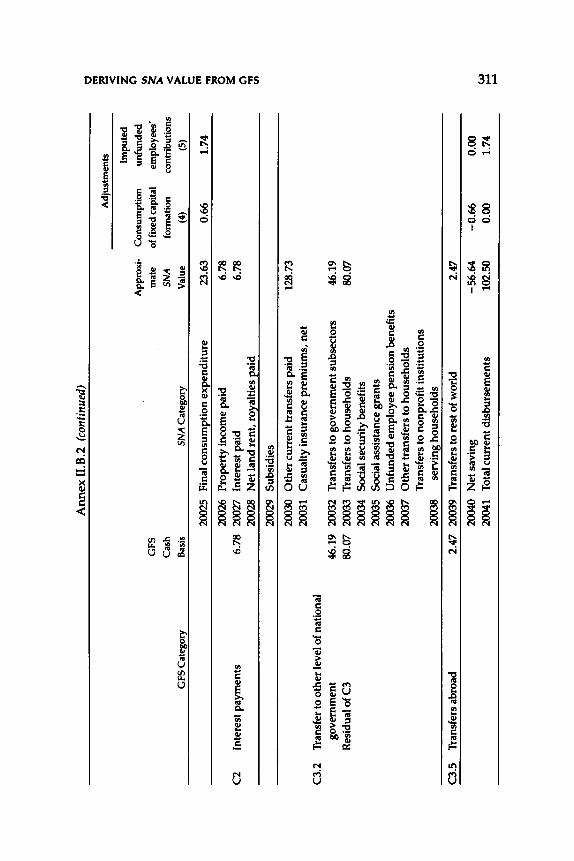
Ann
ex 1
1.8.
2 (c
ontin
ued)
0 tt
l A
djus
tmen
ts
2!! <
Impu
ted
z A
ppro
xi-
Con
sum
ptio
n un
fund
ed
C1
Ill
GFS
m
ate
of fi
xed
capi
tal
empl
oyee
s' ~
Cas
h S
NA
fo
rmat
ion
cont
ribut
ions
<
G
FS C
ateg
ory
Bas
is S
NA
Cat
egor
y V
alue
(4
) (5
) >
I"
" c:: 20
025
Fina
l con
sum
ptio
n ex
pend
itur
e 23
.63
0.66
1.
74
ttl
'II
2002
6 P
rope
rty
inco
me
paid
6.
78
~ C
2 In
tere
st p
aym
ents
6.
78
2002
7 In
tere
st p
aid
6.78
=:::
C1
20
028
Net
land
ren
t, r
oyal
ties
pai
d 'I
I U
l
2002
9 S
ubsi
dies
2003
0 O
ther
cur
rent
tran
sfer
s pa
id
128.
73
2003
1 C
asua
lty
insu
ranc
e pr
emiu
ms,
net
C
3.2
Tra
nsfe
r to
oth
er le
vel o
f na
tion
al
gove
rnm
ent
46.1
9 20
032
Tra
nsfe
rs to
gov
ernm
ent s
ubse
ctor
s 46
.19
Res
idua
l of C
3 80
.07
2003
3 T
rans
fers
to h
ouse
hold
s 80
.07
2003
4 So
cial
sec
urit
y be
nefi
ts
2003
5 So
cial
ass
ista
nce
gran
ts
2003
6 U
nfun
ded
empl
oyee
pen
sion
ben
efit
s 20
037
Oth
er tr
ansf
ers
to h
ouse
hold
s T
rans
fers
to n
onpr
ofit
inst
itut
ions
20
038
serv
ing
hous
ehol
ds
C3.
5 T
rans
fers
abr
oad
2.47
20
039
Tra
nsfe
rs to
res
t of
wor
ld
2.47
2004
0 N
et s
avin
g -5
6.64
-0
.66
0.
00
2004
1 T
otal
cur
rent
dis
burs
emen
ts
102.
50
0.00
1.
74
VJ .... ....
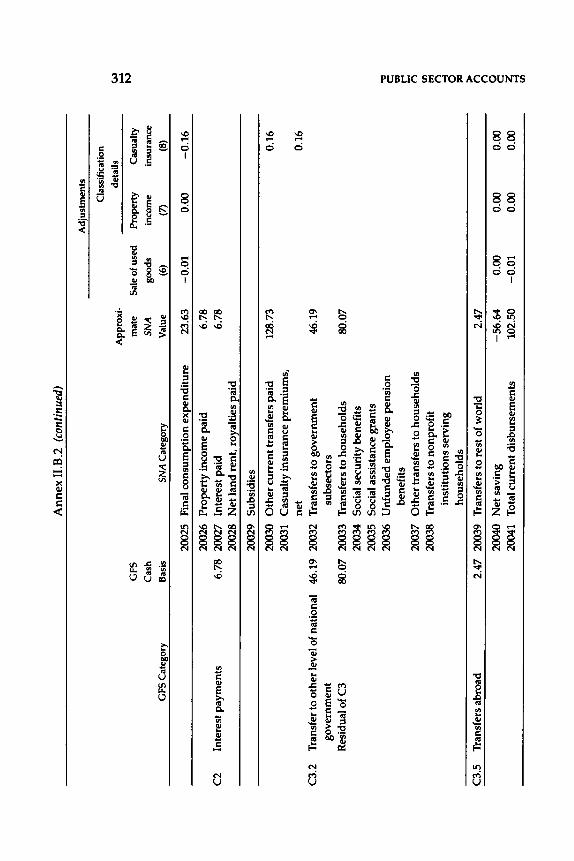
Ann
ex 1
1.8.
2 (c
ontin
ued)
Adj
ustm
ents
Cla
ssif
icat
ion
App
roxi
-de
tail
s w
.... G
FS
mat
e Sa
le o
f use
d P
rope
rty
Cas
ualt
y .....
,
Cas
h S
NA
go
ods
inco
me
insu
ranc
e G
FS C
ateg
ory
Bas
is
SN
A C
ateg
ory
Val
ue
(6)
(7)
(8)
2002
5 Fi
nal c
onsu
met
ion
expe
ndit
ure
23.6
3 -0
.01
0.
00
-0.1
6
2002
6 P
rope
rty
inco
me
paid
6.
78
C2
Inte
rest
pay
men
ts
6.78
20
027
Inte
rest
pai
d 6.
78
2002
8 N
et la
nd r
ent,
roy
alti
es p
aid
2002
9 S
ubsi
dies
2003
0 O
ther
cur
rent
tran
sfer
s pa
id
128.
73
0.16
20
031
Cas
ualt
y in
sura
nce
prem
ium
s,
net
0.
16
C3.
2 T
rans
fer
to o
ther
leve
l of
nati
onal
46
.19
2003
2 T
rans
fers
to g
over
nmen
t 46
.19
gove
rnm
ent
subs
ecto
rs
Res
idua
l of C
3 80
.07
2003
3 T
rans
fers
to h
ouse
hold
s 80
.07
2003
4 So
cial
sec
urit
y be
nefi
ts
2003
5 So
cial
ass
ista
nce
gran
ts
2003
6 U
nfun
ded
empl
oyee
pen
sion
~
bene
fits
=
!:
20
037
Oth
er tr
ansf
ers
to h
ouse
hold
s n
2003
8 T
rans
fers
to n
onpr
ofit
1
/)
!!I n
inst
itut
ions
ser
ving
--1
0
hous
ehol
ds
~
C3.
5 T
rans
fers
abr
oad
2.47
20
039
Tra
nsfe
rs to
res
t of
wor
ld
>
2.47
n n
2004
0 N
et s
avin
g -5
6.6
4
0.00
0.
00
0.00
0 c::
2004
1 T
otal
cur
rent
dis
burs
emen
ts
102.
50
-0,0
1
0.00
0.
00
z --1
1/)
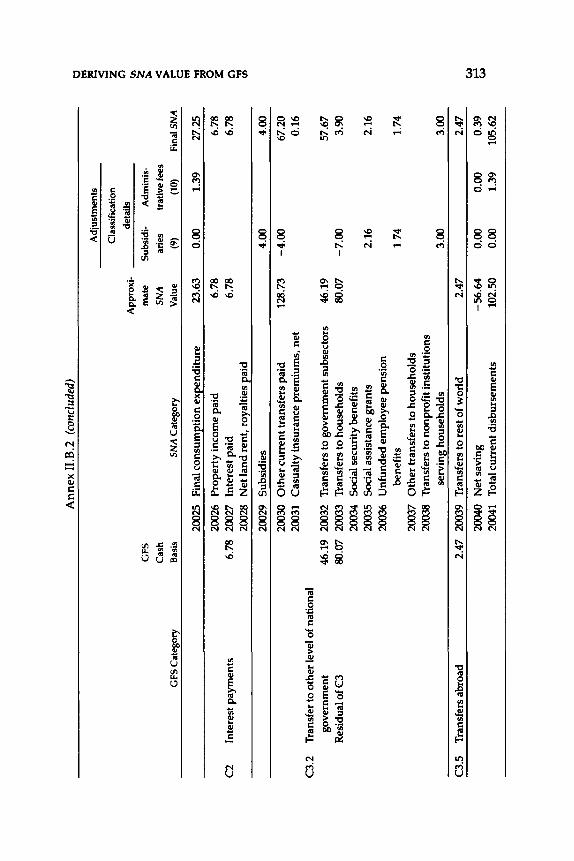
An
nex
11.
8.2
(con
clud
ed)
t:l
1!1
Adj
ustm
ents
2!!
<
Cla
ssif
icat
ion
z de
tail
s C"
l A
ppro
xi-
Ill
GF
S
mat
e S
ubsi
di-
Adm
inis
-~
Cas
h S
NA
ar
ies
trat
ive
fees
<
>
GFS
Cat
egor
y B
asis
S
NA
Cat
egor
y V
alue
(9
) (1
0)
Fin
aiS
NA
E
1!
1 20
025
Fina
l consum~tion e
xpen
ditu
re
23.6
3 0.
00
1.39
27
.25
'" 20
026
Pro
pert
y in
com
e pa
id
6.78
6.
78
~ =::::
C2
Inte
rest
pay
men
ts
6.78
20
027
Inte
rest
pai
d 6.
78
6.78
C"
l 20
028
Net
land
ren
t, r
oyal
ties
pai
d '" U
)
2002
9 S
ubsi
dies
4.
00
4.00
2003
0 O
ther
cur
rent
tran
sfer
s pa
id
128.
73
-4.0
0
67.2
0 20
031
Cas
ualt
y in
sura
nce
prem
ium
s, n
et
0.16
C
3.2
Tra
nsfe
r to
oth
er le
vel o
f na
tion
al
gove
rnm
ent
46.1
9 20
032
Tra
nsfe
rs to
gov
ernm
ent s
ubse
ctor
s 46
.19
57.6
7 R
esid
ual o
f C3
80.0
7 20
033
Tra
nsfe
rs to
hou
seho
lds
80.0
7 -7
.00
3.
90
2003
4 So
cial
sec
urit
y be
nefi
ts
2003
5 So
cial
ass
ista
nce
gran
ts
2.16
2.
16
2003
6 U
nfun
ded
empl
oyee
pen
sion
be
nefi
ts
1.74
1.
74
2003
7 O
ther
tran
sfer
s to
hou
seho
lds
2003
8 T
rans
fers
to n
onpr
ofit
inst
itut
ions
se
rvin
g ho
useh
olds
3.
00
3.00
C3.
5 T
rans
fers
abr
oad
2.47
20
039
Tra
nsfe
rs to
res
t of
wor
ld
2.47
2.
47
UJ
2004
0 N
et s
avin
g -5
6.6
4
0.00
0.
00
0.39
~
UJ
2004
1 T
otal
cur
rent
dis
burs
emen
ts
102.
50
0.00
1.
39
105.
62
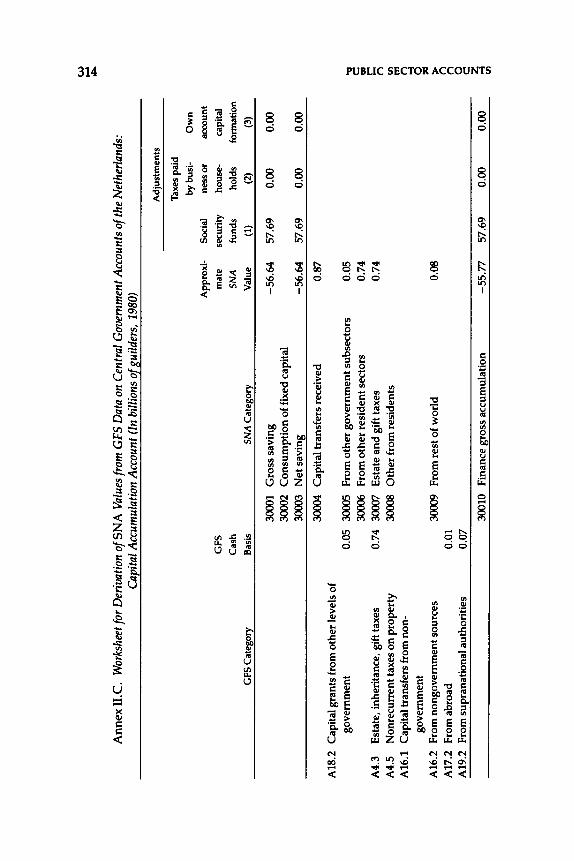
UJ .... ,.
Ann
ex II
. C.
Wor
kshe
et fo
r D
eriv
atio
n o
fSN
A V
alue
s fro
m G
FS D
ata
on C
entr
al G
over
nmen
t Acc
ount
s of
the
Net
herl
ands
: C
apita
l Acc
umul
atio
n A
ccou
nt (I
n bi
llion
s o[
s.uild
ers,
1980
)
Adj
ustm
ents
Tax
es p
aid
bybu
si-
Ow
n
App
roxi
-So
cial
ne
ss o
r ac
coun
t
GFS
m
ate
secu
rity
ho
use-
capi
tal
Cas
h S
NA
fu
nds
hold
s fo
rmat
ion
GFS
Cat
egor
y B
asis
S
NA
Cat
egor
y V
alue
(1
) (2
) (3
)
3000
1 G
ross
sav
ing
-56
.64
57
.69
0.00
0.
00
3000
2 C
onsu
mpt
ion
of fi
xed
capi
tal
3000
3 N
et s
avin
g -5
6.6
4
57.6
9 0.
00
0.00
3000
4 C
apit
al tr
ansf
ers
rece
ived
0.
87
A18
.2
Cap
ital
gra
nts
from
oth
er le
vels
of
gove
rnm
ent
0.05
30
005
Fro
m o
ther
gov
ernm
ent
subs
ecto
rs
0.05
"'
I
3000
6 F
rom
oth
er r
esid
ent s
ecto
rs
0.74
c:: al
A4.
3 E
stat
e, i
nher
itan
ce, g
ift t
axes
0.
74
3000
7 E
stat
e an
d gi
ft ta
xes
0.74
I:"
' ?i
A4.
5 N
onre
curr
ent t
axes
on
pro
pert
y 30
008
Oth
er fr
om r
esid
ents
Il
l !!
I A
16.1
C
apit
al tr
ansf
ers
from
non
-n
gove
rnm
ent
d :;o
A16
.2
Fro
m n
ongo
vern
men
t sou
rces
30
009
Fro
m r
est o
f w
orld
0.
08
>
A17
.2
Fro
m a
broa
d O.
Ql
n n A
19.2
Fr
om s
upra
nati
onal
aut
hori
ties
0.
07
0 c:: 30
010
Fin
ance
gro
ss a
ccum
ulat
ion
-55
.77
57
.69
0.00
0.
00
z ~ Ill
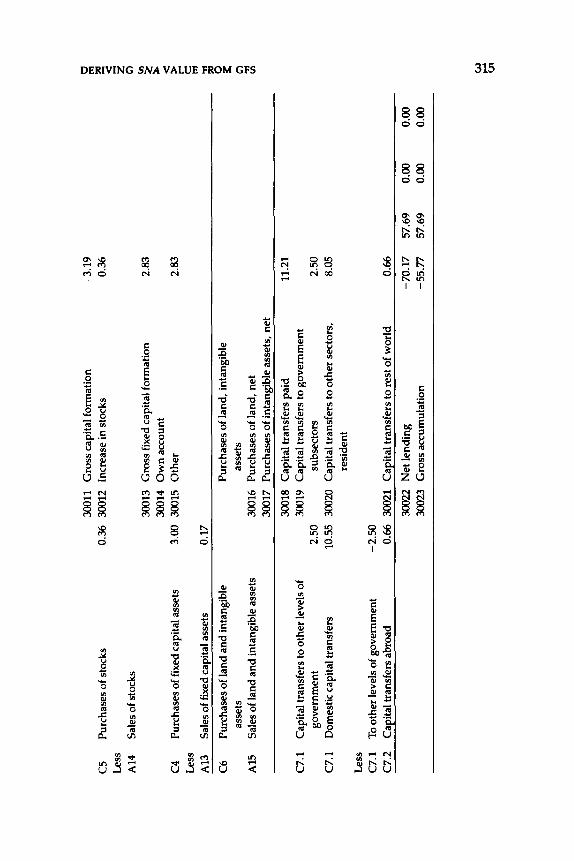
3001
1 G
ross
cap
ital
for
mat
ion
3.19
l:::
l rt
!
C5
Pur
chas
es o
f st
ocks
0.
36
3001
2 In
crea
se in
sto
cks
0.36
2!! <
L
ess
z A
14
Sal
es o
f st
ocks
C
')
3001
3 G
ross
fixe
d ca
pita
l fo
rmat
ion
2.83
II
) ~ 30
014
Ow
n a
ccou
nt
<
C4
Pur
chas
es o
f fi
xed
capi
tal a
sset
s 3.
00
3001
5 O
ther
2.
83
>
r"
Les
s c::
rt
! A
13
Sal
es o
f fix
ed c
apit
al a
sset
s 0.
17
"" C
6 P
urch
ases
of l
and
and
inta
ngib
le
Pur
chas
es o
f la
nd,
inta
ngib
le
~ 3:
asse
ts
asse
ts
C')
A15
S
ales
of
land
and
inta
ngib
le a
sset
s 30
016
Pur
chas
es o
f la
nd,
net
"" Vl 30
017
Pur
chas
es o
f in
tang
ible
ass
ets,
net
3001
8 C
apit
al tr
ansf
ers
paid
11
.21
C7.
1 C
apit
al t
rans
fers
to o
ther
leve
ls o
f 30
019
Cap
ital
tran
sfer
s to
gov
ernm
ent
gove
rnm
ent
2.50
su
bsec
tors
2.
50
C7.
1 D
omes
tic
capi
tal t
rans
fers
10
.55
3002
0 C
apit
al tr
ansf
ers
to o
ther
sec
tors
, 8.
05
resi
dent
L
ess
C7.
1 To
oth
er le
vels
of
gove
rnm
ent
-2.5
0
C7.
2 C
apit
al tr
ansf
ers
abro
ad
0.66
30
021
Cap
ital
tran
sfer
s to
res
t of w
orld
0.
66
3002
2 N
et le
ndin
g -7
0.1
7
57.6
9 0.
00
0.00
30
023
Gro
ss a
ccum
ulat
ion
-55
.77
57
.69
0.00
0.
00
VJ ~
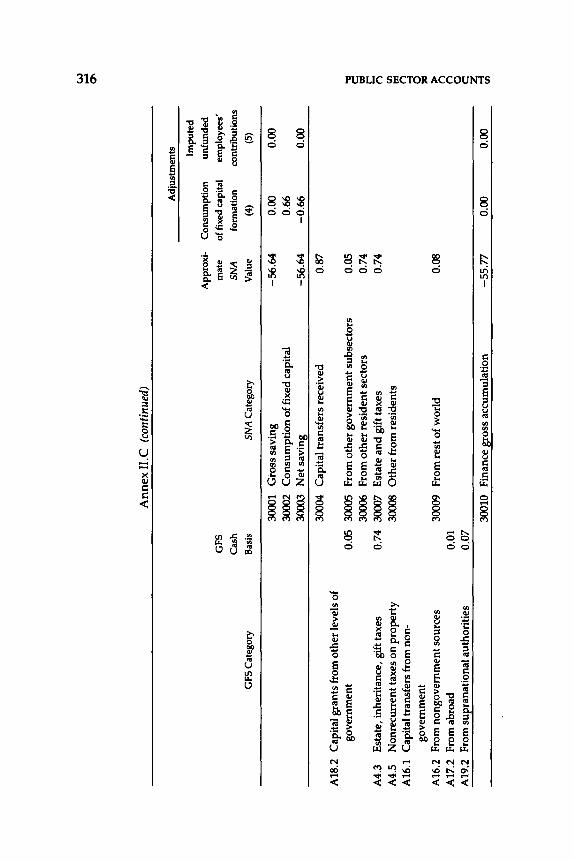
Ann
ex II
.C (
cont
inue
d)
GF
S
Cas
h G
FS
Cat
egor
y B
asis
SN
A C
ateg
ory
3000
1 G
ross
sav
ing
3000
2 C
onsu
mpt
ion
of fi
xed
capi
tal
3000
3 N
et s
avin
g
3000
4 C
apit
al tr
ansf
ers
rece
ived
A
18.2
C
apit
al g
rant
s fr
om o
ther
leve
ls o
f go
vern
men
t 0.
05
3000
5 F
rom
oth
er g
over
nmen
t sub
sect
ors
3000
6 F
rom
oth
er r
esid
ent s
ecto
rs
A4.
3 E
stat
e, i
nher
itan
ce,
gift
taxe
s 0.
74
3000
7 E
stat
e an
d g
ift t
axes
A
4.5
Non
recu
rren
t tax
es o
n pr
oper
ty
3000
8 O
ther
from
res
iden
ts
A16
.1
Cap
ital
tra
nsfe
rs f
rom
non
-go
vern
men
t A
16.2
F
rom
non
gove
rnm
ent s
ourc
es
3000
9 F
rom
res
t of w
orld
A
17.2
F
rom
abr
oad
0.01
A
19.2
F
rom
sup
rana
tion
al a
utho
riti
es
0.07
3001
0 F
inan
ce g
ross
acc
umul
atio
n
App
roxi
-m
ate
SN
A
Val
ue
-56
.64
-56
.64
0.87
0.05
0.
74
0.74
0.08
-55
.77
Adj
ustm
ents
Impu
ted
Con
sum
ptio
n un
fund
ed
of fi
xed
capi
tal
empl
oyee
s' fo
rmat
ion
cont
ribu
tions
(4
) (5
)
0.00
0.
00
0.66
-0
.66
0.
00
0.00
0.
00
w ~
0"1 ~ ell t: n Ill
Ill n -,I 0 )11:1 >
n n 0 c:: z -,I
Ill
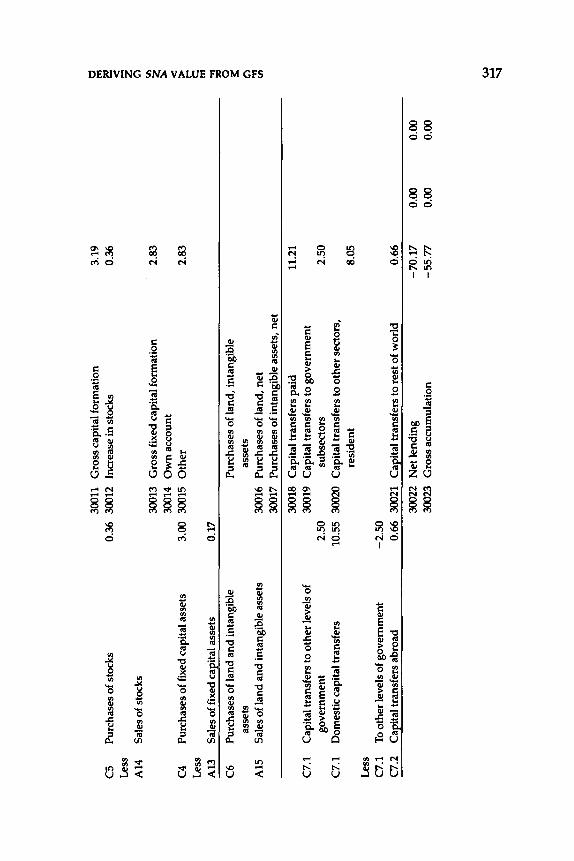
C5
Pur
chas
es o
f st
ocks
L
ess
A14
Sa
les
of s
tock
s
C4
Pur
chas
es o
f fi
xed
capi
tal a
sset
s L
ess
A13
S
ales
of f
ixed
cap
ital
ass
ets
C6
Pur
chas
es o
f lan
d an
d in
tang
ible
as
sets
A
15
Sale
s of
land
and
inta
ngib
le a
sset
s
C7.
1 C
apit
al tr
ansf
ers
to o
ther
leve
ls o
f go
vern
men
t C
7.1
Dom
esti
c ca
pita
l tra
nsfe
rs
Les
s C
7.1
To o
ther
leve
ls o
f gov
ernm
ent
C7.
2 C
apit
al tr
ansf
ers
abro
ad
3001
1 G
ross
cap
ital
for
mat
ion
0.36
30
012
Incr
ease
in s
tock
s
3001
3 G
ross
fixe
d ca
pita
l for
mat
ion
3001
4 O
wn
acc
ount
3.
00
3001
5 O
ther
0.17
Pur
chas
es o
f la
nd,
inta
ngib
le
asse
ts
3001
6 P
urch
ases
of l
and,
net
30
017
Pur
chas
es o
f in
tang
ible
ass
ets,
net
3001
8 C
apit
al t
rans
fers
pai
d 30
019
Cap
ital
tran
sfer
s to
gov
ernm
ent
2.50
su
bsec
tors
10
.55
3002
0 C
apit
al tr
ansf
ers
to o
ther
sec
tors
, re
side
nt
-2.5
0
0.66
30
021
Cap
ital
tran
sfer
s to
res
t of w
orld
3002
2 N
et le
ndin
g 30
023
Gro
ss a
ccum
ulat
ion
3.19
0.
36
2.83
2.83
11.2
1
2.50
8.05
0.66
-70
.17
0.
00
-55
.77
0.
00
0.00
0.
00
0 1!1 2!! < z G1
Ill ~ < > E
1!1
"'I ~ 3:
G1
"'I en
(JJ .... "'
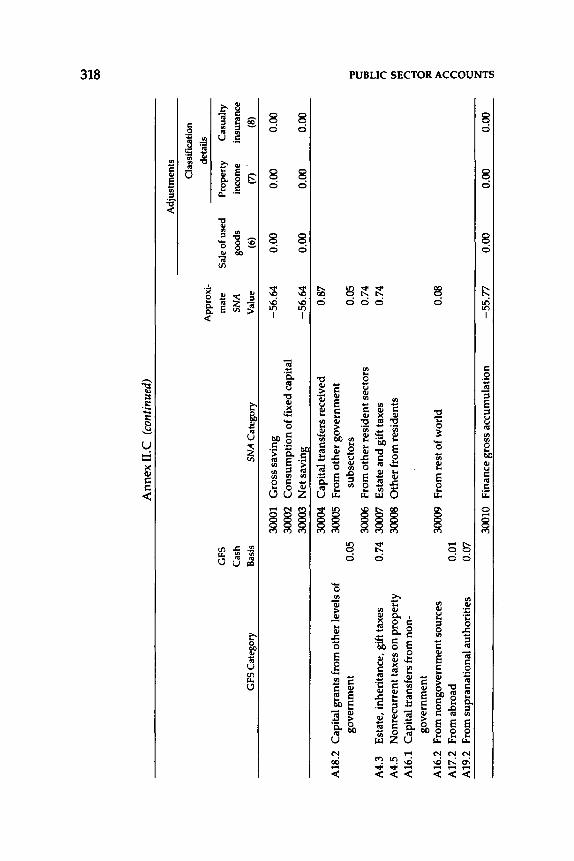
Ann
ex I
I.C
(co
ntin
ued)
GFS
C
ash
GFS
Cat
egor
y B
asis
S
NA
Cat
egor
y
3000
1 G
ross
sav
ing
3000
2 C
on
sum
pti
on
of
fixe
d ca
pita
l 30
003
Net
sav
ing
3000
4 C
apit
al t
rans
fers
rec
eive
d A
18.2
C
apit
al g
rant
s fr
om o
ther
leve
ls o
f 30
005
Fro
m o
ther
go
ver
nm
ent
gove
rnm
ent
0.05
su
bsec
tors
30
006
Fro
m o
ther
res
iden
t sec
tors
A
4.3
Est
ate,
inh
erit
ance
, gi
ft t
axes
0.
74
3000
7 E
stat
e an
d g
ift t
axes
A
4.5
Non
recu
rren
t tax
es o
n p
rop
erty
30
008
Oth
er fr
om r
esid
ents
A
16.1
C
apit
al t
rans
fers
fro
m n
on-
gove
rnm
ent
A16
.2
Fro
m n
ongo
vern
men
t sou
rces
30
009
Fro
m r
est o
f w
orld
A
17.2
F
rom
abr
oad
0.01
A
19.2
F
rom
sup
rana
tion
al a
utho
riti
es
0.07
3001
0 F
inan
ce g
ross
acc
umul
atio
n
App
roxi
-m
ate
Sale
of u
sed
SN
A
good
s V
alue
(6
)
-56
.64
0.
00
-56
.64
0.
00
0.87
0.05
0.
74
0.74
0.08
-55
.77
0.
00
Adj
ustm
ents
Cla
ssifi
catio
n de
tails
Prop
erty
C
asua
lty
inco
me
insu
ranc
e (7
) (8
)
0.00
0.
00
0.00
0.
00
0.00
0.
00
w
......
00
~ =
!:
n !/)
rt! n o-,1 0 ~ >
n n 0 c: z o-,1
Ul
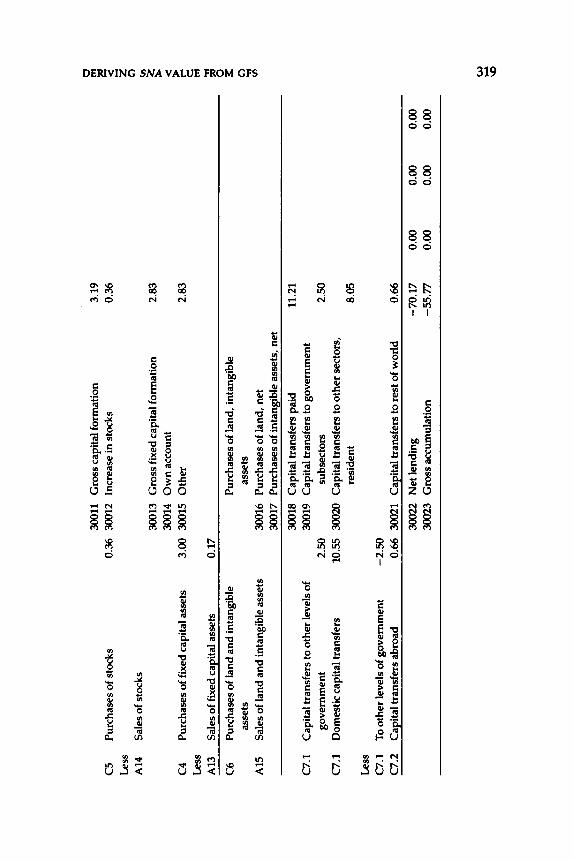
C5
Pur
chas
es o
f st
ocks
L
ess
A14
S
ales
of
stoc
ks
C4
Pur
chas
es o
f fix
ed c
apit
al a
sset
s L
ess
A13
S
ales
of
fixe
d ca
pita
l ass
ets
C6
Pur
chas
es o
f lan
d an
d in
tang
ible
as
sets
A
15
Sal
es o
f la
nd a
nd in
tang
ible
ass
ets
C7.
1 C
apit
al tr
ansf
ers
to o
ther
leve
ls o
f go
vern
men
t C
7.1
Dom
esti
c ca
pita
l tra
nsfe
rs
Les
s C
7.1
To o
ther
leve
ls o
f gov
ernm
ent
C7.
2 C
apit
al tr
ansf
ers
abro
ad
3001
1 G
ross
cap
ital
for
mat
ion
0.36
30
012
Incr
ease
in s
tock
s
3001
3 G
ross
fixe
d ca
pita
l for
mat
ion
3001
4 O
wn
acc
ount
3.
00
3001
5 O
ther
0.17
Pur
chas
es o
f lan
d, i
ntan
gibl
e as
sets
30
016
Pur
chas
es o
f lan
d, n
et
3001
7 P
urch
ases
of
inta
ngib
le a
sset
s, n
et
3001
8 C
apit
al tr
ansf
ers
paid
30
019
Cap
ital
tran
sfer
s to
gov
ernm
ent
2.50
su
bsec
tors
10
.55
3002
0 C
apit
al tr
ansf
ers
to o
ther
sec
tors
, re
side
nt
-2.5
0
0.66
30
021
Cap
ital
tran
sfer
s to
res
t of w
orld
3002
2 N
et le
ndin
g 30
023
Gro
ss a
ccum
ulat
ion
3.19
0.
36
2.83
2.83
11.2
1
2.50
8.05
0.66
-70
.17
0.
00
-55
.77
0.
00
0.00
0.
00
0.00
0.
00
0 I'll 2!! < z Cl
In ~ <
> E
I'll
'"rl ~ =:: Cl
'"rl
1/)
w .... \C)
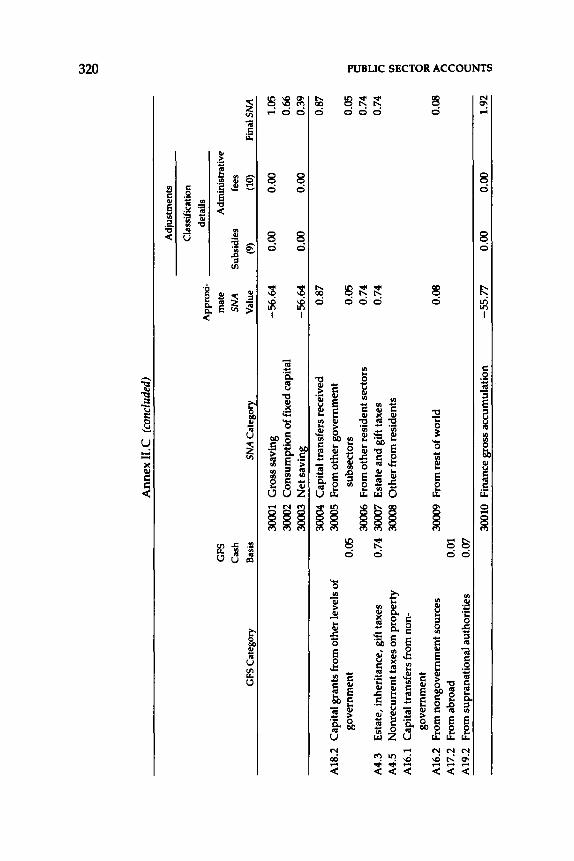
~
Ann
ex II
.C (
conc
lude
d)
Adj
ustm
ents
Cla
ssifi
catio
n
App
roxi
-de
tails
GFS
m
ate
Adm
inis
trat
ive
Cas
h S
NA
Su
bsid
ies
fees
G
FS C
ateg
ory
Bas
is
SN
A C
ateg
ory
Val
ue
(9)
(10)
Fi
nalS
NA
3000
1 G
ross
sav
ing
-56
.64
0.
00
0.00
1.
05
3000
2 C
onsu
mpt
ion
of fi
xed
capi
tal
0.66
30
003
Net
sav
ing
-56
.64
0.
00
0.00
0.
39
3000
4 C
apit
al tr
ansf
ers
rece
ived
0.
87
0.87
A
18.2
C
apit
al g
rant
s fr
om o
ther
leve
ls o
f 30
005
Fro
m o
ther
gov
ernm
ent
gove
rnm
ent
0.05
su
bsec
tors
0.
05
0.05
~
3000
6 F
rom
oth
er r
esid
ent s
ecto
rs
0.74
0.
74
=
A4.
3 E
stat
e, i
nher
itan
ce,
gift
taxe
s 0.
74
3000
7 E
stat
e an
d g
ift t
axes
0.
74
0.74
c n
A4.
5 N
onre
curr
ent t
axes
on
prop
erty
30
008
Oth
er fr
om r
esid
ents
1.1
1 1!
1 A
16.1
C
apit
al t
rans
fers
fro
m n
on-
n -l
gove
rnm
ent
0 "' A
16.2
F
rom
non
gove
rnm
ent s
ourc
es
3000
9 F
rom
res
t of w
orld
0.
08
0.08
>
n
A17
.2
Fro
m a
broa
d 0.
01
n A
19.2
F
rom
sup
rana
tion
al a
utho
riti
es
0.07
0 e
3001
0 F
inan
ce g
ross
acc
umul
atio
n 0.
00
0.00
1.
92
z -5
5.7
7
-l
1.11
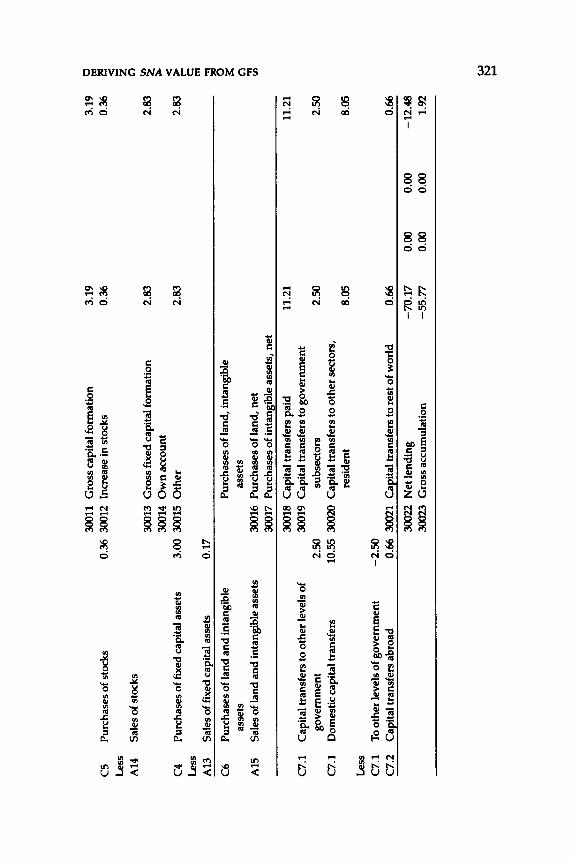
3001
1 G
ross
cap
ital
for
mat
ion
3.19
3.
19
0 !!I
C5
Pur
chas
es o
f sto
cks
0.36
30
012
Incr
ease
in s
tock
s 0.
36
0.36
2!! <
L
ess
z A
14
Sal
es o
f sto
cks
C'l
3001
3 G
ross
fixe
d ca
pita
l for
mat
ion
2.83
2.
83
In
3001
4 O
wn
acc
ount
~
Pur
chas
es o
f fi
xed
capi
tal a
sset
s 3.
00
3001
5 O
ther
<
C
4 2.
83
2.83
>
L
ess
E
!!I
A13
S
ales
of
fixe
d ca
pita
l ass
ets
0.17
"'
I
C6
Pur
chas
es o
f lan
d an
d in
tang
ible
P
urch
ases
of
land
, in
tang
ible
~ :::
asse
ts
asse
ts
C'l
A15
S
ales
of
land
and
inta
ngib
le a
sset
s 30
016
Pur
chas
es o
f la
nd,
net
"'I
<JI
3001
7 P
urch
ases
of
inta
ngib
le a
sset
s, n
et
3001
8 C
apit
al tr
ansf
ers
paid
11
.21
11.2
1 C
7.1
Cap
ital
tran
sfer
s to
oth
er le
vels
of
3001
9 C
apit
al tr
ansf
ers
to g
over
nmen
t go
vern
men
t 2.
50
subs
ecto
rs
2.50
2.
50
C7.
1 D
omes
tic
capi
tal t
rans
fers
10
.55
3002
0 C
apit
al tr
ansf
ers
to o
ther
sec
tors
, re
side
nt
8.05
8.
05
Les
s C
7.1
To o
ther
leve
ls o
f gov
ernm
ent
-2.5
0
C7.
2 C
aeit
al tr
ansf
ers
abro
ad
0.66
30
021
Cae
ital
tran
sfer
s to
res
t of w
orld
0.
66
0.66
3002
2 N
et le
ndin
g -7
0.1
7
0.00
0.
00
-12
.48
30
023
Gro
ss a
ccum
ulat
ion
-55
.77
0.
00
0.00
1.
92
~
.....
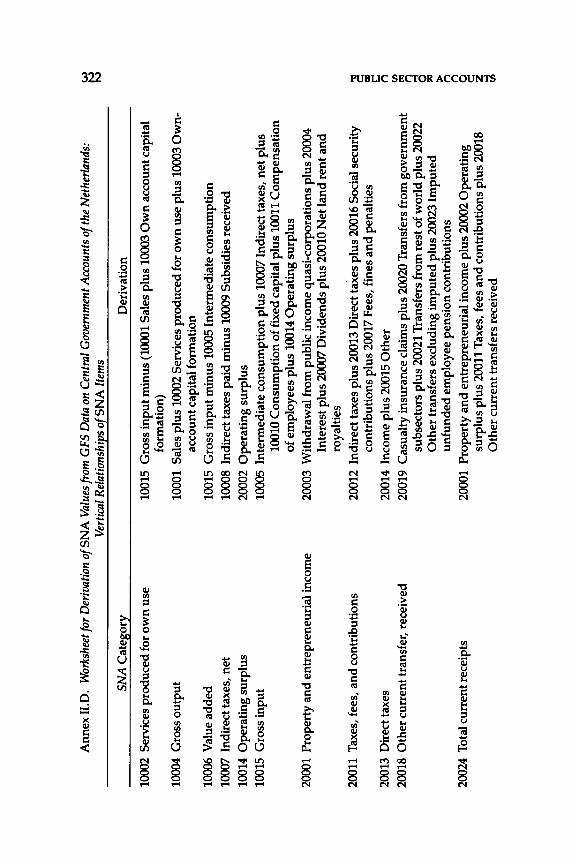
Ann
ex I
I.D.
Wor
kshe
et fo
r D
eriv
atio
n o
fSN
A V
alue
s fr
om G
FS D
ata
on C
entr
al G
over
nmen
t Acc
ount
s of
the
Net
herl
ands
:
SNA
Cat
egor
y
1000
2 Se
rvic
es p
rodu
ced
for
ow
n u
se
1000
4 G
ross
out
put
1000
6 V
alue
add
ed
1000
7 In
dire
ct ta
xes,
net
10
014
Ope
rati
ng s
urpl
us
1001
5 G
ross
inpu
t
2000
1 P
rope
rty
and
entr
epre
neur
ial i
ncom
e
2001
1 T
axes
, fee
s, a
nd c
ontr
ibut
ions
2001
3 D
irec
t tax
es
2001
8 O
ther
cur
rent
tran
sfer
, re
ceiv
ed
2002
4 T
otal
cur
rent
rece
ipts
Vert
ical
Rel
atio
nshi
ps o
f SN
A It
ems
Der
ivat
ion
1001
5 G
ross
inp
ut m
inus
(100
01 S
ales
plu
s 10
003
Ow
n a
ccou
nt c
apit
al
form
atio
n)
1000
1 S
ales
plu
s 10
002
Ser
vice
s pr
oduc
ed fo
r o
wn
use
plu
s 10
003
Ow
n-ac
coun
t cap
ital
form
atio
n 10
015
Gro
ss i
nput
min
us 1
0005
Int
erm
edia
te c
onsu
mpt
ion
1000
8 In
dire
ct ta
xes
paid
min
us 1
0009
Sub
sidi
es re
ceiv
ed
2000
2 O
pera
ting
sur
plus
10
005
Inte
rmed
iate
con
sum
ptio
n pl
us 1
0007
Ind
irec
t tax
es,
net
plu
s 10
010
Con
sum
ptio
n of
fixe
d ca
pita
l plu
s 10
011
Com
pens
atio
n of
em
ploy
ees
plus
100
14 O
pera
ting
sur
plus
20
003
Wit
hdra
wal
fro
m p
ubli
c in
com
e qu
asi-
corp
orat
ions
plu
s 20
004
Inte
rest
plu
s 20
007
Div
iden
ds p
lus
2001
0 N
et la
nd r
ent a
nd
ro
yalt
ies
2001
2 In
dire
ct ta
xes
plus
200
13 D
irec
t taX
es p
lus
2001
6 So
cial
sec
urit
y co
ntri
buti
ons
plus
200
17 F
ees,
fin
es a
nd
pen
alti
es
2001
4 In
com
e pl
us 2
0015
Oth
er
2001
9 C
asua
lty
insu
ranc
e cl
aim
s pl
us 2
0020
Tra
nsfe
rs f
rom
gov
ernm
ent
subs
ecto
rs p
lus
2002
1 T
rans
fers
fro
m r
est o
f wor
ld p
lus
2002
2 O
ther
tran
sfer
s ex
clud
ing
impu
ted
plus
200
23 I
mpu
ted
unfu
nded
em
ploy
ee p
ensi
on c
ontr
ibut
ions
20
001
Pro
pert
y an
d e
ntre
pren
euri
al in
com
e pl
us 2
0002
Ope
rati
ng
surp
lus
plus
200
11 T
axes
, fe
es a
nd
con
trib
utio
ns p
lus
2001
8 O
ther
cur
rent
tran
sfer
s re
ceiv
ed
~ ~ Cll !:
n fJ)
rll ~ ~ n 0 c:: ~ fJ)
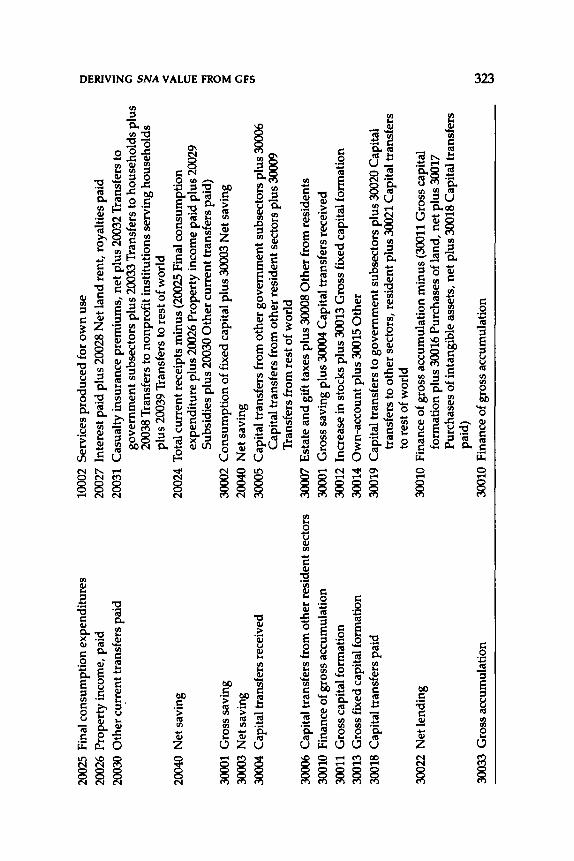
2002
5 Fi
nal c
onsu
mpt
ion
expe
ndit
ures
20
026
Pro
pert
y in
com
e, p
aid
2003
0 O
ther
cur
rent
tran
sfer
s pa
id
2004
0 N
et s
avin
g
3000
1 G
ross
sav
ing
3000
3 N
et s
avin
g 30
004
Cap
ital
tran
sfer
s re
ceiv
ed
3000
6 C
apit
al tr
ansf
ers
from
oth
er r
esid
ent s
ecto
rs
3001
0 F
inan
ce o
f gro
ss a
ccum
ulat
ion
3001
1 G
ross
cap
ital
form
atio
n 30
013
Gro
ss fi
xed
capi
tal f
orm
atio
n 30
018
Cap
ital
tran
sfer
s pa
id
3002
2 N
et le
ndin
g
3003
3 G
ross
acc
umul
atio
n
1000
2 S
ervi
ces
prod
uced
for
ow
n u
se
2002
7 In
tere
st p
aid
plus
200
28 N
et la
nd re
nt,
roya
ltie
s pa
id
2003
1 C
asua
lty
insu
ranc
e pr
emiu
ms,
net
plu
s 20
032
Tra
nsfe
rs to
go
vern
men
t sub
sect
ors
plus
200
33 T
rans
fers
to h
ouse
hold
s pl
us
2003
8 T
rans
fers
to n
onpr
ofit
inst
itut
ions
ser
ving
hou
seho
lds
plus
200
39 T
rans
fers
to r
est o
f wor
ld
2002
4 T
otal
cur
rent
rece
ipts
min
us (2
0025
Fin
al c
onsu
mpt
ion
expe
ndit
ure
plus
200
26 P
rope
rty
inco
me
paid
plu
s 20
029
Sub
sidi
es p
lus
2003
0 O
ther
cur
rent
tran
sfer
s pa
id)
3000
2 C
onsu
mpt
ion
of fi
xed
capi
tal p
lus
3000
3 N
et s
avin
g 20
040
Net
sav
ing
3000
5 C
apit
al tr
ansf
ers
from
oth
er g
over
nmen
t sub
sect
ors
plus
300
06
Cap
ital
tran
sfer
s fr
om o
ther
resi
dent
sec
tors
plu
s 30
009
Tra
nsfe
rs f
rom
res
t of
wor
ld
3000
7 E
stat
e an
d g
ift t
axes
plu
s 30
008
Oth
er fr
om r
esid
ents
30
001
Gro
ss s
avin
g pl
us 3
0004
Cap
ital
tra
nsfe
rs r
ecei
ved
3001
2 In
crea
se in
sto
cks
plus
300
13 G
ross
fixe
d ca
pita
l for
mat
ion
3001
4 O
wn-
acco
unt p
lus
3001
5 O
ther
30
019
Cap
ital
tran
sfer
s to
gov
ernm
ent s
ubse
ctor
s pl
us 3
0020
Cap
ital
tr
ansf
ers
to o
ther
sec
tors
, re
side
nt p
lus
3002
1 C
apit
al tr
ansf
ers
to r
est o
f w
orld
30
010
Fin
ance
of
gros
s ac
cum
ulat
ion
min
us (3
0011
Gro
ss c
apit
al
form
atio
n pl
us 3
0016
Pur
chas
es o
f lan
d, n
et p
lus
3001
7 P
urch
ases
of
inta
ngib
le a
sset
s, n
et p
lus
3001
8 C
apit
al tr
ansf
ers
paid
) 30
010
Fin
ance
of
gros
s ac
cum
ulat
ion
0 Ill 2!! < z C1
II) ~ ~ E
Ill ., ~ a: C1 ., rJ
'l ~
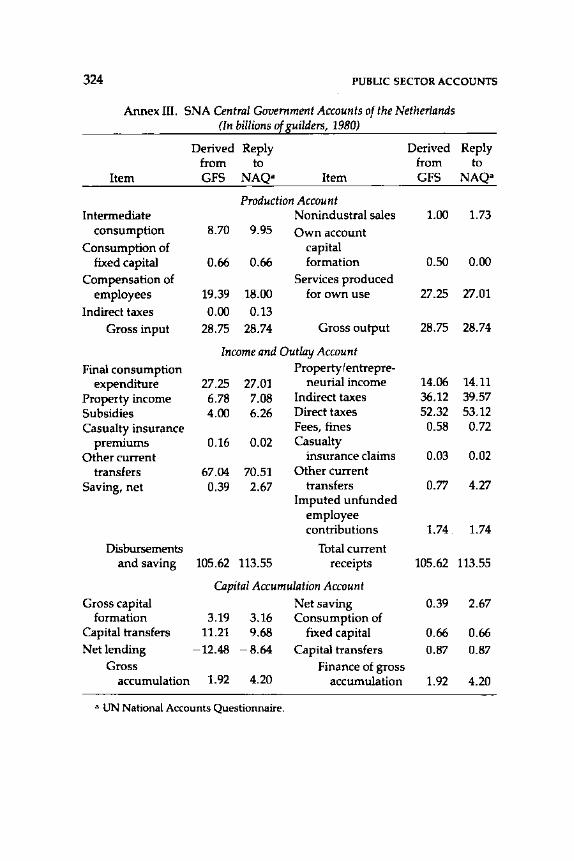
324 PUBLIC SECTOR ACCOUNTS
Annex III. SNA Central Government Accounts of the Netherlands (In billions o[s_uilders, 1980)
Derived Reply Derived Reply from to from to
Item GFS NAQa Item GFS NAQa
Production Account Intermediate Nonindustral sales 1.00 1.73
consumption 8.70 9.95 Own account Consumption of capital
fixed capital 0.66 0.66 formation 0.50 0.00 Compensation of Services produced
employees 19.39 18.00 for own use 27.25 27.01
Indirect taxes 0.00 0.13 Gross input 28.75 28.74 Gross output 28.75 28.74
Income and Outlay Account Final consumption Property/ entrepre-
expenditure 27.25 27.01 neurial income 14.06 14.11 Property income 6.78 7.08 Indirect taxes 36.12 39.57 Subsidies 4.00 6.26 Direct taxes 52.32 53.12 Casualty insurance Fees, fines 0.58 0.72
premiums 0.16 0.02 Casualty Other current insurance claims 0.03 0.02
transfers 67.04 70.51 Other current Saving, net 0.39 2.67 transfers 0.77 4.27
Imputed unfunded employee contributions 1.74. 1.74
Disbursements Total current and saving 105.62 113.55 receipts 105.62 113.55
Capital Accumulation Account Gross capital Net saving 0.39 2.67
formation 3.19 3.16 Consumption of Capital transfers 11.21 9.68 fixed capital 0.66 0.66 Net lending -12.48 -8.64 Capital transfers 0.87 0.87
Gross Finance of gross accumulation 1.92 4.20 accumulation 1.92 4.20
a UN National Accounts Questionnaire.
20
Sectorization of Social Security Funds
TERESA VILLACirnS
T o SHED LIGHT on the merits of classifying social security funds separately or together with other parts of government, this paper
examines several key characteristics of social security operations, drawing primarily on data in the Fund's Government Finance Statistics Yearbook (GFS Yearbook) and the U.S. Social Security Administration's Social Security Programs Around the World1 and on papers appearing in the International Social Security Review.2 The question of the appropriate classification of social security funds arises from differences between the United Nations' A System of National Accounts (SNA) and the IMF's Manual on Government Finance Statistics (GFSM). Although both data systems consider social security funds to be a part of general government and include social security schemes that are not separately organized as funds within the level of government at which they operate, the SNA treats social security funds as a separate subsector of government, and the GFS includes them in the level (subsector) of government at which they operate. Thus, the GFS calls for the inclusion of statistics for all national social security schemes with data for central government and the inclusion of data relating to all separate schemes operating at regional or local government levels with the statistics for regional or local governments, respectively. Social security funds, as distinguished from other social security schemes, are defined in the SNA (page 237) as "schemes imposed,
1 U.S. Department of Health and Human Services, Social Security Administration, Office of Policy, Social Security Programs Throughout the World-1983, Research Report 59 (Washington, D.C.: Government Printing Office, 1984).
2 International Social Security Association, International Social Security Review (Geneva).
325
326 PUBLIC SECTOR ACCOUNTS
controlled or financed by the public authorities for purposes of providing social security benefits for the community, or large sections of the community, which are separately organized from the other activities of the public authorities and hold their assets and liabilities separately from them." The SNA's treatment of social security funds as a separate subsector, therefore, turns on their separate organization, separate finances, and, by implication, their relative independence as a decision-making center.
This paper focuses on the question of consolidating statistics for social security funds operating at the national level with those of other central government units, and the term "social security funds" is used throughout this paper to refer to national social security funds.
I. Social Security Funds' Financial Dependence on Central Government
Experience suggests that the financial independence of social security funds is not fixed but is rather a function of the risks they cover, their age, and the overall social, economic, and political context in which they operate. Several issues arise in the determination of whether social security funds should be treated as a separate subsector: whether they constitute independent decision-making institutions, whether such independence is limited by financial dependence on contractual or discretionary funds from budgetary central government, whether social security funds perform functions distinct and separate {!om those performed by the rest of the government, and whether the magnitude of their operations makes their inclusion or exclusion from data for total central government operations a major or minor concern. As social security funds have grown older and more complex in terms of benefits provided and segments of the population covered-for example, among industrial countries and in some developing countries in Latin America3-they have found it increasingly difficult to cover their expenditures with their own revenues and have become dependent on substantial financial support
3 As noted in U.S. Department of Health and Human Services, Social Security Program Throughout the World, social security funds covering old-age invalidity and death have operated in the Federal Republic of Germany, Austria, New Zealand, Iceland, the United Kingdom, the Netherlands, and Sweden for over 70 years and in Argentina, Uruguay, Brazil, and Chile for at least 60 years.
SECTORIZATION OF SOCIAL SECURITY 327
from central government. Some older social security funds have used pension reserves to meet the costs of sickness and maternity benefits, so that governments committed to ensuring payment of pension benefits when they mature have had to provide subsidies or levy special taxes for such purposes. Receipts of social security systems, furthermore, depend heavily on trends in wages and are therefore quite vulnerable to economic conditions, such as unemployment. Thus, the recession of the 1970s brought lower social security contributions, an increase in unemployment benefits, and inflation, which triggered sizable cost-of-living adjustments for some benefit programs. As a result, "since the mid-1960s, in most countries, social security has been overshadowed by increasingly serious economic difficulties. "4
A quantitative indication of the degree of financial stress that social security funds around the world have faced in recent years is provided by Table 1, which shows, for 59 countries in the period 1975-84, social security funds' deficit or surplus as a percentage of gross domestic product (GOP) before the elimination of transactions with the rest of central government.5 About half of the industrial countries listed have run social security fund deficits of up to 3.0 percent of GOP, with most of the remainder showing continuously declining surpluses of less than 2.5 percent. The majority of developing countries show relatively modest and continuously declining surpluses, of less than 1.5 percent of GOP. Notable exceptions are found in Cyprus and several English-speaking Caribbean countries, where early stages of social security operations are characterized by the accumulation of reserves for future pension benefit payments. Surpluses in these countries ranged from less than 1 percent in Trinidad and Tobago during the period 1976-81 to 7 percent in Guyana in 1984. Table 1 shows the older social security funds in Latin America (Argentina, Colombia, Costa Rica, Mexico, Panama, Uruguay, and Venezuela) running deficits through all or part of the period under review.
4 Raymond Poirrier, "Recent Developments in the Public Information Activities of Social Security Institutions," International Social Security Review, 2/85, p. 201.
5 "Before consolidation with the rest of central government" refers to social security fund data that include all payments and receipts between them and other central government units. These payments and receipts are eliminated as intragovernmental transactions when data for social security funds are combined with those relating to budgetary and extrabudgetary accounts to produce data for the consolidated central government.
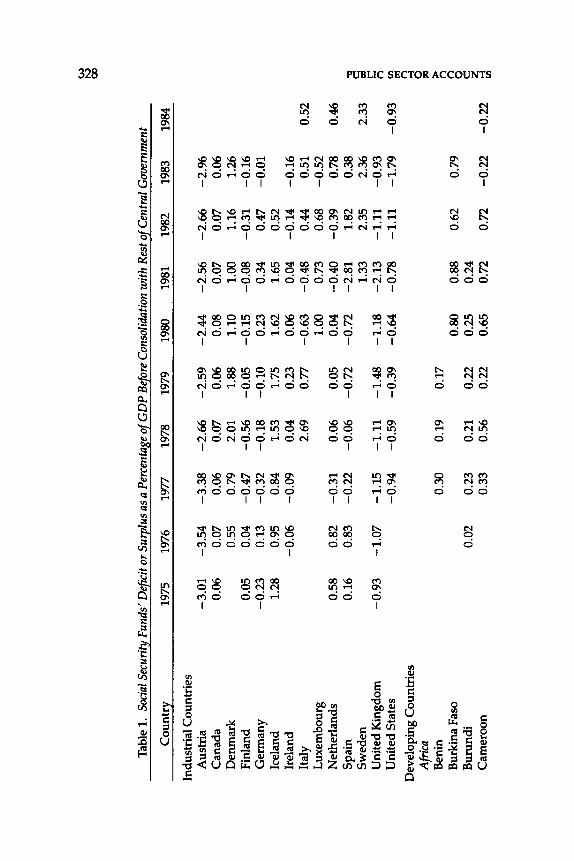
~
Tab
le 1
. So
cial
Sec
urity
_ F
unds
' Defj
_cit
or S
u'l!_
lus
as a
Per
cent
as_e
o[ G
DP
Bef
ore
Con
solid
atio
n w
ith R
esto
[ Cen
tral
Gov
ernm
ent
Cou
ntrl
:: 19
75
1976
19
77
1978
19
79
1980
19
81
1982
19
83
1984
Indu
stri
al C
ount
ries
A
ustr
ia
-3.0
1
-3.5
4
-3.3
8
-2.6
6
-2.5
9
-2.4
4
-2.5
6
-2.6
6
-2.%
C
anad
a 0.
06
0.07
0.
06
0.07
0.
06
0.08
0.
07
0.07
0.
06
Den
mar
k 0.
55
0.79
2.
01
1.88
1.
10
1.00
1.
16
1.26
F
inla
nd
0.05
0.
04
-0.4
7
-0.5
6
-0.0
5
-0.1
5
-0.0
8
-0.3
1
-0.1
6
Ger
man
y -0
.23
0.
13
-0.3
2
-0.1
8
-0.1
0
0.23
0.
34
0.47
-0
.01
Ic
elan
d 1.
28
0.95
0.
84
1.53
1.
75
1.62
1.
65
0.52
Ir
elan
d -0
.06
-0
.09
0.
04
0.23
0.
06
0.04
-0
.14
-0
.16
It
aly
2.69
0.
77
-0.6
3
-0.4
8
0.44
0.
51
0.52
L
uxem
bour
g 1.
00
0.73
0.
68
-0.5
2
Net
herl
ands
0.
58
0.82
-0
.31
0.
06
0.05
0.
04
-0.4
0
-0.3
9
0.78
0.
46
Spa
in
0.16
0.
83
-0.2
2
-0.0
6
-0.7
2
-0.7
2
-2.8
1
1.82
0.
38
~ S
wed
en
1.33
2.
35
2.36
2.
33
=
Uni
ted
Kin
gdom
-0
.93
-1
.07
-1
.15
-1
.11
-1
.48
-1
.18
-2
.13
-1
.11
-0
.93
!:
n
Uni
ted
Sta
tes
-0.9
4
-0.5
9
-0.3
9
-0.6
4
-0.7
8
-1.1
1
-1.7
9
-0.9
3
Ul
rt!
Dev
elop
ing
Cou
ntri
es
n o-,1
Afri
ca
0 "' B
enin
0.
30
0.19
0.
17
>
n B
urki
na F
aso
0.80
0.
88
0.62
0.
79
n 0 B
urun
di
0.02
0.
23
0.21
0.
22
0.25
0.
24
c:: z C
amer
oon
0.33
0.
56
0.22
0.
65
0.72
0.
72
-0.2
2
-0.2
2
o-,1
Ul
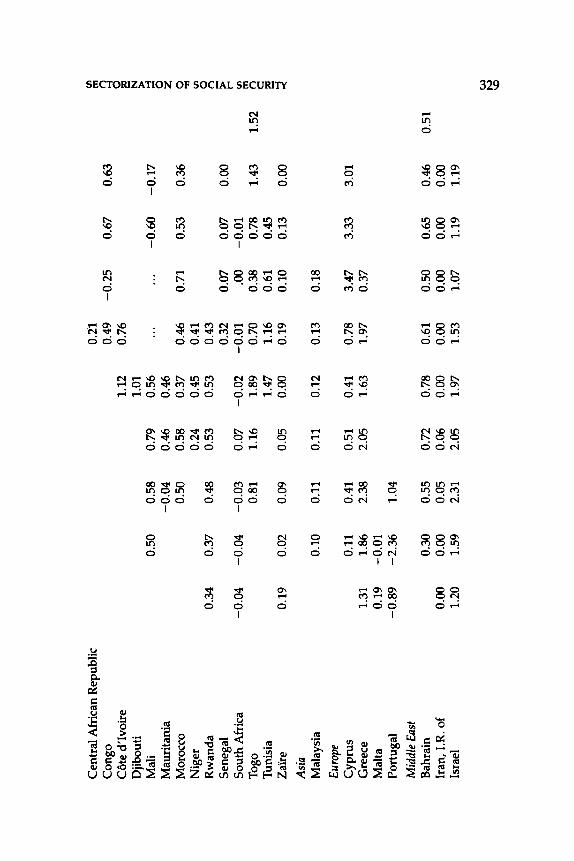
Cen
tral
Afr
ican
Rep
ubli
c 0.
21
Ill
!!I
Con
go
0.49
-0
.25
0.
67
0.63
('
) Cl C
ote
d'lv
oire
1.
12
0.76
2!!
Dji
bout
i 1.
01
N >
Mal
i 0.
50
0.58
0.
79
0.56
...
. ..
-0.6
0
-0.1
7
::::!
Mau
rita
nia
-0.0
4
0.46
0.
46
0 z M
oroc
co
0.50
0.
58
0.37
0.
46
0.71
0.
53
0.36
0 "r
r N
iger
0.
24
0.45
0.
41
Ill
Rw
anda
0.
34
0.37
0.
48
0.53
0.
53
0.43
0 ('
)
Sen
egal
0.
32
0.07
0.
07
0.00
>
r-
' S
outh
Afr
ica
-0.0
4
-0.0
4
-0.0
3
0.07
-0
.02
-0
.01
.0
0 -0
.01
Il
l
0.81
!!
I T
ogo
1.16
1.
89
0.70
0.
38
0.78
1.
43
1.52
('
) c:: T
unis
ia
1.47
1.
16
0.61
0.
45
2!! Z
a'ir
e 0.
19
0.02
0.
09
0.05
0.
00
0.19
0.
10
0.13
0.
00
~ A
sia
Mal
aysi
a 0.
10
0.11
0.
11
0.12
0.
13
0.18
Euro
pe
Cyp
rus
0.11
0.
41
0.51
0.
41
0.78
3.
47
3.33
3.
01
Gre
ece
1.31
1.
86
2.38
2.
05
1.63
1.
97
0.37
M
alta
0.
19
-O.o
t P
ortu
gal
-0.8
9
-2.3
6
1.04
Mid
dle
East
Bah
rain
0.
30
0.55
0.
72
0.78
0.
61
0.50
0.
65
0.46
0.
51
Iran
, I.
R.
of
0.00
0.
00
0.05
0.
06
0.00
0.
00
0.00
0.
00
0.00
Is
rael
1.
20
1.59
2.
31
2.05
1.
97
1.53
1.
07
1.19
1.
19
UJ
N
\0
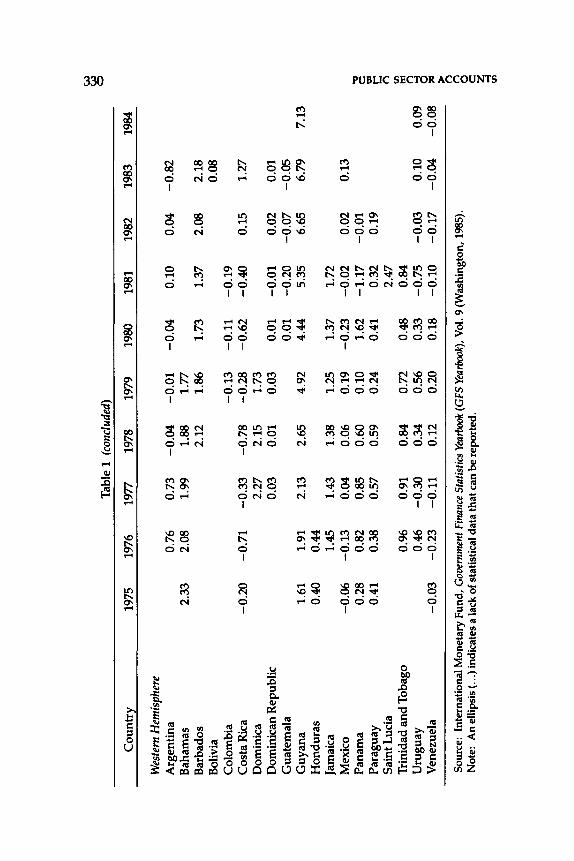
w
Tab
le 1
(co
nclu
ded)
~
Cou
ntry
19
75
1976
19
77
1978
19
79
1980
19
81
1982
19
83
1984
Wes
tern
Hem
isph
ere
Arg
enti
na
0.76
0.
73
-0.0
4
-0.0
1
-0.0
4
0.10
0.
04
-0.8
2
Bah
amas
2.
33
2.08
1.
99
1.88
1.
77
Bar
bado
s 2.
12
1.86
1.
73
1.37
2.
08
2.18
B
oliv
ia
0.08
C
olom
bia
-0.1
3
-0.1
1
-0.1
9
Cos
ta R
ica
-0.2
0
-0.7
1
-0.3
3
-0.7
8
-0.2
8
-0.6
2
-0.4
0
0.15
1.
27
Dom
inic
a 2.
27
2.15
1.
73
Dom
inic
an R
epub
lic
0.03
0.
01
0.03
0.
01
-O.Q
l 0.
02
0.01
G
uate
mal
a 0.
01
-0.2
0
-0.0
7
-0.0
5
Guy
ana
1.61
1.
91
2.13
2.
65
4.92
4.
44
5.35
6.
65
6.79
7.
13
Hon
dura
s 0.
40
0.44
Ja
mai
ca
1.45
1.
43
1.38
1.
25
1.37
1.
72
Mex
ico
-0.0
6
-0.1
3
0.04
0.
06
0.19
-0
.23
-0
.02
0.
02
0.13
P
anam
a 0.
28
0.82
0.
85
0.60
0.
10
1.62
-1
.17
-0
.01
~
Par
agua
y 0.
41
0.38
0.
57
0.59
0.
24
0.41
0.
32
0.19
1:1
1 c S
aint
Luc
ia
2.47
("
)
Tri
nida
d an
d T
obag
o 0
.%
0.91
0.
84
0.72
0.
48
0.84
Il
l 1!
1 ("
) U
rugu
ay
0.46
-0
.30
0.
34
0.56
0.
33
-0.7
5
-0.0
3
0.10
0.
09
d V
enez
uela
-0
.03
-0
.23
-0
.11
0.
12
0.20
0.
18
-0.1
0
-0.1
7
-0.0
4
-0.0
8
, >
(")
Sou
rce:
In
tern
atio
nal M
onet
ary
Fun
d, G
over
nmen
t Fin
ance
Sta
tistic
s Ye
arbo
ok (
GFS
Yea
rboo
k), V
ol. 9
(W
ashi
ngto
n, 1
985)
. ("
) 0 N
ote:
A
n el
lips
is( .
.. ) i
ndic
ates
a la
ck o
f st
atis
tica
l dat
a th
at c
an b
e re
port
ed.
c:: z --1
Ill
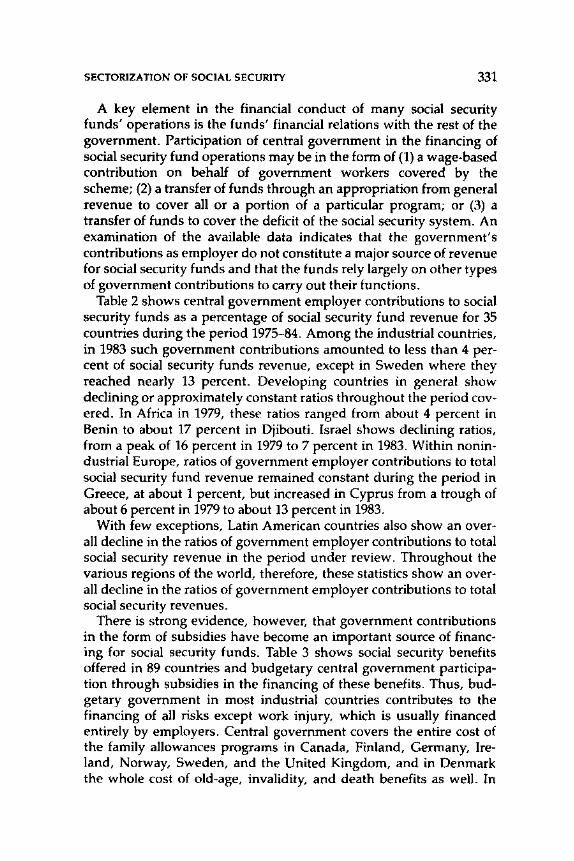
SECTORIZATION OF SOCIAL SECURITY 331
A key element in the financial conduct of many social security funds' operations is the funds' financial relations with the rest of the government. Participation of central government in the financing of social security fund operations may be in the form of (1) a wage-based contribution on behalf of government workers covered by the scheme; (2) a transfer of funds through an appropriation from general revenue to cover all or a portion of a particular program; or (3) a transfer of funds to cover the deficit of the social security system. An examination of the available data indicates that the government's contributions as employer do not constitute a major source of revenue for social security funds and that the funds rely largely on other types of government contributions to carry out their functions.
Table 2 shows central government employer contributions to social security funds as a percentage of social security fund revenue for 35 countries during the period 1975-84. Among the industrial countries, in 1983 such government contributions amounted to less than 4 percent of social security funds revenue, except in Sweden where they reached nearly 13 percent. Developing countries in general show declining or approximately constant ratios throughout the period covered. In Africa in 1979, these ratios ranged from about 4 percent in Benin to about 17 percent in Djibouti. Israel shows declining ratios, from a peak of 16 percent in 1979 to 7 percent in 1983. Within nonindustrial Europe, ratios of government employer contributions to total social security fund revenue remained constant during the period in Greece, at about 1 percent, but increased in Cyprus from a trough of about 6 percent in 1979 to about 13 percent in 1983.
With few exceptions, Latin American countries also show an overall decline in the ratios of government employer contributions to total social security revenue in the period under review. Throughout the various regions of the world, therefore, these statistics show an overall decline in the ratios of government employer contributions to total social security revenues.
There is strong evidence, however, that government contributions in the form of subsidies have become an important source of financing for social security funds. Table 3 shows social security benefits offered in 89 countries and budgetary central government participation through subsidies in the financing of these benefits. Thus, budgetary government in most industrial countries contributes to the financing of all risks except work injury, which is usually financed entirely by employers. Central government covers the entire cost of the family allowances programs in Canada, Finland, Germany, Ireland, Norway, Sweden, and the United Kingdom, and in Denmark the whole cost of old-age, invalidity, and death benefits as well. In
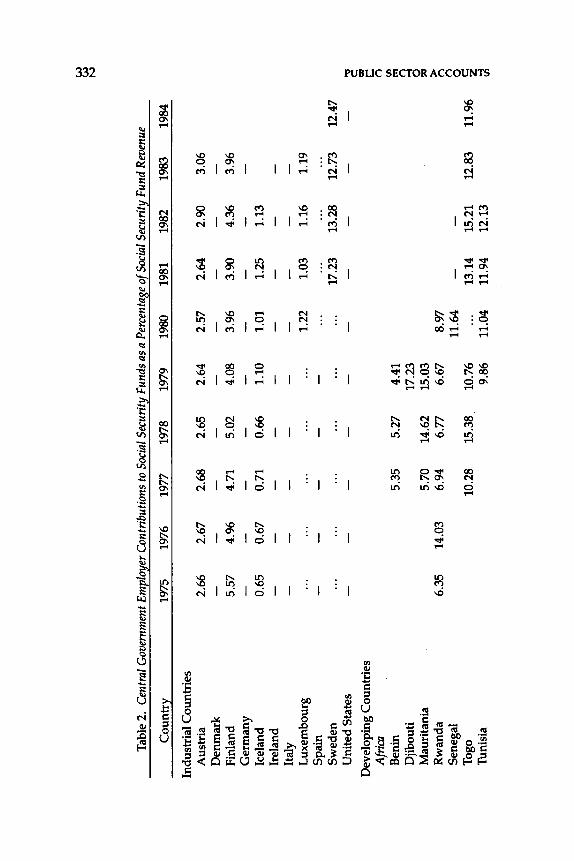
w
w
N
Tab
le 2
. C
entr
al G
over
nmen
t Emp
lo~e
r C
ontr
ibut
ions
to S
ocia
l Sec
urity
Fun
ds a
s a
Perc
enta
s.e o
[ Soc
ial S
ecur
it~
Fund
Rev
enue
Cou
ntry
19
75
1976
19
77
1978
19
79
1980
19
81
1982
19
83
1984
Indu
stri
al C
ount
ries
A
ustr
ia
2.66
2.
67
2.68
2.
65
2.64
2.
57
2.64
2.
90
3.06
D
enm
ark
Fin
land
5.
57
4.96
4.
71
5.02
4.
08
3.96
3.
90
4.36
3.
96
Ger
man
y Ic
elan
d 0.
65
0.67
0.
71
0.66
1.
10
1.01
1.
25
1.13
Ir
elan
d It
aly
Lux
embo
urg
... ...
...
...
...
1.22
1.
03
1.16
1.
19
Spa
in
Sw
eden
...
...
...
...
...
...
17
.23
13.2
8 12
.73
12.4
7 U
nite
d S
tate
s -
--
--
--
--
-~
Dev
elop
ing
Cou
ntri
es
1:111 c
Afri
ca
n Ill
Ben
in
5.35
5.
27
4.41
1:!
1
Dji
bout
i 17
.23
n d M
auri
tani
a 5.
70
14.6
2 15
.03
" R
wan
da
6.35
14
.03
6.94
6.
77
6.67
8.
97
>
n S
eneg
al
11.6
4 n
--
0 T
ogo
10.2
8 15
.38
10.7
6 13
.14
15.2
1 12
.83
11.9
6 c::
...
z T
unis
ia
9.86
11
.04
11.9
4 12
.13
--!
Ill
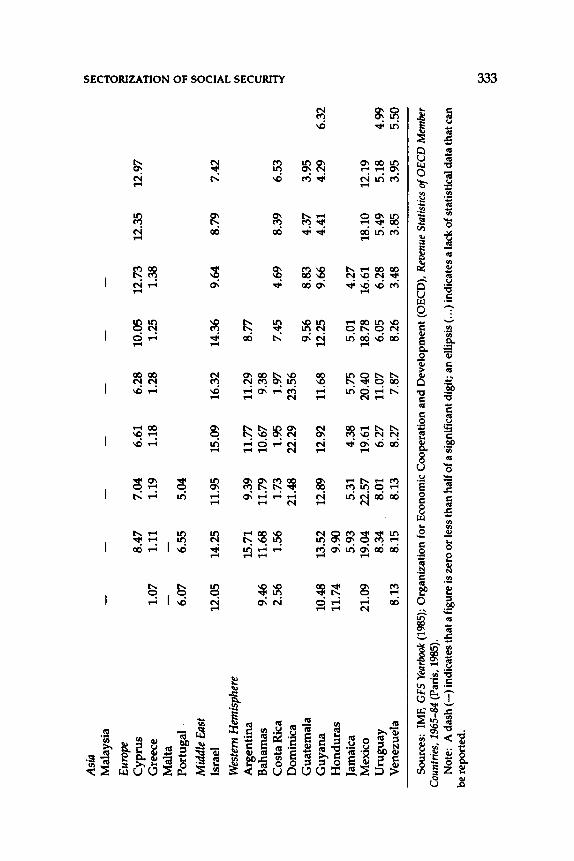
Asi
a U
l I'
ll
Mal
aysi
a -
--
--
-n
-0
Euro
pe
2!! C
yp
rus
8.47
7.
04
6.61
6.
28
10.0
5 12
.73
12.3
5 12
.97
N ~
Gre
ece
1.07
1.
11
1.19
1.
18
1.28
1.
25
1.38
0
Mal
ta
--
z P
ort
ug
al·
6.07
6.
55
5.04
0 ..,
Mid
dle
East
Ul 0
Isra
el
12.0
5 14
.25
11.9
5 15
.09
16.3
2 14
.36
9.64
8.
79
7.42
n >
W
este
rn H
emis
pher
e I:"
' U
l
Arg
enti
na
15.7
1 9.
39
11.7
7 11
.29
8.77
I'l
l n B
aham
as
9.46
11
.68
11.7
9 10
.67
9.38
c 2!!
Co
sta
Ric
a 2.
56
1.56
1.
73
1.95
1.
97
7.45
4.
69
8.39
6.
53
~ D
om
inic
a 21
.48
22.2
9 23
.56
Gu
atem
ala
9.56
8.
83
4.37
3.
95
Gu
yan
a 10
.48
13.5
2 12
.89
12.9
2 11
.68
12.2
5 9.
66
4.41
4.
29
6.32
H
on
du
ras
11.7
4 9.
90
Jam
aica
5.
93
5.31
4.
38
5.75
5.
01
4.27
M
exic
o 21
.09
19.0
4 22
.57
19.6
1 20
.40
18.7
8 16
.61
18.1
0 12
.19
Uru
gu
ay
8.34
8.
01
6.27
11
.07
6.05
6.
28
5.49
5.
18
4.99
V
enez
uel
a 8.
13
8.15
8.
13
8.27
7.
87
8.26
3.
48
3.85
3.
95
5.50
Sour
ces:
IM
F, G
FS Y
earb
ook
(198
5);
Org
aniz
atio
n fo
r E
cono
mic
Coo
pera
tion
and
Dev
elop
men
t (O
EC
D),
Rev
enue
Sta
tistic
s of
OE
CD
Mem
ber
Cou
ntri
es,
1965
-84
(Par
is,
1985
). N
ote:
A
das
h(-
) in
dica
tes
that
a fi
gure
is z
ero
or le
ss th
an h
alf o
f a s
igni
fica
nt d
igit;
an
elli
psis
( ...
) ind
icat
es a
lack
of s
tati
stic
al d
ata
that
can
be
rep
orte
d.
t.J ~
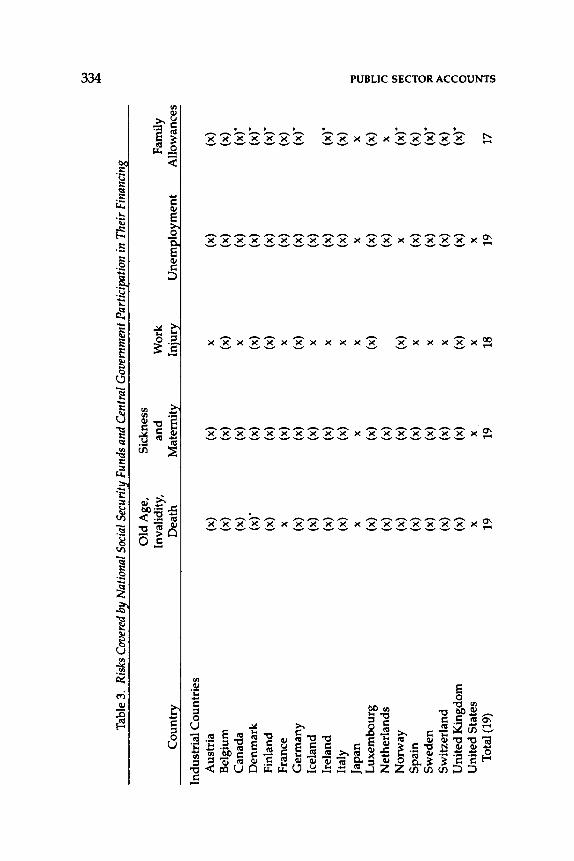
w ~
Tab
le 3
. R
isks
Cov
ered
by
Nat
iona
l So
cial
Sec
urit!
f. Fu
nds
and
Cen
tral
Gov
ernm
ent P
artic
ipat
ion
in T
heir
Fin
anci
n8.
Old
Age
, S
ickn
ess
Inva
lidi
ty,
and
W
ork
Fam
ily
Cou
ntry
D
eath
M
ater
nity
In
jury
U
nem
[!Io
ymen
t A
llow
ance
s
Indu
stri
al C
ount
ries
A
ustr
ia
(x)
(x)
X
(x)
(x)
Bel
gium
(x
) (x
) (x
) (x
) (x
) C
anad
a (x
) (x
) X
(x
) (x
)*
Den
mar
k (x
)*
(x)
(x)
(x)
(x)*
F
inla
nd
(x)
(x)
(x)
(x)
(x)*
F
ranc
e X
(x
) X
(x
) (x
) G
erm
any
(x)
(x)
(x)
(x)
(x)*
Ic
elan
d (x
) (x
) X
(x
) Ir
elan
d (x
) (x
) X
(x
) (x
)*
Ital
y (x
) (x
) X
(x
) (x
) Ja
pan
X
X
X
X
X
., c:: L
uxem
bour
g (x
) (x
) (x
) (x
) (x
) 1:1
1:1
r"'
Net
herl
ands
(x
) (x
) (x
) X
?i
Nor
way
(x
) (x
) (x
) (x
)*
(Jl
X
rn
Spa
in
(x)
(x)
(x)
(x)
n X
a
Sw
eden
(x
) (x
) X
(x
) (x
)*
~
Sw
itze
rlan
d (x
) (x
) X
(x
) (x
) >
n
Uni
ted
Kin
gdom
(x
) (x
) (x
) (x
) (x
)*
n 0 U
nite
d S
tate
s X
X
X
X
c:: z
Tot
al (
19)
19
19
18
19
17
...j
(Jl
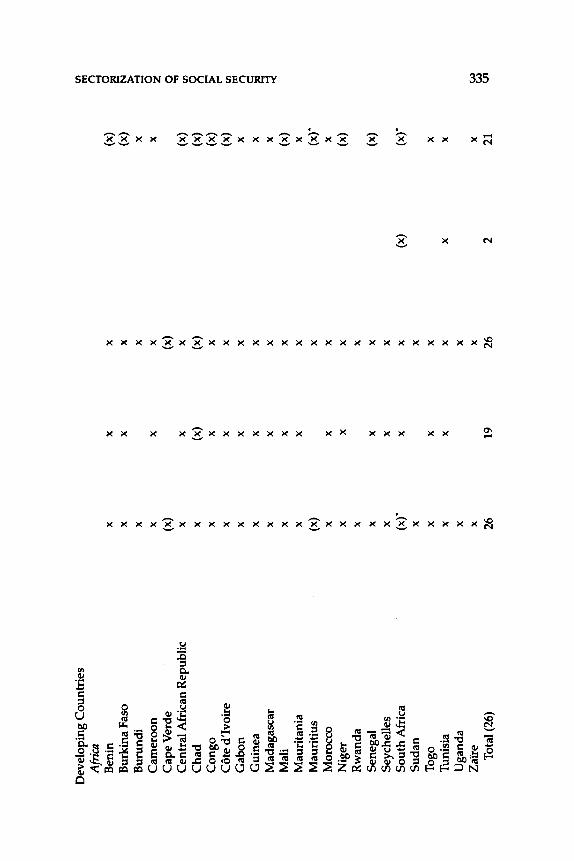
Dev
elop
ing
Cou
ntri
es
Ill
1'11
Afr
ica
(')
Ben
in
X
X
X
(x)
6 I!!
Bur
kina
Fas
o X
X
X
(x
) N
Bur
undi
X
X
X
~
Cam
eroo
n X
X
X
X
0 z
Cap
e V
erde
(x
) (x
) 0
Cen
tral
Afr
ican
Rep
ubli
c (x
) ...
X
X
X
Ill
Cha
d X
(x
) (x
) (x
) 0 ('
)
Con
go
X
X
X
(x)
>
Cot
e d'
lvoi
re
(x)
r"
X
X
X
Ill
Gab
on
X
X
X
X
1'11
(')
Gui
nea
X
X
X
X
c:: I!!
Mad
agas
car
X
X
X
X
~ M
ali
X
X
X
(x)
Mau
rita
nia
X
X
X
X
Mau
riti
us
(x)
X
(x)*
M
oroc
co
X
X
X
X
Nig
er
X
X
X
(x)
Rw
anda
X
X
Sen
egal
X
X
X
(x
) S
eych
elle
s X
X
X
Sou
th A
fric
a (x
)*
X
X
(x)
(x)*
S
udan
X
X
Tog
o X
X
X
X
Tun
isia
X
X
X
X
X
Uga
nda
X
X
Zai
re
X
X
X
(JJ
Tot
al (
26)
26
19
26
2 21
~
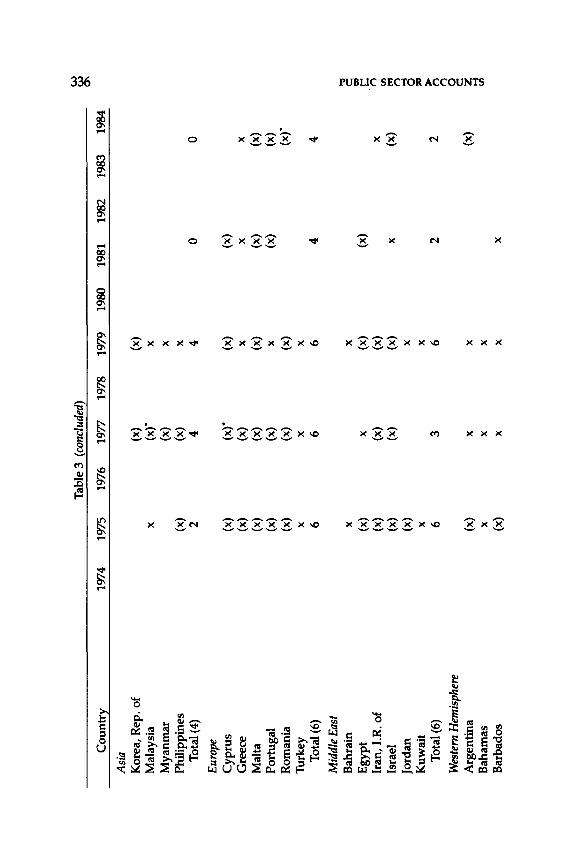
Tab
le 3
(co
nclu
ded)
V
J ~
Cou
ntry
19
74
1975
19
76
1977
19
78
1979
19
80
1981
19
82
1983
19
84
Asi
a K
orea
, R
ep.
of
(x)
(x)
Mal
aysi
a X
(x
)" X
Mya
nmar
(x
) X
Phi
lipp
ines
(x
) (x
) X
Tot
al(4
) 2
4 4
0 0
Euro
pe
Cyp
rus
(x)
(x)"
(x)
(x)
Gre
ece
(x)
(x)
X
X
X
Mal
ta
(x)
(x)
(x)
(x)
(x)
Por
tuga
l (x
) (x
) X
(x
) (x
) R
oman
ia
(x)
(x)
(x)
(x)*
T
urke
y X
X
X
Tot
al (
6)
6 6
6 4
4
Mid
dle
East
Bah
rain
X
X
~
Egy
pt
(x)
(x)
(x)
=
X
!:
Iran
, I.
R.
of
(x)
(x)
(x)
X
11
Ill
Isra
el
(x)
(x)
(x)
X
(x)
trl
11
Jord
an
(x)
X
a K
uwai
t X
X
~
Tot
al(6
) 6
3 6
2 2
>
11
11
Wes
tern
Hem
isph
ere
0 c: A
rgen
tina
(x
) X
X
(x
) z -'
I B
aham
as
X
X
X
Ill
Bar
bado
s (x
) X
X
X
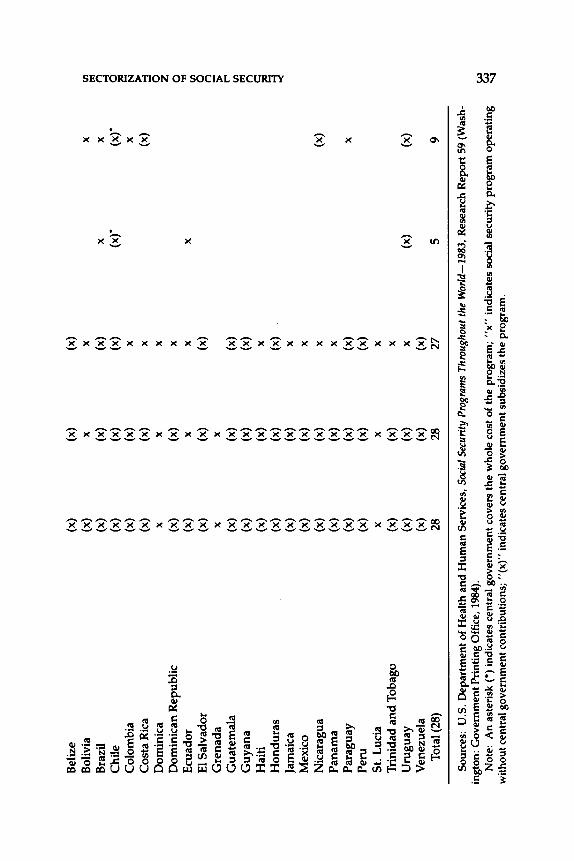
Bel
ize
(x)
(x)
(x)
Bol
ivia
(x
) X
X
X
1;
1)
Ill
Bra
zil
(x)
(x)
(x)
X
X
(")
Chi
le
(x)
(x)
(x)
(x)"
(x
)"
d 2!! C
olom
bia
(x)
(x)
X
X
N
Cos
ta R
ica
(x)
(x)
(x)
>
X
::!
Dom
inic
a X
X
X
0 z
Dom
inic
an R
epub
lic
(x)
(x)
X
0 E
cuad
or
(x)
X
X
X
"" 1;1) E
l Sal
vado
r (x
) (x
) (x
) 0 ("
)
Gre
nad
a X
X
>
G
uat
emal
a (x
) (x
) (x
) !"
" 1;
1)
Gu
yan
a (x
) (x
) (x
) Il
l ("
)
Hai
ti
(x)
(x)
X
c: H
on
du
ras
(x)
(x)
(x)
9 Ja
mai
ca
(x)
(x)
X
Mex
ico
(x)
(x)
X
Nic
arag
ua
(x)
(x)
X
(x)
Pan
ama
(x)
(x)
X
Par
agua
y (x
) (x
) (x
) X
Per
u
(x)
(x)
(x)
St.
Luc
ia
X
X
X
Tri
nida
d an
d T
obag
o (x
) (x
) X
Uru
gu
ay
(x)
(x)
X
(x)
(x)
Ven
ezue
la
(x)
(x)
(x)
Tot
al (
28)
28
28
27
5 9
Sour
ces:
U.S
. D
epar
tmen
t of
Hea
lth a
nd H
uman
Ser
vice
s, S
ocia
l Se
curi
ty P
rogr
ams
Thr
ough
out
the
Wor
/d-1
983,
Res
earc
h R
epor
t 59
(Was
h-in
gton
: G
over
nmen
t Pri
ntin
g O
ffic
e, 1
984)
. U
J N
ote:
A
n as
teri
sk(*
) in
dica
tes
cent
ral g
over
nmen
t cov
ers
the
who
le c
ost o
f th
e pr
ogra
m;
"x"
indi
cate
s so
cial
sec
urit
y pr
ogra
m o
pera
ting
U
J -...
:1 w
ithou
t cen
tral
gov
ernm
ent c
ontr
ibut
ions
; "(
x)"
indi
cate
s ce
ntra
l gov
ernm
ent s
ubsi
dize
s th
e pr
ogra
m.
338 PUBLIC SECTOR ACCOUNTS
Switzerland, ''all sickness insurance funds are entitled to federal subsidies. "6
The degree of central government participation varies among developing countries. Central government does not appear active in the financing of specific risks in Africa, except for family allowances, for which central government pays the whole cost in Mauritius and a portion in nine other countries. Central government pays the entire cost of family allowances and old-age, invalidity, and death benefits in South Africa. In nonindustrial Europe, central government contributes to all benefits in Malta, Romania, and Cyprus, assuming the whole cost of sickness and maternity benefits in Cyprus and the whole cost of family allowances in Romania. Moreover, it may be noted that in Greece, "arrangements financed from public funds have been introduced to cover agricultural pension scheme contributors and pensioners, and their dependents, against the cost of pharmaceutical products."7 In half of the Middle Eastern countries listed, central government subsidizes most social security benefits, but does not cover the whole cost of any particular program. Furthermore, in Egypt, "the financial situation of the fund is examined by actuaries every five years in order to establish existing commitments. If there is a deficit in the fund, it is borne by the Treasury and is to be settled later if there is a money surplus. " 8
Central government plays a more active role in Latin America, sharing in the financing of old-age, invalidity, and death benefits and in sickness and maternity benefits in most countries. Because work injury, unemployment, and family allowance benefits are less common in this region, government participation in their financing is limited. Only in Chile does the central government pay for the whole cost of unemployment and family allowance benefits, since employer contributions to these programs were abolished in 1980.
A study based on Brazil, Colombia, the Dominican Republic, Nicaragua, Peru, and Venezuela indicated that "with the exception of Peru, legislation in these countries prescribes state participation in
6 Jean-Francis Charles, "Social Security in Switzerland: Main Features of the Schemes and Current Problems," International Social Security Review, 2/84, p. 186.
7 International Social Security Association, "Social Security News," "Social Security in the Member States of the European Community in 1983," International Social Security Review, 4184, p. 448.
8 Ministry of Social Insurance, Arab Republic of Egypt, "Social Insurance in the Arab Republic of Egypt," International Social Security Review, 4/84, p. 425.
SECTORIZATION OF SOCIAL SECURITY 339
the financing of social security through direct transfers from general government funds"; however, "direct state participation in the financing of social security is subject to considerable delays in most of the schemes and can be considered nonexistent in the Dominican Republic."9 Moreover, it has been observed that "the chronic delay in payment of state contributions is often a major factor in the financial difficulties of the institutions. "10
To obtain an indication of the magnitude of central government support of social security funds in financial terms, it is useful to examine such support expressed as a percentage of total social security fund revenue, as shown in Table 4. Such contributions appear most important among industrial countries, particularly in Denmark and Iceland, where they amounted to about 70 percent and 90 percent of total social security fund revenue during 1975-83, followed by Finland, Germany, Ireland, Italy, Luxembourg, and Spain, with ratios ranging between 10 percent and 30 percent. Also during this period, ratios for Finland and Spain showed a threefold increase; only those for the Netherlands showed a decline, from a peak of 15 percent in 1980 to 3 percent in 1984.
The magnitude of central government contributions to social security funds varies also among developing countries. Thus, in Chad they represent 100 percent of social security fund revenue, followed by Uruguay with about 40 percent; Burundi, Malta, and Colombia with about 30 percent; and Malaysia, Cyprus, Israel, and Trinidad and Tobago with ratios of about 20 percent. In the remainder of developing countries list€d in Table 4, government contributions amount to 10 percent or less of total social security funds revenue.
Thus, a comparison of the magnitude of central government employer contributions and of other government contributions to social security funds, based on Tables 2 and 4, shows a significant difference in the relative importance of these items as sources of social security revenue, particularly among industrial countries. Government contributions other than as employer constitute a more important source of revenue to social security funds in industrial countries and in certain developing countries such as Chad, Cyprus, Greece, Malta, Israel, Malaysia, Colombia, Trinidad and Tobago, and Uruguay. Central government contributions as employer, however, are not a major source of revenue for most social security funds, and
9 Hernando Perez Montas, "Problems and Perspectives in the Financing of Social Security in Latin America," International Social Security Review, 1/83, p. 77.
10 Ibid., p. 75.
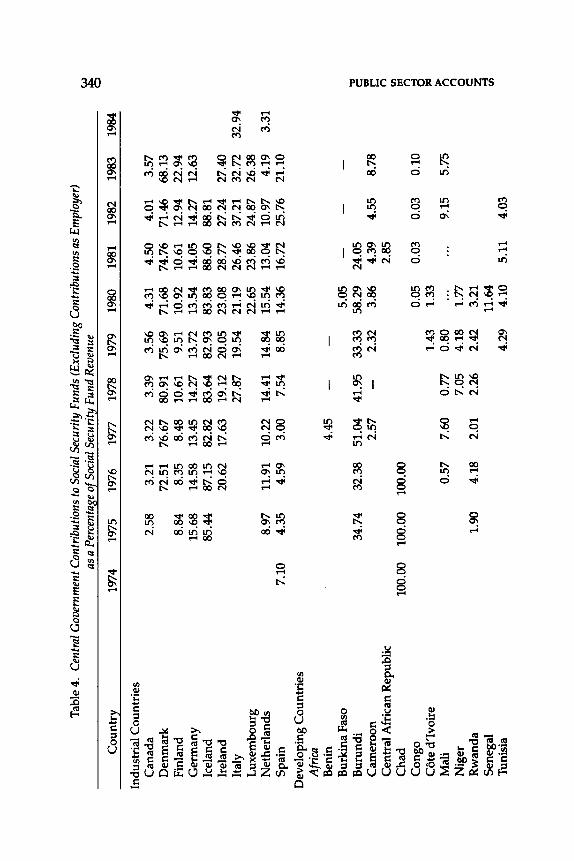
Tab
le 4
. C
entr
al G
over
nmen
t Con
trib
utio
ns to
Soc
ial S
ecur
ity F
unds
(E
xclu
ding
Con
trib
utio
ns a
s E
mpl
oyer
) ~
as a
Per
cent
age
of S
ocia
l Sec
urity
Fun
d R
even
ue
0
Cou
ntry
19
74
1975
19
76
1977
19
78
1979
19
80
1981
19
82
1983
19
84
Indu
stri
al C
ount
ries
C
anad
a 2.
58
3.21
3.
22
3.39
3.
56
4.31
4.
50
4.01
3.
57
Den
mar
k 72
.51
76.6
7 80
.91
75.6
9 71
.68
74.7
6 71
.46
68.1
3 F
inla
nd
8.84
8.
35
8.48
10
.61
9.51
10
.92
10.6
1 12
.94
22.9
4 G
erm
any
15.6
8 14
.58
13.4
5 14
.27
13.7
2 13
.54
14.0
5 14
.27
12.6
3 Ic
elan
d 85
.44
87.1
5 82
.82
83.6
4 82
.93
83.8
3 88
.60
88.8
1 Ir
elan
d 20
.62
17.6
3 19
.12
20.0
5 23
.08
28.7
7 27
.24
27.4
0 It
aly
27.8
7 19
.54
21.1
9 26
.46
37.2
1 32
.72
32.9
4 L
uxem
bour
g 22
.65
23.8
6 24
.87
26.3
8 N
ethe
rlan
ds
8.97
11
.91
10.2
2 14
.41
14.8
4 15
.54
13.0
4 10
.97
4.19
3.
31
Spa
in
7.10
4.
35
4.59
3.
00
7.54
8.
85
14.3
6 16
.72
25.7
6 21
.10
Dev
elop
ing
Cou
ntri
es
Afri
ca
Ben
in
4.45
B
urki
na F
aso
5.05
B
urun
di
34.7
4 32
.38
51.0
4 41
.95
33.3
3 58
.29
24.0
5 ., c::
Cam
eroo
n 2.
57
2.32
3.
86
4.39
4.
55
8.78
ca
-
c C
entr
al A
fric
an R
epub
lic
2.85
n U
l C
had
100.
00
100.
00
100.
00
rrl n
Con
go
0.05
0.
03
0.03
0.
10
Cl C
ote
d'Iv
oire
1.
43
1.33
11
0
Mal
i 0.
57
7.60
0.
77
0.80
9.
15
5.75
>
...
...
n N
iger
7.
05
4.18
1.
77
n 0 R
wan
da
1.90
4.
18
2.01
2.
26
2.42
3.
21
c:: z S
eneg
al
11.6
4 o-
1 U
l
Tun
isia
4.
29
4.10
5.
11
4.03
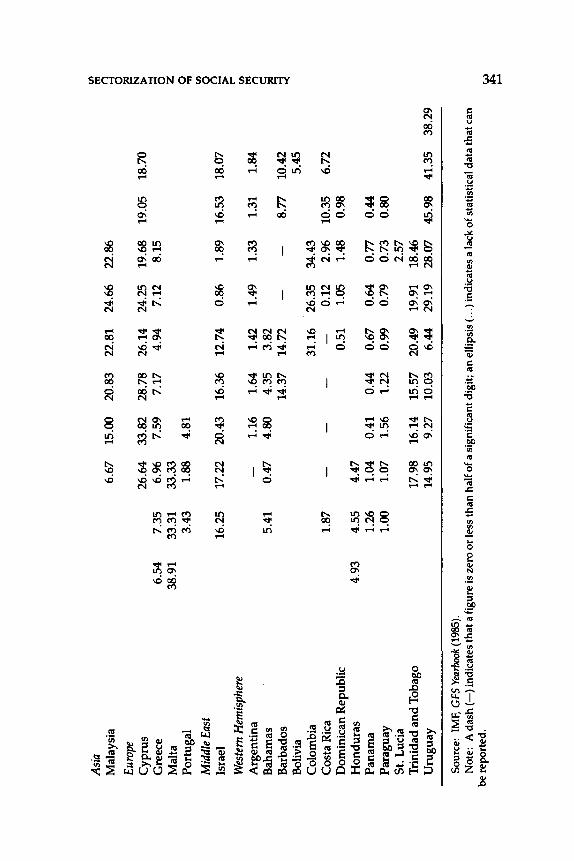
Asi
a U
l Il
l
Mal
aysi
a 6.
67
15.0
0 20
.83
22.8
1 24
.66
22.8
6 t"
l -,
) 0 Eu
rope
22
Cyp
rus
26.6
4 33
.82
28.7
8 26
.14
24.2
5 19
.68
19.0
5 18
.70
N >
Gre
ece
6.54
7.
35
6.96
7.
59
7.17
4.
94
7.12
8.
15
:::!
0 M
alta
38
.91
33.3
1 33
.33
z P
ortu
gal
3.43
1.
88
4.81
0 ""
Mid
dle
East
Ul 0
Isra
el
16.2
5 17
.22
20.4
3 16
.36
12.7
4 0.
86
1.89
16
.53
18.0
7 t"
l >
Wes
tern
Hem
isph
ere
r"
Ul
Arg
enti
na
-1.
16
1.64
1.
42
1.49
1.
33
1.31
1.
84
Ill
t"l
Bah
amas
5.
41
0.47
4.
80
4.35
3.
82
c: 22 B
arba
dos
14.3
7 14
.72
--
8.77
10
.42
~ B
oliv
ia
5.45
C
olom
bia
31.1
6 26
.35
34.4
3 C
osta
Ric
a 1.
87
--
--
0.12
2.
96
10.3
5 6.
72
Dom
inic
an R
epub
lic
0.51
1.
05
1.48
0.
98
Ho
nd
ura
s 4.
93
4.55
4.
47
Pan
ama
1.26
1.
04
0.41
0.
44
0.67
0.
64
0.77
0.
44
Par
agua
y 1.
00
1.07
1.
56
1.22
0.
99
0.79
0.
73
0.80
S
t. L
ucia
2.
57
Tri
nida
d an
d T
obag
o 17
.98
16.1
4 15
.57
20.4
9 19
.91
18.4
6 U
rugu
ay
14.9
5 9.
27
10.0
3 6.
44
29.1
9 28
.07
45.9
8 41
.35
38.2
9
Sour
ce:
IMF,
GFS
Yea
rboo
k (1
985)
. N
ote:
A
dash
(-)
indi
cate
s th
at a
figu
re is
zer
o or
less
than
hal
f of a
sig
nifi
cant
dig
it;
an e
llip
sis(
... )
indi
cate
s a
lack
of s
tati
stic
al d
ata
that
can
be
rep
orte
d.
~
......
342 PUBLIC SECTOR ACCOUNTS
their importance has declined over the years. Significant exceptions appear among the English-speaking Caribbean countries with relatively new social security schemes, where the central government seems to contribute mostly in its role as employer.
To provide the budgetary support for social security needs, central governments, particularly in the industrial countries, have found it necessary to tap additional sources of revenue. In Germany, for example, part of a package to deal with the financial crisis caused by the recession of 1974 included a "general tax increase to permit a larger federal subsidy to the pension system." 11 In general, among industrial countries "total reliance on national government aid with regard to the entire cost of the pension dynamic is either a fact, as in the United Kingdom, or a mounting demand. " 12 France in 1983 introduced a 5 percent tax on advertising expenditures by the pharmaceutical industry, added new taxes on alcohol and tobacco, and doubled the auto insurance surcharge paid to the health insurance funds. 13 Special taxes were imposed in Brazil (on lottery, other gambling, petrol, and imports) and in Panama; value-added taxes and production taxes are levied in Argentina and Uruguay.14
Throughout a conference convened by the International Social Security Association in 1979, "there was acknowledgement of past, and prediction of future, increases in general revenue subsidies in the financing of social security." 1s Both statistics and policy discussions, therefore, reflect the financial stress that most social security funds around the world now face and their increased dependence on central government support. This takes the form of direct budgetary transfers or earmarked collections from special taxes levied for this purpose, with consequent increases in central government influence over benefits, policies, and performance. In many countries, part of central government's strategy to deal with inflation has included curbing of social security fund expenditures by altering the automatic adjustment mechanism for cash benefits, reducing other benefit expenditures, and controlling social security investments. Price increases that accompanied rising unemployment and slow economic
11 George Rohrlich, "Maintaining Social Security Pension Schemes Adequate and Solvent-A Transnational Synopsis of Problems and Policies," International Social Security Review, 2180, p. 151.
12 Ibid., p. 152. 13 U.S. Department of Health and Human Services, Social Security Programs
Throughout the World, p. xiii. 14 Perez Montas, "Problems and Perspectives," pp. 70-71, 77. 15 Rohrlich, "Maintaining Social Security Pension Schemes," p. 152.
SECTORIZATION OF SOCIAL SECURITY 343
growth resulted in financial difficulties for social security funds and the rest of central government. Governments were faced with the need to reduce expenditures, particularly those on public health care and pensions, which "are the two largest items in the social budgets of western states, and represent on average about two-thirds of social expenditure. ''16
Thus, "since 1981 several countries have postponed or limited benefit adjustments. " 17 In Canada, old-age and family allowance benefits that were previously automatically linked to changes in the consumer price index were capped at 6 percent for 1983 and 5 percent for 1984. Denmark temporarily suspended, from January 1983 to April1985, the indexation to price changes for certain benefits. Similar changes took place in Finland, Greece, Sweden, Germany, and the United States. In the Netherlands, Finland, and the United Kingdom, the government adjusts the rates at its discretion, whereas Switzerland and Italy adhere to mixed indices.
II. Central Government Control Over Investment of Social Security Fund Reserves
The financial independence of social security funds has been increasingly subjected, in recent years, to the overarching requirements of national fiscal management. "It is only during the past decade that the need has been keenly felt for a thorough study of the relationship between social security and the economy, and the integration of social security resources with the economic strategy. Conventional planning has tended to ignore the interaction between the factors of social security and economic aggregates. " 18 To carry out their broader policy objectives, central governments in many countries have found it necessary to control or direct the investment of social security funds reserves, for the management of government debt and the promotion of programs of interest to the government. Central governments have guided social security funds toward investing part or all of their reserves in government securities yielding lower rates of return, or in social projects such as construction of
16 F. Kaufmann and L. Leisering, "Demographic Changes as a Problem for Social Security Systems," International Social Security Review, 4/84, p. 395.
17 U. S. Department of Health and Human Services, Social Security Programs Throughout the World, p. xii.
18 Mohamed Gourja, "The Contribution of Social Security to Development of Objectives: The Role of Income Support Measures," International Social Security Review, 2/81, p. 131.
344 PUBLIC SECTOR ACCOUNTS
hospitals and medical facilities or projects intended to generate income and contribute to economic development.
In a meeting of experts on investments of social security funds in developing countries, called by the International Labor Organization in November 1983, it was stressed that "the demands made on the social security system to invest its reserves in projects having social or economic value could not be ignored."19 For example, "in Mauritius, the law requires that reserves be invested mainly in long-term government stocks and Treasury Bills"; in Morocco through 1972, "social security investments could be made only in Treasury Bills or bonds guaranteed by the state."20 The law was changed thereafter, requiring that social security funds' reserves other than those needed for current operations be deposited with the Deposit and Administration Fund which "acts in accordance with the government policy and the objectives of the Economic and Social Development Plans."21 In Sudan, "the general policy has been to invest in government bonds and in property, provided that a balance was maintained between social and commercial investments. At the end of June 1982, the investment portfolio consisted mainly of 60 percent in loans to the Government or in Government bonds, 22 percent in fixed deposits in banks, and 16 percent in property. "22
During the Eighth African Regional Conference of the International Social Security Association in September 1984, it was observed that "most of the social security schemes invested the bulk of the reserve funds in government bonds and loans, bank deposits, and property, particularly those concerned with improvements in health infrastructures.' '23 In several Latin American countries, ''social security institutions lack sophisticated investment machinery or the legislation itself prevents them from obtaining maximum yield on their investments compatible with the capital market situation. "24 Among the Englishspeaking Caribbean countries, it was apparent that in Barbados, Jamaica, Guyana, and Trinidad and Tobago, "the national insurance boards were making strenuous efforts to identify sound and profit-
19 International Social Security Association, "International News," "Meeting of Experts on Investment of Social Security Funds in Developing Countries," International Social Security Review, 2184, p. 219.
20 Gourja, "Contribution of Social Security to Development," p. 145. 21 Ibid., p. 142. 22 International Social Security Association, "ISSA News," "Eighth Afri
can Regional Conference," International Social Review, 4/84, p. 480. 23 Ibid., p. 481. 24 Perez Montas, "Problems and Perspectives," p. 85.
SECTORIZATION OF SOCIAL SECURITY 345
able investments, but were subject to ministerial authority in establishing their investment portfolios.' '25 Clearly, a major concern facing all social security funds with investible reserves has been how to reconcile their requirements for sufficiently high yields with the social and economic objectives imposed by investment decisions taken by the central government. Any financial independence exercised in the investment of social security fund reserves in early periods has more recently been constrained by the control of social security fund investments as one more instrument of central fiscal policy.
III. Use of Social Security Funds to Control Unemployment
Central governments, especially in industrial countries, have used social security funds not only to compensate the unemployed but also as a tool to reduce unemployment. To enhance employment opportunities for the unemployed and younger people, authorities have acted to lower retirement ages. In the United Kingdom, for example, 1976 legislation provided for retirement one year before the normal retirement age, with a higher than normal pension when the vacancy created was filled by an unemployed person. "As part of a general policy to encourage employment, France is paying full pensions at age 60 (instead of the previous 65) and has eliminated the incentive of 5 percent a year for delaying retirement."26 Similar legislation has been passed in other industrial countries (for example, Belgium and Spain). Lowering the retirement age and making early retirement more attractive has also been used to control unemployment among developing countries, such as Tunisia, Nicaragua, and Nigeria.27 The increased benefits that social security funds are called upon to support must be viewed as the cost of meeting the broader social and economic objectives of central government.
Central governments have also used variations in social security contributions as a fiscal policy tool to control unemployment. In Belgium in 1982, for example, employers were exempted from social security contributions over a period of six months in an effort to stimulate employment. In Italy, through a law of November 1980, the
2s International Social Security Association, "ISSA News," "Third Meeting of the Heads of ISSA Member Organizations in the English-speaking Caribbean," International Social Security Review, 1183, p. 117.
26 U.S. Department of Health and Human Services, Social Security Programs Throughout the World, p. xiii.
27 Ibid., pp. xii-xiii.
346 PUBLIC SECTOR ACCOUNTS
central government assumed responsibility for ''a reduction in the employers' social security contributions in manufacturing firms and certain other undertakings."28 In Chile, employer contributions for family allowances and unemployment benefits were abolished in 1980, to be financed out of general tax revenue.29
Central governments have also used social security funds as direct creators of employment. For example, in Seychelles, in order to fight unemployment, the social security system "provides subsistence wages to unemployed persons who choose to work on governmentapproved work projects."30 Central governments have also used social security funds to attract foreign workers. In European countries, it has been observed that "where wages are more or less equal, the preference of immigrant workers goes to the countries whose social legislation offers the best advantages"; in Morocco, "social legislation was the means of enticing skilled European manpower to the country shortly after colonization ended.''31
Independent financial management of social security funds has had to give way to the variation of social security benefits and contributions as a fiscal policy instrument to counteract unemployment within the central government's broad mix of economic policies.
I'V. Central Government as Direct Provider of Social Security and Welfare Services
The burgeoning size of health, social security, and welfare costs in recent years has stimulated a sharing in the provision for these functions between social security funds and other parts of government. Measurement of social security funds' expenditures alone, or of central government's expenditures excluding social security funds, now fails to portray the full measure of such functions carried out by government.
An indication of participation in the provision of health care ser-
28 International Social Security Association, "International News," "Social Security in the Member States of the European Community in 1980," International Social Security Review, 2/81, p. 210.
29 International Social Security Association, "Social Security News," "New Pension Legislation in Chile," International Social Security Review, 2/81, p.198.
30 International Social Security Association, "Social Security News," "Seychelles: Full Employment Scheme Established," International Social Security Review, 2/81, p. 201.
31 Gourja, "Contribution of Social Security to Development," p. 147.
SECTORIZATION OF SOCIAL SECURITY 347
vices by parts of central government other than social security funds is given in Table 5, which shows budgetary expenditures on health as a percentage of the combined expenditures on this function by central government and social security funds in 20 countries during 1974-84. A wide contrast is evident. In Finland, about 75 percent of all health expenditures are executed inside the budget, followed by the United States and Iceland, with about 40 percent. Other industrial countries listed, however, show low ratios not exceeding 16 percent (Norway in 1977). Latin American countries show ratios ranging from 33 percent in Brazil in 1974 to 73 percent in the Dominican Republic in 1983. The few ratios available for Africa (Cameroon, Djibouti, and Tunisia) suggest that public health in the African countries is offered mainly through health programs carried out directly by central government.
Another indication of the magnitude of other social services provided directly by central government can be obtained from Table 6, which shows budgetary central government expenditures on social security and welfare (excluding health) as a percentage of the combined expenditures on this function by central government and social security funds for the period 1974-84. Here, too, contrast is evident. In half of the 16 industrial countries listed, at least 30 percent of social security and welfare expenditures are made by government units inside the budget, with Denmark, Sweden, and Canada showing ratios between 70 percent and 90 percent, and France and Germany showing ratios of about 20 percent. Only Belgium and Italy show ratios not greater than 10 percent. Among developing countries, only 4 of the 16 African countries listed show ratios of 10 percent or less in 1980, while in the remainder up to 67 percent of social security welfare expenditures is carried out by budgetary government units. About half of the nonindustrial European and Middle Eastern countries listed show high but declining ratios of social security and welfare expenditures carried out by budgetary central government, ranging between about 30 percent and 60 percent in the early 1980s, except for Romania, where almost all such expenditures are carried out by the budget. In the Western Hemisphere, most of the Englishspeaking Caribbean countries also show large but declining ratios of budgetary social security and welfare expenditures, ranging from 80 percent in Trinidad and Tobago in 1980 to about 30 percent in Guyana in 1983. Of the 13 remaining countries in this area, Paraguay, Costa Rica, the Dominican Republic, Honduras, and Venezuela show ratios ranging from about 50 percent to 80 percent, followed by Panama, Argentina, Brazil, and Mexico with ratios between 10 percent and 25 percent.
The sharing of responsibilities for health, welfare, and social secu-
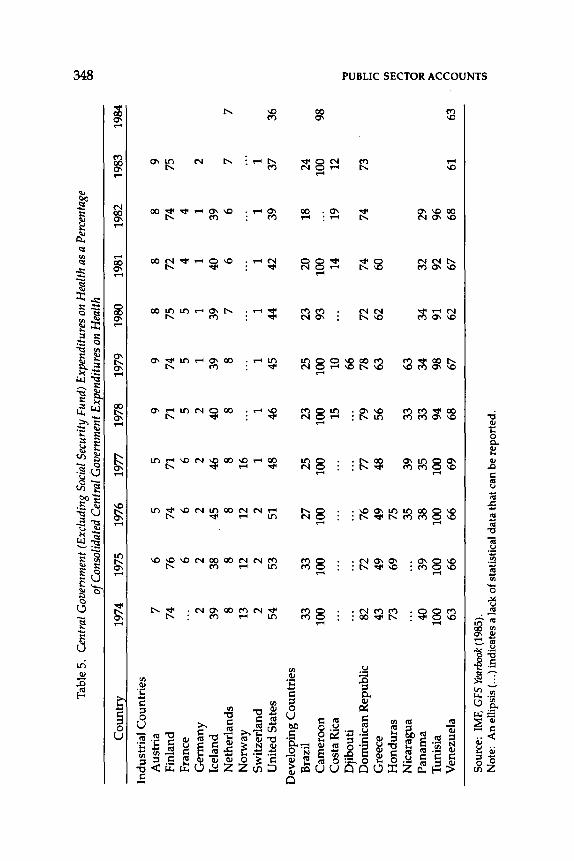
Tab
le 5
. C
entr
al G
over
nmen
t (E
xclu
ding
Soc
ial
Secu
rity
Fun
d) E
xpen
ditu
res
on H
ealth
as
a Pe
rcen
tage
~
o[ C
onso
lidat
ed C
entr
al G
over
nmen
t E
xpen
ditu
res
on H
ealth
0
0
Co
un
try
19
74
1975
19
76
1977
19
78
1979
19
80
1981
19
82
1983
19
84
Indu
stri
al C
ount
ries
A
ustr
ia
7 6
5 5
9 9
8 8
8 9
Fin
land
74
76
74
71
71
74
75
72
74
75
F
ranc
e ...
6
6 6
5 5
5 4
4 G
erm
any
2
2 2
2 2
1 1
1 1
2 Ic
elan
d 39
38
45
46
40
39
39
40
39
N
eth
erla
nd
s 8
8 8
8 8
8 7
6 6
7 7
No
rway
13
12
12
16
S
wit
zerl
and
2 2
2 1
1 1
1 1
1 1
Uni
ted
Sta
tes
54
53
51
48
46
45
44
42
39
37
36
Dev
elop
ing
Cou
ntri
es
Bra
zil
33
33
27
25
23
25
23
20
18
24
Cam
ero
on
10
0 10
0 10
0 10
0 10
0 10
0 93
10
0 ...
10
0 98
C
osta
Ric
a ...
. ..
. ..
. ..
15
10
...
14
19
12
D
jibo
uti
66
'"0
...
. ..
. ..
...
. .. c::
Dom
inic
an R
epub
lic
82
72
76
77
79
78
72
74
74
73
1:1!1
r-'
Gre
ece
43
49
49
48
56
63
62
60
;:; H
on
du
ras
73
69
75
r.n
m
(")
Nic
arag
ua
...
. ..
35
39
33
63
o-1
0 P
anam
a 40
39
38
35
33
34
34
32
29
::;
tl
Tun
isia
10
0 10
0 10
0 10
0 94
98
91
92
96
>
("
)
Ven
ezue
la
63
66
66
69
68
67
62
67
68
61
63
(") 0 c::
Sour
ce:
IMF,
GFS
Yea
rboo
k (1
985)
. z o-1
r.n
N
ote:
A
n el
lipsi
s( ..
. ) in
dica
tes
a la
ck o
f sta
tistic
al d
ata
that
can
be
repo
rted
.
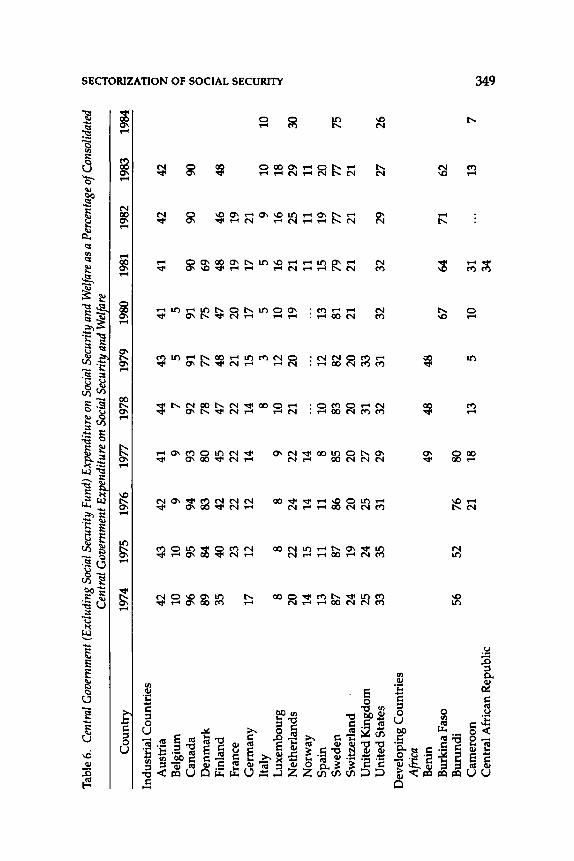
Tabl
e 6.
C
entr
al G
over
nmen
t (E
xclu
ding
Soc
ial S
ecur
ity F
und)
Exp
endi
ture
on
Soci
al S
ecur
ity a
nd W
elfa
re a
s a
Perc
enta
ge o
f Con
solid
ated
(,
/)
1!1
Cen
tral
Gov
ernm
ent E
xpen
ditu
re o
n So
cial
Sec
urity
and
Wel
fare
n d
Cou
ntrl:
: 19
74
1975
19
76
1977
19
78
1979
19
80
1981
19
82
1983
19
84
i!:! N >
Indu
stri
al C
ount
ries
:::!
A
ustr
ia
42
43
42
41
44
43
41
41
42
42
0 z B
elgi
um
10
10
9 9
7 5
5 0 "'
I C
anad
a 96
95
94
93
92
91
91
90
90
90
(,
/)
Den
mar
k 89
84
83
80
78
77
75
69
0 n
Finl
and
35
40
42
45
47
48
47
48
46
48
>
r"
Fran
ce
23
22
22
22
21
20
19
19
(,/)
1!
1 G
erm
any
17
12
12
14
14
15
17
17
21
n 0 Ita
ly
8 3
5 5
9 10
10
i!:!
Lux
embo
urg
8 8
8 9
10
12
10
16
16
18
~ N
ethe
rlan
ds
20
22
24
22
21
20
19
21
25
29
30
Nor
way
14
15
14
14
...
...
.. .
11
11
11
Sp
ain
13
11
11
8 10
12
13
15
19
20
Sw
eden
87
87
86
85
83
82
81
79
77
77
75
Sw
itzer
land
24
19
20
20
20
20
21
21
21
21
U
nite
d K
ingd
om
25
24
25
27
31
33
Uni
ted
Stat
es
33
35
31
29
32
31
32
32
29
27
26
Dev
elop
ing
Cou
ntri
es
Afri
ca
Ben
in
49
48
48
Bur
kina
Fas
o 67
64
71
62
B
urun
di
56
52
76
80
Cam
eroo
n 21
18
13
5
10
31
...
13
7 C
entr
al A
fric
an R
epub
lic
34
~
\C
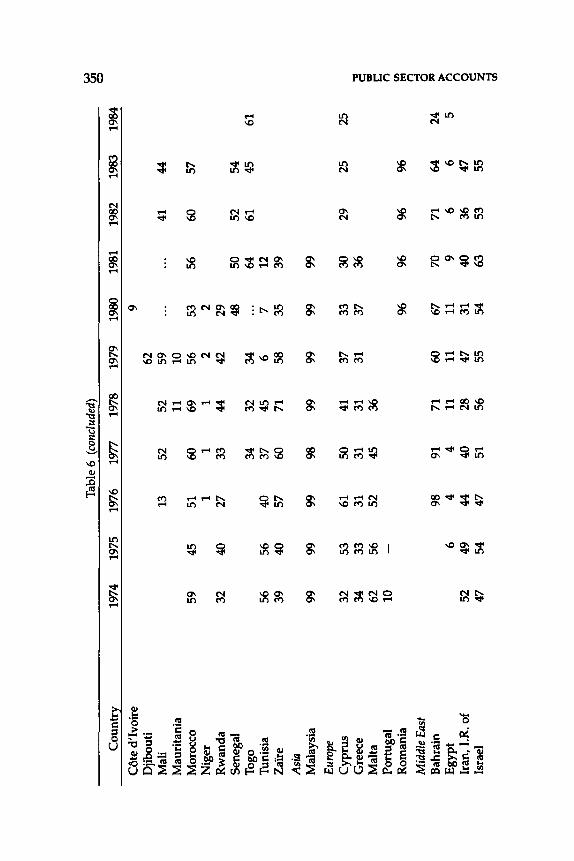
Tabl
e 6
(con
clud
ed)
w
U1
0
Cou
ntry
19
74
1975
19
76
1977
19
78
1979
19
80
1981
19
82
1983
19
84
Cot
e d'
Ivoi
re
9 D
jibou
ti 62
M
ali
13
52
52
59
... ...
41
44
M
auri
tani
a 11
10
M
oroc
co
59
45
51
60
69
56
53
56
60
57
Nig
er
1 1
1 2
2 R
wan
da
32
40
27
33
44
42
29
Sene
gal
48
50
52
54
Togo
34
32
34
...
64
61
45
61
T
unis
ia
56
56
40
37
45
6 7
12
Zai
re
39
40
57
60
71
58
35
39
Asi
a M
alay
sia
99
99
99
98
99
99
99
99
Euro
pe
Cyp
rus
32
53
61
50
41
37
33
30
29
25
25
Gre
ece
34
33
31
31
31
31
37
36
~ M
alta
62
56
52
45
36
=
c Po
rtug
al
10
-n
Rom
ania
96
%
96
96
U
l tr
l n M
iddl
e Ea
st Cl
Bah
rain
98
91
71
60
67
70
71
64
24
1:1
0 >
Egy
pt
6 4
4 11
11
11
9
6 6
5 n n
Iran
, I.R
. of
52
49
44
40
28
47
31
40
36
47
0 Is
rael
47
54
47
51
56
55
54
63
53
55
c:: z ~ U
l
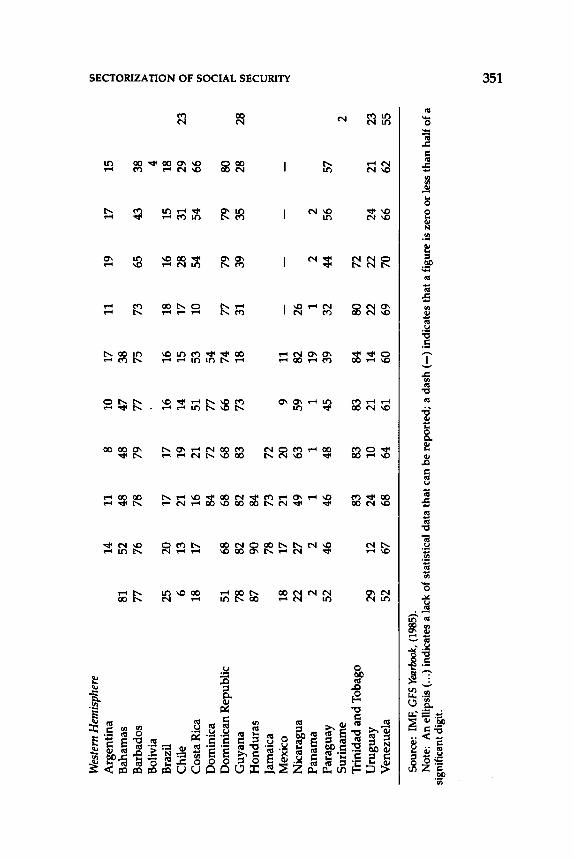
Wes
tern
Hem
isph
ere
U:l
Ill
Arg
enti
na
14
11
8 10
17
11
19
17
15
n -'
I B
aham
as
81
52
48
48
47
38
0 !!:! B
arba
dos
77
76
78
79
77
75
73
65
43
38
N >
Bol
ivia
4
::!
Bra
zil
25
20
17
17
16
16
18
16
15
18
0 z C
hile
6
13
21
19
14
15
17
28
31
29
23
0 C
osta
Ric
a 18
17
16
21
51
53
10
54
54
66
"" U:l
Dom
inic
a 84
72
77
54
0 n
Dom
inic
an R
epub
lic
51
68
68
68
66
74
77
79
79
80
>
Gu
yan
a 78
82
82
83
73
18
31
39
35
28
28
r"
U
:l
Ho
nd
ura
s 87
90
84
Il
l n Ja
mai
ca
78
73
72
c:: !!:! M
exic
o 18
17
21
20
9
11
--
--
::;! N
icar
agua
22
27
49
63
59
82
26
P
anam
a 2
2 1
1 1
19
1 2
2 P
arag
uay
52
46
46
48
45
39
32
44
56
57
Su
rin
ame
2 T
rini
dad
and
Tob
ago
83
83
83
84
80
72
Uru
gu
ay
29
12
24
10
21
14
22
22
24
21
23
Ven
ezue
la
52
67
68
64
61
60
69
70
66
62
55
Sou
rce:
IM
F, G
FS Y
earb
ook,
(19
85).
Not
e:
An
elli
psis
( ...
) in
dica
tes
a la
ck o
f st
atis
tica
l dat
a th
at c
an b
e re
port
ed;
a d
ash
(-)
indi
cate
s th
at a
fig
ure
is z
ero
or
less
th
an h
alf
of a
si
gnif
ican
t dig
it.
~
~

352 PUBLIC SECTOR ACCOUNTS
rity functions between social security funds and other parts of government is reflected also in more closely integrated administrative arrangements. The many ramifications of social security activities in industrial countries have required coordination of social security funds with other central government units in order to economize resources, avoid overlapping of services, promote uniformity of the services provided, and avoid abuse of these benefits. For example, efficient administration of housing benefits available under some social security funds requires close cooperation with the housing authorities of central government. Administration of employment benefits must be integrated with labor market research, placement services, and education policies, which fall outside the confines of social security funds' functions. In the area of health and occupational injury, the prevention of technological risks has required direct central government efforts to make the working environment safer and healthier.
In some countries there is evidence of a movement toward centralization of social security programs within one institution, or the turning over of the administrative powers of social security funds to the budgetary central government. In Greece, for example, "in addition to building up national health service, the Government has continued its efforts to bring the many different social security bodies together within one organization."32 In Hungary, "as from July 1, 1984, the management of social insurance was transferred to the State, through a new National Insurance Administration, which carries out its functions with the status of a state body with national competence, coming directly under the Council of Ministries."33 In Uruguay, under the Constitutional Decree of October 23, 1979, "the administration of social security was centralized in a new General Directorate under the Ministry of Labour and Social Security."34
As a result, several autonomous social security agencies have been abolished, and their funds transferred to central government. In France, the Social Security Scheme created in 1930 was endowed with
32 International Social Security Association, "International News," "Social Security in the Member States of the European Community in 1984," International Social Security Review, 3/85, p. 309.
33 International Social Security Association, "Social Security News," "Hungary: Transfer of the Management of Social Insurance to the State," International Social Security Review, 4184, p. 444.
34 International Social Security Association, "Social Security News," "Uruguay: Pension Age Raised," International Social Security Review, 2180, p. 208.
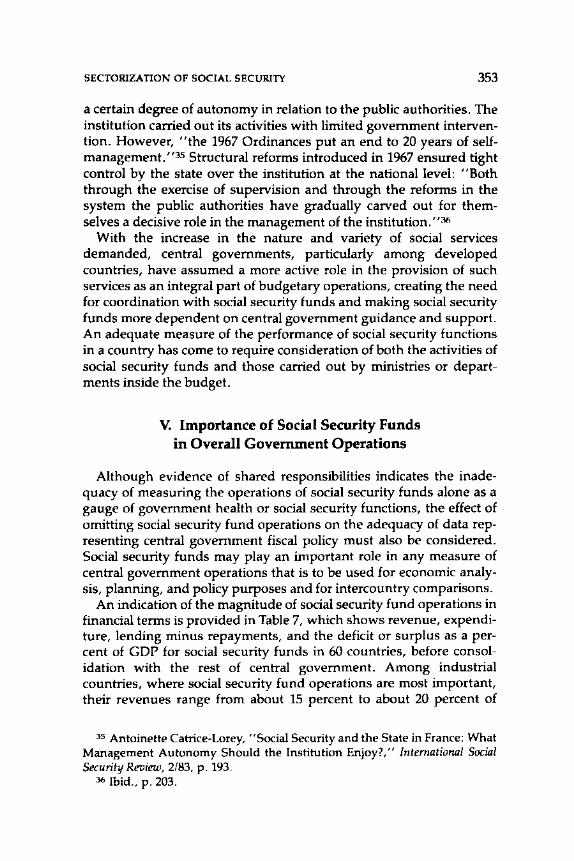
SECTORIZATION OF SOCIAL SECURITY 353
a certain degree of autonomy in relation to the public authorities. The institution carried out its activities with limited government intervention. However, "the 1967 Ordinances put an end to 20 years of selfmanagement."35 Structural reforms introduced in 1967 ensured tight control by the state over the institution at the national level: "Both through the exercise of supervision and through the reforms in the system the public authorities have gradually carved out for themselves a decisive role in the management of the institution."36
With the increase in the nature and variety of social services demanded, central governments, particularly among developed countries, have assumed a more active role in the provision of such services as an integral part of budgetary operations, creating the need for coordination with social security funds and making social security funds more dependent on central government guidance and support. An adequate measure of the performance of social security functions in a country has come to require consideration of both the activities of social security funds and those carried out by ministries or departments inside the budget.
V. Importance of Social Security Funds in Overall Government Operations
Although evidence of shared responsibilities indicates the inadequacy of measuring the operations of social security funds alone as a gauge of government health or social security functions, the effect of omitting social security fund operations on the adequacy of data representing central government fiscal policy must also be considered. Social security funds may play an important role in any measure of central government operations that is to be used for economic analysis, planning, and policy purposes and for intercountry comparisons.
An indication of the magnitude of social security fund operations in financial terms is provided in Table 7, which shows revenue, expenditure, lending minus repayments, and the deficit or surplus as a percent of GOP for social security funds in 60 countries, before consolidation with the rest of central government. Among industrial countries, where social security fund operations are most important, their revenues range from about 15 percent to about 20 percent of
Js Antoinette Catrice-Lorey, "Social Security and the State in France: What Management Autonomy Should the Institution Enjoy?," International Social Security Review, 2/83, p. 193.
36 Ibid., p. 203.
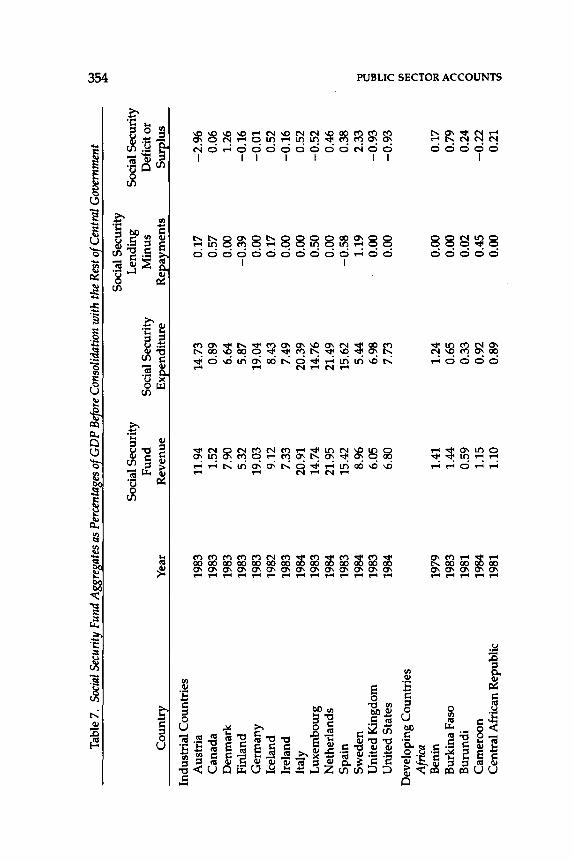
Tab
le 7
. So
cial
Sec
urity
Fun
d A
ggre
gate
s as
Per
cent
ages
of G
DP
Bef
ore
Con
solid
atio
n w
ith t
he R
est o
f Cen
tral
Gov
ernm
ent
~ """
Soc
ial S
ecur
ity
Soc
ial S
ecur
ity
Len
ding
So
cial
Sec
urit
y F
und
Soci
al S
ecur
ity
Min
us
Def
icit
or
Co
un
trr
Yea
r R
even
ue
ExE
endi
ture
R
eEar
men
ts
Sur
plus
Indu
stri
al C
ount
ries
A
ustr
ia
1983
11
.94
14.7
3 0.
17
-2.9
6
Can
ada
1983
1.
52
0.89
0.
57
0.06
D
enm
ark
1983
7.
90
6.64
0.
00
1.26
F
inla
nd
1983
5.
32
5.87
-0
.39
-0
.16
G
erm
any
1983
19
.03
19.0
4 0.
00
-0.0
1
Icel
and
1982
9.
12
8.43
0.
17
0.52
Ir
elan
d 19
83
7.33
7.
49
0.00
-0
.16
It
aly
1984
20
.91
20.3
9 0.
00
0.52
L
uxem
bour
g 19
83
14.7
4 14
.76
0.50
-0
.52
N
ethe
rlan
ds
1984
21
.95
21.4
9 0.
00
0.46
S
pain
19
83
15.4
2 15
.62
-0.5
8
0.38
S
wed
en
1984
8.
96
5.44
1.
19
2.33
~
Uni
ted
Kin
gdom
19
83
6.05
6.
98
0.00
-0
.93
=
U
nite
d S
tate
s 19
84
6.80
7.
73
0.00
-0
.93
c n
Dev
elop
ing
Cou
ntri
es
r:r>
l:!l
(')
Afri
ca
""" 0 B
enin
19
79
1.41
1.
24
0.00
0.
17
lOa
Bur
kina
Fas
o 19
83
1.44
0.
65
0.00
0.
79
>
(')
Bur
undi
19
81
0.59
0.
33
0.02
0.
24
(') 0
Cam
eroo
n 19
84
1.15
0.
92
0.45
-0
.22
c: z
Cen
tral
Afr
ican
Rep
ublic
19
81
1.10
0.
89
0.00
0.
21
""" r:r>
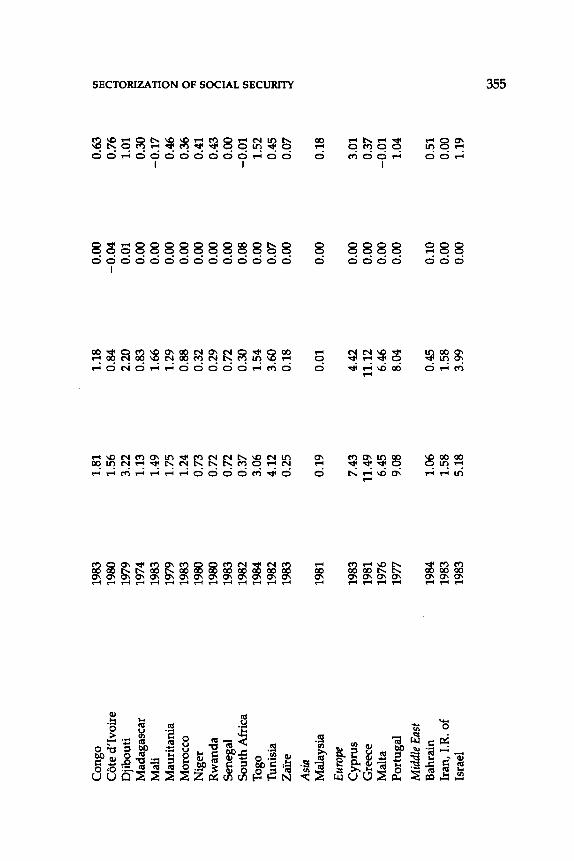
Con
go
1983
1.
81
1.18
0.
00
0.63
U
l 1:1
1
Cot
e d'
Ivoi
re
1980
1.
56
0.84
-0
.04
0.
76
n
Dji
bout
i 19
79
3.22
2.
20
0.01
1.
01
d 2!! M
adag
asca
r 19
74
1.13
0.
83
0.00
0.
30
N >
Mal
i 19
83
1.49
1.
66
0.00
-0
.17
>-
1
Mau
rita
nia
1979
1.
75
1.29
0.
00
0.46
0 z
Mor
occo
19
83
1.24
0.
88
0.00
0.
36
0 N
iger
19
80
0.73
0.
32
0.00
0.
41
.... Ul
Rw
anda
19
80
0.72
0.
29
0.00
0.
43
0 n S
eneg
al
1983
0.
72
0.72
0.
00
0.00
>
S
outh
Afr
ica
1982
0.
37
0.30
0.
08
-0.0
1
I""
Ul
Tog
o 19
84
3.06
1.
54
0.00
1.
52
1:11 n
Tun
isia
19
82
4.12
3.
60
0.07
0.
45
c:: 2!!
Za'
ire
1983
0.
25
0.18
0.
00
0.07
~
Asi
a M
alay
sia
1981
0.
19
0.01
0.
00
0.18
Euro
pe
Cyp
rus
1983
7.
43
4.42
0.
00
3.01
G
reec
e 19
81
11.4
9 11
.12
0.00
0.
37
Mal
ta
1976
6.
45
6.46
0.
00
-0.0
1
Por
tuga
l 19
77
9.08
8.
04
0.00
1.
04
Mid
dle
East
Bah
rain
19
84
1.06
0.
45
0.10
0.
51
Iran
, I.
R.
of
1983
1.
58
1.58
0.
00
0.00
Is
rael
19
83
5.18
3.
99
0.00
1.
19
w
01
0
1
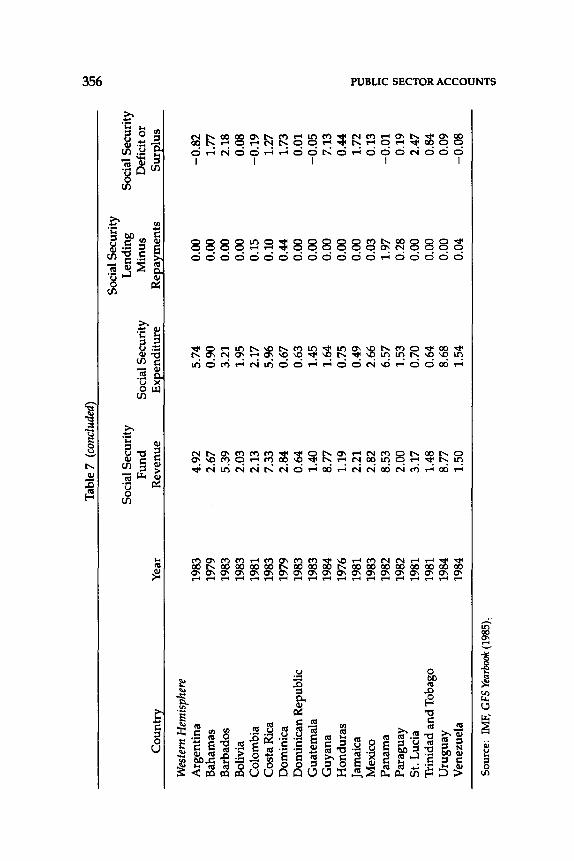
Tab
le 7
(co
nclu
ded)
~
Soci
al S
ecur
ity
Soci
al S
ecur
ity
Len
ding
So
cial
Sec
urit
y F
un
d
Soci
al S
ecur
ity
Min
us
Def
icit
or
Cou
ntry
Y
ear
Rev
enue
Ex~enditure
Re~ayments
Su!:
£lus
Wes
tern
Hem
isph
ere
Arg
enti
na
1983
4.
92
5.74
0.
00
-0.8
2
Bah
amas
19
79
2.67
0.
90
0.00
1.
77
Bar
bado
s 19
83
5.39
3.
21
0.00
2.
18
Bol
ivia
19
83
2.03
1.
95
0.00
0.
08
Col
ombi
a.
1981
2.
13
2.17
0.
15
-0.1
9
Cos
ta R
ica
1983
7.
33
5.%
0.
10
1.27
D
omin
ica
1979
2.
84
0.67
0.
44
1.73
D
omin
ican
Rep
ublic
19
83
0.64
0.
63
0.00
0.
01
Gua
tem
ala
1983
1.
40
1.45
0.
00
-0.0
5
Guy
ana
1984
8.
77
1.64
0.
00
7.13
H
ondu
ras
1976
1.
19
0.75
0.
00
0.44
Ja
mai
ca
1981
2.
21
0.49
0.
00
1.72
~
Mex
ico
1983
2.
82
2.66
0.
03
0.13
=
t:
Pan
ama
1982
8.
53
6.57
1.
97
-0.0
1
('1
Par
agua
y 19
82
2.00
1.
53
0.28
0.
19
til
rrl
('1
St
. L
ucia
19
81
3.17
0.
70
0.00
2.
47
--!
Tri
nida
d an
d T
obag
o 19
81
1.48
0.
64
0.00
0.
84
0 :-:1
Uru
guay
19
84
8.77
8.
68
0.00
0.
09
>
('1
Ven
ezue
la
1984
1.
50
1.54
0.
04
-0.0
8
('1
0 c:: S
ourc
e: I
MF,
GFS
Yea
rboo
k (1
985)
. z --
! ti
l
SECTORIZATION OF SOCIAL SECURITY 357
GOP in 5 of the 14 countries listed in the years shown (1982, 1983, or 1984). The remaining industrial countries show ratios ranging from about 5 percent to about 12 percent, except for Canada, where the low ratio (1.5 percent) reflects the existence of important social security programs within the budget.
In the four nonindustrial European countries listed, social security fund revenues range from about 7 percent to about 11 percent of GOP, with Greece showing the highest ratio (11.5). Social security funds are the least important in Africa, where most of the countries listed show social security fund revenue ratios of less than 2 percent of GOP. Approximately half of the Latin American countries listed have social security funds with revenues ranging between 2 percent and 5 percent of GOP, and in five countries revenues are higher, amounting to as much as 9 percent of GOP. About a fourth of the countries listed in Table 7 show deficits of less than 1 percent of GOP. Surpluses shown for the remaining countries fall within a range of 0.01 percent to 2.5 percent, except for Guyana, which shows 7.1 percent.
The primary sources of income for social security funds are contributions from employers, employees, and the government and returns on investments of social security reserves. According to the data for social security funds published in the 1985 GFS Yearbook, employers' and employees' contributions account for at least 70 percent of total social security fund revenue in most countries. In Canada, Finland, and Sweden such contributions amount to about 60 percent of total revenue; in Denmark, Egypt, Argentina, and Brazil, between about 40 percent and 50 percent. Whatever their magnitude, social security contributions represent compulsory payments and thus resemble a wage tax. Social security contributions by employers and employees are an important part of the tax structure in many countries and cannot be omitted from the statistics of central government without giving an incomplete picture of tax revenue.
To measure the importance of contributions to social security funds in overall central government tax revenue, Table 8 compares central government tax revenue for 72 countries as a percentage of GOP both before and after consolidation with social security funds, for the earliest and most recent years available in the 1985 GFS Yearbook. Again, sharp contrasts in the importance of social security funds are evident. Among industrial countries, the central government tax ratio is raised by only about 1 percent of GOP in Canada, Denmark, and Iceland when consolidated with social security funds, but by as much as about 20 percent of GOP in the Netherlands, followed by about 19 percent in France and about 16 percent in Germany. About a third
358 PUBLIC SECTOR ACCOUNTS
of the industrial countries show tax ratio increases ranging between 10 percent and 13 percent of GOP when consolidated with social security funds. In the African countries, by contrast, the central government tax ratio increases by less than 2 percent when consolidated with social security funds, except for Tunisia, which shows a 3 percent increase. The effect of including social security funds on the tax ratios of the nonindustrial European countries listed varies from less than 1 percent in Romania to about 12 percent in Hungary. Among Middle Eastern countries, the most noticeable increases as a result of including social security funds in central government tax ratios appear in Egypt and Israel, with 5 percent and 3 percent, respectively. In about two thirds of the Western Hemisphere countries listed, the tax ratio increase from inclusion of social security funds does not exceed 2 percent of GOP, but among the remaining countries the ratio is raised by between 3 percent and 7 percent. The most significant increases (5 percent or more) appear for Brazil, Costa Rica, Guyana, Panama, and Uruguay. It is among industrial countries, as a group, that contributions to social security funds are most important, with 12 of the 18 industrial countries listed showing such contributions of not less than 6 percent of GOP.
Although social security fund benefit payments resemble other central government expenditures for these purposes, they may differ significantly in whether they cover long-term risks or short-term risks. Programs providing for old-age, invalidity, and survivors' benefits are characterized by accumulation of large reserves during the initial years of operation to cover future benefit costs. Programs covering sickness and maternity, work injury, unemployment, and family allowances are usually financed out of current contributions, accumulating only small contingency reserves. Overall, however, the importance of social security fund expenditures relative to other central government expenditures shows the same pattern of contrasts between countries as obtained for tax revenues. Table 9 shows central government expenditure as a percentage of GOP both before and after consolidation with social security funds. The consolidation process involves the elimination of all payments between social security funds and the rest of central government before adding the expenditures together.
Among industrial countries, the most significant increases in central government expenditure as a percentage of GOP as a result of consolidation with social security funds appear for the Netherlands (about 20 percent), followed by Germany (about 17 percent), Austria (about 14 percent), and Spain (about 12 percent). In seven industrial countries the ratios are increased by between 4 percent and 10 percent
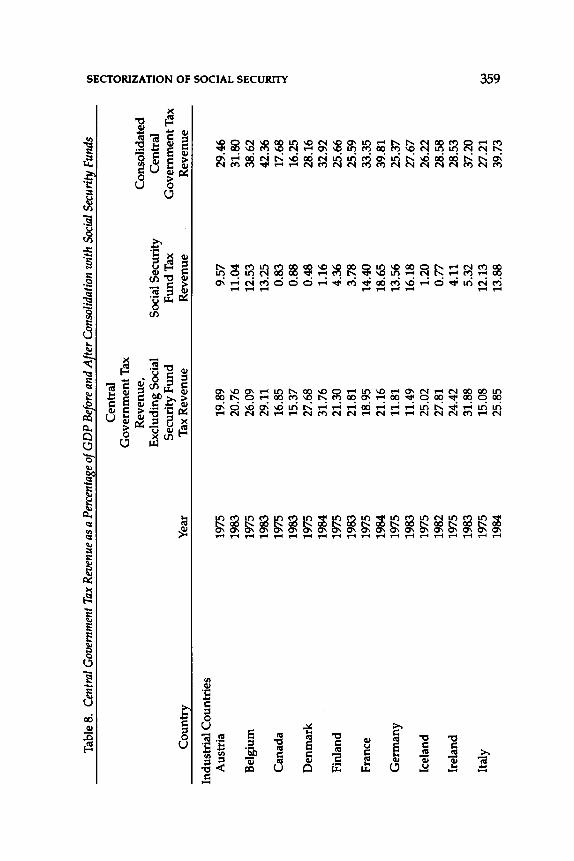
Tab
le 8
. C
entr
al G
over
nmen
t Tax
Rev
enue
as a
Per
cent
age
of G
DP
Bef
ore
and
Afte
r C
onso
lidat
ion
with
Soc
ial S
ecur
ity F
unds
Il
l Il
l
Cen
tral
n a
Gov
ernm
ent T
ax
2!! R
even
ue,
Con
soli
date
d N
~ E
xclu
ding
Soc
ial
Soc
ial S
ecur
ity
Cen
tral
0
Sec
urit
y F
un
d
Fu
nd
Tax
G
over
nmen
t Tax
z
Cou
ntry
Y
ear
Tax
Rev
enue
R
even
ue
Rev
enue
0 'I
I Il
l
Indu
stri
al C
ount
ries
0 n
Aus
tria
19
75
19.8
9 9.
57
29.4
6 >
19
83
20.7
6 11
.04
31.8
0 r"
Il
l
Bel
gium
19
75
26.0
9 12
.53
38.6
2 Il
l n 19
83
29.1
1 13
.25
42.3
6 c:: 2!!
Can
ada
1975
16
.85
0.83
17
.68
~ 19
83
15.3
7 0.
88
16.2
5 D
enm
ark
1975
27
.68
0.48
28
.16
1984
31
.76
1.16
32
.92
Fin
land
19
75
21.3
0 4.
36
25.6
6 19
83
21.8
1 3.
78
25.5
9 F
ranc
e 19
75
18.9
5 14
.40
33.3
5 19
84
21.1
6 18
.65
39.8
1 G
erm
any
1975
11
.81
13.5
6 25
.37
1983
11
.49
16.1
8 27
.67
Icel
and
1975
25
.02
1.20
26
.22
1982
27
.81
0.77
28
.58
Irel
and
1975
24
.42
4.11
28
.53
1983
31
.88
5.32
37
.20
Ital
y 19
75
15.0
8 12
.13
27.2
1 ~
1984
25
.85
13.8
8 39
.73
\0
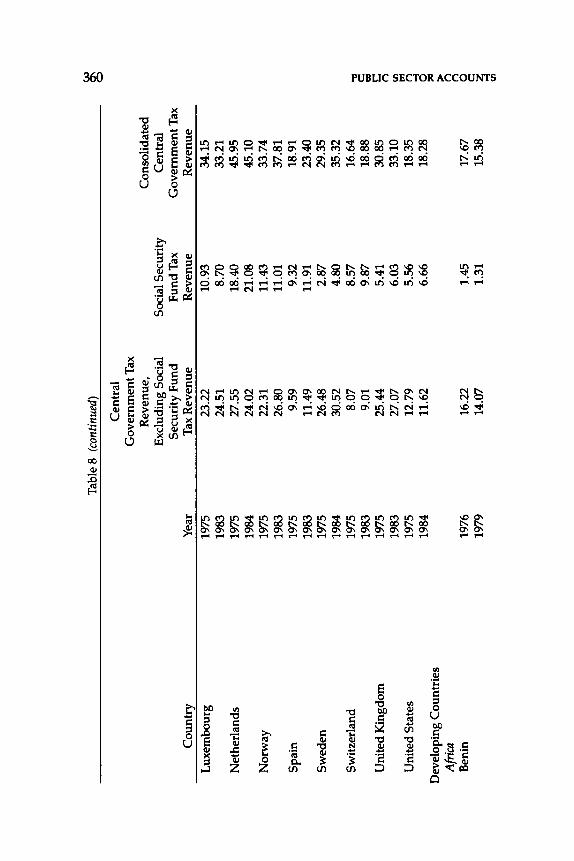
Tab
le 8
(co
ntin
ued)
~
Cen
tral
G
over
nmen
t Tax
R
even
ue,
Con
soli
date
d E
xclu
ding
Soc
ial
Soc
ial S
ecur
ity
Cen
tral
S
ecur
ity
Fu
nd
F
un
d T
ax
Gov
ernm
ent T
ax
Cou
ntry
Y
ear
Tax
Rev
enue
R
even
ue
Rev
enue
Lux
embo
urg
1975
23
.22
10.9
3 34
.15
1983
24
.51
8.70
33
.21
Net
herl
ands
19
75
27.5
5 18
.40
45.9
5 19
84
24.0
2 21
.08
45.1
0 N
orw
ay
1975
22
.31
11.4
3 33
.74
1983
26
.80
11.0
1 37
.81
Spa
in
1975
9.
59
9.32
18
.91
1983
11
.49
11.9
1 23
.40
Sw
eden
19
75
26.4
8 2.
87
29.3
5 19
84
30.5
2 4.
80
35.3
2 S
wit
zerl
and
1975
8.
07
8.57
16
.64
"0
1983
9.
01
9.87
18
.88
c =
Uni
ted
Kin
gdom
19
75
25.4
4 5.
41
30.8
5 I"
' ?i 19
83
27.0
7 6.
03
33.1
0 !J
)
Uni
ted
Sta
tes
1975
12
.79
5.56
18
.35
1!1 n
1984
11
.62
6.66
18
.28
o-l 0
Dev
elop
ing
Cou
ntri
es
:00 >
Afri
ca
n n B
enin
19
76
16.2
2 1.
45
17.6
7 0
1979
14
.07
1.31
15
.38
c z o-l
!J)
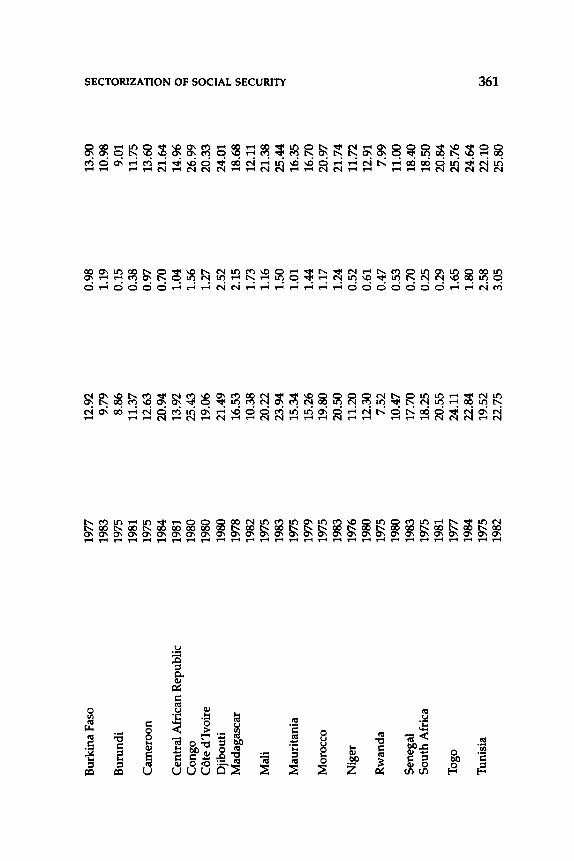
Bur
kina
Fas
o 19
77
12.9
2 0.
98
13.9
0 (S
l rt
l
1983
9.
79
1.19
10
.98
n o-1
Bur
undi
19
75
8.86
0.
15
9.01
0 !!!
1981
11
.37
0.38
11
.75
N
Cam
eroo
n 19
75
12.6
3 0.
97
13.6
0 ~
1984
20
.94
0.70
21
.64
0 z C
entr
al A
fric
an R
epub
lic
1981
13
.92
1.04
1
4.%
0
Con
go
1980
25
.43
1.56
26
.99
..., (Sl
Cot
e d'
Ivoi
re
1980
19
.06
1.27
20
.33
0 n D
jibo
uti
1980
21
.49
2.52
24
.01
>
I"'
Mad
agas
car
1978
16
.53
2.15
18
.68
(Sl
1982
10
.38
1.73
12
.11
rtl n
Mal
i 19
75
20.2
2 1.
16
21.3
8 c:::
!!! 19
83
23.9
4 1.
50
25.4
4 ~
Mau
rita
nia
1975
15
.34
1.01
16
.35
1979
15
.26
1.44
16
.70
Mor
occo
19
75
19.8
0 1.
17
20.9
7 19
83
20.5
0 1.
24
21.7
4 N
iger
19
76
11.2
0 0.
52
11.7
2 19
80
12.3
0 0.
61
12.9
1 R
wan
da
1975
7.
52
0.47
7.
99
1980
10
.47
0.53
11
.00
Sen
egal
19
83
17.7
0 0.
70
18.4
0 S
outh
Afr
ica
1975
18
.25
0.25
18
.50
1981
20
.55
0.29
20
.84
Tog
o 19
77
24.1
1 1.
65
25.7
6 19
84
22.8
4 1.
80
24.6
4 T
unis
ia
1975
19
.52
2.58
22
.10
~
1982
22
.75
3.05
25
.80
'""'
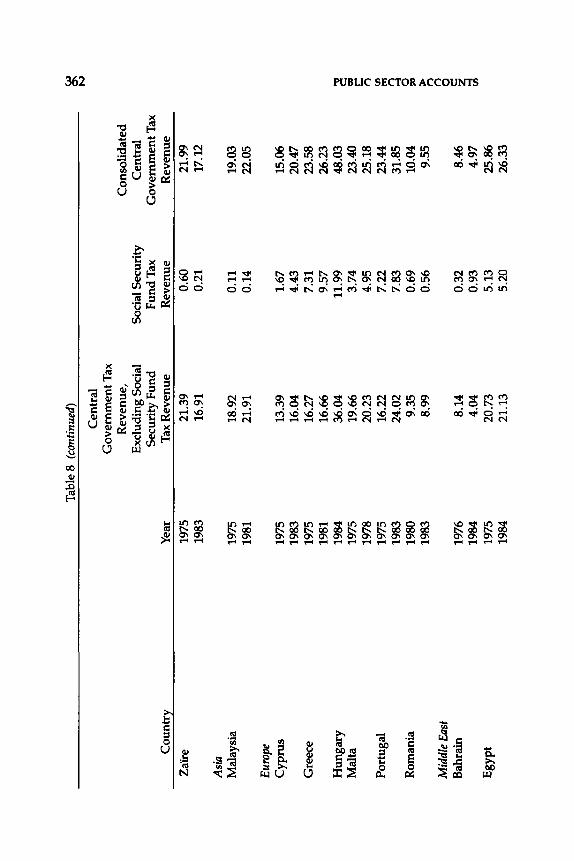
Tab
le 8
(co
ntin
ued)
~
IV
Cen
tral
G
over
nmen
t Tax
R
even
ue,
Con
soli
date
d E
xclu
ding
Soc
ial
Soc
ial S
ecur
ity
Cen
tral
S
ecur
ity
Fu
nd
F
un
d T
ax
Gov
ernm
ent T
ax
Countr~
Yea
r Ta
x R
even
ue
Rev
enue
R
even
ue
Zai
're
1975
21
.39
0.60
21
.99
1983
16
.91
0.21
17
.12
Asi
a M
alay
sia
1975
18
.92
0.11
19
.03
1981
21
.91
0.14
22
.05
Euro
pe
Cyp
rus
1975
13
.39
1.67
15
.06
1983
16
.04
4.43
20
.47
Gre
ece
1975
16
.27
7.31
23
.58
1981
16
.66
9.57
26
.23
Hun
gary
19
84
36.0
4 11
.99
48.0
3 ~
Mal
ta
1975
19
.66
3.74
23
.40
Oil c
1978
20
.23
4.95
25
.18
(')
Por
tuga
l 19
75
16.2
2 7.
22
23.4
4 U
l 1!
1
1983
24
.02
7.83
31
.85
(') d
Rom
ania
19
80
9.35
0.
69
10.0
4 "'
1983
8.
99
0.56
9.
55
>
(')
Mid
dle
East
('
) 0 B
ahra
in
1976
8.
14
0.32
8.
46
c:: z 19
84
4.04
0.
93
4.97
-1
U
l
Egy
pt
1975
20
.73
5.13
25
.86
1984
21
.13
5.20
26
.33
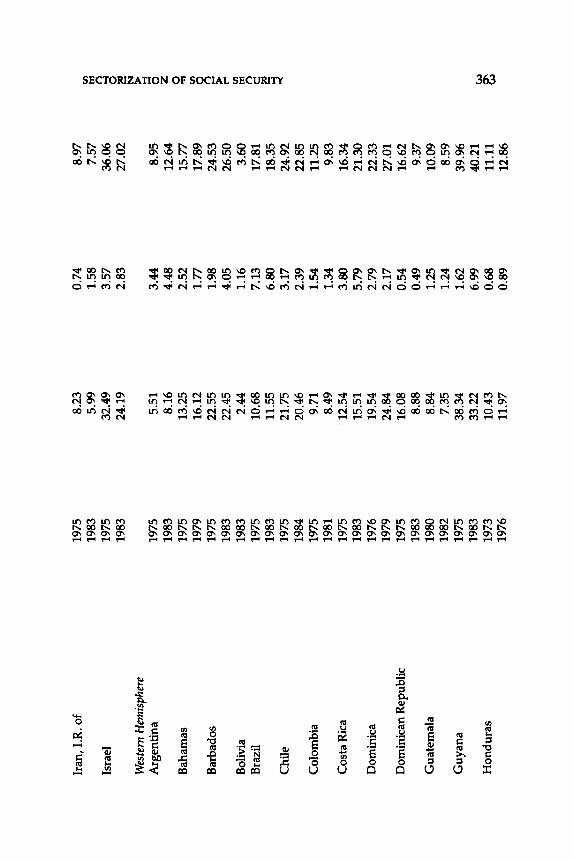
Iran
, I.R
. of
1975
8.
23
0.74
8.
97
Ill
1983
5.
99
1.58
7.
57
1:!1
(')
Isra
el
1975
32
.49
3.57
36
.06
d 19
83
24.1
9 2.
83
27.0
2 2!!
N
W
este
rn H
emisp
here
>
::l
A
rgen
tina
19
75
5.51
3.
44
8.95
0
1983
8.
16
4.48
12
.64
z 0 B
aham
as
1975
13
.25
2.52
15
.77
"" 19
79
16.1
2 1.
77
17.8
9 Il
l 0 B
arba
dos
1975
22
.55
1.98
24
.53
(') >
1983
22
.45
4.05
26
.50
r"
Bol
ivia
19
83
2.44
1.
16
3.60
Il
l 1:!
1 ('
) B
razi
l 19
75
10.6
8 7.
13
17.8
1 c::
1983
11
.55
6.80
18
.35
2!!
Chi
le
1975
21
.75
3.17
24
.92
::;!
1984
20
.46
2.39
22
.85
Col
ombi
a 19
75
9.71
1.
54
11.2
5 19
81
8.49
1.
34
9.83
C
osta
Ric
a 19
75
12.5
4 3.
80
16.3
4 19
83
15.5
1 5.
79
21.3
0 D
omin
ica
1976
19
.54
2.79
22
.33
1979
24
.84
2.17
27
.01
Dom
inic
an R
epub
lic
1975
16
.08
0.54
16
.62
1983
8.
88
0.49
9.
37
Gua
tem
ala
1980
8.
84
1.25
10
.09
1982
7.
35
1.24
8.
59
Guy
ana
1975
38
.34
1.62
39
.96
1983
33
.22
6.99
40
.21
~ H
ondu
ras
1973
10
.43
0.68
11
.11
1976
11
.97
0.89
12
.86
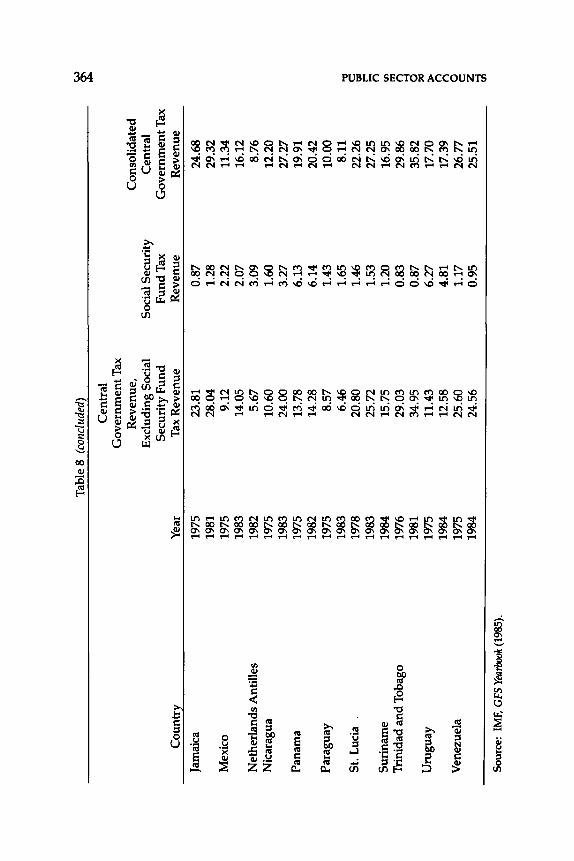
Tab
le 8
(co
nclu
ded)
w
~
Cen
tral
G
over
nmen
t Tax
R
even
ue,
Con
soli
date
d E
xclu
ding
Soc
ial
Soc
ial S
ecur
ity
Cen
tral
S
ecur
ity
Fu
nd
F
un
d T
ax
Gov
ernm
ent T
ax
Cou
ntry
Y
ear
Tax
Rev
enue
R
even
ue
Rev
enue
Jam
aica
19
75
23.8
1 0.
87
24.6
8 19
81
28.0
4 1.
28
29.3
2 M
exic
o 19
75
9.12
2.
22
11.3
4 19
83
14.0
5 2.
07
16.1
2 N
ethe
rlan
ds A
ntil
les
1982
5.
67
3.09
8.
76
Nic
arag
ua
1975
10
.60
1.60
12
.20
1983
24
.00
3.27
27
.27
Pan
ama
1975
13
.78
6.13
19
.91
1982
14
.28
6.14
20
.42
Par
agua
y 19
75
8.57
1.
43
10.0
0 19
83
6.46
1.
65
8.11
~
St.
Luc
ia
1978
20
.80
1.46
22
.26
1:111
1983
25
.72
1.53
27
.25
t: n S
urin
ame
1984
15
.75
1.20
16
.95
In
Tri
nida
d an
d T
obag
o rt
l 19
76
29.0
3 0.
83
29.8
6 n
1981
34
.95
0.87
35
.82
0 llll
Uru
guay
19
75
11.4
3 6.
27
17.7
0 >
19
84
12.5
8 4.
81
17.3
9 n n
Ven
ezue
la
1975
25
.60
1.17
26
.77
0 c:: 19
84
24.5
6 0.
95
25.5
1 z ~ In
Sou
rce:
IM
F, G
FS Y
earb
ook
(198
5).
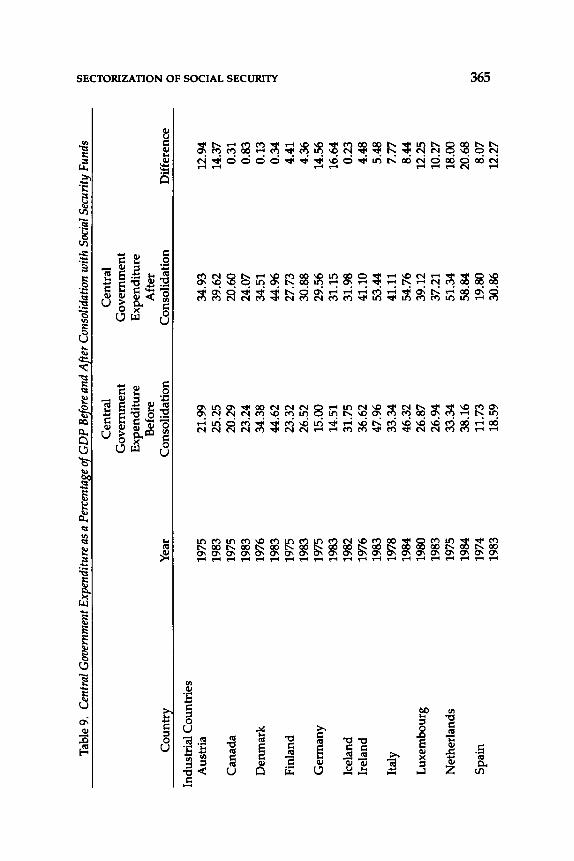
Tab
le 9
. C
entr
al G
over
nmen
t Exp
endi
ture
as a
Per
cent
age
of G
DP
Bef
ore
and
Afte
r C
onso
lidat
ion
with
Soc
ial S
ecur
ity F
unds
IJ
'J !!I n
Cen
tral
C
entr
al
d G
over
nmen
t G
over
nmen
t 2!! N
E
xpen
ditu
re
Exp
endi
ture
>
::!
B
efor
e A
fter
0
Cou
ntry
Y
ear
Con
soli
dati
on
Con
soli
dati
on
Dif
fere
nce
z 0 "'l
Indu
stri
al C
ount
ries
IJ'
J 0 A
ustr
ia
1975
21
.99
34.9
3 12
.94
n 19
83
25.2
5 39
.62
14.3
7 >
r'
Can
ada
1975
20
.29
20.6
0 0.
31
IJ'J !!I
1983
23
.24
24.0
7 0.
83
n c::
Den
mar
k 19
76
34.3
8 34
.51
0.13
2!!
1983
44
.62
44.%
0.
34
::;! F
inla
nd
1975
23
.32
27.7
3 4.
41
1983
26
.52
30.8
8 4.
36
Ger
man
y 19
75
15.0
0 29
.56
14.5
6 19
83
14.5
1 31
.15
16.6
4 Ic
elan
d 19
82
31.7
5 31
.98
0.23
Ir
elan
d 19
76
36.6
2 41
.10
4.48
19
83
47.9
6 53
.44
5.48
It
aly
1978
33
.34
41.1
1 7.
77
1984
46
.32
54.7
6 8.
44
Lux
embo
urg
1980
26
.87
39.1
2 12
.25
1983
26
.94
37.2
1 10
.27
Net
herl
ands
19
75
33.3
4 51
.34
18.0
0 19
84
38.1
6 58
.84
20.6
8 S
pain
19
74
11.7
3 19
.80
8.07
~
1983
18
.59
30.8
6 12
.27
Ul
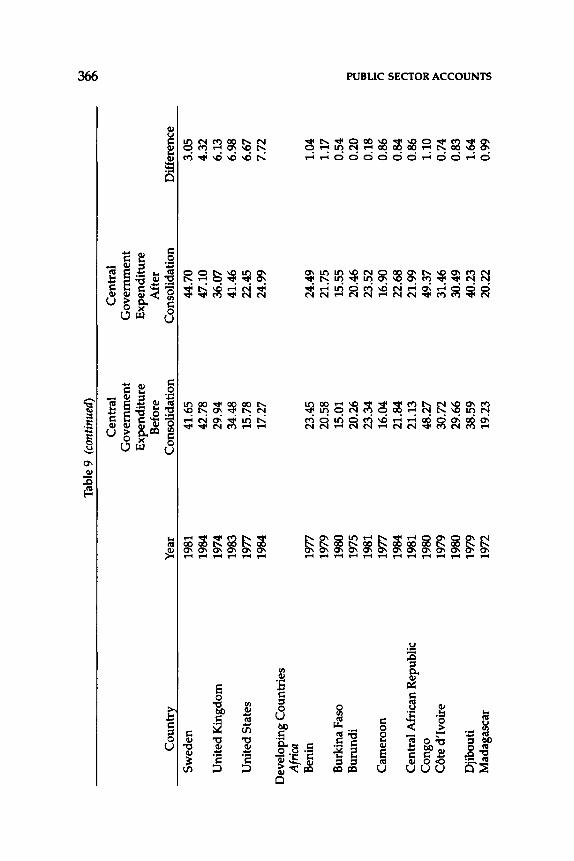
Tab
le 9
(co
ntin
ued)
~
Cen
tral
C
entr
al
Gov
ernm
ent
Gov
ernm
ent
Exp
endi
ture
E
xpen
ditu
re
Bef
ore
Aft
er
Cou
ntry
Y
ear
Con
soli
dati
on
Con
soli
dati
on
Dif
fere
nce
Sw
eden
19
81
41.6
5 44
.70
3.05
19
84
42.7
8 47
.10
4.32
U
nite
d K
ingd
om
1974
29
.94
36.0
7 6.
13
1983
34
.48
41.4
6 6.
98
Uni
ted
Sta
tes
1977
15
.78
22.4
5 6.
67
1984
17
.27
24.9
9 7.
72
Dev
elop
ing
Cou
ntri
es
Afri
ca
Ben
in
1977
23
.45
24.4
9 1.
04
1979
20
.58
21.7
5 1.
17
Bur
kina
Fas
o 19
80
15.0
1 15
.55
0.54
B
urun
di
1975
20
.26
20.4
6 0.
20
~ 19
81
23.3
4 23
.52
0.18
a
l c C
amer
oon
1977
16
.04
16.9
0 0.
86
n 19
84
21.8
4 22
.68
0.84
f.
/)
1!1
Cen
tral
Afr
ican
Rep
ubli
c 19
81
21.1
3 21
.99
0.86
n o-1
0
Con
go
1980
48
.27
49.3
7 1.
10
lOa
Cot
e d'
Ivoi
re
1979
30
.72
31.4
6 0.
74
>
n 19
80
29.6
6 30
.49
0.83
n 0
Dji
bout
i 19
79
38.5
9 40
.23
1.64
c:: z
Mad
agas
car
1972
19
.23
20.2
2 0.
99
o-1
f./)
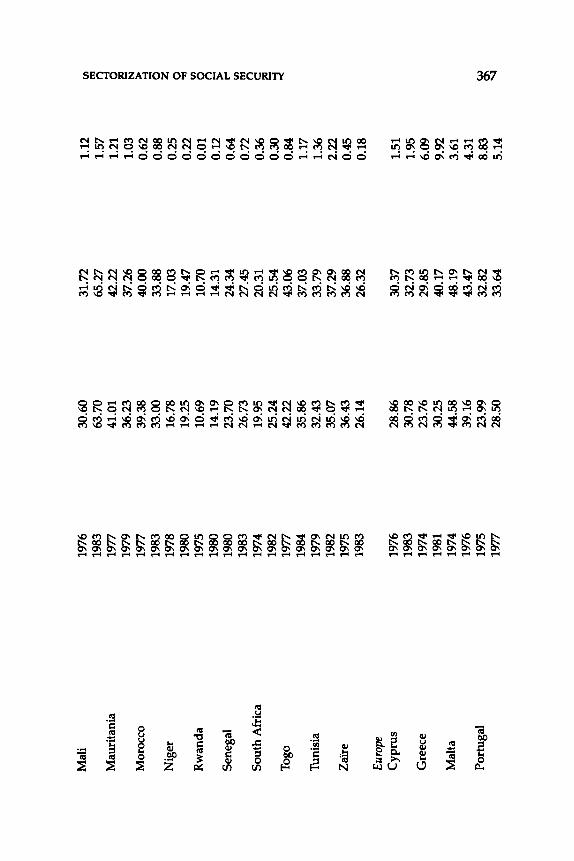
Mal
i 19
76
30.6
0 31
.72
1.12
U
l
1983
63
.70
65.2
7 1.
57
1:1!
(')
Mau
rita
nia
1977
41
.01
42.2
2 1.
21
d 19
79
36.2
3 37
.26
1.03
2!! N
M
oroc
co
1977
39
.38
40.0
0 0.
62
>
::!
1983
33
.00
33.8
8 0.
88
0 N
iger
19
78
16.7
8 17
.03
0.25
z 0
1980
19
.25
19.4
7 0.
22
..., Ul
Rw
anda
19
75
10.6
9 10
.70
0.01
0 ('
) 19
80
14.1
9 14
.31
0.12
>
S
eneg
al
1980
23
.70
24.3
4 0.
64
I"'
Ul
1983
26
.73
27.4
5 0.
72
1:1!
(')
Sou
th A
fric
a 19
74
19.9
5 20
.31
0.36
c:: 2!!
19
82
25.2
4 25
.54
0.30
::;!
Tog
o 19
77
42.2
2 43
.06
0.84
19
84
35.8
6 37
.03
1.17
T
unis
ia
1979
32
.43
33.7
9 1.
36
1982
35
.07
37.2
9 2.
22
Zai
re
1975
36
.43
36.8
8 0.
45
1983
26
.14
26.3
2 0.
18
Eur
ope
Cyp
rus
1976
28
.86
30.3
7 1.
51
1983
30
.78
32.7
3 1.
95
Gre
ece
1974
23
.76
29.8
5 6.
09
1981
30
.25
40.1
7 9.
92
Mal
ta
1974
44
.58
48.1
9 3.
61
1976
39
.16
43.4
7 4.
31
Por
tuga
l 19
75
23.9
9 32
.82
8.83
~
1977
28
.50
33.6
4 5.
14
'1
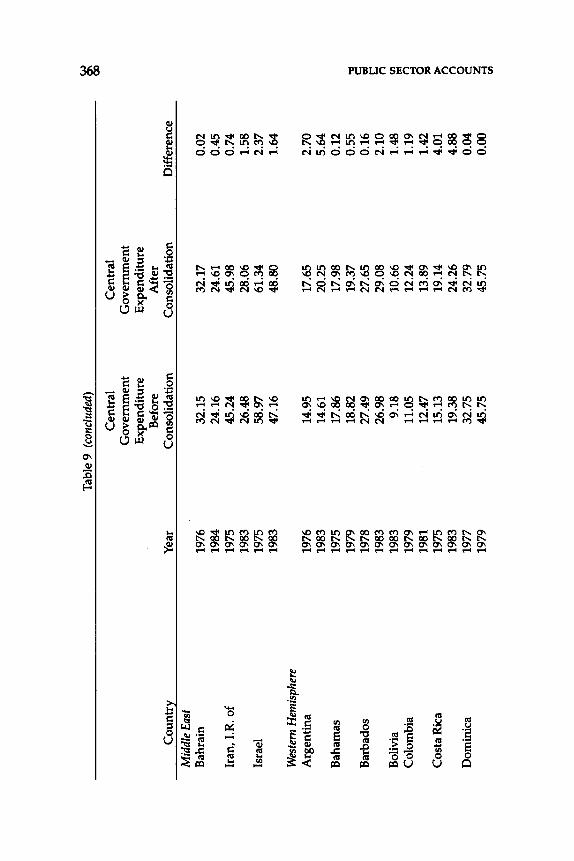
Tab
le 9
(co
nclu
ded)
~
Cen
tral
C
entr
al
Gov
ernm
ent
Gov
ernm
ent
Exp
endi
ture
E
xpen
ditu
re
Bef
ore
Aft
er
Cou
ntry
Y
ear
Con
soli
dati
on
Con
soli
dati
on
Dif
fere
nce
Mid
dle
East
Bah
rain
19
76
32.1
5 32
.17
0.02
19
84
24.1
6 24
.61
0.45
Ir
an,
I.R.
of
1975
45
.24
45.9
8 0.
74
1983
26
.48
28.0
6 1.
58
Isra
el
1975
58
.97
61.3
4 2.
37
1983
47
.16
48.8
0 1.
64
Wes
tern
Hem
isph
ere
Arg
enti
na
1976
14
.95
17.6
5 2.
70
1983
14
.61
20.2
5 5.
64
Bah
amas
19
75
17.8
6 17
.98
0.12
19
79
18.8
2 19
.37
0.55
~
Bar
bado
s 19
78
27.4
9 27
.65
0.16
=
19
83
26.9
8 29
.08
2.10
c n
Bol
ivia
19
83
9.18
10
.66
1.48
1/
'J t!l
Col
ombi
a 19
79
11.0
5 12
.24
1.19
n o-1
1981
12
.47
13.8
9 1.
42
0 "' C
osta
Ric
a 19
75
15.1
3 19
.14
4.01
>
19
83
19.3
8 24
.26
4.88
n n
Dom
inic
a 19
77
32.7
5 32
.79
0.04
0 ~
1979
45
.75
45.7
5 0.
00
z o-1
1/'J
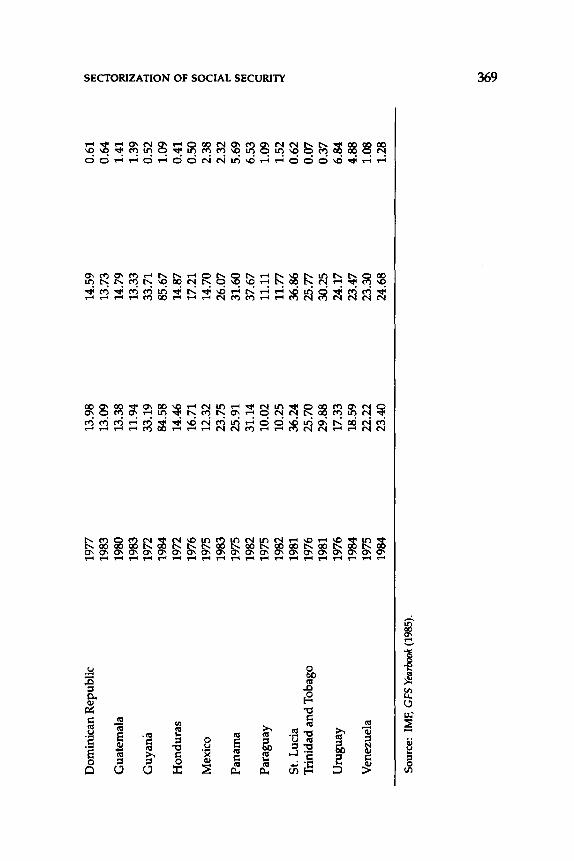
Dom
inic
an R
epub
lic
1977
13
.98
14.5
9 0.
61
Ul
1:1:1
1983
13
.09
13.7
3 0.
64
n
Gua
tem
ala
1980
13
.38
14.7
9 1.
41
d 2!! 19
83
11.9
4 13
.33
1.39
N
Guy
ana
1972
33
.19
33.7
1 0.
52
~ 19
84
84.5
8 85
.67
1.09
0 z
Hon
dura
s 19
72
14.4
6 14
.87
0.41
0
1976
16
.71
17.2
1 0.
50
..., Ul
Mex
ico
1975
12
.32
14.7
0 2.
38
0 n 19
83
23.7
5 26
.07
2.32
>
19
75
25.9
1 !"
' P
anam
a 31
.60
5.69
U
l
1982
31
.14
37.6
7 6.
53
1:1:1 n
Par
agua
y 19
75
10.0
2 11
.11
1.09
c:: 2!!
1982
10
.25
11.7
7 1.
52
::;! S
t. L
ucia
19
81
36.2
4 36
.86
0.62
T
rini
dad
and
Tob
ago
1976
25
.70
25.7
7 0.
07
1981
29
.88
30.2
5 0.
37
Uru
guay
19
76
17.3
3 24
.17
6.84
19
84
18.5
9 23
.47
4.88
V
enez
uela
19
75
22.2
2 23
.30
1.08
19
84
23.4
0 24
.68
1.28
Sou
rce:
IM
F, G
FS
Year
book
(19
85).
$
370 PUBLIC SECTOR ACCOUNTS
as a result of consolidation, and only in three countries (Canada, Denmark, and Iceland) are central government expenditures increased by less than 1 percent of GOP as a result of consolidation with social security funds. Again, the African countries listed show relatively insignificant increases in central government expenditures as a percentage of GOP after consolidation with social security funds, ranging from 0.12 percent in Rwanda in 1980 to 2.2 percent in Tunisia in 1982. Among nonindustrial European countries, the most significant increases from inclusion of social security fund expenditures appear for Greece, with about 10 percent in 1981, followed by Portugal and Malta, with increases of about 5 percent in 1976 and 1977. Middle Eastern countries show increases of less than 2 percent of GOP in 1983-84. Among Western Hemisphere countries, the largest increases in central government expenditure as a result of including social security funds range between 5 percent and 7 percent of GOP for Argentina, Costa Rica, Panama, and Uruguay but are no more than 2.5 percent of GOP in the remaining 14 countries.
These results parallel those for the tax revenues of central government and social security funds, with relatively large increases in central government ratios of expenditure to GOP resulting from consolidation with social security fund expenditures in industrial countries, nonindustrial European countries, and several Latin American countries, and relatively small increments elsewhere.
VI. Conclusions
Several conclusions are suggested by this analysis of the nature and magnitude of the operations of national social security funds and their relationship to other parts of central government. Reflecting both the evolution of social security needs and broader developments in many economies, social security funds have experienced a trend toward greater financial dependence on central government support, have increasingly been used by central government as a tool for the implementation of broader fiscal policy, and have been paralleled by increasing participation by other parts of central government in the direct provision of social security benefits. These developments have implications for the treatment of statistics on social security fund operations.
Insofar as such statistics serve the purpose of alerting or reassuring contributors and beneficiaries about the financial health of these institutions, their separate compilation may be necessary. As a measure of the performance of social security functions, however, data for social
SECTORIZATION OF SOCIAL SECURITY 371
security fund operations alone cannot be viewed as adequately comprehensive. At the same time, because social security fund operations have reached significant proportions in many countries, particularly in industrial countries, their omission detracts appreciably from the usefulness of central government data for purposes of economic analysis, policy making, and cross-country comparison. The persistent contrasts between countries in the proportion of social security functions carried out by social security funds and by other parts of central government, finally, give rise to inconsistencies in any crosscountry comparisons based on either social security funds alone or on other parts of central government alone. The most useful course of action, it would seem, would lie in the initial compilation of data on social security fund operations to show their financial health, followed by the consolidation of such data with the statistics for the rest of central government for the more comprehensive analysis of central fiscal policy and the performance of social security functions.


Part ill
FINANCIAL FLOWS AND BALANCES

21
Flow-of-Funds Accounts, A System of National Accounts,
and Developing Countries
}OHN C. DAWSON
T HE PURPOSE of this paper is to survey flow-of-funds (FOF) or national financial accounting in the context of the forthcoming
revision of the United Nations' A System of National Accounts (SNA), with special emphasis on the potential of FOF analysis for developing countries. The task has been divided into three main sections.
Section I considers the analytical uses of the FOF accounts, using simple data matrices of the sort that could be available in most of the countries of the world. A key scheme for the analysis of financial fluctuations-the saving-investment process-is presented and related to the data matrix. The data are also related both to financial policy problems that are commonly faced by developing countries and to more sophisticated types of projections and programming. In all, the substantial usefulness of FOF data in the formation and execution of public policies in the financial area is emphasized.
In Section II the conceptual relations between the FOF accounts and the SNA are examined by considering how certain key features of the SNA standard accounts have evolved during successive revisions of the SNA, with particular emphasis on the representation of finance in the SNA and how financial data should be portrayed in the forthcorning SNA revision (labeled SNA 1993). Section II also addresses the closely related matter of harmonization between the Fund's statistical systems and the SNA as well as the technical problem of relating financial flows and balances in the accounts.
Section III considers the procedures to be used in the estimation of FOF accounts in the developing countries. It is demonstrated that an
375
376 FINANCIAL FLOWS AND BALANCES
effective FOF system can now be implemented quickly and easily by most of these countries. The data problems that these countries face, however, are seen to have implications for the design of SNA 1993. Section IV presents conclusions.
I. Analytical Uses of the Flow-of-Funds Accounts
The broad purpose of the FOF accounts, or the sector capital finance accounts as they appear in the SNA, is to facilitate analysis of the operation of the financial system. That is, these accounts aim to interpret the transactions in financial markets carried out by the various economic sectors and to relate these transactions to the behavior of the nonfinancial economy. To this end, the sector accounts record for each sector its capital formation, its gross saving (that is, its operating surplus), and its acquisitions of various types of claims (financial uses of funds) and incurrence of various types of liabilities (financial sources of funds). Financial institutions are separated in the sectoring scheme in order to distinguish their functional role. Finally, the whole can be presented as a technically interlocking matrix with balancing cross and down totals. Tables 1 and 2 present simple examples of this type of matrix format that could be currently produced by most of the nations of the world.
The analytical power of the FOF system of accounts-like that of the income and product accounts-stems fundamentally from the interlocking character of the system-from the cross and down totals that balance for every period. Social accounting consistency requires that a flow change in any matrix cell be accompanied by corresponding changes in at least three other cells. For example, if increased government capital formation is to be financed by government debt issues, some sector must absorb the issues. To do so that sector must have larger sources of funds or must reduce other acquisitions. By making use of this feature in various forms, it is often possible to trace the impact of each sector's financial behavior on the others and eventually on the nonfinancial economy, or vice versa.
In the following four subsections, the intent is to indicate the range of different forms of FOF analysis. The level of detail naturally depends on the sector and the transaction detail available in the accounts, but the focus here is on condensed matrices of the sort that many countries are able to construct. Although the emphasis is on structures that are best revealed by the matrices, substantive work would be largely expressed as time-series analysis.
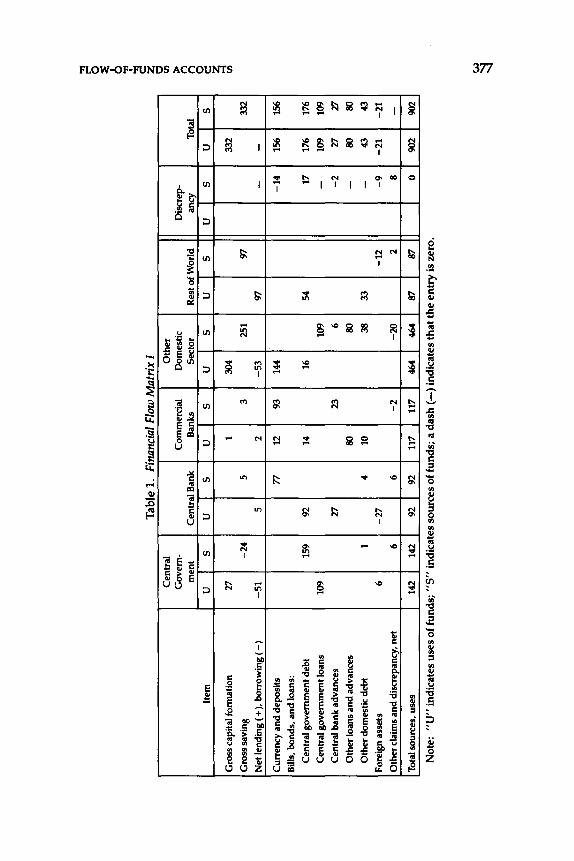
Tab
le 1
. Fi
nanc
ial
Flow
Mat
rix
I C
entr
al
Oth
er
Go
ver
n-
Com
mer
cial
D
omes
tic
men
t C
entr
al B
ank
Ban
ks
Sec
tor
Res
t of
Wor
ld
Item
u
5 u
5 u
5 u
5 u
5
Gro
ss c
apit
al f
orm
atio
n 27
1
304
Gro
ss s
avin
g -2
4
5 3
251
97
Net
lend
ing
( + ),
bo
rro
win
g (
-)
-51
5
2 -5
3
97
Cur
renc
y an
d d
epo
sits
77
12
93
14
4
Bill
s, b
onds
, an
d l
oans
:
Cen
tral
go
ver
nm
ent d
ebt
159
92
14
16
54
Cen
tral
go
ver
nm
ent l
oans
10
9 10
9
Cen
tral
ban
k a
dvan
ces
27
23
6
Oth
er lo
ans
and
adv
ance
s 80
80
Oth
er d
omes
tic
deb
t 1
4 10
38
33
For
eign
ass
ets
6 -2
7
-12
Oth
er c
laim
s an
d d
iscr
epan
cy,
net
6
6 -2
-2
0
2
Tot
al s
ourc
es,
use
s 14
2 14
2 92
92
11
7 11
7 46
4 46
4 87
87
Not
e:
"U"
indi
cate
s us
es o
f fun
ds;
"S"
indi
cate
s so
urce
s of
fund
s; a
dash
(-)
indi
cate
s th
at th
e en
try
is z
ero.
Dis
crep
-an
cy
Tot
al
u 5
u 332
--
-14
15
6
17
176
-10
9
-2
27
-80
-43
-9
-21
8 0 90
2
5 332
156
176
109 27
80
43
-21
- 902
6 ~ 11 ~ z 0 (/
) ~ n g ~ (/) ~
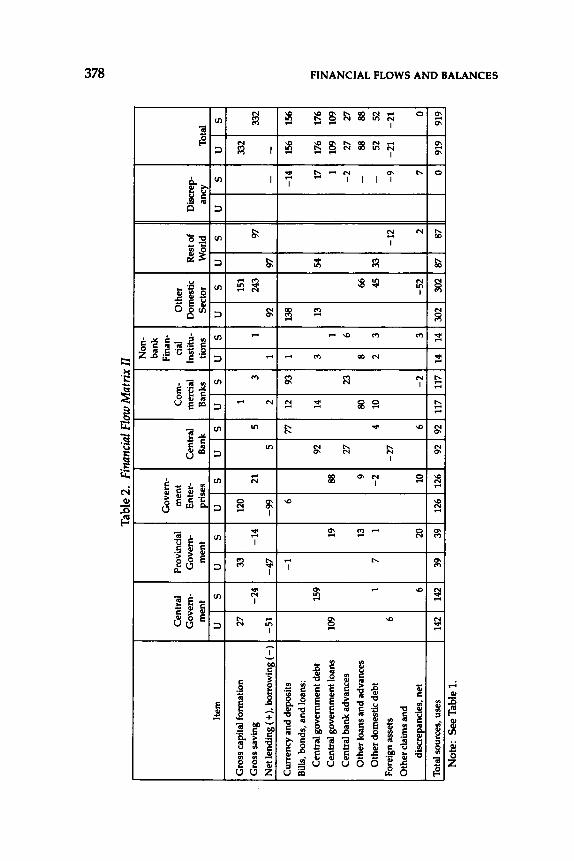
Tab
le 2
. Fi
nanc
ial F
low
Mat
rix
II N
on-
bank
G
over
n-F
inan
-C
entr
al
Pro
vinc
ial
men
t C
om-
cia!
G
over
n-G
over
n-E
nter
-C
entr
al
mer
cia!
In
stit
u-m
ent
men
t pr
ises
B
ank
Ban
ks
tion
s
Item
u
5 u
5 u
5 u
5 u
5 u
5
Gro
ss c
apit
al f
orm
atio
n 27
33
12
0 1
Gro
ss s
avin
g -2
4
-14
21
5
3 1
Net
lend
ing
( + ),
borr
owin
g (-
) -5
1
-47
-9
9
5 2
1
Cur
renc
y an
d de
posi
ts
-1
6 77
12
93
1
Bill
s, b
onds
, and
loan
s:
Cen
tral
gov
ernm
ent d
ebt
159
92
14
3 C
entr
al g
over
nmen
t loa
ns
109
19
88
1 C
entr
al b
ank
adva
nces
27
23
6
Oth
er lo
ans
and
adv
ance
s 13
9
80
8 O
ther
dom
esti
c de
bt
1 7
1 -2
4
10
2 3
For
eign
ass
ets
6 -2
7
Oth
er c
laim
s an
d
disc
repa
ncie
s, n
et
6 20
10
6
-2
3
Tot
al s
ourc
es,
uses
14
2 14
2 39
39
12
6 12
6 92
92
11
7 11
7 14
14
Not
e: S
ee T
able
1.
Oth
er
Dom
esti
c R
est o
f S
ecto
r W
orld
u 5
u 5
151
243
'17
92
97
138 13
54
66
45
33
-12
-52
2
302
302
87
87
Dis
crep
-an
cy
u 5 - -1
4
17 1
-2
- - -9 7 0
Tot
al
u 5
332
332
- 156
156
176
176
109
109
27
27
88
88
52
52
-21
-2
1 0
919
919
'
UJ Oci
'TI z > z (1 >
I"' 5 ~ t/) > z 0 ~ >
z (1
Ill
t/)
FLOW-OF-FUNDS ACCOUNTS 379
Saving-Investment Process Analysis
Perhaps the most frequently used structure in FOF analysis is the saving-investment process, by which saving is transformed into ultimate lending, whence it passes through various financial channels to ultimate borrowing, and then into real investment. An important feature of this scheme is the insertion of financial institutions in the center between ultimate lending and ultimate borrowing in order to portray their role as financial intermediaries.
The way in which the details of the process are worked into the scheme will vary with the analyst. One such scheme is shown in Figure 1, which is designed to reveal the domestic financing process.l Private saving appears at the right of the figure and, as the arrows indicate, is either placed internally into real investment or into ultimate lending (that is, used to acquire claims). The claims acquired may take any of three major forms: claims on financial institutions, thus placing funds with these institutions; private credit instruments, thus passing funds directly through these markets to finance private ultimate borrowing; or federal securities, thus advancing funds in this market. In tum, financialinstitutions (bank or nonbank), in lending out the funds placed with them, must acquire either federal securities or private claims. Finally, private ultimate borrowing assembles the borrowing from banks, nonbanks, and ultimate lenders, which together with internal financing provides the funds to finance real investment.
Federal ultimate borrowing in Figure 1 also assembles the lending of the various sectors and provides the financing for the federal deficit. Here, however, there is also a "feedback" arrow (at the top of the diagram). This is a somewhat awkward expression of the fact that governments often borrow not to finance the government deficit, narrowly defined, but to on-lend the funds. In developing countries this is a key form of finance for government enterprises. In this way general government becomes a kind of financial intermediary.
Note that, in effect, in Figure 1 the saving-investment account is split down the middle, with the financial system inserted between. As a result, the placement of saving and the financing of investment appear to be two distinct activities. But they necessarily articulate: whatever saving is placed with the financial system necessarily provides the financing of investment. Further, because saving and real
1 Rest-of-world saving, lending, and borrowing could easily be shown separately in another variant.
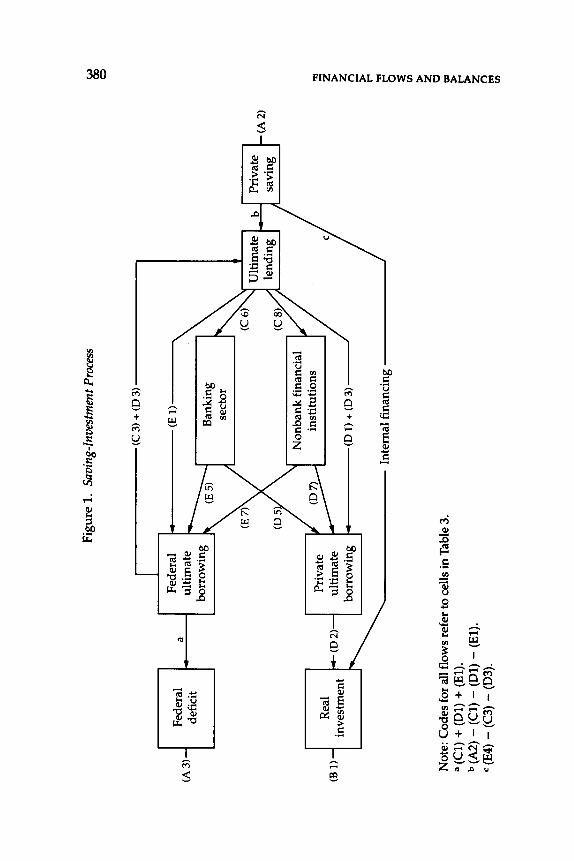
Fig
ure
1.
Savi
ng-I
nves
tmen
t Pro
cess
I F
eder
al
I. (A
3)-
-l
Fed
eral
I·
a I
ulti
mat
e de
fici
t bo
rrow
ing
h.
Pri
vate
...
Rea
l 1--
-i (B
1)-
-l
inve
stm
ent
(O Z
) ul
tim
ate
bo
rro
win
!_j•
Not
e: C
odes
for
all f
low
s re
fer
to c
ells
in T
able
3.
a (C
l) +
(D
l) +
(El)
. b
(A2)
-(C
l) -
(Dl)
-(E
l).
c (E
4) -
(C3)
-(0
3).
(C 3
) +
(0
3)
(E 1
)
tr<
::\""
"'--
.l B
anki
ng
sect
or
Non
bank
fina
ncia
l \IJ ~I
__.,.
in
stit
utio
ns
(0 1
) +
(0
3)
Inte
rnal
fin
anci
ng
(A2
)
~ ~ ~ z n >
r"' ~ 5 ~ Ul > z 0 =
> >
z n Ill
Ul
FLOW-OF-FUNDS ACCOUNTS 381
investment are both nonfinancial variables, the financial markets are linked to the real economy at each end of the scheme.
This scheme is tied closely to FOF data because the various flow arrows can be measured by the cells in a FOF matrix (Table 3). The codes on the various arrows in Figure 1 refer to the rows and columns of Table 3. Each of the major flows (italic) in the matrix is represented in the scheme. The saving-investment process scheme thus provides a means of interpreting the flow movements in the matrix over time.
In using the scheme, the analyst often finds that causation moves from left to right, counter to the arrows. For example, fluctuations in real investment or the federal deficit will result in fluctuations in various forms of borrowing. Figure 1 indicates how the impact of these borrowing fluctuations on financial institutions and markets can be traced. The advantage of having available in the FOF accounts the immediate forms of borrowing by each sector, not just the ultimate "financing" of the saving figures, becomes apparent. With added detail the scheme can become a very effective vehicle for understanding how capital formation or the federal deficit is financed.
Policy Problem Analysis in Developing Countries
Some key financial planning problems regularly faced by developing countries are posed in this subsection, and their relationship to the FOF accounts is briefly indicated. Will there be an adequate amount of foreign exchange? In the first instance, of course, this question implies an analysis of the rest-of-world account. Given the balance of payments current deficit (rest-of-world saving), the foreign exchange balance is protected by foreign borrowing. To judge the extent of foreign borrowing, an analysis of the domestic borrowers' financing is needed (private and public enterprises, financial institutions, and general government). How will the central government deficit be financed? The government deficit (gross capital formation less gross saving) plus its lending will be financed by the issue of government debt. The placement of these issues is analyzed by moving horizontally across the FOF matrix. Estimating the other sectors' capacities to absorb the issues requires sector analysis of the major debt buyers. The absorption by the banking system may imply further money supply expansion or the crowding out of private borrowers. How will the major government enterprises be financed, and by whom? Government enterprise capital formation will be financed first by the enterprises' own saving (that is, their operating surpluses). Beyond this, their major sources of funds will be government loans, borrowing from abroad,
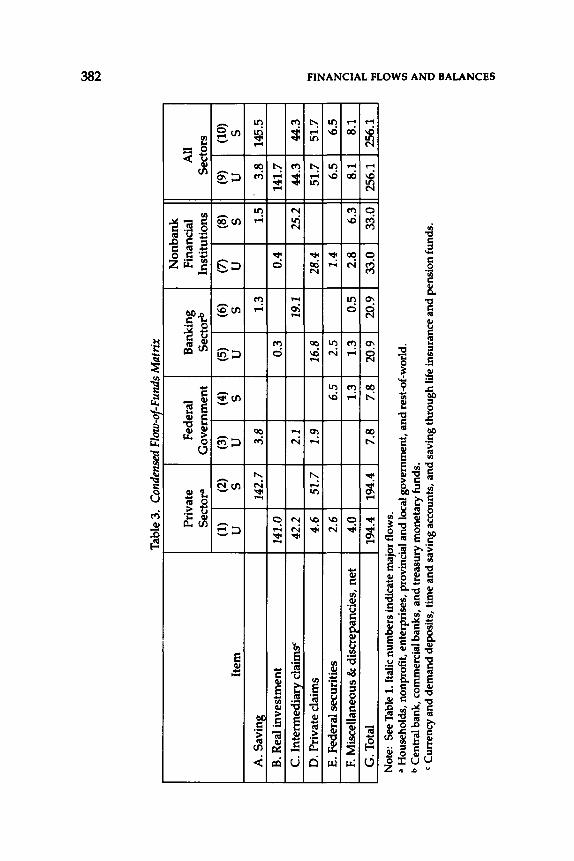
Pri
vate
F
eder
al
Ban
king
S
ecto
r"
Gov
ernm
ent
Sec
t orb
(1)
(2)
(3)
(4)
(5)
(6)
Item
u
s u
s u
s A
. S
avin
g 14
2.7
3.8
1.
3 B
. Rea
l inv
estm
ent
141.
0 0.
3 C
. In
term
edia
ry c
laim
sc
42.2
2.
1 19
.1
D.
Pri
vate
cla
ims
4.6
51
.7
1.9
16.8
E. F
eder
al s
ecur
itie
s 2.
6 6.
5 2.
5 F.
Mis
cell
aneo
us &
dis
crep
anci
es,
net
4.0
1.3
1.3
0.5
G. T
otal
19
4.4
1~~-
7.8
7.8
20.9
20
.9
Not
e:
See
Tab
le 1
. It
alic
num
bers
indi
cate
maj
or fl
ows.
•
Hou
seho
lds,
non
prof
it, e
nter
pris
es,
prov
inci
al a
nd lo
cal g
over
nmen
t, a
nd
rest
-of-
wor
ld.
b C
entr
al b
ank,
com
mer
cial
ban
ks,
and
trea
sury
mon
etar
y fu
nds.
Non
bank
F
inan
cial
In
stit
utio
ns
(7)
(8)
u s 1.
5 0.
4 25
.2
28.4
1.4
2.8
6.3
33.0
33
.0
c C
urre
ncy
and
dem
and
depo
sits
, ti
me
and
savi
ng a
ccou
nts,
and
sav
ing
thro
ugh
life
insu
ranc
e an
d pe
nsio
n fu
nds.
All
Sec
tors
(9)
(10)
u
s 3.
8 14
5.5
141.
7 44
.3
44.3
51
.7
51.7
6.5
6.5
8.1
8.1
256.
1 25
6.1
I i I I
~ "" z > z 1'1 ~ "" 5 ~ Ill > z 0 ~ z 1'1
Ill
Ill
FLOW-OF-FUNDS ACCOUNTS 383
and borrowing from commercial banks. The volume of the last of these is of special interest because of the possibility, again, of crowding out private borrowers.
For all three of these policy questions, the answers require an impact analysis for various sectors, types of transaction, or both. It is the articulation of the accounts within the FOF matrix that enables one to seek and judge the answers.
Financial Projections and Programming
The essence of a FOF projection is a matrix for some future time period. Such projections can be used for a variety of purposes. One would be to test the consistency of separately prepared sector or market forecasts. Another would be to develop a consistent view of the financial flow implications of a particular set of assumptions about future events. A third might be used by the planners in a developing country to examine the implications of parts of an economic plan.
For example, consider a projection of Table 1. A developing country might have sector capital formation and saving data from a tentative plan formulation. It might then impose certain constraining balance of payments estimates. The interior of the matrix could be projected under these constraints in order to work out the implications for domestic finance. The projection might well be able to identify certain types of credit shortages or the amount of necessary monetary expansion.
The projection of a more elaborate matrix-of some 10 sectors and 20 or more financial transaction types-has for many years been a regular part of monetary and credit policymaking at the U.S. central bank. In a series of iterations, the judgmental forecasts of numerous financial market and national account specialists in the research division are used to modify an extrapolated matrix. At the same time, monetary policy implementation and impact are gradually worked into the projection. In the end the exercise provides a detailed statistical picture of future financial flows that is closely integrated with the prepared policy position to be placed before the governing board.
A sophisticated illustration can be drawn from the type of financial programming engaged in by the Fund in the design of adjustment programs. The policy packages of these programs aim primarily to establish a viable balance of payments position over the medium term. An important element of this type of programming is an analysis that traces major credit demands to a focus on the banking system, even on the central bank itself. First, a balance of payments target is
384 FINANCIAL FLOWS AND BALANCES
established, and the implications of projected imports, exports, and foreign borrowing for foreign exchange reserves are calculated. The pathway of balance of payments impact is through the movement in the foreign exchange reserves to the banking system. Because the central bank is assumed to be the residual buyer of government debt, public finance needs can ultimately also be traced to the banking system. Given an independent estimate of the appropriate currency and deposit expansion, the credit extension available to the private domestic sector can be calculated residually, and its adequacy can be judged in the light of financing needs. Iterations of this analysis lead to the fimiing of various policy objectives. Until now, financial programming has generally been done without the help of formal FOF projections, but it is evident that such projections would be a useful complement to the analysis.
Long-Run Development of Financial Institutions
FOF projections need not be merely short-run; they can cover 5-year plan periods or even 15- to 20-year financial developments. In this latter case the projection may reveal, or be required to take into account, various institutional developments in the financial system. Thus, shifts in the main sectors carrying out capital formation will be accompanied by changes in the types and composition of claims that the financial system will be asked to absorb. Similarly, as some households become more affluent and sophisticated, the supply of funds moving into the various financial markets will alter. Wealthy households may wish to deal regularly in equity share markets or to place funds into life insurance and pension saving. These changing borrower and lender needs will be forces for change in the financial institutions and the markets that are their financial channels. An efficient group of financial institutions can comfortably absorb the various instruments offered to it by borrowers and can offer a suitable variety of claims to meet the needs of lenders. The long-run changes in these borrower and lender needs will thus suggest appropriate institutional growth, and policies can be designed for its promotion.
One or two examples from developing countries may be illustrative. Well-organized open markets for financial instruments may not be common in developing countries. A country may wish to place more of its government debt issues domestically but less with its banking system. The situation may be appropriate for the design of a small-saver instrument that can be widely distributed and that would carry a very high rate of return in the interest of mobilizing private
FLOW-OF-FUNDS ACCOUNTS 385
nonbank saving. Or a country may wish to store liquid business deposits in foreign assets. Such accumulation represents lending to the rest of the world and may be part of a pattern in which the rest of the world is being treated as a financial intermediary, accepting shortterm funds and lending back long-term funds. It may be desirable to attract the short-term flow to the domestic economy. What is suggested is the need for a secure, liquid financial instrument-for example, a treasury bill-with a return attractive enough to compete with foreign instruments. The FOF projection can incorporate such new growth patterns into its flows and can assist one in judging their impact on other markets and sectors.
Given all these promising applications, why has FOF analysis not become more prominent during the past 30 years? On the one hand, FOF analysis-unlike input-output analysis-seems not to have developed a strong academic tradition. On the other hand, many applied economists have apparently not sensed how they might make use of the system. Or perhaps much FOF analysis is so informal as to remain hidden, as in much of the Fund's work. Nevertheless, given the growing importance of financial problems for most of the countries of the world, the system's potential remains great.
II. Conceptual Relationship of Flow-of-Funds Accounts to the SNA
In this section, the relation of FOF accounts to the SNA is examined.
Finance and the Evolution of the SNA
As background to a consideration of the relationship between FOF accounts and the SNA, it will be useful to review briefly the evolution of the SNA itself over the past 35 years: the so-called standard accounts as they first appeared in the 1953 version of the SNA, then as they appeared in the 1968 version, and finally as they might appear in the revision under consideration (SNA 1993). Several key features of each phase of the evolution will be discussed in tum.
The 1953 SNA
The standard accounts as initially laid out in the 1953 SNA focus on the circular flow of product and income. Accounts 1 and 2 present on
386 FINANCIAL FLOWS AND BALANCES
the right side the sale of the final product and on the left side the income and other payments generated in producing the product.2
Accounts 3 through 6 are the accounts that receive the income and, taking account of the various transfer and financing operations, use it in purchasing the product. This portrayal of the income circuit in the accounts thus separates the activity of production from all other activities engaged in by the institutional sectors of the economy-the activities that later came to be associated with income or outlay and capital finance. The foundation of the 1953 SNA system is a crossclassification of the economy: once by activity and once by institution. This first key feature is an obvious and familiar one.
The second key feature is that these standard accounts consist of a set of balancing and interlocking accounts. One source from which the analytical power of the system stems is that each account balances conceptually, that each is a selection of receipt items providing the finance for its corresponding group of disbursement items; each is a balancing statement for sources and uses of funds. Another source of the system's analytical power is its interlocking character. That is, each disbursement (use of funds) item in one account can be matched to an equal receipt (source of funds) item in a different account. The system is technically a quadruple entry system: a change in any one item implies a change in at least three other items. These are characteristics that greatly facilitate the tracing of intersectoral economic effects.
In connection with this interlocking feature, it is necessary to consider Account 6, External Transactions (rest-of-the-world account). The treatment of this account in the 1953 SNA-and in the 1968 SNA as well-is somewhat ambiguous with respect to the point of view represented by the account.
On the one hand, the title and wording of the account imply that it is an assembly of the domestic sector records of international transactions-as in a balance of payments account. Thus, we have an external transactions account, an account derivable by consolidating all the domestic sector accounts-Accounts 1 through 5. Such an account records transactions from the viewpoint of the domestic sectors. In this view the account reflects one kind of domestic sector activity, and the rest of the world is not an institutional sector in a system of national accounts.
2 If accounts 1 and 2 are consolidated, one obtains gross national product on the right and an income total on the left that may be referred to as gross national income.
FLOW-OF-FUNDS ACCOUNTS 387
On the other hand, if the accounts are to be considered as a complete system of interlocking accounts, Account 6 must be viewed as recording the transactions of the rest of the world (for example, a domestic sector receipt in Accounts 1 through 5 must be matched by a rest-of-world disbursement in Account 6). In the 1953 SNA, this view is implied both by the interlocking coding of account items and by the consistency with which the accounts elsewhere record sources of funds on the right and uses of funds on the left. In this view the right side of Account 6 should be labeled (Rest-of-world) Receipts rather than (Domestic Sector) Disbursements. It would seem desirable to remove this ambiguity in SNA 1993. And if the interlocking feature of the system is as important as we assert, it would seem that the External Transactions account should become unambiguously a rest-ofworld account and the rest of the world should become an institutional sector in a closed social accounting system.
A third key feature of the 1953 SNA is the analytical significance of the system. This feature was unquestionably a central motivation for the statistical development of the accounts. First, Western economic analysis had universally accepted the circular flow of product and income as a central organizing concept. Further, GOP (or some variant of it) was becoming widely accepted as an important measure of overall economic performance. In addition, the Keynesian hypothesis that GOP is determined by aggregate demand remains even today as the key practical hypothesis in macroeconomic analysis. In the 1953 SNA aggregate demand is prominently set out in Account 1. These accounts, particularly the sector accounts, also contain a judicious selection of other important variables-for example, household income and saving, the general government current deficit (saving), and the economy's external surplus on current account. Moreover, as was noted above, all the variables are related through the balancing and interlocking feature. Finally, although the 1953 SNA accounts are somewhat cluttered with items of minor importance for many countries, the scheme is simple enough to be analytically manageable. The list of such characteristics could be extended, but suffice it to say that the scheme was nicely designed and timed to catch on as a tool for economic analysis.
Finally, since the ultimate purpose here is to relate the SNA to finance, it is necessary to consider the portrayal of finance in these standard accounts. At first sight, Account 3 appears to be a capital formation account for the whole economy, showing domestic capital formation together with its methods of finance. But items 3.7 and 3.8, despite their labels as "finance," are imputed items measured as types of real capital formation. If one consolidates the three capital
388 FINANCIAL FLOWS AND BALANCES
reconciliation accounts (for households and the like, general government, and the rest of the world) with Account 3, however, one obtains an account for capital formation together with the elements of sector saving that ultimately finance it (items 4.6, 5.5, and 6.6; see the 1953 SNA, Standard Table V). Because this consolidated "saving and investment" account was in practice substituted for Account 3 and the reconciliation accounts were never developed, the best sense of the 1953 SNA is from the viewpoint of finance to see the system as presenting the sector surpluses that ultimately finance real investment but as not presenting any information about the flows in financial assets and liabilities by which the saving moves through the financial system into investment. These flows in financial claims have in effect been consolidated out.
An alternative view is to see the capital reconciliation accounts as primitive capital finance accounts (items 4.12 and 5.13 being converted into capital formation components) and Account 3 (by netting items 3.7 and 3.8) as applying only to corporate enterprises. This approach, in effect, deconsolidates the Domestic Capital Formation account. When this is done, the financial claim items (items 3.6, 4.18, 5.19, and 6.11) are retained, and finance remains explicitly in the system. It will be appropriate to pursue this view in discussing the 1968SNA.
The 1968SNA
Three different systems of standard accounts are apparent in the 1968 (current) version of the SNA. The first consists of the four consolidated accounts for the nation (Accounts 1, 3, 5, and 6). This system is then deconsolidated in two quite separate ways. One method deconsolidates the GOP and expenditure account (Account 1) in the direction of detailed production analysis. Because the concern here is finance, this path will not be pursued. The other deconsolidates the national income and outlay account (Account 3) and the national capital finance account (Account 5) into five domestic sectors each. When these 10 accounts are put together with the GOP and external accounts (Accounts 1 and 6), one has a 12-account version of the 1968 SNA. This is the standard system we shall examine as the 1%8 SNA.
How have the various key features that were sketched for the 1953 SNA fared in this revision? The 1968 SNA focuses even more sharply on the circular flow of income and product than did its predecessor. Note that the first two accounts in the previous system, the Domestic Product and National Income accounts, have here been merged into a
FLOW-OF-FUNDS ACCOUNTS 389
single GOP and expenditure account (Account 1). Thus, all of the GOP expenditure flows are on one side of Account 1, and all of the equal income flows-here called gross domestic income-are on the other side of the same account.
With respect to the balancing and interlocking features, the former is clearly present. But in the sector accounts the parenthetical references that specified the interlocking character of the previous system have disappeared. The 1968 SNA is nevertheless interlocking, but in a somewhat different sense. It should be understood as a matrix of accounts with balancing cross totals (total sources and uses for each transaction type), as well as balancing down totals (total sources and uses for each account). For example, the sum of the final consumption expenditure items as disbursements equals, conceptually, final consumption expenditure as receipts; similarly, total property income receipts should equal property income disbursements. The analytical power of the quadruple entry system is in this way preserved.
From the viewpoint of financial analysis, this 12-account system takes two crucial steps forward. Although the consolidated capital finance account (Account 5) remained similar to the earlier capital formation or saving-investment account in that it presented only the ultimate origins of the finance of investment, the deconsolidated sector capital finance accounts each present, as well, the immediate financial sources and uses. That is, these accounts show details of the net incurrence of liabilities and the net acquisition of financial assets as well as the sectors' saving (income and outlay surplus) and capital formation. Furthermore, these financial flows are for the first time defined (other than residually) and classified. As indicated earlier, such data make possible a very useful and straightforward analysis of how a sector finances itself and how it contributes to the finance of other sectors.
The second crucial step forward occurs by virtue of the separate sectoring of financial institutions in the 1968 SNA domestic sector breakdown. As pointed out in the 1953 SNA,3 the separate sectoring of financial institutions is necessary for a meaningful analysis of the financial flows. This is because of the intermediary role played by financial institutions in providing finance to governments and to the enterprise and household sectors. This role is characteristic of devel-
3 Page 14, paragraph 285: "No further classification of these [net changes in financial assets and liabilities] flows is undertaken in the system since, to produce meaningful results this would require a greater number of sectors including, in particular, a separate sector for banks and other financial intermediaries.''
390 FINANCIAL FLOWS AND BALANCES
oping as well as developed economies; almost all countries have important central bank and commercial banking institutions.
The matter of analytical significance raises questions about the 12-account system of the 1968 SNA: it appears to be far more complex than the 6-account system of the 1953 SNA. How much more analytically effective is the newer system? Is the added detail worth the effort to collect it? At least some sector detail is necessary to facilitate intersectoral impact analysis, and separate sectoring of financial institutions is essential for effective financial analysis. Thus, a meaningful system should accommodate, it would seem, no fewer than four domestic sectors.4
But proliferation of sectors is not in fact the main source of added complexity, which stems primarily from added detail of transaction type in the income and outlay accounts and the capital finance accounts.s These classification schemes could be substantially condensed with little analytical loss for the purposes of standard national accounts. Furthermore, with respect to the detail on financial transactions presented in the sector capital finance accounts, effective financial analysis requires not only less detail but detail of a different sort, which will be proposed in the discussion of SNA 1993. Suffice it to say here that a standard system containing well-designed sector capital finance accounts would be capable of producing financial system analysis far beyond the capability of the 1953 SNA.
Types of National Accounts Data Currently Submitted
Thus far the UN schemes of what was desirable in social accounting data have been discussed. There is also a need to observe what has been happening in practice over the past 35 years. One way of doing this is to look at what types of data the countries of the world are able to submit for the UN's compendium of national accounts.6 Table 4 summarizes a recent survey of this kind.
One can see in Table 4 strong evidence that the 1953 SNA scheme has taken hold in practice. Almost all of the 146 reporting countries are producing a GOP account (GOP, 1.1, and income, 1.3), although it is true that for many countries these data are not yet current. Most also provide the GOP by industry (1.10) and in constant prices (1.2
4 Private nonprofit institutions serving households need not be a separate sector in the standard accounts.
5 When social accountants try too hard for conceptual neatness, complexity is sometimes the result.
6 United Nations, National Accounts Statistics (New York, annual).
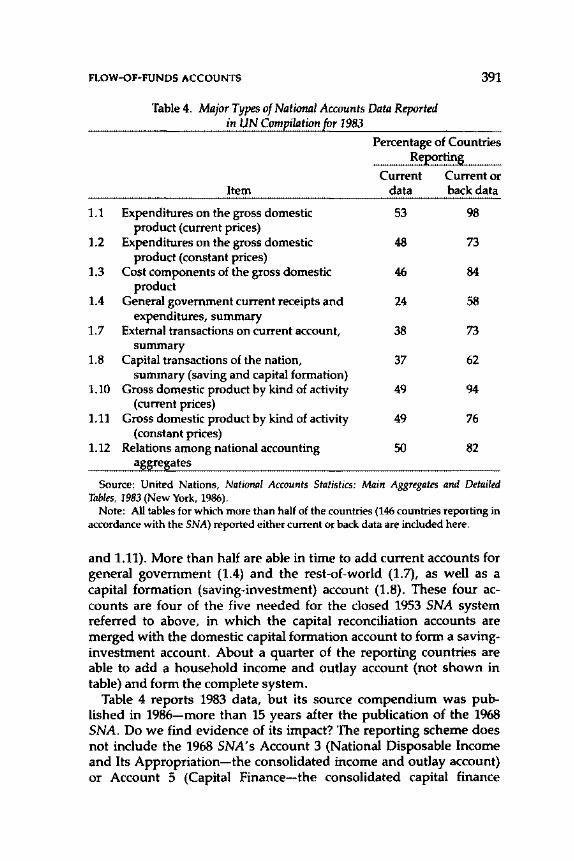
FLOW-OF-FUNDS ACCOUNTS 391
Table 4. Major Types of National Accounts Data Reported in UN Coml?!.lation fE.r 1983
Percentage of Countries Re£orting
Current Current or Item data back data
1.1 Expenditures on the gross domestic 53 98 product (current prices)
1.2 Expenditures on the gross domestic 48 73 product (constant prices)
1.3 Cost components of the gross domestic 46 84 product
1.4 General government current receipts and 24 58 expenditures, summary
1.7 External transactions on current account, 38 73 summary
1.8 Capital transactions of the nation, 37 62 summary (saving and capital formation)
1.10 Gross domestic product by kind of activity 49 94 (current prices)
1.11 Gross domestic product by kind of activity 49 76 (constant prices)
1.12 Relations among national accounting 50 82 aggresates
Source: United Nations, National Accounts Statistics: Main Aggregates and Detailed Tables, 1983 (New York, 1986).
Note: All tables for which more than half of the countries (146 countries reporting in accordance with the SNA) reported either current or back data are included here.
and 1.11). More than half are able in time to add current accounts for general government (1.4) and the rest-of-world (1.7), as well as a capital formation (saving-investment) account (1.8). These four accounts are four of the five needed for the closed 1953 SNA system referred to above, in which the capital reconciliation accounts are merged with the domestic capital formation account to form a savinginvestment account. About a quarter of the reporting countries are able to add a household income and outlay account (not shown in table) and form the complete system.
Table 4 reports 1983 data, but its source compendium was published in 1986-more than 15 years after the publication of the 1968 SNA. Do we find evidence of its impact? The reporting scheme does not include the 1968 SNA's Account 3 (National Disposable Income and Its Appropriation-the consolidated income and outlay account) or Account 5 (Capital Finance-the consolidated capital finance
392 FINANCIAL FLOWS AND BALANCES
account). So, apparently, the four "Consolidated Accounts for the Nation" as a standard scheme did not take hold. As regards the deconsolidated 12-sector scheme, only a handful of countriesperhaps 10 percent, largely in Europe-are able to report sector income and outlay accounts at the level of detail of the 1968 SNA, and a still smaller handful-perhaps 5 percent-are able to report detailed sector capital finance accounts. One thus must conclude that the 1968 SNA is not widely used as a system of standard accounts.
Implications for SNA 1993
In formulating SNA 1993, it is important to consider why the 1968 SNA has had so little impact. The data suggest an important clue: whereas 57 percent of the countries reporting could submit a summary account of general government current receipts and expenditures, only 11 percent could submit one at the level of detail required by the standard system; for the external account, the corresponding figures are 73 percent and 11 percent. One might infer that the 1968 SNA is too complicated and detailed for most countries to produce at present. It is this author's view that the 1968 SNA is too complex and contains too much insignificant detail for straightforward policy analysis. These suggestions underscore the objective in the current revision process of presenting a simpler standard set of accounts.
Flow-of-Funds Representation in the SNA
What, then, should inform a vision of the about-to-be-created SNA 1993 standard accounts? If the main lesson of the 1968 SNA is to be heeded, the new accounts should not be far ahead of the current statistical accomplishment of most countries. To be serviceable, the new accounts should be next steps in feasible statistical development. In addition, the analysis has stressed the need to maintain sector accounts in the standard central system. In addition, sector capital finance accounts and the separate sectoring of financial institutions are needed for effective financial analysis. Are these objectives compatible? It appears so.
In sketching a suggested new system, let us begin where a good many countries are now: they have a gross product and income account; income and outlay accounts for the rest-of-world, general government, and households (including within it nonprofit institutions); and a consolidated capital formation (saving-investment)
FLOW-OF-FUNDS ACCOUNTS 393
account. Let us move along the lines of the 12-account scheme of the 1968 SNA but keep in mind the need for simplification.
First, envision a vertical extension of the rest-of-world account to derive its capital finance account and a similar extension for general government. The development of full balance of payments and government finance data for most countries during the past few decades should make this a relatively easy step. (As discussed further below, however, the balance of payments data must be in local currency.)
Three capital finance accounts remain: for nonfinancial enterprises, for financial institutions, and for households and the like (including nonprofit institutions). Imagine them lumped together into a single residual capital finance account. For analytical purposes it is essential to estimate and break out an account for at least a large share of finanCial institutions. For many countries this can be done through an account for the monetary and banking system alone, and these basic data are available for almost all countries. As noted below, it is analytically less essential to break nonfinancial enterprises away from households and the like, but such a step would in any event have to await the compilation of balance-sheet data for substantial groups of enterprises. If the SNA 1993 wishes to emphasize feasibility, a firststage version of it might contain, first, a capital finance account for the monetary and banking system and, second, a catch-all capital finance account for other domestic sectors.
Consider also the types of financial transactions to be used. As suggested earlier, much of the difficulty in producing sector capital finance accounts may stem from the complexity of the classification scheme for financial claims. For SNA 1993, a greatly condensed scheme consisting of four broad financial categories is suggested: (A) foreign assets; (B) currency and deposits; (C) bills, bonds, and loans; and (D) other claims.
The existing 13-claim categories can, of course, be allocated to these headings.7 The purpose here is only in part simplification. In many applications foreign assets (category A), properly defined, will consist largely of net foreign exchange. In addition, currency and deposits
7 The allocation is straightforward except for category A. Foreign assets consist of all rest-of-world liabilities held by domestic sectors as financial assets. In the cases of the central bank and the commercial banks, however, it is somewhat customary to assign to this category (by netting against their foreign assets) certain of their short-term deposit liabilities held by the rest of the world. In this way, the foreign asset holdings of these two banking sectors become net foreign exchange-the balances used to effect international transactions.
394 FINANCIAL FLOWS AND BALANCES
(category B) are closely related to money, broadly defined. So these categories are likely to be of analytical use.
To understand why category C as a whole might not be very useful, consider such an item in the various 1968 SNA capital finance accounts. Each of the sectors might accumulate and each of them might issue these instruments. In these circumstances it would generally not be possible to identify who is acquiring from whom (that is, who is financing whom). And narrowing the category to long-term bonds would probably not improve matters. But consider the category of central government bond issues. Here only one sector issues the instrument. In the absence of secondary market transactions, the acquiring sector is financing the government. Even with secondary market transactions, there is a much better chance with government bond issues of being able to identify who is financing whom-and that is the central objective in financial flow tracing. To generalize, the most useful financial transaction types will be those designed so as to have only one or two sectors issuing or only one or two sectors acquiring the instrument. Category C needs to be broken down.
This discussion of the most useful categories of financial transaction types for a FOF matrix is related to Table 24 in the 1968 SNA. The same 13 types of claim that appear in the sector capital finance accounts appear there, but within each of the 13 types also appears institutional sector detail to indicate sectors bearing the liabilities for that particular claim.s The line for a subcategory such as S.iii (longterm bonds, liability of the central government) would have a single issue figure under central government off to the right and figures for the various sector acquisitions off to the left. Given such detail, it is clear that the category of central government debt could be assembled as the sum of 4.iii, S.iii, 7.iv, and 8.iii-that is, the sum of all the central government liability components that one wishes to define as constituting central government debt. Alternatively, if one wishes to build up data for the 13 basic claim types, one would have to reverse this process, allocating central government debt to the Table 24 subcategories. The Table 24 analysis thus shows how the 13 basic claim types can be conceptually related both to basic data sources and to analytically significant categories.
Perhaps the simplest effective breakdown for the bills, bonds, and loans that make up category C would be into central government debt, bank loans, and other, but most countries should consider at least the following:
8 To simplify this discussion, the subclasses indicating sectors holding the particular claim are neglected here.
FLOW-OF-FUNDS ACCOUNTS 395
C. Bills, bonds, and loans 1. Central government debt 2. Central government loans 3. Central bank advances 4. Financial institution loans and advances 5. Other debt.
This or a similar list should be adopted for the SNA 1993 standard accounts to suggest the type of detail that countries would find analytically useful. These are the types of claims shown in Tables 1 and 2 that were used to indicate intersectoral tracing of financial flows.
In summary, producing the accounts as presented in the 1968 SNA sector capital finance accounts requires a high level of financial detail-detail at the level of the subcategories of SNA Table 24, which is generally available only in the most statistically advanced countries. Further, the transaction types in these accounts are not very effective in financial flow analysis: they provide little sector-to-sector identification of flows. The alternative classification presented above is simpler and, as will be shown in Section III, can be derived directly from data available in almost all countries. In addition, it is demonstrably useful in financial flow analysis.
In conclusion, the FOF accounts should be represented in SNA 1993 by a closed set of condensed capital finance accounts for the rest-ofworld, general government, and monetary and banking sectors, and the other domestic sector. To form a standard system, a gross product and income account and three income-outlay accounts (rest-of-world, general government, and households and the like, including nonprofit institutions) could be added to these four capital finance accounts.9 These eight accounts could form a closed, interlocking system-a system that in its condensed form is achievable for most countries in the next decade or so and that could be a standard first stage leading to a later, more detailed standard system.
If financial analysis is to have an improved social accounting data base, increased statistical effort must focus on the sector capital finance accounts. To help in this effort, these accounts must have a prominent place in formulation of the simplest, central, UN standard accounts.
9 A simplification would be not to have separate income-outlay accounts for nonfinancial enterprises or financial institutions. The latter account is analytically insignificant, and the former greatly overlaps in content the gross product and income account. In effect, these two income-outlay accounts could be merged with the larger account without loss of analytical power.
396 FINANCIAL FLOWS AND BALANCES
Flow-of-Funds Accounts, the Fund's Statistical Systems, and Harmonization
The view taken here is that the hope for an early statistical realization of sector capital finance accounts rests in large part on early development of such accounts for the government, the rest-of-world, and the monetary and banking sectors. To serve the social accounting purpose, such accounts must, of course, fit into a matrix. This means that at the technical level there must be consistent sector coverage and consistent accounting treatment of transactions within and (especially) across sectors. This is what harmonization means. Harmonization among the three Fund sy~tems-government finance statistics (GFS), balance of payments statistics (BOPS), and money and banking statistics (MBS)-and between each of these and SNA 1993 becomes an issue because GFS, BOPS, and MBS (or closely related country data) are likely to be basic source material for the new FOF accounts.
Each of the three Fund systems has had international comparability as a goal, and each has provided useful compilations of data. In this process some member countries have altered their accounts in the direction of the respective Fund conventions. To the extent that the Fund's standard systems are not harmonized, such alterations may make the local articulation of these accounts more difficult. There is to some extent an inherent conflict between international comparability and local articulation of sector accounts, but this is especially so if the international standards are not harmonious.
If GFS, BOPS, and MBS had been developed for systematic social accounting purposes, their instruction manuals might well now provide uniform and consistent conventions of measurement. These systems did not, however, come about in this way. They were created within the Fund over a considerable period, each guided by the analytical needs of a particular group of specialists. It is true that steps toward harmonization were taken as the later system~ were developed and the earlier ones revised. But differences remain, and now that the differing conventions of measurement have taken hold among analysts both within and outside the Fund, changing them will be difficult. Perhaps over time the analytical advantages of a social accounting approach may be persuasive in moving toward harmonization: after all, the problems dealt with by the Fund usually deal with the interrelations among these three sectors. At present, however, the differing needs of each system's primary users may continue to impede true harmonization.
FLOW-OF-FUNDS ACCOUNTS 397
SNA 1993, in contrast, is constrained to build full consistency into its system. In this situation, what is to be done? Of course, one should harmonize to the extent possible. But wisdom may suggest stressing the construction of standard reconciliation or bridge tables linking the key time series in the four systems to permit analysts to move from one system to another in both estimation and analysis. Such an effort, which is under way, should be given urgent priority because such tables could greatly facilitate the construction of SNA accounts by individual countries.
Curiously, the single most important harmonization issue for the SNA seems likely to be overlooked entirely. To form a closed system, all the sector accounts of that system must be in the same unit of account, the same currency. Thus, it is essential to the SNA that the rest-of-world account be expressed in the local currency. But this in turn means that there must be a balance of payments account in the local currency as a data source. The increasing trend throughout the world is to do balance of payments analysis in some international currency such as U.S. dollars. The loss of any analytical connection with domestic sector data is apparently less important than the fact that payments to abroad must be made in an international currency. In countries without balance of payments data in local currency, or where such data are of low quality, the Fund could aid the development of the SNA accounts by ensuring the early compilation or improvement of these data.1o
Dealing with the many technical aspects of the harmonization issue is outside the scope of this paper, but an attempt will be made to offer an approach to these problems, one that suggests a rough ordering of priorities. Attention should first be focused on the definitions of sector coverage for the major domestic sectors and the rest-of-world sector. The remaining issues here are relatively minor, and-with compromise-true consistency should be achievable. In any case, complete harmony on the definitions of major sectors would greatly simplify the conversion of BOPS, GFS, or MBS data into the corresponding SNA capital finance accounts.
The second priority for harmonization would be toward standardization of the financial-nonfinancial line in each sector account for the four systems. Conceptually, entries indicating the exchange of goods, services, and transfers lie above this line in each sector account, and
10 Technical readers will be aware that, for countries with multiple exchange rates, the conversion of the account from local currency to dollars or vice versa cannot be satisfactorily done with the use of a single conversion ratio.
398 FINANCIAL FLOWS AND BALANCES
entries recording the exchange of claims (including cash balances) lie below this line. In the 1968 SNA the line is marked by the net lending item in each capital finance account, which, broadly, equals the difference between gross saving and gross capital formation for each sector.11 In the harmonization, the attempt would be to standardize the definition of this deficit or surplus of each sector; conceptually, the algebraic sum of these items across all sectors (including the rest-ofworld sector) should be zero. Drawing this line is an essential feature of FOF accounts.
For example, in the GFS, although lending minus repayments is separated out from other government expenditure and revenue, it is for analytical purposes located above the overall deficit or surplus line (that is, as part of the net aggregate that is to be financed by government debt issue). Although this practice cannot be accepted by the SNA, the separate identification of the item makes the shift of these financial transactions to below the deficit line simple. This applies, of course, providing that the technical specifications for the total of lending minus repayments are in harmony with those for the other sectors. This harmonization is an example of the second-priority focus.
Finally, the complexities of the harmonization of the various types of financial transactions should be addressed. Here, too, one can take a "closing in" strategy. First, standardization should be attempted across sectors of broad groups of claims, such as the four groups we suggested earlier, by way of simplifying the capital finance account (see the preceding subsection). In this way there are far fewer borderlines to define. Beyond this, one can only recommend the wisdom of the view that in these matters it is necessary to have some agreed convention; which particular convention is less important. Where agreement is not possible, one should take on the obligation of providing reconciliations.
Consider just one key example in this category. It is hoped that harmonization can be effected in the area of foreign exchange and, in particular, the area of international reserves. The flow in these net foreign assets appears only in the monetary sector and the rest-ofworld sector accounts. The analytical purpose of the identification of these reserves-a key part of the means of payment for international transactions-is broadly the same for users of both BOP and MBS. Furthermore, both estimates generally rely on the same (monetary sector) sources for data. To a practitioner there would seem to be no reason for differences in these flows where they are expressed in
11 The minor items are neglected here: purchases of land, net; purchases of intangible assets n.e.c., net; and capital transfers, net.
FLOW-OF-FUNDS ACCOUNTS 399
the local currency unit. At a minimum, there should be a clear reconciliation.
Balances, Flows, and Valuation Changes
About a decade ago the standard accounts of the 1968 SNA were extended in the Provisional Guidelines12 to add a system of balancesheet and reconciliation accounts to the capital finance accounts. The construction of national and sectoral balance sheets and reconciliation accounts is in general envisioned as a stage beyond the construction of sectoral capital finance accounts (that is, FOF accounts). Nevertheless, because flow estimates are often derived from balance-sheet increments, the two areas appear to have a substantial overlap, and it is this overlap that will here be explored.
From an accounting viewpoint, asset and liability balances change either as a result of transactions, which are encompassed in the flow measure, or as a result of revaluations-that is, write-ups or writedowns of the asset or liability valuations. This principle is embodied in the definition of the reconciliation accounts, which include all the differences between opening and closing balance-sheet accounts that are not covered by the flows in the capital finance accounts. That is, the reconciliation accounts will consist largely of revaluations of balance-sheet items.n
In general, the Provisional Guidelines call for nonfinancial assets on the balance sheets to be valued at current market values. This rule makes large annual revaluations of tangible assets highly likely; because the companion entry to every revaluation is a corresponding change in the transactor's net worth, large and frequent revaluations in sector equities are assured. The situation differs dramatically, however, when one considers financial assets. With only three exceptions, the Provisional Guidelines call for these assets to be valued at nominal or face values. These financial assets-so-called fixed-claim assetsare similarly valued as liabilities. The upshot of these rules is that much of the array of claims in the FOF matrix is not subject to regular revaluations owing to asset price changes.
The exceptions to the use of nominal values for financial assets are
12 United Nations, Provisional International Guidelines on the National and Sectoral Balance-Sheet and Reconciliation Accounts of the System of National Accounts, Statistical Papers, Series M, No. 60 (New York, 1977).
13 The reconciliation entries will also include some nonrevaluation elements, such as changes that are due to asset items not included in the capital finance accounts and statistical discrepancies and discontinuities.
400 FINANCIAL FLOWS AND BALANCES
made in the cases of (1) gold, (2) long-term bonds, and (3) corporate equity securities. Current market valuations are proposed for all three of these. Market valuations are also proposed for long-term bonds and corporate equity securities on the liability side of the balance sheet. Thus, revaluations are to be expected in these three items. The Provisional Guidelines also allow for another important type of revaluation. The foreign assets category will be subject to revaluation if the local balance-sheet convention is to show the local currency equivalent of the foreign exchange that is receivable or payable on the claim. In all, one is alerted to three types of FOF claims in which revaluations are likely to play a role in the scheme for balance-sheet and reconciliation accounts: (1) corporate equity securities, (2) long-term bonds, and (3) foreign assets (including gold).14
Let us now return to the situation of the implementation not of balance sheets and reconciliation accounts but merely of the capital finance accounts themselves. The problem will be reduced to removing revaluations that are picked up when flows are estimated from balance-sheet increments. To consider it, one must anticipate some of the results reached below in the discussion of estimating procedures. Of the main sectors, at first only the accounts for the financial sectors will be estimated from balance sheets. The valuation conventions for these balance sheets will be near enough to face values so that the increments will be good approximations of the actual flows for most items. But if long-term bonds are a substantial portfolio item, and if the balance sheets value them at market values, removal of the revaluations will be in order. Finally, there may be difficulty in reconciling the flow in net foreign exchange to the corresponding flow as shown in the balance of payments. Valuation changes may be at the heart of this matter. This last is the harmonization issue referred to above.
At a later stage in the implementation, balance sheets of enterprises-both government and private-will be used as sources. Revaluations of fixed assets as well as other items on the balance sheet are to be found here and can probably be avoided in flow estimates only by a case-by-case scrutiny of the accounts. In addition, large revaluations in the corporate stock account are so likely that this item should not be used to estimate the cash inflow derived from net cash stock issues if at all possible. In most cases, this flow is small and, luckily, plays a minor role in the FOF matrix.
14 In principle, one may also find revaluations that are due to exchange rate response in the case of debts held by foreigners, but such cases seem uncommon.
FLOW-OF-FUNDS ACCOUNTS 401
Overall, this review of the problems involved in the overlap of FOF estimation and the revaluation of balance-sheet items has indicated that the overlap is not large. Experience indicates that at present most of the errors that are due to unidentified revaluations being mixed into the flows are small errors in relation to classification problems and other data shortcomings.
III. Feasible Flow-of-Funds Accounts and the Developing Countries
Mos~ of the 160 or so countries of the world are developing countries. One of the features of a developing country is a developing statistical system. Unfortunately, the 1968 SNA did not take into account that a great many countries have only the most limited capacity for producing new and improved data. One surmises that this was a key reason that the 1968 SNA has been, as concluded above, too complicated and detailed for most countries to produce during the past 20 years; the goals were set too far ahead of the possibilities.
In presenting its full set of standard accounts and supporting tables, the only concession the 1968 SNA made to development was a suggested order in which the full accounts should be implemented.15 The developing countries were not offered any intermediate targets leading up to the full system. In particular, they were not offered simpler versions that, although within their statistical capabilities, would offer the analytical advantages of a social accounting system (that is, of a closed set of interlocking accounts). The objective in this section is to demonstrate a simplified system in the FOF area that is currently feasible for almost all countries and that can lead in steps to the 1968 SNA system of sector capital finance accounts or to a complete FOF system. It is, in effect, a design for a series of intermediate systems leading toward complete implementation; it thus embodies its own suggestions for statistical priorities.
Getting the Initial Estimates
The method of presentation will be to describe the statistical implementation of a simplified FOF matrix by using the sort of statistical base found in the developing countries in, let us say, the 1970s. This
1s Note that the chapter in the 1968 SNA devoted to developing countries was concerned with how the full system, presumably once that system was achieved, could be adapted to the development situation.
402 FINANCIAL FLOWS AND BALANCES
will enable an enumeration of the bare statistical necessities for such an undertaking. Then the successive stages of statistical elaboration of the matrix will be described in the order of movement toward a full system. For this exercise we shall assume that the Fund's BOPS, GFS, and MBS systems are not available to use as data sources.
Table 1 earlier presented an illustration of the format used for the earliest stage of a FOF matrix.16 It contains a very simple sectoring scheme of five sectors: central government, central bank, commercial banks, rest-of-world, and other domestic (a catch-all sector that includes enterprises, households, and a variety of smaller sectors including provincial and local government and other financial institutions). The classification for types of financial claims follows closely the scheme advocated above. In Table 1, financial institution loans and advances is divided between central bank advances and other loans and advances, which in this simple sectoring become entirely commercial bank loans and advances. Note that several of the key claims selected for enumeration are claims attributable to the sectors that have been selected, so that if data are available for these sectors they will in general be available for these claims. Note also that this layout of sector accounts does not suggest government as a whole or financial institutions as a whole. Each of these more aggregative sectors contains subsectors for which data are not likely to be available at this earliest stage.
As a primary matter, the time reference that is to be standard for all sectors must be considered. Local data sources may deal with the central government on a fiscal year basis, whereas the banking data and balance of payments are on calendar years. Which time reference is used will depend on the ease of conversion. If an insufficient amount of quarterly or semiannual data is available to permit conversion and, hence, uniformity where it does not exist, then FOF implementation should probably be deferred. Financial flows are simply too volatile for the average of two calendar years to be representative of a fiscal year, or vice versa.
A second primary requirement is the existence of balance of payments data on a local currency basis. As suggested above, moving from dollar or SDR figures to a local currency basis with a single exchange ratio can sometimes give unsatisfactory results. However, the most critical data are those for the current account balance and the items above it. Because local currency figures here are necessary for
16 Use of this format is recommended not only for countries with the leastdeveloped statistical systems but also as the starting FOF format for countries at a more advanced statistical stage.
FLOW-OF-FUNDS ACCOUNTS 403
the income and product accounts, it is likely that even for developing countries a local currency balance of payments will be available or can be estimated. If it is not possible to obtain it, however, the FOF effort should be deferred.
The question of how current the basic data are is a final preliminary. The data are likely to be reasonably current in the directly estimated sectors because they are all tied to areas of current public policy decision making. At the start, one need not aim to assemble a very recent year. This compiler would be well-advised to move back in time to a year in which definitive rather than preliminary or revised data are available. Once the system can be successfully produced with a lag of a few years, one can use the more recent, more preliminary, and more fragmentary sources to carry the system toward current data production.
One may now proceed to the matrix itself, referring to Table 1. The totals data at the right of the table for the first two lines-gross capital formation and gross saving-will come from the national income and product (NIP) data. It is on these first two lines that the FOF construction ties in with the income and outlay accounts that lie above the capital finance accounts in the SNA. The key breakdown of capital formation between central government and other sectors is usually available in the NIP source. The saving breakdown is generally more troublesome. The NIP source will have a rest-of-world saving figure that is (minus) the surplus of the nation on current account, but NIP is unlikely to have central government saving. This figure may well have to be derived as an operating surplus from the central government data. Given the domestic saving breakdown between central government and other sectors, one has the surplus or deficit of each sector (shown in Table 1 as net lending), 17 which is to be analyzed into the incurrence of liabilities (financial sources of funds in Table 1) and the acquisition of financial assets (financial uses in Table 1) in the lower section of the matrix.
Now consider the initial derivation of each of the directly estimated sector accounts from its basic sources. For the central government, two such sources are generally available: the data associated with the budget-making process and the data associated with the auditing process. Each will contain past actuals for income, outlay, and financing-the budget source often being more up to date but less detailed. The quality of either source may be much better than the
17 As a first approximation, these lines for the banking sectors may be assumed to be zero.
404 FINANCIAL FLOWS AND BALANCES
other. It is better to stick to one source if possible, since each reflects a whole system of accounts and tables.
The worksheet task is to transcribe the balancing account and supporting detail so that the account can be rearranged and condensed to yield a first approximation to the Table 1 sector account. The focus will first be on deriving a nonfinancial surplus or deficit (net lending) from the revenue and expenditure figures. The main difficulty is the removal of financial transactions from the expenditures and revenues.ts Expenditures are likely to contain new loans or equity advances (or both) made and also repayments of government debt principal; receipts will probably contain some types of debt issues and repayments of principal on loans. These financial entries are to be assigned below the line to complete the estimates for the net increases in government debt and government loans. It is useful to keep the balance in the account during this process of netting, reclassification, and condensation, making use of a miscellaneous (or ''other sources") net item. Finally, if necessary, the nonfinancial surplus control figure from the government finance data can be combined with the capital formation figure from the income and product data to obtain a residual estimate for central government gross saving.
As this process proceeds, classification decisions will be made. If ways and means advances from the central bank can be identified in these data, they can be assigned either to the bank loans or government debt category according to local policy usage. For FOF purposes, where they are assigned is not critical; the key point is to make the same assignment in the central bank account.
In broad outline, the estimation of the rest-of-world account from the balance of payments data is a simple affair. 19 The debits and credits are reversed to shift to a rest-of-world viewpoint, and the current account is netted down to a single gross saving figure. In the transforming of the capital account, it is essential that the basic data separate asset items from liability items so that financial uses can be separated from sources. The capital flow to the official sector is an estimate of the rest-of-world's acquisition of government debt, and that to the private sectors is an estimate of its acquisition of other domestically issued debt. All the rest-of-world liabilities are assembled into the claim category of foreign assets. To the extent that these
18 Other technical problems may involve the removal of internal transaction entries and the adjustment of accrual items.
19 It is assumed here that the figures for the balance of payments current account surplus from the balance of payments data and the rest-of-world saving from NIP data are equal, apart from sign reversal.
FLOW-OF-FUNDS ACCOUNTS 405
are held by the central bank or the commercial banks, they become foreign exchange; in general, other domestic sector holdings are small. It is sometimes analytically desirable to present the foreign exchange of the two banking sectors on a net basis, and that convention is followed here. In principle, then, the rest-of-world's foreign exchange entry is the sum of the net foreign exchange held by commercial banks and by the central bank. These entries are the bulk of the foreign assets line.
The flows for both the central bank and the commercial banks in Table 1 are derived as balance-sheet increments. The basic process is again straightforward. Balance-sheet transcriptions are taken from the basic banking statistics; they are reclassified into FOF format, and increments are taken. To ensure that the currency and deposits liabilities of the banking sectors reflect the entire quantity of money, a small accounting adjustment is sometimes made (as in MBS), transferring any monetary accounts of the central government into the central bank account.
Whenever financial flows are being estimated by balance-sheet increments, as here, the question arises whether these increments reflect only the transactions in the instrument or also reflect book write-ups or write-downs.2o Conceptually, the revaluations should be removed so that the flow portrays only the transactions. Practically, the matter hinges on the size of the revaluation in relation to the flow and, indeed, on whether the data availability makes the removal possible. Fortunately, for developing countries, experience indicates that the problem is not serious in the banking sectors as far as the domestic assets and liabilities are concerned.21 As noted earlier, it is most likely to arise in foreign assets and with respect to net foreign exchange. For example, it has become somewhat conventional for central bank balance sheets to revalue their monetary gold stocks for balance-sheet purposes. Because the international transactions in gold are likely to be small, the flow will be overwhelmed in the balance-sheet increment by a revaluation of the stock, and a removal adjustment will be essential.
With respect to commercial banks, the sector coverage will be governed by the basic aggregation in the banking statistics. It is very
2o The issue here is not affected by whether the gain or loss is realized but, rather, by whether balance-sheet valuations reflect the gain or loss, realized or not. The sale of a financial asset that realizes and records a gain should be viewed as a book revaluation followed by a transaction.
21 It is assumed here that the commercial banks' long-term bond holdings are small.
406 FINANCIAL FLOWS AND BALANCES
important for effective sector articulation that the data used be as of the actual year end and not, for example, as of the end of the last business week of the year. In the account for this sector, it is useful to accept for the time being the definition of bank loans that is found here (interbank loans are eliminated). Further, the bank loan portfolio figures are taken as the statistical control total for the bank loans (other loans and advances) category. With the Table 1 matrix, the only institutional sector breakdown of bank loans that is required is that between central government and other, and the usual balance sheet will provide it. But, to anticipate, a bank loan classification by institutional sector (loans to local governments, government enterprises, other financial institutions) will at a later stage be very useful.
Once preliminary sources and uses of funds accounts have been completed for the four sectors, the assembly of the other domestic sector in Table 1 is simply a matter of calculating the residuals to balance the cross totals. In this process, any items in the discrepancy columns not involving the other domestic sector should be taken as given. In fact, the discrepancy columns should be treated as if they comprise an institutional sector, with a residual estimate at the bottom to force the total net sources to zero.
The matrix at this stage is a fairly rough affair. It is essential now to examine and tighten the articulation of the sector accounts. This is best done by focusing "cross-wise" on the transaction type accounts or the level version of these accounts, which may be called debt distribution tables. For example, suppose that the banking statistics offer a table that breaks down the government debt holdings by sector, or that data are available for portions of the government debt such as treasury bills or government bonds. The assembly of such tables may well have involved adjusting the technical basis of the various sector records into uniformity and may thus enable the compiler to do so as well. 22 Most important, this process should enable one to make progress on what are likely to be the main inconsistencies at this stage-the coverage of the types of transaction. Borderline transactions need to be treated in the same way by all sectors across the matrix. For example, if the treasury catries an overdraft, it must consistently be assigned either to deposits or to bank loans.
In the end, the compiler will have a matrix of substantial usefulness both as a way of conceptualizing important relationships and as a source of substantive analysis. A number of types of analysis that are
22 The major origins of discrepancies may be listed as differences in (1) sector coverage, (2) transaction classification, (3) basis of valuation, (4) timing of recording, and (5) degree of netting or of consolidation.
FLOW-OF-FUNDS ACCOUNTS 407
available even with so condensed a matrix were indicated in Section I. If it is urged that a residually estimated "other domestic sector" is not a very firm basis for economic policy, then the reply must be that these estimates are inferred from data for the central government, the banking system, and the balance of payments that are routinely used as the basis for policy. One may as well see clearly what such data imply for the other domestic sector. Finally, as it is hoped this description has made clear, one has an instrument that is feasible and inexpensive to create-easily done by one social accountant in, perhaps, two months.
Tightening the System
One of the great advantages of the initial FOF implementation described above is its launching of a creative stage for the statistical system of a developing country. Broadly speaking, the condensed FOF matrix provides the incentive and points out the direction for several substantial improvements in financial statistics. The nature of these developments will now be indicated.
Table 1 might have very few entries in the discrepancy columns. If this is the case, it would not be because of the high quality of the estimates, but rather because of the necessity for residual estimates for the other domestic sector. In effect, many of the discrepancies will be transferred to and incorporated in the estimates for this sector. These discrepancies can be conceived of as arising from the existence of two differing estimates for one FOF matrix cell-estimates from two differing statistical sources. For example, figures for bank reserve deposits usually appear in the balance sheets of both the central bank and the commercial banks. If the figures differ and if, rather than selecting one as the basis for both bank reserve flow estimates, one retains both flow estimates-each in its respective sector-then one has identified a discrepancy that will appear in the discrepancy column. It is very important in FOF work to make such identifications wherever possible and to have them appear in the discrepancy columns: if the discrepancies are large and involve key policy variables, they should be out in the open so they can be dealt with.
The estimates assembled so far have involved three (largely) separate data sources. Thus it is likely that this sort of discrepancy will already have been encountered and that the differences will turn out to be recalcitrant (that is, the estimates cannot be reconciled by modest efforts). Five possibilities for such discrepancies might well be significant: (1) central government borrowing from abroad (central
408 FINANCIAL FLOWS AND BALANCES
government versus balance of payments data), (2) central government cash balance (central government versus banking data), (3) change in foreign exchange reserves (balance of payments versus banking data), (4) central government gross saving (central government versus national income and product data), and (5) government debt issue (central government data versus data compiled in the central bank).
To gain a sense of why the exploration of these discrepancies has creative possibilities, visualize the typical statistical "system" of many developing countries. The data souraes considered here will to some extent correspond to different data-producing organizations. Perhaps there will be a bureau of statistics producing the national income and product data. Probably the central bank will supervise banking data and the assembly of the balance of payments data, and the treasury (or auditor general) will generate the central government data. In a developing country, these organizations may well generate their respective data with a minimum of technical communication with respect to statistical methods or detailed breakdowns. Coordination and cooperation among governmental agencies may not yet have developed. The point is that a detailed reconciliation effort of the sort required to reduce the FOF discrepancies requires the kind of technical consultation that can become an important force for coordination.
Organizationally, FOF analysis also needs a home. Some single agency needs to be responsible for its generation; an interagency committee will not have sufficient authority to be successful. Probably the central bank will have closest access to the necessary data sources and, eventually, to analytical users. The latter is desirable because users will press for continuous, current generation of the data and for needed types of further detail.
Expanding the System
The strategy for expanding the condensed matrix, either toward the 1968 SNA's sector capital finance accounts scheme or toward a still fuller FOF system, is the same simple one: to break down the "other domestic sector" -that is, to proceed to make direct estimates for subsector accounts and in tum break each subsector account out of the other domestic sector, each time leaving a smaller and more homogeneous, residually estimated other domestic sector. This procedure implies that added sector detail is more useful analytically than transaction detail at this point. This will continue to be true until the main parts of the enterprise sector can be separately shown.
FLOW-OF-FUNDS ACCOUNTS 409
If a country has a substantial system of economic planning, an appropriate statistical direction would be toward a public sector account (that is, to estimate accounts for provincial and local government and for government enterprises). Provincial and local governments themselves (or at least the large ones) should be able to provide income, outlay, and financing data in budget documents. If necessary, earlier actuals can be carried forward on the basis of budget figures. Or it may be possible to assemble a synthetic account from data from the planning ministry if the plan covers provincial and local government capital formation and financing. In addition, perhaps the banking data can provide figures for bank loans to this sector. As this sector is entered into the matrix, the components of provincial and local government debt issues will be defined and allocated. There may be security issues (perhaps assigned into other domestic debt), borrowing from the central government (into central government loans), bank loan borrowing (into other loans and advances), and, perhaps, borrowing from abroad (into other domestic debt).
Next, nonfinancial government enterprises will be considered. Suppose that the central government or planning data do not provide the detail needed to assemble a capital finance account, and so a new compilation must be made. The initial task will be to transcribe the balance-sheet and appropriate income statement items for each enterprise from published annual reports or reports filed with regulatory agencies or with the registrar of companies.23 If there are many such enterprises, a sample of the largest may be advisable; often, a surprisingly small number of government enterprises can account for 80 percent or more of the sector. Given the transcriptions, a standard balance-sheet format must be designed-one as close as possible to the FOF classification but still one into which all the enterprise statements can be transformed in order to permit compilation. If the accounts have been audited by auditing companies, the balance-sheet formats will b~ surprisingly similar. At this point in the derivation of the FOF account from these data, rough estimates of some items will no doubt be necessary. Finally, either the sample or blown-up estimates for the universe may be used for the FOF sector.
Another subsector that will be quite easy for most developing countries to assemble is that of the nonbank financial institutions. In the early development of a financial system, there are usually few such
23 Gross saving can be approximated by the sum of retained profit plus the depreciation charge from the income statement. Gross capital formation can be approximated by the increment in gross fixed assets.
410 FINANCIAL FLOWS AND BALANCES
institutions. The procedure is as outlined above for government enterprises.
The expansions of the condensed matrix are illustrated by Table 2 (above). The sectors in the matrix at this stage are similar to the full FOF scheme, except that private corporate enterprises are not yet separated out of the other domestic sector.24 For many developing countries, this will be as far as the FOF implementation can be taken, given a modest commitment of resources. An assembly of basic financial data for private corporations is not likely to exist, and such a compilation may be beyond the capability of a small statistical shop. Thus, the final stage in this case will await the compilation from tax files, official financial reports, or company reports of aggregate balance sheets and income statements for a significant sample of private companies. Still, these data are important for many uses, and the task of compilation will not be an enormous one.25
Throughout this description of breaking down the other domestic sector, little attention has been paid to the expansion of detail for transaction types. But the coverage of financial transactions has been slowly expanding. Each new directly estimated subsector picks up new claims in its liabilities or its portfolio that were not previously in the matrix because, in effect, they were washed out when the subsector was a consolidated part of the other domestic sector. That sector is de facto a consolidated one because of its residual derivation. Thus, perhaps the greatest increase in the system's coverage of private claims will occur when private corporations can be finally separated from households.
A final commentary relating SNA 1993 to the implementation process as it has been described here should be made. As the developing countries set out to disaggregate the national capital finance account into sector capital finance accounts, their data sources do not permit them first to estimate such an account for general government as a whole and then break it down further into central, provincial, and local government, or to estimate such an account for all financial
24 The other domestic sector also· still includes local government and the government enterprises and nonbank financial institutions lying outside their respective samples.
25 Far off on the horizon, the question might arise whether to split a noncorporate business sector away from a remaining household sector, as is done in some full FOF systems. Even if data are available, such a split would be highly arbitrary in the institutional context of most countries. It would seem wise for SNA 1993 to leave noncorporate business sectored within households, except for the quasi-corporate portion.
FLOW-OF-FUNDS ACCOUNTS 411
institutions and then break this down for the central bank, commercial banks, and other financial institutions. As we have seen, the process is rather the reverse. Accounts are first estimated for the key subsectors-those of policy importance-and these are later added to in order to assemble government or financial institutions or nonfinancial enterprises as a whole. This suggests that perhaps SNA 1993 should present a sequence of standard systems-a developmental sequence that would guide countries toward the implementation of a full SNA system.
I'V. Conclusions
The conclusions of this paper may be summarized as follows. First, a survey of the applications of FOF accounts concluded that analysis based on these data could be of considerable use to many nations. These accounts are an especially effective data organization for the key public policy problems in the financial area. Moreover, the techniques can vary according to need: from crude flow tracing, to the use of the saving-investment process scheme, to highly sophisticated programming models. If the case for the usefulness of FOF accounts is correct, one may infer that these accounts should have a central place in the standard SNA.
Several more specific conclusions emerge from an examination of the representation of finance in the 1953 SNA and the 1968 SNA and in the forthcoming revision SNA 1993, as follows.
• For the proper articulation of national accounts as a system, the rest of the world needs to be treated clearly as an institutional sector.
• The path taken in the 1968 SNA of deconsolidating the national capital finance account and separately sectoring financial institutions was correct. In effect, the comprehensive set of sector capital finance accounts becomes the FOF system of accounts.
• However, the 13-claim financial transaction classification in the 1968 SNA is not well designed for analysis. It should contain at least key elements of the "three-dimensional classification" identifying creditor and debtor sectors, as is completely done in Table 24 of the 1968 SNA. At the same time, the standard classification needs to be much simpler, at least for developing countries.
• From the viewpoint of many developing countries, the standard accounts should emphasize three main capital finance accountsthose for the rest of the world, for general government, and for the monetary and banking system. This may imply, at least initially, a catch-all "other domestic sector" account.
412 FINANCIAL FLOWS AND BALANCES
Because the Fund's statistical systems (BOPS, GFS, and MBS) will provide basic financial data for the estimation of the key capital finance accounts, for SNA purposes these systems need to be harmonized. The issue is a difficult one because of the independent life of these systems within the Fund. The compromise position is to provide for reconciliation among the systems. If harmonization fails, reconciliation should be made an urgent priority. For harmonization, the effort should concentrate first on sector articulation and second on a uniform definition of the sector deficit or surplus.
The relations among flows, balances, and valuation changes must also be considered. In the estimation of flows from balances in order to derive capital finance accounts, the difficulties posed by valuation changes involve only the estimates for (1) corporate equity securities, (2) long-term bonds, and (3) foreign assets (including gold). In practical terms, especially for developing countries, these difficulties do not appear to be great.
A simple but analytically effective form of the FOF system can now be implemented quickly and easily, even by most developing countries. To demonstrate this statistical feasibility, the paper described a process by which these accounts can be derived. Showing the movement of estimates from the simplest loose matrix toward a tighter and more detailed formulation also shows the developmental or evolutionary path of implementation.
Several elements of the analysis have suggested that the design of SNA 1993 should take such an evolutionary view of the development of national accounts. Much of the 1968 SNA has not been implemented, and there are indications that the 1968 SNA is too complex to be a feasible next step in statistical development for many countries. Moreover, the actual process of FOF estimation necessarily has an evolutionary character. The new SNA might wish, therefore, to present both simpler and more complex standard systems, in a sequence that would provide developing countries with a useful immediate system and, at the same time, with guidance in achieving the full SNA system.
22
The Financial Sector
EDWARD W. SAUNDERS
F INANCIAL INNOVATION in recent years has been characterized not only by the introduction of new financial instruments and
changes in the nature of existing instruments, but also by the continuing blurring in the nature of financial intermediation services offered by various types of financial institutions. The traditional banking institutions are conducting business differently and other institutions are increasingly undertaking traditional banking functions. These developments call into question the meaningfulness of the existing focus on the narrow measure of money embodied in the "Monetary Survey" of the IMF's draft Guide to Money and Banking Statistics (MBS Guide) and also, implicitly, in the United Nations' A System of National Accounts (SNA). This paper deals with the delineation of the financial institutions sector (hereafter referred to as the financial sector) in relation to other sectors, and with that of subsectors within the financial sector. 1 It reviews the question of the narrow measure of money and concludes that, from the perspective of financial analysis, the financial sector should be subsectored in such a way as to focus on a level of consolidation that is broader than that of the present SNA and the draft MBS Guide.
The following section deals with the definition of financial institutions in the SNA, the draft MBS Guide, and the European System of Integrated Economic Accounts (ESA).2 Section II deals with the subsec
1 This paper draws extensively from a paper by Nancy D. Ruggles, "Financial Accounts and Balance Sheets: Issues for the Revision of the SNA" (unpublished; New Haven, Connecticut: Yale University, January 23, 1984). Questions relating to the delineation of other sectors will be covered in this paper only insofar as they affect the financial sector.
2 EUROSTAT, European System of Integrated Economic Accounts-ESA, 2d ed. (Luxembourg, 1979).
413
414 FINANCIAL FLOWS AND BALANCES
torings of the financial sector in the SNA and in the Fund's money and banking statistics (MBS) published in International Financial Statistics {IFS).3 Section III reviews the boundary issues involved in delineating between the financial sector and other sectors and between subsectors of the financial sector.
I. The Definition of Financial Institutions
Financial institutions are defined in both the SNA and the draft MBS Guide as "incorporated and unincorporated enterprises which are primarily engaged in financial transactions in the market consisting of both incurring liabilities and acquiring financial assets.'' 4 There is therefore the need to distinguish financial activities recorded in the financial sector from related services provided by institutions that do not, or do not on a major scale, incur liabilities and acquire financial assets. Some of these services may have a close relation to the activities of deposit money banks, whereas others relate more closely to those of other financial institutions or to those of both of these subsectors of the financial sector. These services include those provided by securities brokers, dealers, flotation companies, commodity brokers, and loan brokers that are included in the financial sector only if they incur liabilities and acquire financial assets on their own account. If their activities do not meet this criterion, they would be attributed to the nonfinancial sectors.
Other intermediary services that would be classified to nonfinancial sectors are those provided by agencies whose principal function is to guarantee by endorsement bills or similar instruments intended for discounting or refinancing by financial institutions. Also excluded from the financial sector are those services provided by security and commodity exchanges for the purpose of trading in shares, bonds, other securities, commodities, or gold; exchange clearinghouse services in connection with securities and commodities; foreigncurrency exchange services at the retail level; check-cashing services; the issuance of travelers' checks and money orders; the rental of safe
3 The term MBS is used to reflect the current thinking of the Fund's Bureau of Statistics on the development of a methodology for money and banking statistics.
4 The analogous sector in the ESA, II credit institutions, II consists of II all institutional units which are principally engaged in finance, i.e., which collect, transform, and distribute available funds. The main resources of these units consist of funds derived from liabilities incurred (sight and time deposits, cash certificates, bonds, etc.) and of interest received."
THE FINANCIAL SECTOR 415
deposit boxes and vault space; and similar services. Also classified as nonfinancial sector activities are services closely related to the purchase and sale of securities and commodities-for example, investment research, counseling and advisory services, and stock quotation services; and services provided by committees or other formal groups organized for the protection of securities holders and royalty owners. Services of this nature are frequently provided by financial institutions themselves as integral parts of their financial activities. However, it is not proposed that attempts be made to adjust balances of financial institutions to exclude the recording of such services; that is, the removal of ancillary services from the accounts of financial institutions and their recording in the accounts of nonfinancial sectors is not required.
In recent years, some (mainly industrial) countries have seen a considerable growth in the issuance by nonfinancial entities of money market instruments that are close substitutes for the equivalent bank liabilities. The question arises whether such activities should be included in the financial sector. In this regard, it should be noted that the ESA classifies holding companies directing a group of companies, the majority of which are classified as credit institutions, to the financial sector. It would also classify as financial institutions those statistical units that are internal financing arms of nonfinancial enterprises (such as the General Motors Acceptance Corporation in the United States) as long as they maintain a full set of accounts and have autonomy in decision making. Although the SNA is not explicit with regard to the sectorization of holding companies and internal financing arms, its definition of an institutional unit-as "the unit of narrowest scope which receives and disburses income and buys and sells property, and which always has complete profit-and-loss and balance sheet accounts" -would suggest that its treatment is consistent with the ESA. The draft MBS Guide does not specifically mention how such units should be treated.
II. Subsectoring of Financial Institutions
The subsectors of the financial sector set out in the SNA and the draft MBS Guide were formulated at a time when the focus of monetary analysis was often on a narrow measure of money comprising currency and transferable deposits. It is generally recognized, however, that innovations in the field of finance, such as credit cards and the electronic transfer of funds, raise questions about the measurement of an economy's means of payment, and that some innovations
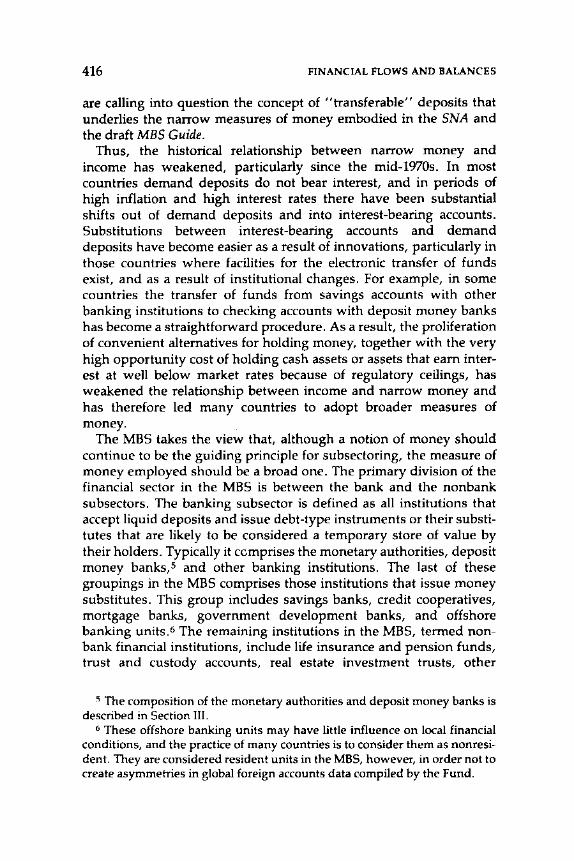
416 FINANCIAL FLOWS AND BALANCES
are calling into question the concept of "transferable" deposits that underlies the narrow measures of money embodied in the SNA and the draft MBS Guide.
Thus, the historical relationship between narrow money and income has weakened, particularly since the mid-1970s. In most countries demand deposits do not bear interest, and in periods of high inflation and high interest rates there have been substantial shifts out of demand deposits and into interest-bearing accounts. Substitutions between interest-bearing accounts and demand deposits have become easier as a result of innovations, particularly in those countries where facilities for the electronic transfer of funds exist, and as a result of institutional changes. For example, in some countries the transfer of funds from savings accounts with other banking institutions to checking accounts with deposit money banks has become a straightforward procedure. As a result, the proliferation of convenient alternatives for holding money, together with the very high opportunity cost of holding cash assets or assets that earn interest at well below market rates because of regulatory ceilings, has weakened the relationship between income and narrow money and has therefore led many countries to adopt broader measures of money.
The MBS takes the view that, although a notion of money should continue to be the guiding principle for subsectoring, the measure of money employed should be a broad one. The primary division of the financial sector in the MBS is between the bank and the nonbank subsectors. The banking subsector is defined as all institutions that accept liquid deposits and issue debt-type instruments or their substitutes that are likely to be considered a temporary store of value by their holders. Typically it comprises the monetary authorities, deposit money banks,s and other banking institutions. The last of these groupings in the MBS comprises those institutions that issue money substitutes. This group includes savings banks, credit cooperatives, mortgage banks, government development banks, and offshore banking units.6 The remaining institutions in the MBS, termed nonbank financial institutions, include life insurance and pension funds, trust and custody accounts, real estate investment trusts, other
5 The composition of the monetary authorities and deposit money banks is described in Section III.
6 These offshore banking units may have little influence on local financial conditions, and the practice of many countries is to consider them as nonresident. They are considered resident units in the MBS, however, in order not to create asymmetries in global foreign accounts data compiled by the Fund.
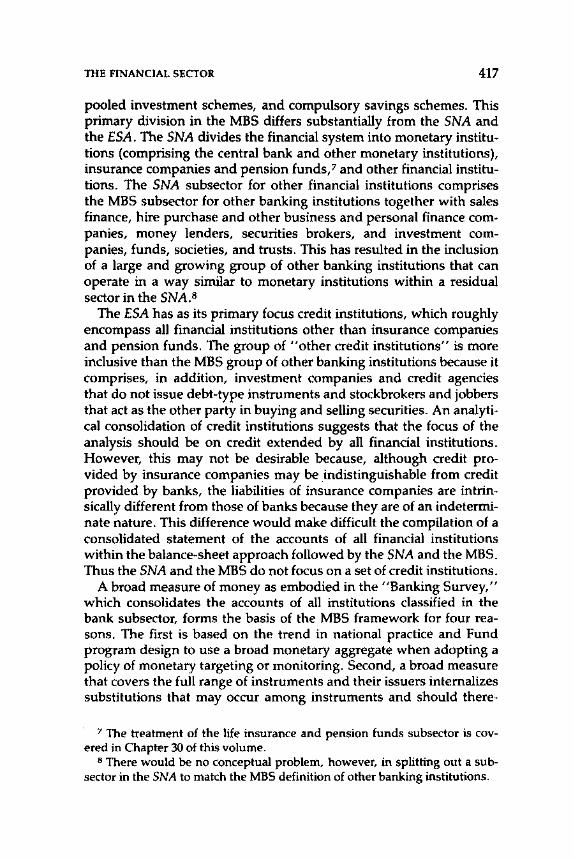
THE FINANCIAL SECTOR 417
pooled investment schemes, and compulsory savings schemes. This primary division in the MBS differs substantially from the SNA and the ESA. The SNA divides the financial system into monetary institutions (comprising the central bank and other monetary institutions), insurance companies and pension funds/ and other financial institutions. The SNA subsector for other financial institutions comprises the MBS subsector for other banking institutions together with sales finance, hire purchase and other business and personal finance companies, money lenders, securities brokers, and investment companies, funds, societies, and trusts. This has resulted in the inclusion of a large and growing group of other banking institutions that can operate in a way similar to monetary institutions within a residual sector in the SNA.B
The ESA has as its primary focus credit institutions, which roughly encompass all financial institutions other than insurance companies and pension funds. The group of "other credit institutions" is more inclusive than the MBS group of other banking institutions because it comprises, in addition, investment companies and credit agencies that do not issue debt-type instruments and stockbrokers and jobbers that act as the other party in buying and selling securities. An analytical consolidation of credit institutions suggests that the focus of the analysis should be on credit extended by all financial institutions. However, this may not be desirable because, although credit provided by insurance companies may be indistinguishable from credit provided by banks, the liabilities of insurance companies are intrinsically different from those of banks because they are of an indeterminate nature. This difference would make difficult the compilation of a consolidated statement of the accounts of all financial institutions within the balance-sheet approach followed by the SNA and the MBS. Thus the SNA and the MBS do not focus on a set of credit institutions.
A broad measure of money as embodied in the "Banking Survey," which consolidates the accounts of all institutions classified in the bank subsector, forms the basis of the MBS framework for four reasons. The first is based on the trend in national practice and Fund program design to use a broad monetary aggregate when adopting a policy of monetary targeting or monitoring. Second, a broad measure that covers the full range of instruments and their issuers internalizes substitutions that may occur among instruments and should there-
7 The treatment of the life insurance and pension funds subsector is covered in Chapter 30 of this volume.
8 There would be no conceptual problem, however, in splitting out a subsector in the SNA to match the MBS definition of other banking institutions.
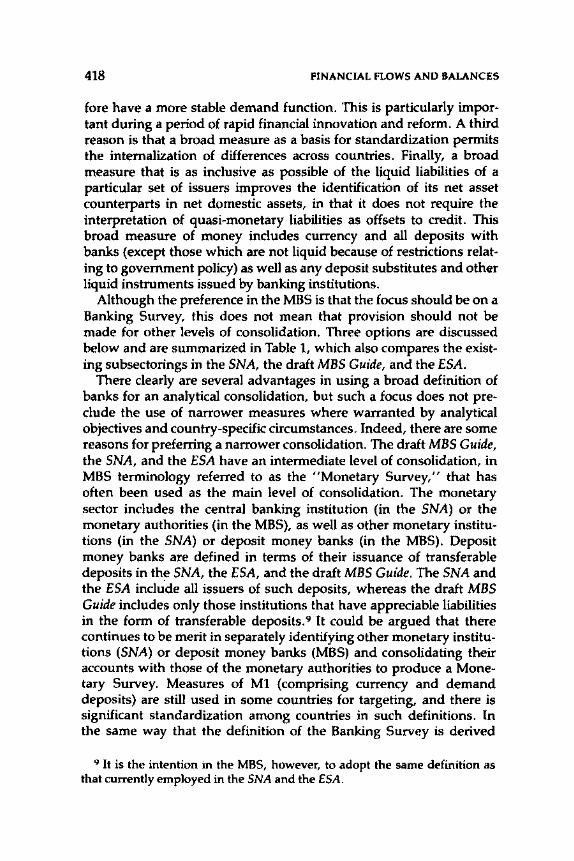
418 FINANCIAL FLOWS AND BALANCES
fore have a more stable demand function. This is particularly important during a period of rapid financial innovation and reform. A third reason is that a broad measure as a basis for standardization permits the internalization of differences across countries. Finally, a broad measure that is as inclusive as possible of the liquid liabilities of a particular set of issuers improves the identification of its net asset counterparts in net domestic assets, in that it does not require the interpretation of quasi-monetary liabilities as offsets to credit. This broad measure of money includes currency and all deposits with banks (except those which are not liquid because of restrictions relating to government policy) as well as any deposit substitutes and other liquid instruments issued by banking institutions.
Although the preference in the MBS is that the focus should be on a Banking Survey, this does not mean that provision should not be made for other levels of consolidation. Three options are discussed below and are summarized in Table 1, which also compares the existing subsectorings in the SNA, the draft MBS Guide, and the ESA.
There clearly are several advantages in using a broad definition of banks for an analytical consolidation, but such a focus does not preclude the use of narrower measures where warranted by analytical objectives and country-specific circumstances. Indeed, there are some reasons for preferring a narrower consolidation. The draft MBS Guide, the SNA, and the ESA have an intermediate level of consolidation, in MBS terminology referred to as the "Monetary Survey," that has often been used as the main level of consolidation. The monetary sector includes the central banking institution (in the SNA) or the monetary authorities (in the MBS), as well as other monetary institutions (in the SNA) or deposit money banks (in the MBS). Deposit money banks are defined in terms of their issuance of transferable deposits in the SNA, the ESA, and the draft MBS Guide. The SNA and the ESA include all issuers of such deposits, whereas the draft MBS Guide includes only those institutions that have appreciable liabilities in the form of transferable deposits.9 It could be argued that there continues to be merit in separately identifying other monetary institutions (SNA) or deposit money banks (MBS) and consolidating their accounts with those of the monetary authorities to produce a Monetary Survey. Measures of M1 (comprising currency and demand deposits) are still used in some countries for targeting, and there is significant standardization among countries in such definitions. In the same way that the definition of the Banking Survey is derived
9 It is the intention in the MBS, however, to adopt the same definition as that currently employed in the SNA and the ESA.
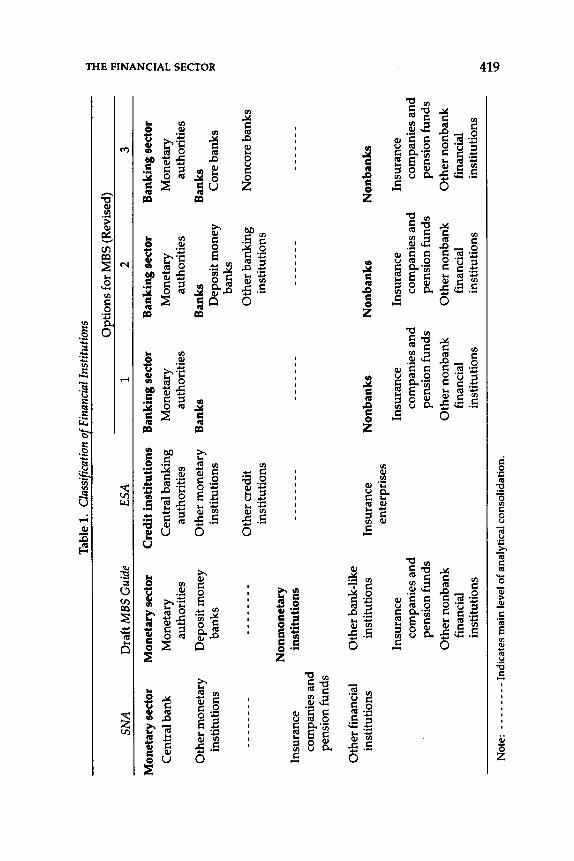
Tab
le 1
. C
lass
ifica
tion
of F
inan
cial
Ins
titut
ions
:I!
0E
tio
ns
for
MB
S (R
evis
ed)
rt! ""
SNA
D
raft
MB
S G
uide
E
SA
1 2
3 z >
M
onet
ary
sect
or
Mon
etar
y se
ctor
C
redi
t in
stit
uti
ons
Ban
kin
g se
ctor
B
ank
ing
sect
or
Ban
kin
g se
ctor
z (1
Cen
tral
ban
k M
onet
ary
Cen
tral
ban
king
M
onet
ary
Mon
etar
y M
onet
ary
>
!""
auth
orit
ies
auth
orit
ies
auth
orit
ies
auth
orit
ies
auth
orit
ies
rJ)
rt!
(1
Oth
er m
onet
ary
Dep
osit
mon
ey
Oth
er m
onet
ary
Ban
ks
Ban
ks
Ban
ks
-,) 0
inst
itut
ions
ba
nks
inst
itut
ions
D
epos
it m
oney
C
ore
bank
s :11
1:1
bank
s
----
----
----
----
Oth
er c
redi
t O
ther
ban
king
N
onco
re b
anks
in
stit
utio
ns
inst
itut
ions
Non
mon
etar
y In
sura
nce
inst
itu
tion
s --
----
----
----
---
----
---
----
-co
mpa
nies
and
pe
nsio
n fu
nds
Oth
er fi
nanc
ial
Oth
er b
ank-
like
in
stit
utio
ns
inst
itut
ions
In
sura
nce
Non
ban
ks
Non
ban
ks
Non
ban
ks
ente
rpri
ses
Insu
ranc
e In
sura
nce
Insu
ranc
e In
sura
nce
com
pani
es a
nd
co
mpa
nies
and
co
mpa
nies
an
d
com
pani
es a
nd
pe
nsio
n fu
nds
pens
ion
fund
s pe
nsio
n fu
nds
pens
ion
fund
s
Oth
er n
onba
nk
Oth
er n
onba
nk
Oth
er n
onba
nk
Oth
er n
onba
nk
fina
ncia
l fi
nanc
ial
fina
ncia
l fi
nanc
ial
inst
itut
ions
in
stit
utio
ns
inst
itut
ions
in
stit
utio
ns
""' ...... N
ote:
---
----
-In
dic
ate
s m
ain
leve
l of a
naly
tica
l con
soli
dati
on.
\0
420 FINANCIAL FLOWS AND BALANCES
from the financial institutions that issue broad money, the definition of the Monetary Survey would continue this pattern and be derived from the issuance of narrower money. In this case the division of financial institutions would be completely determined by the type of monetary liabilities they issue.
Alternatively, it could be argued that the view that deposit money banks are different from other banks in that they can ''create deposit money" is no longer valid and that analytical consolidations should therefore always be as inclusive as possible of all banks. In practice, deviations from this criterion of inclusiveness can occur, but for essentially pragmatic reasons (for example, the unavailability of current and detailed data from some banks). The normative conclusion would seem to be that the authorities should be encouraged to overcome these problems (particularly where the omission is or will become significant) and aim for a Banking Survey that would be as complete as possible. A secondary issue with this approach is the loss of data for a previously separately identified group-other monetary institutions or deposit money banks.
The third option given in Table 1 reflects the view that the choice of a monetary target depends not only on the stability of its money demand function but also on the controllability of the aggregate. This rests on the assumption of a stable relationship between this narrower aggregate under control and broader aggregates and the ultimate targets.1o The subset of" core" banks on which national authorities may focus their monetary policy may be the result of the concentration of banking activity (for example, in many developing countries the commercial banks dominate the financial system, and other banking institutions are not significant) or of the limitations of existing banking legislation. In practice, the banking institutions over which the monetary authorities have some special control tend to be the issuers of demand (transferable) deposits, or "deposit money." The reasons for this include the perceived need of the authorities to have special control over the issuers of the means of payment in order to ensure the stability of the payments system and to limit the size of the money multiplier. The danger of focusing on some core group of banks is the fact that the resulting set of institutions would be based on subjective and ad hoc decisions for individual countries and might
10 The problems of applying this approach during a period of financial change, and the fact that quantitative controls over a subset of banks may lead to distortions and innovation that ultimately render those controls ineffective, are beyond the scope of this paper.
THE FINANCIAL SECTOR 421
therefore not be amenable to incorporation in a standard international classification scheme.
III. Boundary Issues
The MBS sectoring of financial transactors closely parallels sectoring in the SNA, but there are some important differences. Although the MBS does not normally extend functionally defined sectorization beyond assigning each institutional reporting unit to a specific transactor group, a few specific exceptions to this rule are made in order to differentiate clearly between the financial system and the nonfinancial public sector, and between subsectors of the financial system.
These exceptions are intended to promote the uniform treatment of certain important functions normally performed by financial institutions but sometimes also undertaken by the treasury or by other units of the central government, such as the issue of currency, the holding of official reserves, and transactions with the IMF. 11 Notional financial units are created, principally within the category of central government, and certain financial claims and liabilities are attributed to these notional units, with any net uncovered balance of claims (or liabilities) regarded as an imputed liability to (or claim on) the functionally defined central government. These notional financial units are consolidated with their nearest SNA subgroups of financial transactors, but different terms are used to identify the resulting subsectors of the financial system in order to emphasize the differences in definition. As noted previously, the MBS financial system thus comprises monetary authorities (rather than the central bank, as in the SNA), deposit money banks (rather than other monetary institutions), other banking institutions (which comprise a part of other financial institutions), and nonbank financial institutions (which are equivalent to the SNA subsector of life insurance and pension funds plus part of other financial institutions). The various "reroutings" made in the MBS for the subsectors of monetary authorities and the deposit money banks are described below.
The Monetary Authorities
The monetary authorities perform a variety of functions. As issuers of currency, they provide the economy with notes and coins that
11 Such reroutings are made in IFS for 48, 43, and 52 countries, respectively.
422 FINANCIAL FLOWS AND BALANCES
constitute the recognized means of payment. As holders of the economy's international reserves, they stand ready either to accept and provide foreign currencies in exchange for their own as needed for balance of payments purposes or to make adjustments to the exchange rate for the national currency. As supervisors of the financial system, they must aim to determine the appropriate level of liquidity for the domestic economy, as well as for banks, and to influence the development of financial institutions' assets and liabilities accordingly. As the principal financial agents of the central government, they are called upon to validate the government's transactions by both providing credit to, and absorbing the surplus funds of, the government.
In many countries the central bank or a similar body, such as a currency board or a monetary agency, has sole responsibility for all such functions. In other cases some of these functions are partially or entirely carried out by the central government, or by financial institutions other than a centralized one. The MBS considers that, in order not to obscure the distinction between monetary and fiscal analysis, it is necessary for the monetary authorities' accounts to encompass all financial assets and liabilities ascribed to the performance of monetary authority functions. This approach differs from that of the SNA and the ESA, where monetary authority functions carried out by bodies other than the central bank in most instances are left in the accounts of the institutional sectors where those bodies are placedusually the government sector. However, in view of the difficulty of designing objective criteria for identifying the government accounts that are linked to monetary authority functions, the MBS undertakes to adjust only those accounts that are quite clearly linked to the two main monetary authority functions-that is, the issue of currency and the management of international reserves, including those resulting from transactions with the Fund.
Historically, governments have exercised a monopoly with regard to the issuance of currency, which originally was in the form of coins. Bank notes have long since replaced coins as the major form of currency, however, and most governments have transferred responsibility for the issue of bank notes to the central bank. Some, but by no means all, governments have also transferred the right to issue coins to the central bank. Where governments have retained control over the currency issue (either coins or bank notes), the accounts associated with this function are consolidated with the monetary authorities' accounts in the MBS, but not in the SNA or the ESA.
With respect to the second function, the MBS consolidates in the monetary authorities' accounts foreign claims held by the central gov-
THE FINANCIAL SECTOR 423
ernment to the extent that they are assets generally recognized as a means of international settlement (for example, gold, deposits with nonresident financial institutions, marketable securities issued by foreign central governments, and other instruments negotiable in external money markets). The MBS does not, however, consolidate the foreign claims held by banks or by nonfinancial public enterprises, even though these may be under the effective control of the central authorities.
Also consolidated are exchange stabilization funds. National sources sometimes exclude exchange stabilization funds from the central banks' accounts when the central bank does not legally own the country's international reserves but rather administers them on the government's behalf through a separate accounting unit such as a foreign exchange or currency stabilization fund. Under such an arrangement, the central bank's balance sheet is likely either to report a claim on the exchange stabilization fund or to subsume such a claim in broader categories of claims on the government. Without an adjustment for such differences in institutional arrangements, developments in central bank holdings of government debt could take on quite different meanings for countries with and without exchange stabilization funds. In the latter case, changes in the central bank's position in relation to the government would reflect the government's recourse to the central bank only for the implementation of what is conventionally regarded as deficit financing and sterilization of surplus funds. In the former case, it would also reflect the government's call upon the central bank to influence the external value of the local currency through intervention in foreign currency markets. So that the analysis will not be obscured by the institutional arrangements in effect in a given country, the MBS consolidates separate funds of this type with the formal balance sheet of the central bank. The reserve assets booked to these separate funds are treated as holdings of the central bank, and an offsetting contra-entry is made to the central bank's position with the government, usually by deducting such funds from the central bank's holdings of government debt.
The final rerouting made in the MBS to derive the accounts of the monetary authorities concerns accounts with the IMF. A country's accounts with the Fund comprise· those arising from its transactions with the Fund's General Department, those with its SDR Department, and its Trust Fund loans outstanding. In cases where one or more of these accounts are held by the central government (treasury) rather than the central bank, the necessary reroutings are made in the following manner.
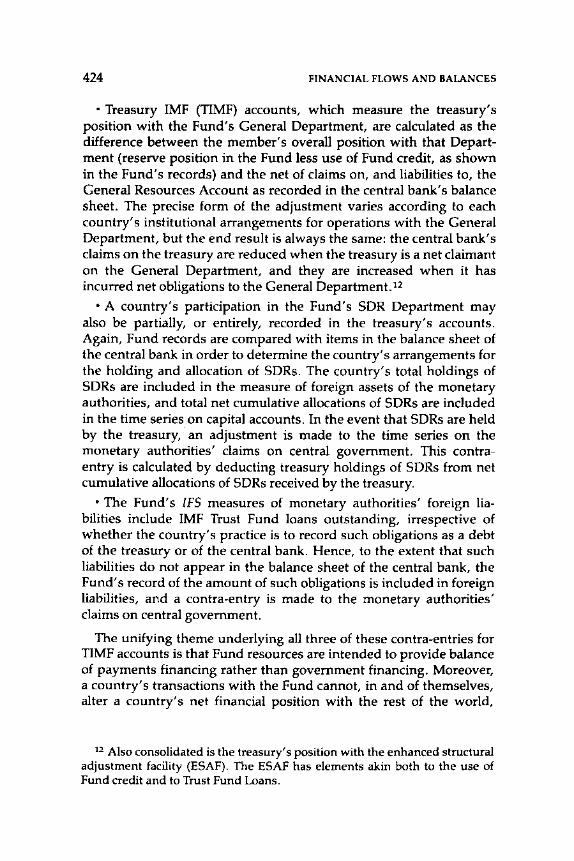
424 FINANCIAL FLOWS AND BALANCES
• Treasury IMF (TIMF) accounts, which measure the treasury's position with the Fund's General Department, are calculated as the difference between the member's overall position with that Department (reserve position in the Fund less use of Fund credit, as shown in the Fund's records) and the net of claims on, and liabilities to, the General Resources Account as recorded in the central bank's balance sheet. The precise form of the adjustment varies according to each country's institutional arrangements for operations with the General Department, but the end result is always the same: the central bank's claims on the treasury are reduced when the treasury is a net claimant on the General Department, and they are increased when it has incurred net obligations to the General Department.12
• A country's participation in the Fund's SDR Department may also be partially, or entirely, recorded in the treasury's accounts. Again, Fund records are compared with items in the balance sheet of the central bank in order to determine the country's arrangements for the holding and allocation of SDRs. The country's total holdings of SDRs are included in the measure of foreign assets of the monetary authorities, and total net cumulative allocations of SDRs are included in the time series on capital accounts. In the event that SDRs are held by the treasury, · an adjustment is made to the time series on the monetary authorities' claims on central government. This contraentry is calculated by deducting treasury holdings of SDRs from net cumulative allocations of SDRs received by the treasury.
• The Fund's IFS measures of monetary authorities' foreign liabilities include IMF Trust Fund loans outstanding, irrespective of whether the country's practice is to record such obligations as a debt of the treasury or of the central bank. Hence, to the extent that such liabilities do not appear in the balance sheet of the central bank, the Fund's record of the amount of such obligations is included in foreign liabilities, and a contra-entry is made to the monetary authorities' claims on central government.
The unifying theme underlying all three of these contra-entries for TIMF accounts is that Fund resources are intended to provide balance of payments financing rather than government financing. Moreover, a country's transactions with the Fund cannot, in and of themselves, alter a country's net financial position with the rest of the world,
12 Also consolidated is the treasury's position with the enhanced structural adjustment facility (ESAF). The ESAF has elements akin both to the use of Fund credit and to Trust Fund Loans.
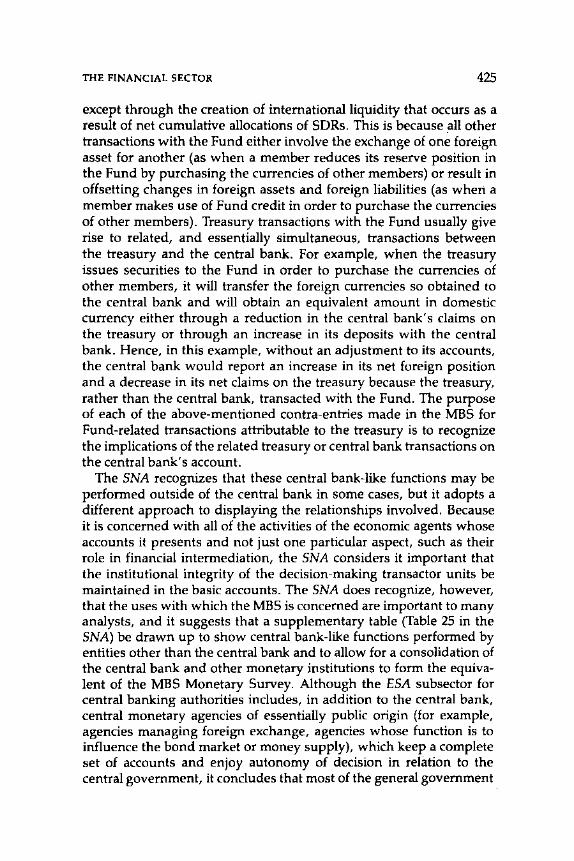
THE FINANCIAL SECTOR 425
except through the creation of international liquidity that occurs as a result of net cumulative allocations of SDRs. This is because all other transactions with the Fund either involve the exchange of one foreign asset for another (as when a member reduces its reserve position in the Fund by purchasing the currencies of other members) or result in offsetting changes in foreign assets and foreign liabilities (as whert a member makes use of Fund credit in order to purchase the currencies of other members). Treasury transactions with the Fund usually give rise to related, and essentially simultaneous, transactions between the treasury and the central bank. For example, when the treasury issues securities to the Fund in order to purchase the currencies of other members, it will transfer the foreign currencies so obtained to the central bank and will obtain an equivalent amount in domestic currency either through a reduction in the central bank's claims on the treasury or through an increase in its deposits with the central bank. Hence, in this example, without an adjustment to its accounts, the central bank would report an increase in its net foreign position and a decrease in its net claims on the treasury because the treasury, rather than the central bank, transacted with the Fund. The purpose of each of the above-mentioned contra-entries made in the MBS for Fund-related transactions attributable to the treasury is to recognize the implications of the related treasury or central bank transactions on the central bank's account.
The SNA recognizes that these central bank-like functions may be performed outside of the central bank in some cases, but it adopts a different approach to displaying the relationships involved. Because it is concerned with all of the activities of the economic agents whose accounts it presents and not just one particular aspect, such as their role in financial intermediation, the SNA considers it important that the institutional integrity of the decision-making transactor units be maintained in the basic accounts. The SNA does recognize, however, that the uses with which the MBS is concerned are important to many analysts, and it suggests that a supplementary table (Table 25 in the SNA) be drawn up to show central bank-like functions performed by entities other than the central bank and to allow for a consolidation of the central bank and other monetary institutions to form the equivalent of the MBS Monetary Survey. Although the ESA subsector for central banking authorities includes, in addition to the central bank, central monetary agencies of essentially public origin (for example, agencies managing foreign exchange, agencies whose function is to influence the bond market or money supply), which keep a complete set of accounts and enjoy autonomy of decision in relation to the central government, it concludes that most of the general government
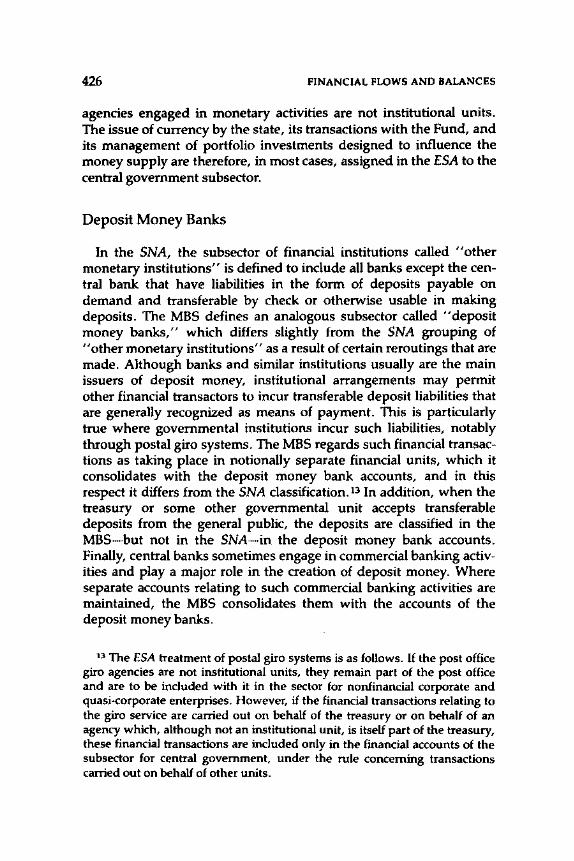
426 FINANCIAL FLOWS AND BALANCES
agencies engaged in monetary activities are not institutional units. The issue of currency by the state, its transactions with the Fund, and its management of portfolio investments designed to influence the money supply are therefore, in most cases, assigned in the ESA to the central government subsector.
Deposit Money Banks
In the SNA, the subsector of financial institutions called "other monetary institutions" is defined to include all banks except the central bank that have liabilities in the form of deposits payable on demand and transferable by check or otherwise usable in making deposits. The MBS defines an analogous subsector called "deposit money banks," which differs slightly from the SNA grouping of "other monetary institutions" as a result of certain reroutings that are made. Although banks and similar institutions usually are the main issuers of deposit money, institutional arrangements may permit other financial transactors to incur transferable deposit liabilities that are generally recognized as means of payment. This is particularly true where governmental institutions incur such liabilities, notably through postal giro systems. The MBS regards such financial transactions as taking place in notionally separate financial units, which it consolidates with the deposit money bank accounts, and in this respect it differs from the SNA classification. n In addition, when the treasury or some other governmental unit accepts transferable deposits from the general public, the deposits are classified in the MBS-but not in the SNA-in the deposit money bank accounts. Finally, central banks sometimes engage in commercial banking activities and play a major role in the creation of deposit money. Where separate accounts relating to such commercial banking activities are maintained, the MBS consolidates them with the accounts of the deposit money banks.
13 The ESA treatment of postal giro systems is as follows. If the post office giro agencies are not institutional units, they remain part of the post office and are to be included with it in the sector for nonfinancial corporate and quasi-corporate enterprises. However, if the financial transactions relating to the giro service are carried out on behalf of the treasury or on behalf of an agency which, although not an institutional unit, is itself part of the treasury, these financial transactions are included only in the financial accounts of the subsector for central government, under the rule concerning transactions carried out on behalf of other units.
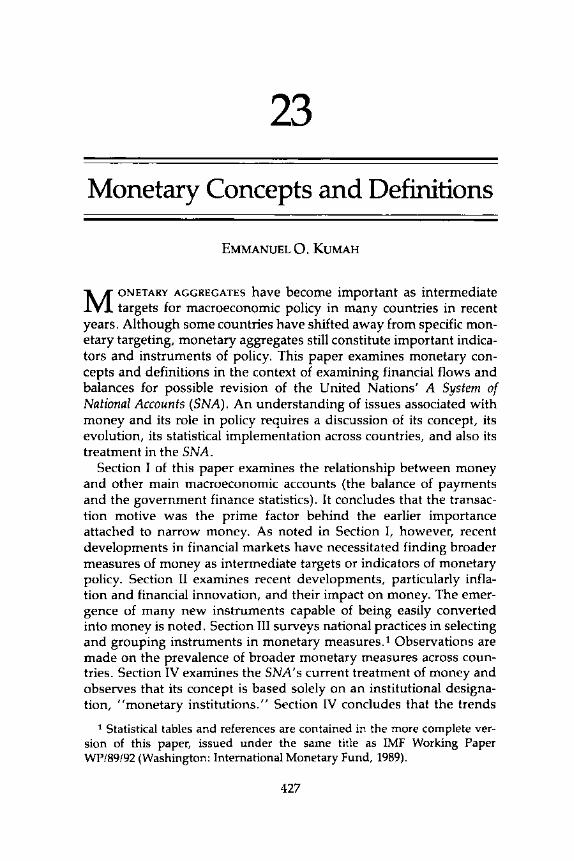
23
Monetary Concepts and Definitions
EMMANUEL 0. KUMAH
M ONETARY AGGREGATES have become important as intermediate targets for macroeconomic policy in many countries in recent
years. Although some countries have shifted away from specific monetary targeting, monetary aggregates still constitute important indicators and instruments of policy. This paper examines monetary concepts and definitions in the context of examining financial flows and balances for possible revision of the United Nations' A System of National Accounts (SNA). An understanding of issues associated with money and its role in policy requires a discussion of its concept, its evolution, its statistical implementation across countries, and also its treatment in the SNA.
Section I of this paper examines the relationship between money and other main macroeconomic accounts (the balance of payments and the government finance statistics). It concludes that the transaction motive was the prime factor behind the earlier importance attached to narrow money. As noted in Section I, however, recent developments in financial markets have necessitated finding broader measures of money as intermediate targets or indicators of monetary policy. Section II examines recent developments, particularly inflation and financial innovation, and their impact on money. The emergence of many new instruments capable of being easily converted into money is noted. Section III surveys national practices in selecting and grouping instruments in monetary measures. 1 Observations are made on the prevalence of broader monetary measures across countries. Section IV examines the SNA's current treatment of money and observes that its concept is based solely on an institutional designation, "monetary institutions." Section IV concludes that the trends
1 Statistical tables and references are contained in the more complete version of this paper, issued under the same title as IMF Working Paper WP/89/92 (Washington: International Monetary Fund, 1989).
427
428 FINANCIAL FLOWS AND BALANCES
toward broader concepts imply the need for some rethinking in the SNA about issues pertaining to issuers, holders, and instruments of money.
I. The Concept of Money and Macroeconomic Policy
There are two main strands of monetary thought. One is based on the use of analytical models (money market models) to postulate relationships between the quantity of money and nominal income or gross national product (GNP) as evidenced by standard closedeconomy models. This approach tends to emphasize the importance of controlling money supply in the interest of maintaining price stability. It has inspired the targeting of the growth rate of the money stock, which became the centerpiece of economic strategies in many countries in the 1970s.z The other is based on the extension of the monetary approach to the analysis of balance of payments problems, and this strand has been referred to as the "monetary approach to the balance of payments."
The monetary approach to the balance of payments underlies the IMF' s financial programming framework, and it has been applied in the Fund's operational work in many countries.3 Money is an important element in financial programming, often serving as one of the policy instruments selected and quantified for monitoring a program. The role of money can be gauged from an examination of the conceptual links among the major macroeconomic accounts-the national income and product accounts, the balance of payments, the government finance statistics, and the monetary accounts. The links permit the derivation of a broad accounting framework for economic analysis and policy formulation. From the point of view of financial programming, the principal links are as follows: (1) the domestic savings-
2 For the past two decades, monetary thought has been influenced substantially by work in the area of the demand for money and its relationship to ultimate economic objectives, particularly by Friedman and his associates. See Milton Friedman and Anna J. Schwartz, A Monetary History of the United States (Princeton, New Jersey: Princeton University Press, 1963).
3 The financial programming framework was originally designed for a small open economy operating under a fixed exchange rate. This assumption is very important for the analysis. The complications that arise from the relaxation of this assumption are addressed in each individual Fund-supported program. See IMF, Theoretical Aspects of the Design of Fund-Supported Adjustment Programs, Occasional Paper 55 (Washington, 1987), p. 12.
MONETARY CONCEPTS AND DEFINITIONS 429
investment gap in the national accounts is equivalent to the current account balance of the balance of payments; (2) the balance of payments is linked to the monetary accounts by the identification of all foreign balances in the latter; and (3) the government or public sector accounts are linked to the monetary accounts by the specification of public sector financing by the banking system. Money is defined in terms of the liabilities issued by the banking system to the nonbanking sector, and it is linked by the balance-sheet identity to the asset base of the banking system, explained in large measure by the balance of payments and domestic credit (the latter with particular emphasis on government operations in relation to the banking system).
In a simplified model, the demand for money is the only behavioral relationship. The assumption of a stable money demand function is needed to ensure that an increase in domestic credit will cause the public initially to hold more money than it desires to hold, resulting in a decline in net foreign assets through increased expenditures, until money returns to its original level. Much of the work carried out in the Fund and elsewhere on intermediate targets of money or credit has been based on the assumption of a stable demand for some definable measure of money; this notion has had a long history. 4
Three theories can be distinguished that provide some guidelines on the characteristics of money. The theory based on the transaction motive emphasizes that money is a universal means of exchange that is readily acceptable and transferable in transactions. The concept of money derived from this perspective-designated as narrow money (Ml)-encompasses currency plus checkable demand deposits at commercial banks. The other two theories, based on the speculative and precautionary motives, offer no clear-cut guidelines on the type of instruments that should be included in the concept of money, although currency and demand (checking) deposits, time deposits at commercial banks, and savings and loan association shares could easily be used for these purposes.
4 Note that the choice between money and credit as a policy variable depends on factors such as the exchange rate regime and the openness of the economy. In general, for small open economies under fixed exchange rates, credit policy instruments are more effective, since the ability of the authorities to control the growth of domestic monetary aggregates over any extended time period is very limited. See IMF, Theoretical Aspects, for an elaboration of these ideas. For a discussion of early issues from Irving Fisher onward, see E.W. Laidler, The Demand for Money: Theories and Evidence, 2d ed. (New York: Harper & Row, 1977).
430 FINANCIAL FLOWS AND BALANCES
The case for narrow money in much of the analytical work has also been motivated by interest in throwing light on the scope and impact of monetary policy. Thus, the bulk of the empirical work carried out in this area, particularly in the United States and Western Europe, has confined the definition to narrow money on the assumption that M1 is more amenable to control by the monetary authorities. The importance attached to narrow money has also been helped by legal and institutional considerations. However, it is clear that in situations of high and variable inflation, when future economic policies and developments are generally uncertain, it becomes very difficult to forecast the demand for money.
The financial environment in many countries in the late 1970s and early 1980s was characterized by high and volatile interest rates and rising prices, which caused shifts in the demand for money. In addition, the rapid pace of financial innovations in many countries has contributed to the increased adaptation of instruments and institutions in financial markets as well as the emergence of new ones. These developments have contributed to the perception that monetary policy effects are now channeled more through interest rate and exchange rate adjustments than through the quantity of credit or money, leading to a search for new targets for monetary policy, including the use of broader monetary aggregates and nonmonetary targets such as credit targets, interest rates, and exchange rates.
Broader monetary aggregates encompass a wider set of financial instruments than M1 that are issued by a more broadly defined set of financial institutions. The underlying principle behind broader aggregates is that of the so-called equal treatment criteria, under which financial instruments that can be substitutes for each other are combined at the same level of aggregation. It is possible to use this principle to compile monetary aggregates encompassing various subsets of liabilities of banking and nonbank financial institutions. Many countries have constructed broader aggregates, leading to a proliferation of money and liquidity measures (M2, M3, L, and so forth). In the Fund, the use of measures incorporating practically all of a banking system's liabilities has long been common practice in reports.
A more sophisticated version arising from this principle is the socalled index method of aggregation. This measures the degree of "moneyness" of each financial instrument and calculates weighted sums of these instruments as money, often using the interest rate forgone on these assets as weights. An example is the Oivisia quantity index constructed by Barnett of the Federal Reserve Board in the
MONETARY CONCEPTS AND DEFINITIONS 431
late 1970s.5 Because there are substantial conceptual and statistical difficulties with the compilation of these aggregates in comparison with the simple sum aggregates such as M2 and M3, they have not been extensively used for policy formulation.
Nonmonetary intermediate targets of monetary policy include credit, prices, exchange rates, and interest rates. The paths of many of these variables may be influenced by the stance of monetary policy. This fact brings up the issue of the independence of these targets compared with monetary targets. The choice between money and credit targets in a simplified model is largely an empirical issue, depending on factors such as the exchange rate regime, the openness of the economy, and the ability of the authorities to monitor and control all potential sources of credit to an economy.6
II. Recent Innovations in Financial Markets and Their Impact on the Definition and Measurement of Money
Financial markets have been characterized by rapid innovation in the last two decades. Spurred on in part by deregulation and new technologies, competition in the financial marketplace became more intense as the international financial system became more integrated, contributing to the emergence of a variety of institutions, instruments, and techniques. Financial market innovations were also occurring in response to macroeconomic disturbances. 7
In the late 1970s and early 1980s high nominal interest rates increased the penalty associated with holding cash and non-interestbearing deposits whose yields were limited by law. This concern about earnings in an inflationary environment led the public to seek instruments that enabled them to earn interest on their assets and at the same time economize on their non-interest-bearing transaction
5 Board of Governors of the Federal Reserve System, ''Improving the Monetary Aggregates," Report of the Advisory Committee on Monetary Statistics (Washington, June 1976).
6 Note that it is possible for domestic prices to be affected not only by exchange rate adjustments but also by changes in reserve money. Therefore, policy actions on both domestic monetary growth and credit may be necessary to achieve balance of payments and inflation objectives at the same time. For a discussion of these issues, see Manuel Guitian, "Credit Versus Money as an Instrument of Control,'' Staff Papers, International Monetary Fund, Vol. 20 (November 1973), pp. 785-800.
7 See Bank for International Settlements, "Financial Innovation and Monetary Policy" (Basle, March 1986), for a discussion of these issues.
432 FINANCIAL FLOWS AND BALANCES
balances. For many bank customers, hedging against inflation is widely believed to have taken place first through switching from noninterest-bearing demand deposits to interest-bearing time, savings, and fixed deposits. The origin of floating-rate bonds, interest and exchange rate swaps, and futures markets could also be traced to these developments. The movement away from lower-yielding money balances in this era was viewed as a major factor in the difficulties of forecasting the relationship between narrow money and nominal income, the primary basis for targeting narrow money.
New instruments can be subdivided into those that substitute for conventional demand deposits, such as negotiable orders of withdrawal (NOW) accounts, and automatic transfer from savings (ATS) accounts, and those that substitute for savings deposits, such as certificates of deposit, money market certificates, and fixed-term repurchase agreements (known as RPs or "repos"). Moreover, new financial products have been introduced to limit or shift interest rate or market risk through interest rate futures, hedging, and arbitrage instruments. Related to all these developments are new facilities that permit automated transfers, payments, and retrieval of information on numerous accounts through devices such as automated teller machines (ATMs), telephone transfers, cash dispensers, and bank credit cards.
Markets for traditional financial instruments have expanded (for example, those for short-term instruments); at the same time, new financial markets for unconventional bonds (for example, floatingrate bonds and zero-coupon bonds), financial futures, options, and stock index futures have also become commonplace in industrial countries. Another phenomenon is the development of secondary markets to service both old and new security issues. Finally, the historical distinctions between classes of financial institutions in terms of their liabilities and functions have been blurred as financial services offered by commercial banks, other banks, and nonbanks have in many cases become similar, thereby encouraging substitution among instruments (for example, money market mutual funds are close substitutes for bank deposits).
Various factors have contributed to the recent spate of innovations. A prominent factor, particularly in many developed countries, is the liberalization of domestic financial markets and the relaxation of capital controls.8 Before the late 1970s, financial markets were characterized by many regulations, and innovations were spurred on in part
8 Deregulation has not always been a deliberate policy; in some cases it has been a reaction to innovation.
MONETARY CONCEPTS AND DEFINITIONS 433
by the need to circumvent the effects of regulation. In the 1980s trends toward deregulation in some countries enabled commercial banks to offer interest-bearing assets that were previously issued solely by institutions other than commercial banks. In the United States, for example, legislative changes made it possible for banks to offer money market certificates in 1978, NOW accounts on a nationwide basis in 1980, and money market deposits in 1982, all of which bore market-related interest rates. In addition, the removal of restrictions on capital movements in the United States in 1974, in the United Kingdom in 1979, and in Japan, France, and Germany in the 1980s has provided some of the momentum for financial innovations.
Financial innovations have also been facilitated by the advent of new technology. These technological advances have increased the convenience and rapidity of the public's access to financial products and reduced the costs of transactions and transfers among accounts. For example, the public has taken advantage of cash management techniques such as ATMs, debit cards, electronic and satellite transfers of funds, and information retrieval systems. All these new facilities have enabled customers to economize on their transaction balances.
The combination of all these developments has resulted in considerable difficulty in distinguishing among instruments traditionally considered money (currency and demand deposits) and many other instruments, such as time and savings deposits and money market funds. Because of the ease of convertibility, many of these instruments have now acquired some "moneyness" or partial medium-ofexchange properties. As a result, it has become difficult to define and to measure money, and the old line dividing narrow money and other financial instruments has become blurred, contributing to a proliferation of money measures in some countries.
III. A Survey of National Monetary Concepts
This section discusses the main features of monetary aggregates recorded in over 150 countries (mainly members of the Fund). National monetary aggregates refer to measures used by individual countries to group or describe monetary instruments. These measures are taken from national statistical publications.9 In general,
9 The monetary aggregates used as intermediate targets of policy in any given country are usually formulated in the annual report of the central bank (or similar monetary authority), and they are not necessarily all those con-
434 FINANCIAL FLOWS AND BALANCES
monetary measures can be distinguished on three fronts: the instruments that are consolidated or grouped into money, the institutional issuers of these instruments, and the holders of these instruments. The combination of these three provides the level of consolidation, which is generally shown by the symbol M followed by a numerical suffix such as 1, 2, or 3 (for example, M1, M2, M3), with the higher number indicating a more inclusive monetary aggregate. Perhaps the main fact that emerges from this review is the proliferation of money measures, which has of course been influenced by the extensive list of instruments and institutional issuers. One also cannot fail to notice the broadening over time of national money measures. It would be misleading, however, to draw conclusions about the narrowness (or otherwise) of monetary measures on the basis of country descriptions (such as M1, M2, M3) without a careful study of the instruments, holders, and issuers.
Monetary aggregates observed in this study include a wide variety of instruments such as currency; demand deposits (both checkable and noncheckable); call deposits; time, savings, and fixed deposits; foreign-currency deposits; repurchase agreements; bills; certificates of deposit; bonds; other commercial paper; restricted deposits; and savings deposit schemes. For the majority of cases the holders of these instruments are residents of the country for which the measures are compiled, but there are more than 17 countries in which instruments held by nonresidents are included in monetary aggregates.10
No single explanation can be offered for this practice, but most of these countries have substantial emigrant populations whose remittances are of considerable importance to their home countries.
Country practices in regard to the treatment of resident-owned instruments in monetary aggregates are not uniform. First, although all countries have currency, demand, time, and savings deposits in their monetary measures, there are marked differences in the levels of consolidation because of institutional and holder differences. Second, in many but not all of the financially developed countries, money market instruments such as bills, repurchase agreements, bankers' acceptances, and certificates of deposit are included in broad money
tained in the statistical publication. In some countries, the formulation of monetary aggregates and their measurement has preceded their regular publication in statistical publications.
10 These include Algeria, Austria, Botswana, Djibouti, India, Lebanon, Lesotho, Mozambique, Pakistan, Papua New Guinea, the Philippines, Portugal, Sudan, Swaziland, Tanzania, Turkey, and the United States.
MONETARY CONCEPTS AND DEFINITIONS 435
measures. 11 Third, a relatively small number of countries include only one or a few of these instruments-bonds, other commercial paper, restricted deposits, and contractual savings-in their broader money measures.12 Finally, foreign-currency deposits are often, although not always, separately identified and included in money measures. In about half of the countries surveyed, foreign-currency deposits of the demand, time, and savings types are included in money measures. The number of these countries may be underestimated because in many of them these kinds of deposits are not separately identified in national publications.
Country practices also vary in terms of the institutional issuers of monetary instruments. The survey revealed five main issuerscentral banks, commercial banks, other banks, the government or treasury, and post office savings banks. Although currency issue has been the customary responsibility of the central bank, there are many instances in which the government or treasury has issued some coins, notes, or both. 13 The central bank's role in the issuance of monetary instruments is not limited to the issuance of currency. Other instruments issued by the central bank include time, savings, and foreigncurrency deposits as well as bonds.14
In virtually all countries, domestic-currency demand deposits are predominantly issued by commercial banks, and in close to half of the cases by other banks. However, in a large number of countries these deposits are also issued by the central bank.15
Commercial banks and other banks are the prime issuers of bank deposits other than demand deposits-mainly time, savings, fixed,
11 Countries following this practice include Argentina, Australia, Brazil, Chile, Denmark, France, Italy, Japan, the Republic of Korea, Malaysia, Mexico, the Netherlands, the Philippines, Portugal, Singapore, Spain, Thailand, the United Kingdom, the United States, Uruguay, and Venezuela.
12 These include Argentina, Bolivia, Brazil, Chile, Costa Rica, Ecuador, France, the Republic of Korea, Libya, Mauritania, the Philippines, Romania, Saudi Arabia, Somalia, Suriname, Sweden, Syria, the United States, and Venezuela.
13 This is the case, for example, in Australia, Austria, Canada, France, Germany, Greece, Haiti, the Islamic Republic of Iran, Italy, Japan, Panama, Spain, Switzerland, Tonga, the United Kingdom, and Western Samoa.
14 For example, central bank bills, bonds, or both are found in Argentina, Brazil, Chile, Italy, Kuwait, Malaysia, and the Philippines, among others.
15 This practice occurs, for example, in Austria, Cape Verde, the Dominican Republic, Ecuador, Germany, Guatemala, Guyana, Hungary, India, Lebanon, Malawi, Mauritius, Norway, Panama, Peru, Romania, Tanzania, Turkey, and Yugoslavia.
436 FINANCIAL FLOWS AND BALANCES
and foreign-currency deposits-as well as certificates of deposit and repurchase agreements. Commercial banks also issue bills, bonds, and other relatively less liquid instruments, although other institutions are equally important here. In particular, the government or treasury issues treasury bills, bonds, or both that are included in broader money aggregates in a number of countries.16 Perhaps more striking are the treasury holdings of deposit liabilities in many francophone African countries.17
The post office institutions are important issuers of monetary instruments-demand, time, savings, and foreign-currency deposits-in many countries, especially the francophone countries.18 In many of these countries, time and savings deposits are also issued by post office institutions and, in a few cases, the same applies to foreign-currency deposits (in Luxembourg, for example) and call money (in Germany, for example). Compared with other institutions, however, the importance of post offices as deposit-taking institutions in many countries appears to be on the decline.
The survey also reveals some similarities and differences among countries as regards the holders of instruments included in money aggregates. All countries include private sector holdings of monetary instruments in money aggregates. Over 90 percent of the countries include in money measures the holdings of nonfinancial public enterprises. Close to two-thirds of the countries include in money measures the holdings of both nonbank financial institutions and other general government (state, local, and other semiautonomous governmental entities). A few countries include central government deposits in money measures.19 The list of countries is likely to be much higher than this information would indicate. This is especially likely in coun-
16 For instance, Brazil, Chile, Denmark, France, Honduras, Italy, Malawi, Mexico, the Netherlands, the Philippines, the United Kingdom, and the United States.
17 For instance, Algeria, Benin, Burkina Faso, Cameroon, the Central African Republic, Chad, Comoros, the Congo, Cote d'Ivoire, Djibouti, Equatorial Guinea, Gabon, Madagascar, Mali, Morocco, Niger, Senegal, Togo-as well as in France and Seychelles.
18 Demand deposits are issued by the post office savings institutions, for example, in Belgium, Benin, Burkina Faso, Burundi, Cameroon, the Central African Republic, Chad, the Congo, Cote d'Ivoire, Denmark, Equatorial Guinea, France, Gabon, Germany, Ireland, Italy, Luxembourg, Madagascar, Mali, Mauritania, Morocco, the Netherlands, New Zealand, Niger, Norway, Senegal, and Togo.
19 Examples include Algeria, Austria, Bahrain, Fiji, Germany, Paraguay, Seychelles, Solomon Islands, and the United Arab Emirates.
MONETARY CONCEPTS AND DEFINITIONS 437
tries in which certain units of the central government hold monetary instruments with the banking system that, for various reasons, are not classified as central government deposits or are not separately identified in the money aggregates.
Various combinations of instruments, holders, and issuers of instruments have resulted in the numerous levels of consolidation recorded across countries. For many countries, frequent revisions of the consolidation level and of the selection of targets for monetary policy have been undertaken with the intention of appropriately regrouping financial instruments in new or old categories in light of changing monetary conditions. For example, a major redefinition occurred in the United States in 1980, in the United Kingdom and in Canada in the early 1980s, in Italy in 1985, and in France in 1986. Also, monetary policy targets were altered or suspended in the late 1970s and the early 1980s in a number of countries.zo Although it is difficult to find a mix of factors capable of succinctly describing the consolidation level for every country, a few generalizations can be made.
In virtually all countries the money measure M1-generally designated as narrow money-is based on the narrowest level of consolidation, usually comprising currency and demand deposits held with the banking system primarily by the private, public enterprise, and general government sectors. The measure M2-the broadest level of money for the majority of countries-generally includes instruments included in M1, as well as time, savings, fixed, and foreign-currency deposits held with the banking system by the private, public, and nonbank financial institutions sectors. However, there are substantial cross-country differences in the grouping of some of these instruments that reflect the specific holders or issuers of the instruments. For example, some territories include some time and savings deposits only in the still broader aggregate M3 because of the special characteristics of the institutional issuer of the instrument or the holder. zt Also, for reasons that are not obvious, some countries include time and savings deposits in M3 or some higher-numbered measures. 22
20 This occurred, for example, in Australia, Canada, France, Germany, Ireland, Japan, Sweden, Switzerland, the United Kingdom, and the United States.
21 Examples include Australia, Canada, France, Hong Kong, Israel, New Zealand, Singapore, Sweden, Switzerland, the United Kingdom, and the United States.
22 Examples include Argentina, Botswana, Chile, Iceland, India, Israel, Mexico, and Papua New Guinea.
438 FINANCIAL FLOWS AND BALANCES
Other countries have reserved the M3 measure for the consolidation of certain types of deposits.23
The line separating M2 from other higher-numbered aggregates such as M3 is often tenuous. In many countries, money market instruments such as certificates of deposit, repurchase agreements, bills, and bonds are increasingly consolidated at the M3 level or at a higher level.24 In a few countries, however, these instruments are consolidated at the M2 level. 25 In addition, some countries have constructed perhaps the broadest aggregates, which essentially attempt to group the total liquid assets of the public that are composed of instruments issued by banks as well as by the nonbank sectors. Such aggregates are often represented by L (liquidity) or by variants of this measure.26
lV. Money in the SNA
The SNA provides a framework for recording flows and stocks in an economy on production, income and outlay, capital finance, and external transactions. The central concepts of these accounts are gross domestic product (GOP), disposable income, savings, and net international lending, which provide aggregates often used as indicators of economic performance. The SNA can be integrated with flow-offunds (FOF) analysis. However, there is no specific money measure defined in the SNA, although the SNA has a narrow money concept implied in the "other monetary institutions" subsector.
In the SNA, the concept of money comprises currency and transferable demand deposits issued by the central bank (inclusive of treasury banking functions) and the "other monetary institutions" subsector. The latter refers to all banks except the central bank that have liabilities in the form of deposits payable on demand and transferable
23 For example, in Argentina, Fiji, Israel, Saudi Arabia, Sweden, Turkey, and Vanuatu, foreign currency deposits are consolidated at the M3 or other, still higher level, while in Bahrain and the United Arab Emirates only government deposits are consolidated at the M3 level.
24 Examples are Argentina, Canada, Chile, France, Germany, Guatemala, Israel, Italy, Japan, the Republic of Korea, Mexico, the Philippines, Portugal, Switzerland, the United Kingdom, the United States, and Venezuela.
25 Examples are Australia, Colombia, Costa Rica, Jamaica, Kuwait, Malaysia, and Uruguay.
26 This occurs, for example, in Bhutan, Brazil, Colombia, France, Hungary, Mexico, the Philippines, Portugal, Romania, Spain, Sweden, Trinidad and Tobago, the United Kingdom, and the United States.
MONETARY CONCEPTS AND DEFINITIONS 439
by check or otherwise usable in making payments. Although the institutional coverage required for the compilation of monetary aggregates is defined in the SNA, the same cannot be said for instruments. Monetary concepts have thus been subject to different national interpretations.
Financial market developments, particularly since the last revision of the SNA, call into question the appropriateness of the SNA's implied focus on narrow money. As was discussed in Section II of this paper, a combination of factors-including the macroeconomic uncertainties of the late 1970s and the 1980s, financial innovation, deregulation in financial markets, and technological progress-has led to a proliferation of instruments with some "moneyness" or partial medium-of-exchange properties. Most obvious among these are other deposits with banks that can be easily converted into demand deposits, as well as certificates of deposit and similar monetary instruments (such as repurchase agreements) issued by banks and nonbanks. This fact in part explains why many countries have increasingly relied on a broader range of money measures than that outlined in the SNA as targets for policy.
The issue of a suitable money concept in the SNA is closely related to whether such a concept should be explicitly defined in the SNA. There are merits to both sides of this issue. On the one hand, money measures have long been compiled by countries because they facilitate the assessment of macroeconomic conditions and can serve as intermediate targets for ultimate goals of policy. Moreover, because monetary policy instruments are designed to correct macroeconomic problems, consistency requires the construction of aggregate monetary concepts. Most international and national statistical systems explicitly recognize monetary aggregates as essential for macroeconomic policy, and the need for their specific definition in the SNA appears to be important.
On the other hand, it can be argued that the identification of a standard money concept would not be desirable in the SNA .framework because this framework should be designed to permit national compilers and analysts to construct whatever aggregates are deemed appropriate for the user's purpose. Moreover, a common standard may be difficult to implement, given the observed dissimilarities across countries that are the result of varied institutional settings and practices. These complications may have led the present SNA to adopt a simple cross-classification of financial items by type of transactor and financial instrument. Nevertheless, the revised SNA could play an important role in facilitating the compilation of monetary aggregates that are increasingly relevant for many countries by
440 FINANCIAL FLOWS AND BALANCES
including a wide spectrum of instruments other than currency and transferable demand deposits.
In this respect, three important considerations relating to issuers, instruments, and holders appear to require some rethinking if the SNA is to remain abreast of observed trends in the compilation of money measures. The first concerns the present narrow focus of the SNA in defining monetary institutions.27 The distinction between "monetary institutions" (as defined above) and other banking (nonmonetary) institutions (currently part of "other financial institutions" in the SNA) may no longer be justified in the light of the many nearmoneys and money substitutes being issued by nonmonetary institutions. The most notable of these are broader monetary instruments such as other deposits at banks that are substitutable for demand deposits. Others include securities and arrangements such as interest-bearing checking deposits offered by money market mutual funds and credit unions, certificates of deposit, and credit cards. Indeed, the recent growth of deposit-taking institutions other than deposit money banks has given rise to the practice, common in many countries, of consolidating monetary accounts at the level of the entire banking system. Other countries have gone beyond this level to include all financial institutions that provide deposit facilities for the public.
The second issue concerns the identification of the kinds of instruments to be included in money measures. The trend toward a broader range of instruments in many countries suggests that some of the other deposits in the present list of instruments in the SNA (Table 24) are de facto monetary instruments. In addition, there are many instruments-some of which are the product of market innovations, such as certificates of deposit, Eurocurrency deposits, and repurchase agreements-that are not explicitly covered by the present SNA. Decisions need to be made about whether to include these financial instruments in Table 24 of the SNA. These decisions may be complicated by the fact that, although some of these instruments may be similar to those included in the present SNA, they possess liquidity, negotiability, and transferability characteristics that differ from those in the present SNA. So far, their inclusion in one or more aggregates has been decided by national compilers on a country-by-country basis. Cross-country differences in instruments and institutions are likely to introduce additional complications into any harmonization efforts. Another aspect of this issue is the treatment to be accorded to
27 See Chapter 22 in this volume for a detailed discussion of these issues.
MONETARY CONCEPTS AND DEFINITIONS 441
short-term as opposed to long-term instruments in money measures in view of the many available schemes for negotiating and transforming the original maturity of instruments.
The third issue concerns the holders of financial instruments. The survey of national monetary practices reveals the holders of monetary instruments to be the private sector, nonfinancial public enterprises, the central government, other general government, nonresidents, and nonbank financial institutions. There seems to be little doubt about the rightful place in monetary aggregates of the deposits held by the private sector and nonbank financial intermediaries. However, there is less unanimity about the deposits held by nonresidents, the central government, other general government, and nonfinancial public enterprises. Country practices are not uniform because many of these cases are "borderline" ones requiring the judgment of national compilers, who must consider the country-specific institutional arrangements. For example, although the residency criterion should exclude nonresident deposits from monetary aggregates, this criterion is itself subject to interpretation, thereby resulting in departures from the norm. Furthermore, the Fund's money and banking statistics (MBS), for example, exclude central government deposits from money because, in principle, the central government has ultimate access to credit from the monetary authorities. Evidence suggests, however, that not all central governments have this ultimate access to credit and that, in some countries, some other levels of government have almost the same freedom of access to credit as the central government. The SNA review provides an opportunity to discuss these issues with a view to providing some compilation guidelines.
24
Repurchase Agreements and Financial Analysis
MARrA CASTELLO-BRANCO
T HE PAST DECADE has witnessed a significant change in financial systems, resulting in the creation of new institutions (such as
money market mutual funds), new instruments (such as negotiable orders of withdrawal-NOW-accounts), and new markets (such as the futures market). Among these important financial developments is the substantial growth in the market for repurchase agreements (RPs, or "repos"), as well as in the number of participants in that market. Repos-which involve the sale of a financial asset or group of assets, with the agreement to reverse the transaction in the futurehave existed for decades, but they have become considerably more popular since the beginning of the 1970s. More recently, the failures of a number of government securities dealers in the United States has raised concerns about the risks involved in repo transactions.
This paper is one of a series of studies concerned with the review of the present version of the United Nations' A System of National Accounts (SNA) and, in particular, with the appropriate treatment of financial instruments in the revised SNA. Within that context, the objective is to discuss the implications of repos for financial analysis, as well as their appropriate classification in the SNA and other statistical systems. The basic question to be discussed is whether repos should be treated as successive independent sales of existing financial instruments or as the creation of a new financial instrument, similar to a collateralized loan.
The discussion focuses on the U.S. market, where repos are widely used. However, the repo market is well established in other countries with developed financial markets.l In all these countries, repos are
1 Well-established repo markets exist in Brazil, Germany, Japan, Malaysia, Spain, and Thailand, for example.
442
REPURCHASE AGREEMENTS 443
used both by central banks for monetary management and by business corporations, banks, and other financial institutions for asset and liability management. This study concludes that, although the legal characterization of repos differs among the various countries, their treatment as secured loans is more appropriate for financial analysis. In general, the change-of-ownership principle gives guidance to the proper classification of a financial instrument. In the case of repos, however, it is clear that the purchaser does not effectively obtain the right of ownership, so the basic nature of transactions should be given precedence over their legal form.
The paper is organized as follows. The first section describes the market for repos in the United States and analyzes its recent expansion and the underlying risks. Section II discusses the implications of repos for monetary policy. Section III deals with the treatment of repos in financial analysis. The main conclusions are given in Section IV.
I. The Repo Market
A repurchase agreement is an acquisition of immediately available funds through the sale of securities with the simultaneous commitment by the seller or borrower to repurchase them at a later date. 2
The same transaction from the perspective of the supplier of funds is called a reverse repurchase agreement (reverse repo). Whereas a repo combines a spot sale with a forward purchase, a reverse repo involves a spot purchase and forward sale.3
The Repo Contract
The repo contract establishes the underlying security or securities, the interest rate, the repurchase price, and the term and maturity of the arrangement. Normally it does not cover default arrangements involving bankruptcy of one of the parties.
2 When borrowed funds are received on the same business day, they are referred to as "immediately available funds." These funds are usually transferred through the Board of Governors of the Federal Reserve System's (FRB) nationwide electronic communications network, the "Fed-wire."
3 In the case of the FRB and thrift institutions, however, the usual terminology is reversed, and the repo represents the point of view of the supplier of funds; the reverse repo represents the point of view of the supplier of securities.
444 FINANCIAL FLOWS AND BALANCES
In principle, any asset can be used as the underlying security in the repo transaction, b!lt in practice U.S. government and federal agencies' securities are more widely used because of their liquidity, low risk, and active market. Other assets that can be used are money market instruments such as certificates of deposit, banker's acceptances, commercial paper, and commercial banks' loans or mortgagebacked securities. The use of a mix of different securities in a repo transaction is also common. For illustrative purposes, the following discussion will be limited to transactions involving government securities. However, the same principles apply to repos involving all classes of securities.
The role of the underlying security is only to provide collateral to the buyer or lender. not to determine the interest rate on the agreement, which is determined by the money market. The repo rate is typically lower than the rate on federal funds loans, which are not collateralized. 4
The repurchase price in the repo transaction can be set either at or above the same level as the sale price. If set at the same level, the parties will arrange for a separate interest payment for the use of the acquired funds; if set above the sale price, the difference reflects the implicit interest rate on the contract. Usually a margin, or "haircut," is set to protect the lender or buyer against fluctuations in the market value of the underlying securities.5 The amount of funds transferred (sale price) is thus equal to the market value of the underlying security plus (in the case of coupon securities) accrued interest less the margin.6 In general, the margin will be larger the longer is the maturity of the underlying security and the less liquid the security is. Haircuts range from 1 percent to 5 percent, but may be as low as 1/8 percent of a point for very short-term securities?
4 The federal funds rate is the rate of interest paid on overnight loans of federal funds (funds on deposit in a bank's reserve account with the Federal Reserve System).
5 Technically, the margin can protect either the lender or the borrower (but not both), depending on how the repo transaction is priced. Here I concentrate on the most common case, where it protects the lender.
6 Full accrual pricing was adopted in October 1982, in the wake of some government securities dealers' failures (see the subsection on "Risks and Regulation," below). When interest is ignored in the pricing, the repo transaction is said to be priced "flat."
7 Stephen A. Lumpkin, "Repurchase and Reverse Repurchase Agreements," Federal Reseroe Bank of Richmond Economic Review, January-February 1987.
REPURCHASE AGREEMENTS 445
Usually repos are written for a very short period of time and involve principal amounts larger than US$1 million. Standard repos include overnight (one-day maturity) and term (fixed-term multiday) repos in treasury and agency securities, but other special arrangements are also common. An "open repo" does not have any specific maturity attached to it and can be closed at the discretion of either party. Such arrangements, often called "continuing contracts," are essentially a series of overnight repos, renewed daily, with the repo rate adjusted to reflect prevailing market conditions. The main advantage of continuing contracts is to avoid new transaction costs, since the underlying securities and the funds are exchanged only at the beginning and at the end of the contract. Consequently, the rate paid on an open repo is usually above the rate on an overnight repo. Another possibility is to engage in a '' repo agreement to maturity,'' in which case the repo matures at the same time as the underlying security.
In a "straight" repo transaction, the same securities are returned at the end of the contract. Those are often called "vanilla" or "plain vanilla" repos. However, it is also possible to arrange for "dollar repos," in which different securities are returned to the borrower or seller. There are two types of dollar repos, a "fixed-coupon repo," in which the returned securities have the same coupon rate and similar maturities as the transferred securities, and a "yield-maintenance repo," in which the returned securities provide roughly the same return as the securities originally sold.
These special arrangements-designed to accommodate specific needs of customers-increase the flexibility of the repo agreement, and thus its attractiveness for borrowers and lenders.
Use of Repos by Participants in the Repo Market
Traditionally, repos have been used on a large scale by government securities dealers, as a form of primary borrowing, and by large commercial banks, as a secured means of obtaining short-term financing. With the development of the repo market, a variety of institutional investors started to engage in such transactions. In addition, the Board of Governors of the Federal Reserve System (FRB) has also increased its use of repurchase agreements as a means of temporarily changing the composition of its portfolio for monetary policy purposes.
As they shifted from asset management to liability management, commercial banks have extensively used federal funds and repos to
446 FINANCIAL FLOWS AND BALANCES
finance cyclical variability in loan growth. There are several advantages in their use of the repo market. Repos are usually less expensive than other sources of short-term funds, such as federal funds. Moreover, repos are exempt from reserve requirements, which considerably reduces the effective cost of loans.s In addition, the repo transaction offers a desirable combination of risk, maturity, flexibility, liquidity, and ease of negotiation that compares favorably with other instruments. Commercial banks and government securities dealers also engage in reverse repos to obtain government securities to be used in repo transactions.
Government securities dealers are very active in the repo market, using repo transactions, as an alternative to commercial bank loans, to finance their positions. A substantial percentage of dealers' inventories of securities is financed through the repo market. Government securities dealers also act as financial intermediaries or brokers, using the repo market to channel funds from lenders to borrowers. These arrangements are called "repo books" and involve a repo and a reverse repo. When the dealer (or the commercial bank, if acting as a middleman) matches the two "legs" of the repo-that is, obtains equal terms to maturity in the purchase and in the sale of the security-the arrangement is called a ''matched book RP. '' In this case the dealer's profit is insulated from movements in the interest rate, although not from default. The size of the market is limited by the amount of securities usable in such operations.
Dealers may also decide not to match the maturities of repos and reverse repos, speculating on future movements of interest rates to increase their profits. For example, if a dealer expects interest rates to rise, he arranges the repo book so that the repo has a longer term to maturity than the reverse repo.
Commercial banks and government securities dealers are usually net borrowers in the repo market. The primary lenders of repo funds are nonfinancial corporations and state and local governments; thrift institutions and pension funds also invest in the repo market.
From the lender's side of the market, repo transactions ideally supplement other cash management techniques. Any excess cash position can find a suitable short-term application that allows investors to hold only a minimal amount of funds without explicit interest return. Reverse repos are attractive to investors because they do not require
8 Repos are nonreservable borrowings only as long as the repo securities are those of the U.S. government or federal agencies (see Amendment to Federal Reserve Regulation D, 1969; Regulation D specifies which deposits of commercial banks are subject to reserve requirements).
REPURCHASE AGREEMENTS 447
commitment of funds for the full term of the repo security. Moreover, they provide a competitive yield and are considered less risky than other instruments. In addition, reverse repos can be particularly attractive to state and local governments and other public bodies that are required to invest in treasury securities. Given the existing flexibility in recording these transactions, they can record the ownership of U.S. government securities, rather than ownership of repos, and thus comply with legal requirements.
The FRB is also an important participant in the repo market. Its extensive use of repos and reverse repos as a way to adjust bank reserves began after World War II and has grown sharply in recent years as the private sector has become more adept at moving funds. In addition to its direct participation in the market,· the FRB also has an important indirect role through its regulations and through its effect on interest rates in general and federal funds rates in particular.
Growth and Development of the Repo Market
Although the repo market has been operating for many years, it became quantitatively important in the early 1970s when commercial banks and their customers started to participate actively in the market. Repos were developed by government securities dealers after World War II as an inexpensive mechanism to finance their inventories. Some sources, however, trace the origin of repos to the 1920s, when the federal funds market was created. As in the case of other financial innovations, the growth in the repo market reflects several factors. Governmental regulation and regulatory changes are among the most important ones, along with the generalized increase in interest rates observed since the mid-1960s.
In a context of rising interest rates, the interest rate ceilings imposed on savings and time deposits and the prohibition of interest payments on demand deposits by the FRB's Regulation Q significantly limited the ability of commercial banks to obtain additional funds. 9 Consequently, banks increasingly turned to nondeposit sources to avoid missing profitable loan opportunities. The restrictive monetary policies adopted to counteract inflation in the early 1970s and the consequent rise in interest rates reinforced this tendency. The result was an increased use of repos by commercial banks as an instrument of liability management. High interest rates also moti-
9 Regulation Q (enacted in the Banking Act of 1933) set the maximum interest rates that commercial banks were allowed to pay on their deposits.
448 FINANCIAL FLOWS AND BALANCES
vated investors to use cash management techniques more actively, thus contributing to the expansion of the repo market. The high rates observed in 1973-74 permanently established repos, but the market continued to grow even after interest rates fell in 1975.
The growth of repo activity by commercial banks has also been influenced by regulatory changes. For example, the 1969 amendment to the FRB's Regulation D ruled that only repos involving government and federal agencies' securities would be exempted from reserve requirements, thus discouraging trading in repos involving other types of securities.1o Beginning in 1974, the U.S. Treasury transferred most of the balances in its Tax and Loan Accounts at commercial banks to the Federal Reserve System. This reduction in treasury deposits allowed banks to use more government securities in the repo market, as the volume of government securities held as required collateral against treasury deposits was reduced.
Technological change also played an important role in the development of the repo market through its contribution to the improvement of cash management systems, thus allowing efficient collection and transfer of large volumes of funds and making participation less costly. The recent increase in government debt has also been important, since the U.S. Treasury relies heavily on the repo market to finance government deficits at the lowest possible cost.
As a result of continued expansion since the early 1970s, today the repo market is considered one of the major financial markets in the United States. There is no physical marketplace for repos. The transactions are done by telephone or over the counter directly between the two parties or through a broker. Consequently, an exact measure of total daily activity in the market cannot be obtained, but the trade volume in repos and reverse repos can reach a trillion dollars on some days. The FRB provides data on overnight and term repos as components of the money stock.11 Although these data, shown in Table 1, include only the use of repos by primary dealers, they give an indication of the growth of the repo market in the past few years.
A further sharp increase in repo activity can be observed from 1973 on, as a result of tight money and high interest rates that restricted the ability of banks to meet growing demand for credit. As an alterna-
10 In October 1979 the FRB imposed marginal reserve requirements on net purchased funds, but these requirements were abandoned in the summer of 1980. See D. Hester, "Innovations and Monetary Control," Brookings Papers on Economic Activity: 1 (1981).
11 Overnight repos are considered part of M2, whereas term repos are a component of M3 (see Section II).
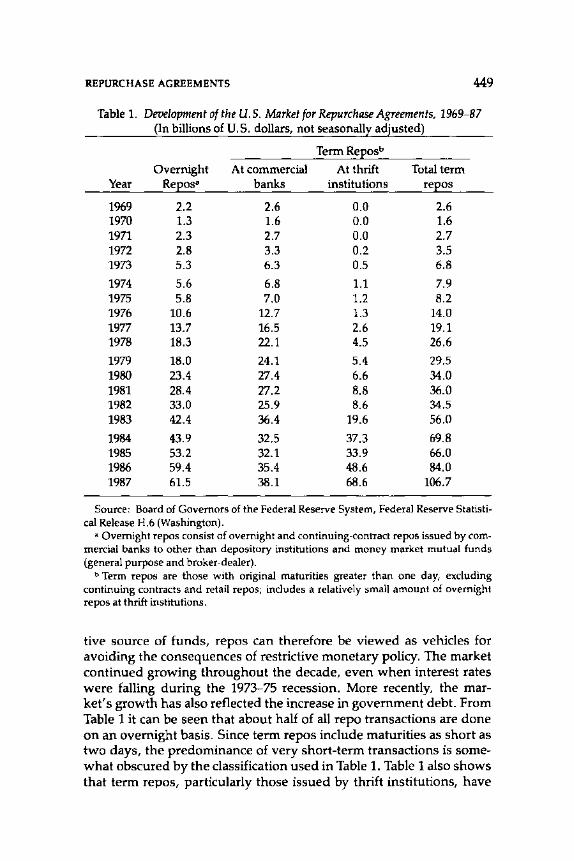
REPURCHASE AGREEMENTS 449
Table 1. Development of the U.S. Market for Repurchase Agreements, 1969-87 (In billions of U.S. dollars, not seasonall~ adjusted)
TermReEosb
Overnight At commercial At thrift Total term Year ReEosa banks institutions reEos
1969 2.2 2.6 0.0 2.6 1970 1.3 1.6 0.0 1.6 1971 2.3 2.7 0.0 2.7 1972 2.8 3.3 0.2 3.5 1973 5.3 6.3 0.5 6.8
1974 5.6 6.8 1.1 7.9 1975 5.8 7.0 1.2 8.2 1976 10.6 12.7 1.3 14.0 1977 13.7 16.5 2.6 19.1 1978 18.3 22.1 4.5 26.6
1979 18.0 24.1 5.4 29.5 1980 23.4 27.4 6.6 34.0 1981 28.4 27.2 8.8 36.0 1982 33.0 25.9 8.6 34.5 1983 42.4 36.4 19.6 56.0
1984 43.9 32.5 37.3 69.8 1985 53.2 32.1 33.9 66.0 1986 59.4 35.4 48.6 84.0 1987 61.5 38.1 68.6 106.7
Source: Board of Governors of the Federal Reserve System, Federal Reserve Statistical Release H.6 (Washington).
• Overnight repos consist of overnight and continuing-contract repos issued by commercial banks to other than depository institutions and money market mutual funds (general purpose and broker-dealer).
b Term repos are those with original maturities greater than one day, excluding continuing contracts and retail repos; includes a relatively small amount of overnight repos at thrift institutions.
tive source of funds, repos can therefore be viewed as vehicles for avoiding the consequences of restrictive monetary policy. The market continued growing throughout the decade, even when interest rates were falling during the 1973-75 recession. More recently, the market's growth has also reflected the increase in government debt. From Table 1 it can be seen that about half of all repo transactions are done on an overnight basis. Since term repos include maturities as short as two days, the predominance of very short-term transactions is somewhat obscured by the classification used in Table 1. Table 1 also shows that term repos, particularly those issued by thrift institutions, have
450 FINANCIAL FLOWS AND BALANCES
increased substantially since 1982.12 This growth is associated with changes in the mortgage market in the 1980s, in particular with the development of a new instrument-the collaterized mortgage obligation (CMO). Through federally sponsored agencies like the Federal National Mortgage Association ("Fannie Mae") and the Federal Home Loan Mortgage Corporation ("Freddie Mac"), individual mortgage loans can be packaged into a federally backed, bondlike instrument that can be used in repos without reserve requirements. As a result, the amount of repos outstanding at thrift institutions increased substantially as they increasingly swapped their mortgage loans for federal agencies' securities. By enhancing the liquidity of mortgage-backed securities, the repo market makes a positive contribution to the domestic housing market. The growth in the repo market has been very impressive in recent years, not only in absolute terms but also relative to other monetary aggregates.
Risks and Regulation
Until recently, repos were considered to be very low-risk transactions because of the use of government securities and the short period of time involved in the transactions. However, after 1982, a series of failures of government securities dealers and the consequent financial losses of their customers showed that transactions involving government securities can be risky even if the underlying securities are free from default risk. These failures called attention to the largely unregulated government securities market and to the repos used to access that market.
The government securities market is characterized by free entry and intense competition. These free-market features have promoted efficiency in the market, making it attractive to a variety of investors. Until the Government Securities Act of 1986 (GSA) was enacted, the market also lacked prudential regulation, which made room for abuses and fraudulent practices by dealers that, together with the lack of investor awareness of the risks involved, resulted in a number of losses.n The major risks associated with repo transactions are market risk and credit risk.
Market risk refers to the possibility that the market value of the
12 The only thrift institutions with a significant amount of repo liabilities outstanding are savings and loan associations.
13 Between May 1982, with the Drysdale failure, and April1985, with the Bevill, Bresler & Schulman failure, a total of $849 million in losses had been recorded.
REPURCHASE AGREEMENTS 451
underlying securities will decline. To mmtmtze this type of risk, investors should require enough margin to protect themselves from market fluctuations, as well as monitor the securities' value (or "mark-to-market"). Failure to require enough margin or to mark-tomarket was one of the factors behind the recent losses, but they were mostly associated with credit risk.
Credit risk refers to the possibility that the other party involved in the transaction will not fulfill its obligation to reverse the transaction at the end of the contract. The main cause of the recent losses was the failure of customers to gain control of the underlying securities, which allowed dealers to use them in multiple transactions. The transaction costs involved in the transfers of securities resulted in the development of repos without actual delivery of the underlying securities.14 These arrangements offered a higher return but implied a higher risk. Among these "nondelivery repos," the most popular is the "tri-party repo," in which an independent custodian is responsible for both the borrower and the lender. However, use of the "due bill" or "letter repo," in which the dealer retains control over the customer's securities, has been common. Moreover, in some cases customers assumed they were dealing with one dealer-only to find later that they had been dealing with an (insolvent) affiliate.
To minimize credit risk and avoid significant losses, investors must always know the dealer. More important, they must arrange '' delivery repos, '' to gain control of the securities, or arrange for a custodian to keep them. From the borrower's point of view, knowledge of the dealer is also important, since he might incur a loss in case the dealer cannot meet his resale obligation.
The recent government securities dealers' failures brought to light dealers' fraudulent practices and stirred debate about the need for more regulation of the government securities industry. Some favored more regulation in the market in order to avoid additional failures and to protect investors against undercapitalized and unscrupulous dealers. Others emphasized the favorable record of the government securities market and the resulting increase in efficiency, competitiveness, and innovation that could be negatively affected by regulation. The FRB favored some form of minimal regulation, sufficient to prevent further abuses but not so much as to reduce the strength and dynamism of the market. After the 1985 failures, the Federal Reserve System started to offer an educational program to inform investors
14 Certified securities are physically delivered to the lender (or custodian). Book-entry, or uncertified, securities are transferred to the lender over the Fed-wire while the funds are transferred to the borrower.
452 FINANCIAL FLOWS AND BALANCES
about the risks involved in repo transactions and the safeguards against these risks, to help reduce the likelihood of future losses.
Several bills were introduced in the U.S. Congress to address the issue of regulation in the government securities market. Mter 18 months of congressional debate, the GSA was enacted in 1986, establishing for the first time a federal system for regulation of the government securities market. The GSA required the Secretary of the Treasury to ''adopt rules and regulations concerning the financial responsibility, protection of investor securities and funds, record keeping, reporting and audit of brokers and dealers in government securities."15 The U.S. Treasury's regulations should also cover the custody of government securities held by depository institutions.
The objective of the new regulatory scheme was to enhance the protection of investors in government securities while maintaining the integrity, liquidity, and efficiency of one of the world's largest securities markets. In addition, the rules and regulations must take into account the importance of the government securities market for the implementation of monetary and fiscal policy in the United States. Mter consulting extensively with other federal regulators, affected parties, and trade and professional associations, the U.S. Treasury developed a set of rules and regulations, published in July 1987, that included registration, minimum capital requirements for dealers, and inspection of dealers' operations, in particular of custodian arrangements.
Recent dealers' failures have also given rise to considerable debate with respect to the legal status of repos. Some parties are legaily constrained to treat repos as purchases and sales, but in general repo transactions are seen as a financing arrangement, or a secured means of borrowing and lending short-term funds, similar to a collateralized loan. During the proceedings in the case of Bevill, Bresler & Schulman, however, the Federal Reserve Bank of New York "took the unequivocal position that repo and reverse repo transactions are structured and should be given legal effect as purchases and sales.''16 The characterization of the buyer or lender as a secured or unsecured creditor is particularly important in the event that the seller or borrower goes bankrupt, since it would determine whether or not the securities could be disposed of by the lender. Nonetheless, court rulings involving bankruptcy proceedings have varied during the period 1982-85, and the question of the legal status of repos is yet to
1s Federal Register, July 24, 1987. 16 Federal Securities Law Reports, December 1986.
REPURCHASE AGREEMENTS 453
be resolved.17 The size of the repo market makes this legal battle all the more important.
II. Implications for Monetary Policy
In the United States the Ml aggregate, including currency and demand deposits, is used to provide the best link between a financial aggregate and spending. However, financial developments that created close substitutes for transferable deposits and strong incentives to move into those substitutes turned the Ml measure into an unreliable policy guide in the mid-1970s and led to the use of broader definitions of money (such as M2 and M3). More recently other developments-such as commercial banks' increased reliance, for mobilizing funds, on nondeposit liabilities such as certificates of deposit and bankers' acceptances-impaired the FRB's ability to control the monetary aggregates, forcing a revision in their definition.18
The new definitions, established in 1980, grouped together similar types of deposits with all depository institutions. Furthermore, the FRB recognized that there is no single set of monetary aggregates capable of satisfying every purpose or every user, so from that date series of the principal components of the revised monetary aggregates were published separately.
The introduction of repos in the new monetary aggregates was decided after some debate concerning their classification as liquid investments or transaction balances. Those who favored the inclusion of repos at the Ml level argued that, since their maturities are so short, repos are very similar to demand deposits.19 In support of that view, they referred to earlier econometric studies of money demand
17 An important result was achieved in June 1984, when the U.S. Congress introduced legislation to amend the bankruptcy code, exempting repos in treasury and government agencies' securities from the "automatic stay" provision of the code. With the amendment, lenders are allowed to liquidate the underlying securities in case of bankruptcy of the borrower, as long as the repo has a maturity of not more than one year and the securities are of certain specified types.
18 For more details, see Federal Reseroe Bulletin, January 1979, and T. Simpson, "The Redefined Monetary Aggregates," Federal Reseroe Bulletin, February 1980.
19 It is even possible for the creditor to write checks on the funds, since they will be available before the checks clear; see Norman N. Browsher, "Repurchase Agreements," Federal Reseroe Bank of St. Louis Review, September 1979.
454 FINANCIAL FLOWS AND BALANCES
that attributed the forecast errors observed in 1974-76 to the growth in transaction-related repos. During this period, available models overpredicted the demand for real balances, prompting discussion about the factors responsible for the "missing money."20 Some analyses suggested that the shift in money demand would have been smaller had repos been included in the definition of money. Others considered it more appropriate to classify repos as time deposits, given their characteristic as liquid investments, and thus to include them in the M2 money aggregate. They argued that, even in the event that the shortfall in the public's demand for Ml in the mid-1970s might be attributed to the increase in repo transactions, the inclusion of such transactions in the definition of money would not guarantee a stable relationship with income in the future.
Eventually it was decided that overnight repos issued by commercial banks should be included in the new M2 measure, whereas term repos should be added to the new M3. Given the potential transaction-related features of overnight repos, however, it was decided that both series would be published separately.
The hybrid nature of repos gives rise to ambiguities from the point of view of instrument classification. No ambiguity would arise, however, if repos were considered as true sales or purchases of securities. In this case, there would be a transfer of ownership between the two parties and, therefore, no real liability on either side. In contrast, if repos were viewed as the creation of a new instrument, as in the IMF's current framework for its money and banking statistics (MBS), they could be treated either as short-term deposits or as highly liquid securities. In this framework, repos would fall within a broad definition of money whenever they were repurchase liabilities of banking institutions.
The effects of repos on the money stock vary according to the participants in the repo transaction. Repos between a commercial bank and the nonbank public have the largest monetary effect. This will be illustrated in the next section, which examines the treatment of repos in monetary statistics.
III. Implications for Financial Analysis
Repos can be treated either as sales without recourse or as collateralized loans. It is current MBS practice, as stated in the IMF's draft
20 See S. Goldfeld, "The Case of the Missing Money," Brookings Papers on Economic Activity: 3 (1976).
REPURCHASE AGREEMENTS 455
Guide to Money and Banking Statistics (MBS Guide), to adopt the latter treatment, considering these arrangements as "creation of new financial instruments, similar to collateralized loans, and not as transfers of existing financial items." The securities held by the buyer or lender are assumed to serve only as collateral and remain an asset of the party incurring the repurchase obligation (the borrower). This approach emphasizes the financial aspect of the repo transaction, not its legal form.
The alternative approach emphasizes precisely the legal aspect of the repo transaction as a contract to sell and later purchase securities. The focus is on the effective transfer of the underlying security and not on its use as collateral. In this case, the security is recorded as an asset of the buyer or lender until the transaction is reversed.
The treatment of repos as a secured loan seems to be in line with the view of market participants. However, countries can adopt either of these approaches in their classification of repos. 21 It is therefore important to discuss the implication of different alternative treatments for the MBS, the IMF's balance of payments statistics (BOPS), and the SNA, as well as for flow-of-funds (FOF) statistics. In what follows, the difference between the two approaches will be discussed in the context of two simple examples. The first shows the balancesheet effects of a repo between the monetary authorities (MA) and a commercial bank; the second examines a repo between a commercial bank and the nonbank public. In both cases, the monetary impact of the transaction will be examined.
Repo Between the Monetary Authorities and a Commercial Bank
The MA engage in repo transactions with banks when they want to increase the economy's overall liquidity temporarily. Thus they buy securities from a bank, which agrees to repurchase them at a later date.22 If this transaction is regarded as a financial arrangement-as in the current MBS approach-it will be considered similar to a direct loan to the bank by the MA. Accordingly, an increase in credit from the MA is booked on the liability side of the bank's balance sheet,
21 Some countries consider repos as a matched pair of contingent accounts, booking them within or outside the balance sheet according to local practice.
22 Recall from Section I that, because it involves the MA, this transaction is called a repo and not a reverse repo (as it would normally be called). The MA would engage in a reverse repo if their objective were to decrease overall liquidity.
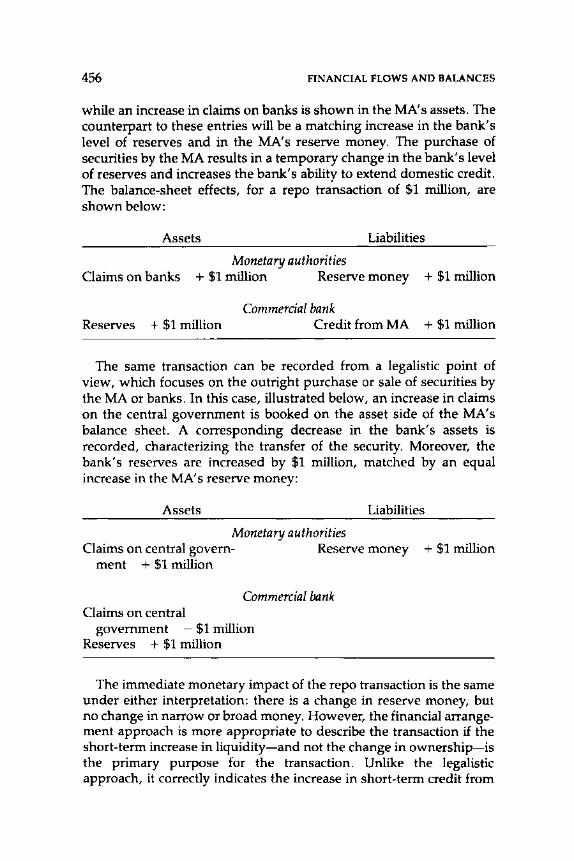
456 FINANCIAL FLOWS AND BALANCES
while an increase in claims on banks is shown in the MA's assets. The counterpart to these entries will be a matching increase in the bank's level of reserves and in the MA' s reserve money. The purchase of securities by the MA results in a temporary change in the bank's level of reserves and increases the bank's ability to extend domestic credit. The balance-sheet effects, for a repo transaction of $1 million, are shown below:
Assets Liabilities
Monetary authorities Claims on banks + $1 million Reserve money + $1 million
Commercial bank Reserves + $1 million Credit from MA + $1 million
The same transaction can be recorded from a legalistic point of view, which focuses on the outright purchase or sale of securities by the MA or banks. In this case, illustrated below, an increase in claims on the central government is booked on the asset side of the MA' s balance sheet. A corresponding decrease in the bank's assets is recorded, characterizing the transfer of the security. Moreover, the bank's reserves are increased by $1 million, matched by an equal increase in the MA' s reserve money:
Assets Liabilities
Monetary authorities Claims on central govern- Reserve money + $1 million
ment + $1 million
Commercial bank Claims on central
government - $1 million Reserves + $1 million
The immediate monetary impact of the repo transaction is the same under either interpretation: there is a change in reserve money, but no change in narrow or broad money. However, the financial arrangement approach is more appropriate to describe the transaction if the short-term increase in liquidity-and not the change in ownership-is the primary purpose for the transaction. Unlike the legalistic approach, it correctly indicates the increase in short-term credit from
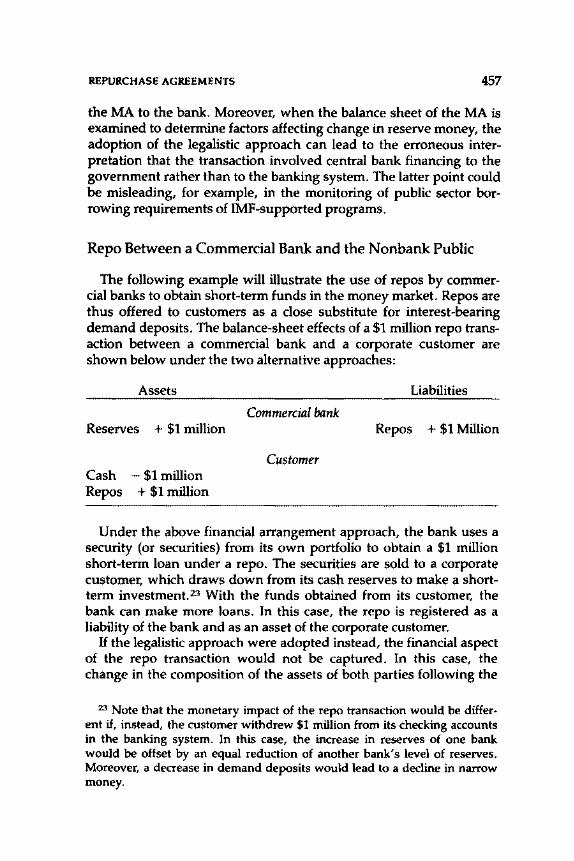
REPURCHASE AGREEMENTS 457
the MA to the bank. Moreover, when the balance sheet of the MA is examined to determine factors affecting change in reserve money, the adoption of the legalistic approach can lead to the erroneous interpretation that the transaction involved central bank financing to the government rather than to the banking system. The latter point could be misleading, for example, in the monitoring of public sector borrowing requirements of IMP-supported programs.
Repo Between a Commercial Bank and the Nonbank Public
The following example will illustrate the use of repos by commercial banks to obtain short-term funds in the money market. Repos are thus offered to customers as a close substitute for interest-bearing demand deposits. The balance-sheet effects of a $1 million repo transaction between a commercial bank and a corporate customer are shown below under the two alternative approaches:
Assets
Reserves + $1 million
Cash - $1 million Repos + $1 million
Liabilities
Commercial bank Repos + $1 Million
Customer
Under the above financial arrangement approach, the bank uses a security (or securities) from its own portfolio to obtain a $1 million short-term loan under a repo. The securities are sold to a corporate customer, which draws down from its cash reserves to make a shortterm investment. 23 With the funds obtained from its customer, the bank can make more loans. In this case, the repo is registered as a liability of the bank and as an asset of the corporate customer.
H the legalistic approach were adopted instead, the financial aspect of the repo transaction would not be captured. In this case, the change in the composition of the assets of both parties following the
23 Note that the monetary impact of the repo transaction would be different if, instead, the customer withdrew $1 million from its checking accounts in the banking system. In this case, the increase in reserves of one bank would be offset by an equal reduction of another bank's level of reserves. Moreover, a decrease in demand deposits would lead to a decline in narrow money.
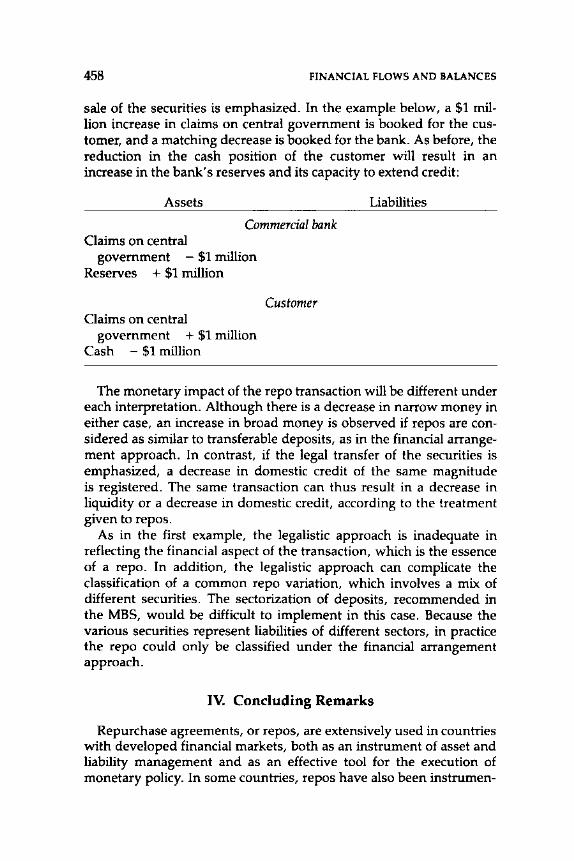
458 FINANCIAL FLOWS AND BALANCES
sale of the securities is emphasized. In the example below, a $1 million increase in claims on central government is booked for the customer, and a matching decrease is booked for the bank. As before, the reduction in the cash position of the customer will result in an increase in the bank's reserves and its capacity to extend credit:
Assets
Commercial bank Claims on central
government - $1 million Reserves + $1 million
Claims on central government + $1 million
Cash - $1 million
Customer
Liabilities
The monetary impact of the repo transaction will be different under each interpretation. Although there is a decrease in narrow money in either case, an increase in broad money is observed if repos are considered as similar to transferable deposits, as in the financial arrangement approach. In contrast, if the legal transfer of the securities is emphasized, a decrease in domestic credit of the same magnitude is registered. The same transaction can thus result in a decrease in liquidity or a decrease in domestic credit, according to the treatment given to repos.
As in the first example, the legalistic approach is inadequate in reflecting the financial aspect of the transaction, which is the essence of a repo. In addition, the legalistic approach can complicate the classification of a common repo variation, which involves a mix of different securities. The sectorization of deposits, recommended in the MBS, would be difficult to implement in this case. Because the various securities represent liabilities of different sectors, in practice the repo could only be classified under the financial arrangement approach.
IV. Concluding Remarks
Repurchase agreements, or repos, are extensively used in countries with developed financial markets, both as an instrument of asset and liability management and as an effective tool for the execution of monetary policy. In some countries, repos have also been instrumen-
REPURCHASE AGREEMENTS 459
tal in the financing of government debt. The repo market is especially highly developed in the United States, where repo transactions are used on a large scale, but it is also important in other member countries of the Organization for Economic Cooperation and Development (OECD), as well as in some developing ones.
The increasing trend toward the continuous adjustment of assets and liabilities that characterized the 1960s and 1970s encouraged the growth of the repo market, which became an important market for short-term funds in the 1980s. In addition, central banks have used repos widely in monetary management. Repurchase agreements allow central banks to temporarily affect commercial banks' reserves, with little or no impact on the yield of the government securities underlying the repo transactions. The role of the repo market in the conduct of monetary policy has been particularly important in the United States, given the larger degree of tolerance with respect to reserve variations in other OECD countries. Among the OECD countries that engage in repos, only in the United States, France, Spain, and Italy are repos between banks and nonbanks considered as part of the monetary aggregates.
The legal characterization of repo and reverse repo transactions differs from country to country and is still the subject of open debate. Some argue that the economic substance, and not the form, of the transaction should determine the proper characterization of repos and reverse repos. This is the view of most market participants, who consider repos as secured loans. Others contend that such transactions should be structured as outright purchases and sales of securities. As a result of their hybrid nature, repos do not fit neatly into either characterization. However, some of the functional attributes of repos-such as the initial taking of margin, the right of substitution of the underlying securities, and the "mark-to-market" provisionstrongly resemble the characteristics of secured loans, making the treatment of repos as secured loans more appropriate for financial analysis.
Within the context of the revision of the SNA, there are two issues that need further discussion. First, although repos are treated as a new financial instrument similar to a collateralized loan in the IMF' s MBS, they are not explicitly dealt with in the SNA. Adoption of the MBS treatment in the revised SNA should be considered. Second, the treatment of repos as a new financial instrument in the revised SNA should be harmonized, to the extent possible, with the balance of payments treatment of repos as a direct transfer of ownership of the underlying securities.
25
Recording of Financial and Operational Leases and of Income on Zero- and Low-Coupon Bonds
BAlANCE OF PAYMENTS DIVISION, IMF BUREAU OF STATISTICS
I N CHAPTER 3 of this volume, attention was drawn to the requirement that ownership of the factors of production and of goods and ser
vices is essential for both the allocation of the income accruing from the application of these factors and the identification of the various stages of the production and consumption process. In that paper, the nature of ownership was defined as "the capacity that it provides to the owner to determine the disposition of an asset"; further, it was suggested that "only the owners control whether assets are employed or remain idle, whether assets are passed to another, and whether assets are consumed or destroyed" (page 28). In addition, it was suggested that ''the existence of such control usually exposes the owners to the risk of changes in the price of their assets and, in general, to regulatory strictures and other economic forces .... [and that] without such exposure, the intervention of governments in the market could do little to alter economic behavior'' (page 28).
The paper suggested that the "ownership concept" be broadened for financial leases and that, with respect to the recording of income on zero-and low-coupon bonds, the accrual method should be adopted, which would result in interest being matched to the life of the debt and in the capital account reflecting the increasing debt associated with accumulating interest.
I. Exceptions to the Change-of-Ownership Principle for Financial Leases
In Chapter 3 it was also noted that, in the current (1977) edition of the IMF's Balance of Payments Manual (BPM), the ownership concept
460
FINANCIAL LEASES AND LOW-COUPON BONDS 461
was broadened to account for financial leases, which in the early 1970s had become attractive because of the tax savings that could be obtained by that means of financing both domestic and international transactions.
At that time a broadening of the ownership concept was considered to be justified because financial leases have many of the hallmarks of a change of ownership, by passing control of an asset to the user while maintaining legal title to the asset on the part of the financing entity. Following publication of the 1977 edition of the BPM, other international organizations followed the Fund's lead; the European Community, the Organization for Economic Cooperation and Development (OECD), and the International Accounting Standards Committee (IASC)l have all adopted the broader concept, although small differences between the three definitions of financial leases still exist.
In the BPM, financial leasing is defined as lease arrangements that provide for the recovery of all, or substantially all, of the cost of the goods, together with carrying charges. As a rule of thumb, a lease arrangement expected to cover at least three-fourths of the cost of the goods, together with the carrying charges, is to be taken as presumptive evidence that a change in ownership is intended. This BPM definition differs from the corresponding OECD definition, which calls for the arrangement to cover all of the cost of the goods, together with carrying charges. The IASC stops short of specifying a precise percentage share and defines a financial lease as ''a lease that transfers substantially all the risks and rewards incident to ownership of an asset [while] title may or may not eventually be transferred" (lAS 17).
For lessees, lAS 17 (page 4) suggests that "transactions and other events ought to be accounted for and presented in accordance with their substance and financial reality and not merely with legal form.'' Thus,
While the legal form of a lease agreement is that the lessee may acquire no legal title to the leased asset, in the case of finance leases the substance and financial reality are that the lessee acquires the economic benefits of the use of the leased asset for the major part of its useful life in return for entering into an obligation to pay for that right an amount approximating to the fair value of the asset and the related finance charge. If such lease transactions are not reflected in the lessee's balance sheet, the economic resources and the level of obligations of an enterprise are understated, thereby distorting financial ratios. It is, therefore, appropriate that a finance lease be recorded
1 International Accounting Standard, Accounting for Leases (lAS 17), International Accounting Standards Committee, September 1982.
462 FINANCIAL FLOWS AND BALANCES
in the lessee's balance sheet both as an asset and as an obligation to pay future rentals.
Similarly, for lessors, "an asset held under a finance lease should be recorded in the balance sheet not as property, plant, and equipment, but as a receivable, at an amount equal to the net investment in the lease" (lAS 17, page 13).
Unlike the BPM, however, lAS 17 does not indicate in terms of a percentage how much of the risk and rewards from ownership of an asset must be transferred by a lease agreement in order for that agreement to become a financial lease agreement. Nevertheless, equipment obtained from abroad under a financial lease is reflected in an increase in the acquiring economy's external debt, which is reduced at such time as that economy makes its lease payments. In contrast, under an operational lease (a lease other than a financial lease) an economy's external debt would not be affected by its acquisition of equipment.
The BPM recommends that the basic nature of these transactionsthat is, the transfer of the economic risk from the lessor to the lesseebe given precedence over their legal form. At the time the possession of the equipment passes from the lessor to the lessee, a change of ownership of the equipment from the lessor to the lessee is imputed, and the full equivalent of the market value of the equipment (not the cumulative total of the expected lease payments) is recorded as merchandise, with an offsetting entry made in the capital account to record the imputed credit received by the nominal owner. Thereafter, the so-called lease payments to the actual legal owner are construed as investment income payments and repayment of the financial obligation that was in effect created when possession of the equipment passed from the lessor to the lessee.
Unlike the BPM, the United Nations' A System of National Accounts (SNA) does not refer to such an arrangement and, therefore, does not distinguish between financial and other lease arrangements. In the SNA, lease arrangements refer to the service provided by the owner in leasing his equipment to the enterprise that operates it. Because there is no change of ownership, the market value of the equipment is not recorded in the merchandise and capital accounts, and the lease payment is recorded in the services account.
Because national compilers appeared to be in favor of the methodology recommended in the BPM, that methodology was supported by the Expert Group on External Sector Transactions in March-April 1987 for the purpose of achieving the harmonization of the recording of financial leasing transactions in the BPM and the SNA.
FINANCIAL LEASES AND LOW-COUPON BONDS 463
The expert group agreed, with regard to financial leasing, that ''guidelines for both the balance of payments and the national accounts should refer to the same cut-off point in determining what percent of the cost of a good, together with the carrying charges, must be recovered by an arrangement to qualify it as a financial lease." The group, furthermore, agreed "that the cut-off point [between financial and other leases] should be less than 100 percent and should be considered in light of any current developments in financial accounting."
Subsequently, national balance of payments compilers meeting in November 1987 in Paris concluded that "an international standard for distinguishing between financial and operational leases is needed. Participants generally were looking for guidance from the International Accounting Standards Committee, and suggested that the definition used for balance of payments statistics should be the same as that for national accounts statistics.''
In addition, those compilers ''considered that until such guidance was forthcoming, the 75 percent cut-off referred to in the BPM should continue to apply in distinguishing between financial and operational leases for international transactions [and] agreed that arrangements similar to financial leases should be brought under the ambit for financial leases."
II. The Time of Recording for Income
The currently recommended rule of thumb for recording interest in the national accounts is on a due-for-payment basis. This rule, however, can produce some anomalous entries in the balance of payments and reconciliation accounts of an economy. Consider the following example of a bond issued on day 1 of year 1, by economy A to economy B. The face value of the bond is 100 units, bearing annual interest coupons worth 12 units. The passage of time between coupon dates will result in economy B holding an additional asset, accrued interest. Such an asset must be recognized, but no flow can be recorded to explain its emergence because the income, which gives rise to the asset, cannot be recorded until the coupon date. The reconciliation accounts must, therefore, show an unrealized valuation change.
Further to the above example, 11 months after issue economy B sells the bond to economy C. Economy C sells the bond to economy D the day after the coupon date (day 1 of year 2). The balance of payments statements in Table 1 summarize these transactions. The cur-
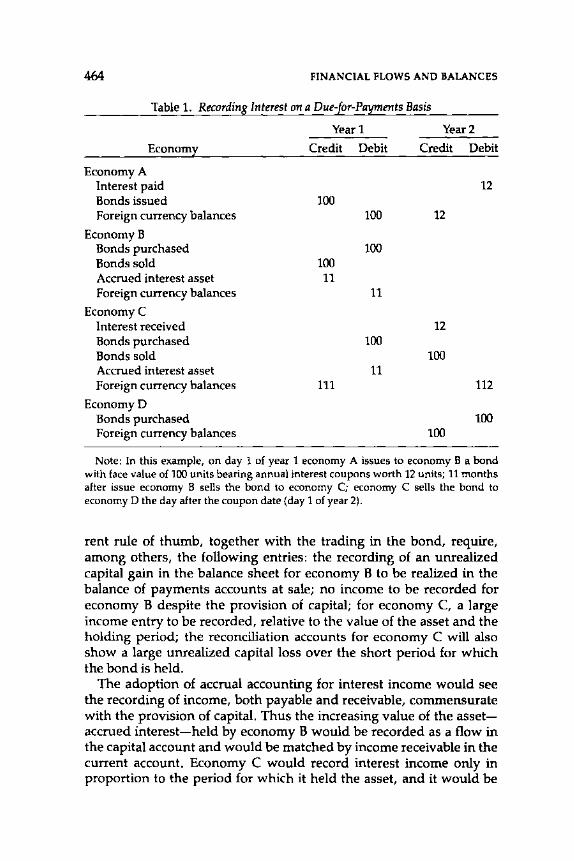
464 FINANCIAL FLOWS AND BALANCES
Table 1. Recordins. Interest on a Due-fE.r-Payments Basis
Year1 Year2
Economr Credit Debit Credit Debit
Economy A Interest paid 12 Bonds issued 100 Foreign currency balances 100 12
EconomyB Bonds purchased 100 Bonds sold 100 Accrued interest asset 11 Foreign currency balances 11
EconomyC Interest received 12 Bonds purchased 100 Bonds sold 100 Accrued interest asset 11 Foreign currency balances 111 112
EconomyD Bonds purchased 100 Foreign currency balances 100
Note: In this example, on day 1 of year 1 economy A issues to economy B a bond with face value of 100 units bearing annual interest coupons worth 12 units; 11 months after issue economy B sells the bond to economy C; economy C sells the bond to economy D the day after the coupon date (day 1 of year 2).
rent rule of thumb, together with the trading in the bond, require, among others, the following entries: the recording of an unrealized capital gain in the balance sheet for economy B to be realized in the balance of payments accounts at sale; no income to be recorded for economy B despite the provision of capital; for economy C, a large income entry to be recorded, relative to the value of the asset and the holding period; the reconciliation accounts for economy C will also show a large unrealized capital loss over the short period for which the bond is held.
The adoption of accrual accounting for interest income would see the recording of income, both payable and receivable, commensurate with the provision of capital. Thus the increasing value of the assetaccrued interest-held by economy B would be recorded as a flow in the capital account and would be matched by income receivable in the current account. Economy C would record interest income only in proportion to the period for which it held the asset, and it would be
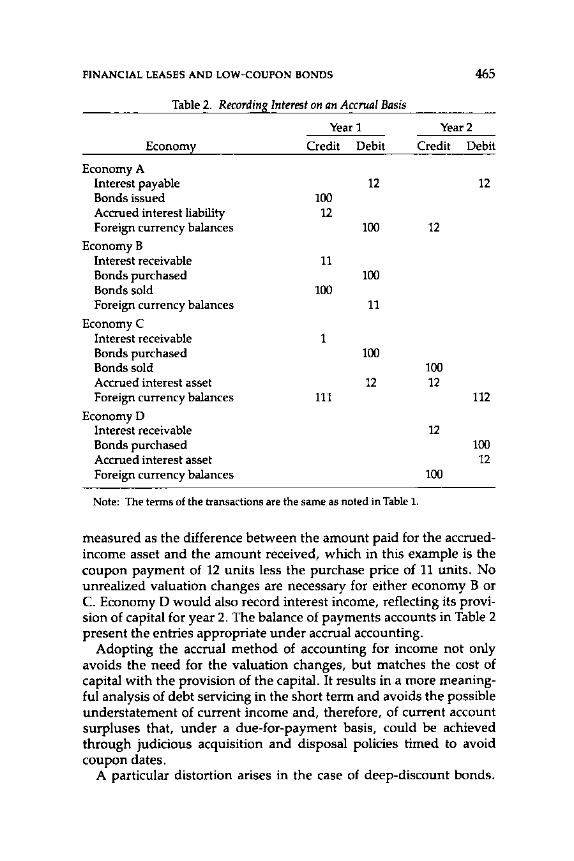
FINANCIAL LEASES AND LOW-COUPON BONDS 465
Table 2. Recordin8_ Interest on an Accrual Basis
Yearl Year2
Econom~ Credit Debit Credit Debit
Economy A Interest payable 12 12 Bonds issued 100 Accrued interest liability 12 Foreign currency balances 100 12
EconomyB Interest receivable 11 Bonds purchased 100 Bonds sold 100 Foreign currency balances 11
EconomyC Interest receivable 1 Bonds purchased 100 Bonds sold 100 Accrued interest asset 12 12 Foreign currency balances 111 112
EconomyD Interest receivable 12 Bonds purchased 100 Accrued interest asset 12 Foreign currency balances 100
Note: The terms of the transactions are the same as noted in Table 1.
measured as the difference between the amount paid for the accruedincome asset and the amount received, which in this example is the coupon payment of 12 units less the purchase price of 11 units. No unrealized valuation changes are necessary for either economy B or C. Economy D would also record interest income, reflecting its provision of capital for year 2. The balance of payments accounts in Table 2 present the entries appropriate under accrual accounting.
Adopting the accrual method of accounting for income not only avoids the need for the valuation changes, but matches the cost of capital with the provision of the capital. It results in a more meaningful analysis of debt servicing in the short term and avoids the possible understatement of current income and, therefore, of current account surpluses that, under a due-for-payment basis, could be achieved through judicious acquisition and disposal policies timed to avoid coupon dates.
A particular distortion arises in the case of deep-discount bonds.
466 FINANCIAL FLOWS AND BALANCES
These are issued with zero or low coupon rates and at a discount which, on bonds with maturities of ten years or longer, can be 70 percent or more of the face value of the bond. The due-for-payment basis requires reporting this interest at maturity.
An argument for recording interest on a due-for-payment basis is that some instruments are not negotiable and the income cannot be realized before the coupon date. This is analogous to recording wages only on payday, or goods transactions according to payment terms. Another argument is that data are only available for contract terms. This is unlikely given modern commercial accounting standards and practices.
Adopting the accrual method would result in interest being matched to the life of the debt, while the capital account would reflect the increasing debt associated with accumulating interest. Stock data, incorporating the accrued interest (and dissected by maturity) would better reflect the liability of the debtor and the causes of that liability. Any asymmetry in current account measures of interest paid or received because of the inability of economies to report interest earned or accrued would be matched, and possibly be identifiable, by the asymmetry in the interest liability or asset reflected in the capital account.
Where royalty and other property income payments are also payable at discrete points in time and such payments represent the use of an intangible asset over a number of time periods, again the accrual basis, rather than the due-for-payment basis, would result in a proper matching of the use of an asset and the cost of that use.
In deliberating on these issues, the Expert Group on External Sector Transactions agreed that "the due-for-payments, as opposed to the full accrual, recording of income should be maintained [but felt that] an exception to the due-for-payment recording be made for zero-coupon bonds."
26
Financial Leasing
BRIAN NEWSON
T HE 1970s SAW rapid growth of the practice of equipment leasing, whereby instead of industrial enterprises themselves buying the
capital goods they needed, with financing by a bank loan, the banks bought the equipment and leased it to the users. In the national accounts the result was that industrial enterprises' gross fixed capital formation and borrowing went down, while their intermediate consumption and services went up substantially; at the same time, the banking sector came to carry out a significant part of total gross fixed capital formation (frequently in equipment totally unrelated to banking) but made fewer loans.
The change was totally artificial because, to both the user of the equipment and the bank, such leasing contracts are a clear substitute for the more usual bank loan. It is the user who chooses the equipment and is responsible for its maintenance, in every way acting as (although not legally being) the owner of the goods. In fact many countries' rules for company accounts have been changed so that leased goods appear in the accounts of the user.
National legislation makes leasing more or less easy, more or less attractive in different countries; but leasing is clearly a phenomenon that will remain a major method of financing capital formation, which the United Nations' A System of National Accounts (SNA) must take into account if analysis of national accounts and financial data is not to become seriously misleading.
The need for a new treatment of financial leasing has already been recognized in business accounting, industrial statistics, and the balance of payments. Leasing was discussed by the Organization for Economic Cooperation and Development's Group of Financial Statisticians as long ago as 1977, and by the OECD Working Party on Accounting Norms as recently as the summer of 1988. National accounts working parties of the OECD and the Statistical Office of the
467
468 FINANCIAL FLOWS AND BALANCES
European Communities (EUROSTAT) both discussed the question in 1981, and since then several countries have implemented the new treatment. The fourth edition of the IMF's Balance of Payments Manual (BPM) recommended the new treatment in 1977, and the SNA Expert Group Meeting on the External Sector (March-April 1987) recommended that the SNA and balance of payments be aligned in their treatment of financial leasing.
This paper proposes a new treatment in the SNA of financial leasing and the capital goods obtained through financial leasing. The new treatment has repercussions throughout the whole SNA system: in the production account and input-output table, the income and outlay account, the capital finance account, and the balance sheets for both financial and nonfinancial assets. Leasing also affects the accounts of most sectors and industries.
I. Definition of Financial Leasing
A financial lease is an arrangement, for the provision of a capital good, between a lessor who provides the initial finance and a lessee who has the use of the asset without initially legally owning it. The following characteristics are typical under a financial lease arrangement.
o The capital good is selected by the lessee from lists of goods available from manufacturers or other suppliers, the purchase of the good being arranged by the lessee. The role of the lessor is simply to provide the requisite finance. The lessor does not purchase goods in advance of negotiating leases merely in the expectation that suitable lessees will appear. The initiative and the investment decision itself is therefore taken by the lessee and not the lessor. When the lessee has decided to acquire some machinery or equipment, he or she approaches the lessor in order to arrange the finance for the purchase.
o The duration of the original contract or primary lease has to be sufficiently long to enable the lessor to amortize his or her capital outlay out of the rentals and to receive an adequate return on his or her outlay. The primary lease will usually be somewhat less than the expected economic lifetime of the asset but long enough to enable the whole of the lessor's outlays to be recovered without raising the rentals to unreasonably high levels from the lessee's point of view.
o At the end of the primary lease, by which time the equipment has been fully amortized by the lessor, there are several possibilities: (1) a new lease may be negotiated at a much reduced rental; (2) the good

FINANCIAL LEASING 469
may be sold, in which case the lessee may be entitled to receive a share, and possibly the bulk, of the proceeds as a "rebate of rentals"; or (3) the good may be sold to the lessee.
It can be seen that the combined effect of the above conditions is to make the role of the lessor purely financial. At no stage does the equipment ever come into the possession of the lessor. The lessor does not have to have any expertise whatsoever concerning the equipment and may lease many different kinds of equipment simultaneously to different lessees. It follows that any type of equipment, from street lamps to oil rigs, is suitable for financial leasing, and virtually every type of equipment is in fact leased. The passive financial role of the lessor is reinforced by the fact that it is the lessee who is responsible for the insurance and maintenance of the equipment and enjoys all the rights in relation to the supplier that arise out of normal conditions of sale.
Difference Between Financial and Operating Leasing
It is clear that financial leasing is a very different kind of activity from "operating" leasing or the temporary hiring of equipment. There are businesses that specialize in hiring by building up stocks of equipment such as automobiles, television sets, agricultural equipment, building equipment, and the like that they hire out to users for short periods of time. In contrast to financial leasing, in the case of operating leasing or hiring:
• The equipment is purchased, maintained, and serviced by the lessor, who must therefore have considerable expertise in the type of equipment being leased
• The equipment is usually leased to several lessees in succession for fairly short periods of time, and the lessor does not expect to amortize the equipment during the period of the first lease
• The lessee has no residual interest whatsoever in the equipment at the end of his or her lease because the equipment is returned to the stock of equipment maintained by the lessor
• Operating leasing is typically confined to equipment that can be moved from one location to another without too much difficulty, whereas financial leasing can cover any type of equipment.
Hire Purchase
It may be much more difficult to distinguish financial leasing from hire purchase, especially when the primary lease may give the lessee
470 FINANCIAL FLOWS AND BALANCES
the option to purchase at the end of the lease. Fortunately, this distinction is not so important in practice because it is proposed to treat financial leasing in essentially the same way as hire purchase in the accounts.
Definition
Various definitions have been proposed to delimit financial leasing and tend to focus on one or another aspect or a combination of the aspects of financial leasing described above in order to distinguish financial leasing from other forms of financing the provision of capital goods. From a microeconomic, enterprise-account point of view, International Accounting Standard No. 17, ''Accounting for Leases," defines a financial lease as "a lease that transfers substantially all the risks and rewards incident to ownership of an asset [while] title may or may not eventually be transferred. " 1
The BPM (paragraph 217) defines financial leases as those "in which the effect of a legal change of ownership is achieved ... by other means ... i.e., lease arrangements that provide for the recovery of all, or substantially all, of the costs of the goods, together with carrying charges .... Therefore, as a rule of thumb, a lease arrangement expected to cover at least three fourths of the cost of the goods, together with the carrying charges, is to be taken as presumptive evidence that a change of ownership is intended."
A somewhat fuller definition was proposed by the OECD Group of Financial Statisticians and expanded by the OECD national accounts meeting in 1981 to read as follows:
A finance lease (sometimes called a full-payment lease) is a contract involving payments over a basic or primary period (during which the agreement cannot be terminated) sufficient in total to cover in full the capital outlay of the lessor together with all subsidiary or financing costs and to give some profit to him. This obligatory period does not exceed the estimated useful life of the asset. The asset is selected by the lessee and delivered to him by the manufacturer. The costs of maintenance and repair, on the subject of the lease, and all risks connected therewith, are borne by the lessee. At the end of the primary lease, the contract may be extended for a further (secondary) period at a much reduced and perhaps purely nominal rental, or the asset may be sold to the lessee at a very low and perhaps purely nominal price, or the asset may be sold to a third party with some, or perhaps most, of the proceeds from the sale being passed on to the lessee as a "rebate of rental."
1 International Accounting Standard, Accounting for Leases (lAS 17), International Accounting Standard Committee, September 1982.
FINANCIAL LEASING 471
Finally, in recent discussions it has been suggested that it would be sufficient to define a financial lease as one that both parties involved view as being merely an alternative to a loan, although this interpretation on its own may be a little too simple and subjective to stand as a definition.
Clearly, all the definitions enumerated above are intended to define the same phenomenon; they are consistent, even if some are more complete than others. The principal difference is between the BPM definition, in which, as a rule of thumb, a lease is a financial lease if it covers three fourths of the cost of the good, and the OECD definition, which requires a financial lease to cover in full the capital outlay of the lessor together with all subsidiary or financing costs and to give some profit to him or her.
Recent discussions have shown that the OECD (100 percent) definition is too restrictive. Financial lease arrangements exist precisely because there are advantages to both parties, particularly in terms of tax concessions or perhaps investment grants, which mean that the contract may not have to cover 100 percent of the market price of the goods. It is therefore recommended that this condition be relaxedfor example, by adopting the 75 percent rule of the BPM.
Borderline Cases
In introducing the new treatment of financial leasing in the SNA, it is also useful to examine the coverage of financial leasing in concrete terms-in terms of the assets and the transactors involved-since certain borderline cases can be numerically quite important.
As regards types of asset, provided that they meet the definition of financial leasing, it is proposed to include all reproducible fixed assets: machinery and equipment of producers, buildings for industrial or commercial purposes, dwellings, and consumer durable goods (especially cars) obtained by households. In the case of machinery, equipment, and buildings of producers, financial leasing is the straightforward alternative to a loan described above. Financial leasing of dwellings is similarly a straightforward alternative to the more usual mortgage loan. Financial leasing of consumer durables is equivalent to hire purchase.
In principle, however, land is excluded because it has a completely different set of characteristics in national accounts. Payments for the use of land are property income, not a service; land does not depreciate, so the residual value is typically greater than the original value, and soon.
472 FINANCIAL FLOWS AND BALANCES
Difficulties arise when the lessor is the manufacturer of the equipment, as frequently occurs in the case of computers and aircraft. The first difficulty is that, even if the period of the primary lease might be long enough to enable the equipment to be amortized, these contracts have often been more akin to operating leasing than to financial leasing because the manufacturer is often responsible for the service and maintenance of the equipment. In addition, of course, the manufacturer only offers such leasing facilities on his own equipment. However, it seems that the trend will increasingly be to separate the provision of the machine from the servicing and provision of the operating system. Therefore, perhaps such long-term leasing of computers and aircraft should be treated as financial leasing.
Second, where leasing facilities are offered by a nonfinancial enterprise (producer or distributor), it is assumed that the unit offering the lease will in general be a separate institutional unit and will maintain a complete set of accounts, so that it can be distinguished from its parent company and will be allocated to the financial institutions sector of the SNA. If, however, parts of nonfinancial enterprises that offer financial leasing contracts cannot be separated in this way, the result would be imputed output of bank services by the nonfinancial enterprise sector, which many experts oppose.
A restriction on the coverage of financial leasing, proposed by the OECD Secretariat for a national accounts meeting in 1983, was that financial leases may only be contracted by producers (including government and private nonprofit institutions serving households) and not by households. The reasons for this restriction were not made clear. They may relate to the impact on gross domestic product (GOP) when the rental payments are in final demand, not in intermediate consumption (see Tables 2-4). However, this reasoning would also exclude international financial leasing. Alternatively, the restriction may have been prompted by the mixed nature of what in some countries are called financial leasing arrangements for the purchase of cars, which include a substantial component of servicing, possibly insurance on the car, and so on. It is proposed here that so long as the definition of financial leasing is met by the contract, leasing of consumer durables by households should not be excluded.
II. Proposed Treatment of Financial Leasing in the SNA Accounts and Balance Sheets
It is proposed that the acquisition of capital goods under financial leasing arrangements should be treated as follows in the accounts, balance sheets, and input-output tables.
FINANCIAL LEASING 473
Details of the Proposed Treatment
• At the time the primary lease is signed, the lessee (user) is treated as having bought the capital asset; its value appears in his or her gross fixed capital formation and, hence, in his or her capital stock and as a fixed asset in his or her balance sheet. Consumption of fixed capital in respect of the asset is also allocated to the user.
• The acquisition of the asset is financed by a loan from the lessor to the lessee, recorded in their respective capital finance and financial balance-sheet accounts.
• The rental payment no longer appears as such anywhere in the system. It is split into two parts: first, interest on the loan, recorded as payments and receipts in the income and outlay account; second, repayment of the loan, recorded in the capital finance account.
• The lessor (the institution providing the loan) should henceforth be classified as a financial institution, not as a nonfinancial enterprise. Even if the lessor is not a bank but an industrial or commercial enterprise, the unit arranging the lease will in general maintain a complete set of accounts so that it can be distinguished from its parent company and treated as a separate financial enterprise.
• In the industry classification, too, units providing financial leasing facilities should be separated from other forms of letting and leasing and should be grouped with credit and insurance. This change has already been made in the newly revised International Standard Industrial Classification (ISiq,2 where ISIC 813, "Credit granting," includes financial leasing, whereas ISIC 84, "Renting," excludes it.
• The output of units providing financial leasing facilities is to be valued-analogously to that of other financial institutions-by the difference between the property income received (other than income from the investment of their own funds) and the interest paid to creditors.
• If there are any taxes (for example, value-added tax) actually levied on the rental payments that the above treatment has disposed of, these taxes are treated as taxes on the imputed bank service charge.
• As regards the valuation of leased goods under a financial leasing contract, the full equivalent of the market value of the good should be recorded in the capital account, and an offsetting entry should appear
2 United Nations, International Standard Industrial Classification of All Economic Activities, Statistical Papers, Series M, No.4, Rev. 3 (New York, 1986).
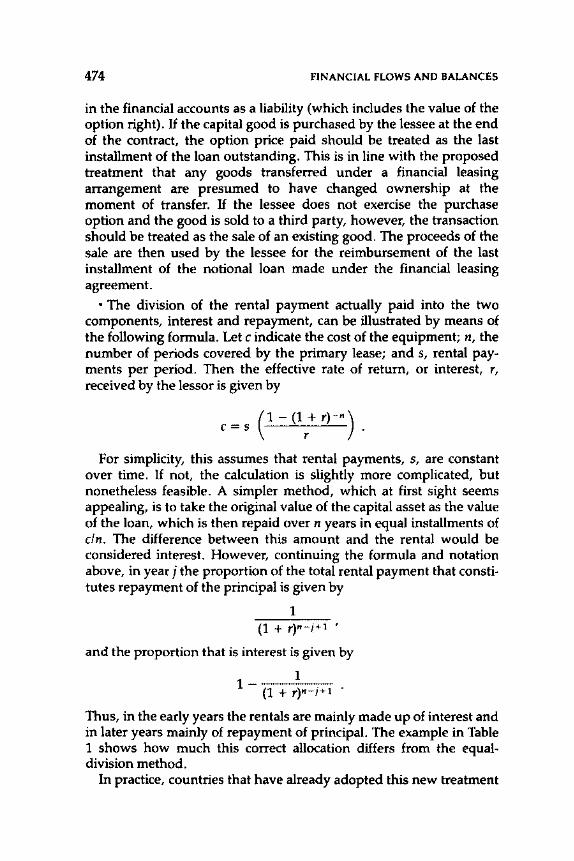
474 FINANCIAL FLOWS AND BALANCES
in the financial accounts as a liability (which includes the value of the option right). If the capital good is purchased by the lessee at the end of the contract, the option price paid should be treated as the last installment of the loan outstanding. This is in line with the proposed treatment that any goods transferred under a financial leasing arrangement are presumed to have changed ownership at the moment of transfer. If the lessee does not exercise the purchase option and the good is sold to a third party, however, the transaction should be treated as the sale of an existing good. The proceeds of the sale are then used by the lessee for the reimbursement of the last installment of the notional loan made under the financial leasing agreement.
• The division of the rental payment actually paid into the two components, interest and repayment, can be illustrated by means of the following formula. Let c indicate the cost of the equipment; n, the number of periods covered by the primary lease; and s, rental payments per period. Then the effective rate of return, or interest, r, received by the lessor is given by
(1- (1 + r)-n)
c=s r
For simplicity, this assumes that rental payments, s, are constant over time. If not, the calculation is slightly more complicated, but nonetheless feasible. A simpler method, which at first sight seems appealing, is to take the original value of the capital asset as the value of the loan, which is then repaid over n years in equal installments of cln. The difference between this amount and the rental would be considered interest. However, continuing the formula and notation above, in year j the proportion of the total rental payment that constitutes repayment of the principal is given by
1 (1 + r)n-j+1 '
and the proportion that is interest is given by
1- 1 (1 + r)n-j+1
Thus, in the early years the rentals are mainly made up of interest and in later years mainly of repayment of principal. The example in Table 1 shows how much this correct allocation differs from the equaldivision method.
In practice, countries that have already adopted this new treatment
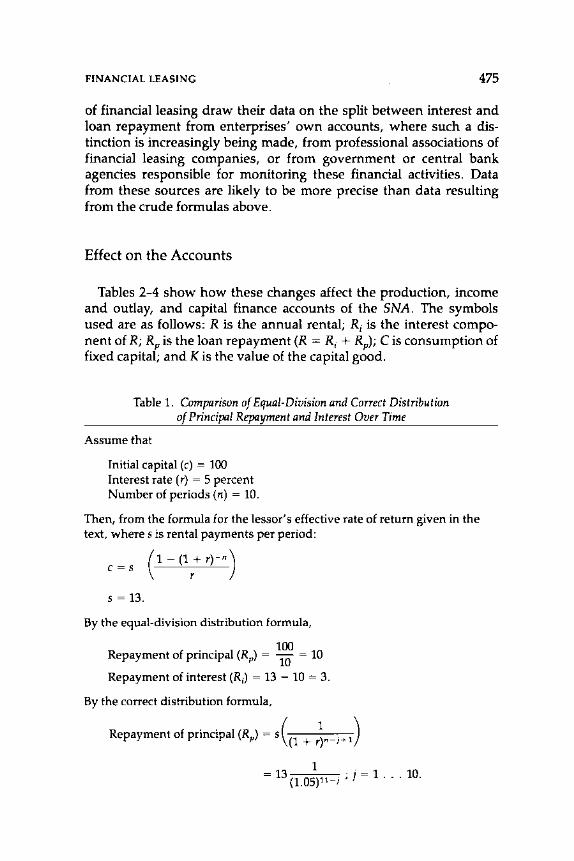
FINANCIAL LEASING 475
of financial leasing draw their data on the split between interest and loan repayment from enterprises' own accounts, where such a distinction is increasingly being made, from professional associations of financial leasing companies, or from government or central bank agencies responsible for monitoring these financial activities. Data from these sources are likely to be more precise than data resulting from the crude formulas above.
Effect on the Accounts
Tables 2-4 show how these changes affect the production, income and outlay, and capital finance accounts of the SNA. The symbols used are as follows: R is the annual rental; Ri is the interest component of R; RP is the loan repayment (R = Ri + Rp); Cis consumption of fixed capital; and K is the value of the capital good.
Table 1. Comparison of Equal-Division and Correct Distribution of Principal Repayment and Interest Over Time
Assume that
Initial capital (c) = 100 Interest rate (r) = 5 percent Number of periods (n) = 10.
Then, from the formula for the lessor's effective rate of return given in the text, where sis rental payments per period:
(1- (1 + r)-n)
c=s r
s = 13.
By the equal-division distribution formula,
Repayment of principal (Rp) = 1
1~ = 10
Repayment of interest (R;) = 13 - 10 = 3.
By the correct distribution formula,
Repaymentofprincipal(Rp) = sC1 + r~n-;+ 1 ) = 13 (1.0;)11-j ; j = 1 ... 10.
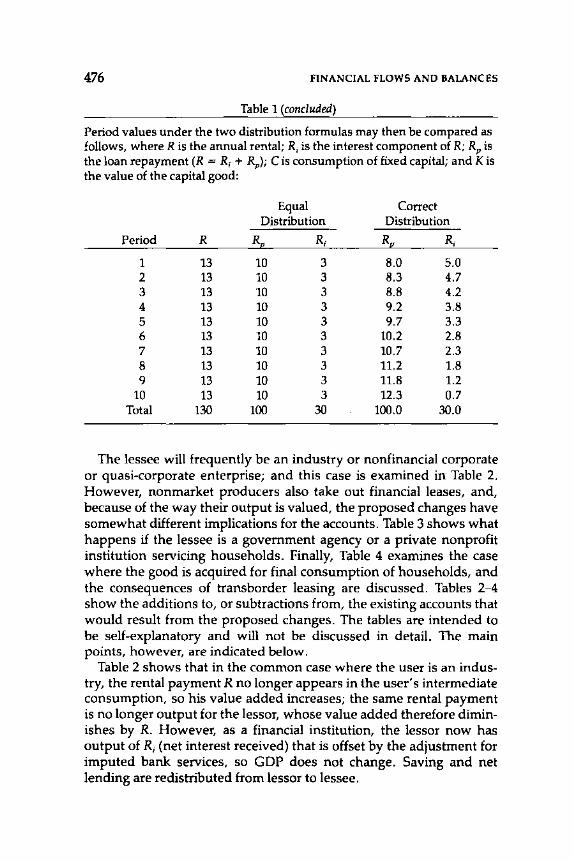
476 FINANCIAL FLOWS AND BALANCES
Table 1 (concluded)
Period values under the two distribution formulas may then be compared as follows, where R is the annual rental; R; is the interest component of R; RP is the loan repayment (R = R; + Rp); Cis consumption of fixed capital; and K is the value of the capital good:
Equal Correct Distribution Distribution
Period R R R; R R;
1 13 10 3 8.0 5.0 2 13 10 3 8.3 4.7 3 13 10 3 8.8 4.2 4 13 10 3 9.2 3.8 5 13 10 3 9.7 3.3 6 13 10 3 10.2 2.8 7 13 10 3 10.7 2.3 8 13 10 3 11.2 1.8 9 13 10 3 11.8 1.2
10 13 10 3 12.3 0.7 Total 130 100 30 100.0 30.0
The lessee will frequently be an industry or nonfinancial corporate or quasi-corporate enterprise; and this case is examined in Table 2. However, nonmarket producers also take out financial leases, and, because of the way their output is valued, the proposed changes have somewhat different implications for the accounts. Table 3 shows what happens if the lessee is a government agency or a private nonprofit institution servicing households. Finally, Table 4 examines the case where the good is acquired for final consumption of households, and the consequences of transborder leasing are discussed. Tables 2-4 show the additions to, or subtractions from, the existing accounts that would result from the proposed changes. The tables are intended to be self-explanatory and will not be discussed in detail. The main points, however, are indicated below.
Table 2 shows that in the common case where the user is an industry, the rental payment R no longer appears in the user's intermediate consumption, so his value added increases; the same rental payment is no longer output for the lessor, whose value added therefore diminishes by R. However, as a financial institution, the lessor now has output of R; (net interest received) that is offset by the adjustment for imputed bank services, so GOP does not change. Saving and net lending are redistributed from lessor to lessee.
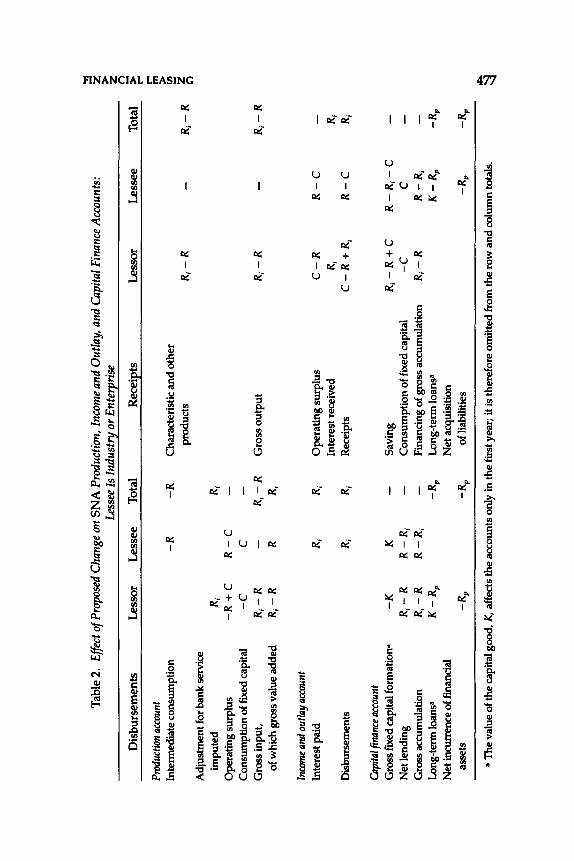
Tab
le 2
. Ef
fect
of P
ropo
sed
Cha
nge
on S
NA
Pro
duct
ion,
Inc
ome
and
Out
lay,
and
Cap
ital F
inan
ce A
ccou
nts:
~ z
Less
ee Is
Ind
ustr
y or
Ent
erpr
ise
> z ('
)
Dis
bu
rsem
ents
L
esso
r L
esse
e T
otal
R
ecei
pts
L
esso
r L
esse
e T
otal
>
r"
Prod
uctio
n ac
coun
t (;;
>
Inte
rmed
iate
con
sum
ptio
n -R
-R
C
hara
cter
isti
c an
d o
ther
(I
)
prod
ucts
R
;-R
-
R;-
R
z C1
Adj
ustm
ent f
or b
ank
serv
ice
impu
ted
R;
R;
Ope
rati
ng s
urpl
us
-R +
C
R-C
C
onsu
mpt
ion
of fi
xed
capi
tal
-c
c G
ross
inpu
t,
R;-
R
-R;
-R
G
ross
out
put
R;-
R
-R
;-R
of
whi
ch g
ross
val
ue a
dded
R;
-R
R
R;
Inco
me a
nd o
utla
y acc
ount
In
tere
st p
aid
R;
R;
Ope
rati
ng s
urpl
us
C-R
R
-C
In
tere
st re
ceiv
ed
R;
R;
Dis
burs
emen
ts
R;
R;
Rec
eipt
s C
-R+
R;
R-C
R;
Capi
tal f
inan
ce a
ccou
nt
Gro
ss fi
xed
capi
tal f
orm
atio
n•
-K
K
-S
avin
g R
;-R
+C
R
-R;-
C
Net
lend
ing
R; -
R
R-R
; -
Con
sum
ptio
n of
fixe
d ca
pita
l -c
c
Gro
ss a
ccum
ulat
ion
R;-
R
R -
R;
-F
inan
cing
of g
ross
acc
umul
atio
n R
;-R
R
-R
; L
ong-
term
loan
s•
K-
RP
-RP
L
ong-
term
loan
s•
K -
RP
-R
P
Net
incu
rren
ce o
f fin
anci
al
Net
acq
uisi
tion
as
sets
-R
P
-RP
of
liab
ilitie
s -R
P
-RP
.... •
The
val
ue o
f the
cap
ital
goo
d, K
, aff
ects
the
acc
ount
s on
ly i
n th
e fi
rst y
ear;
it i
s th
eref
ore
omit
ted
from
the
row
and
col
umn
tota
ls.
:::.)
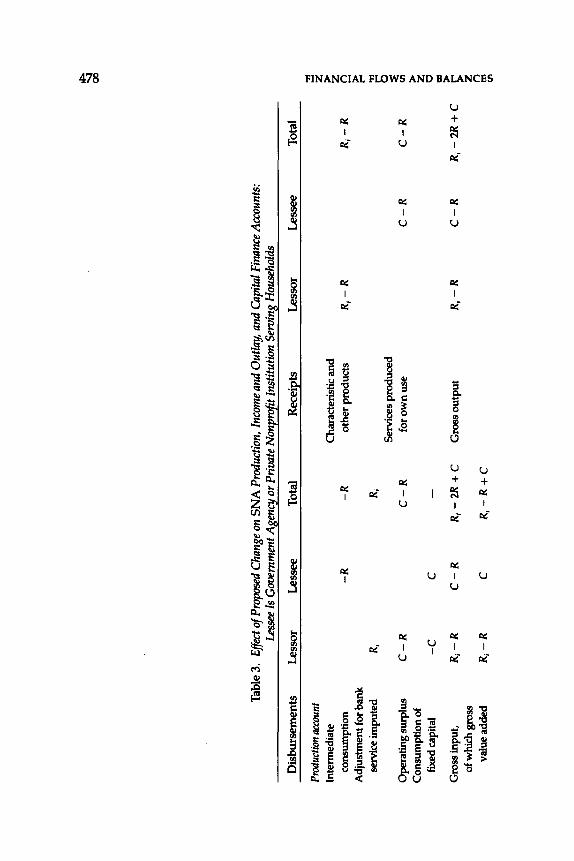
~
Tab
le 3
. Ef
fect
of P
ropo
sed
Cha
nge
on S
NA
Pro
duct
ion,
Inc
ome
and
Out
lay,
and
Cap
ital F
iruzn
ce A
ccou
nts:
Le
ssee
Is G
over
nmen
t Ag_
ency
or P
rivat
e No
npro
[!.t
Inst
itutio
n Se
rvin
g_ H
ouse
hold
s
Dis
burs
emen
ts
Les
sor
Les
see
Tot
al
Rece
i~ts
L
esso
r L
esse
e T
otal
"" Pr
oduc
tion
acco
unt
z In
term
edia
te
Cha
ract
eris
tic
and
> z
cons
umpt
ion
-R
-R
othe
r pro
duct
s R
;-R
R
;-R
(1
Adj
ustm
ent f
or b
ank
>
I'"'
serv
ice
impu
ted
R;
R;
"" 6 Se
rvic
es p
rodu
ced
~
Ope
rati
ng s
urpl
us
C-R
C
-R
foro
wn
use
C
-R
C-R
U
l
Con
sum
ptio
n of
>
z fix
ed c
apita
l -c
c
-0 =
G
ross
inpu
t,
R;-
R
R;-
2R
+C
>
C
-R
R;-
2R
+C
G
ross
out
put
R;-
R
C-R
s:
of w
hich
gro
ss
z (1
valu
e ad
ded
R;-
R
c R
;-R
+ C
1!'
1 U
l
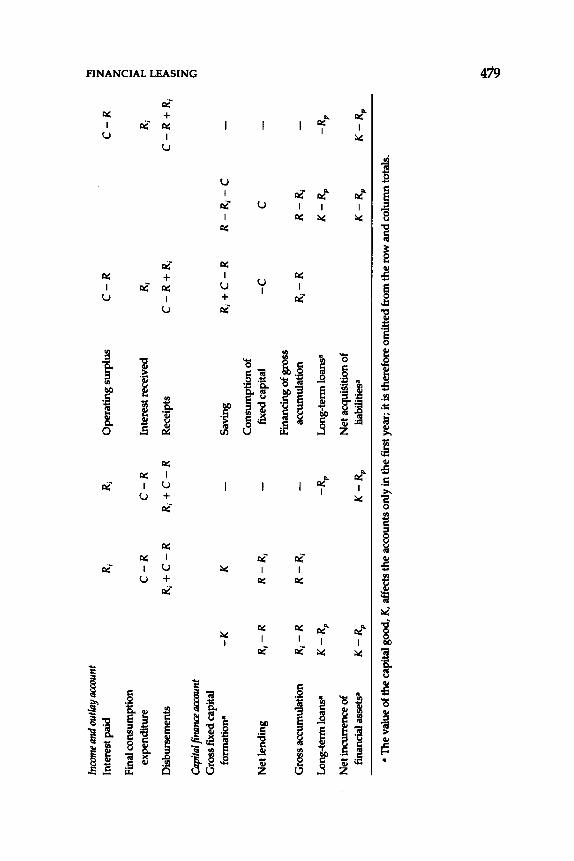
Inco
me
and
outll
ly a
ccou
nt
., z In
tere
st p
aid
R;
R;
Op
erat
ing
su
rplu
s C
-R
C-R
>
z F
inal
con
sum
ptio
n n >
ex
pend
itur
e C
-R
C-R
In
tere
st re
ceiv
ed
R;
R;
I""
I""
1'11
Dis
burs
emen
ts
R;+
C-R
R;
+ C
-R
R
ecei
pts
C-R
+R
; C
-R+
R;
>
til z
Cap
ital f
inan
ce a
ccou
nt
C)
Gro
ss fi
xed
capi
tal
fonn
atio
n•
-K
K
-S
avin
g R
;+C
-R
R-R
;-C
Co
nsu
mp
tio
n o
f N
et le
ndin
g R;
-R
R
-R;
-fix
ed c
apit
al
-c
c F
inan
cing
of g
ross
G
ross
acc
umul
atio
n R
;-R
R
-R;
-ac
cum
ulat
ion
R;-
R
R-R
;
Lon
g-te
nn lo
ans•
K
-RP
-R
P
Lo
ng
-ten
n lo
ans•
K
-RP
-R
P
Net
incu
rren
ce o
f N
et a
cqui
siti
on o
f fi
nanc
ial a
sset
s•
K -
RP
K
-RP
li
abil
itie
s•
K-R
P
K-R
P
• T
he v
alue
of t
he
capi
tal g
ood,
K, a
ffec
ts th
e ac
coun
ts o
nly
in th
e fir
st y
ear;
it i
s th
eref
ore
omit
ted
from
th
e ro
w a
nd
co
lum
n to
tals
.
~
~
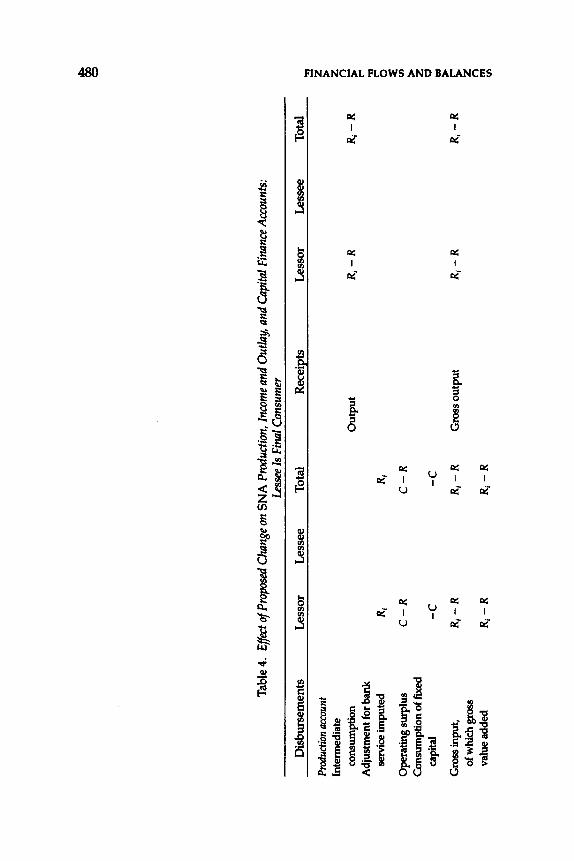
~
Tab
le 4
. Ef
fect
of P
ropo
sed
Cha
nge
on S
NA
Pro
duct
ion,
Inc
ome
and
Out
lay,
and
Olp
ital F
inan
ce A
ccou
nts:
Le
ssee
Is F
inal
Con
sum
er
Dis
burs
emen
ts
Les
sor
Les
see
Tot
al
Rec
eipt
s L
esso
r L
esse
e T
otal
"!
!
Prod
uctio
n ac
coun
t z >
In
term
edia
te
z n co
nsum
ptio
n O
utp
ut
R,-
R
R,-
R
>
Adj
ustm
ent f
or b
ank
I"'
"!!
serv
ice
impu
ted
R,
R,
I"'
0 ~
Ope
rati
ng s
urpl
us
C-R
C
-R
f/1 >
Con
sum
ptio
n of
fixe
d z
capi
tal
-c
-c
c 1:11 >
Gro
ss in
put,
R
,-R
R,
-R
G
ross
ou
tpu
t R
,-R
R
,-R
s:
of w
hich
gro
ss
z n va
lue
add
ed
R, -
R
R,-
R
1ft
f/1
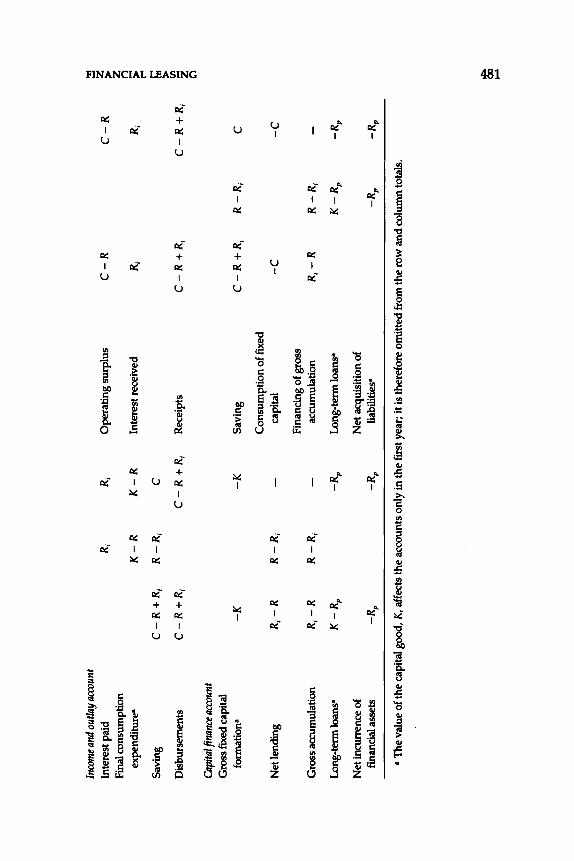
Inco
me a
nd o
utla
y acc
ount
"l
l z In
tere
st p
aid
R;
R;
Ope
rati
ng s
urpl
us
C-R
C
-R
>
Fina
l con
sum
ptio
n z n
expe
ndit
urea
K
-R
K-R
In
tere
st re
ceiv
ed
R;
R;
>
1:""
Sav
ing
C-
R +
R;
R-R
; c
!;j >
Dis
burs
emen
ts
C-R
+R
; C
-R+
R;
Rec
eipt
s C
-R+
R;
C-R
+R
; ti
l z C')
Cap
ital f
inan
ce a
ccou
nt
Gro
ss fi
xed
capi
tal
form
atio
n•
-K
-K
Sav
ing
C-
R +
R;
R -
R;
c C
onsu
mpt
ion
of fi
xed
Net
lend
ing
R;-
R
R -
R;
-ca
pita
l -c
-c
F
inan
cing
of g
ross
G
ross
acc
umul
atio
n R
;-R
R
-R;
-ac
cum
ulat
ion
R;-
R
R -
R;
Lon
g-te
rm lo
ans•
K
-R
P
-RP
L
ong-
term
loan
s•
K-R
P
-RP
Net
incu
rren
ce o
f N
et a
cqui
siti
on o
f fi
nanc
ial a
sset
s -R
P
-RP
lia
bilit
ies•
-R
P
-RP
• T
he v
alue
of t
he c
apit
al g
ood,
K,
affe
cts
the
acco
unts
onl
y in
the
firs
t ye
ar;
it is
the
refo
re o
mit
ted
from
the
row
an
d c
olum
n to
tals
.
~
.......
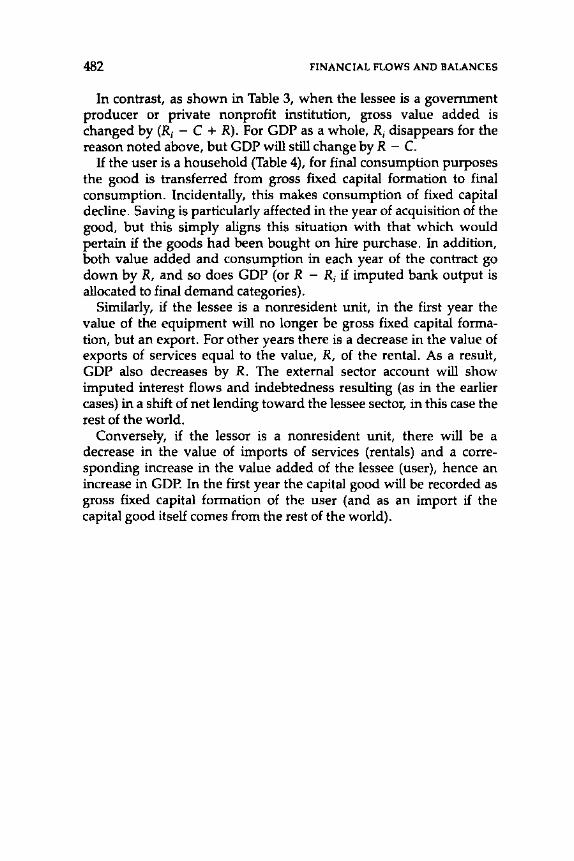
482 FINANCIAL FLOWS AND BALANCES
In contrast, as shown in Table 3, when the lessee is a government producer or private nonprofit institution, gross value added is changed by (R; - C + R). For GOP as a whole, R; disappears for the reason noted above, but GOP will still change by R - C.
H the user is a household (Table 4), for final consumption purposes the good is transferred from gross fixed capital formation to final consumption. Incidentally, this makes consumption of fixed capital decline. Saving is particularly affected in the year of acquisition of the good, but this simply aligns this situation with that which would pertain if the goods had been bought on hire purchase. In addition, both value added and consumption in each year of the contract go down by R, and so does GOP (orR - R; if imputed bank output is allocated to final demand categories).
Similarly, if the lessee is a nonresident unit, in the first year the value of the equipment will no longer be gross fixed capital formation, but an export. For other years there is a decrease in the value of exports of services equal to the value, R, of the rental. As a result, GOP also decreases by R. The external sector account will show imputed interest flows and indebtedness resulting (as in the earlier cases) in a shift of net lending toward the lessee sector, in this case the rest of the world.
Conversely, if the lessor is a nonresident unit, there will be a decrease in the value of imports of services (rentals) and a corresponding increase in the value added of the lessee (user), hence an increase in GOP. In the first year the capital good will be recorded as gross fixed capital formation of the user (and as an import if the capital good itself comes from the rest of the world).
27
Treatment of Deep-Discounted and Index-Linked Bonds in the National Accounts
BRIAN NEWSON AND 5oREN BRODERSEN
I NDEX-LINKED securities and deep-discounted bonds take a variety of forms but have one significant feature in common. In both, the
asset carries only a fairly low explicit rate of interest (say 0 percent to 2 percent), but the holder of the security is guaranteed some upward revaluation of the principal invested during or at the end of the term of the security.
I. The Problems Posed
For the United Nations' A System of National Accounts (SNA), the question then is whether this upward revaluation should be shown in the reconciliation account or as interest in the income and outlay account, possibly distributed over the lifetime of the bond.
This paper is based on experience in the European Community (EC) in the 1970s and 1980s, particularly in the United Kingdom and Denmark, where the "imputed" interest payments represented as much as 8 percent of gross domestic product (GOP). The issue, however, would appear to be important for a wide range of countries in conditions of inflation.
Deep-Discounted Bonds
Deep-discounted bonds are bonds with a maturity of several years that are issued at a price substantially below their redemption value, sometimes as little as 50 percent of the redemption price. This arrangement is associated with a very low-or even zero-explicit rate
483
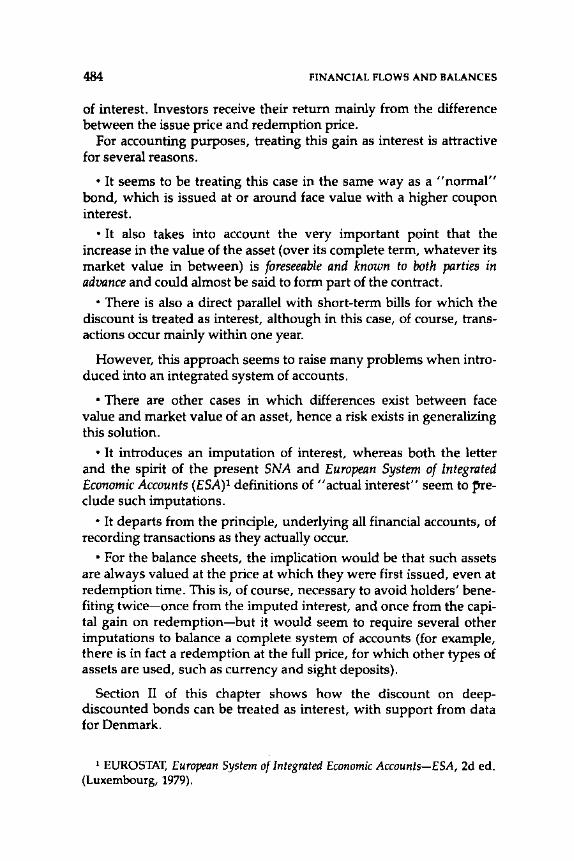
484 FINANCIAL FLOWS AND BALANCES
of interest. Investors receive their return mainly from the difference between the issue price and redemption price.
For accounting purposes, treating this gain as interest is attractive for several reasons.
• It seems to be treating this case in the same way as a "normal" bond, which is issued at or around face value with a higher coupon interest.
• It also takes into account the very important point that the increase in the value of the asset (over its complete term, whatever its market value in between) is foreseeable and known to both parties in advance and could almost be said to form part of the contract.
• There is also a direct parallel with short-term bills for which the discount is treated as interest, although in this case, of course, transactions occur mainly within one year.
However, this approach seems to raise many problems when introduced into an integrated system of accounts.
• There are other cases in which differences exist between face value and market value of an asset, hence a risk exists in generalizing this solution.
• It introduces an imputation of interest, whereas both the letter and the spirit of the present SNA and European System of Integrated Economic Accounts (ESA)l definitions of "actual interest" seem to preclude such imputations.
• It departs from the principle, underlying all financial accounts, of recording transactions as they actually occur.
• For the balance sheets, the implication would be that such assets are always valued at the price at which they were first issued, even at redemption time. This is, of course, necessary to avoid holders' benefiting twice-once from the imputed interest, and once from the capital gain on redemption-but it would seem to require several other imputations to balance a complete system of accounts (for example, there is in fact a redemption at the full price, for which other types of assets are used, such as currency and sight deposits).
Section II of this chapter shows how the discount on deepdiscounted bonds can be treated as interest, with support from data for Denmark.
1 EUROSTAT, European System of Integrated Economic Accounts-ESA, 2d ed. (Luxembourg, 1979).
DISCOUNTED AND INDEXED BONDS 485
Index-Linked Securities
Various index-linked savings schemes were developed in the United Kingdom in the inflationary conditions of the 1970s.2 They were designed to protect the capital of small investors-indeed, the first example was government savings certificates known as "Granny bonds" that were available only to old-age pensioners. However, index-linked financial assets also exist in other countries and other sectors.
The basic mechanism is that the investor receives a small nominal interest rate (0 percent to 2 percent), but the value of his or her asset increases in line with some price index. Frequently a general retail price index is used, but it could also be an index related to the purposes of the investment, such as an index of housing costs or even of foreign exchange rates. Frequently, too, the whole gain from indexation is only obtained if the investment is maintained for the whole contract period (for example, five years). That is, early redemption is penalized by being granted at a less favorable rate. (This is therefore not the same as actual payment of interest at a rate defined as "2 percent plus the rate of inflation.")
There is no disagreement about how to record the initial investment and all interest actually received in the period when they do in fact happen (that is, in the same way as for non-index-linked assets of the same type). The problem is how to treat the index-linked increase in the value of the asset itself. Three treatments of the index-linked component seem possible.
• Because there is a revaluation of the principal invested without any transaction occurring, the most obvious solution is to record this upward revaluation only in the reconciliation account.
• The increase in the value of the investment that results from indexation could be counted as a capital transfer. Such a treatment is already accorded to nonrecurrent bonus payments on savings granted by general government to households to reward them for their saving carried out over a number of years.
• The United Kingdom opted to record the increase in value of the asset as interest. This treatment portrays such assets in a way similar to the normal case of high nominal interest. It does, however, add two imputations: of interest paid out to the household, and of rein-
2 For an excellent discussion, see "The National Accounts Treatment of Index-Linked Bonds," in Economic Trends (London: Central Statistical Office, February 1984).
486 FINANCIAL FLOWS AND BALANCES
vestment of the same amount in the asset in order to show in the balance sheet the increasing claim and liability of households and government, respectively.
Time of Recording
For both deep-discounted bonds and index-linked securities, it frequently occurs that the capital revaluation is only available to the creditor at the end of the contract period. However, in both cases the value is known (in advance, for deep-discounted bonds; when the price index is published, for index-linked securities). Thus, the imputed interest could be distributed over the life of the asset.
Most experts advocate showing this gradual increase in the value of the asset and liability. It is true that for individual contracts there frequently is no legal.liability for the debtor until the end of the term; indeed, early redemption, if allowed, takes place at much less advantageous terms. However, since only a very small proportion of contracts are prematurely terminated, in general it is probably more reasonable to treat outstanding claims as accruing in line with the price index throughout the period.
The Crucial Argument
In discussions within the EC Working Party on National Accounts in 1984, 1986, and 1988, experts have been fairly equally divided. Roughly half of these advocated recording transactions as they actually occur and so would record all these revaluations in the reconciliation account, but separately identified so that analysts could combine them with actual interest payments for specific analyses.
Other experts considered that these revaluations are a mechanism of equivalent effect to more traditional interest and should be portrayed accordingly. The argument for this behavioral view essentially rests on how creditors and debtors perceive their capital gain. Recording it as interest raises disposable income and saving, although it is not actually available to the household. Do households behave as if their capital gain were interest, a capital transfer, or a revaluation?
One vital characteristic of deep-discounted bonds-and, to some extent, of index-linked securities-is that increases in the value of assets and liabilities are foreseeable, guaranteed, and known to both parties in advance and, thus, could be regarded as part of the initial contract. These gains are therefore different in nature from normal
DISCOUNTED AND INDEXED BONDS 487
holding gains and losses arising from changes in market prices of assets, which generally do not affect the liability of the debtor.
II. The Concepts in Practice
In both the SNA and the ESA, the transaction date for interest is, as a general rule, the date on which the interest falls due. For discounts and upward revaluations of the nominal values of index-linked bonds, this means that the amounts due are accrued up to the date when the bond is redeemed.
Accrual of Discounts and Index-Linked Revaluations as Interest
Because bonds are issued in series that are often redeemed by being called (or "drawn") as and when the borrowers pay installments, th~ discounts and index-linked revaluations have to be divided up over time in line with the installment schedule of the bond series. This is illustrated in Table 1, which shows Danish kroner bonds broken down by borrower sector over the period 1982-86. It can be seen from the table that the special installment schedules for government bonds led to a sharp rise in the interest element between 1982 and 1983. The considerable fluctuations in market rates of interest and bond prices during the period 1982 to 1986 had no noticeable effect on the figures shown. However, the fact that market interest rates and the specified bond interest rate move closer together toward the end of the period will lessen the impact of the distributed discount over a period of years. But because the first index-linked bonds of any importance in Denmark were not issued until1982, the upward revaluation through indexing has not yet begun to have any significant effect on the redemption of bonds, although it will be of considerable importance in a few years' time. Whether this interest element will be of greater or lesser significance for the Danish economy in the future will depend, among other things, on the future level of inflation.3
The following paragraphs show how the overall system of accounts-from opening balance to closing balance via the distribution and use of income accounts, financial account, and revaluation
3 The actual procedures used in Danish national accounts for the accrual of discounts as interest are described in "How Discounting on Bonds Is Dealt with in the Danish National Accounts," Annex to Document Bl/CN/59 (Luxembourg: EUROSTAT, 1984).
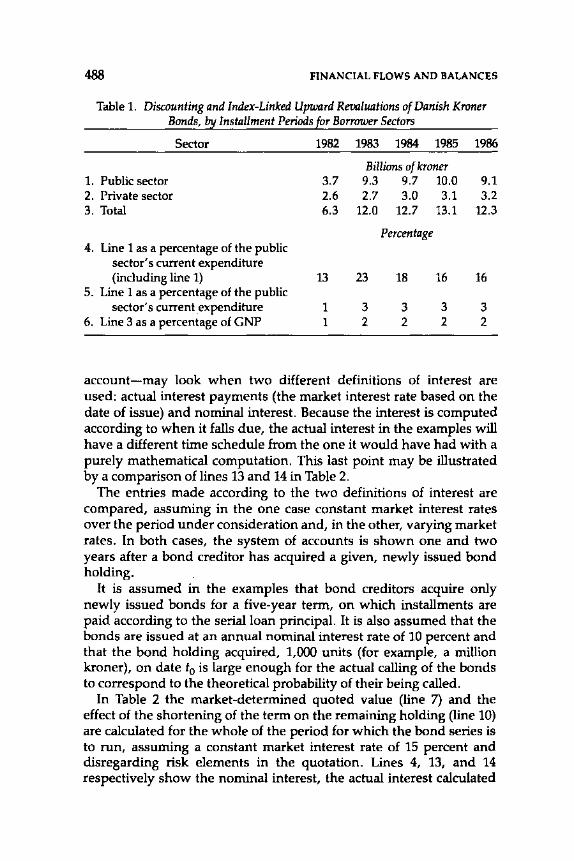
488 FINANCIAL FLOWS AND BALANCES
Table 1. Discounting and Index-Linked Upward Revaluations of Danish Kroner Bonds, by Installment Periods for Borrower Sectors
Sector 1982 1983 1984 1985 1986
Billions of kroner 1. Public sector 3.7 9.3 9.7 10.0 9.1 2. Private sector 2.6 2.7 3.0 3.1 3.2 3. Total 6.3 12.0 12.7 13.1 12.3
Percentage 4. Line 1 as a percentage of the public
sector's current expenditure (including line 1) 13 23 18 16 16
5. Line 1 as a percentage of the public sector's current .expenditure 1 3 3 3 3
6. Line 3 as a percentage of GNP 1 2 2 2 2
account-may look when two different definitions of interest are used: actual interest payments (the market interest rate based on the date of issue) and nominal interest. Because the interest is computed according to when it falls due, the actual interest in the examples will have a different time schedule from the one it would have had with a purely mathematical computation. This last point may be illustrated by a comparison of lines 13 and 14 in Table 2.
The entries made according to the two definitions of interest are compared, assuming in the one case constant market interest rates over the period under consideration and, in the other, varying market rates. In both cases, the system of accounts is shown one and two years after a bond creditor has acquired a given, newly issued bond holding.
It is assumed in the examples that bond creditors acquire only newly issued bonds for a five-year term, on which installments are paid according to the serial loan principal. It is also assumed that the bonds are issued at an annual nominal interest rate of 10 percent and that the bond holding acquired, 1,000 units (for example, a million kroner), on date t0 is large enough for the actual calling of the bonds to correspond to the theoretical probability of their being called.
In Table 2 the market-determined quoted value (line 7) and the effect of the shortening of the term on the remaining holding (line 10) are calculated for the whole of the period for which the bond series is to run, assuming a constant market interest rate of 15 percent and disregarding risk elements in the quotation. Lines 4, 13, and 14 respectively show the nominal interest, the actual interest calculated
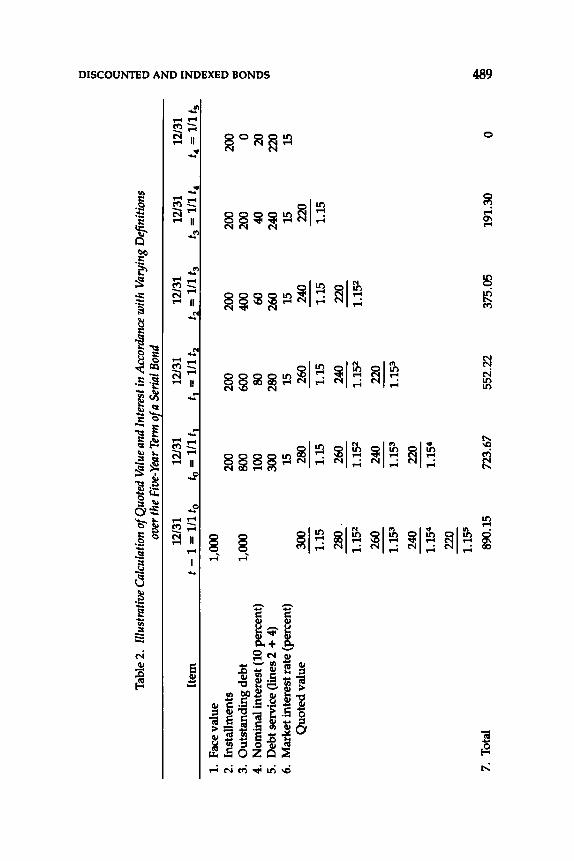
t:l u; ('
) 0 c:: z T
able
2.
Illus
trat
ive
Cal
cula
tion
of Q
uote
d Va
lue
and
Inte
rest
in A
ccor
danc
e w
ith V
aryi
ng D
efin
ition
s ;!
t:l
ov
er th
e Fi
ve-Y
ear
Term
of a
Ser
ial B
ond
> z
12/3
1 12
/31
12/3
1 12
/31
12/3
1 12
/31
t:l
Item
t-
1 =
111
t 0
t 0 =
1/1
t1
tl =
1/1
t2
t2 =
1/1
t3
t3 =
1/1
t4
t 4 =
1/1
t 5
z t:l
II!
1. F
ace
valu
e 1,
000
)(
II!
2.
Inst
allm
ents
20
0 20
0 20
0 20
0 20
0 t:l
1:1
:1 3.
Ou
tsta
nd
ing
deb
t 1,
000
BOO
600
400
200
0 0 z
4.
Nom
inal
inte
rest
(10
perc
ent)
10
0 80
60
40
20
t:l
5.
D
ebt s
ervi
ce (
line
s 2
+ 4
) 30
0 28
0 26
0 24
0 22
0 II
)
6.
Mar
ket i
nter
est r
ate
(per
cent
) 15
15
15
15
15
Q
uo
ted
val
ue
300
280
260
240
220
--
--
--
--
--
1.15
1.
15
1.15
1.
15
1.15
28
0.
260
240
220
--
--
--
-1.
152
1.15
2 1.
152
1.15
2
260
240
220
--
--
-1.
153
1.15
3 1.
153
240
220
--
-1.
154
1.15
4
220
--
1.15
5
7.
Tot
al
890.
15
723.
67
552.
22
375.
05
191.
30
0 ~
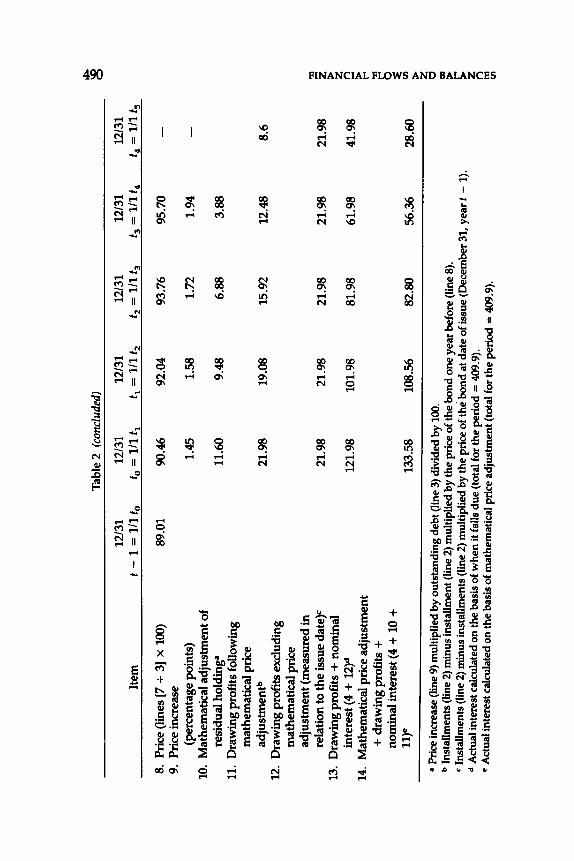
Tab
le 2
(co
nclu
ded)
~
12/3
1 12
/31
12/3
1 12
/31
12/3
1 12
/31
Item
t-
1 =
1/1
t 0
t 0 =
1/1
t1
tl =
1/1
t2
t2 =
1/1
t3
t3 =
1/1
t.
t 4 =
1/1
t 5
8.
Pri
ce (
line
s [7
+ 3
] x
100)
89
.01
90.4
6 92
.04
93.7
6 95
.70
9. P
rice
incr
ease
(p
erce
ntag
e po
ints
) 1.
45
1.58
1.
72
1.94
10
. M
athe
mat
ical
adj
ustm
ent o
f re
sidu
al h
oldi
ng"
11.6
0 9.
48
6.88
3.
88
11.
Dra
win
g pr
ofit
s fo
llow
ing
mat
hem
atic
al p
rice
ad
just
men
tb
21.9
8 19
.08
15.9
2 12
.48
8.6
12.
Dra
win
g pr
ofit
s ex
clud
ing
mat
hem
atic
al p
rice
ad
just
men
t (m
easu
red
in
"JJ
rela
tion
to th
e is
sue
date)
<=
21.9
8 21
.98
21.9
8 21
.98
21.9
8 z >
13
. D
raw
ing
prof
its
+ n
omin
al
z in
tere
st (4
+ 1
2)d
121.
98
101.
98
81.9
8 61
.98
41.9
8 t"
l >
14.
Mat
hem
atic
al p
rice
adj
ustm
ent
I""
"JJ
+ d
raw
ing
prof
its
+
6 no
min
al in
tere
st (4
+ 1
0 +
~
11)e
13
3.58
10
8.56
82
.80
56.3
6 28
.60
~ > z
• Pr
ice
incr
ease
(lin
e 9)
mul
tipl
ied
by
out
stan
ding
deb
t (li
ne 3
) di
vide
d by
100
. 0 =
b
Inst
allm
ents
(lin
e 2)
min
us in
stal
lmen
t (li
ne 2
) m
ulti
plie
d by
the
pric
e of
the
bo
nd
one
yea
r bef
ore
(lin
e 8)
. >
c
Inst
allm
ents
(lin
e 2)
min
us in
stal
lmen
ts (l
ine
2) m
ulti
plie
d by
the
pric
e of
the
bo
nd
at d
ate
of is
sue
(Dec
embe
r 31,
yea
r t
-1)
. >
d
Act
ual i
nter
est c
alcu
late
d on
the
bas
is o
f wh
en it
fal
ls d
ue
(tot
al fo
r th
e p
erio
d=
409
.9).
z t"
l e
Act
ual i
nter
est c
alcu
late
d on
the
bas
is o
f mat
hem
atic
al p
rice
adj
ustm
ent (
tota
l for
th
e pe
riod
= 4
09.9
).
l:rl ~
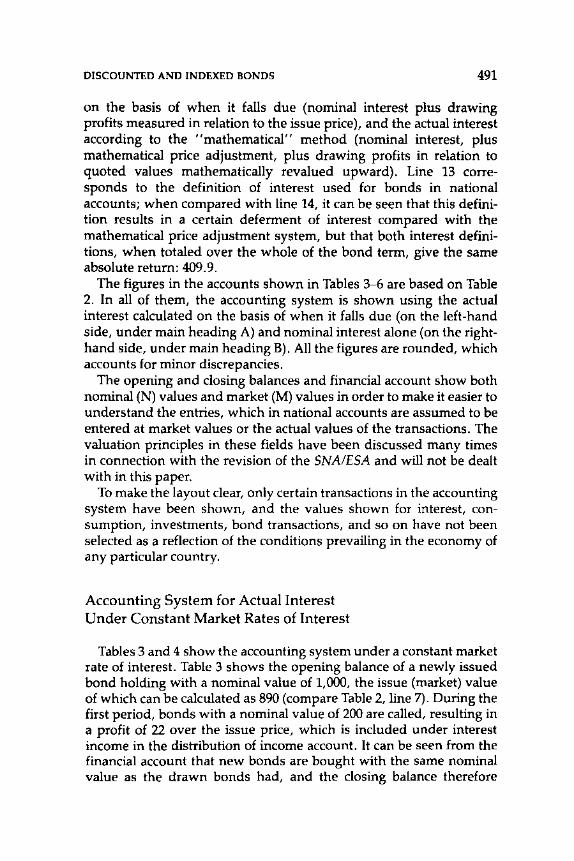
DISCOUNTED AND INDEXED BONDS 491
on the basis of when it falls due (nominal interest plus drawing profits measured in relation to the issue price), and the actual interest according to the "mathematical" method (nominal interest, plus mathematical price adjustment, plus drawing profits in relation to quoted values mathematically revalued upward). Line 13 corresponds to the definition of interest used for bonds in national accounts; when compared with line 14, it can be seen that this definition results in a certain deferment of interest compared with the mathematical price adjustment system, but that both interest definitions, when totaled over the whole of the bond term, give the same absolute return: 409.9.
The figures in the accounts shown in Tables 3-6 are based on Table 2. In all of them, the accounting system is shown using the actual interest calculated on the basis of when it falls due (on the left-hand side, under main heading A) and nominal interest alone (on the righthand side, under main heading B). All the figures are rounded, which accounts for minor discrepancies.
The opening and closing balances and financial account show both nominal (N) values and market (M) values in order to make it easier to understand the entries, which in national accounts are assumed to be entered at market values or the actual values of the transactions. The valuation principles in these fields have been discussed many times in connection with the revision of the SNAIESA and will not be dealt with in this paper.
To make the layout clear, only certain transactions in the accounting system have been shown, and the values shown for interest, consumption, investments, bond transactions, and so on have not been selected as a reflection of the conditions prevailing in the economy of any particular country.
Accounting System for Actual Interest Under Constant Market Rates of Interest
Tables 3 and 4 show the accounting system under a constant market rate of interest. Table 3 shows the opening balance of a newly issued bond holding with a nominal value of 1,000, the issue (market) value of which can be calculated as 890 (compare Table 2, line 7). During the first period, bonds with a nominal value of 200 are called, resulting in a profit of 22 over the issue price, which is included under interest income in the distribution of income account. It can be seen from the financial account that new bonds are bought with the same nominal value as the drawn bonds had, and the closing balance therefore
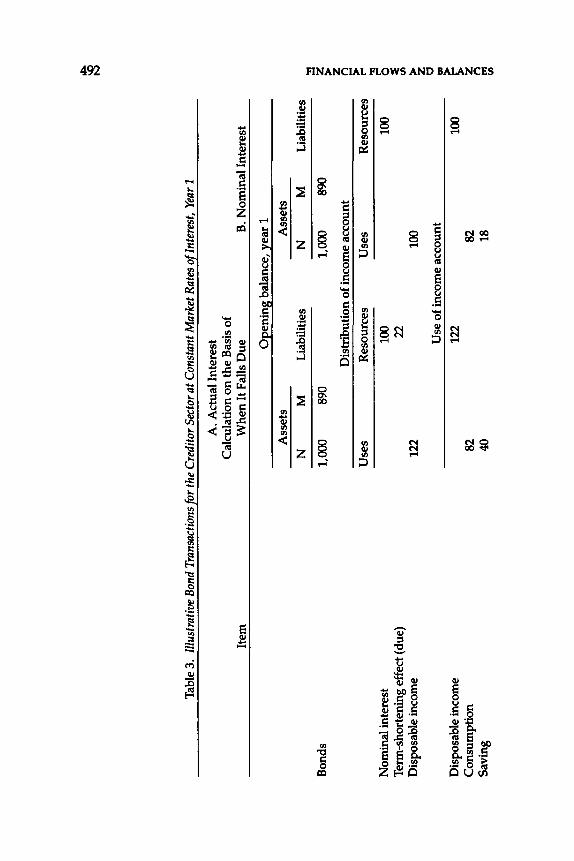
Tab
le 3
. Ill
ustr
ativ
e Bo
nd T
rans
actio
ns fo
r th
e C
redi
tor
Sect
or a
t Con
stan
t Mar
ket R
ates
of I
nter
est,
Year
1
Item
Bon
ds
Nom
inal
inte
rest
T
erm
-sho
rten
ing
effe
ct (
due)
D
ispo
sabl
e in
com
e
Dis
posa
ble
inco
me
Con
sum
ptio
n S
avin
g
A.
Act
ual I
nter
est
Cal
cula
tion
on
the
Bas
is o
f W
hen
It F
alls
Due
B
. Nom
inal
Int
eres
t
0E
enin
g b
alan
ce,
year
1
Ass
ets
Ass
ets
N
M
Lia
bilit
ies
N
M
Lia
bili
ties
1,00
0 89
0 1,
000
890
Dis
trib
utio
n of
inco
me
acco
unt
Use
s R
esou
rces
U
ses
Res
ourc
es
100
100
22
122
100
Use
of
inco
me
acco
unt
122
100
82
82
40
18
~ .., z > z t"
l >
I"' .., 6 ~ Ul > z 0 Il
l >
~ z t"l
1!1
Ul
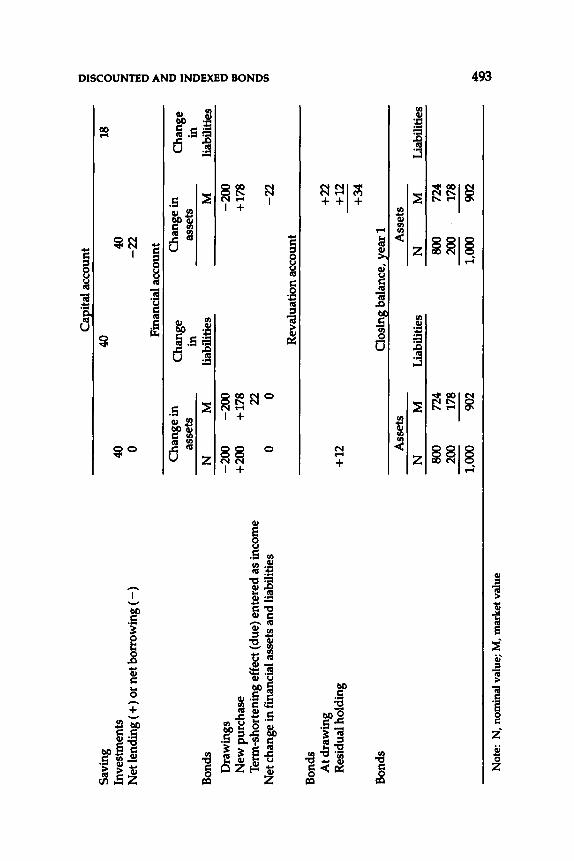
CaE
ital a
ccou
nt
0 u; S
avin
g 40
18
n 0
Inve
stm
ents
40
40
c::
Net
lend
ing
( +) o
r net
bor
row
ing
(-)
0 -2
2
~ 0 F
inan
cial
acc
ount
>
z C
hang
e in
C
hang
e C
hang
e in
C
hang
e 0
asse
ts
in
asse
ts
in
z 0 B
onds
N
M
li
abil
itie
s M
li
abil
itie
s II
! X
II
! D
raw
ings
-2
00
-200
-2
00
0
New
pur
chas
e +2
00
+178
+1
78
al 0
Ter
m-s
hort
enin
g ef
fect
(du
e) e
nter
ed a
s in
com
e 22
z 0
Net
cha
nge
in fi
nanc
ial
asse
ts a
nd li
abil
itie
s 0
0 -2
2
en
Rev
alua
tion
acc
ount
Bon
ds
At d
raw
ing
+22
Res
idua
l hol
ding
+1
2 +1
2 --
+34
Bon
ds
Oo
sin
g b
alan
ce, 1
:ear
1
Ass
ets
Ass
ets
N
M
Lia
bilit
ies
N
M
Lia
bilit
ies
800
724
800
724
200
178
200
178
--
--
--
1,00
0 90
2 1,
000
902
""' ~ N
ote:
N,
nom
inal
val
ue;
M,
mar
ket v
alue
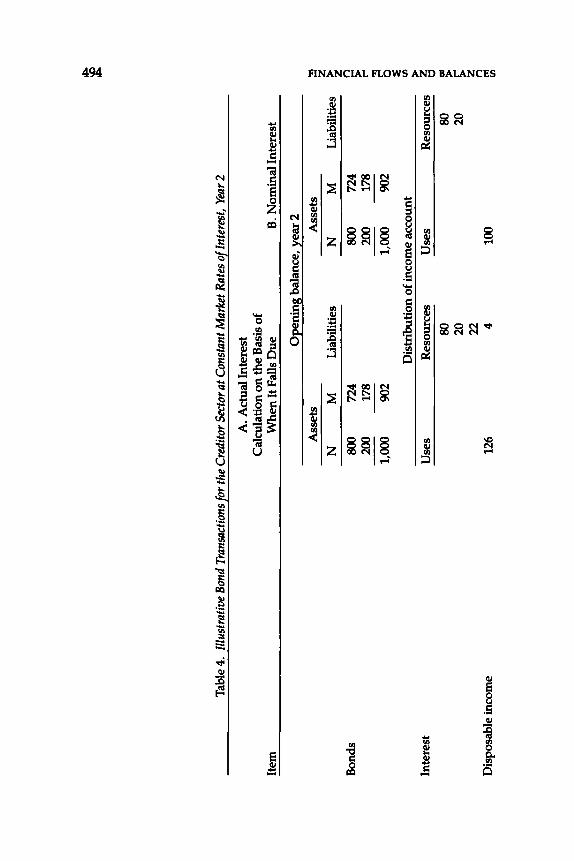
Tab
le 4
. Ill
ustr
ativ
e Bo
nd T
rans
actio
ns fo
r th
e C
redi
tor
Sect
or a
t Con
stan
t Mar
ket R
ates
of I
nter
est,
Year
2
Item
Bon
ds
Inte
rest
Dis
posa
ble
inco
me
A.
Act
ual I
nte
rest
C
alcu
lati
on o
n th
e B
asis
of
Wh
en I
t Fal
ls D
ue
B.
No
min
al I
nter
est
Ope
ning
bal
ance
, ~e
ar 2
Ass
ets
Ass
ets
N
M
Lia
bili
ties
N
M
L
iabi
liti
es
800
724
800
724
200
178
200
178
--
--
---
1,00
0 90
2 1,
000
902
Dis
trib
utio
n o
f in
com
e ac
cou
nt
- Use
s R
esou
rces
U
ses
Res
ourc
es
--
80
80
20
20
22
126
4 10
0
~ ~ z > z ('
) >
r"
'rl
r"
0 ~
VI > z lj 1:1
1 > >
z (')
II!
VI
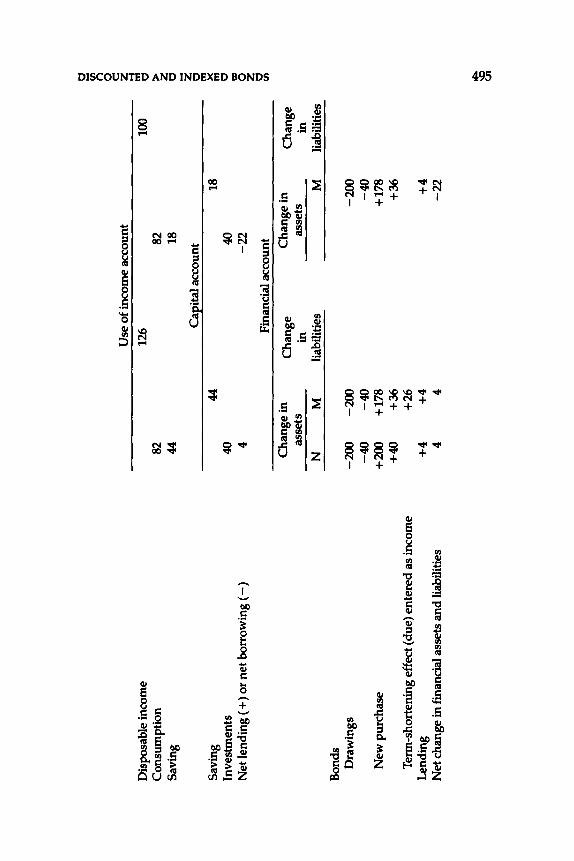
Dis
posa
ble
inco
me
Con
sum
ptio
n ·
Sav
ing
Sav
ing
Inve
stm
ents
N
et le
ndin
g ( +
) or
net
bor
row
ing
(-)
Bon
ds
Dra
win
gs
New
pur
chas
e
Ter
m-s
hort
enin
g ef
fect
(du
e) e
nte
red
as
inco
me
Len
ding
N
et c
hang
e in
fina
ncia
l ass
ets
and
liab
ilit
ies
82
44
40 4
Ch
ang
e in
as
sets
44
Use
of i
ncom
e ac
coun
t
126
82
18
Cap
ital
acc
ount
40
-22
Fin
anci
al a
ccou
nt
Ch
ang
e C
han
ge
in
in
asse
ts
18
N
M
liab
ilit
ies
M
-20
0
-40
+
200
+40
+4 4
-20
0
-40
+
178
+3
6
+26
+
4 4
-20
0
-40
+
178
+3
6
+4
-22
c u; n 0 c: z 10
0 ;!
c > z c z c I'l
l X
I'l
l c all 0 z c Ul
---
Ch
ang
e in
li
abil
itie
s
~
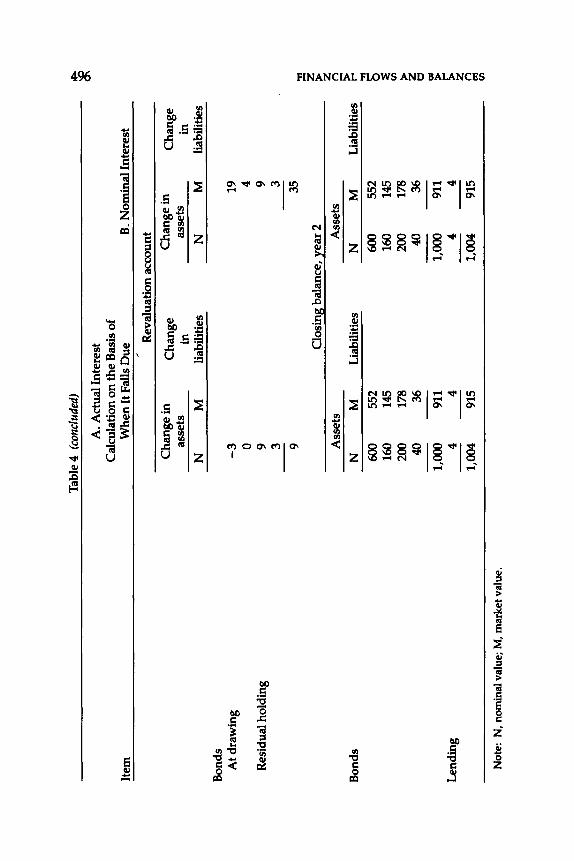
Item
Bon
ds
At d
raw
ing
Res
idua
l hol
ding
Bon
ds
Len
ding
Not
e: N
, no
min
al v
alue
; M
, m
arke
t val
ue.
Tab
le 4
(co
nclu
ded)
A.
Act
ual I
nter
est
Cal
cula
tion
on
the
Bas
is o
f W
hen
It F
alls
Du
e B
. N
omin
al I
nter
est
Rev
alua
tion
acc
ount
Ch
ang
e in
C
han
ge
Ch
ang
e in
C
han
ge
asse
ts
in
asse
ts
in
N
M
liab
ilit
ies
N
M
liab
ilit
ies
-3
19
0 4
9 9
3 3
---
9 35
Clo
sing
bal
ance
, y
ear
2
Ass
ets
Ass
ets
N
M
Lia
bili
ties
N
M
L
iabi
liti
es
600
552
600
552
160
145
160
145
200
178
200
178
40
36
40
36
---
--
--
1,00
0 91
1 1,
000
911
4 4
4 4
--
--
--
--
1,00
4 91
5 1,
004
915
~ "ff z > z l"
l >
r"'
"ff
r"'
0 ~
{/)
> z 0 =
> s: z l"
l !I
I {/
)
DISCOUNTED AND INDEXED BONDS 497
shows an unchanged holding in nominal terms. However, the market value of the bond holding has risen by 12, owing to the unrealized effect of the shortening of the term on the remaining holding (nominally 800; compare Table 2, line 10). No other revaluations are shown because it is assumed that the market rate of interest remains unchanged at 15 percent.
In the financial account, the effect of the shortening of the term4
( +22), which is posted as income, is entered as a special increase in financial assets at market value, and this figure is also included under bonds drawn at market value (-200). The term-shortening effect entered in the financial account is not intended to be an imputed figure but is an accounting device that is necessary because "drawing profits" are to be classified as both interest income and a negative change in assets.
On the right-hand side (under main heading B), it can be seen that drawing profits (measured in relation to the issue price) have to be entered as resources in the revaluation account. The financial closing balance is then shown as the sum of the opening balance, the financial account, and the revaluation account.
In period 2 (Table 4) a loss on bond holdings occurs (under main heading A) in the revaluation account ( -3), corresponding to the upward revaluation at the end of the first period of the price of the bonds drawn during the second period. This is because the distributed discount, included under interest in the distribution of income account, is computed to the time of maturity as a drawing profit measured in relation to the issue price (excluding the not-due mathematical upward revaluation as a result of the shortening of the term). The market (mathematical) upward revaluation of the remaining initial holding of period 2 amounts to 9 + 3, which is included in the revaluation account under both headings A and B. Under heading B, the drawing profit is also entered, measured in relation to the value of the bond holding in the opening balance (19 + 4).
Lending of +4 is also shown in the financial account, since for the purpose of the illustration it was decided to restrict the reacquisition of bonds to exactly what was needed to maintain a constant, nominal bond holding. The total revaluation of 35 under heading B thus corresponds, under main heading A, to the sum of the term-shortening effect entered as income, 26, as shown in the financial account, and the total revaluation of 9.
In connection with national accounts, it is frequently the total earn-
4 The "term-shortening effect" is another way of phrasing "drawing profits" (see Table 2, lines 11 and 12).
498 FINANCIAL FLOWS AND BALANCES
ings on investments, corresponding to 35 in the example, that can be seen, for example, in the accounts of the financial institutions that are most often entered as income together with the nominal interest. Since it is proposed to calculate the drawing profits entered as income in national accounts (corresponding to 26 under main heading A of Table 4), the revaluation entry (corresponding to 9 under main heading A) can be calculated as a residual when the total revaluations (corresponding to 35 under main heading B) are known.
Accounting System for Actual Interest Under Variable Market Rates of Interest
Tables 5 and 6 show the system of accounts when market rates of interest fall during the first period and rise to their initial level during the second period.
In the financial account on the left-hand side of Table 5 (under main heading A), there is a technical set-off to the drawing profits, which in this example is shown both in the distribution of income account as interest ( + 22) and in the financial account as part of the termshortening effect (due) entered as income, and is exactly the same as in Table 3 under heading A. It can also be seen that, as a result of the fall in market interest rates, there has been a rise in the price of bonds, since the newly issued bonds with a nominal value of 200 were acquired at a market value of 180, whereas the initial price for the corresponding bonds was 178.
In the revaluation account, the increase in market value is entered for the part of the initial holding that has not been drawn. The market value for bonds with a nominal value of 800 increased from 712 at the start of the period to 732 at the end of the period as a result of the shortening of the term ( + 12) and the drop in interest rates ( +8). The whole of the difference (20) is entered in the revaluation account. In Table 5 under main heading B, further drawing profits ( + 22) are entered in the revaluation account, since it is only the nominal interest that appears in the distribution of income account.
Under main heading A of Table 6, drawing profits (22 + 4) are entered as income, measured in relation to the issue price and to the price at the beginning of period 2. As in period 1, a set-off is entered in the financial account-a term-shortening effect of 126 entered as income-since the drawn bonds are assessed at transaction values (-200 - 40). This means that there was an indirect discount when the bonds were drawn, which was the difference between the initial market value in period 2 of the drawn amounts and the market value
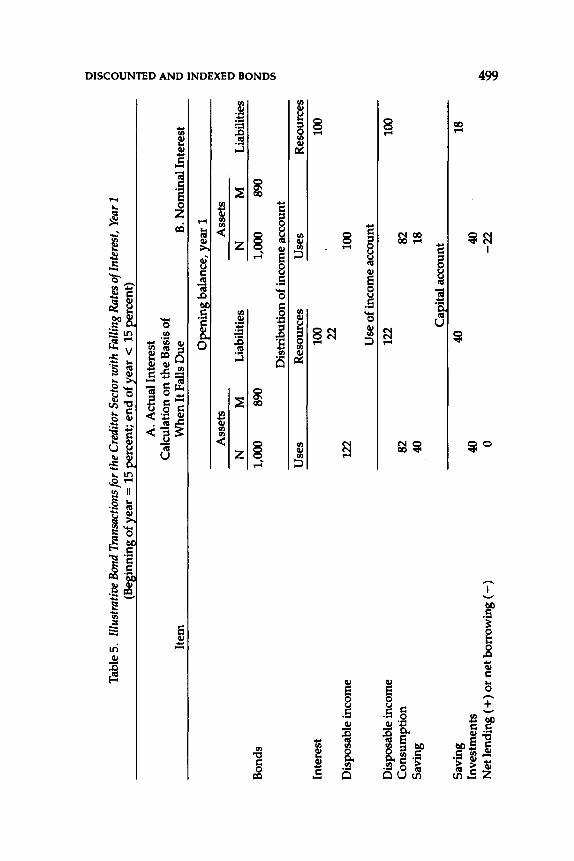
Tab
le 5
. Ill
ustr
ativ
e Bo
nd T
rans
actio
ns fo
r th
e C
redi
tor
Sect
or w
ith F
allin
g R
ates
of I
nter
est,
Year
1
(Beg
inni
ng o
f yea
r =
15
per
cent
; en
d o
f yea
r <
15
perc
ent)
Bon
ds
Inte
rest
Dis
posa
ble
inco
me
Dis
posa
ble
inco
me
Con
sum
ptio
n S
avin
g
Sav
ing
Inve
stm
ents
Item
Net
lend
ing
( +)
or
net
bor
row
ing
(-)
A.
Act
ual I
nter
est
Cal
cula
tion
on
the
Bas
is o
f W
hen
It F
alls
Due
B
. Nom
inal
Int
eres
t
Op
enin
g b
alan
ce,
year
1
Ass
ets
Ass
ets
N
M
Lia
bili
ties
N
M
L
iabi
liti
es
1,00
0 89
0 1,
000
890
Dis
trib
utio
n of
inco
me ~ccount
Use
s R
esou
rces
U
ses
Res
ourc
es
122 82
40
40 0
100
100
22
100
Use
of i
ncom
e ac
coun
t
122
40
82
18
Cap
ital
acc
ount
40
-22
100
18
0 tii () g ~ 0 > z 0 z 0 rr:
t ~ 0 1:111 0 z 0 tn ~
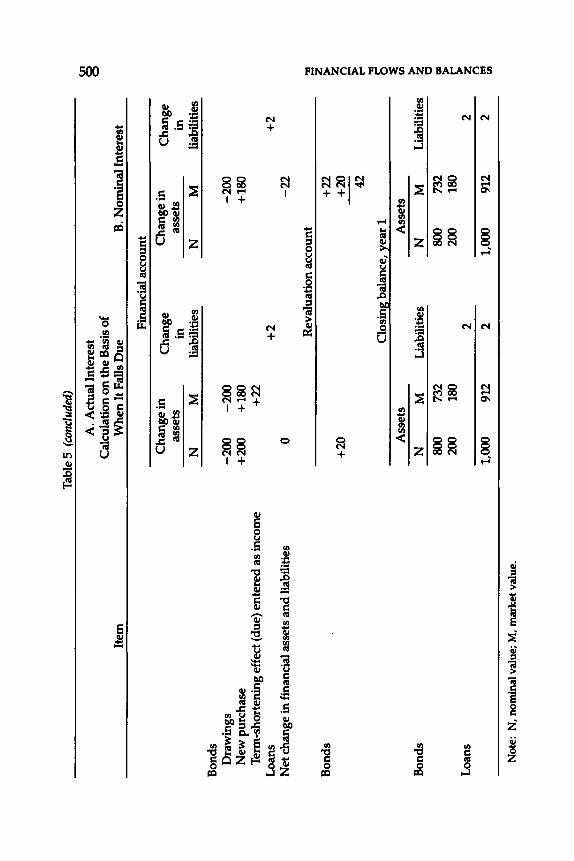
Bon
ds
Dra
win
gs
New
pur
chas
e
Item
Ter
m-s
hort
enin
g ef
fect
(du
e) e
nte
red
as
inco
me
Loa
ns
Net
cha
nge
in fi
nanc
ial a
sset
s an
d li
abil
itie
s
Bon
ds
Bon
ds
Loa
ns
Not
e: N
, no
min
al v
alue
; M
, mar
ket v
alue
.
Tab
le 5
(co
nclu
ded)
A.
Act
ual I
nter
est
Cal
cula
tion
on
the
Bas
is o
f W
hen
It F
alls
Du
e B
. N
om
inal
Int
eres
t
Ch
ang
e in
as
sets
N
M
-20
0
+20
0 0
+20
-20
0
+18
0 +2
2
Ass
ets
N
M
800
732
200
180
1,00
0 91
2
Fin
anci
al a
ccou
nt
Ch
ang
e in
li
abil
itie
s
+2
Ch
ang
e in
as
sets
N
M
-20
0
+18
0
-22
Rev
alua
tion
acc
ount
+22
+20
42
Oo
sin
g b
alan
ce,
yea
r 1
Ass
ets
Lia
bili
ties
N
M
800
732
200
180
2 2 1,
000
912
Ch
ang
e in
li
abil
itie
s
+2
Lia
bili
ties
2 2
8 .., ~ ~ >
!"" .., 6 ~ Ul > ~ ~ z n II!
Ul
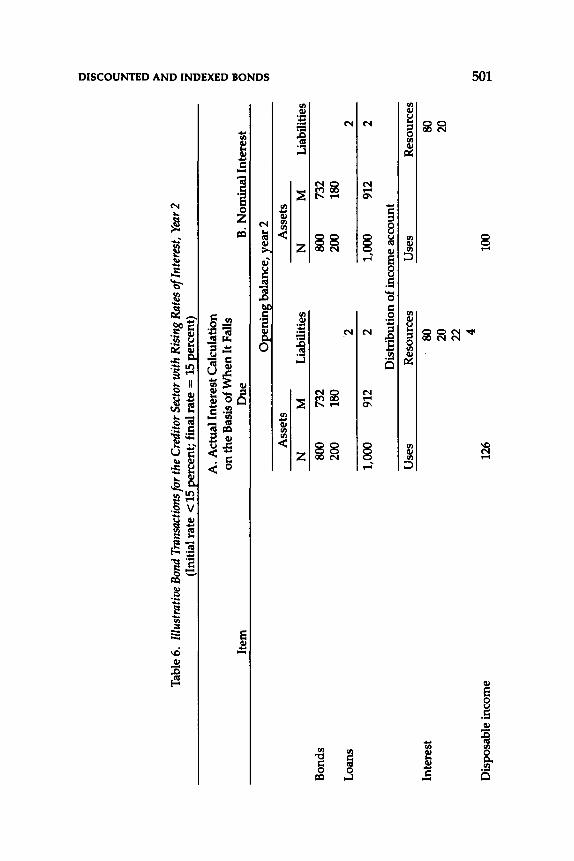
Tab
le 6
. Ill
ustr
ativ
e Bo
nd T
rans
actio
ns fo
r th
e C
redi
tor
Sect
or w
ith R
isin
g Ra
tes
of In
tere
st,
Year
2
(Ini
tial
rat
e <
15 p
erce
nt;
fina
l ra
te =
15
per
cen
t)
Item
A.
Act
ual I
nte
rest
Cal
cula
tion
o
n th
e B
asis
of
Wh
en I
t Fal
ls
Due
B
. N
om
inal
In
tere
st
Ass
ets
N
M
Bon
ds
800
732
200
180
Loa
ns
1,00
0 91
2
- Use
s --
Inte
rest
Dis
posa
ble
inco
me
126
Op
enin
g b
alan
ce,
rear
2
Ass
ets
Lia
bili
ties
N
800
200
2 --
2 1,
000
Dis
trib
utio
n o
f in
com
e ac
cou
nt
Res
ourc
es
Use
s --
80
20
22 4
100
M
732
180
912
Lia
bili
ties
2 2
Res
ourc
es
80
20
0 (ii
l"l g ~ 0 > ~ z 0 1!
1 ~ 0 "' 0 z 0 II)
~ ....
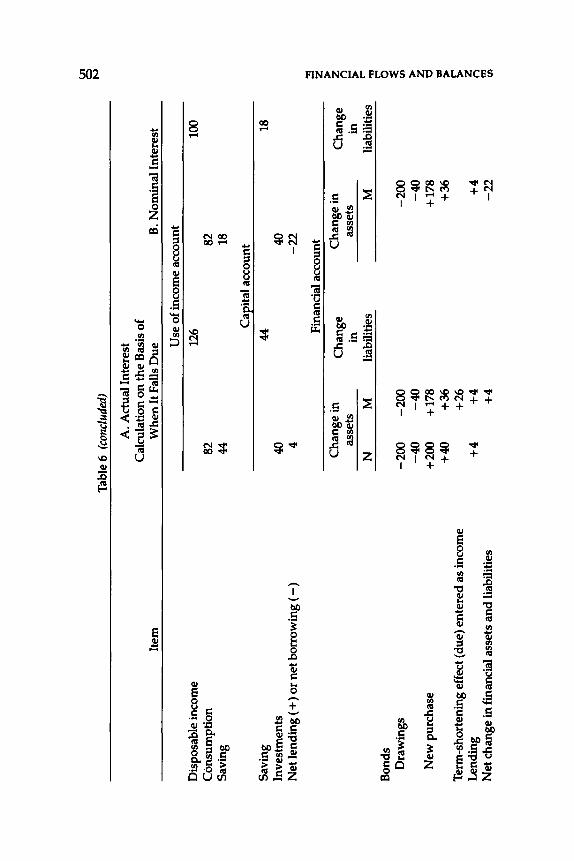
Dis
posa
ble
inco
me
Con
sum
ptio
n S
avin
g
Sav
ing
Inve
stm
ents
Item
Net
lend
ing
( +)
or n
et b
orro
win
g (-
)
Bon
ds
Dra
win
gs
New
pur
chas
e
Ter
m-s
hort
enin
g ef
fect
(du
e) e
nter
ed a
s in
com
e L
endi
ng
Net
cha
nge
in fi
nanc
ial
asse
ts a
nd li
abil
itie
s
Tab
le 6
(co
nclu
ded)
J\.
J\ct
uali
nter
est
Cal
cula
tion
on
the
Bas
is o
f W
hen
It F
alls
Due
B
. N
omin
al I
nter
est
82
44
40 4
Cha
nge
in
asse
ts
N
M
-200
-2
00
-40
-4
0
+200
+1
78
+40
+36
+26
+4
+4 +4
Use
of i
ncom
e ac
coun
t
126 44
82
18
Cap
ital
acc
ount
40
-22
Fin
anci
al a
ccou
nt
Cha
nge
Cha
nge
in
asse
ts
in
liab
ilit
ies
M
-200
-4
0
+178
+3
6
+4
-22
100 18
Cha
nge
in
liab
ilit
ies
s 'TI z > z ('
) >
!"' 5 :E In
> z 0 til ~ z (')
1:!1
In
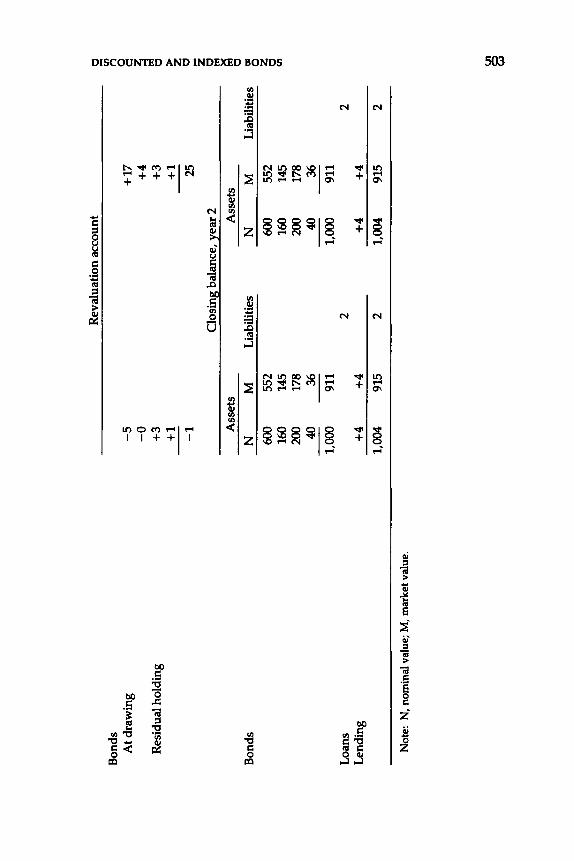
Rev
alua
tion
acc
ount
0
Bon
ds
u; (")
At d
raw
ing
-5
+17
0 c:: -0
+
4 z ;!
Res
idua
l hol
ding
+3
+
3 0
+1
+1
>
--
--
z -1
25
0 z
Clo
sin8
bal
ance
, l:e
ar 2
0 tr
l
Ass
ets
Ass
ets
)(
trl
0 B
onds
N
M
L
iabi
litie
s N
M
L
iabi
litie
s 1:1
1 0 60
0 55
2 60
0 55
2 z 0
160
145
160
145
Ul
200
178
200
178
40
36
40
36
---
--
--
1,00
0 91
1 1,
000
911
Loa
ns
2 2
Len
ding
+
4 +
4 +
4 +
4 1,
004
915
2 1,
004
915
2
Not
e: N
, no
min
al v
alue
; M
, m
arke
t val
ue.
s
504 FINANCIAL FLOWS AND BALANCES
upon issue ( -5 - 0). These amounts are entered in the revaluation account together with the market value increase on the part of the initial bond holding that was not drawn during the course of the period. This market value increase ( +3 + 1) is a combination of the shortening of the term (rising prices) and rising market interest rates (falling prices).
Under main heading B of Table 6, the revaluation account has to include, in addition to the above-mentioned amounts, drawing profits measured in relation to the initial price in period 2 ( + 17 + 4). In this case, the total revaluation remains, with nominal interest, 25, which corresponds to the sum of the balance in the revaluation account and the term-shortening effect entered as income under main heading A of Table 6 ( -1 + 26). This can also be expressed as the balance in the revaluation account under main heading A being equal to the revaluation under main heading B minus the term-shortening effect entered as income under main heading A.
The closing balance in Table 6 is 2 less than in Table 4 because the reacquisition of bonds at a nominal value of 200 at the close of the first period cost 180 as a result of the drop in interest rates, whereas when market interest rates were constant they cost 178. In the example shown in Table 6, the bond creditor has financed this difference by borrowing 2.
28
Principles of Valuation and Reconciliation Items in the
IMF' s Money and Banking Statistics and A System of National Accounts
I<Erm G. DuBUN
T HE PRESENTATION of economic accounts of the institutional sectors of the economy in the form of balance sheets is essential to eco
nomic and financial analysis because it provides a systematic record of the stocks of real and financial resources that are available to the respective sectors and that affect their economic decisions.1 Although the balance-sheet framework provides a basic structure for monitoring and forecasting the behavior of various economic transactors on the basis of existing patterns of wealth and indebtedness, it is also useful for deriving data on the flow of transactions over time in the absence of independent sources of data on flows. By comparing the values of the same balance-sheet item at different time periods, it is conceptually possible to ascertain the magnitude of transactions that have occurred during any given time period. In reality, however, changes in the values of most balance-sheet items will be affected by both variations in price and in quantity, and the impact of pure price changes, regardless of origin, must first be isolated before it is possible to proceed to determine flows of economic and financial activity. In the United Nation's A System of National Accounts (SNA), and as specified in the Provisional Guidelines, 2 these valuation adjustments
This paper draws extensively on Nancy D. Ruggles, "Financial Accounts and Balance Sheets: Issues for the Revision of the SNA" (unpublished; New Haven, Connecticut: Yale University, January 1984).
2 United Nations, Provisional International Guidelines on the National and Sec-
505
506 FINANCIAL FLOWS AND BALANCES
are recorded separately in a supplementary set of accounts that comprises all reconciliation-type items. The Fund's Money and Banking Statistics (MBS) records the counterparts of these price changes or valuation adjustments as items of net worth or in the capital accounts.3
The aims of this paper are (1) to discuss the basic principles of valuation as they apply to balance sheets in the SNA; (2) to review the structure of the reconciliation accounts in the SNA and the Provisional Guidelines and the ability of these accounts to explain adequately differences that exist between changes in balance-sheet positions and the aggregation of individual transactions over time; and (3) to examine the methodology used in the valuation of financial instruments and the treatment of the valuation adjustment in the MBS.
Section I analyzes the methodology proposed by the SNA for valuing various assets and liabilities and for reconciling differences between changes in stock data and transactions flows. Section II reviews the valuation principles in the MBS and some of the problems posed for compiling MBS data from national balance sheets. This section also discusses the methodology for deriving transactions flows from balance-sheet positions. Section III concludes the paper by comparing valuation principles in the SNA and the MBS, discussing the limitations of attempting to derive flow data from the balancesheet structure of these systems, and offering proposals for facilitating the estimation of flows from stock data in the revised SNA and theMBS.
I. Role of Balance Sheets in the SNA
National and sectoral balance sheets covering the real and financial assets and liabilities of institutional sectors are an integral part of the SNA. Their place in the framework of the system and the concepts of the accounts are laid out in the 1968 version, which later was supplemented by more specific definitions and classifications in the Provisional Guidelines. The balance-sheet accounts in the SNA are statements of tangible assets and intangible nonfinancial assets owned by institu-
toral Balance-Sheet and Reconciliation Accounts of the System of National Accounts, Statistical Papers, Series M, No. 60 (New York, 1977).
3 MBS refers to the Fund's current practices and methodology in money and banking statistics. The MBS differs in some respects from the draft of A Guide to Money and Banking Statistics in International Financial Statistics (MBS Guide) issued in 1984 to reflect practices existing then.
MBS AND SNA VALUATION AND RECONCILIATION 507
tional sectors of the economy and of the outstanding financial claims among institutional units.
General Characteristics
With regard to financial assets and liabilities, the basic SNA classification is in terms of the legal form of the instrument and its liquidity. Within this structure, the most liquid assets are defined as those which are exchangeable on demand and without penalty for any other financial instrument or for nonfinancial goods and services. Currency and transferable deposits constitute the main examples of instruments that fall into this category. Other deposit accounts with financial institutions that are usually regarded as close substitutes for the means of payment constitute another group of financial instruments that are slightly less liquid than the first. Examples of other groups of financial instruments, in a presumed descending order of liquidity, are bills and bonds, corporate equities, loans, trade credits and advances, and other accounts receivable and payable.
In addition to classifying financial assets and liabilities according to type of instrument, the SNA recommends a more detailed structure of classification for some of the categories of financial transactions in order to indicate the institutional sectors of debtors in the case of financial assets and of creditors in the case of some liabilities (see SNA, Table 24). When transactions in these assets and liabilities are also classified along the lines of institutional sectors, grouping together units that are sufficiently homogeneous in respect of the kinds of liabilities incurred and of the kinds of assets held, they constitute a basis for analysis of the financial flows of these sectors. An example of the balance sheet of financial institutions proposed in the Provisional Guidelines is shown in Table 1.
Valuation Principles
In the SNA, balance-sheet items, with few exceptions, are valued at current market prices, and for any one sector the total value of all assets held less the total value of financial liabilities and share capital yields a residual that is referred to as "net worth." The balance sheet for each sector is therefore always in balance because the sum of its net tangible assets, nonfinancial intangible assets, and financial assets is equal to the sum of its liabilities, share capital, and net worth.
As regards the methodology for valuing balance-sheet items, the SNA stipulates that the same mode of valuation should be applied to
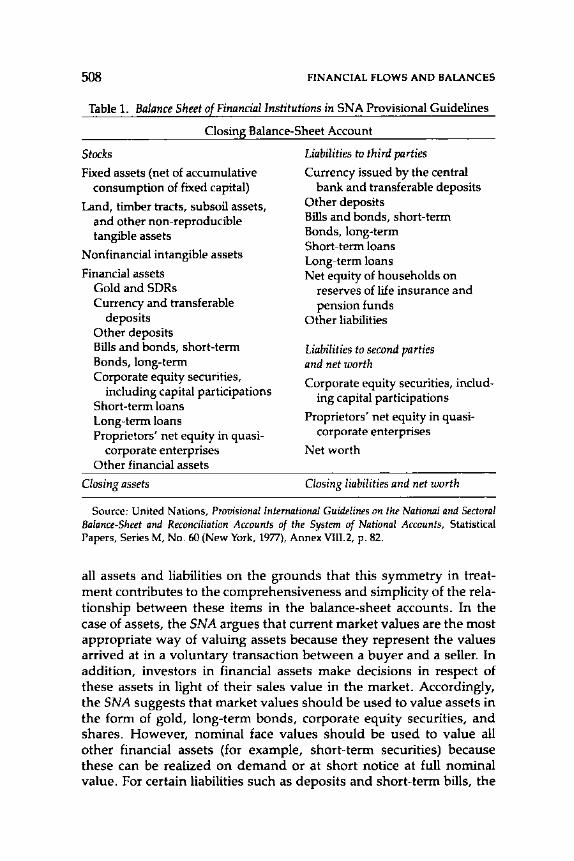
508 FINANCIAL FLOWS AND BALANCES
Table 1. Balance Sheet of Financial Institutions in SNA Provisional Guidelines
Closing Balance-Sheet Account
Stocks Fixed assets (net of accumulative
consumption of fixed capital)
Land, timber tracts, subsoil assets, and other non-reproducible tangible assets
Nonfinancial intangible assets
Financial assets Gold and SDRs Currency and transferable
deposits Other deposits Bills and bonds, short-term Bonds, long-term Corporate equity securities,
including capital participations Short-term loans Long-term loans Proprietors' net equity in quasi
corporate enterprises Other financial assets
Closing assets
Liabilities to third parties Currency issued by the central
bank and transferable deposits Other deposits Bills and bonds, short-term Bonds, long-term Short-term loans Long-term loans Net equity of households on
reserves of life insurance and pension funds
Other liabilities
Liabilities to second parties and net worth
Corporate equity securities, including capital participations
Proprietors' net equity in quasicorporate enterprises
Net worth
Closing liabilities and net worth
Source: United Nations, Provisional International Guidelines on the National and Sectoral Balance-Sheet and Reconciliation Accounts of the System of National Accounts, Statistical Papers, Series M, No. 60 (New York, 1977), Annex VIII.2, p. 82.
all assets and liabilities on the grounds that this symmetry in treatment contributes to the comprehensiveness and simplicity of the relationship between these items in the balance-sheet accounts. In the case of assets, the SNA argues that current market values are the most appropriate way of valuing assets because they represent the values arrived at in a voluntary transaction between a buyer and a seller. In addition, investors in financial assets make decisions in respect of these assets in light of their sales value in the market. Accordingly, the SNA suggests that market values should be used to value assets in the form of gold, long-term bonds, corporate equity securities, and shares. However, nominal face values should be used to value all other financial assets (for example, short-term securities) because these can be realized on demand or at short notice at full nominal value. For certain liabilities such as deposits and short-term bills, the
MBS AND SNA VALUATION AND RECONCILIATION 509
most suitable mode of valuation is to assign nominal face values as in the case of short-term assets. For long-term liabilities (for example, bonds, corporate equities, and shares), however, the same valuation principles should be applied to these claims when they are held as assets-namely, market values. Valuing long-term liabilities at market prices can be justified on the grounds that it is the common practice for issuers of long-term bonds to manage their liabilities actively, and they might choose to redeem these bonds early or to refinance their obligations if the current interest rate for long-term bonds is significantly lower than the issue rate for their bonds.
For financial assets denominated in foreign currencies (usually, bank deposits and securities), their values in domestic currencies will change whenever there are changes in exchange rates. The SNA recommends that the appropriate conversion rates to be used would be the average daily transaction rates prevailing during the course of the day on which the balance sheet is prepared. This rule would, however, not apply in instances where the foreign exchange market is segregated on the basis of type of usage or where, because of scarcity, foreign exchange acquires a premium value in the parallel market. In such cases the value of financial assets in national currency should reflect the premium paid to acquire the foreign exchange.
Unlike investors in financial assets, users of fixed assets or raw materials used in the production process are concerned with the current market costs of replacing these assets. Thus, for most reproducible fixed assets, valuation at gross replacement cost with an allowance for depreciation is appropriate. Conceptually, the cost of acquisition of each class of fixed asset (same type and same year of acquisition) is adjusted to current gross replacement cost by an index of the average change in prices from the year of acquisition to the year in question. An allowance for accumulated depreciation between the two dates is deducted in order to arrive at the written-down current replacement cost. The depreciation allowance itself is usually calculated either on the basis of an annual fixed nominal amount during the anticipated life of the equipment-the ''straight-line'' method-or on the basis of a fixed percentage per year on a diminishing balance.
The problem of disaggregating changes in the values of balancesheet items in the SNA that are the result of transactions, on the one hand, and price changes, on the other, is addressed in the context of two supplementary accounts. The 1968 SNA envisaged a complete accounting for the change in balance-sheet values over time through two separate accounts, one of which was designed to record the flow of transactions (the capital finance or accumulation account) and the other to reflect the impact of all price and other changes (the recon-
510 FINANCIAL FLOWS AND BALANCES
ciliation account). In actuality, the treatment of the capital account, which covers the creation and extinction of financial assets and liabilities, was very brief in the 1968 SNA, and there was no discussion of the reconciliation account. These issues were more fully addressed in the Provisional Guidelines issued in 1977.
The present SNA includes in the capital account, all capital formation in tangible reproducible assets, as well as changes in the accumulation of nonreproducible tangible assets if the latter changes are a consequence of a purchase or sale of those assets. Also included are the creation, elimination, purchases, and sales of financial assets and nonfinancial intangible assets. The function of the reconciliation account is, therefore, to explain the differences between opening and closing values of balance-sheet items that are not covered by transactions recorded in the capital finance account. Accordingly, apart from valuation adjustments owing to price changes, the reconciliation account also comprises the counterparts of balance-sheet changes resulting from the following: adjustments due to unforeseen events, net increases in the value of tangible assets not accounted for in the capital finance account, the allocation of SDRs, adjustments due to structural changes, and statistical discrepancies and discontinuities. These reconciliation items are discussed below, and the detailed entries in the reconciliation account are shown in Table 2.
Revaluations Because of Price Changes
When balance-sheet items are revalued following changes in market prices, capital gains and losses will be incurred, although in most cases these are not immediately realized. The same is also true when the values of assets and liabilities are determined by capitalizing an expected income stream and the capitalization factor or rate of discount is subsequently changed. These gains and losses, either realized or unrealized, are recorded as entries in the reconciliation account. If assets and liabilities are denominated in foreign currencies, the counterpart of the valuation changes following exchange rate movements is also reflected in the reconciliation account as a valuation adjustment.
Adjustments Because of Unforeseen Events
The SNA production account includes an estimate of consumption of fixed capital as an element of cost. This estimate, in principle, includes an allowance for obsolescence that enters into the fixing of
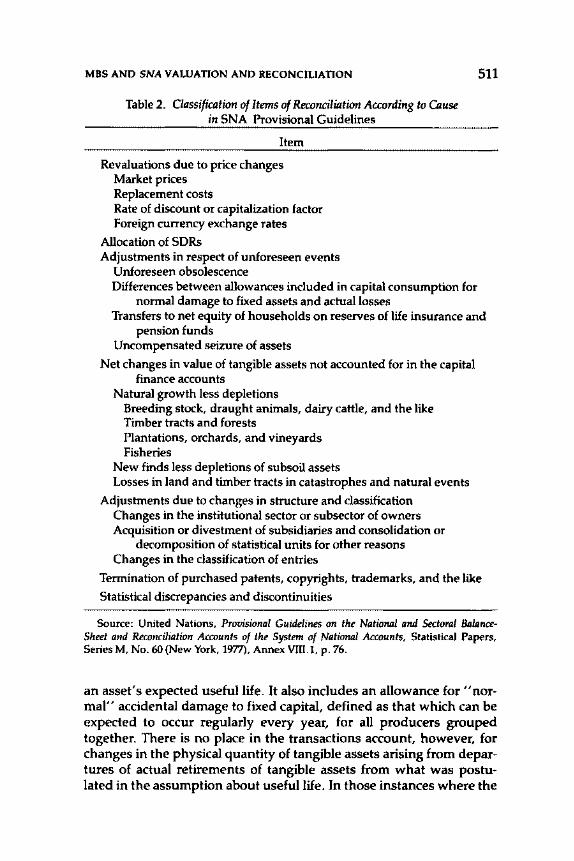
MBS AND SNA VALUATION AND RECONCILIATION
Table 2. Classification of Items of Reconciliation According to Cause in SNA Provisional Guidelines
Item
Revaluations due to price changes Market prices Replacement costs Rate of discount or capitalization factor Foreign currency exchange rates
Allocation of SDRs Adjustments in respect of unforeseen events
Unforeseen obsolescence Differences between allowances included in capital consumption for
normal damage to fixed assets and actual losses
511
Transfers to net equity of households on reserves of life insurance and pension funds
Uncompensated seizure of assets
Net changes in value of tangible assets not accounted for in the capital finance accounts
Natural growth less depletions Breeding stock, draught animals, dairy cattle, and the like Timber tracts and forests Plantations, orchards, and vineyards Fisheries
New finds less depletions of subsoil assets Losses in land and timber tracts in catastrophes and natural events
Adjustments due to changes in structure and classification Changes in the institutional sector or subsector of owners Acquisition or divestment of subsidiaries and consolidation or
decomposition of statistical units for other reasons Changes in the classification of entries
Termination of purchased patents, copyrights, trademarks, and the like
Statistical discrepancies and discontinuities
Source: United Nations, Provisional Guidelines on the National and Sectoral BalanceSheet and Reconciliation Accounts of the System of National Accounts, Statistical Papers, Series M, No. 60 (New York, 1977), Annex VIII.l, p. 76.
an asset's expected useful life. It also includes an allowance for "normal" accidental damage to fixed capital, defined as that which can be expected to occur regularly every year, for all producers grouped together. There is no place in the transactions account, however, for changes in the physical quantity of tangible assets arising from departures of actual retirements of tangible assets from what was postulated in the assumption about useful life. In those instances where the
512 FINANCIAL FLOWS AND BALANCES
allowance for expected damage falls short of the actual damage, an adjustment representing the difference is included in the reconciliation account.
Net Increases in the Value of Tangible Assets Not Accounted for in the Capital Finance Account
Although the initial outlays on acquiring fixed nonreproducible assets that are used in the production process are included in gross capital formation and the values of these assets are covered in SNA balance sheets, the natural growth and depletions in these assets are excluded from the capital finance account and are recorded in the reconciliation account. Assets that would fall into this category include, for example, livestock, timber tracts, plantations, land, and fisheries. Although outlays on improvements of these nonreproducible assets are also treated as gross capital formation, changes in the value of these assets that do not result from expenditures on improvement or from production-related activities are omitted from the capital finance account and are shown in the reconciliation account.
SDRs
SDRs were first allocated by the IMF in 1970, after the publication of the SNA. Because SDRs are regarded as acceptable international assets for balance of payments settlements, in the Provisional Guidelines each country's allocation of SDRs is treated as a financial asset and is combined with its holdings of gold in the classification of financial claims on the balance sheet. As in the case of gold, SDRs are not considered to be the liability of any country or institution, and the counterpart of the SDR allocation is reflected in the balance sheet as a part of net worth. Consistent with this treatment, the allocations of SDRs do not appear in the capital finance in the Provisional Guidelines; they are reflected as assets in the balance sheet, and the contra-entry is accounted for in the reconciliation account. This treatment differs from that of the European System of Integrated Economic Accounts (ESA), which classifies the allocation of SDRs and the liability counterpart as a part of the transactions account.4 The liability is viewed as one of indefinite maturity in ESA. In contrast, the allocation of SDRs in the MBS resembles an unrequited transfer in that the holder acquires a
4 EUROSTAT, European System of Integrated Economic Accounts-ESA, 2d ed. (Luxembourg, 1979).
MBS AND SNA VALUATION AND RECONCILIATION 513
financial asset but does not exchange it for anything of economic value. The MBS thus regards the counterpart of SDR allocations as liabilities that are classified in the capital accounts of the monetary authorities.
Changes in Structure and Classification
This category in the Provisional Guidelines embraces both real changes (such as the acquisition or divestiture of subsidiaries by parent companies) and changes in the classification of statistical units (such as changes in the statistical reporting unit). With respect to the real changes, the appearance or disappearance of securities in the balance sheet of the parent company after the acquisition or divestiture of a subsidiary represents a transaction. However, in the Provisional Guidelines these adjustments are not reflected in the capital finance account but as entries in the reconciliation account.
Statistical Discrepancies and Discontinuities
Those differences in the values of entries between the opening and closing balance sheets that cannot be accounted for by transactions and the appropriate identifiable revaluations and adjustments are treated as statistical discrepancies. These statistical discrepancies may arise from unknown inaccuracies, inconsistencies, changes in institutional coverage, or discontinuities in the original sources of data. In the SNA these are classified as part of the reconciliation account, which in this instance fulfills the role of a residual account because these adjustments could not on conceptual grounds be classified as transactions in the capital finance account.
II. Structure and Uses of Balance Sheets in the MBS
The compilation of internationally comparable money and banking statistics poses many problems, both conceptual and practical. The nature of financial systems and the roles they play can differ markedly from country to country. In addition, national statistics on money and banking are constructed according to a variety of methodologies, reflecting differences in individual countries' banking traditions, regulatory views, laws, and accounting practices. Despite these differences, important similarities have evolved among countries in the forms of monetary analysis and concepts that make it
514 FINANCIAL FLOWS AND BALANCES
possible for analysts to recast data available from national sources into a form that permits international comparison.
General Characteristics
The MBS focuses, in particular, on a concept of money in relation to the domestic and external positions of banking institutions. In contrast to the SNA, the MBS is designed to provide, for each country, a standard set of analytic aggregates (on a monthly, quarterly, and annual basis) that facilitates the integration of money, credit, and balance of payments analysis. Monetary statistics have long been maintained by countries because of the demonstrated relationship among money growth and real. output, prices, and the balance of payments, and their relevance for the formulation of financial policies. There is no universally applicable approach to monetary analysis or policy, and thus there is no single analytical framework that can encompass the needs of all users. The MBS system is, however, sufficiently generalized to permit assessment of the linkages between the banking sector, the other domestic sectors of the economy (with special emphasis accorded on the government sector, which is frequently a source of imbalance and the policy area in which imbalances can be redressed), and the balance of payments. These constitute key elements of a financial program, which focuses on the principal financial targets.
Balance-Sheet Accounting Principles
The primary focus of the MBS is the Banking Survey, which consolidates the accounts of the monetary authorities and deposit money banks with the accounts of other banking institutions because these latter institutions also incur deposit liabilities and perform many of the same functions as deposit money banks. Financial instruments that are covered in these balance sheets normally share the common characteristic of a creditor-debtor relationship. There are, however, certain assets that do not have this general attribute but that are, nonetheless, regarded as financial assets from an economic perspective. Three examples of such assets are gold, SDRs, and corporate equity securities or shares. To obtain meaningful economic aggregates from the balance-sheet structures, assets are classified according to the type of debtor, and liabilities according to the degree of liquidity. The balance-sheet structure of the SNA classifies both assets and liabilities by the degree of liquidity. The standard presentation of bal-
MBS AND SNA VALUATION AND RECONCILIATION 515
ance sheet entries for the banking survey in the IMF' s International Financial Statistics (IFS) is shown in Table 3.
Valuation Principles
Contrary to the general SNA practice, the draft MBS Guide did not recommend uniform valuation procedures for the same financial instruments in the accounts of creditors and debtors. On the assumption that debtors and creditors usually have different perspectives on the value or cost of a financial instrument, the methodology recommended by the draft MBS Guide was to value financial assets at the present discounted value of future payments and to price financial liabilities at nominal face value. The draft MBS Guide, however, noted that as a practical matter financial assets would usually be valued at market prices, since many of these instruments were traded on an ongoing basis and the prices set in the market were probably more indicative of their value to the holder than the present discounted values of future streams of payments. Although in a perfect situation market value and present discounted values should yield the same result, they can diverge for several reasons including speculative activities and the lack of perfect knowledge in relation to future price and interest rate developments. The distinction in treatment in the draft MBS Guide between assets and liabilities was justified on the grounds that, in decision making, creditors would normally focus on market values that represent the best prices to be earned from the sale of their various assets, whereas debtors would tend to emphasize the eventual cost of discharging their liabilities. Departing from the recommendations of the draft MBS Guide, the MBS system now values financial assets at market prices and, therefore, agrees with the SNA that both assets and liabilities should be valued in a symmetrical manner. Accordingly, whereas short-term assets and liabilities are to be valued at face value, the value of long-term assets and liabilities is to be established by reference to market prices. This latter development in the MBS with respect to the valuation of liabilities reflects a recognition that many financial transactors actively manage their liabilities and will refinance outstanding liabilities based on relative changes in financing terms.
For instruments denominated in foreign currencies, the MBS stipulates that for balance-sheet purposes these items should be converted to the national currency at the prevailing exchange rate. Gains and losses accruing to creditors and debtors from the revaluation of foreign assets and liabilities following an exchange rate change are
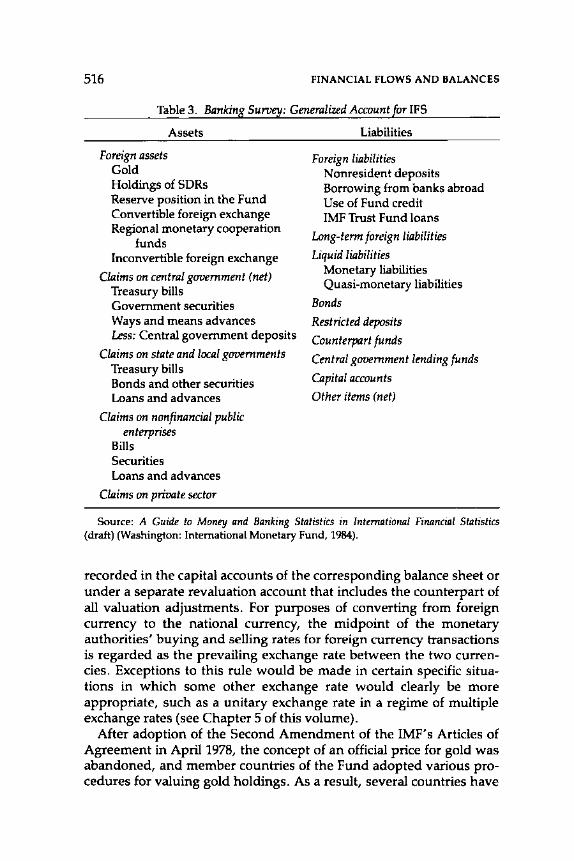
516 FINANCIAL FLOWS AND BALANCES
Table 3. Banking Survey: Generalized Account for IFS
Foreign assets Gold
Assets
Holdings of SDRs Reserve position in the Fund Convertible foreign exchange Regional monetary cooperation
funds Inconvertible foreign exchange
Claims on central government (net) Treasury bills Government securities Ways and means advances Less: Central government deposits
Claims on state and local governments Treasury bills Bonds and other securities Loans and advances
Claims on nonfinancial public enterprises
Bills Securities Loans and advances
Claims on private sector
Liabilities
Foreign liabilities Nonresident deposits Borrowing from banks abroad Use of Fund credit IMF Trust Fund loans
Long-term foreign liabilities
Liquid liabilities Monetary liabilities Quasi-monetary liabilities
Bonds Restricted deposits Counterpart funds Central government lending funds
Capital accounts Other items (net)
Source: A Guide to Money and Banking Statistics in International Financial Statistics (draft) (Washington: International Monetary Fund, 1984).
recorded in the capital accounts of the corresponding balance sheet or under a separate revaluation account that includes the counterpart of all valuation adjustments. For purposes of converting from foreign currency to the national currency, the midpoint of the monetary authorities' buying and selling rates for foreign currency transactions is regarded as the prevailing exchange rate between the two currencies. Exceptions to this rule would be made in certain specific situations in which some other exchange rate would clearly be more appropriate, such as a unitary exchange rate in a regime of multiple exchange rates (see Chapter 5 of this volume).
After adoption of the Second Amendment of the IMF' s Articles of Agreement in April1978, the concept of an official price for gold was abandoned, and member countries of the Fund adopted various procedures for valuing gold holdings. As a result, several countries have
MBS AND SNA VALUATION AND RECONCILIATION 517
adopted new gold valuation procedures based on gold prices in the private market, whereas a substantial number still continue to value their official gold holdings at some historical official price. In the MBS, no attempt is made to provide standardized value data on a country's holdings of gold.
Valuation Adjustments
Because valuation adjustments resulting from domestic price changes do not reflect flows of transactions, in the balance-sheet structure of the MBS the counterparts of these adjustments are entered as offsetting entries in the capital accounts of the balance sheet. Similarly, valuation adjustments made to foreign exchange holdings and foreign liabilities on account of exchange rate changes also result in unrealized profits and losses, which are recorded as revaluation items under the reconciliation account. As noted above, gold valuation practices differ among countries. For countries that value gold at market-related prices, it is the general practice that the resulting profits or losses are undistributed and are reported separately in national sources in a gold adjustment subaccount of the reconciliation account. The timing of such valuation adjustments also varies in practice; they may be carried out at prescribed intervals-for example, on balance sheet dates-or only when transactions give rise to realized profits and losses.
Deriving Transaction Flows from MBS Balance Sheets
Contrary to the structure of the SNA, which, in addition to presenting data in the framework of the balance sheet, provides information on transaction flows in the capital finance account, information on financial transactions in MBS must be derived from available balancesheet data that include both transaction flows and valuation adjustments. In theory, it should be possible to make use of the data on valuation adjustments that are recorded in the capital accounts to isolate all price-related changes from transactions flows. In practice, however, it is not possible to adopt this methodology for specific financial instruments because the valuation adjustments made to individual assets and liabilities are usually recorded as aggregate totals in the capital accounts, with inadequate supporting details concerning individual adjustments.
An alternative procedure for estimating transaction flows is to make use of price indices for individual financial instruments denom-
518 FINANCIAL FLOWS AND BALANCES
inated in domestic currency that take into account those price developments that have a direct impact on the instruments in question during a given period. Such indices can, for example, be constructed from information on stock, bond, and share price developments and can be used to deflate end-period values, thereby yielding values in constant prices from which the flow of transactions can be easily calculated. For instruments denominated in foreign currency, the procedures to be followed are somewhat different. The Fund's International Banking Statistics (IBS) recommends that entries in national currency be converted back to their original currencies using the applicable effective end-period exchange rates. 5 Changes in these positions are then calculated in terms of the original currencies. These changes are then converted to the national currency using periodaverage exchange rates. To yield accurate results, these procedures for estimating transaction flows from stocks are recommended only when a significant amount of detail is available for each of the relevant balance-sheet entries.
III. Conclusions
The principles of valuation play an important role in measuring the relative importance of various assets and liabilities in the balancesheet structure of the SNA and the MBS. These valuation principles, as they apply to financial instruments, are generally comparable for both the SNA and the MBS and emphasize the appropriateness of valuing short-term instruments at face value, long-term domestic assets and liabilities at market prices, and foreign assets and liabilities at the prevailing exchange rate. The MBS recognizes, however, that these principles of valuation represent only a framework of reference, since balance sheets made available from national sources very often reflect national accounting and bank supervisory practices that differ from those recommended in the MBS.
The derivation of transaction flows from balance-sheet stock positions may also be necessary for economic and financial analysis in the absence of detailed data on the volume of transactions. The calculation of flows is, however, complicated whenever balance-sheet entries are revalued following changes in market prices of financial instruments and movements in exchange rates. As regards the SNA, because of the residual nature of the reconciliation account and the
5 See Joslin Landell-Mills, The Fund's International Banking Statistics (Washington: International Monetary Fund, 1986), p. 18.
MBS AND SNA VALUATION AND RECONCILIATION 519
inclusion of adjustments other than those related to valuation, it is not possible to derive transaction flows by adjusting individual balance-sheet entries with items recorded in the reconciliation account. In the MBS, because of the aggregated nature of the data, it is also impractical to use data on valuation changes that are shown in the capital accounts to adjust the values of individual balance-sheet items. Depending on the degree of detail provided in the balance sheet itself, in these cases alternative procedures-such as first deflating the end-period values of domestic assets with appropriate price indices, and reconverting foreign instruments into original currencies before calculating flows-can provide a mechanism for estimating transactions from the balance-sheet data. Consideration should, therefore, be given to the inclusion of a section in the revised SNA and in the revised MBS Guide that outlines these procedures for estimating flows from stock data.
29
Treatment of Output in the Banking Industry
ABUL SIDDIQUE
T HERE ARE DIFFERENT ways of looking at what the banking industry produces, although the concept of input is intermediate pur
chases as in other industries. According to one view, the output of banks consists of services to depositors rather than to borrowers because, in national income and product accounting, interest payments are regarded as output of the paying rather than the receiving industry. This view, however, is grounded in the difficulties of allocating banking services among the borrowing industries. A comprehensive definition of banking output should, therefore, be based on a closer examination of banking activity and banking costs. Such an examination would show that financial services (rather than deposits or loans) are the products of banking. These services can be grouped into three main categories:
• Providing the medium of payments
• Intermediation between borrowers and lenders • Specialized financial services such as trust department and for-
eign exchange services, investment banking services, and so on.
Medium of payments services are provided to demand depositors; intermediation services are rendered to both depositors and borrowers; and other specialized services are provided to depositors, borrowers, and other customers.
All these banking activities involve interest receipts and payments, and explicit and implicit service charges. The crucial problem in defining value added is in determining the part of interest payments that is for intermediation services provided by banks and the part that is for the depositor's liquidity preference, since depositors are paying to the banks implicitly by accepting interest rates lower than what they
520
OUTPUT IN THE BANKING INDUSTRY 521
could earn from higher-yielding assets. Another important issue concerns the net exports of banking services by a country. In the present version of the United Nations' A System of National Accounts (SNA), all imputed bank service charges are allocated to domestic industry as intermediate demand and, as such, do not affect gross domestic product (GOP). A deficiency of nonallocation of imputed bank service charges between intermediate and final demand is that the GOP of countries that are net exporters of banking services would be understated, whereas the GOP of countries that are net importers of banking services would be overstated. Without resolving these issues, a straightforward application of national accounting concepts to the calculation of value added in the banking industry results in very small or negative value added in the banking industry for reasons that are explained below.
The rest of the paper will take the present SNA treatment of this "banking income anomaly" and the various proposed revisions as points of departure for suggesting some practicable procedures for computing sectoral origins of the banking product for intermediate and final consumption. Section I outlines the present SNA treatment of the banking income anomaly and reviews the various proposals made at the Organization for Economic Cooperation and Development (OECD) Meeting of National Accounts Experts in May 1986.1
This section also discusses the allocation of imputed banking services between intermediate consumption and final demand, with an illustration using data for Luxembourg. Section II briefly outlines the work done in the IMF' s Bureau of Statistics on sectoral imputations and allocation of banking output.2 Finally, Section III makes suggestions for further work, and, in particular, discusses briefly issues relating to an appropriate deflator for banking sector output, including the question of measuring productivity in this sector.
I. Present SNA Practice and Review of Proposals for Change
As pointed out above, the application of the usual procedure for estimating value added for the banking sector produces very small or
1 The OECD proposals were originally contained in a paper by the Committee on Financial Markets, "Measuring the Output of Financial Institutions in the National Accounts" (Paris: OECD, December 1985).
2 Presented in a paper by Howell Zee, "Determination of the Output of the Banking Industry in National Income Accounts: A Critical Survey of Concepts" (unpublished; Washington: IMF, Bureau of Statistics, August 1981).
522 FINANCIAL FLOWS AND BALANCES
negative value added. This is because value added by banks comprises net interest paid, employee compensation, and other income net of provisions for loan losses; of these, the largest item is usually net interest paid, which is commonly a negative figure.3 This is clearly inconsistent with the generally evident growth of the banking sector in national economies.
Present SNA Practice
The present SNA has tried to get around this anomaly by imputing a charge for the undercharged or "free" services that banks usually provide to their customers. This imputed amount represents the difference between the income received by financial institutions on loans and investments made from deposits and the interest paid on these deposits. These imputed charges are considered to have been paid by various industries for banking services and are treated as intermediate consumption of those industries. To avoid double counting and because it is extremely difficult to attribute these imputed charges to the various industries, the aggregate imputed value is deducted from GOP as a single item representing the negative value added of a national financial institution.
Proposals for Change
A review of the proposals for change, prepared by the OECD, suggests two basically different ways of solving the banking income anomaly in the present SNA. One set of proposals suggests a redefinition of interest transactions as the sale and purchase of services for which receipts and payments are explicit and, as such, no imputation is necessary. The other set of proposals suggests that the services provided by banks to depositors are not explicitly paid for, but a service charge is implicit in the interest payments made to depositors. These two approaches have different effects on the measures of total national product and of output originating in nonfinancial industries.
If interest transactions were redefined as the sale and purchase of services, the debtor sector's value added would be reduced by the amount of interest paid, the banking sector's value added would be increased by interest received, and the nation's output would remain unchanged. With appropriate imputation to depositors, banking sec-
3 Ibid., p. 6.
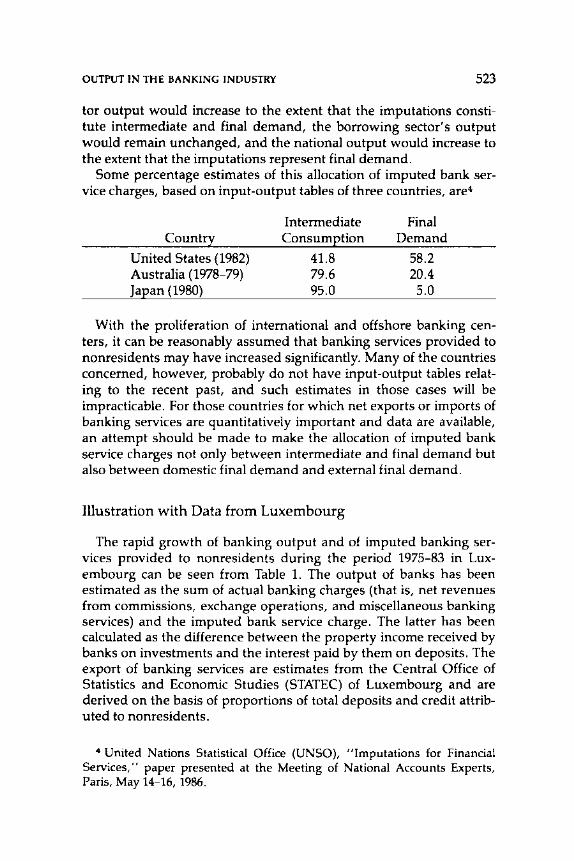
OUTPUT IN THE BANKING INDUSTRY 523
tor output would increase to the extent that the imputations constitute intermediate and final demand, the borrowing sector's output would remain unchanged, and the national output would increase to the extent that the imputations represent final demand.
Some percentage estimates of this allocation of imputed bank service charges, based on input-output tables of three countries, are4
Intermediate Final Country
United States (1982) Australia (1978-79) Japan (1980)
Consumption
41.8 79.6 95.0
Demand
58.2 20.4 5.0
With the proliferation of international and offshore banking centers, it can be reasonably assumed that banking services provided to nonresidents may have increased significantly. Many of the countries concerned, however, probably do not have input-output tables relating to the recent past, and such estimates in those cases will be impracticable. For those countries for which net exports or imports of banking services are quantitatively important and data are available, an attempt should be made to make the allocation of imputed bank service charges not only between intermediate and final demand but also between domestic final demand and external final demand.
Illustration with Data from Luxembourg
The rapid growth of banking output and of imputed banking services provided to nonresidents during the period 1975-83 in Luxembourg can be seen from Table 1. The output of banks has been estimated as the sum of actual banking charges (that is, net revenues from commissions, exchange operations, and miscellaneous banking services) and the imputed bank service charge. The latter has been calculated as the difference between the property income received by banks on investments and the interest paid by them on deposits. The export of banking services are estimates from the Central Office of Statistics and Economic Studies (STATEC) of Luxembourg and are derived on the basis of proportions of total deposits and credit attributed to nonresidents.
4 United Nations Statistical Office (UNSO), "Imputations for Financial Services," paper presented at the Meeting of National Accounts Experts, Paris, May 14-16, 1986.
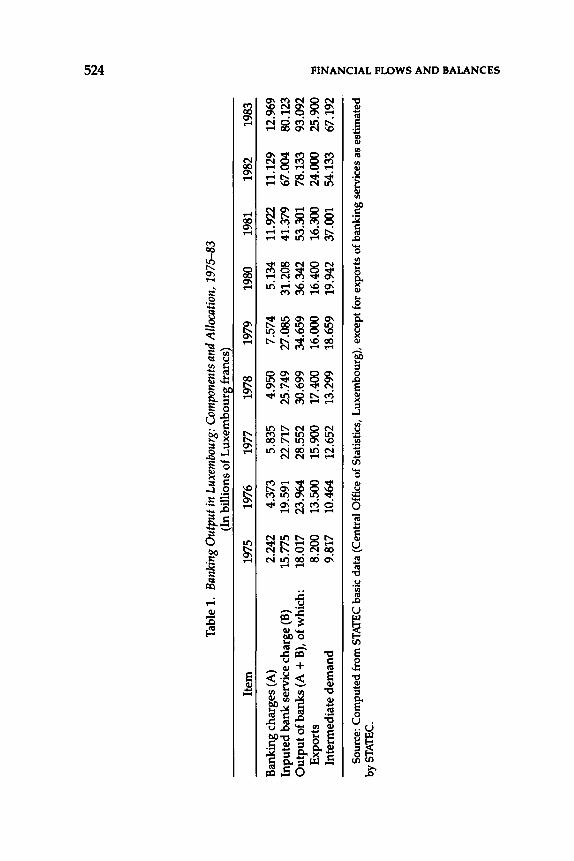
Tab
le 1
. Ba
nkin
g O
utpu
t in
Luxe
mbo
urg:
Com
pone
nts
and
Allo
catio
n, 1
975-
83
(In
bill
ions
of L
uxem
bour
g fr
ancs
)
Item
19
75
1976
19
77
1978
19
79
1980
19
81
1982
19
83
Ban
king
cha
rges
(A)
2.24
2 4.
373
5.83
5 4.
950
7.57
4 5.
134
11.9
22
11.1
29
12.9
69
Inpu
ted
bank
ser
vice
cha
rge
(B)
15.7
75
19.5
91
22.7
17
25.7
49
27.0
85
31.2
08
41.3
79
67.0
04
80.1
23
Ou
tpu
t of b
anks
(A +
B),
of w
hich
: 18
.017
23
.964
28
.552
30
.699
34
.659
36
.342
53
.301
78
.133
93
.092
E
xpor
ts
8.20
0 13
.500
15
.900
17
.400
16
.000
16
.400
16
.300
24
.000
25
.900
In
term
edia
te d
eman
d
9.81
7 10
.464
12
.652
13
.299
18
.659
19
.942
37
.001
54
.133
67
.192
Sou
rce:
Com
pute
d fr
om S
TATE
C b
asic
dat
a (C
entr
al O
ffic
e of
Sta
tist
ics,
Lux
embo
urg)
, ex
cept
for
exp
orts
of
bank
ing
serv
ices
as
esti
mat
ed
byST
AT
EC
.
~ ..., z > z ("
) ~ s ~ fll > z 0 ~ z ("
) !!
I fl
l
OUTPUT IN THE BANKING INDUSTRY 525
The definition of bank output in this illustration is the same as in the present SNA. However, instead of treating the entire imputed bank output as intermediate demand (the SNA treatment), this illustration treats part of the output as exports, thus as final demand. This has the effect of increasing GOP by the additional final demand originating from banking services provided to nonresidents. The significant differences between GOP excluding the export of banking services and GOP including the export of banking services during the period 1975-85 are shown in Table 2.
It has not been possible to estimate the proportions of imputed bank service charge that should be attributed to the household and the government sectors because of the unavailability of data on deposits received from and credit provided to those sectors. Thus, GOP is still understated to the extent that the imputed bank service charge attributable to households and government is final demand rather than intermediate consumption. The additional final demand of the imputed bank service charge from these two sectors can in principle be calculated on the basis of opportunity cost or other economic criteria. s This element should be relatively more important for countries that are not significant exporters of banking services but have a sizable banking sector catering to the domestic economy.
Although the imputation discussed above is not necessary in the ''commodity-type service'' treatment, it would make the contribution of capital to the value added of a firm depend on whether the capital was borrowed or owned.6 Economic reasoning would suggest that own capital also has cost because it could have earned interest as bank deposits or other types of marketable assets.
II. New Perspective on Sectoral Imputations and Allocations of Banking Output
From a review of the different proposals, it would appear that it is insufficient to impute banking services to depositors only; the imputation should also be allocated, according to conceptually valid procedures to all groups benefiting from it. The paper by Zee on the
5 See Zee, "Determination of the Output of the Banking Industry." 6 P. Sunga of Statistics Canada has proposed that the gross output of banks
would consist of the interest they receive plus any other service charges levied, and their intermediate consumption would include any interest that they pay to their depositors and lenders. Thus, there would be no need for imputation.
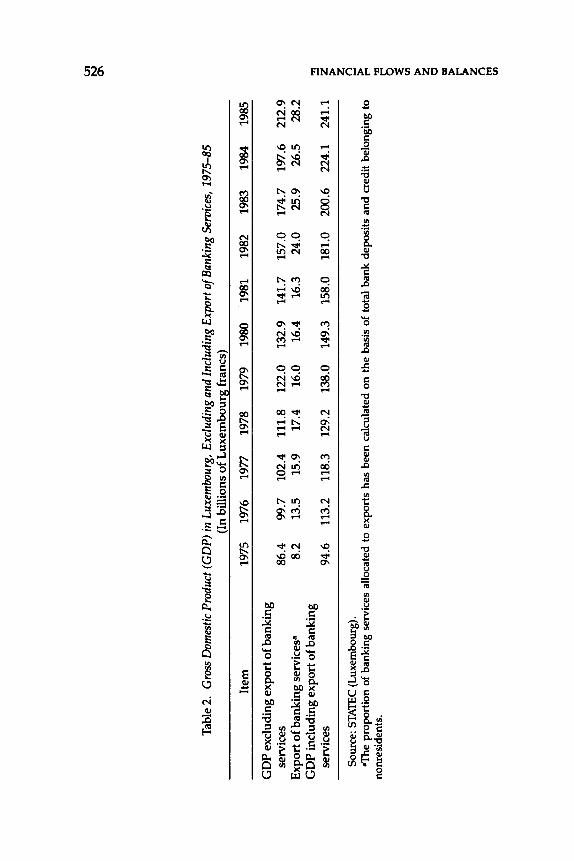
Tab
le 2
. G
ross
Dom
estic
Pro
duct
(G
DP)
in
Luxe
mbo
urg,
Exc
ludi
ng a
nd I
nclu
ding
Exp
ort o
f Ban
king
Ser
oice
s, 19
75-8
5 (I
n bi
llio
ns o
f L
uxem
bour
g fr
ancs
)
Item
19
75
1976
19
77
1978
19
79
1980
19
81
1982
19
83
1984
19
85
GO
P e
xclu
ding
exp
ort o
f ban
king
se
rvic
es
86.4
99
.7
102.
4 11
1.8
122.
0 13
2.9
141.
7 15
7.0
174.
7 19
7.6
212.
9 E
xpor
t of b
anki
ng s
ervi
cesa
8.
2 13
.5
15.9
17
.4
16.0
16
.4
16.3
24
.0
25.9
26
.5
28.2
G
OP
incl
udin
g ex
port
of b
anki
ng
serv
ices
94
.6
113.
2 11
8.3
129.
2 13
8.0
149.
3 15
8.0
181.
0 20
0.6
224.
1 24
1.1
Sou
rce:
STA
TEC
(L
uxem
bour
g).
aThe
pro
port
ion
of b
anki
ng s
ervi
ces
allo
cate
d to
exp
orts
has
bee
n ca
lcul
ated
on
the
basi
s of
tot
al b
ank
depo
sits
an
d c
redi
t be
long
ing
to
nonr
esid
ents
.
~ ..., z > z ("
) ~ ..., 5 ~ (/) > z 0 1:1
1 >
~ z (")
1:!1
(/)
OUTPUT IN THE BANKING INDUSTRY 527
concept and sectoral imputations and allocations of banking output makes such an attempt.7 It is based on the Mehl variant of the interest-as-composite-payment concept of banking outputs and allocates banking services to both borrowers and depositors, thus highlighting the intermediation function of the banking industry. Although imputations are necessary in the determination of the value of services sold implicitly to depositors, they are based on such economic concepts as opportunity costs of deposits and liquidity premiums, as illustrated for the United States in Zee's paper. Instead of making arbitrary imputations, as in the present SNA, Zee has used data from the Internal Revenue Service, the Federal Reserve System, and other U.S. agencies.
It is suggested that these procedures be considered for adoption in the revised SNA. The application of these procedures would increase the value added in the banking industry and consequently its savings. The savings of the borrowing industries would be reduced, and the entries in the SNA capital accumulation account would change correspondingly.
III. Suggestions for Further Work, with Special Reference to a Deflator for Banking Output
An unresolved question, which has not been discussed in any of the proposals, is that of an appropriate deflator or extrapolator for the current price output of the banking sector. The United Nations' Manual on National Accounts at Constant Prices suggests that some kind of "neutral" index, such as the consumer price index or the index of wholesale prices, be used as a deflator. 9 Theoretical questions have action hypothesis in deriving deflators for banking sector output. It has been shown that the deflator generated by the liquidity approach, which assumes that banks produce money to hold, tends to approximate the product of an index of interest rates and an index of the general price level. 10 In contrast, the deflator derived from the trans-
7 Zee, "Determination of the Output of the Banking Industry." 8 G.M. Mehl, "A Reconsideration of the Commercial Banking Imputation
in the Official U.S. National Accounts" (doctoral dissertation; State University of New York at Binghamton, 1976).
9 United Nations, Manual on National Accounts at Constant Prices, Statistical Papers, Series M, No. 64 (New York, 1979), p. 92.
10 The gross national product (GNP) deflator is not a suitable indicator for this purpose because the deflator for the imputed portion of bank output is a
528 FINANCIAL FLOWS AND BALANCES
action approach, which regards banks as producers of money to spend, tends to approximate an index of the general price level adjusted by the shifting relationships between an index of interest rates and the inverse of an index of the velocity of circulation.u Empirical work on this question remains scanty. Further theoretical and empirical work could try to find out whether, taking the same general price index, an index of interest rates on deposits or an index of wages and salaries of bank employees, or a combination of both, is a better deflator for the banking sector's output.
There is a further question that concerns the homogeneity of banking services. Even if there is agreement on the appropriate measures of gross output and value added, there is a need to review the scope for a more detailed commodity classification of banking services from the point of view of identifying homogeneous product groups that are suitable for decomposition into prices and quantities. This question should be addressed in the course of a discussion of appropriate deflators and of the kind of information that would be required. When extrapolation techniques are used (as would be the case in the real input approach), there will be a serious problem of quality change that would need to be addressed because of the substantial changes in the technology available to banks in conducting their business that have taken place in many financial markets in recent years. There is also the question of what indicators to use in estimating value added when balance-sheet and income statements of banks are not available. Because deposits and advances account for the bulk of the banking sector's income-generating transactions, a weighted average of these two could be considered.
To reduce errors and inaccuracies in estimating banking industry output, the SNA classification of the related products needs to be revised. Any revised classification should ensure that the products in the Central Product Classification (CPC) are consistent with the prod-
component of the overall GNP deflator, which cannot be derived until the commercial bank deflator has been settled. Besides, the GNP deflator is a Paasche-type index, and it represents not only changes in prices but also changes in the relative proportions of goods and services purchased. Either the wholesale price index or the consumer price index can be used, but the latter is to be preferred because it includes services that can show significant difference in price movements compared with goods.
11 See John A. Gorman, "Alternative Measures of the Real Output and Productivity of Commercial Banks," in Production and Productivity in the Service Industries, ed. by Victor R. Fuchs (New York: Columbia University Press for the National Bureau of Economic Research, 1969).

OUTPUT IN THE BANKING INDUSTRY 529
ucts measured and accounted for in the national accounts. Although national accounts estimates might in most cases be made as broad aggregates, these should be consistent with an implicit aggregation of the separate products as identified in the classification.
30
A Further Look at the Treatment of Insurance
in A System of National Accounts
AND~VANOU
T o MAKE IT EASIER to re-examine the way insurance is dealt with in the United Nations' A System of National Accounts (SNA), the rele
vant paragraphs of the 1968 SNA and the European System of Integrated Economic Accounts (ESA)l are reviewed. There are differences in the way the two systems assess gross premiums and claims, and it is proposed that, first of all, these points of divergence be eliminated.
I. Assessing Gross Premiums and Claims
Gross premiums, premium prepayments, daims, and reserves against unsettled claims are considered.
Gross Premiums
These do not appear in the accounts but are the basis on which the accounts are drawn up. The SNA (paragraph 7.54) records net premiums due to be paid (received) during the year, whereas the ESA (paragraph 315.k) records gross premiums earned (that portion of the premiums intended to cover risks during the financial year).
Note: The author thanks Pierre Muller and Jean-Pierre Dupuis for their helpful contributions to this study.
1 EUROSTAT, European System of Integrated Economic Accounts-ESA, 2d ed. (Luxembourg, 1979).
530
INSURANCE 531
Proposal
The ESA solution should be chosen because it is more correct in principle and in line with insurance companies' own accounting practice.
Prepayment of Premiums
It follows from the treatment of gross premiums that the SNA and the ESA do not deal with the prepayment of premiums in the same way.
Proposal
In line with the proposal for gross premiums, the prepayment of premiums should be considered as accounts receivable by the insured persons and as accounts payable by the insurance companies. Prepayments should be entered under a heading of "insurance technical reserves."
Claims
The SNA (paragraph 7 .54) considers that net claims are due on the date when the parties reach agreement or a claim has been adjudicated, whereas the ESA (paragraph 315.k) considers that claims are due at the time that the casualty occurs (there will therefore be some time lag, with the companies estimating the amount of the claim due and revising it if necessary at a later stage).
Proposal
The ESA solution should be chosen because it is more correct in principle and in line with insurance companies' own accounting practice.
Reserves Against Unsettled Claims
In the SNA, insurance claims not yet paid are entered under categories 8.12 or 9.12, "other accounts receivable and payable." The ESA, however, enters them under the heading "reserves against unsettled
532 FINANCIAL FLOWS AND BALANCES
claims," which is a subcategory of the heading "insurance technical reserves."
Proposal
The ESA solution should be adopted: the heading "insurance technical reserves" should be introduced in the revised SNA, with appropriate subcategories.
II. Claims Circuit
For covering risks run by third parties, the SNA (paragraph 7.56) recommends that claims should be recorded, first, as payments by the companies to policy holders and, second, as transfers from policy holders to injured parties. This treatment is in line with the law on liability but is highly unrealistic and irrelevant to national accounts.
Proposal
It should be considered that claims are paid directly to the units that are the ultimate beneficiaries, as is already done in the ESA (paragraph 455).
III. Assessing Insurance Services: Taking Investment Income into Account
By nature, the gross insurance premium is a composite flow. It would seem that the loading used by insurance companies in their calculations of gross premiums does not provide a practical basis for the calculation of that part of the premium intended to pay for insurance services. First, there appear to be few macroeconomic statistics that include loading data. Second, management costs may be partially covered by resources other than gross premiums (a proportion of investment income). In this case the loading included in the premiums is only partial, and the service component can be assessed only indirectly.
Application of the SNA (paragraphs 6.37 and 6.38) and ESA (paragraph 315.k) definitions appears, however, to have led to amounts being universally underestimated and to abnormal movements in the figures for insurance services. This is the result of insufficient account being taken of the insurance companies' financial activity and its
INSURANCE 533
results, especially in the form of income from financial investments made by the companies.
Let us first consider the simpler case of casualty insurance. The SNA assumes that the premium component intended to cover the risk is equal to the amount of claims due during the same period (collectively, of course). Thus, the service charge is calculated-still collectively-as the difference between gross premiums and claims due. 2 This solution would be wholly correct if the casualty insurance companies had no reserves and therefore no income from investment of these reserves. Taken to its logical conclusion, there would be an immediate set-off between that part of the gross premiums intended to cover risks and the amount of claims paid. In that case, gross premiums would be used to cover in full both the insurance service charges and claims due.
In reality, casualty insurance companies have major reserves and derive considerable income from investing them. The result is that claims are met not only from gross premiums but also from investment income. H there were no investment income, the total gross premiums paid by the insured persons would have to be much higher than they actually are, other things being equal.
For life insurance, the SNA and ESA both to a certain extent take account of the results of financial activity. To estimate the part of gross premiums that corresponds to the savings component, the SNA (paragraph 6.38) deducts from the change in technical reserves "the interest on these reserves, which accrues to policy holders. "3 Even though the results of financial activity have to some extent been taken into account, the assessment of life insurance services-like that of casualty insurance-has also produced deviant results.
When the French System of National Accounts (SECN)4 was last
2 The ESA solution is very similar, except that it admits the existence of actuarial reserves for casualty insurance (establishment of annuities) and thus gives a single definition for both casualty and life insurance.
3 The ESA goes a little farther. On the one hand, it takes into account the change in actuarial reserves for outstanding risks and the change in reserves for with-profits insurance, whereas the SNA mentions only the change in technical reserves (actuarial reserves). The intention is probably to cover the same things, but this point should be clarified. On the other hand, in addition to the imputed interest accruing to insurance policy holders, the ESA mentions realized capital gains that are distributed (paragraph 315.k). There seems to be a difference between the two systems here.
4 Institut National de Ia Statistique et des Etudes Economiques, Systeme Elargi de Comptabilite National (SECN), INSEE collection C44-45 (Paris, 1976).
534 FINANCIAL FLOWS AND BALANCES
revised, the assessment of insurance services was redefined. Insurance services are still defined as the difference between gross and net premiums, but paragraph 13.17 of the SECN defines net insurance premiums as the difference between technical charges and net investment income. Technical charges are claims due, together with the change in actuarial reserves and reserves for with-profits insurance. Net investment income represents the difference between the income from all investments in real estate and movable assets (rent, interest, dividends), together with the sum of the costs incurred for such investments (acquisition and maintenance costs, and so on) and the interest paid by the insurance companies in connection with reinsurance.
Net premiums are therefore equivalent to that part of the technical charges not covered by net investment income, and the latter is therefore by convention allocated first to coverage of technical charges.5
Strictly speaking, not all the net income from investments-included in France for reasons of data availability-should be included in the calculation, only the part of income that does not come from investment of the companies' equity capital. The correct formulation is as follows:
or
or
Net insurance premiums = technical charges - net investment income other than from equity capital,
Net insurance premiums= technical charges- net income from the investment of technical reserves,
Net insurance premiums = claims due + change in actuarial reserves and reserves for with-profits insurance - net income from the investment of technical reserves.
With casualty insurance, if it is assumed that there are no actuarial reserves,6 the definition becomes
5 Another convention, which shall be discussed below, would have been to agree that the net investment income could cover part of both the technical charges and the service charge.
6 If one considers, as the ESA does and as happens in practice, that there are (and this is the case in France for relatively small amounts) actuarial reserves and reserves for with-profits insurance in casualty insurance, it is preferable for the SNA to keep to a single, generally applicable definition, even though this may suggest that the reserves in question play a much
INSURANCE 535
Net premiums = claims due - net income from the investment of technical reserves.
Two rules thus apply, as follows:
• The technical reserves are a debt owed to insured persons collectively by the insurance companies, even though it is not always possible at the microeconomic level to determine the amount of the share of each insured person in those reserves.
• The net income from the investment of those reserves is used to finance the insurance technical charges. It is therefore allocated in full to the insured persons collectively. With casualty insurance, it works to reduce the amount of net premiums entered in the income and outlay account.7 For life insurance, interest imputed to insured persons also includes-and this is an extension of the SNA (paragraph 7 .48) and the ESA (paragraphs 432 and 433-the total income from the investment of technical reserves (SECN, paragraphs 13.33 and 13.34).
The first rule was applied in the ESA, whereas the SNA applied this rule only to the prepayment of premiums. The second rule was applied in both systems only in part. With perhaps some minor differences between the SNA and the ESA, the net investment income is allocated to insured persons only if the insurance companies have actually somehow credited that income to them. It seems that statutory or accounting practices may in this case conceal the economic logic behind these ideas.
The philosophy behind this treatment has been recommended by others. In a doctoral thesis presented in 1980-81 van den Berghe concentrates on the financial intermediary aspect of insurance activity. 8 He arrives at a solution close to that of the SECN for the assessment of insurance services but, in particular, does not include the income from real estate investments in his calculations.
smaller part in casualty insurance. 7 There is another possible solution (see footnote 5). 8 Lutgart van den Berghe, "Kritisch Onderzoek naar de Validiteit van de
Nationale Bockhouding Voor de Evaluatie van de Dienstverlening door de Verzekeringssector" (doctoral dissertation; Ghent, Belgium: University of Ghent, 1980-81). The English abstract of the dissertation was published by the International Association for the Study of Insurance Economics (Association Intemationale pour l'Etude de l'Economie de I' Assurance; Geneva Association) in October 1981 ("Critical Analysis into the Validity of the National Accounting for the Evaluation of the Services Performed by the Insurance Sector," Etudes et Dossiers, No. 51).
536 FINANCIAL FLOWS AND BALANCES
In his discussion of the background to this problem, van den Berghe reminds us that Richard Stone had already adopted a similar solution in his 1947 work for the Subcommittee on National Income Statistics of the League of Nations Committee of Statistical Experts. 9
It can be seen from Stone's work that the counterpart of the interest and dividends from investments is imputed to insured persons, whereas the payment of services is calculated as the balance of an account showing, on the one hand, gross premiums and the counterpart to investment income and, on the other hand, technical charges.1o Apart from differences in terminology and a few nuances, the identity
Gross premiums + investment income = claims + change in actuarial reserves (and so on) +service charge
introduced by the SECN in the 1980s thus appeared as long ago as in Stone's 1947 text. Similarly, as long ago as in the 1952 standardized system of the Organization for European Economic Cooperation, solutions other than that in the 1947 appendix were being used.
IV. Taking Account of Investment Income: A Component in the Calculation of Insurance Services
or the Imputed Output of Financial Services?
As Schiltz has indicated, an alternative solution would have been to keep to the method used to assess insurance services in the 1968 SNA and to add to the insurance companies' production account an imputed output of financial services along the lines of the imputed output of bank services.11 In this way, the emphasis would have been on the insurance companies' role as financial intermediaries.
This solution did not appear to be satisfactory, however, for two main reasons. First, it would have left the abnormal movements noted in the value of the output of insurance services. Second, it would have obscured the fact that the insurance companies' financial
9 Richard Stone, "Definition and Measurement of National Income and Associated Totals," in United Nations, Measurement of Natiotlllllncome and the Construction of Social Accounts, Studies and Reports on Statistical Methods, No. 7 (Geneva, 1947).
10 Stone, "Definition and Measurement of National Income," Tables 49 and 50 in the English edition.
11 Marie-Therese Schiltz,'' A New Method of Assessment of the Insurance Service Production," Review of Income and Wealth, Series 33 (December 1987), pp. 431-37.
INSURANCE 537
activity is a vital part of insurance activities proper and cannot be dissociated from them.
V. Assessing Insurance Services: What Happens to Capital Gains or Losses?
A comment in paragraph 13.33 of the SECN raises the question of gains realized by insurance companies when they dispose of assets. These gains, measured as the difference between the selling prices of the asset disposed of and the book values on the assets side of the balance sheet (in France, historical cost, corrected, if necessary, in the margin), have been considerable over the past few years. French insurance regulations include them in the financial revenue distributable to insured persons. Should they have been taken into account, either wholly or in part, in the new method of calculating insurance services? While recognizing that a problem did exist, the 1987 SECN did not settle the matter.
On further consideration, the following conclusion may be suggested. If the amount of technical charges, as it appears in the insurance companies' accounts, includes a revaluation component for those investments that are the counterpart of the technical reserves, that amount should be corrected by the revaluation component before being included in the formula for the calculation of insurance services.
The formula proposed,
Gross premiums received + net income from the investment of the technical reserves = technical charges (claims + change in actuarial reserves and reserves for with-profits insurance) + insurance services,
supposes that the technical charges are covered only by the net income from investment of the technical reserves and part of the gross premiums, since what is being determined is precisely that part of those gross premiums that covers technical charges, so that the amount of insurance services can be worked out as the residue.
If some of the technical charges result from the allocation of capital gains (realized or unrealized) to insured persons (actually paid to them, if added to claims due; or increasing their equity, if added to reserves), the estimated value of the insurance services is reduced by the same amount.
Under this hypothesis, the above formula should be completed as follows, taking into account also the possibility that capital losses may be allocated to insured persons:
538 FINANCIAL FLOWS AND BALANCES
Gross premiums received + net income from the investment of technical reserves + capital gains or losses allocated to insured persons12 =technical charges+ insurance services,
or, preferably,
Gross premiums received + net income from the investment of technical reserves = technical charges - capital gains or losses allocated to insured persons+ insurance services.
Insurance services are thus assessed as follows:
Insurance services = gross premiums received + net income from the investment of technical reserves - technical charges net of capital gains or losses allocated to insured persons.
Net premiums are defined as follows:
Net premiums = technical charges net of capital gains or losses allocated to insured persons - net income from the investment of technical reserves.
The formula applies whether the capital gains or losses are realized as a result of the sale of the assets concerned or are potential-that is, resulting from the writing up to market value of assets remaining on the companies' balance sheet. These gains or losses need only be a book allocation to the insured persons when the technical charges for the year are calculated by the companies. Only part of the capital gains or losses actually made may, of course (and, in general, probably will) be included.
The proposed solution is an extension of the treatment in the ESA (paragraph 315.k), which deducts from the change in actuarial reserves and reserves for with-profits insurance not only (as the SNA does) the interest credited to insured persons but also realized capital gains that are actually distributed to insured persons. The treatment proposed here does away with the restriction to realized gains allocated. Any capital gain or loss allocated to insured persons and included in the technical charges must be excluded from those technical charges when insurance services are calculated.
Practical implementation of the proposed solution entails obtaining from the insurance companies data that they have but that probably do not appear in their published accounts. In effect, the components of the insured persons' shares in the profits have to be known.
12 The phrase "and included in technical charges for the financial year" is always understood, of course.
INSURANCE
VI. Where Should Capital Gains or Losses Allocated to Insured Persons Be Recorded?
539
Capital gains or losses allocated by the companies to insured persons may be actually paid to insured persons or may increase their claims on the insurance companies. In either case, the ESA (paragraph 4112.i) records such gains or losses under capital transfers if they are in fact a redistribution of capital gains or losses realized.
It would appear that the SNA (paragraph 7.98) tackles the question only as regards pension funds. Because the equity of the individuals equals the net total value of the funds, the SNA provides for adjustments in the revaluation accounts (previously known as reconciliation accounts) of households and pension funds for all capital gains or losses (by implication, whether realized or not, with adjustments made annually).t3
The Provisional Guidelines (M 60, paragraphs 5.31 to 5.33 and 7.9) adopt a different position from that of the SNA.14 M 60 lumps together mutual insurance companies, where the policy holders are also the owners, and pension funds. It considers that in both cases there are reserves separate from those of the policy holders. 15 Capital gains realized and, perhaps, unrealized may be transferred to the policy holders' reserves when they are of a certain size and are liable to be permanent. If this transfer takes the form of a bonus, it appears under capital transfers. Otherwise, M 60 (see Table 7.1) enters an adjustment component in the reconciliation account, "transfers to households' equity on life insurance and pension fund technical reserves."
To clarify this point, assume that the insurance companies' assets are revalued regularly every year (with certain precautions being taken, of course) and that the equities of insured persons and shareholders, which are obviously not the same, would also be revalued by the appropriate amount. This hypothesis further assumes that the capital gains or losses would automatically be allocated annually to
13 Note that, for pension funds, the SNA (paragraph 7.97) allocates to members all of the net property income earned by the funds. The ESA (paragraph 433) allocates to them all of the property income derived from the investment of the technical reserves.
14 United Nations, Provisional International Guidelines on the National and Sectoral Balance-Sheet and ReconciliJltion Accounts of the System of National Accounts, Statistical Papers, Series M, No. 60 (New York, 1977).
15 This seems also to apply to the ESA (compare the wording of ESA paragraph 433).
540 FINANCIAL FLOWS AND BALANCES
the insured persons' equity in proportion to their shares in the companies' assets. The corresponding accounting flows would be recorded in the reconciliation accounts of the national accounts.
On the insurance companies' side, the various types of assets would be revalued, as would the companies' liabilities toward insured persons, and the net value of the companies (shareholders' equity) would be increased by the difference. For households, their equity on the insurance companies would increase (as would their net assets, by the equivalent amount). Realization or otherwise of the gains or losses would be immaterial, as would the fact that a fraction of the gains may actually have been paid to the policy holders. This latter transaction is considered to be a reduction in the households' assets, or a reduction in the companies' liabilities, in the same way as the payment of life insurance claims by a withdrawal from the actuarial reserves or the reserves for with-profits insurance.
Difficulties arise for several reasons. On the one hand, in some countries (the United Kingdom, the Netherlands, and Germany, for example) the companies make a clear distinction between ''the funds of insured persons" (an identified set of investments that is the counterpart to life insurance technical reserves: this is known as ''splitting assets") and shareholders' funds, thus making it easy to calculate separately the capital gains or losses on both.16 In other countries (in particular, France) the assets are fungible, and only overall calculations are possible; companies have certain statutory obligations but are given some room for maneuver. 17 On the other hand, assets are regularly revalued in some countries but not in others. Finally, when the revaluation takes place (notably at the point where assets are sold, which by that fact leads to a partial revaluation of assets), the companies do not always immediately allocate the corresponding gains or losses to the policy holders, to the value of the share due to them. It takes time for the gains or losses to filter through other reserves.
It may be imagined that national accountants do what the insurance companies cannot do: not only do compilers systematically revalue their assets (which it is vital for them to do, in any case, in order to draw up balance sheets), but they also revalue the reserves representing the insured persons' equity.1s One then would be back
16 It also makes it easy to calculate the net income from the investment of technical reserves as opposed to investment of the companies' equity capital.
17 Thus, in France insured persons are considered to have equity on a minimum of 85 percent of that part of capital gains corresponding pro rata to the technical reserves in life insurance investments.
18 The amount of the reserves representing the insured persons' equity on
INSURANCE 541
at square one. Although it would not be unrealistic, if certain conventions are forgone, this method would no doubt appear to be too daring for national accountants en masse, and would possibly involve them in conflicts of interest between companies and insured persons. Assume, therefore, that company assets are revalued by national accountants when balance-sheet accounts showing assets and liabilities are drawn up, but that the reserves that represent the insured persons' equity are revalued not by those officials but by the companies alone, in line with their statutory obligations (if any) and their marketing policies. The effect of revaluation may be-initially, at any rate-to increase the insurance companies' net assets.
When these gains or losses, whether realized or not, are transferred in the companies' books, in whole or in part, to the policy holders, there are two possibilities:
• This may be taken to be a transfer from the companies' assets to the insured persons' assets and, hence, entered under capital transfers. In this case, in the financial accounts, the change in the equity of insured persons on the companies should include this amount, which will actually be covered by the book change in the reserves allocated to policy holders.
• Alternatively, it may be considered that there is merely a time lag in recording the effects of the revaluation, and the amount may be entered in the reconciliation account. In this case, in the financial accounts, the change in the insured persons' equity on the com-
the liabilities side of the company balance sheets does not represent the exact value of that equity when there are considerable unrealized capital gains or losses. In France, at the end of 1985 the difference between the realized value and the net value on the investments balance was 49,000 million francs (as against 280 million francs net value) in the case of life insurance. This is not to say-the October 1987 stock market crash was sufficient demonstration-that these capital gains were all stable and could thus be allocated to the insured in proportion to their share in the investments. What is suggested is that, even in the case of strictly commercial types of insurance, all of these potential gains could not, in view of their size, be considered as the property of the shareholders alone. Subsequent discussions in France, when preparations were being made for the privatization of nationalized insurance companies, confirmed this point because the discussions concentrated particularly on the sharing out of the real value of company assets between policy holders and shareholders (in this case, the state). A further point is that part of the unrealized capital gains is also attributable to previously insured persons who, when their contracts expired, did not receive all the gains from the capital they had invested in the form of life insurance.
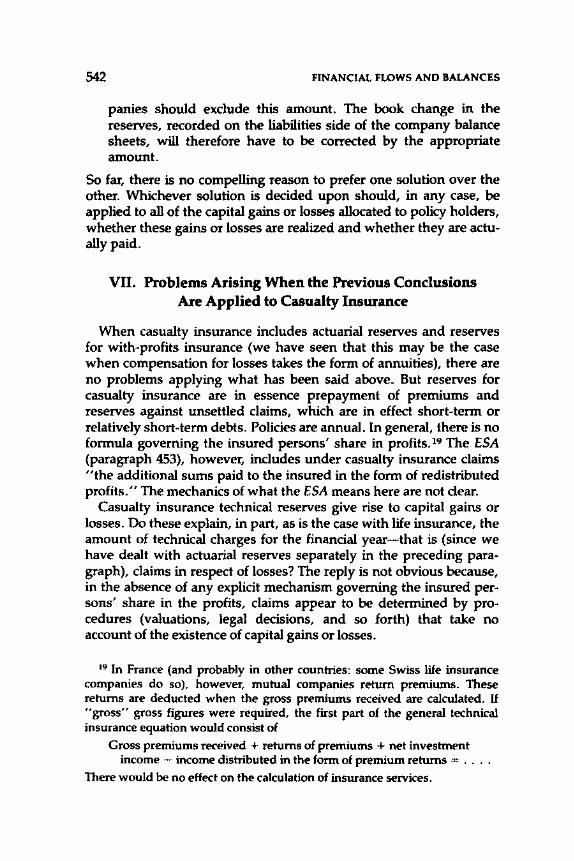
542 FINANCIAL FLOWS AND BALANCES
panies should exclude this amount. The book change in the reserves, recorded on the liabilities side of the company balance sheets, will therefore have to be corrected by the appropriate amount.
So far, there is no compelling reason to prefer one solution over the other. Whichever solution is decided upon should, in any case, be applied to all of the capital gains or losses allocated to policy holders, whether these gains or losses are realized and whether they are actually paid.
VII. Problems Arising When the Previous Conclusions Are Applied to Casualty Insurance
When casualty insurance includes actuarial reserves and reserves for with-profits insurance (we have seen that this may be the case when compensation for losses takes the form of annuities), there are no problems applying what has been said above. But reserves for casualty insurance are in essence prepayment of premiums and reserves against unsettled claims, which are in effect short-term or relatively short-term debts. Policies are annual. In general, there is no formula governing the insured persons' share in profits. 19 The ESA (paragraph 453), however, includes under casualty insurance claims ''the additional sums paid to the insured in the form of redistributed profits." The mechanics of what the ESA means here are not clear.
Casualty insurance technical reserves give rise to capital gains or losses. Do these explain, in part, as is the case with life insurance, the amount of technical charges for the financial year-that is (since we have dealt with actuarial reserves separately in the preceding paragraph), claims in respect of losses? The reply is not obvious because, in the absence of any explicit mechanism governing the insured persons' share in the profits, claims appear to be determined by procedures (valuations, legal decisions, and so forth) that take no account of the existence of capital gains or losses.
19 In France (and probably in other countries: some Swiss life insurance companies do so), however, mutual companies return premiums. These returns are deducted when the gross premiums received are calculated. If "gross" gross figures were required, the first part of the general technical insurance equation would consist of
Gross premiums received + returns of premiums + net investment income - income distributed in the form of premium returns = ....
There would be no effect on the calculation of insurance services.
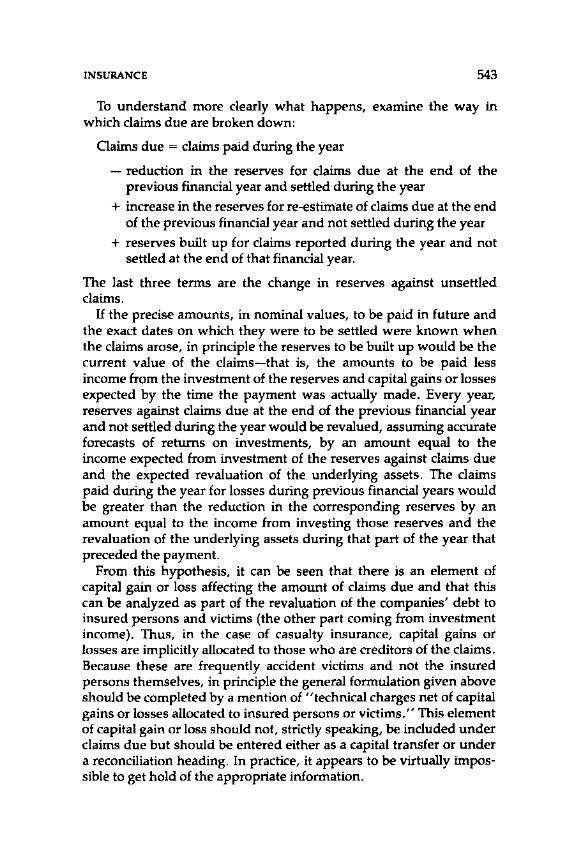
INSURANCE 543
To understand more clearly what happens, examine the way in which claims due are broken down:
Oaims due = claims paid during the year
- reduction in the reserves for claims due at the end of the previous financial year and settled during the year
+ increase in the reserves for re-estimate of claims due at the end of the previous financial year and not settled during the year
+ reserves built up for claims reported during the year and not settled at the end of that financial year.
The last three terms are the change in reserves against unsettled claims.
H the precise amounts, in nominal values, to be paid in future and the exact dates on which they were to be settled were known when the claims arose, in principle the reserves to be built up would be the current value of the claims-that is, the amounts to be paid less income from the investment of the reserves and capital gains or losses expected by the time the payment was actually made. Every year, reserves against claims due at the end of the previous financial year and not settled during the year would be revalued, assuming accurate forecasts of returns on investments, by an amount equal to the income expected from investment of the reserves against claims due and the expected revaluation of the underlying assets. The claims paid during the year for losses during previous financial years would be greater than the reduction in the corresponding reserves by an amount equal to the income from investing those reserves and the revaluation of the underlying assets during that part of the year that preceded the payment.
From this hypothesis, it can be seen that there is an element of capital gain or loss affecting the amount of claims due and that this can be analyzed as part of the revaluation of the companies' debt to insured persons and victims (the other part coming from investment income). Thus, in the case of casualty insurance, capital gains or losses are implicitly allocated to those who are creditors of the claims. Because these are frequently accident victims and not the insured persons themselves, in principle the general formulation given above should be completed by a mention of ''technical charges net of capital gains or losses allocated to insured persons or victims.'' This element of capital gain or loss should not, strictly speaking, be included under claims due but should be entered either as a capital transfer or under a reconciliation heading. In practice, it appears to be virtually impossible to get hold of the appropriate information.
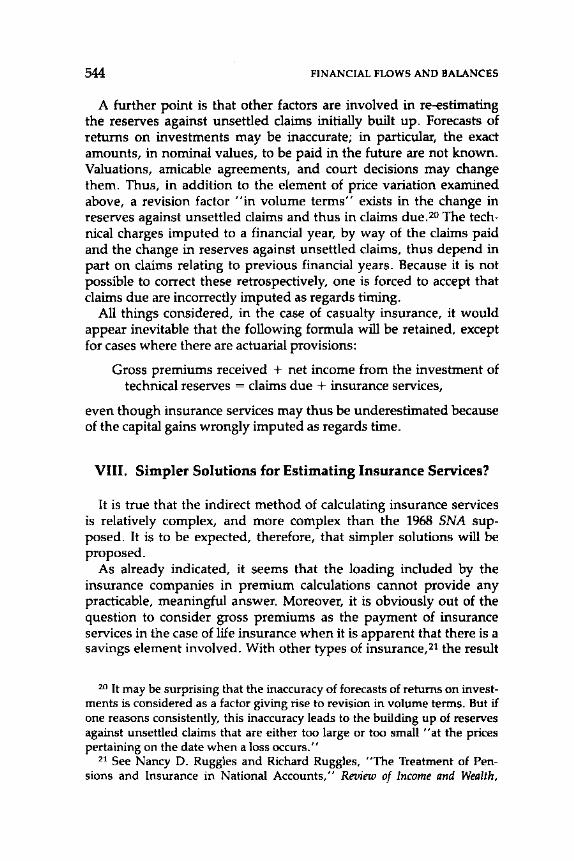
544 FINANCIAL FLOWS AND BALANCES
A further point is that other factors are involved in re-estimating the reserves against unsettled claims initially built up. Forecasts of returns on investments may be inaccurate; in particular, the exact amounts, in nominal values, to be paid in the future are not known. Valuations, amicable agreements, and court decisions may change them. Thus, in addition to the element of price variation examined above, a revision factor "in volume terms" exists in the change in reserves against unsettled claims and thus in claims due.2o The technical charges imputed to a financial year, by way of the claims paid and the change in reserves against unsettled claims, thus depend in part on claims relating to previous financial years. Because it is not possible to correct these retrospectively, one is forced to accept that claims due are incorrectly imputed as regards timing.
All things considered, in the case of casualty insurance, it would appear inevitable that the following formula will be retained, except for cases where there are actuarial provisions:
Gross premiums received + net income from the investment of technical reserves = claims due + insurance services,
even though insurance services may thus be underestimated because of the capital gains wrongly imputed as regards time.
VIII. Simpler Solutions for Estimating Insurance Services?
It is true that the indirect method of calculating insurance services is relatively complex, and more complex than the 1968 SNA supposed. It is to be expected, therefore, that simpler solutions will be proposed.
As already indicated, it seems that the loading included by the insurance companies in premium calculations cannot provide any practicable, meaningful answer. Moreover, it is obviously out of the question to consider gross premiums as the payment of insurance services in the case of life insurance when it is apparent that there is a savings element involved. With other types of insurance,21 the result
20 It may be surprising that the inaccuracy of forecasts of returns on investments is considered as a factor giving rise to revision in volume terms. But if one reasons consistently, this inaccuracy leads to the building up of reserves against unsettled claims that are either too large or too small "at the prices pertaining on the date when a loss occurs."
21 See Nancy D. Ruggles and Richard Ruggles, "The Treatment of Pensions and Insurance in National Accounts," Review of Income and Wealth,
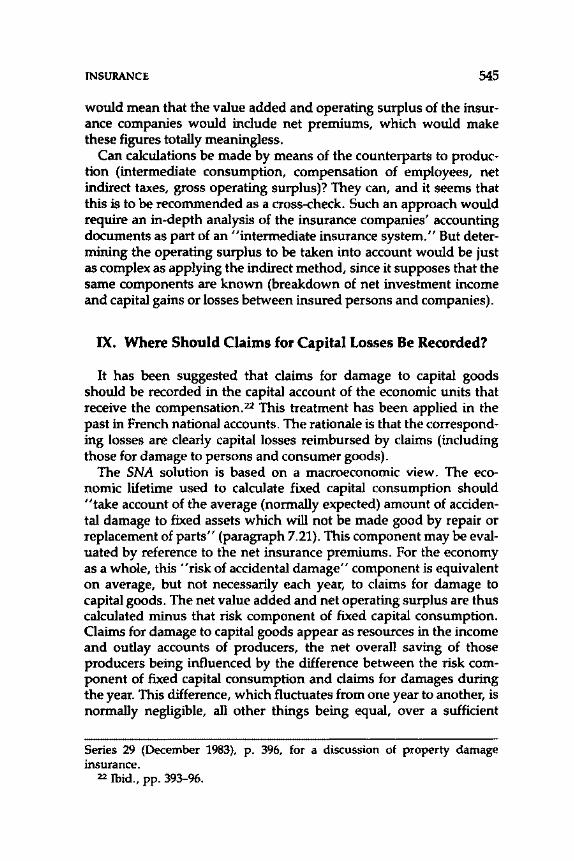
INSURANCE 545
would mean that the value added and operating surplus of the insurance companies would include net premiums, which would make these figures totally meaningless.
Can calculations be made by means of the counterparts to production (intermediate consumption, compensation of employees, net indirect taxes, gross operating surplus)? They can, and it seems that this is to be recommended as a cross-check. Such an approach would require an in-depth analysis of the insurance companies' accounting documents as part of an "intermediate insurance system." But determining the operating surplus to be taken into account would be just as complex as applying the indirect method, since it supposes that the same components are known (breakdown of net investment income and capital gains or losses between insured persons and companies).
IX. Where Should Claims for Capital Losses Be Recorded?
It has been suggested that claims for damage to capital goods should be recorded in the capital account of the economic units that receive the compensation.22 This treatment has been applied in the past in French national accounts. The rationale is that the corresponding losses are clearly capital losses reimbursed by claims (including those for damage to persons and consumer goods).
The SNA solution is based on a macroeconomic view. The economic lifetime used to calculate fixed capital consumption should "take account of the average (normally expected) amount of accidental damage to fixed assets which will not be made good by repair or replacement of parts" (paragraph 7.21). This component may be evaluated by reference to the net insurance premiums. For the economy as a whole, this "risk of accidental damage" component is equivalent on average, but not necessarily each year, to claims for damage to capital goods. The net value added and net operating surplus are thus calculated minus that risk component of fixed capital consumption. Claims for damage to capital goods appear as resources in the income and outlay accounts of producers, the net overall saving of those producers being influenced by the difference between the risk component of fixed capital consumption and claims for damages during the year. This difference, which fluctuates from one year to another, is normally negligible, all other things being equal, over a sufficient
Series 29 (December 1983), p. 396, for a discussion of property damage insurance.
22 Ibid., pp. 393-96.
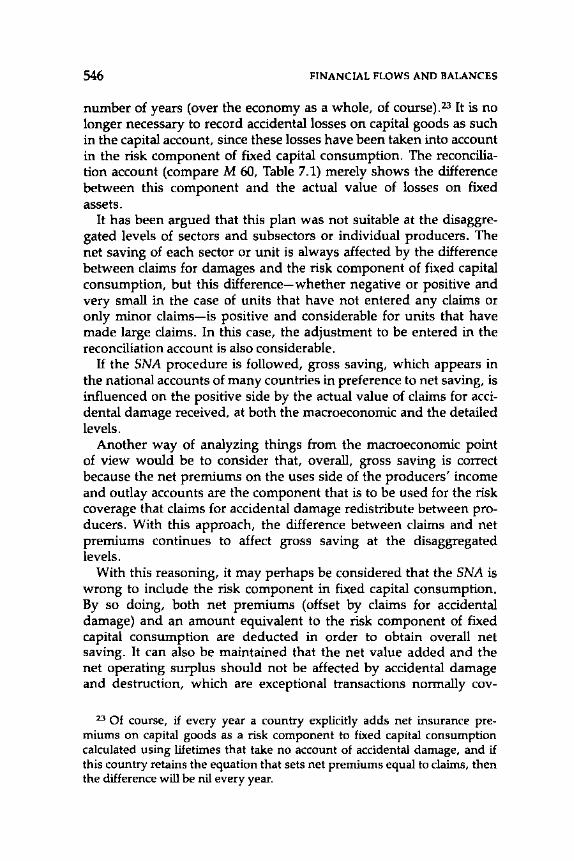
546 FINANCIAL FLOWS AND BALANCES
number of years (over the economy as a whole, of course).23 It is no longer necessary to record accidental losses on capital goods as such in the capital account, since these losses have been taken into account in the risk component of fixed capital consumption. The reconciliation account (compare M 60, Table 7.1) merely shows the difference between this component and the actual value of losses on fixed assets.
It has been argued that this plan was not suitable at the disaggregated levels of sectors and subsectors or individual producers. The net saving of each sector or unit is always affected by the difference between claims for damages and the risk component of fixed capital consumption, but this difference-whether negative or positive and very small in the case of units that have not entered any claims or only minor claims-is positive and considerable for units that have made large claims. In this case, the adjustment to be entered in the reconciliation account is also considerable.
If the SNA procedure is followed, gross saving, which appears in the national accounts of many countries in preference to net saving, is influenced on the positive side by the actual value of claims for accidental damage received, at both the macroeconomic and the detailed levels.
Another way of analyzing things from the macroeconomic point of view would be to consider that, overall, gross saving is correct because the net premiums on the uses side of the producers' income and outlay accounts are the component that is to be used for the risk coverage that claims for accidental damage redistribute between producers. With this approach, the difference between claims and net premiums continues to affect gross saving at the disaggregated levels.
With this reasoning, it may perhaps be considered that the SNA is wrong to include the risk component in fixed capital consumption. By so doing, both net premiums (offset by claims for accidental damage) and an amount equivalent to the risk component of fixed capital consumption are deducted in order to obtain overall net saving. It can also be maintained that the net value added and the net operating surplus should not be affected by accidental damage and destruction, which are exceptional transactions normally cov-
23 Of course, if every year a country explicitly adds net insurance premiums on capital goods as a risk component to fixed capital consumption calculated using lifetimes that take no account of accidental damage, and if this country retains the equation that sets net premiums equal to claims, then the difference will be nil every year.
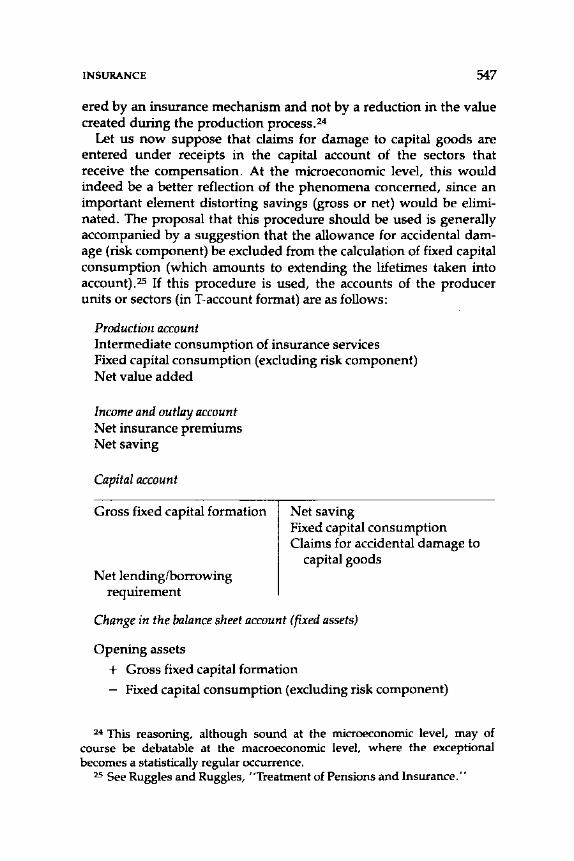
INSURANCE 547
ered by an insurance mechanism and not by a reduction in the value created during the production process.24
Let us now suppose that claims for damage to capital goods are entered under receipts in the capital account of the sectors that receive the compensation. At the microeconomic level, this would indeed be a better reflection of the phenomena concerned, since an important element distorting savings (gross or net) would be eliminated. The proposal that this procedure should be used is generally accompanied by a suggestion that the allowance for accidental damage (risk component) be excluded from the calculation of fixed capital consumption (which amounts to extending the lifetimes taken into account).25 If this procedure is used, the accounts of the producer units or sectors (in T-account format) are as follows:
Production account Intermediate consumption of insurance services Fixed capital consumption (excluding risk component) Net value added
Income and outlay account Net insurance premiums Net saving
Capital account
Gross fixed capital formation
Net lending/borrowing requirement
Net saving Fixed capital consumption Claims for accidental damage to
capital goods
Change in the balance sheet account (fixed assets)
Opening assets
+ Gross fixed capital formation - Fixed capital consumption (excluding risk component)
24 This reasoning, although sound at the microeconomic level, may of course be debatable at the macroeconomic level, where the exceptional becomes a statistically regular occurrence.
25 See Ruggles and Ruggles, "Treatment of Pensions and Insurance."
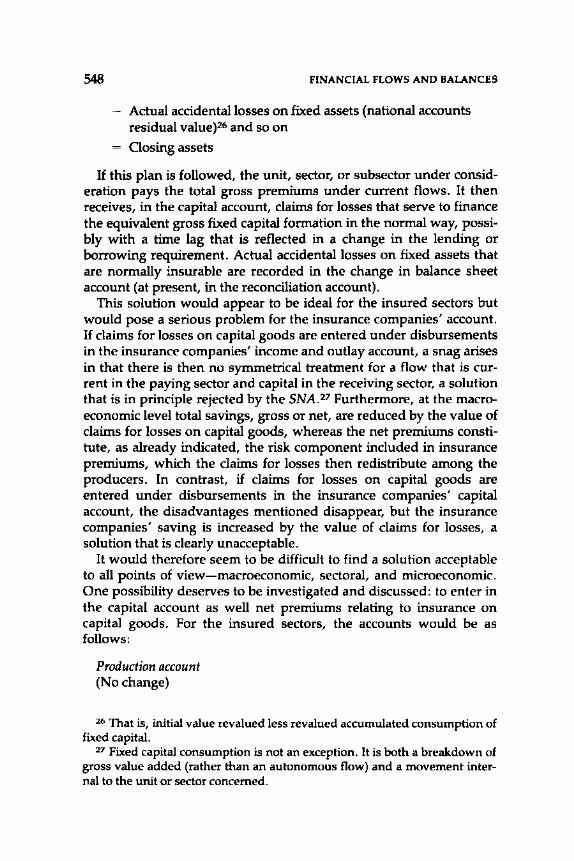
548 FINANCIAL FLOWS AND BALANCES
Actual accidental losses on fixed assets (national accounts residual value )26 and so on
= Oosing assets
If this plan is followed, the unit, sector, or subsector under consideration pays the total gross premiums under current flows. It then receives, in the capital account, claims for losses that serve to finance the equivalent gross fixed capital formation in the normal way, possibly with a time lag that is reflected in a change in the lending or borrowing requirement. Actual accidental losses on fixed assets that are normally insurable are recorded in the change in balance sheet account (at present, in the reconciliation account).
This solution would appear to be ideal for the insured sectors but would pose a serious problem for the insurance companies' account. If claims for losses on capital goods are entered under disbursements in the insurance companies' income and outlay account, a snag arises in that there is then no symmetrical treatment for a flow that is current in the paying sector and capital in the receiving sector, a solution that is in principle rejected by the SNA.27 Furthermore, at the macroeconomic level total savings, gross or net, are reduced by the value of claims for losses on capital goods, whereas the net premiums constitute, as already indicated, the risk component included in insurance premiums, which the claims for losses then redistribute among the producers. In contrast, if claims for losses on capital goods are entered under disbursements in the insurance companies' capital account, the disadvantages mentioned disappear, but the insurance companies' saving is increased by the value of claims for losses, a solution that is clearly unacceptable.
It would therefore seem to be difficult to find a solution acceptable to all points of view-macroeconomic, sectoral, and microeconomic. One possibility deserves to be investigated and discussed: to enter in the capital account as well net premiums relating to insurance on capital goods. For the insured sectors, the accounts would be as follows:
Production account (No change)
26 That is, initial value revalued less revalued accumulated consumption of fixed capital.
27 Fixed capital consumption is not an exception. It is both a breakdown of gross value added (rather than an autonomous flow) and a movement internal to the unit or sector concerned.
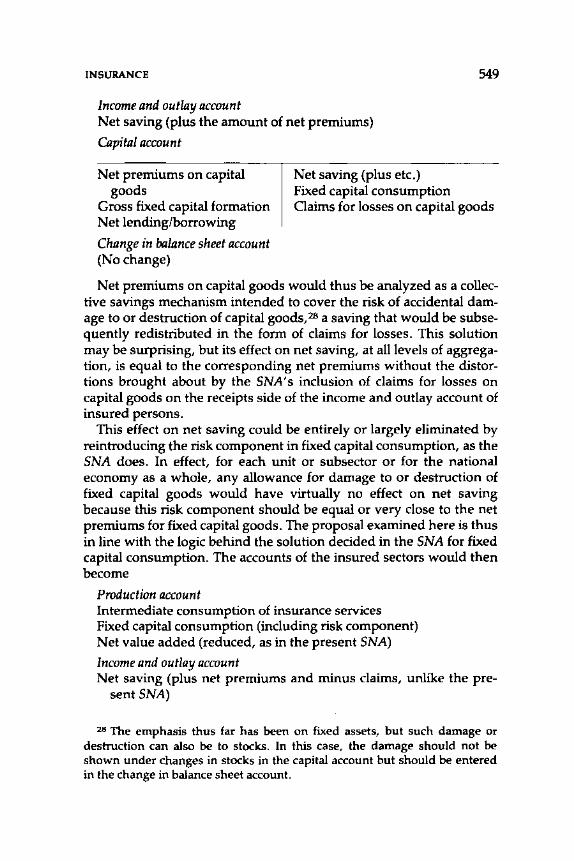
INSURANCE 549
Income and outlay account Net saving (plus the amount of net premiums)
Capital account
Net premiums on capital Net saving (plus etc.) goods
Gross fixed capital formation Net lending/borrowing
Fixed capital consumption Claims for losses on capital goods
Change in balance sheet account (No change)
Net premiums on capital goods would thus be analyzed as a collective savings mechanism intended to cover the risk of accidental damage to or destruction of capital goods,28 a saving that would be subsequently redistributed in the form of claims for losses. This solution may be surprising, but its effect on net saving, at all levels of aggregation, is equal to the corresponding net premiums without the distortions brought about by the SNA's inclusion of claims for losses on capital goods on the receipts side of the income and outlay account of insured persons.
This effect on net saving could be entirely or largely eliminated by reintroducing the risk component in fixed capital consumption, as the SNA does. In effect, for each unit or subsector or for the national economy as a whole, any allowance for damage to or destruction of fixed capital goods would have virtually no effect on net saving because this risk component should be equal or very close to the net premiums for fixed capital goods. The proposal examined here is thus in line with the logic behind the solution decided in the SNA for fixed capital consumption. The accounts of the insured sectors would then become
Production account Intermediate consumption of insurance services Fixed capital consumption (including risk component) Net value added (reduced, as in the present SNA)
Income and outlay account Net saving (plus net premiums and minus claims, unlike the pre
sentSNA)
28 The emphasis thus far has been on fixed assets, but such damage or destruction can also be to stocks. In this case, the damage should not be shown under changes in stocks in the capital account but should be entered in the change in balance sheet account.
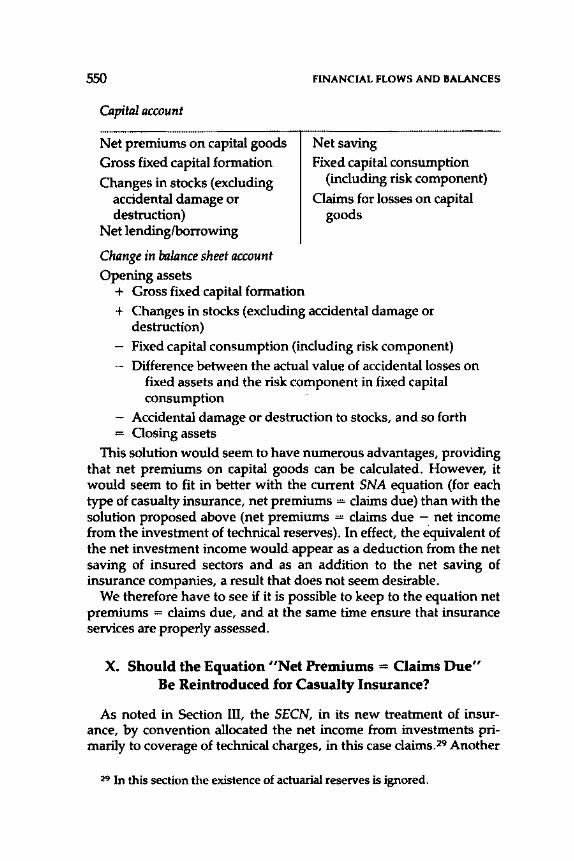
550 FINANCIAL FLOWS AND BALANCES
Capital account
Net premiums on capital goods Gross fixed capital formation
Changes in stocks (excluding accidental damage or destruction)
Net lending/borrowing
Change in balance sheet account Opening assets
+ Gross fixed capital formation
Net saving Fixed capital consumption
(including risk component)
Claims for losses on capital goods
+ Changes in stocks (excluding accidental damage or destruction) Fixed capital consumption (including risk component) Difference between the actual value of accidental losses on
fixed assets and the risk component in fixed capital consumption
Accidental damage or destruction to stocks, and so forth Oosing assets
This solution would seem to have numerous advantages, providing that net premiums on capital goods can be calculated. However, it would seem to fit in better with the current SNA equation (for each type of casualty insurance, net premiums =claims due) than with the solution proposed above (net premiums =claims due -net income from the investment of technical reserves). In effect, the equivalent of the net investment income would appear as a deduction from the net saving of insured sectors and as an addition to the net saving of insurance companies, a result that does not seem desirable.
We therefore have to see if it is possible to keep to the equation net premiums = claims due, and at the same time ensure that insurance services are properly assessed.
X. Should the Equation "Net Premiums = Claims Due" Be Reintroduced for Casualty Insurance?
As noted in Section III, the SECN, in its new treatment of insurance, by convention allocated the net income from investments primarily to coverage of technical charges, in this case claims.29 Another
29 In this section the existence of actuarial reserves is ignored.
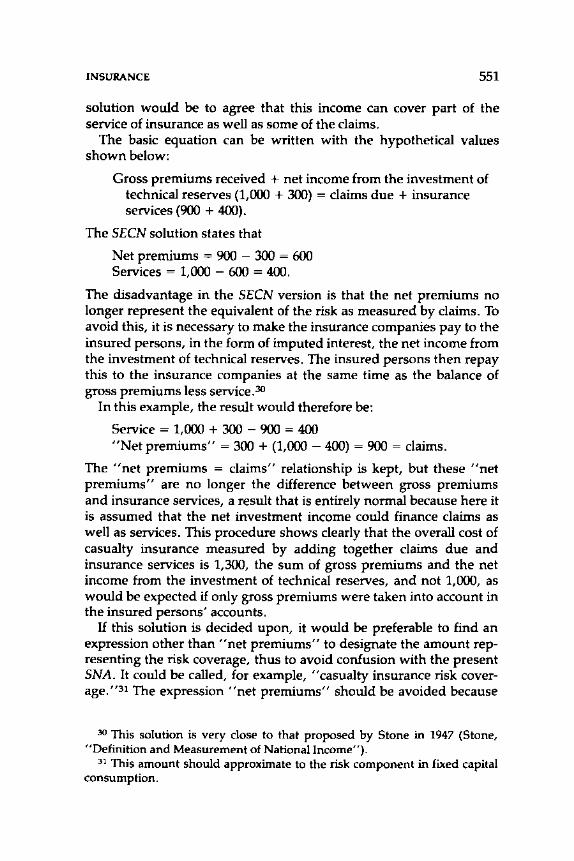
INSURANCE 551
solution would be to agree that this income can cover part of the service of insurance as well as some of the claims.
The basic equation can be written with the hypothetical values shown below:
Gross premiums received + net income from the investment of technical reserves (1,000 + 300) = claims due + insurance services (900 + 400).
The SECN solution states that
Net premiums = 900 - 300 = 600 Services = 1,000 - 600 = 400.
The disadvantage in the SECN version is that the net premiums no longer represent the equivalent of the risk as measured by claims. To avoid this, it is necessary to make the insurance companies pay to the insured persons, in the form of imputed interest, the net income from the investment of technical reserves. The insured persons then repay this to the insurance companies at the same time as the balance of gross premiums less service. 30
In this example, the result would therefore be:
Service= 1,000 + 300- 900 = 400 "Net premiums" = 300 + (1,000 - 400) = 900 = claims.
The "net premiums = claims" relationship is kept, but these "net premiums" are no longer the difference between gross premiums and insurance services, a result that is entirely normal because here it is assumed that the net investment income could finance claims as well as services. This procedure shows clearly that the overall cost of casualty insurance measured by adding together claims due and insurance services is 1,300, the sum of gross premiums and the net income from the investment of technical reserves, and not 1,000, as would be expected if only gross premiums were taken into account in the insured persons' accounts.
H this solution is decided upon, it would be preferable to find an expression other than "net premiums" to designate the amount representing the risk coverage, thus to avoid confusion with the present SNA. It could be called, for example, "casualty insurance risk coverage."31 The expression "net premiums" should be avoided because
30 This solution is very close to that proposed by Stone in 1947 (Stone, "Definition and Measurement of National Income").
31 This amount should approximate to the risk component in fixed capital consumption.
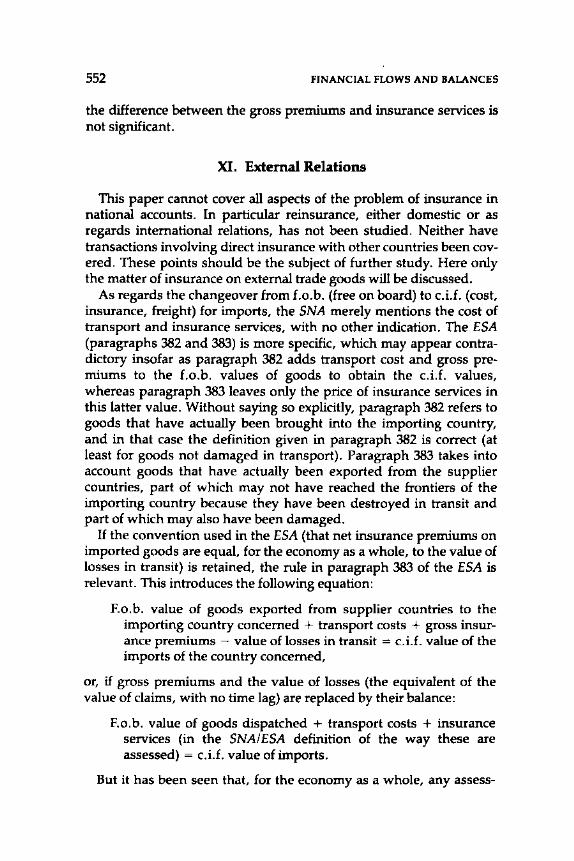
552 FINANCIAL FLOWS AND BALANCES
the difference between the gross premiums and insurance services is not significant.
XI. External Relations
This paper cannot cover all aspects of the problem of insurance in national accounts. In particular reinsurance, either domestic or as regards international relations, has not been studied. Neither have transactions involving direct insurance with other countries been covered. These points should be the subject of further study. Here only the matter of insurance on external trade goods will be discussed.
As regards the changeover from f.o.b. (free on board) to c.i.f. (cost, insurance, freight) for imports, the SNA merely mentions the cost of transport and insurance services, with no other indication. The ESA (paragraphs 382 and 383) is more specific, which may appear contradictory insofar as paragraph 382 adds transport cost and gross premiums to the f.o.b. values of goods to obtain the c.i.f. values, whereas paragraph 383 leaves only the price of insurance services in this latter value. Without saying so explicitly, paragraph 382 refers to goods that have actually been brought into the importing country, and in that case the definition given in paragraph 382 is correct (at least for goods not damaged in transport). Paragraph 383 takes into account goods that have actually been exported from the supplier countries, part of which may not have reached the frontiers of the importing country because they have been destroyed in transit and part of which may also have been damaged.
If the convention used in the ESA (that net insurance premiums on imported goods are equal, for the economy as a whole, to the value of losses in transit) is retained, the rule in paragraph 383 of the ESA is relevant. This introduces the following equation:
F.o.b. value of goods exported from supplier countries to the importing country concerned + transport costs + gross insurance premiums - value of losses in transit = c.i.f. value of the imports of the country concerned,
or, if gross premiums and the value of losses (the equivalent of the value of claims, with no time lag) are replaced by their balance:
F.o.b. value of goods dispatched + transport costs + insurance services (in the SNAIESA definition of the way these are assessed) = c.i.f. value of imports.
But it has been seen that, for the economy as a whole, any assess-

INSURANCE 553
ment of insurance services must take account of investment income. In order not to complicate the c.i.f./f.o.b. changeover (which is actually an f.o.b./c.i.f. changeover), the convention that, in the case of insurance on external trade, income from the investment of reserves is negligible should be adopted.32
32 Without this convention, the first equation above would read "value of losses in transit (that is, claims), net of investment income," and the second would read ''insurance service net of investment income.''
31
How to Treat Nonproduced Assets and Exceptional Events
in the National Accounts?
Considerations on the Variations in Wealth Accounting
}EAN-PAUL MILOT, PIERRE ThiLLET, AND ANDRE VANOU
N ational accounts should not only record flows but should also record wealth. To describe the latter, it is essential to form an
exhaustive accounts framework to analyze the changes in the value of wealth in successive years.
One of the difficulties most often felt in this field is the insufficiency of the ''flows'' to describe the changes in natural wealth, particularly as regards mineral deposits. When mineral deposits are discovered, the find is not valued; when the find is exploited, the value obtained is described without noting the decrease in the resources.
Discussions to date regarding the revision of the United Nations' A System of National Accounts (SNA) usually have proposed to enter these elements directly into the calculation of annual incomes. But economic analysis, as well as accounting constraints (incomes directly or indirectly issue from production), would then make it necessary to modify the scope and significance of the concept of production. In
Note: This is a revised version of a paper originally presented at the Twentieth General Conference of the International Association for Research in Income and Wealth, August 24-28, 1987. The French version is available on request from the authors: 18, bid A. Pinard - 75675 Paris, Cedex 14. This paper is reprinted, with minor editorial modifications, with permission from the Review of Income and Wealth, where it originally appeared in Series 35 (No. 2, June 1989), pp. 163-86.
554
NONPRODUCED ASSETS AND EXCEPTIONAL EVENTS 555
addition, the consequences for economic indicators that are linked with production (for example, productivity indicators) are considered unacceptable. Finally, the current range of treatments used for nonproduced wealth has proved insufficient for developing a usable practical solution.
In this paper we propose an approach, but no completely developed solutions. In Section I we examine the present configuration of the SNA and complementary manuals. In Section II we propose a structuring of the value of wealth in year n - 1 to that of year n. The structure obtained does not modify the definition of production, but it allows for calculating aggregates, thus completing the present income and wealth aggregates. In Section III, elements of analysis of the capital gains and losses are proposed.
I. The Current Configuration
The current version of the SNA proposes a capital finance account for each institutional sector, which describes how the flows deriving from production and capital transfers received and paid modify a sector's wealth (Table 1). This account shows the actual flows of purchases and sales of assets affecting wealth. It is not limited to assets derived from production (or imported), since it is necessary to take account of all transactions to obtain coherence with the financial operations.
However, the gross accumulation derived from this account does not completely represent the variation of the wealth of the sector during the period. Certain items described in the Provisional Guidelines (M 60)1 must be added to the annual flows. These items are presented in Table 2; all of them affect the change in wealth, but their justification may vary.
In certain cases, the existence of the item is the consequence of pure measurement problems: thus the natural growth of "breeding stock, draught animals, dairy cattle, and the like" (item 13.4.1.1 in Table 2) should be described in the flows of the present SNA. For practical reasons, however, this is not the case in general. In other cases, it is an issue that has not been resolved: the natural growth of forests is not described in production, nor is the consequence of their felling. Yet there is nothing to indicate that this is a conceptual choice or a
t United Nations, Provisional International Guidelines on the National and Sectoral Balance-Sheet and Reconciliation Accounts of the System of National Accounts, Statistical Papers, Series M, No. 60 (New York, 1977).
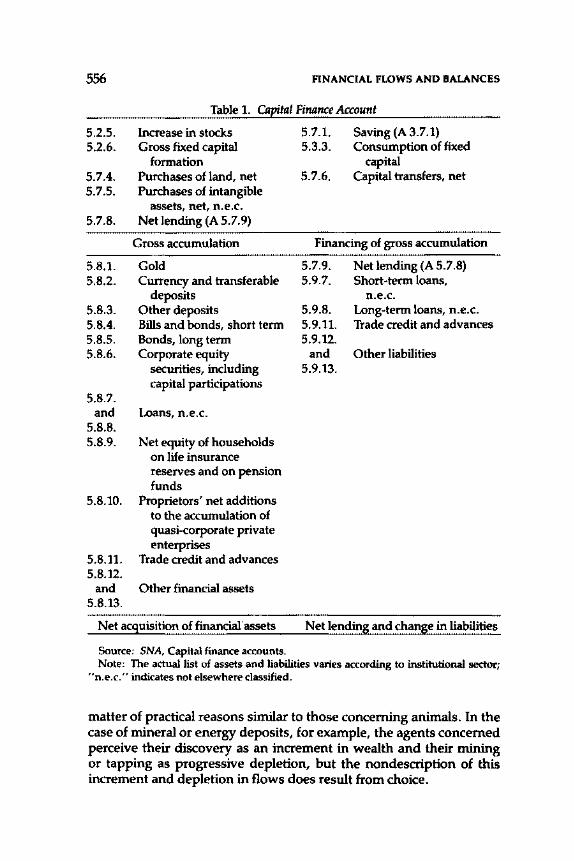
556 FINANCIAL FLOWS AND BALANCES
Table 1. Capital Finance Account
5.2.5. 5.2.6.
5.7.4. 5.7.5.
Increase in stocks Gross fixed capital
formation Purchases of land, net Purchases of intangible
assets, net, n.e.c. 5.7.8. Net lending (A 5.7.9)
5.8.1. 5.8.2.
5.8.3. 5.8.4. 5.8.5. 5.8.6.
5.8.7.
Gross accumulation
Gold Currency and transferable
deposits Other deposits Bills and bonds, short term Bonds, long term Corporate equity
securities, including capital participations
and Loans, n.e.c. 5.8.8. 5.8.9. Net equity of households
5.8.10.
5.8.11. 5.8.12.
and 5.8.13.
on life insurance reserves and on pension funds
Proprietors' net additions to the accumulation of quasi-corporate private enterprises
Trade credit and advances
Other financial assets
Net acquisition of financial assets
Source: SNA, Capital finance accounts.
5.7.1. 5.3.3.
5.7.6.
Saving (A 3.7.1) Consumption of fixed
capital Capital transfers, net
Financing of gross accumulation
5.7.9. 5.9.7.
5.9.8. 5.9.11. 5.9.12.
and 5.9.13.
Net lending (A 5.7.8) Short-term loans,
n.e.c. Long-term loans, n.e.c. Trade credit and advances
Other liabilities
Net lending and change in liabilities
Note: The actual list of assets and liabilities varies according to institutional sector; "n.e.c." indicates not elsewhere classified.
matter of practical reasons similar to those concerning animals. In the case of mineral or energy deposits, for example, the agents concerned perceive their discovery as an increment in wealth and their mining or tapping as progressive depletion, but the nondescription of this increment and depletion in flows does result from choice.
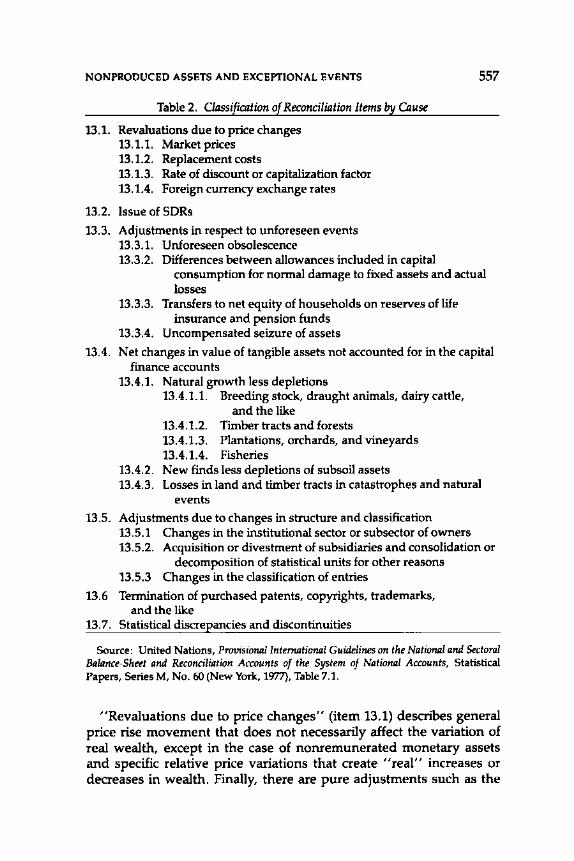
NONPRODUCED ASSETS AND EXCEPTIONAL EVENTS
Table 2. Classification of Reconciliation Items by Cause
13.1. Revaluations due to price changes 13.1.1. Market prices 13.1.2. Replacement costs 13.1.3. Rate of discount or capitalization factor 13.1.4. Foreign currency exchange rates
13.2. Issue of SDRs
13.3. Adjustments in respect to unforeseen events 13.3.1. Unforeseen obsolescence
557
13.3.2. Differences between allowances included in capital consumption for normal damage to fixed assets and actual losses
13.3.3. Transfers to net equity of households on reserves of life insurance and pension funds
13.3.4. Uncompensated seizure of assets
13.4. Net changes in value of tangible assets not accounted for in the capital finance accounts
13.4.1. Natural growth less depletions 13.4.1.1. Breeding stock, draught animals, dairy cattle,
and the like 13.4.1.2. Timber tracts and forests 13.4.1.3. Plantations, orchards, and vineyards 13.4.1.4. Fisheries
13.4.2. New finds less depletions of subsoil assets 13.4.3. Losses in land and timber tracts in catastrophes and natural
events 13.5. Adjustments due to changes in structure and classification
13.5.1 Changes in the institutional sector or subsector of owners 13.5.2. Acquisition or divestment of subsidiaries and consolidation or
decomposition of statistical units for other reasons 13.5.3 Changes in the classification of entries
13.6 Termination of purchased patents, copyrights, trademarks, and the like
13.7. Statistical discrepancies and discontinuities
Source: United Nations, Provisiontll Internlltional Guidelines on the National and Sectoral Balance-Sheet and Reconciliation Accounts of the System of National Accounts, Statistical Papers, Series M, No. 60 (New York, 1977), Table 7.1.
"Revaluations due to price changes" (item 13.1) describes general price rise movement that does not necessarily affect the variation of real wealth, except in the case of nonremunerated monetary assets and specific relative price variations that create "real" increases or decreases in wealth. Finally, there are pure adjustments such as the
558 FINANCIAL FLOWS AND BALANCES
changes in the classification of items (item 13.5) and statistical discrepancies and discontinuities (item 13.7). In addition, the description of copyrights and patents and the like (item 13.6) allows for the phasing out of purchased assets but does not allow for the identification of these assets when they are created, despite the fact that they are beginning to appear in company balance sheets (for example, computer software). Nor does it allow identifying them at the seller, if the seller has created them himself, except by means of the "statistical discrepancy'' item.
II. A Re-examination
We propose to analyze again the overall variations in wealth. First, we will reconsider the general structure of assets and liabilities, and then take another look at the types of operations or events that contribute to the variation of these assets and liabilities. After this we will ask ourselves about the articulation between the movements concerning these assets and liabilities and the national accounts sequence.
General Structure of Assets and Liabilities
The SNA and M 60 distinguish
• Reproducible tangible assets • Nonreproducible tangible assets • Nonfinancial intangible assets • Financial assets and liabilities.
There is not much to say about financial assets and liabilities in the context of this article, except to recall that by convention in the SNA all liabilities are financial. This is not the case in real life. In societies where vendettas are current, for example, an individual may have a "blood debt," not at all financial in nature, with respect to his family, clan, or group of another type, that is perceived by the group as a claim it holds against the individual. We admit that from the moment that a liability is or becomes economic, a financial debt comes into play. More pertinent for the national accounts purpose is the existence of contingent liabilities related, for example, to guarantees, endorsements, and the like that can be given by one economic agent to another. The frequency of contingent liabilities has grown considerably in the recent past. Written "off balance sheet" in the accounts of economic agents, these contingent liabilities (contingent assets are
NONPRODUCED ASSETS AND EXCEPfiONAL EVENTS 559
also to be considered) do not constitute financial liabilities in the sense of the 1%8 SNA. Their inclusion there could be envisaged, not of course for their gross amounts, but for the (present) value of the risks taken. The difficulty then should be to enter their counterpart. Logically, the latter should be constituted by a corresponding reduction in the value of the liabilities of the group of economic agents benefiting from the guarantees considered, but this treatment is inapplicable in practice. Failing this, thought should be given to creating a specific category of ''quasi-liabilities.'' In any event, it is important to be provided with corresponding information as well as that relating to certain types of provisions, especially for bad debts that, for the same reason of asymmetry between the lenders and the debtors, are eliminated from the wealth accounts.
As regards nonfinancial assets, we do not question the usefulness of the SNA classification, even if, as can be seen with the categories "cultivated land" (nonreproducible asset) and "land improvement" (reproducible asset), the conceptual criterion of reproducibility creates a few problems of application, and even if the nature of the nonfinancial intangible assets is defined in a doubly negative manner. From the point of view of the SNA general structure, the distinction between produced assets and nonproduced assets presents a valid description. "Produced" assets are understood here as "produced in the national accounts sense" (in particular, in the sense of the 1968 SNA). A produced asset is fully described for entry in the framework of the SNA operations: it can be produced or imported, stocked, invested or exported, possibly consumed (in the sense of fixed capital consumption), bought and sold as a secondhand good (and reinvested or finally consumed); it appears among the assets of the wealth accounts; and it can be accidentally destroyed or scrapped. If economic life concerned only produced assets, things would be relatively simple. Matters become complicated because nonproduced assets (land, mines, patents, and trademarks, for example) sometimes appear in the wealth of economic agents and can be the subject of transactions.
In the 1968 SNA and in M 60, all the produced assets are tangible assets (reproducible in general; the separation between reproducible and nonreproducible is not clear a posteriori in certain cases). Within the framework of the SNA revision, the way will probably be opened up for the production of intangible assets (such as computer software, unless it is considered as tangible; mining exploration expenditure; and, in particular, all or part of research and development expenditure). The production of an asset in the national accounts sense can associate the work of nature with human activity. Stocks of agri-

560 FINANCIAL FLOWS AND BALANCES
cultural products in general and fixed capital in cattle are in the 1968 SNA.2 In contrast, the SNA does not include natural growth in the production of assets constituted of plantations, orchards, vineyards, and timber tracts. These assets should be included. Produced assets can thus cover tangible assets, including assets produced in part by nature, and intangible assets.
Nonproduced assets-always nonfinancial assets-constitute all other assets. They can be grouped in five categories:
• Rights that are not the counterpart of liabilities ("nonfinancial intangible assets" in the 1968 SNA)
• Subsoil resources
• Physical environments and living organisms (ecosystems)
• Human resources
• Intangible cultural assets (in the broad sense).
The first category calls for a brief comment. The SNA includes here patents, copyrights, trademarks, rights to exploit mining fields and fisheries, leases concerning land, and the like. The list is not restrictive. The item can cover, for example, the sums paid by one sports club to another to obtain the transfer of a professional player.
Operations and Events That Make Assets and Liabilities Vary
Variations in wealth include everything that explains the changes in wealth from the end of year n - 1, at the prices of the end of this year, to the end of year n, at the prices of the end of that year.
Transactions (Purchases or Sales, Gifts)
To simplify, let us equate with transactions all the stock entries or exits other than those due to wear and tear and destruction.
2 According to M 60 (paragraph 7.11), only the initial outlay for cattle acquisition is included in the formation of fixed assets in the SNA; this interpretation does not seem correct.
NONPRODUCED ASSETS AND EXCEPTIONAL EVENTS 561
Own-Account Production
Fixed Capital Consumption
We use here the present SNA definition, which includes the average value of expected accidental damage.
Creation or Appearance of Assets Othenoise Than by Production and Corresponding Consumption
Most transactions concern produced assets (within or outside the economy considered). The goods concerned are created at the time of production. Some transactions, however, concern nonproduced assets (patents and trademarks, for example). In one way or another, these assets must be made to appear so that they can be the subject of transactions. Apart from this, wealth in nonproduced assets (noncultivated natural resources or subsoil assets, for example) varies irrespective of any transaction. Although creation or appearance and consumption are grouped in this description, the events leading to an increase in wealth should in practice be distinguished from those leading to a decrease.
Revaluation
The value of assets and liabilities changes as a function of the movement of prices between the end of year n - 1 or the subsequent date of entry into wealth, and the date of exit from wealth during the year or on December 31 if the asset or liability is still there. It is fundamental to distinguish the effect of the changes in the general price level from the effect of the changes in relative prices (the difference between the effect of the change in the general price level and the effect of the change in the specific prices of the assets or liabilities considered). We will refer again to this point.
Adjustment of Fixed Capital Consumption
The calculation of fixed capital consumption takes account of average life durations. Any discrepancy between these average durations and the actual life durations should in principle be subject to an
562 FINANCIAL FLOWS AND BALANCES
adjustment because the inventory value of assets has to take into account effective life durations. M 60 refers to two elements here:
• Unforeseen obsolescence • The discrepancy between the "risk" element of fixed capital con
sumption and the actual losses of the period;3 this discrepancy exists individually in any hypothesis, even if balance is achieved globally.
The following should also be added:
• Replacing in activity totally consumed assets (through fixed capi-tal consumption) or assets having previously become obsolete.
In the three cases. we are presented with an a posteriori revaluation of the fixed capital consumption of the prior periods (including the current year).
Capital Gains or Losses on Disposal or Scrapping of Assets
If these corrections are made, the inventory value (in the national accounts sense) will not necessarily coincide with the selling price in case of resale or scrapping (for example, price of scrap iron). In principle, those capital gains or losses must be taken into account, as in the case of company accounts, but under the assumption of a revaluation of assets.
The capital gains or losses from disposal are equal to the difference between the actual value of the disposals (sales or benefits for claims in case of destruction of insured goods) and the "national accounts" residual value. M 60 does not allow this element to be taken into account in its Table 7.1, thus implicitly assuming that the element is part of the revaluation. But this would be the case only if the national accounts residual values were based on the "true" market (or insurance) residual values of assets. Similar gains or losses can also occur
3 Measured at the residual value according to national accounts; that is, the difference between the revaluated initial value and the accumulated and revaluated fixed capital consumption. The actual losses do not appear except as an element of the adjustment of the fixed capital consumption because of the SNA definition of the latter (see the third point above). If the fixed capital consumption were to exclude the "risk" component, then the losses would directly appear as a factor of the assets variation.
NONPRODUCED ASSETS AND EXCEPTIONAL EVENTS 563
on some financial assets when market prices are not available for their revaluation.
"Assetization" of Previously Consumed Durable Goods
Wealth value can be modified-for example, if some consumer durables, while being treated as consumption expenditure, cu:e afterward directly included in household balance sheets.
Destruction or Wear and Tear of Stocks by Insurable Risks
These should not appear in the changes of stocks of the capital account unless they are included in intermediate consumption or deducted from output. They would unbalance this account if they were treated as equivalent to sales of stocks.
Destruction of Assets by Noninsumble Risks
These can derive from natural catastrophes or political events (such as wars, demonstrations, and the like).
Uncompensated Seizures
In case of compensation representing only part of the value of an asset, the nonindemnified part should be taken into account. In case of uncompensated seizures of financial assets, the corresponding liabilities should be noted (debt repudiation).
Changes in Classification
Changes in classification do not normally affect the global consistency of national wealth, but they can modify its breakdown:
• Between the institutional sectors or subsectors, in case of transfer of an institutional unit from a sector or subsector to another (for example, an unincorporated enterprise registering as corporation)
• Between the various categories or subcategories of assets or liabilities (for example, in M 60, possibly between the "improvement of land" and "development of plantations" items and the "cultivated land" item: the first two items can be considered as
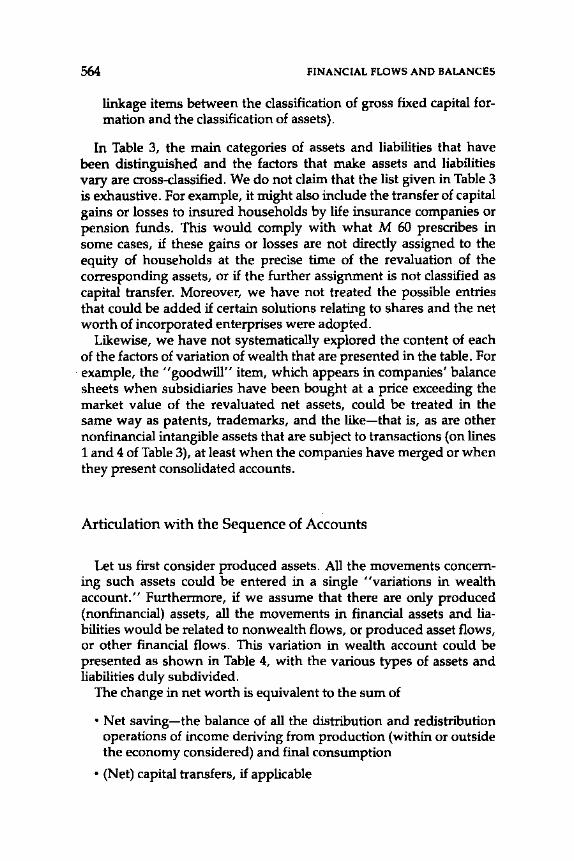
564 FINANCIAL FLOWS AND BALANCES
linkage items between the classification of gross fixed capital formation and the classification of assets).
In Table 3, the main categories of assets and liabilities that have been distinguished and the factors that make assets and liabilities vary are cross-classified. We do not claim that the list given in Table 3 is exhaustive. For example, it might also include the transfer of capital gains or losses to insured households by life insurance companies or pension funds. This would comply with what M 60 prescribes in some cases, if these gains or losses are not directly assigned to the equity of households at the precise time of the revaluation of the corresponding assets, or if the further assignment is not classified as capital transfer. Moreover, we have not treated the possible entries that could be added if certain solutions relating to shares and the net worth of incorporated enterprises were adopted.
Likewise, we have not systematically explored the content of each of the factors of variation of wealth that are presented in the table. For example, the "goodwill" item, which appears in companies' balance sheets when subsidiaries have been bought at a price exceeding the market value of the revaluated net assets, could be treated in the same way as patents, trademarks, and the like-that is, as are other nonfinancial intangible assets that are subject to transactions (on lines 1 and 4 of Table 3), at least when the companies have merged or when they present consolidated accounts.
Articulation with the Sequence of Accounts
Let us first consider produced assets. All the movements concerning such assets could be entered in a single "variations in wealth account." Furthermore, if we assume that there are only produced (nonfinancial) assets, all the movements in financial assets and liabilities would be related to nonwealth flows, or produced asset flows, or other financial flows. This variation in wealth account could be presented as shown in Table 4, with the various types of assets and liabilities duly subdivided.
The change in net worth is equivalent to the sum of
• Net saving-the balance of all the distribution and redistribution operations of income deriving from production (within or outside the economy considered) and final consumption
• (Net) capital transfers, if applicable
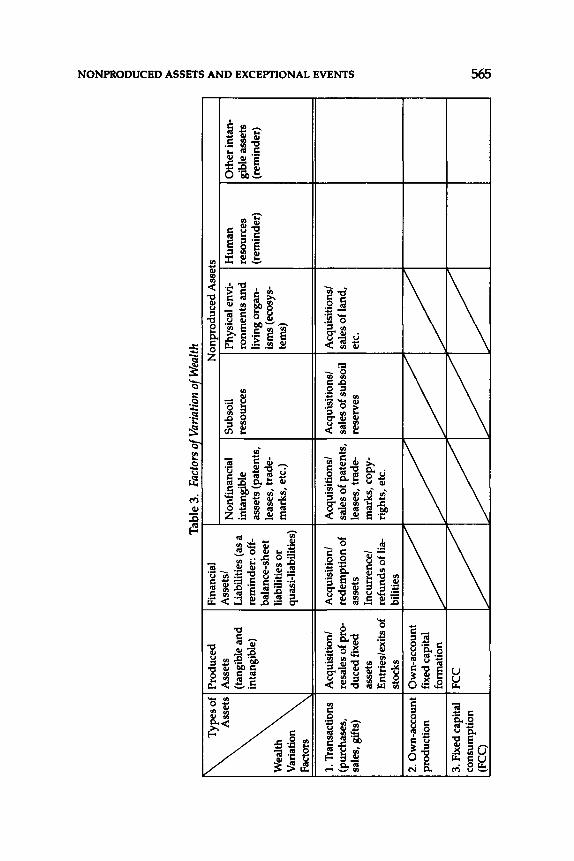
------
--
Typ
es o
f P
rodu
ced
Fin
anci
al
Ass
ets
Ass
ets
Ass
ets/
N
onfi
nanc
ial
(tan
gibl
e an
d L
iabi
litie
s (a
s a
inta
ngib
le
inta
ngib
le)
rem
inde
r: o
ff-
asse
ts (
pate
nts,
ba
lanc
e-sh
eet
leas
es,
trad
e-W
ealth
li
abil
itie
s o
r m
arks
, et
c.)
Var
iatio
n qu
asi-
liab
ilit
ies)
Fa
ctor
s
1. T
rans
acti
ons
Acq
uisi
tion
/ A
cqui
siti
on/
Acq
uisi
tion
s/
(pur
chas
es,
resa
les
of p
ro-
rede
mpt
ion
of
sale
s of
pat
ents
, sa
les,
gif
ts)
duce
dfix
ed
asse
ts
leas
es,
trad
e-as
sets
In
curr
ence
/ m
arks
, cop
y-E
ntri
es/e
xits
of
refu
nds
of li
a-ri
ghts
, et
c.
stoc
ks
bili
ties
2. O
wn-
acco
unt
Ow
n-ac
coun
t
v v
prod
ucti
on
fixe
d ca
pita
l fo
rmat
ion
3. F
ixed
cap
ital
FC
C
v v
cons
umpt
ion
(FC
C)
~ ~
Non
prod
uced
Ass
ets
Sub
soil
P
hysi
cal e
nvi-
Hu
man
re
sour
ces
ronm
ents
an
d
reso
urce
s li
ving
org
an-
(rem
inde
r)
ism
s (e
cosy
s-te
ms)
Acq
uisi
tion
s/
Acq
uisi
tion
s/
sale
s of
sub
soil
sa
les
of la
nd,
rese
rves
et
c.
v v
v v
Oth
er in
tan-
gibl
e as
sets
(r
emin
der)
z 0 ~ Ill 0 >
Ul
Ul
Ill til ~ 0 Ill ~ Ill ~ 0 ~ Ill <
Ill ~ 8i
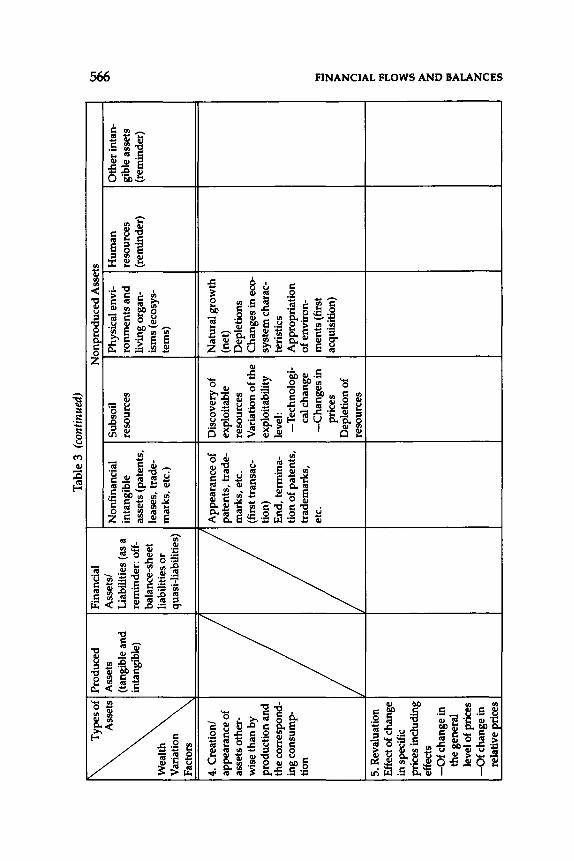
Typ
es o
f P
rodu
ced
Fin
anci
al
Ass
ets
Ass
ets
Ass
ets/
(t
angi
ble
and
Lia
bilit
ies
(as
a in
tang
ible
) re
min
der:
off
-ba
lanc
e-sh
eet
Wea
lth
liabi
litie
s o
r V
aria
tion
quas
i-lia
bilit
ies)
Fa
ctor
s
4. C
reat
ion/
ap
pear
ance
of
asse
ts o
ther
-w
ise
than
by
prod
ucti
on a
nd
the
corr
espo
nd-
ing
cons
ump-
tion
5. R
eval
uatio
n E
ffec
t of c
hang
e in
spe
cifi
c pr
ices
incl
udin
g ef
fect
s -O
f ch
ange
in
the
gene
ral
leve
l of p
rice
s -O
f ch
ange
in
rela
tive
pric
es
Tab
le 3
(co
ntin
ued)
Non
prod
uced
Ass
ets
Non
fina
ncia
l S
ubso
il
Phy
sica
l env
i-H
uman
in
tang
ible
re
sour
ces
ronm
ents
and
re
sour
ces
asse
ts (
pate
nts,
li
ving
org
an-
(rem
inde
r)
leas
es,
trad
e-is
ms
(eco
sys-
mar
ks,
etc.
) te
rns)
App
eara
nce
of
Dis
cove
ry o
f N
atur
al g
row
th
pate
nts,
tra
de-
expl
oita
ble
(net
) m
arks
, etc
. re
sour
ces
Dep
leti
ons
(fir
st tr
ansa
c-V
aria
tion
of th
e C
hang
es in
eco
-ti
on)
expl
oita
bili
ty
syst
em c
hara
c-E
nd,
term
ina-
leve
l: te
rist
ics
tion
of p
aten
ts,
-T
echn
olog
i-A
ppro
pria
tion
tr
adem
arks
, ca
l cha
nge
of e
nvir
on-
etc.
-C
han
ges
in
men
ts (f
irst
pr
ices
ac
quis
itio
n)
Dep
leti
on o
f re
sour
ces
Oth
er in
tan-
gibl
e as
sets
(r
emin
der)
' ' I
~ .... ~ z (") >
r"' 6 ~ Ul > ~ = ~ z ("
) !I
I U
l
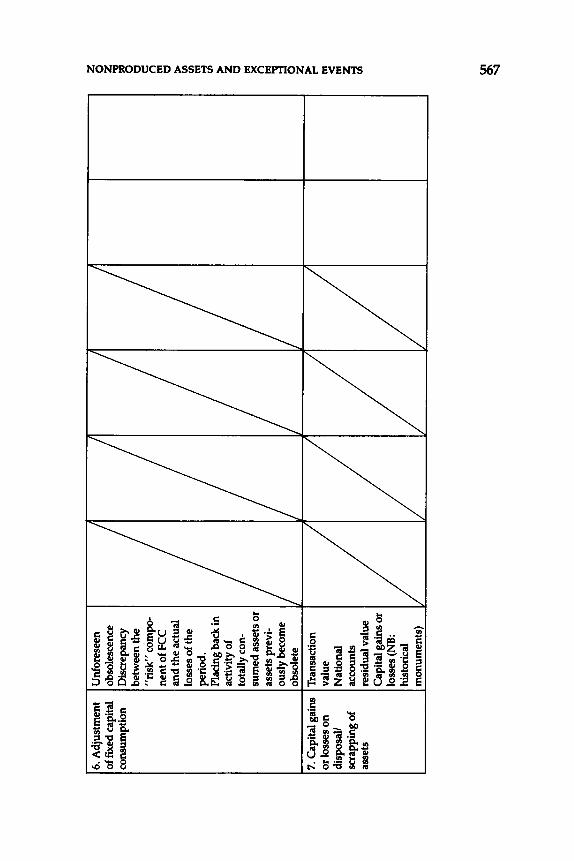
6. A
djus
tmen
t I Un
fore
seen
z 0
of fi
xed
capi
tal
obso
lesc
ence
z
cons
umpt
ion
Dis
crep
ancy
~
betw
een
the
0 "r
isk
" co
mpo
-c:: ("
)
nen
tofF
CC
tt
l
and
the
actu
al
0 >
loss
es o
f the
U
l U
l
peri
od.
ttl ~
Plac
ing
back
in
Ul >
activ
ity o
f z
tota
lly
con-
0 ttl
sum
ed a
sset
s or
)(
asse
ts p
revi
-("
) tt
l
ousl
y be
com
e ~
obso
lete
0 z
7. C
apit
al g
ains
T
rans
acti
on
>
r"'
or lo
sses
on
valu
e tt
l
disp
osal
/ N
atio
nal
<
ttl
scra
ppin
g of
ac
coun
ts
~ as
sets
re
sidu
al v
alue
U
l
Cap
ital
gai
ns o
r lo
sses
(NB
: hi
stor
ical
m
onum
ents
)
~
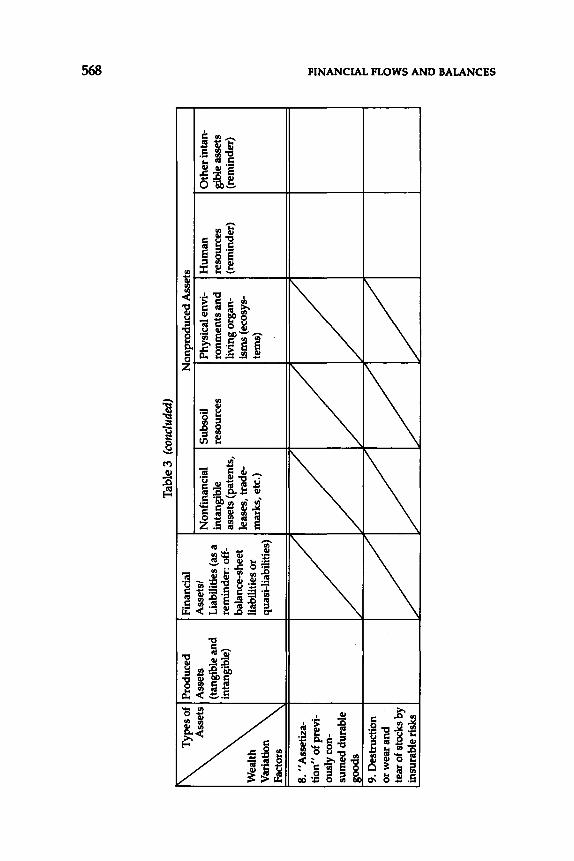
Typ
es o
f I Prod
uced
A
sset
s A
sset
s (t
angi
ble
and
Fact
ors
8. "
Ass
etiz
ati
on"
of p
revi
ou
sly
con
sum
ed d
urab
le
:ood
s
9. D
estr
ucti
on
or w
ear a
nd
tear
of s
tock
s by
in
sura
ble
risk
s
inta
ngib
le)
Fin
anci
al
Ass
ets/
L
iabi
litie
s (a
s a
rem
inde
r: o
ff
bala
nce-
shee
t lia
bilit
ies
or
quas
i-li
abil
itie
s)
Tab
le 3
(co
nclu
ded)
Non
fina
ncia
l in
tang
ible
as
sets
(pa
tent
s,
leas
es,
trad
em
arks
, etc
.)
Sub
soil
re
sour
ces
Non
prod
uced
Ass
ets
Phy
sica
l env
iro
nmen
ts a
nd
li
ving
org
an
ism
s (e
cosy
ste
ms)
Hum
an
reso
urce
s (r
emin
der)
Oth
er in
tan
gibl
e as
sets
(r
emin
der)
~ 'II ~ z n ~ 6 :E (I) ~ 1:11 ~ ~ Ill
(I)
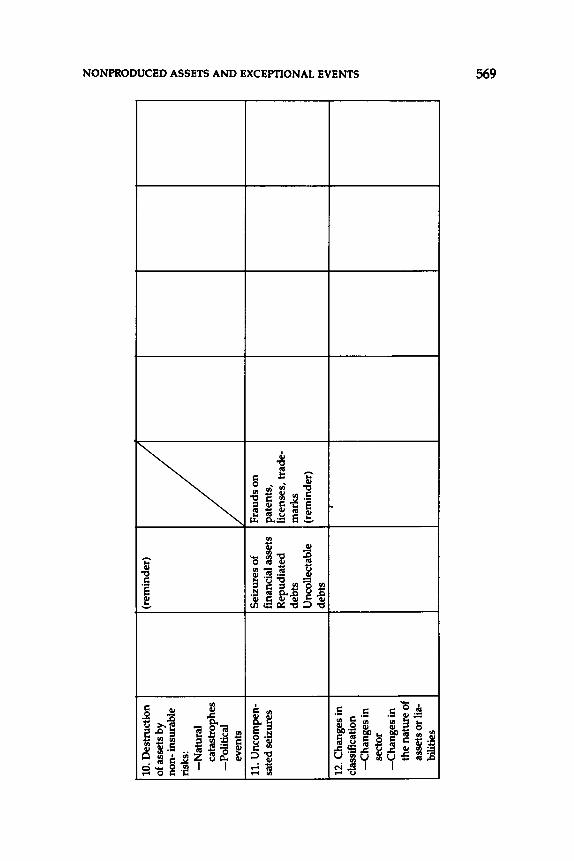
10. D
estr
ucti
on
of a
sset
s by
no
n-in
sura
ble
risk
s:
-Nat
ura
l ca
tast
roph
es
-Pol
itic
al
even
ts
11. U
ncom
pen-
sate
d se
izur
es
12. C
hang
es in
cl
assi
fica
tion
-Ch
ang
es in
se
ctor
-C
han
ges
in
the
natu
re o
f as
sets
or l
ia-
bilit
ies
(rem
inde
r)
Sei
zure
s of
F
raud
s o
n
fina
ncia
l ass
ets
pate
nts,
R
epud
iate
d li
cens
es,
trad
e-de
bts
mar
ks
Unc
olle
ctab
le
(rem
inde
r)
debt
s
~ ?J ~ ~ 111 0 >
(I)
(I) ~ > ~ 11
1 ~ 111 ~ 0 ~ t"'
111 <
111 ~ $
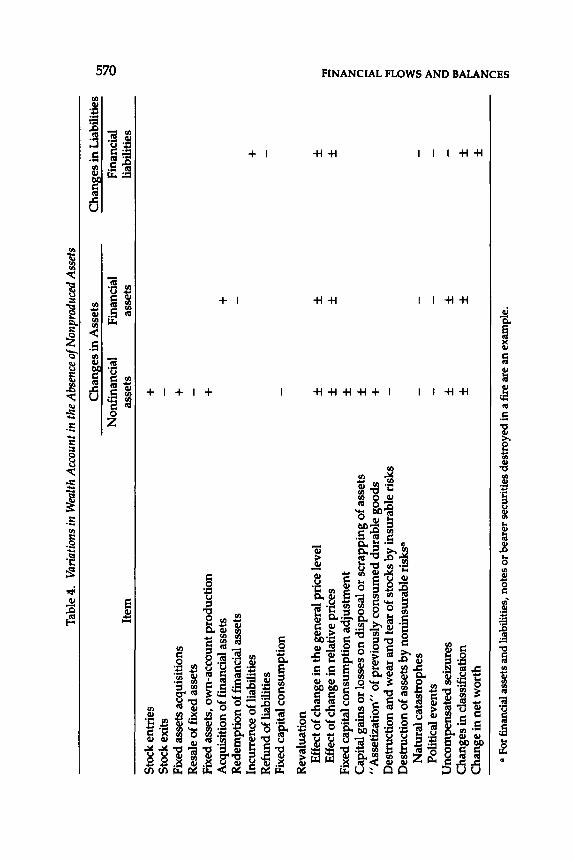
Tab
le 4
. Va
riat
ions
in
Wea
lth A
ccou
nt in
the
Abse
nce
of N
onpr
oduc
ed A
sset
s
Cha
nges
in A
sset
s C
hang
es in
Lia
bili
ties
0
1
Non
fina
ncia
l F
inan
cial
F
inan
cial
~
Item
as
sets
as
sets
li
abil
itie
s
Sto
ck e
ntri
es
+
Sto
ck e
xits
Fi
xed
asse
ts a
cqui
siti
ons
+
Res
ale
of fi
xed
asse
ts
Fixe
d as
sets
, ow
n-ac
coun
t pro
duct
ion
+
Acq
uisi
tion
of f
inan
cial
ass
ets
+
Red
empt
ion
of fi
nanc
ial a
sset
s In
curr
ence
of l
iabi
litie
s +
R
efun
d of
liab
ilitie
s Fi
xed
capi
tal c
onsu
mpt
ion
Rev
alua
tion
E
ffec
t of c
hang
e in
the
gene
ral p
rice
leve
l ±
±
±
..,
Eff
ect o
f cha
nge
in re
lati
ve p
rice
s ±
±
±
z
Fixe
d ca
pita
l con
sum
ptio
n ad
just
men
t ±
>
z C
apit
al g
ains
or l
osse
s o
n d
ispo
sal o
r sc
rapp
ing
of a
sset
s ±
n
"Ass
etiz
atio
n" o
f pre
viou
sly
cons
umed
dur
able
goo
ds
+
>
I"'
Des
truc
tion
an
d w
ear
and
tear
of s
tock
s by
insu
rabl
e ri
sks
-.., I"
' D
estr
ucti
on o
f ass
ets
by n
onin
sura
ble
risk
sa
0 :e N
atur
al c
atas
trop
hes
--
-(I
)
Polit
ical
eve
nts
--
->
z U
ncom
pens
ated
sei
zure
s ±
±
-
0 1111
Cha
nges
in c
lass
ific
atio
n ±
±
±
>
C
hang
e in
net
wor
th
±
!;: z n •
For f
inan
cial
ass
ets
and
liab
ilit
ies,
not
es o
r bea
rer
secu
riti
es d
estr
oyed
in a
fir
e ar
e an
exa
mpl
e.
!11
(I)
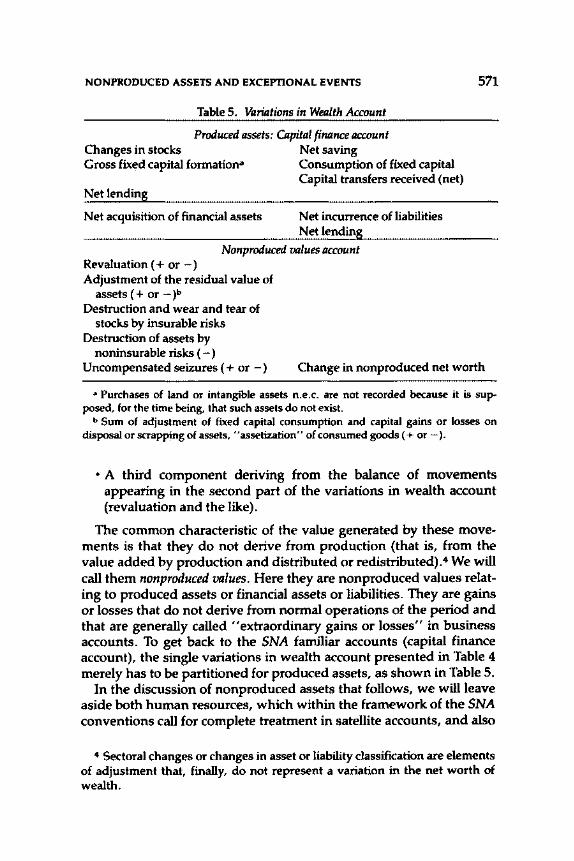
NONPRODUCED ASSETS AND EXCEPTIONAL EVENTS
Table 5. Variations in Wealth Account
Produced assets: Capital finance account Changes in stocks Gross fixed capital formationa
Net lending
Net acquisition of financial assets
Net saving Consumption of fixed capital Capital transfers received (net)
Net incurrence of liabilities Net lending
Nonproduced values account Revaluation ( + or -) Adjustment of the residual value of
assets ( + or - )b
571
Destruction and wear and tear of stocks by insurable risks
Destruction of assets by noninsurable risks (-)
Uncompensated seizures ( + or -) Change in nonproduced net worth
• Purchases of land or intangible assets n.e.c. are not recorded because it is supposed, for the time being, that such assets do not exist.
b Sum of adjustment of fixed capital consumption and capital gains or losses on disposal or scrapping of assets, "assetization" of consumed goods ( + or - ).
• A third component deriving from the balance of movements appearing in the second part of the variations in wealth account (revaluation and the like).
The common characteristic of the value generated by these movements is that they do not derive from production (that is, from the value added by production and distributed or redistributed). 4 We will call them nonproduced values. Here they are nonproduced values relating to produced assets or financial assets or liabilities. They are gains or losses that do not derive from normal operations of the period and that are generally called "extraordinary gains or losses" in business accounts. To get back to the SNA familiar accounts (capital finance account), the single variations in wealth account presented in Table 4 merely has to be partitioned for produced assets, as shown in Table 5.
In the discussion of nonproduced assets that follows, we will leave aside both human resources, which within the framework of the SNA conventions call for complete treatment in satellite accounts, and also
4 Sectoral changes or changes in asset or liability classification are elements of adjustment that, finally, do not represent a variation in the net worth of wealth.
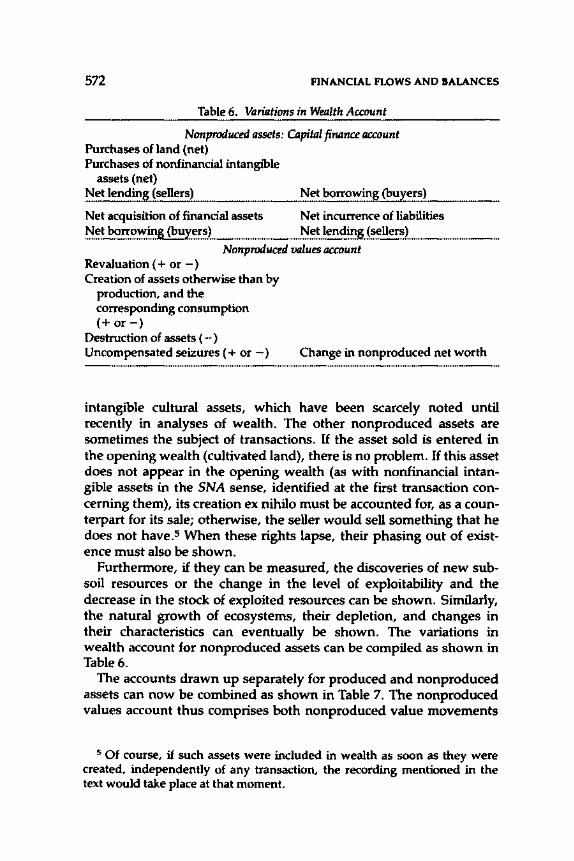
572 FINANCIAL FLOWS AND BALANCES
Table 6. Variations in Wealth Account
Nonproduced assets: CApital finance account Purchases of land (net) Purchases of nonfinancial intangtble
assets (net) Net lending (sellers) Net borrowing (buyers)
Net acquisition of financial assets Net borrowing (buyers)
Net incurrence of liabilities Net lending (sellers)
Nonproduced values account Revaluation ( + or -) Creation of assets otherwise than by
production, and the corresponding consumption (+or-)
Destruction of assets (-) Uncompensated seizures ( + or -) Change in nonproduced net worth
intangible cultural assets, which have been scarcely noted until recently in analyses of wealth. The other nonproduced assets are sometimes the subject of transactions. H the asset sold is entered in the opening wealth (cultivated land), there is no problem. If this asset does not appear in the opening wealth (as with nonfinancial intangible assets in the SNA sense, identified at the first transaction concerning them), its creation ex nihilo must be accounted for, as a counterpart for its sale; otherwise, the seller would sell something that he does not have.s When these rights lapse, their phasing out of existence must also be shown.
Furthermore, if they can be measured, the discoveries of new subsoil resources or the change in the level of exploitability and the decrease in the stock of exploited resources can be shown. Similarly, the natural growth of ecosystems, their depletion, and changes in their characteristics can eventually be shown. The variations in wealth account for nonproduced assets can be compiled as shown in Table6.
The accounts drawn up separately for produced and nonproduced assets can now be combined as shown in Table 7. The nonproduced values account thus comprises both nonproduced value movements
5 Of course, if such assets were included in wealth as soon as they were created, independently of any transaction, the recording mentioned in the text would take place at that moment.
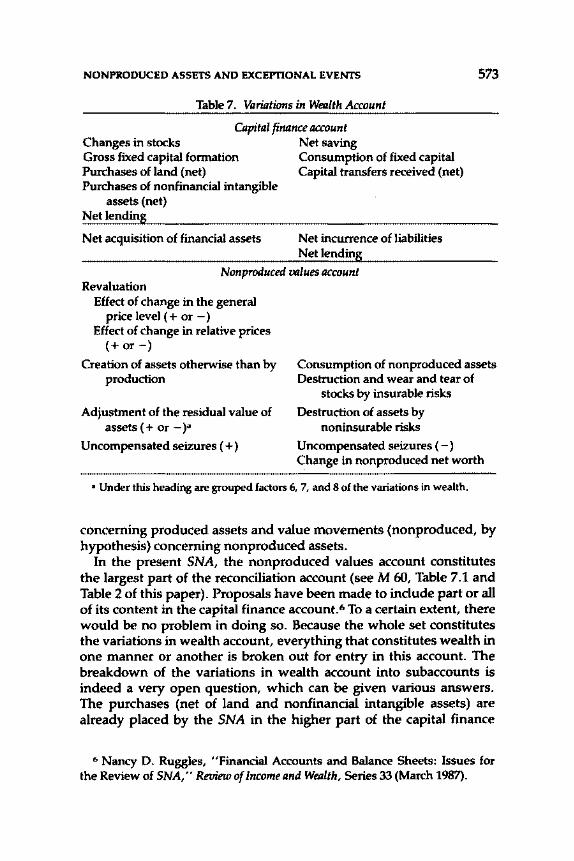
NONPRODUCED ASSETS AND EXCEPTIONAL EVENTS 573
Table 7. Variations in Wealth Account
Capital finance account Changes in stocks Gross fixed capital formation Purchases of land (net) Purchases of nonfinancial intangible
assets (net) Net lending
Net acquisition of financial assets
Net saving Consumption of fixed capital Capital transfers received (net)
Net incurrence of liabilities Net lending
Nonproduced values account Revaluation
Effect of change in the general price level ( + or -)
Effect of change in relative prices (+or-)
Creation of assets otherwise than by production
Adjustment of the residual value of assets ( + or - )•
Uncompensated seizures ( +)
Consumption of non produced assets Destruction and wear and tear of
stocks by insurable risks
Destruction of assets by noninsurable risks
Uncompensated seizures (-) Change in nonproduced net worth
• Under this heading are grouped factors 6, 7, and 8 of the variations in wealth.
concerning produced assets and value movements (nonproduced, by hypothesis) concerning nonproduced assets.
In the present SNA, the nonproduced values account constitutes the largest part of the reconciliation account (seeM 60, Table 7.1 and Table 2 of this paper). Proposals have been made to include part or all of its content in the capital finance account.6 To a certain extent, there would be no problem in doing so. Because the whole set constitutes the variations in wealth account, everything that constitutes wealth in one manner or another is broken out for entry in this account. The breakdown of the variations in wealth account into subaccounts is indeed a very open question, which can be given various answers. The purchases (net of land and nonfinancial intangible assets) are already placed by the SNA in the higher part of the capital finance
6 Nancy D. Ruggles, "Financial Accounts and Balance Sheets: Issues for the Review of SNA," Review of Income and Wealth, Series 33 (March 1987).
574 FINANCIAL FLOWS AND BALANCES
account because they are market transactions bringing about a change in net lending and, correlatively, in financial assets and liabilities. To a certain extent, it is already a matter of "reconciliation" operations with respect to the "normal" sequence of economic operations described by the national accounts. The items relating to nonproduced values could be placed back "at the top," with a "change in nonreproduced net worth" counterpart being introduced to take account of the fact that the movements considered do not have an incidence on net borrowing or lending.
A remark must be made in relation to this last point. Because the unilateral noncollectibility of debts, whether explicitly repudiated or not, has been placed among uncompensated seizures (see Table 3), a change in assets and liabilities can appear in the finance account if the cancelled debts are entered in the variations in this account. A statistical adjustment thus exists between the net borrowing or lending and the net change in financial assets and liabilities. In the context of the SNA revision, the position adopted beforehand consists in distinguishing between the cancellation of debts that were the subject of an agreement between the creditor and the debtor-a counterpart would in this case be entered in the capital transfers-and the unilateral cancellation of debts with a counterpart entered in the reconciliation account. In this second case, a statistical imbalance appears between the two parts of the capital finance account. To make it disappear, in the present SNA framework there are two possibilities: either the unilateral cancellation of debts is included in the higher part of the capital finance account in a subcategory of capital transfers (or in a specific item), or else the corresponding changes in assets and liabilities are excluded from the second part of the capital finance account and placed only in the reconciliation account.
Let us now come back to the main topic. There is really no definitive argument against mixing what we have called the nonproduced values account (in other words, the main part of the M 60 reconciliation account) with the capital finance account. But should this be done? Let us set aside the measurement difficulty, which is very real for many items but which does not alone control the solutions chosen in a long-term accounting system. Truly, the effective calculation of these items would only be partial and would vary from one country to another for a very long period. The disadvantage would be minor only insofar as, clearly isolated and designated and including a counterpart of an equivalent amount, these items would not hamper the analyses and comparisons. Those who propose the integration solution use a similar consideration, but draw an opposite conclusion. H the items that are difficult to measure are not placed in an account
NONPRODUCED ASSETS AND EXCEPI'IONAL EVENTS 575
considered as having a high priority ranking, then scant efforts will be made to measure the underlying magnitudes. The argument is not unfounded, and it shows that national accounts are widely underdeveloped in most countries and are nowhere totally developed.
It is preferable to distinguish the nonproduced values account, provided that it is given conceptual consistency that the present reconciliation account does not have, and as long as it is clearly shown that the SNA framework includes a variations in wealth account that comprises the nonproduced values account, the financial account, and the present capital account (whose name should be changed).7
Regardless of the possible presentation variations, to our mind the variations in wealth account enables one to address more explicitly the question of the relation between income and wealth in the national accounts. The implicit hypothesis in the SNA is that movements in nonproduced values and capital transfers do not influence the measurement of the net disposable income defined as the sum of final consumption and net saving. It follows that net saving is not equal in the national accounts to net change in wealth, and that income is not what can be consumed without tapping one's wealth.s The SNA therefore does not follow either the wisdom of nations, which readily speak of "consuming one's wealth" or "consuming
7 The respective positions of the financial account and the nonproduced values account are conventional. They could be reversed with respect to the presentation made above. The best solution, but one that would probably change habits too much, would be to place the nonproduced values account first by including in it the purchases (net) of land and non-intangible assets, which would make a balance (net) to be financed appear in this account. Placed last, the balancing item of the financial account would then be equal, leaving aside the statistical adjustment, to the total of the balances (net) to be financed of the "capital" account and the nonproduced values account.
8 Recall that consumer durables (households, military goods) do not appear in wealth in the SNA sense; so wealth does not include everything that, at a given time, is available for the future. As regards households (military forces raise more complex problems that have not been discussed in this paper), the exclusion of durables that are actually consumption goods does not matter very much; to give the value of the stock of these goods as a complementary item can be considered sufficient. On the contrary, some durables are acquired and held exclusively or essentially as reserves of value (gold and other precious metals, precious stones, antiques, and the like). Except accidentally, they do not disappear progressively when using them and can be thought of as "financial investment goods." It certainly would be wise to exclude them from consumption and to put the corresponding flows in the capital account.

576 FINANCIAL FLOWS AND BALANCES
one's capital'' with reference to spendthrifts, or economists who have drawn up and perfected a common notion of income.
Reference to Hicks is essential here: "We ought to define a man's income as the maximal value he can consume during a week and still expect to be as well off at the end of the week as he was at the beginning. "9 In this commonplace formulation, it is nothing more than the wisdom of nations, or else, as Adam Smith (An Inquiry into the Nature & Causes of the Wealth of Nations, Tome 2, Chapter 2) is quoted by Schumpeter: "neat revenue" was what people, individually and collectively, "without encroaching upon their capital ... can . . . spend upon their subsistence, conveniences and amusements. " 10 But the Hicksian notion comprises many refinements. It is only in ex ante forecasting (short-term) that it is useful to theoretical economists, since it is then revealing of behavior. The wealth referred to is the "capitalized money value of the individual's prospective receipts" or the individual's gain expectations. Expectations concerning changes in the interest rate and in prices intervene. The sum of the incomes of individuals understood that way does not make any sense except arithmetically. "Income is a subjective concept dependent on the particular expectations of the individual in question,'' which do not have any reason to tally with the expectation of any other individual; if the forecasts do not come true, the "value of his (the individual's) prospect at the end of the week will be greater or less than it was expected to be, so that he makes a 'windfall' profit or loss. " 11 In addition, in order to neutralize the effect of fluctuations in receipts, Hicks defined an individual's income as "some sort of standard stream of values whose present capitalized value equals the present value of the stream of receipts which is actually in prospect. "12
Economic definitions on one side, and accounting measurements on the other side (in the national accounts, but also in accountancy more generally), thus appear irreducible. The absence of a link would be total if Hicks had not recognized that ex post income notions have great usefulness, in particular as a convenient measurement of economic progress, that grants them a specific place in economic and statistical history. Furthermore, macroeconomics and econometrics
9 John R. Hicks, Value and Capital: An Inquiry into Some Fundamental Principles of Economic Theory, 2d ed. (Oxford: Oxford University Press, 1946), p. 173.
10 Joseph A. Schumpeter, History of Economic Analysis (Oxford: Oxford University Press, 1954), p. 628.
11 Hicks, Value and Capital, pp. 177, 178. 12 Ibid., p. 184.
NONPRODUCED ASSETS AND EXCEPTIONAL EVENTS 577
have developed approaches and techniques that enable making the theoretically imperfect magnitudes constituted by income and saving, in the SNA sense, "say" things about the behavior of economic agents. The debate therefore cannot be avoided by advocating the ''lack of a bridge.'' The national accounts are indeed confronted, if not with the Hicksian notion of income, for the reasons stated, at least with that of common sense.
Recall that the SNA net saving is not equal to the net change in wealth. Its relation to wealth is defined as follows:
Net saving = net change in wealth +capital transfers (net) paid -change in nonproduced net worth.
If one wishes to introduce into the SNA a "quasi-Hicksian" concept of income, one is faced with the following alternative:
or
• Include in the current flows of the period ("current" here means the flows of the production and income and expenditure accounts in the sense of the 1968 SNA) capital transfers and operations that make the nonproduced net worth vary (the variations in wealth account is then reduced to the present capital finance account after elimination of the capital transfers item)
• Consider that the central concept of income in the national accounts is, by nature, different from the "quasi-Hicksian" concept and that the latter can be applied only to the set constituted
-by the accounts of the "normal" operations of the period accounted for in the production and income and expenditure accounts
-and by an "extraordinary" operations account covering the nonproduced values account and possibly capital transfers.
This does not mean that putting something in either the normal ("current") or the extraordinary operations account makes no difference. A satisfactory solution has to be found for the difficult problem raised by the treatment of
• Direct indexation of financial assets and liabilities • Their indirect indexation through an actual amount of ''some
thing" explicitly directed to the compensation of inflation • Their implicit indexation by means of the "compensation for
inflation" component of undifferentiated rates of interest.
In effect, if an element of compensation for inflation remains included
578 FINANCIAL FLOWS AND BALANCES
in the interest appearing in current flows (as presently in the national accounts), then current income (consequently current saving, according to the terminology used in the following paragraphs) covers redemption of a part of the real value of creditors' claims and is calculated after refunding a part of the real value of debtors' liabilities.
Given the high inflation prevailing in some countries (but the problem in principle is the same everywhere; even low rates of inflation may influence the real value of very large amounts of financial assets and liabilities), the impact on the measurement of (current) income, (current) saving, and net lending of institutional sectors can be very meaningful. A full discussion of this question, of course, is beyond the scope of this paper.
As regards the alternative raised when a quasi-Hicksian concept of income is considered for the SNA, a few observations are necessary. It is assumed that the magnitudes in question are known or can be known. Considering the first part of the alternative, one must consider the additive quality of current economic life and extraordinary events. Hicks's analysis may be thought to apply mainly to the former, but Hicks referred explicitly to "windfall losses due to natural catastrophes and war" in one of his concepts of ex post income.t3 From the point of view of wealth value, regardless of its concrete consistency, additivity cannot be discarded. Analysts would probably not like simply substituting new concepts of income and saving for the present ones, preferring instead to see a distinction made between several notions of income and saving. This would bring us back to the second part of the alternative, except for differences in presentation.
A specific problem arises in the revaluation of assets and liabilities. The first reaction is to exclude them from the quasi-Hicksian notion of income and saving. Being "as well off at the end of the week as [one] was at the beginning" is being as rich as one started in real terms. To consume the equivalent of the revaluation of one's assets would manifestly mean tapping one's capital. However, these remarks must be qualified. Being as rich in real terms applies to the abstract global value of wealth. H the revalued value of the opening wealth of an economic agent increases more than the general price level, we will say that this agent has grown richer and that an income is constituted, in Hicks's sense, by the difference between the evolution of the revalued value of his wealth and the evolution of that value if the revaluation had been done in terms of the general price level. The
13 Ibid., p. 180, fn. 2.
NONPRODUCED ASSETS AND EXCEPTIONAL EVENTS 579
economic agent could consume this difference while being as well off at the end of the period as he was at the beginning.14 Conversely, an economic agent obtaining a negative difference should, everything else being the same, reduce his consumption by an equivalent amount in order to remain as well off at the end of the period as he was at the beginning.
A distinction must thus be drawn in the nominal capital gains or losses15 between the two elements that have been isolated in the presentation of the variations in wealth account:
• Capital gains or losses linked with relative price movements (real capital gains or losses calculated as the difference between the revaluation of assets or liabilities made with their specific prices, or by using specific price indexes, and the revaluation of the same elements obtained by using a general price index)16
• The effect of changes in the general price level, as just described.
The sum of the two constitutes the revaluation, at specific prices, of the assets or liabilities. Only the first element represents capital gains or losses; the second corresponds only to maintaining wealth intact.
Finally, one might think about the following accounts on the assumption of concurrent treatment of extraordinary operations (Table 8).17 The sum of current income and extraordinary income
14 Of course, prudence would require the economic agent to make sure about the stable nature of this gain.
15 Nominal capital gains or losses are defined as the difference between the value of the assets (or liabilities) at their date of exit (or end of a period) and their value at the beginning of the period (or subsequent date of entry), with these values being measured at the specific prices of each of the assets (or liabilities) at each of these dates.
16 The choice of the general price level indicator will not be discussed in detail here. Should it relate to the sole assets, or to goods and services (gross domestic product-GOP-or gross national expenditure), or to this last set increased by nonproduced assets that are the subject of transactions or increased by all the nonproduced assets? Let us say simply that this indicator must be unique because it aims to measure the change in real value of money in general. Should it be chosen so that capital gains and losses compensate each other exactly? Not necessarily, for the same reason that it is required to be unique. This would lead to choosing in principle the widest possible cover indicator.
17 Recall that throughout this paper the distinction between current or extraordinary refers to the borderline of the production. Thus, some elements of the extraordinary income account can be recurrent, such as the effects of relative price movements and the appearance of patents.
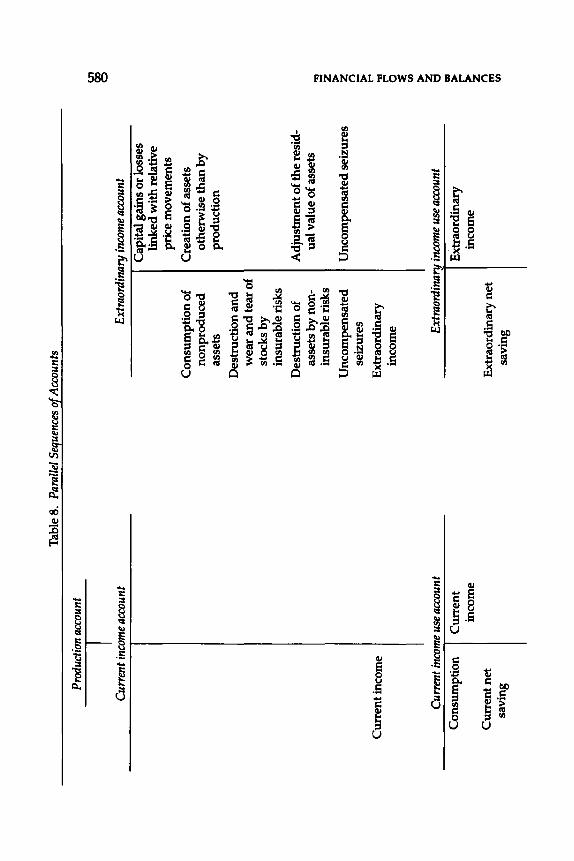
Prod
uctio
n ac
coun
t
Cu"
ent i
ncom
e ac
coun
t
Cur
rent
inco
me
Cur
rent
inco
me
use
acco
unt
Con
sum
ptio
n I C
urre
nt
inco
me
Cur
rent
net
sa
ving
Tab
le 8
. Pa
ralle
l Seq
uenc
es o
f Acc
ount
s
Extr
aord
inar
y in
com
e ac
coun
t
Con
sum
ptio
n of
n
on
prod
uced
as
sets
Des
truc
tion
and
w
ear
and
tear
of
stoc
ks b
y in
sura
ble
risk
s
Des
truc
tion
of
asse
ts b
y no
nin
sura
ble
risk
s
Unc
ompe
nsat
ed
seiz
ures
Ext
raor
dina
ry
inco
me
Cap
ital
gai
ns o
r los
ses
link
ed w
ith
rela
tive
pr
ice
mov
emen
ts
Cre
atio
n of
ass
ets
othe
rwis
e th
an b
y pr
oduc
tion
Adj
ustm
ent o
f the
resi
dua
l val
ue o
f ass
ets
Unc
ompe
nsat
ed s
eizu
res
Extr
aord
inar
y in
com
e us
e ac
coun
t
Ext
raor
dina
ry n
et
savi
ng
Ext
raor
dina
ry
inco
me
~ .... z > z n >
r-o .... ~ Ul ~ Ill > ~ II
! U
l
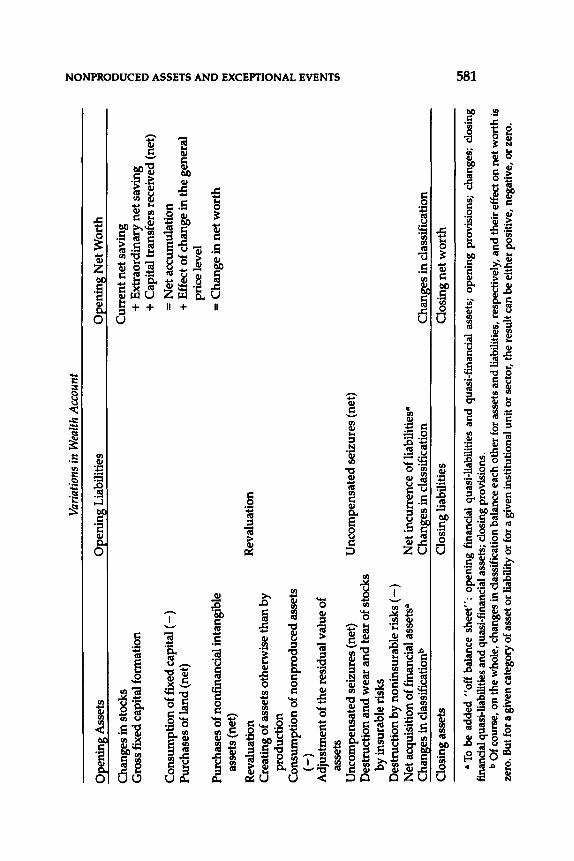
Varia
tions
in W
ealth
Acc
ount
Ope
ning
Ass
ets
Ope
ning
Lia
bilit
ies
Ope
ning
Net
Wor
th
Cha
nges
in s
tock
s G
ross
fixe
d ca
pita
l for
mat
ion
Con
sum
ptio
n of
fixe
d ca
pita
l (-)
P
urch
ases
of l
and
(net
)
Pur
chas
es o
f non
fina
ncia
l int
angi
ble
asse
ts (
net)
Rev
alua
tion
Rev
alua
tion
C
reat
ing
of a
sset
s ot
herw
ise
than
by
prod
ucti
on
Con
sum
ptio
n of
non
prod
uced
ass
ets
(-)
Adj
ustm
ent o
f the
resi
dual
val
ue o
f as
sets
U
ncom
pens
ated
sei
zure
s (n
et)
Unc
ompe
nsat
ed s
eizu
res
(net
) D
estr
ucti
on a
nd w
ear
and
tear
of s
tock
s by
insu
rabl
e ri
sks
Des
truc
tion
by n
onin
sura
ble
risk
s (-
) N
et a
cqui
sitio
n of
fina
ncia
l ass
etsa
N
et in
curr
ence
of l
iabi
litie
sa
Cur
rent
net
sav
ing
+ E
xtra
ordi
nary
net
sav
ing
+ C
apit
al tr
ansf
ers
rece
ived
(ne
t)
= N
et a
ccum
ulat
ion
+ E
ffec
t of c
hang
e in
the
gene
ral
pric
e le
vel
= C
hang
e in
net
wor
th
Cha
nges
in c
lass
ific
atio
nb
Cha
nges
in c
lass
ific
atio
n C
hang
es in
cla
ssif
icat
ion
Clo
sing
ass
ets
Clo
sing
liab
ilitie
s C
losi
ng n
et w
orth
• To
be
adde
d "o
ff b
alan
ce s
heet
": o
peni
ng f
inan
cial
qua
si-l
iabi
liti
es a
nd
qua
si-f
inan
cial
ass
ets;
ope
ning
pro
visi
ons;
cha
nges
; cl
osin
g fi
nanc
ial q
uasi
-lia
bilit
ies
and
quas
i-fi
nanc
ial a
sset
s; c
losi
ng p
rovi
sion
s.
b O
f cou
rse,
on
the
who
le, c
hang
es in
cla
ssif
icat
ion
bala
nce
each
oth
er fo
r as
sets
an
d li
abili
ties,
res
pect
ivel
y, a
nd
thei
r eff
ect o
n n
et w
orth
is
zero
. But
for
a gi
ven
cate
gory
of a
sset
or l
iabi
lity
or fo
r a
give
n in
stit
utio
nal u
nit o
r se
ctor
, the
res
ult c
an b
e ei
ther
pos
itiv
e, n
egat
ive,
or z
ero.
~ z ~ ~ l'll
t:l >
Ul
Ul
l'll Ul ~ ~ l'll ti 0 ~ l'll ~ ~ Ul ~
.......
582 FINANCIAL FLOWS AND BALANCES
corresponds to the quasi-Hicksian income, subject to the acquisition of capital transfers. In a presentation of this type, nothing would go against placing capital transfers in the extraordinary income account. However, this would mean that wealth donations do not "notionally" have the right to exist. For households in particular, the question arises if accounts per category of households are drawn up or if life-cycle types of analyses are made. More broadly, the problem concerns "heritages," including deceased estates. A possible interpretation of the SNA and M 60 would consist in saying that, were these flows known, they would be entered in the "changes in sector" item. But this solution would not be correct because it is the assets or liabilities that are transferred from one institutional unit to another one (and possibly, as a consequence, from one sector to another) and not the institutional units that change sector. It thus appears preferable to choose the solution appearing in the above presentation. In Tasi-Hicksian terms, this could be expressed in the following manner: "the income of an economic agent (of an institutional unit) is the maximal value that he can consume in the period without tapping his wealth (without prejudice, however, to the wealth transfers he can make or receive).'' If the beneficiary of such a transfer uses its amount to increase his consumption, this supplement is therefore not financed by income but by a reduction in wealth. The person who makes the transfer does not undergo a reduction in income.
The accounting framework we propose is independent from the precise production concept. If that concept were modified to include the creation of assets that at present are considered as nonproduced, this would change the content of certain items presented without modifying the approach itself. It is therefore not necessary to discuss, for example, the problem of subsoil resources or degradation of the natural environment.
III. Capital Gains or Losses
The proposals made in.the foregoing raise many technical accounting questions. In this section we propose to treat only one of these: the measurement of capital gains and losses.
Nominal Capital Gains and Losses
The variation in the value of wealth is at the beginning equal to
W = E + VNP + PVC,
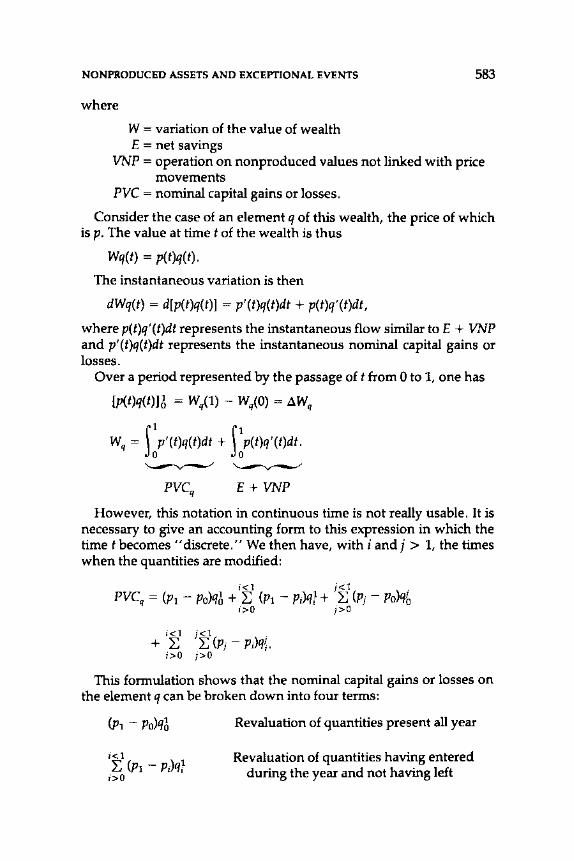
NONPRODUCED ASSETS AND EXCEPTIONAL EVENTS
where
W = variation of the value of wealth E = net savings
583
VNP = operation on nonproduced values not linked with price movements
PVC = nominal capital gains or losses.
Consider the case of an element q of this wealth, the price of which is p. The value at time t of the wealth is thus
Wq(t) = p(t)q(t).
The instantaneous variation is then
dWq(t) = d[p(t)q(t)] = p'(t)q(t)dt + p(t)q'(t)dt,
where p(t)q'(t)dt represents the instantaneous flow similar toE + VNP and p'(t)q(t)dt represents the instantaneous nominal capital gains or losses.
Over a period represented by the passage of t from 0 to 1, one has
[p(t)q(t)JA = Wq(1) - Wq(O) = 4Wq
wq = 1:p'(t)q(t)dt + tp(t)q'(t)dt.
~~
PVCq E + VNP
However, this notation in continuous time is not really usable. It is necessary to give an accounting form to this expression in which the time t becomes "discrete." We then have, with i and j > 1, the times when the quantities are modified:
i<l j<l . PVCq = (Pt - Po)q~ + L: (Pt - p;)ql + ~ (pi - Po)%
i>O j>O
i<l j<l . + ~ L: (pj - p;)q{,
i>O j>O
This formulation shows that the nominal capital gains or losses on the element q can be broken down into four terms:
(Pt- Po)q~
i<l ~ (Pt- P;)ql
i>O
Revaluation of quantities present all year
Revaluation of quantities having entered during the year and not having left
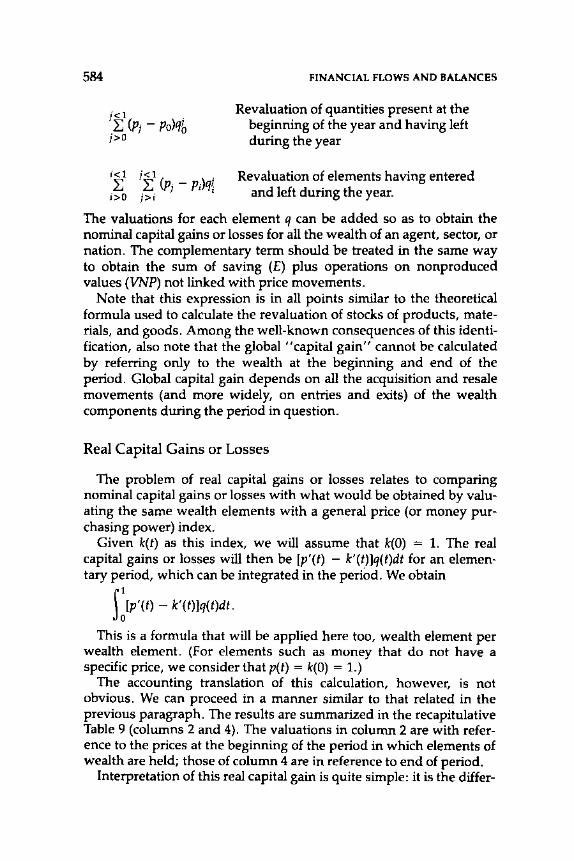
584
i<1 j<1 1: L: (pi - P;)q{
i>O j>i
FINANCIAL FLOWS AND BALANCES
Revaluation of quantities present at the beginning of the year and having left during the year
Revaluation of elements having entered and left during the year.
The valuations for each element q can be added so as to obtain the nominal capital gains or losses for all the wealth of an agent, sector, or nation. The complementary term should be treated in the same way to obtain the sum of saving (E) plus operations on nonproduced values (VNP) not linked with price movements.
Note that this expression is in all points similar to the theoretical formula used to calculate the revaluation of stocks of products, materials, and goods. Among the well-known consequences of this identification, also note that the global "capital gain" cannot be calculated by referring only to the wealth at the beginning and end of the period. Global capital gain depends on all the acquisition and resale movements (and more widely, on entries and exits) of the wealth components during the period in question.
Real Capital Gains or Losses
The problem of real capital gains or losses relates to comparing nominal capital gains or losses with what would be obtained by valuating the same wealth elements with a general price (or money purchasing power) index.
Given k(t) as this index, we will assume that k(O) = 1. The real capital gains or losses will then be [p'(t) - k'(t)]q(t)dt for an elementary period, which can be integrated in the period. We obtain
1: [p'(t) - k'(t)]q(t)dt.
This is a formula that will be applied here too, wealth element per wealth element. (For elements such as money that do not have a specific price, we consider that p(t) = k(O) = 1.)
The accounting translation of this calculation, however, is not obvious. We can proceed in a manner similar to that related in the previous paragraph. The results are summarized in the recapitulative Table 9 (columns 2 and 4). The valuations in column 2 are with reference to the prices at the beginning of the period in which elements of wealth are held; those of column 4 are in reference to end of period.
Interpretation of this real capital gain is quite simple: it is the differ-
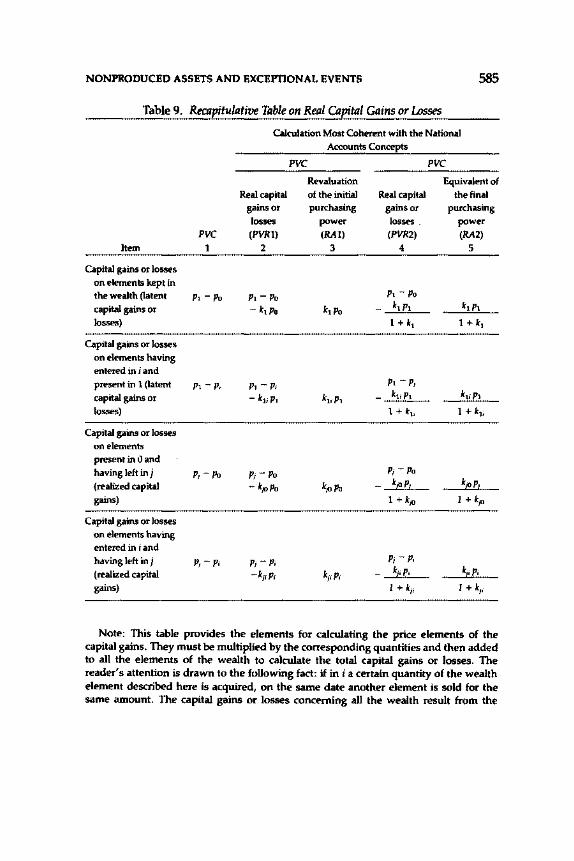
NONPRODUCED ASSETS AND EXCEPI'IONAL EVENTS 585
Table 9. Recapitulative Table on Real Capital Gains or Losses
Calculation Most Coherent with the National
Accounts Concepts
PVC PVC
Revaluation Equivalent of
Real capital of the initial Real capital the final gains or purchasing gains or purchasing
losses power losses . power
PVC (PVR1) (RA1) (PVR2) (RA2)
Item 1 2 3 4 5
Capital gains or losses
on elements kept in the wealth Oatent P1- Po P1- Po P1- Po
capital gains or - k1Po k1Po - k1 P1 k1P1
losses) 1 + kl 1 + kl
Capital gains or losses
on elements having entered in i and
present in 1 (latent P1 -pi P1- Pi P1- Pi
capital gains or -k1iP1 k1iP1 - k1iP1 k1iP1
losses) 1 + kli 1 + kli
Capital gains or losses
on elements present in 0 and
having left in j Pi- Po Pi- Po Pi- Po
(realized capital - kjOpO kjO Po - k;oP; k;oP;
gains) 1 + kjO 1 + kjO
Capital gains or losses
on elements having entered in i and
having left in j Pi- Pi Pi- Pi Pi- Pi
(realized capital -kiiPi kiiPi k;iPi k;;P;
gains) 1 + kii 1 + kii
Note: This table provides the elements for calculating the price elements of the capital gains. They must be multiplied by the corresponding quantities and then added to all the elements of the wealth to calculate the total capital gains or losses. The reader's attention is drawn to the following fact: if in i a certain quantity of the wealth element described here is acquired, on the same date another element is sold for the same amount. The capital gains or losses concerning all the wealth result from the
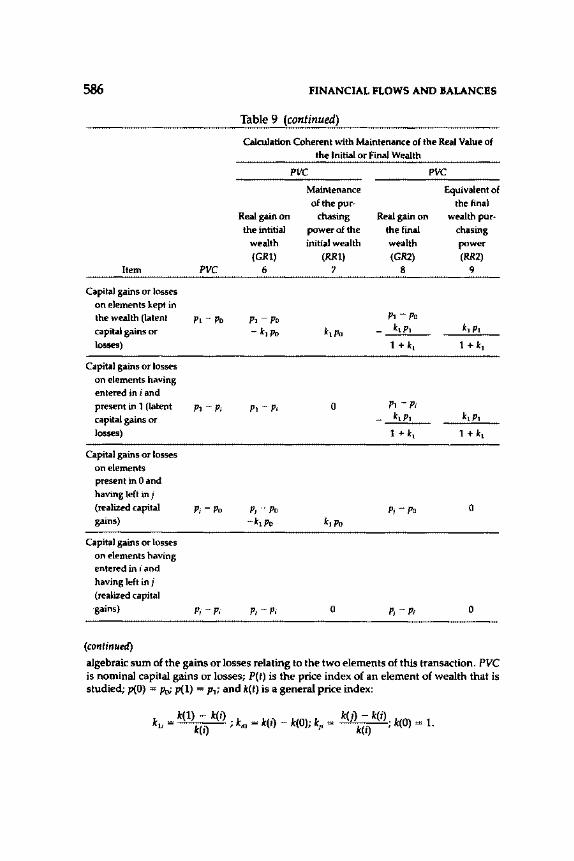
586 FINANCIAL FLOWS AND BALANCES
Table 9 (continued)
Calculation Coherent with Maintenance of the Real Value of the Initial or Final Wealth
PVC PVC
Maintenance Equivalent of of the pur- the final
Real gain on chasing Real gain on wealth pur-the intitial power of the the final chasing
wealth initial wealth wealth power (GR1) (RR1) (GR2) (RR2)
Item PVC 6 7 8 9
Capital gains or losses on elements kept in the wealth (latent Pt- Po Pt- Po Pt- Po
capital gains or - k,po k1 Po - k,p, k,p,
losses) 1 + k, 1 + k,
Capital gains or losses on elements having entered in i and present in 1 (latent Pt- Pi Pt- Pi 0 Pt- Pi
capital gains or - k,p, k, Pt
losses) 1 + k, 1 + k,
Capital gains or losses on elements present in 0 and having left in j (realized capital P;- Po P;- Po P;- Po 0 gains) -k,po k, Po
Capital gains or losses on elements having entered in i and having left in j (realized capital gains) P;- Pi P; -pi 0 P;- P; 0
(continued)
algebraic sum of the gains or losses relating to the two elements of this transaction. PVC is nominal capital gains or losses; P(t) is the price index of an element of wealth that is studied; p(O) = Po; p(l) = p1; and k(t) is a general price index:
k = k(l) - k(r) · k = k(~ - k(O)· k = k(J)- k(r) · k(O) = 1 1
' k(r) ' 10 11 ' 1' k(r) ' ·
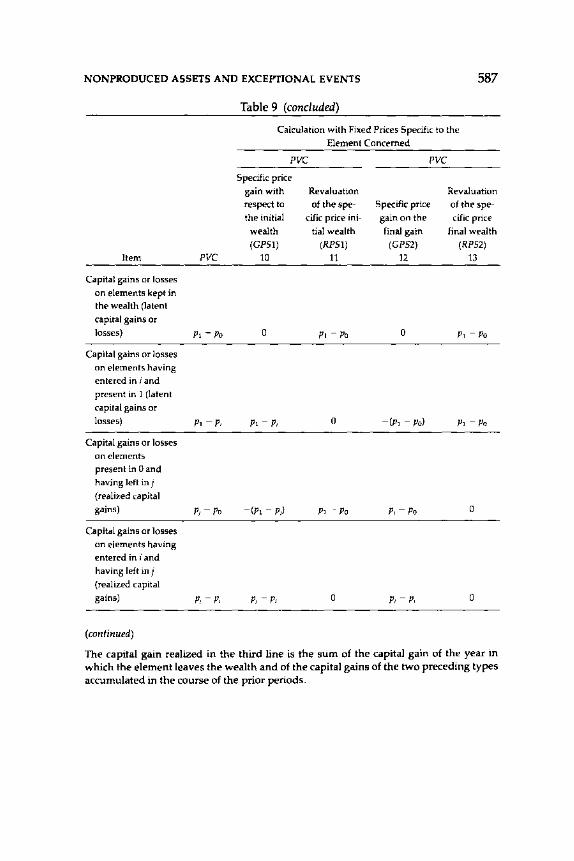
NONPRODUCED ASSETS AND EXCEPTIONAL EVENTS 587
Table 9 (concluded)
Calculation with Fixed Prices Specific to the Element Concerned
PVC PVC
Specific price gain with Revaluation Revaluation respect to ofthespe- Specific price of the spe-the initial cific price ini- gain on the cific price wealth tial wealth final gain final wealth (GPS1) (RPS1) (GPS2) (RPS2)
Item PVC 10 11 12 13
Capital gains or losses on elements kept in the wealth (latent capital gains or losses) P1- Po 0 P1- Po 0 P1- Po
Capital gains or losses on elements having entered in i and present in 1 (latent capital gains or losses) PI- Pi PI- Pi 0 -(pi- Po) P1- Po
Capital gains or losses on elements present in 0 and having left in j (realized capital gains) P1 - Po -(pi-P;) P1- Po p,- Po 0
Capital gains or losses on elements having entered in i and having left in j (realized capital gains) P;- Pi P1 - Pi 0 P;- Pi 0
(continued)
The capital gain realized in the third line is the sum of the capital gain of the year in which the element leaves the wealth and of the capital gains of the two preceding types accumulated in the course of the prior periods.
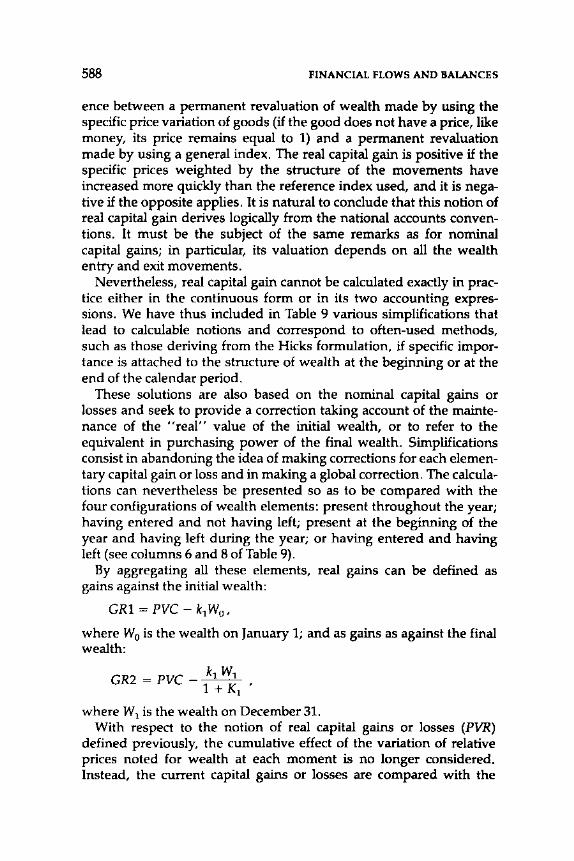
588 FINANCIAL FLOWS AND BALANCES
ence between a permanent revaluation of wealth made by using the specific price variation of goods (if the good does not have a price, like money, its price remains equal to 1) and a permanent revaluation made by using a general index. The real capital gain is positive if the specific prices weighted by the structure of the movements have increased more quickly than the reference index used, and it is negative if the opposite applies. It is natural to conclude that this notion of real capital gain derives logically from the national accounts conventions. It must be the subject of the same remarks as for nominal capital gains; in particular, its valuation depends on all the wealth entry and exit movements.
Nevertheless, real capital gain cannot be calculated exactly in practice either in the continuous form or in its two accounting expressions. We have thus included in Table 9 various simplifications that lead to calculable notions and correspond to often-used methods, such as those deriving from the Hicks formulation, if specific importance is attached to the structure of wealth at the beginning or at the end of the calendar period.
These solutions are also based on the nominal capital gains or losses and seek to provide a correction taking account of the maintenance of the "real" value of the initial wealth, or to refer to the equivalent in purchasing power of the final wealth. Simplifications consist in abandoning the idea of making corrections for each elementary capital gain or loss and in making a global correction. The calculations can nevertheless be presented so as to be compared with the four configurations of wealth elements: present throughout the year; having entered and not having left; present at the beginning of the year and having left during the year; or having entered and having left (see columns 6 and 8 of Table 9).
By aggregating all these elements, real gains can be defined as gains against the initial wealth:
GR1 =PVC- k1W0 ,
where W0 is the wealth on January 1; and as gains as against the final wealth:
GR2 = PVC - k1 W1
1 + K1 '
where W1 is the wealth on December 31. With respect to the notion of real capital gains or losses (PVR)
defined previously, the cumulative effect of the variation of relative prices noted for wealth at each moment is no longer considered. Instead, the current capital gains or losses are compared with the

NONPRODUCED ASSETS AND EXCEPTIONAL EVENTS 589
effect of revaluation of a fixed structure of wealth over the whole period.
Finally, we have included in Table 9 a calculation of the capital gains made at fixed prices specific to each of the wealth elements. The result (not directly discussed here) corresponds, for GPSl, to the surplus gain obtained with respect to that which we would have had by keeping the initial wealth; for GPS2, to the same surplus gain with respect to the final wealth. In other words, with the average index of the initial wealth as the k price index, GPSl = GR1; with the average index of the final wealth as the k price index, GPS2 = GR2.
32
Fixed Capital Formation by Owner and User
HEINRICH LOTzEL
T HE UNITED NATIONS' A System of National Accounts (SNA) and the Provisional Guidelines (M 60)1 do not distinguish between the con
cepts of owner and user when allocating fixed capital formation or fixed assets to investing sectors (producers). It seems to be obvious that in the SNA fixed assets have to be attributed to the owner.2 For many purposes of the data, this way of recording should indeed be given priority and be included as the predominant concept in the revised SNA. In particular, the owner concept should be used for recording the financing of fixed capital formation, calculating the operating surplus (allocation of fixed capital consumption), and drawing up property balance sheets recording the net worth.
H fixed capital formation and the stock of fixed capital are analyzed in conjunction with the production of goods and services (capital stock, capital as a factor of production), it is expedient to record these commodities where they are actually used in production for a long period. This is also what the Guidelines on Statistics of Tangible Assets suggest.3 For the recording of fixed assets, a distinction between the two concepts has always to be made if tangible assets are recorded in
1 United Nations, Provisional International Guidelines on the National and Sectoral Balance-Sheet and Reconciliation Accounts of the System of National Accounts, Statistical Papers, Series M, No. 60 (New York, 1977).
2 The term "owner" is not used here in the strict legal sense, but rather in an economic one. As a rule, the enterprise that enters the capital good on the asset side of its balance sheet is considered as its owner.
3 United Nations, Guidelines on Statistics of Tangible Assets, Statistical Papers, Series M, No. 68 (New .York, 1979).
590
FIXED CAPITAL FORMATION 591
the balance sheets of their owner while they are actually being used in production for a long period by other economic units (in other words, if producers are using fixed assets that are not part of the property of these users). As a rule, the fixed assets thus are rented to producers.
Over the past few years, the renting of fixed assets in the form of financial leasing has gained considerable importance (see Chapters 25 and 26 of this volume). This is, from an economic point of view, a special form of financing of fixed capital formation rather than a type of renting in the normal sense of the word. Therefore, it has been suggested that the revised SNA should consider financial leasing as a pure financial activity, on the one hand, and as an acquisition of a fixed asset on credit, on the other. Thus, the assumption is made that the investor immediately takes ownership of the commodity purchased on credit and that this commodity is shown neither as part of the fixed capital formation nor as part of the fixed capital of the lender.
Because of these changes in the treatment of financial leasing, the differences between the owner concept and the user concept are substantially reduced in terms of quantity (especially with respect to machinery and equipment). It has to be examined whether the remaining differences owing to the renting of tangible assets are so large that a clear distinction between the two concepts should be drawn in the revised SNA. In the following, some types of renting will be studied, and suggestions will be made about how rented objects should be recorded according to the owner concept and the user concept in the revised SNA.
The user concept should be applied only to fixed assets that are employed in production by the user. This is not the case with housing; the lessee is not a producer, but acts as the final consumer of the services rendered by the lessor. According to the user concept, rented dwellings would therefore also have to be attributed to the lessor.
The user concept should relate only to fixed assets rented (or leased) for a long period. A period of one year could be chosen as a minimum limit. This would entail that for several types of rentingsuch as renting a car, the renting of film studios, and the short-term "renting" of agricultural or construction machines (including, perhaps, the operating staff)-the rented fixed assets would have to be attributed to the lessor according to the user concept as well. This norm seems to be favorable with regard to both theoretical considerations ("renting" including personnel probably is not renting at all) and practical reasons concerning the statistical realization.
As regards application of the owner concept or user concept, three types of leasing have to be distinguished.
592 FINANCIAL FLOWS AND BALANCES
• Leasing to households is always considered as purchasing goods on credit, irrespective of the kind of leasing arrangement. Neither the owner concept nor the user concept provides for a recording of fixed capital formation. A passenger car leased by a household is part of household consumption.
• In the case of financial leasing, the revised SNA is to proceed from the assumption that the fixed asset purchased on credit immediately passes into the ownership of the lessee. These fixed assets are allocated to the purchaser (lessee) according to both the owner concept and the user concept.
• In the case of operation leasing, the leased object remains the property of the lessor. According to the owner concept, the leased assets thus are allocated to the lessor; according to the user concept, they are attributed to the lessee.
Apart from leasing, the "normal" renting of commercial J;"Ooms, or rooms used by general government, of buildings or built-up land is of considerable significance in terms of quantity. For this type of renting, too, the recording of fixed assets differs with regard to the owner concept and the user concept. If the user concept is applied, in the first year of renting an addition to the stock of fixed assets of the lessee and a corresponding loss of fixed assets for the lessor would have to be shown.
With respect to the application of the owner concept and the user concept, leased agricultural land, farms, and so on should be treated the same way as rented fixed assets.
In isolated cases, which nevertheless may have considerable quantitative effects, legally independent enterprises are founded that only make investments and then rent the assets to another legally independent enterprise. Thus it may occur that an enterprise is subdivided into two corporate enterprises: a producer unit and an investor unit. According to the owner concept, there is no fixed capital formation (or capital stock) attributed to the producer unit. It is even for large-scale investment projects, such as the construction of a nuclear power plant, that such investing enterprises are founded, which then rent the asset to another enterprise (frequently the parent company). In this case it is particularly controversial to use the owner concept, for the fixed capital formation would then have to be allocated to service industries. A possible solution for this problem would be to attribute legally independent enterprises, which render services usually considered as intrafirm ancillary activities and provide these services only to one other enterprise, to the industry to which the enterprise receiving the services belongs.
FIXED CAPITAL FORMATION 593
When disaggregating fixed capital formation by investing producers (industries and other producers in the present SNA), the question arises whether the owner concept may be applied to establishments at all. From a legal point of view an enterprise consisting of several establishments as a whole, and not the individual establishment, is considered to be the owner. Despite this difficulty, the owner concept must also be used for establishments in order to calculate their fixed capital consumption and operating surplus. Therefore, it should be agreed by convention that, in an enterprise with several establishments, fixed assets are allocated to that part of the enterprise where they are used. The individual establishment should always be considered as the owner if the enterprise owns the capital good. This convention seems to be expedient because all other solutions (for example, the enterprise "rents" to its establishments) would entail considerable complications. If, however, the enterprise has rented or leased reproducible assets or land, the establishment should also be considered as lessee.
In conclusion, it primarily depends on the intended purpose of the data whether the owner concept or the user concept should be applied for recording fixed capital formation by investors. In the revised SNA the owner concept should prevail, including also the classification of fixed capital formation by producers. The user concept, in contrast, is suitable for analyzing production processes and should be included in the revised SNA as an additional way of recording. In this context, it will be important to show the additions to and the losses of fixed capital as well as the fixed capital (capital stock) in the breakdown by investing producers.
It is a quite conceivable and consistent approach to apply the user concept also in the production accounts and the input-output tables. In this case the consumption of fixed capital would have to be reclassified from the lessor to the lessee, and the value of the renting service would have to be reduced accordingly. But because of the additional imputations, the effects on gross output of the renting industry, and the poor additional knowledge to be gained, it is proposed here that the user concept should not be extended in the revised SNA to the core accounts and the input-output tables.
In those cases where the user is not the owner, the user concept should be confined strictly to the renting of fixed assets for production purposes on a long-term basis (for a period of at least one year). With respect to the application of the user concept, taking land on lease and renting should be treated in the same way.
Despite the fact that it is intended to treat financial leasing as a pure

594 FINANCIAL FLOWS AND BALANCES
financial activity, the remaining types of renting of capital goods are sufficiently important to necessitate an application of the user concept. In Germany, for instance, more than 5 percent of the stock of buildings (excluding dwellings and public civil engineering) are rented by other producers, not including financial leasing.
Contributors
C ontributors' institutional affiliations are those at the time when their papers were prepared.
Derek Blades Economic Statistics and National Accounts Division, Organization for Economic Cooperation and Development (OECD), Paris
Arie C. Bouter Former Assistant Director in charge of the Balance of Payments Division, Bureau of Statistics, International Monetary Fund (IMF), VVashington
Soren Brodersen Danmarks Statistik, Copenhagen
Marta Castello-Branco Financial Institutions Division, Bureau of Statistics, IMF
John C. Dawson Department of Economics, Grinnell College, Grinnell, Iowa
Keith G. Dublin Financial Institutions Division, Bureau of Statistics, IMF
Vicente Galbis Immediate Office, Bureau of Statistics, IMF
Mahinder S. Gill Balance of Payments Division, Bureau of Statistics, IMF
George H. Hoezoo Balance of Payments Division, Bureau of Statistics, IMF
Emmanuel 0. Kumah Financial Institutions Division, Bureau of Statistics, IMF
Jonathan Levin Government Finance Division, Bureau of Statistics, IMF
Heinrich Liitzel Statistisches Bundesamt, Germany
Khashayar Mahdavy Intern, General Economy Division, Bureau of Statistics, IMF
595
596 CONTRIBUTORS
D. Keith McAlister Balance of Payment Division, Bureau of Statistics, IMF
Robert McColl Balance of Payments Division, Bureau of Statistics, IMF
Jean-Paul Milot Institut National de Ia Statistique et des Etudes Economiques (INSEE), Paris
Brian Newson Statistical and Accounting Coordination Unit, Statistical Office of the European Communities (EUROSTAT)
Pierre Luigi Parcu Balance of Payments Division, Bureau of Statistics, IMF
Gerard G. Raymond Balance of Payments Division, Bureau of Statistics, IMF
Geoffrey J. Robertson Balance of Payments Division, Bureau of Statistics, IMF
Edward W. Saunders Financial Institutions Division, Bureau of Statistics, IMF
Marianne Schulze-Ghattas Balance of Payments Division, Bureau of Statistics, IMF
Abul Siddique General Economy Division, Bureau of Statistics, IMF
Mick Silver Consultant, General Economy Division, Bureau of Statistics, IMF
Pierre Teillet INSEE, Paris
John E. Thornton International Banking and External Debt Division, Bureau of Statistics, IMF
IreneTsao National Accounts and Special Projects, United Nations Statistical Office (UNSO), New York
Andre Vanoli Director, Department of Statistical Coordination and Accounting, INSEE, Paris
Jan van Tongeren National Accounts and Special Projects, UNSO
Teresa Villacres Government Finance Division, Bureau of Statistics, IMF
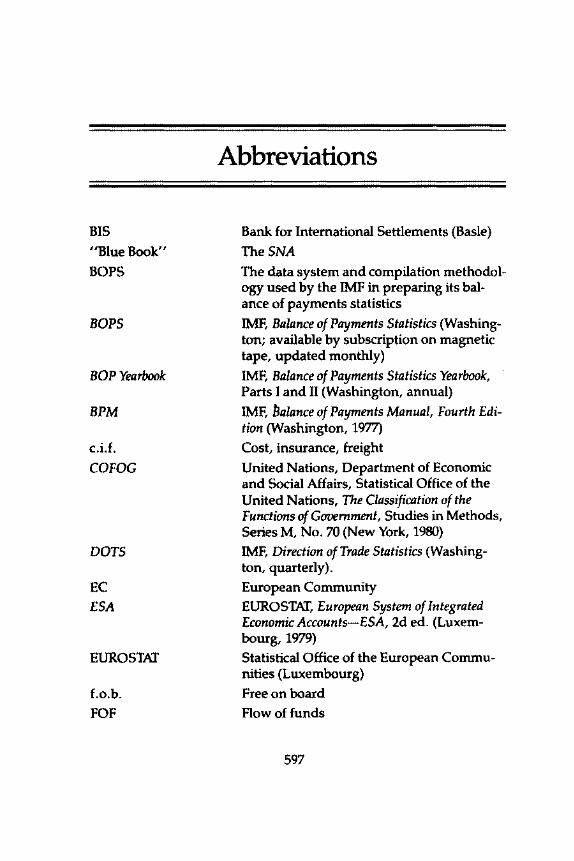
BIS
"Blue Book"
BOPS
BOPS
BOP Yearbook
BPM
c.i.f.
CO FOG
DOTS
EC
ESA
EUROSTAT
f.o.b.
FOF
Abbreviations
Bank for International Settlements (Baste)
TheSNA The data system and compilation methodology used by the IMF in preparing its balance of payments statistics
IMF, Balance of Payments Statistics (Washington; available by subscription on magnetic tape, updated monthly)
IMF, Balance of Payments Statistics Yearbook, Parts I and II (Washington, annual)
IMF, halance of Payments Manual, Fourth Edition (Washington, 1977)
Cost, insurance, freight
United Nations, Department of Economic and Social Affairs, Statistical Office of the United Nations, The Classification of the Functions of Government, Studies in Methods, Series M, No. 70 (New York, 1980)
IMF, Direction of Trade Statistics (Washington, quarterly).
European Community
EUROSTAT, European System of Integrated Economic Accounts-ESA, 2d ed. (Luxembourg, 1979)
Statistical Office of the European Communities (Luxembourg)
Free on board
Flow of funds
597
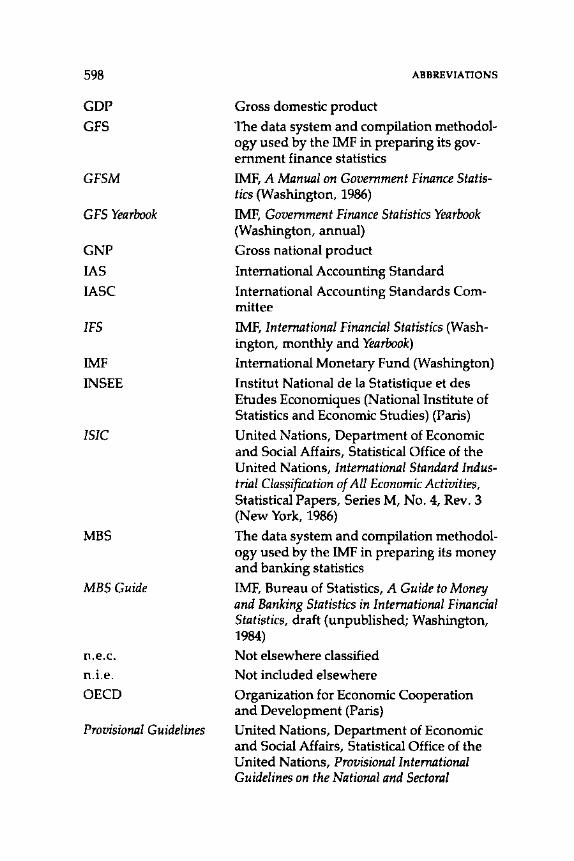
598
GOP
GFS
GFSM
GFS Yearbook
GNP
lAS
IASC
IFS
IMF
IN SEE
ISIC
MBS
MBS Guide
n.e.c. n.i.e.
OECD
Provisional Guidelines
ABBREVIATIONS
Gross domestic product
The data system and compilation methodology used by the IMF in preparing its government finance statistics
IMF, A Manual on Government Finance Statistics (Washington, 1986)
IMF, Government Finance Statistics Yearbook (Washington, annual) Gross national product
International Accounting Standard
International Accounting Standards Committee
IMF, International Financial Statistics (Washington, monthly and Yearbook) International Monetary Fund (Washington)
Institut National de la Statistique et des Etudes Economiques (National Institute of Statistics and Economic Studies) (Paris)
United Nations, Department of Economic and Social Affairs, Statistical Office of the United Nations, International Standard Industrial Classification of All Economic Activities, Statistical Papers, Series M, No.4, Rev. 3 (New York, 1986)
The data system and compilation methodology used by the IMF in preparing its money and banking statistics
IMF, Bureau of Statistics, A Guide to Money and Banking Statistics in International Financial Statistics, draft (unpublished; Washington, 1984)
Not elsewhere classified Not included elsewhere
Organization for Economic Cooperation and Development (Paris) United Nations, Department of Economic and Social Affairs, Statistical Office of the United Nations, Provisional International Guidelines on the National and Sectoral

ABBREVIATIONS
SNA
UN
UNSO
599
Balance-Sheet and Reconciliation Accounts of the System of National Accounts, Statistical Papers, Series M, No. 60 (New York, 1977)
United Nations, Department of Economic and Social Affairs, Statistical Office of the United Nations, A System of National Accounts, Studies in Methods, Series F, No.2, Rev. 3 (New York, 1968)
United Nations
United Nations Statistical Office (New York)