chapter one - tucl elibrary
TRANSCRIPT

1
CHAPTER ONE
INTRODUCTION
1.1 Background
In the broadest sense investment means the sacrifice of current rupees and resources
for the rupees and resources for the sake of future rupees and resources. In other
words, it is co-commitment of money and other resources that are expected to
generate additional money and resources in the future. Generally investment
involves two important things. They are time and risk. The sacrifice takes place in
the present and is certain. The rewards come later, if at all, and the magnitude is
generally uncertain. Investment is the commitment of current funds in anticipation
of receiving a larger future flow of funds the investor hopes to be compensated for
forgoing immediate consumption for the effect of inflation, and for taking a risk.
Investment or investing is a term with several closely-related meanings in finance
and economics. It refers to the accumulation of some kind of asset in hope of
getting a future return from it. Investment is the value of machinery, plants and
buildings that are bought by firms production purposes.
Investment a means, in finance, the purchase of a financial product or other item of
value with on expectation of favorable future returns. In general terms, investment
means the use money in the hope of making more money.
Money committed or property acquired for future income
(www.businessdictionary.com) investment generally involves real or financial
assets. Real investment generally involves some kind of tangible assets such land,
machinery or factories, real assets used by a firm ultimately generate income
whereas since investment in financial assets means buying securities or other
monitory or paper assets. Financial investment involves contracts written on a piece
of paper. Common stocks and bonds are financial assets. Real assets are less liquid
2
than financial assets. Investment involves long term commitment and waiting for a
reward. Return, risk and time are the important elements of the investment. The
return better known as rewards from investment include both current income &
capital gains or loses that arises by the increase or by the decrease of the security
price. Risk is inseparable from return. The investment must deal with both the
return and the risk. Another important factor in investment is the time. Time period
depends upon the attitude of the investors, who follow buy and hold policy.
Investment process is concerned with how on investors make decision about what
securities to invest in, how extensive this investment should make. The investment
process involves the five steps- (1) Selling investment policy (2) Performing
security analysis (i) Technical analysis (ii) Fundamental analysis (3) Construction
of portfolio (4) Revision of portfolio (5) Evaluation of portfolio performance.
Investment decision is very crucial decision among the various decision of finance.
Investment Analysis
Investment is long term commitment and waiting for a reword. An investment
involves the sacrifice of current rupees for future rupees so that investor have to be
alert about investment of their assets. Investment analysis help them to invest.
Investment analysis is an examination of corporate accounting reports to asses the
value of company (CRAB). In the process of examining the investment, financial
statement should be analyzed. There are three primary and interrelated financial
statements. They are namely income statement balance sheet and cash flow
statement. The income statement summaries the revenue receipt from the sale of
firm goods and the expenses associated with sale for the given period (CRAB). The
balance sheet of the company reflects the firms assets and liabilities for a given
dates. The balance sheet is the picture of the company at any given point in time,
(CRAB).
3
A study of the likely return from a proposed investment with the objective of
evaluating the amount an investor may pay for it, the investment’s suitability to that
investor, or the feasibility of a proposed real state development. There are various
methods of investment analysis, including cash on cash return payback period,
internal rate of return, and net present volume. Each provides some measure of the
estimated return on an investment based on various assumptions and investment
horizons. (www.answer.com)
Banks which are established to accept and grant loan to the industries, individual
and traders with a view to earn profit are known as commercial banks. Commercial
banks in Nepal deserve a crucial or vital role for the economic development.
The development of country always measures by the economic indices. Nepalese
economy is distinctly different in its character from the regional economics poverty
less developed geographical situation, technological backwardness, land locked and
dominated by two large economics India and China. Most of the population of the
country is in rural areas, where there is no access of banking facilities. From the
beginning of the 1970 A.D. some programs were introduced focused to poverty
alleviation but did not achieve significant result in that purpose.
Nepal is one of the agro-based economy countries. To aid in the development of the
country development in the field of industrial sector is of crucial importance. Hence
investment on both agriculture and industrial sector is needed. To make investment,
saving must be collected from the different sectors. For this purpose various banks
& financial institutions are established on different sector like commercial,
industrial and development etc. on both urban and remote areas. They collect
deposits from different sectors and make huge amount then invest in various
sectors.
4
The established financial system in Nepal has more history, the introduction of
modern banking activities and system had been traced back to year 1937is first
promulgated during. A government institution called Tejarath Adda at the period of
Ranoddhip Singh who is called the father of modern banking, was established. The
Tejarath Adda helped public by provided credit at 5% interest rate on the security of
gold and silver ornaments and mobilized the resources.
At the developing process of financial institution to help the growing economic
activities the need of banking has been increasingly realized and established a
system. In 1994 B.S. the first bank of Nepal. Nepal Bank Limited was established.
Nepal Rastra Bank was established as a central bank of Nepal in 2013 B.S. The
second commercial bank is RastriyaBanijya Bank established 2022 B.S. in full
ownership of the government. Agriculture development bank was established 2024
B.S. for providing capital & technical assistancy for the development of agriculture
sector in Nepal. The Nepalese government kept on liabalizing the economical
policies as a result various bank were established in public and private sector in
joint venture for capital & support for the economic development of country (2065
B.S.)
As per statistical data of Nepal Rastra Bank 26 commercial banks, 59 development
banks, 78 finance companies, 46 co-operatives performing limited banking
transactions. After then, implementation of the liberal economic policy, foreign and
private internal investment has increased and currently many banks have come into
existence one after another.
1.2 Profile of Sampled Bank
In this chapter it has been discussed about the profiles of concerned banks. These
profiles are related to the established objectives development, capital structure,
investment policy & sector and the facilities granted by the concerned banks.
5
Himalayan Bank Ltd. (HBL)
Himalayan Bank Ltd. Is a joint venture bank with Habib Bank Ltd. Pakistan was
established 1992, under the company Act 1964. The main objective of the bank is to
carryout the bank activities under the bank Act. 1974. Habib Bank Pakistan has
manage 20% share capital, Nepali promotes have 80% share capital and the bank
has altogether15 branches. It’s authorized equity capital is 1000 million, issued
equity capital is 650 million & paid up equity capital 429 million. It is taken share
ownership from foreign institution 20% other licensed institution 14% general 51%
& public 15%.
Nepal SBI Bank Ltd.
Nepal SBI Bank Ltd. Was established in 1993 under the company Act 1964 as a
fifth joint venture bank in Nepal. This is a joint venture of the state bank of India
and Nepal promoters. The bank is managed by state bank of India under the joint
venture and technical services agreement signed between it and Nepali promoters.
The Nepal’s promoters are employees provident fund and agriculture Development
bank Nepal. The state bank of India is holding 50.2% equity. The head office of the
bank is in Hattisar, Kathmandu. There are 19 branch offices (including extension
company) of Nepal SBI Bank it’s authorized capital is 1000 million issued capital is
650 million & paid up capital is 6477984 thousand. It is taken share ownership from
state bank of India 50.2%, Agriculture Development Bank 5%, Employee provident
fund 15%, General Public 29.98%
Nabil Bank Limited
Nabil Bank Ltd. Formerly known as Nepal Arab Bank Ltd. was incorporated 11
May 1984 as the first foreign joint ventures bank in Nepal with the authorized
capital of Rs. 100 million. It commenced its operation from 12 July, 1984 with the
technical service assistance and 50% share of Dubai Bank Limited and remaining
50% shared among Nepal industrial development, Rastriya Beema Santhan, Nepal
Stock Exchange Limited and Nepalese general public. The head office of NABIL is
6
in Kathmandu. The main objective of this bank is to collected deposit, provide loan
and provide modern banking services to the public. The promoters and the
shareholding pattern of Nabil Bank Ltd. are NB (international) limited 50%, Nepal
industrial Development Corporation 10%, Rastriya Beema Sansthan 9.67%, Nepal
Stock exchange 0.33, General Public 30%, share capital of NABIL Bank Ltd. (end
of Aasar 2064) is authorized capital 500 million, issued capital 491654400, paid up
capital 49165.44.
Standard Chartered Bank Ltd. (SCBL)
Standard Chartered Bank Ltd. a subsidiary of standard Chartered group is Nepal
largest international bank and has completed 23 years of operation in January 2007
the bank was established in 1987 (2043 B.S.) as a third joint venture bank in Nepal
under the company act 1964 with authorized capital of Rs. 100 million issued
capital of Rs. 50 million and paid up capital of Rs. 30 million its head office located
in Naya Baneshwor, Kathmandu. Since July 2001, it’s name changed from Nepal
Grindlays Bank Ltd. to Standard Chartered Bank Limited. The promoters and
shareholding pattern of its is foreign institution 75% and general public 25% share
capital of Nepal SCBL (end of Aasar 2064) is taken from authorized capital Rs.
1000 million, issued capital Rs. 500 million paid up capital Rs. 413254800.
Machhapuchhre Bank Limited (MBL)
Machhapuchhre Bank Limited was registered in 1998 as the first regional
commercial bank to start banking business from the western region of Nepal with
its head office in Pokhara. Today with a paid up capital of above 820 million
rupees. It is one of the full fledged commercial bank operating in Nepal and it ranks
in the topmost among the private commercial banks. It is rewarded by ISO 9001-
2000. It is the pioneer in introducing the latest technology in the banking industry in
the country. It is the first bank in Nepal to introduce centralized banking software
named BLOBUS BANKING SYSTEM developed by Temenous N, Switzerland.
Currently it is using the latest version of BLOBUS, referred as T-24 Banking
7
system to its valued customers. It is taken share ownership (End of the Aasar 2063)
from industrial 74.86% & other institution 25.14%.
1.3 Focus of the study
The main focus of the study is to highlight the investment policies of five
commercial banks namely, Nabil Bank Ltd., SBI bank Ltd., Standard Chartered
Bank Ltd., Himalayan Bank Ltd., Machhapuchchre bank Ltd. Expecting that they
study on bridge the gap between deposit and investment policies. Past, present as
well as future analysis are carried out. The study would provide information the
management of the banks that would help them to corrective action. For this,
different tools of analysis are use and preserve remedial measure to improve the
investment policies of five banks.
1.4 Statement of the Problem
In Nepal, after the economic liberalization many joint venture banks have emerged.
Currently establishment of joint venture banks in various numbers have drastically
made changes over the financial system of Nepal. Though the flow of money in the
market is high still they are not fully utilize in absence of better investible project.
Increasing trend of banking institution brought into existence of such idle moneys
utilization to a great extent. Most of the existing commercial banks are making
profit and has been satisfying their share holders. Thus this has attracted the
potential customers to power their money into banks, as they are very few sectors
to make a profitable investment and the potential investor are always reluctant to
risk. That is the reason commercial banks have a lot of deposits but very low
interest. Lake of sound investment policy is another reason for a commercial bank
not to properly utilizing its deposits that is making loan and advances or lending for
a profitable project. Existence of this kind of kind of condition will lead the
commercial bank to the position liquidation. They are facing much difficulty in
8
mobilizing their deposits on the profitable investment which leads them to achieve
not sufficient return from the investment and satisfy their shareholders.
Many studies are completed on the investment analysis and related topic in the
national international era as well. The joint venture banks are to manage invest in
different sectors. Although the joint venture banks have manage to perform better
than the local commercial banks within short span of time. They have been facing
highly competition against one another the interest rate of the banks have been
decrease and mobilized resources are mostly idle. Commercial banks of Nepal also
have failed to fulfill the growing need of customers. They are operating in
traditional ways and failed to meet customer’s expectation of fast service.
Commercial banks in Nepal are expected to mobilize the passive funds towards
trade and commerce to provide economic assistance to entrepreneurs and to create
saving habits in public. Activities of commercial banks are fulfilling the growing
need of funds required for development of country. There is high competition
among joint venture banks and other commercial banks. Due to decreasing interest
rate the depositor are discourages. In view of these problems this study is directed
towards the following research problem:
How is the liquidity position of the different banks
What is the relationship between investment and loans and advances with total
deposits and total net profit ?
How is the effectiveness of fund mobilization and applied investment policy ?
What is the effect of the investment decision to the total earning of the bank ?
How is the proper utilization of the available fund ?
What are the associated risk return with the investment in the financial assets ?
How is the relationship of investment with the financial variables like liquidity,
profitability, tax provision and interest paid according to the correlation
analysis ?
What is the investment criteria of the commercial banks in Nepal ?
9
What is the proportion of the non-performing assets of the bank ?
What is the growth trend of the investment and its associated factors in different
commercial banks in Nepal ?
What are tools and technique for evaluate performance ?
Based on the problem how those banks evaluate investment risk ?
1.5 Objective of the Study
The main objective of this study is to analyze investment policy of commercial
banks. Other specific objectives are as follows:-
To examine the liquidity positives of selected banks.
To examine the profitability of selected banks
To examine the assets management of selected banks.
To examine the criteria of the investment of Nepalese commercial banks.
To examine the relationship of different variables like:- correlation coefficient
between total deposit and loan & advance, correlation coefficient between
profitability & liquidity of selected banks.
1.6 Significance of the Study
It is fact that the banks affect the economic condition of whole country in the
absence of study and research it is difficulty to know what is the exact economic
condition and how to take decision about it.
For provided exact information & data to concern institution, bank, shareholders,
persons and also get information for take decision for various ways. The proper
mobilization of domestic resources becomes indispensable for any developing
country aspiring for a sustainable economic development. There is no doubt that
JVBs have vital role in the mobilization and utilization of scattered resources of a
nation. NABIL, HBL, MBL, SBI Bank Ltd, SCBL are pioneering JVBs of country.
The prosperity of the five JVBs will naturally have a positive impact on the
10
economic development of the country and vice-versa. In conclusion the importance
of the study focuses at the following points.
It will be helpful to concern financial institutions.
It will be valuable property for decision making
It will be benefited to lenders and borrowers of the banks.
Other concerned parties who interested of these banks
It will be benefited to customers of those banks.
It provides various information & data to required persons, readers,
shareholders, decision-makers, traders, investors, economic planners etc.
By the above points it helps to study all economic condition of nation.
1.7 Limitation of the Study
In the context of Nepal problem is major problem for study. There is a considerable
place a arguing about its accuracy and reliability. This research has been conducted
to fulfill the requirement for the Master Degree of Business Studies (MBS). It is,
therefore, an action oriented research. It does not focus much on fundamentals
issues. Although this research will be helpful to know the economic condition of
nation but it is not covered whole sector due to lack of resources, finance & time
constraints etc. It has covered mini data of only investment policy of concern bank
absence of current data information & other required resources it can’t fulfill every
aspects of country. There are many limitations, which weaken generalization eg.
Period taken and other variables. Generally the limitations of this study are as
follows:-
For completion of the study the researcher have boundary.
Required data & information may not be able to collect by different sources due
to the lack of resources.
The collected data and information from different sources covered by only 5
years.
11
The analysis is mainly based on the secondary data therefore reliability of the
result depends upon the data.
Out of various banks of finance institutions, only HBL, SBI, NABIL, SCBL,
MBL banks are taken as sample.
1.8 Organization of the Study
This study has been divided into five chapters, each devoted to some aspects of the
study of the investment analysis of commercial banks (Five banks). The titles of
each of the chapter are as follows:-
Chapter One – Introduction
Chapter Two – Review of Literature
Chapter Three – Research Methodology
Chapter Four – Data Presentation and Analysis
Chapter Five – Summary, Conclusion and Recommendation
Chapter One – This chapter deals with the general background of study with the
subject matter of study. This chapter includes profile of concern bank, statement of
the problem, objective of the study, significance of the study, limitation of the
study, function of the bank, focus of the study, organization of the study.
Chapter Two – This chapter’s titled review of literature. Conceptual framework,
characteristics of good investment policy, investment portfolio management &
portfolio theory, capital assets pricing model, portfolio management, review of
books, review of previous thesis, review of articles, concluding remarks have been
stated.
Chapter Three – This chapter deals, research design, sources of data, population &
sample, method of analysis, data collection method, limitation of the methodology.

12
Chapter Four – This chapter deals with systematic presentation and analysis of
data. Various financial and statistical tools & techniques have been used to analysis
and interpret the data. This chapter is the key chapter for the present study. This is
the analyzing chapter concern with the analysis of different financial ratios related
to the investment policy. It also presents the results relating to investment analysis.
Chapter Five – Lastly, this chapter includes summary of the whole study and state
main finding along with various suggestions and recommendations for improving
future performance of the banks and conclusion drawn from the study.
Finally an extensive bibliography and appendixes are presented at the end of study.
13
CHAPTER TWO
REVIEW OF LITERATURE
Review of literature means reviewing research studies or other relevant preparation
in the related area of the study. So that all past studies, their conclusions and
deficiencies may be known and further research can be conducted (Pant: 2003).
This chapter high lights upon the literature that have already been conducted by
some thesis researchers in this particular topic of commercial banks. It means prior
to this study, various students regarding various aspects of banking have conducted
several thesis works. Likewise, different persons regarding commercial banks and
their activities, on, journals, booklets, magazines etc. have expressed numerous
views and opinions. The review of literature has been described in four sections.
Section 1: presents a discussion of the conceptual framework. Section: includes the
review of empirical work. Section 3: describes about the review of Nepalese study
and finally. Section 4: includes concluding remarks of above three sections.
2.1 The conceptual Framework
An investment involves the sacrifice of current rupees for future rupees. The
sacrifice takes place in the present and certain. The reward comes later and is
uncertain. According to F. Amling “investment may be defined as the purchase by
an individual or institutional investor of a financial or real asset that produces a
return proportional to the risk assumed over some future investment period.”
According to Donald E. Fisher and Ronald J. Jordan “An investment is a
commitment of funds made in the expectation of some positive rate of return. If the
investment is properly undertaken, the return will be commensurate with the risk
the investor assumes”. Investment, in its broadest sense, means the sacrifice of
current dollars for future dollars. Two different attributes are generally involved:
14
time and risk. The sacrifice takes place in the present and is certain. The reward
comes later if at all and the magnitude is generally uncertain. (William F. Sharpe)
Return, Risk, Time elements are involved in investment.
Return: Investors may buy and sell financial assets in order to earn returns on
them. The return better known as reward from investment includes both current
income and capital gains or losses that arise by the increase or decrease of the
security price.
Risk: Risk is inseparable from return. Risk is quantity in term of statistical terms.
The investment process must be considered in terms of both aspects risk and return.
Time: another important factor in investment is the time, which offers several
different sources of action. The time period depends on the attitude of the investors
who follows a buy and hold policy.
An investment is a commitment of money that is expected to generate additional
money. Every investment entails some degree of risk, it requires a present certain
sacrifice for future uncertain benefits. There are various ways to select the
investments that will provide the maximum future return at an acceptable level of
risk. It examine such marketable financial instruments as common stools, preferred
stocks, bonds, put options, call options, combination options. (Jack Clark Francis)
Investment generally involves real assets or financial assets. Real assets represent
actual tangible assets that may be seen felt, held or collected. For examples
building, automobiles, machinery, factories and textbooks. A financial asset
represents a financial claim on an asset that is usually documented by some from of
legal representation.
Analysis is the detail study or examination of something in order to understand
about it.
15
2.2 Characteristics of Good Investment Policy
There are some of the main characteristics of good investment policy, which are as
follows:-
2.2.1 Liquidity
2.2.2 Profitability
2.2.3 Safety and security
2.2.4 Suitability
2.2.5 Diversification
2.2.1 Liquidity
Liquidity refers to the capacity of the bank to pay cash against deposits. Having
confidence that the bank will repay their money wherever it is needed people
deposits money at the bank in different accounts. In order to maintain the
confidence to the depositors, bank must be prepared with sufficient degree of
liquidity of its assets. Once the confidence is lost in view of depositors, they may
withdraw all their deposits within a brief period without giving any chance the bank
to manage. So, to maintain the confidence of the depositors, the bank must keep this
point while investing its excess fund in different securities or at the time of
investing as that it can meet the readily demands for cash made by customers
2.2.2 Profitability
Bank should invest their fund where they earn maximum profit. Banks built up their
capital accept deposits from depositors and issued of shave and debenture from
shareholders who contribute interest and dividend. The profit of banks mainly
depend on the interest rate, volume of loan, time period and nature of investment in
different securities.
2.2.3 Safety and Security
While investing its funds the bank should recognize those person who are
speculative businessman, who may be bankrupt at once and who may earn million

16
in a minute also. The bank must not finance its fund to those people at all. Only
commercial durable, marketable and high market valued securities should be
accepted. The bank should never invest its fund in those securities that one too
volatile since a little difference may cause the great loss.
2.2.4 Suitability
Bank should know that why a customer needs loan or it is for appropriate propose
or not. If the borrower misuse the loan. Granted by bank, he will never to be able
repay the loan which posses heavy bad debts to bank. In order to avoid such
situation advances should be allowed to selected and suitable borrow is and
necessary all detailed information about the scheme of project or activities should
be demanded and it should be examined before investing. There suitability is the
important factors for investment.
2.2.5 Diversification
Diversification of loan helps to sustain loss to the law of because if securities of a
company deprived, there may be appreciation in the securities of other companies.
This can minimize the loss. So in order to minimize risk a bank must diversity its
investment on different sectors.
2.3 Investment Portfolio Management and Portfolio Theory
A portfolio is a combination of investment assets. The portfolio is the holding of
securities and investment in financial assets ie bond, stock, portfolio management is
related to efficient portfolio investment in financial assets.
Harry M. Markowitz developed portfolio theory which appeared in the journal of
1952. portfolio theory allows investors to estimate both the expected risk and
returns as measured statistically for their investment portfolios.
(www.riskglossary.com)
17
Markowitz described how to combine assets into efficiently diversified portfolios. It
was his positions that a portfolios risk could be reduced and the expected return
could be improved if investment having dissimilar price movements where
combined.
An investors will choose his or her optimal portfolio from the set of portfolios that
1) Offer maximum expected return for varying level of risk.
2) Offer minimum risk for varying levels of expected return. (William F. Sharpe)
2.4 Review of Previous Thesis
Pant, (1996) in his thesis paper “A study of Banks deposits and its utilization” has
tried to make an attempt to highlight the discrepancy between resource collection
and its utilization. Further he is trying to trace the availability of funds in the banks
to invest. After going through the detailed study of the above areas he got to
conclusion that banks are being failure in resource utilization the reasons there on is
due to their lending confirmed for short-term only. So, he recommended that banks
should give emphasis on long term lending too, for sound utilization of the deposits.
Pradhan, (1980) in his thesis “A study on investment policy of Nepal Bank Ltd.”
has concluded that to maintain sound relationship between deposits and loan and
advances. In his 6 year’s period study he conclude that loan and advances as well as
deposits are increasing by the pace of each year, however their increasing is not in a
proportionate manner, Immense increase in the deposits and leaded to little increase
in loans and advances without its lengthy process and also suggested for extending
banking transaction towards rural sectors of the kingdom Mr. Khadka in his thesis,
“A study on investment policy of NABIL in comparison to other joint venture
banks of Nepal.” (Khadka, 1998) has suggested that JVBs to careful in increasing
profit in real sense to maintain the confidence of shareholders depositors and
customers. He has strongly recommended NABIL to utilize its risks assets and
shareholders fund to gain highest profit margin and reduce its expenses and collect
18
cheaper fund for more profitability. He has recommended investing its fund in
different sectors of investment and administering various deposits schemes to
collect fund such as cumulative deposits scheme etc. He has recommended that to
be success in competitive banking environment, deposit’s money should be utilized
as loans and advances, since, the target item of the bank in assets side is loan and
advances, negligence in administering this asset could be the main course of a
liquidity crisis in the bank and one of the main reason of a bank failure.
Ojha, (1997) in her thesis paper “A study on priority Sector investment in banks”
(Ojha, 1997) that the banks are unable to meet the requirement of 12% lending in
priority sectors as set under NRB directives. As her 5 years study period she has
further found that low interest rate in priority sector but increasing trend of overdue
and its misutilization. She has pointed out to give more emphasis on the
improvement of sound supervision, evaluation of borrower’s paying capacity and
reduction of overdue through integrated program of priority sector loan as main
recommendation of the research.
Yadav, (2002) has done analysis of saving, investment and capital market and its
various determinator of Nepalese enterprise by using the properties of portfolio
formed on saving investments and capital formation. This study has examined the
relationship between saving investment and capital formation through regression
analysis taking 39 enterprises from the fiscal years 1995/1996 to 1999/2000. His
study has revealed positive relationship between saving and GDP. Investment and
GDP, capital formation and GDP and these variables has positive relation with tax
revenues, foreign and exports.
Chettry, (2003) is thesis paper “Portfolio theory in financial institution of Nepal”
Chettry found three objectives by researching in this thesis. Studying the portfolio
theory in financial institution of Nepal Chettry found that the portfolio risk of 15
financial institution were diversified. Second he found that the portfolio risk of 15
19
financial institution were less than the average risk of the average risk of the fifteen
financial institution in Nepal and the third he found the relationship between risk
and return was negative for insurance and finance company whereas banking
industry shows positive relationship between risk and return.
Pandey, (2006) in her thesis paper “Investment analysis of the commercial Banks
in Nepal.” The researcher objectives are listed below:-
1) Mobilization of six banks deposits on loan and advances.
2) Liquidity ratio of the six banks.
3) The assets of six banks one efficiently utilize.
4) To develop alternative investment strategies for selecting a better portfolio
which will ensure a trade-off risk and return.
5) Investment has positive relation with the probability and the negative relation
with the tax paid.
Singh, (2007) in her thesis paper “Investment policy of commercial banks in
Nepal.” In this thesis she has been use SCBL, NABIL and HBL with comparative
study under 5 years study period from 2000 to 2004. Major finding derived from the
analysis by using different financial tools and statistical tools.
Current ratio cash and bank balance to total deposit ratio cash and bank balance to
current assets ratio, investment on government securities to total assets ratio etc. has
been analyzed. Mobilization of three bank total working fund on loan and advance.
2.5 Review of Articles
Bajracharya, (1990) in his article “Monetary policy and deposit mobilization in
Nepal” has mentioned that mobilization of domestic saving is one of the prime
objectives of the monetary policy in Nepal and banks and the most active financial
intermediary for generating resources in the form of deposit of private sector and
providing credit to the investor in different sectors of the economy.
20
Pradhan, (1991), in this article “Nepal ma Banijya Bank Upalabdhi Tatha
Chunauti”, concluded some major issue in local banks in comparison of recently
established joint venture banks. The study deals with the whole banking system of
Nepal in respect of their performance and profitability. Some of his finding,
relevant to this study is given as-
The deposit collection rate of local banks is very poor in comparisons to joint
venture banks.
The patterns of deposit are also different between these banks. The ratio of
current deposit in local banks is 9.34% only where the same as the joint venture
banks is 52.5%. But the fixed deposit ratio is very high is local banks.
Shrestha, (1998) in this article, “Portfolio management in Bank Theory and
practices” In case of investors having lower income portfolio management may be
limited to small saving incomes. But, on the other hand, portfolio management
means to invest fund in various schemes of mutual funds like deposits, shares and
debentures for the investors with surplus income. Therefore, portfolio management
becomes very important both for individual as well as institutional investors would
like to select a best mix of investment assets.
R. Sharma, (1998) is his article Nepal, co-existing or Crowing out” pointed out that
it would be definitely unwise for Nepal not to let the JVBs to operate in the country
and not to take advantage of them as additional means of resources mobilization as
well as harbinger of new era in banking. But it will certainly be unfortunate for the
country to develop the JVBs at the cost of domestic banks. So far, one should admit
frankly no differential treatment has been extended to the domestic and JVBs al
least from the government’s side which is commendable. If the government keeps
on the attention of treating the domestic and JVBs equally deposit the letter’s
bargaining strength and if the JVBs also show their alacrity to come forward to
share the trials and tribulations of this poor country, both types of banks will

21
coalesce and coexist complementing each other and contributing to the nation’s
accelerated development. On the country, if the JVBs use their strength against
treading into the cumbersome path of development along with the domestic banks
and the government they will eventually crowd out the domestic banks from the
more profitable urban areas and lucrative urban sectors unless reined by the
determination of the government.
Ghimire, (1999) has mentioned in his article “Banijya Bank haru Prathamikta
chhetra ma lagani garna bhanda harjana tirna tayar.” That most of banks of Nepal
are ready to pay the penalty in spite of investing in rural, priority sector, poverty
stricken and deprived in spite of investing in rural, priority sector, poverty stricken
and deprived areas. In the directives of Nepal Rastra Bank it is clearly mentioned
and directed that all the banks (Under NRB) should invest 12% of its total
investment to the priority sectors. Out of this 12%, they should invest 3% to the
lower level class of countrymen. However those banks are unable to meet the
requirement of NRB.
Scort Harringon and Greg Niehaus (2003) “Risk management and insurance
Review.” Risk management refers to the management of so-called pure risks, eg,
losses from property damage liability suits and worker injuries. These risk typically
are managed through a combination of loss control (efforts to reduce the likelihood
or magnitude of losses) and loss financing through internal retentions or the
purchase of insurance.
Regmi, (2046 B.S.) has indicated in his article “Aarthik Mimangsa” has concludes
that all the commercial banks were found problematic due to the combinations of
various factors. But problems with credit have became common in majority of the
cases. Credit management could not be seen sufficiently robust to prevent poor
lending practices excessive loan concentration, excessive risk taking and overriding
existing policy and procedures. As result quality of assets started to deteriorate,
22
profitability ratio reduced, liquidity crunched, capital position deteriorated and
finally turned to problematic.
“In business the purchase by a producer of a physical good, such as durable
equipment or inventory, in the hope of improving future business called
investment.” (www.google.com, 2009)
“In finance, the purchase of financial product or other item of value with an
expectation of favourable future returns. In general terms investment means the use
money in the hope of making more money.” (www.google.com, 2009)
“Investment analysis is examination and assessment of economic and market trends,
earnings prospects, earnings ratios, and various other indicators and factors to
determined suitable investment strategies.” (www.google.com, 2009)
“Investment analysis is in the accounting and auditing, investing and statistics,
mathematics and analysis subjects.” (www.google.com, 2009)
2.6 Concluding Remarks
Through the past researches the thesis got a bundle of helps and ideas to get success
in the motto of study, most of the investment objective is to increase systematically
the individual wealth. An investors get return as their face level of risk. Investment
is long term commitment and waiting for reward. An investment involves the
sacrifice of current rupees for future rupees. The sacrifice takes place in the present
and is certain. The reward comes later and is uncertain. It is very important to
understand the various determinants of investment and its behaviour in the course of
development.
Researcher explained and presented the portfolio theory, lending in priority sector,
analysis of saving, investment and capital market and its various determinations.
During the trend analysis some researcher had presented only comparing few banks,
23
comparison with two or maximum three, which not sufficient to compare in an
overall macro level most of the empirical studies are however devoted in testing
econometric model and ratio analysis the overall picture that involves from the
empirical literature is that the bank should focus on the efficient utilization of
resources and that after the liberalization policies banks has been expanded.
The general conclusion that. Emerges above the studies is that investment cannot be
determined by single factor, and only profit does not reveal the financial
performance of any organizations. On the other hand, in the empirical literature
consideration attention has been paid to analyze the investment and its associated
financial factors. Financial performance should be judged on the basis of profit
along with discharging responsibilities like deposit mobilization, resource
mobilization, employment generation. Service to client and so on finding in general
has revealed strong positive association between the investment and its
determinants and the policy like liberalization and globalization.
Nepal has also followed a policy of liberalization privatization and globalization.
Considering the above mentioned studies in the context of Nepal, it has now
become necessary to find out whether these findings are still valid. Thus this study
of investment analysis of commercial banks in Nepal may be very rewarding.
Previous researchers have presented investment analysis of few banks but I have
taken 5 banks most of the researchers have failed through analysis. They did not
predict any assumption, which are meaningful during the analysis.
In this thesis overall macro banking condition is revealed and placed some of the
assumptions which are important for the banks.
In my view, this research is more comparative illustrative and descriptive than done
before. As this research includes secondary data for further analysis, which is more
practical formal and scientific. The bank selection in this research is limited within
24
two banks only. It has involved atleast five. In spite of there are many obstacles of
getting information and primary data from the banks due to security awareness and
therefore much information are based from their annual reports brochure
newsletters and data available in website. A deep consideration is being made to
select the banks for investment analysis. Out of twenty six commercial banks in
Nepal, the study covers only five of them, due to incalculability of required data and
time constraint.
Most of the researchers have applied the financial tools on surface or in aggregate
so these researchers could not reach to the depth of the study. They did not predict
any assumption, which are meaningful during the analysis. But this study has been
tried to full x-ray the investment analysis of five joint venture commercial banks by
applying various financial as well as statistical tools and techniques in effective
manner along with well trained and experienced lectures idea. So I think this
research becomes successful research to fulfill the gap between this research and
previous researches.
25
CHAPTER THREE
RESEARCH METHODOLOGY
Research is a common refers to a search for knowledge. According to P.V. Young
“Research may be defined as the systematic method of discovering new facts or
verifying old facts, their sequences, interrelationships casual explanation and the
natural laws which govern them.”
Research methodology is a way to systematically solve the research problem. In it
we study the various steps that are generally adopted by a researcher, studying this
research problem among with the logical behind them. Research methodology is the
process of arriving at the solution of the problem through planned and systematic
dealing with collection, analysis and interpretation of facts and figures “Research
methodology refers to the various sequential steps to be adopted by the researcher
in studying a problem with certain object in view” (Kothari 1989). Research
methodology describes the methods and processes applied in the entire aspect of the
study. Thus, it is a way to solve the research problem systematically and it considers
the logic behind the methods used in the context of research study and explains why
particular method or technique is used.
Good and proper methodology is needed to carry out study works smoothly and to
visualize all the works clearly. Main aim of, this research is to evaluate and analysis
of investment of five selected banks. This chapter contains the discussed about the
methods and processes that has been used for the study and analysis of the
investment strategy of given banks. This chapter highlights the research design,
source of data, population and sample, method of data analysis used in this study for
the investment analysis of commercial banks.
26
3.1 Research Design
A research design is the arrangement of conditions for collecting and analysis of
data. It is the plan, structure and research question and to control variances are
obtained. According to cook, “A research design is the arrangement of condition for
collecting and analysis of data in a manner that aims to combine relevance to the
research purpose with economy is procedure.” Likewise according to Wolff and
Pant “The research design services as a frame work for the study guiding the
collection and analysis of the data.
In order to complete the research work, a well the out research design is necessary
which makes the study easy and fulfills the objectives of the study. As the purpose
of this research is to make a investment analysis of five commercial banks it has
been designed in a correlation format. Several relative variables were assessed to
make an analysis of their relative investment status and standing. Descriptive as
well as analytical research will be applied in this study to clarify the situation
through presentation and analysis of various data. Descriptive research design has
been utilized for conceptualizing and analytical research design for investment
analysis of different banks and analyze the relationship with the capital assets
pricing model and other different variables.
Therefore, the study is based on the descriptive and analytical research design.
3.2 Nature and Source of Data
1) Secondary Data
Data collection is the blood of any research. The present study is mainly based on
the secondary data relating to the financial statement as they are readily available at
the banks concerned. Other necessary secondary data are obtained from the
different sources. So the major sources of secondary data for this study are as
follows:-
Annual reports of various banks
27
Reports of NRB
NEPSE reports
Websites of related bank
All the secondary data are complied, processed and tabulated in the time as per need
and objective. Questionnaire and interview also conducted if adequate information
are not available form secondary data.
3.3 Population and Sample
A small portion taken from the lot to know the characteristic of the universe
(population) is called sample. For example a physician takes a little amount of
blood for blood testing a customer takes a handful of rice from a sack to know the
characteristic of the lot. According to good Hatt “A sample as the name implies is
the smaller representation of a large whole. “Whole portion is taken to know the
character is called population.
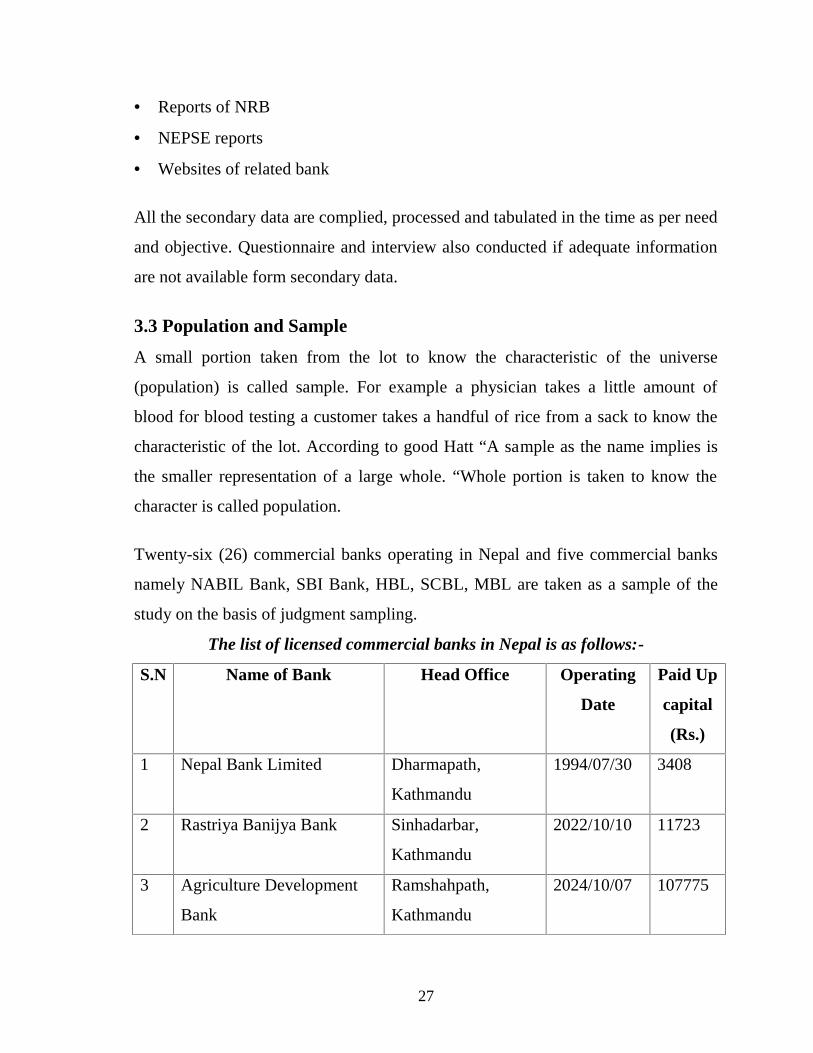
Twenty-six (26) commercial banks operating in Nepal and five commercial banks
namely NABIL Bank, SBI Bank, HBL, SCBL, MBL are taken as a sample of the
study on the basis of judgment sampling.
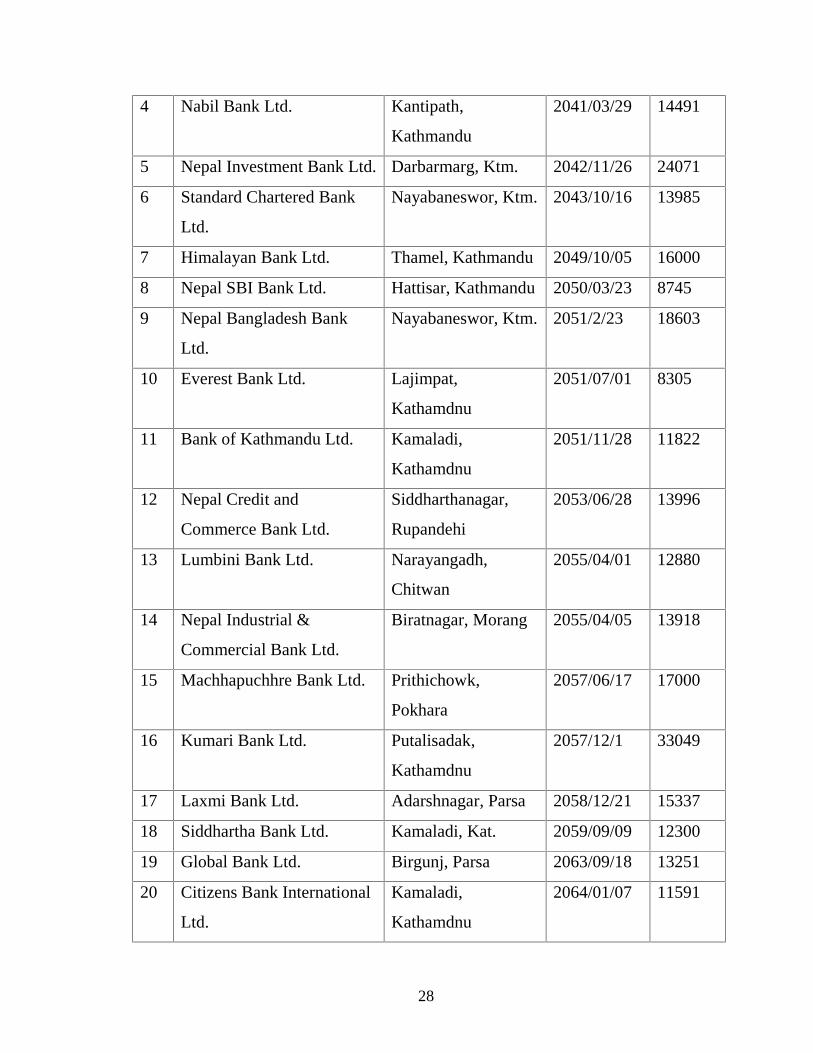
The list of licensed commercial banks in Nepal is as follows:-
S.N Name of Bank Head Office Operating
Date
Paid Up
capital
(Rs.)
1 Nepal Bank Limited Dharmapath,
Kathmandu
1994/07/30 3408
2 Rastriya Banijya Bank Sinhadarbar,
Kathmandu
2022/10/10 11723
3 Agriculture Development
Bank
Ramshahpath,
Kathmandu
2024/10/07 107775
28
4 Nabil Bank Ltd. Kantipath,
Kathmandu
2041/03/29 14491
5 Nepal Investment Bank Ltd. Darbarmarg, Ktm. 2042/11/26 24071
6 Standard Chartered Bank
Ltd.
Nayabaneswor, Ktm. 2043/10/16 13985
7 Himalayan Bank Ltd. Thamel, Kathmandu 2049/10/05 16000
8 Nepal SBI Bank Ltd. Hattisar, Kathmandu 2050/03/23 8745
9 Nepal Bangladesh Bank
Ltd.
Nayabaneswor, Ktm. 2051/2/23 18603
10 Everest Bank Ltd. Lajimpat,
Kathamdnu
2051/07/01 8305
11 Bank of Kathmandu Ltd. Kamaladi,
Kathamdnu
2051/11/28 11822
12 Nepal Credit and
Commerce Bank Ltd.
Siddharthanagar,
Rupandehi
2053/06/28 13996
13 Lumbini Bank Ltd. Narayangadh,
Chitwan
2055/04/01 12880
14 Nepal Industrial &
Commercial Bank Ltd.
Biratnagar, Morang 2055/04/05 13918
15 Machhapuchhre Bank Ltd. Prithichowk,
Pokhara
2057/06/17 17000
16 Kumari Bank Ltd. Putalisadak,
Kathamdnu
2057/12/1 33049
17 Laxmi Bank Ltd. Adarshnagar, Parsa 2058/12/21 15337
18 Siddhartha Bank Ltd. Kamaladi, Kat. 2059/09/09 12300
19 Global Bank Ltd. Birgunj, Parsa 2063/09/18 13251
20 Citizens Bank International
Ltd.
Kamaladi,
Kathamdnu
2064/01/07 11591
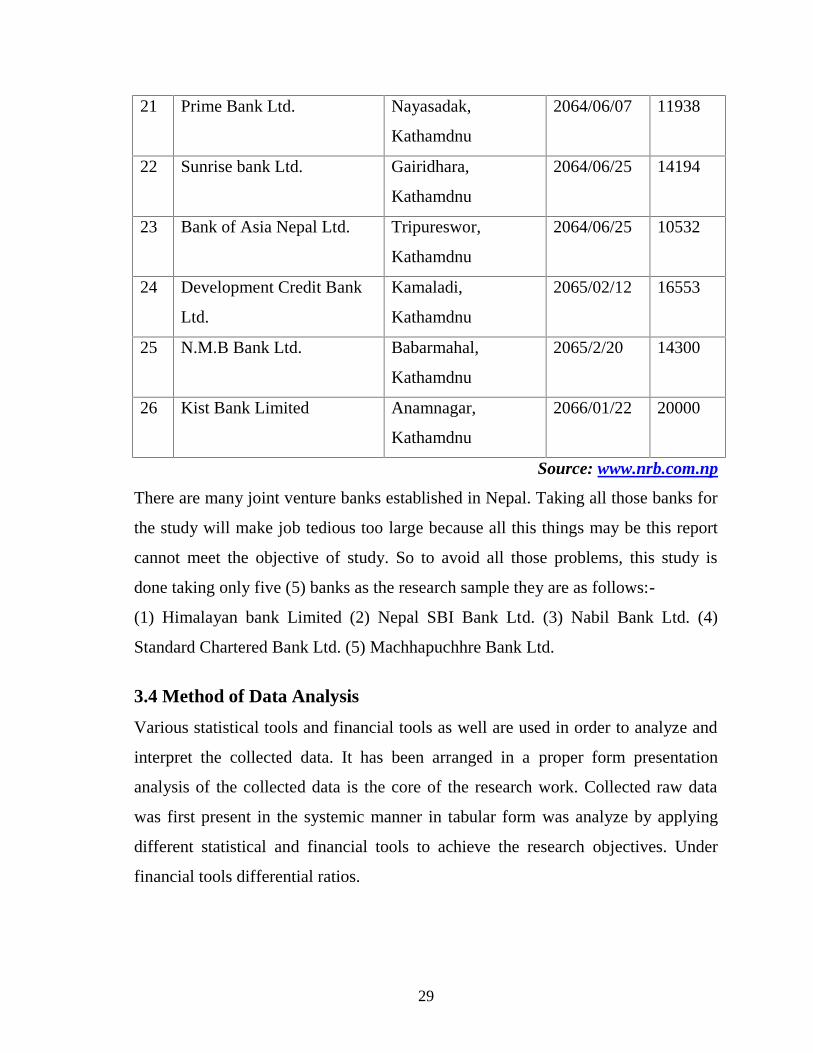
29
21 Prime Bank Ltd. Nayasadak,
Kathamdnu
2064/06/07 11938
22 Sunrise bank Ltd. Gairidhara,
Kathamdnu
2064/06/25 14194
23 Bank of Asia Nepal Ltd. Tripureswor,
Kathamdnu
2064/06/25 10532
24 Development Credit Bank
Ltd.
Kamaladi,
Kathamdnu
2065/02/12 16553
25 N.M.B Bank Ltd. Babarmahal,
Kathamdnu
2065/2/20 14300
26 Kist Bank Limited Anamnagar,
Kathamdnu
2066/01/22 20000
Source: www.nrb.com.np
There are many joint venture banks established in Nepal. Taking all those banks for
the study will make job tedious too large because all this things may be this report
cannot meet the objective of study. So to avoid all those problems, this study is
done taking only five (5) banks as the research sample they are as follows:-
(1) Himalayan bank Limited (2) Nepal SBI Bank Ltd. (3) Nabil Bank Ltd. (4)
Standard Chartered Bank Ltd. (5) Machhapuchhre Bank Ltd.
3.4 Method of Data Analysis
Various statistical tools and financial tools as well are used in order to analyze and
interpret the collected data. It has been arranged in a proper form presentation
analysis of the collected data is the core of the research work. Collected raw data
was first present in the systemic manner in tabular form was analyze by applying
different statistical and financial tools to achieve the research objectives. Under
financial tools differential ratios.
30
In this study various financial, statistical tools have been used to achieve of study.
The analysis of data is according to available of data. The various tools applied in
this study are presented as follows:
3.4.1 Financial Tools
Financial tool is used to analysis financial strength and weakness of bank for these
purpose financial tools like ratio analysis has been used. A ratio simply one number
expressed in term of another and such it expresses in term of percentage proportion
and as coefficient. It is a way of comparing and investigating the relationship
between different pieces of financial information.
Ratio Analysis
Ratio is the mathematical relationship between two accounting figures. According
Kathari 1984 “Ratio analysis is a part of the whole process of analysis of financial
statement of any business or industrial concern especially to take output and credit
decisions.” Therefore, ratio analysis is comparing a firm’s financial performance
and status to that other firm’s or to itself of different time. Qualitative judgment of a
firm can be done with the help of ratio analysis.
There are many ratios to compare of firm’s financial performance and status but
have only those ratios have been covered which are related to investment operation
of the bank, this study contains following ratios.
3.4.1.1 Liquidity Ratio
Liquidity ratios are used to judge the ability of banks to meet its short term
liabilities that are likely to mature in the short period. It is measurement of speed
with which a bank’s assets can be converted into cash to meet deposit withdrawal
and other current obligations the assets that can be converted into cash quickly
without having to reduce the asset’s price very much is liquid asset. “The liquidity
31
ratio measure the ability of a firm to meet its short term obligation and reflect the
short term financial strength/solving of firm.” (Khan and Jain, 2000, 4:3)
Liquidity ratios are used to assets the ability of a bank to meet its short term
obligation. These ratios make comparison between short term resource and short
term obligation banks must maintain adequate liquidity ratio should neighbor be
neither inadequate nor high. If the liquidity ratio of the bank is not enough, it will
result in bad credit ratios less creditors, confidence, eventually may lead to the
bankruptcy. If the company has high degree of liquidity funds, it wills unnecessary
tied up in current assets. Thus the bank should be maintaining proper balance
between inadequate liquidity and unnecessary liquidity for the survival and for
avoiding the risk of insolvency. For the study purpose, the following probability
ratios have been calculated:
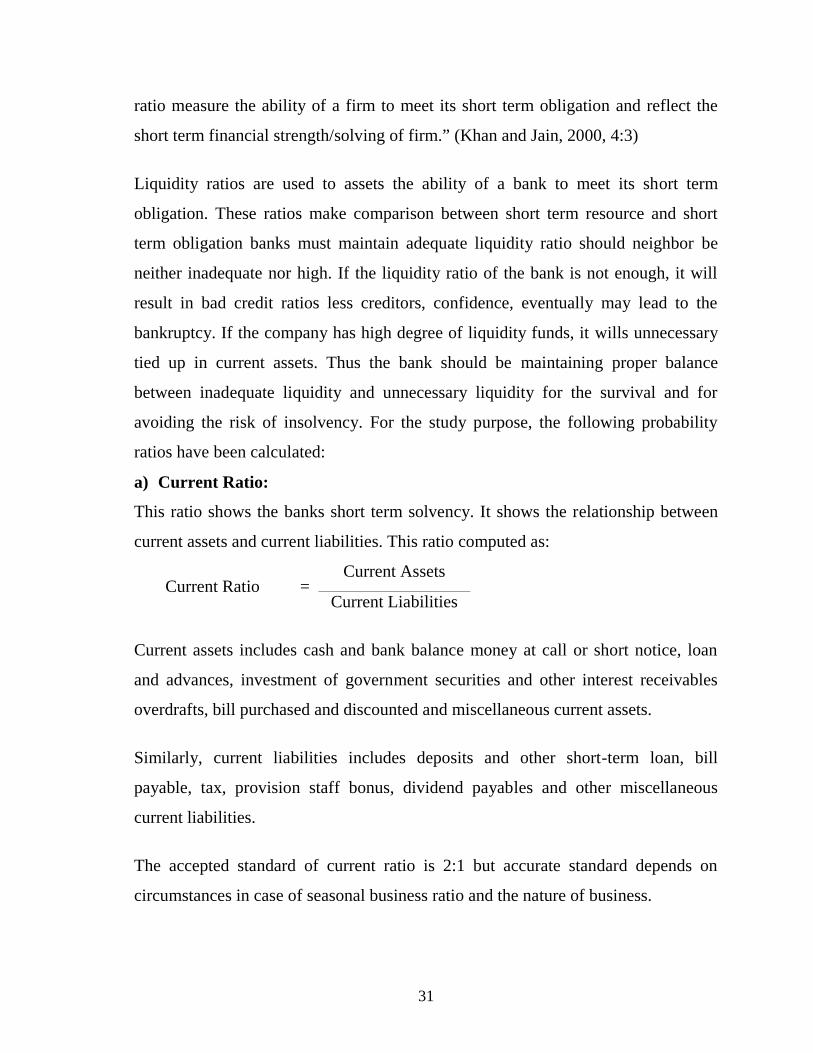
a) Current Ratio:
This ratio shows the banks short term solvency. It shows the relationship between
current assets and current liabilities. This ratio computed as:
Current Ratio =Current Assets
Current Liabilities
Current assets includes cash and bank balance money at call or short notice, loan
and advances, investment of government securities and other interest receivables
overdrafts, bill purchased and discounted and miscellaneous current assets.
Similarly, current liabilities includes deposits and other short-term loan, bill
payable, tax, provision staff bonus, dividend payables and other miscellaneous
current liabilities.
The accepted standard of current ratio is 2:1 but accurate standard depends on
circumstances in case of seasonal business ratio and the nature of business.
32
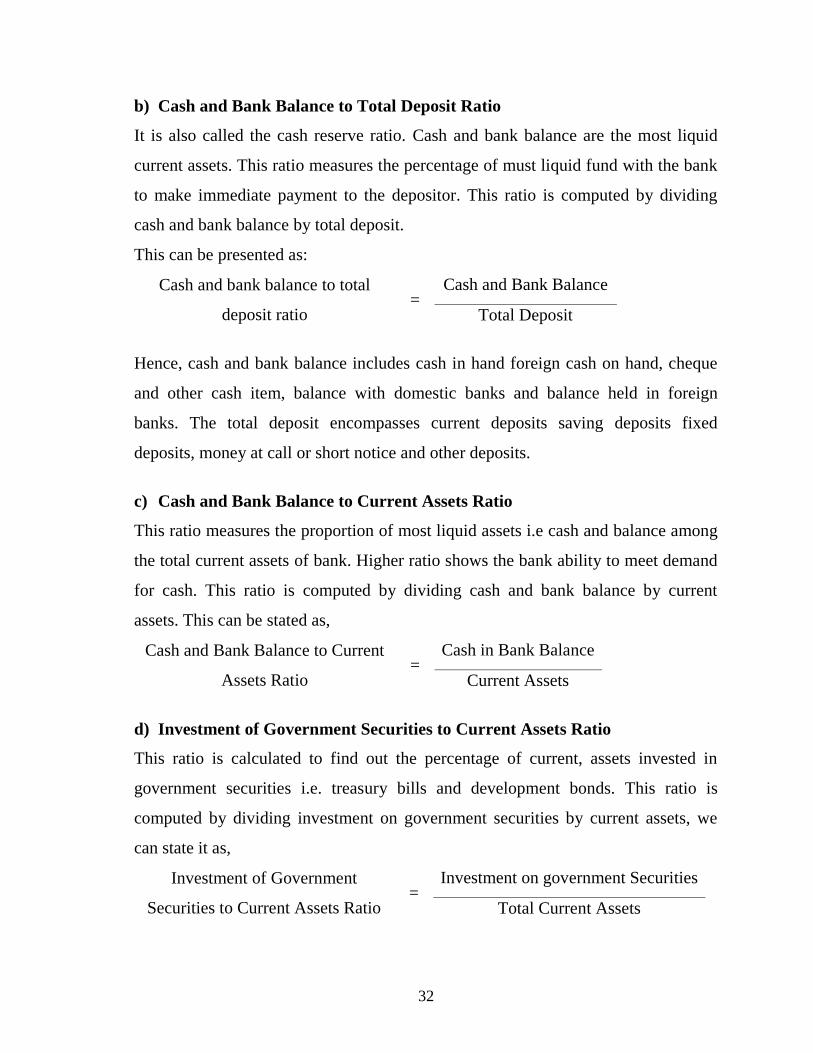
b) Cash and Bank Balance to Total Deposit Ratio
It is also called the cash reserve ratio. Cash and bank balance are the most liquid
current assets. This ratio measures the percentage of must liquid fund with the bank
to make immediate payment to the depositor. This ratio is computed by dividing
cash and bank balance by total deposit.
This can be presented as:
Cash and bank balance to total
deposit ratio=
Cash and Bank Balance
Total Deposit
Hence, cash and bank balance includes cash in hand foreign cash on hand, cheque
and other cash item, balance with domestic banks and balance held in foreign
banks. The total deposit encompasses current deposits saving deposits fixed
deposits, money at call or short notice and other deposits.
c) Cash and Bank Balance to Current Assets Ratio
This ratio measures the proportion of most liquid assets i.e cash and balance among
the total current assets of bank. Higher ratio shows the bank ability to meet demand
for cash. This ratio is computed by dividing cash and bank balance by current
assets. This can be stated as,
Cash and Bank Balance to Current
Assets Ratio=
Cash in Bank Balance
Current Assets
d) Investment of Government Securities to Current Assets Ratio
This ratio is calculated to find out the percentage of current, assets invested in
government securities i.e. treasury bills and development bonds. This ratio is
computed by dividing investment on government securities by current assets, we
can state it as,
Investment of Government
Securities to Current Assets Ratio=
Investment on government Securities
Total Current Assets
33
Here, investment on government securities includes treasury bills and development
bonds etc.
3.4.1.2 Assets Management Ratio
Assets Management ratio measures how efficiently the bank manager the resources
as its command. “Activity ratios are employed to evaluate the efficiency with the
firm manages and utilizes its assets.” (I.M. Pandey, 1991:125)
This ratio measures the efficiency of the bank to manage its assets in profitable and
satisfactory manner. A commercial banks must be able to manage to its assets
properly to earn high profit to profit to satisfy its customer and for its own
existence.
Through the following ratios the efficiency of the banks to manage its assets in
profitable and satisfactory manner will be examined.
a) Loan and Advances to Total Deposit Ratio
This ratio is calculated to find out how successfully the banks are utilizing their
total deposits on loans and advances for profit generating propose. Higher ratio
implies the better utilization of total deposits. This can be obtained by dividing loan
and advances by total deposits, which can be stated as,
Loan and Advances to Total
Deposit Ratio=
Loan and Advance
Total Deposits
b) Total Investment to Total Deposit Ratio
Investment is one of the major credits created to earn income. This implies the
utilization of firm’s deposit on investment in government securities and shares
debentures of other companies and bank High ratio indicates that bank’s success in
utilization of deposits and vice-versa. This ratio can be obtained by dividing total
investment by total deposit. This can be mentioned as,

34
Total Investment to Total Deposit
Ratio=
Total investment
Total Deposit
The numerator consists of investment on government securities, investment on
debenture and bonds shares in other companies and other investment.
c) Loan and Advances to Total Working Fund Ratio
Loan and advances is the major component in the total working fund (Total Assets,
which indicates the ability of commercial bank are successful in mobilizing their
loan and advances on working fund ratio for the purpose of income generation
commercial banks should be alert in mobilizing total working fund. High ratio
indicates the better mobilization of fund as loan and advances and vice-versa. This
ratio is calculated by using the following formula:
Loan and Advance to Total
Working Fund Ratio=
Loan & Advances
Total Working Fund
Here, the denominator includes all assets as of on balance sheet items. In other
words this includes current assets, net fixed assets loans for development banks and
other miscellaneous assets but excludes off balance sheet items like letter of credit
letter of guarantee etc.
d) Investment on Shares and debenture to Total Working Fund Ratio
This ratio shows the bank’s investment in shares and debenture of subsidiary and
other companies. Now a days, commercial banks are interested to invest its fund not
only in loan and advances but also to government securities, bonds and shares and
debenture issued by different types of companies as well. The ratio of investment on
shares and debentures to total working fund reveal that weather the banks are
successful or not in mobilizing their total assets on shares and debentures of other
companies to generate income. A high ratio indicates more portion of working fund
in invested in the shares and debenture and vice-versa. This ratio can be divided by
35
dividing investment on shares and debenture by total working fund, which can be
mentioned as,
Investment on Shares and Debenture
to Total Working Fund Ratio=
Investment on Share and Debentures
Total Working Fund
The numerator includes investment on debentures bonds and shares of other
companies.
e) Loan Loss Ratio
This ratio shows the possibility of loan default of a bank. It indicates how
efficiently if manages its loan advances and makes effort for loan recovery. Higher
ratio implies higher portion of non-performing loan portfolio. Dividing loan loss
provision from total loan and advances derives this ratio. This can be stated as:
Loan Loss Ratio =Total Loss provision
Total Loan and Advances
Here the numerator indicates the amount of provision for possible loss.
f) Non-Performing Assets( NPA)
A loan not recovered within the given time from in the form of interest servicing or
principal repayment is called non-performing loan (NPL) for any organization is
like a developing concern for a human body, which will collapse the whole
organization, when the NPL begins in two digits then the problems begins to start.
So the management always should be aware to lower it in the single figure, this
NPL can be calculated as below:
NPL to total Loan and Advances =Non-Performing Loan
Total Loan and Advances
3.4.2 Profitability Ratio
“Profitability ratio is a group of ratio that shows the combined effects of liquidity,
assets management and dept on operating results.” (Brigham and Houston)
36
Profit is the differences between revenue and expenses over a period of time. Every
commercial bank has the ultimate objective to earn profit. So every activity is
concern towards the profit. No bank or financial institution can service without
profit. So profit is the indicator of efficient operation of bank. The banks acquire the
profit by providing different types of services to the customers or by making
investment in different sectors. So sufficient profit is must to have good liquidity,
grab investment opportunity, expand banking transactions, finance government in
need of development fund, meet fixed internal obligation for a bank and over come
the future contingencies. So profitability ratio measures the efficiency of bank.
The profitability ratio are designed to provide the answer to questions such as:-
1. Is the profit earned by the firm adequate ?
2. What rate of return does it represent ?
3. What is the rate of profit for various division and segments of the firm ?
4. What is the earning per share ?
5. What amount was paid in dividend ?
6. What is the rate of return to equity holders ?
Profitability of a business concern may be measured in two ways: profitability in
relation to sales and profitability in relation to investment. The profitability ratios
are popularly known as return on investment. In this section some profitability
ratios have been calculated which are as follows:
(a) Return on Total Assets Ratio
This ratio established the relationship between net profit and total assets. The
objective of computing this ratio is to fund out how efficiently the total assets have
been used by the management.
Higher the ratio indicates the higher efficiency in the utilization of total assets and
vice-versa. Lower ratio implies that low utilization of bank assets and over use of
higher interest bearing amount of debt and vice-versa. In this study, return on total

37
assets is examined to measures the profitability of all the financial resources in bank
assets and calculated by applying the following-
Return on Total Assets Ratio =NPAT
Total Assets
Where,
NPAT = Net Profit after tax
NPAT represents the total profit earned after deducting tax and total assets represent
all type of assets owned by the firm.
(b) Return on Capital Employed Ratio
A relation between net profit and capital employed is known as return on capital
employed ratios. It shows whether the amount of capital employed has been
properly used or not. The objective of computing this ratio is fund out how
efficiently the long term funds supplied by the creditors and share holders have
been used. This ratios shows the efficiency of the firm on the utilizations of total
capital. A higher ratio is an indication of the better utilization of capital employed
and vice-versa. Hence, higher ratio is preferable. It can be calculate by using
following formula-
Return on Capital Employed Ratio =NPAT + Interest
Total Capital Employed
Where,
NPAT = Net profit after tax,
Capital employed: It refers to long term fund supplied by the long-term creditors
and share holders.
Return: It means net profit after tax plus interest expenses.
38
Capital employed: share capital + Resource and fund + Debenture & Bonds +
Borrowing
(c) Return on Total Deposit Ratio
This ratio measures the degree on NPAT carried by using total deposits. Net profit
to total deposit ratio measures the return on deposits. Generally, higher ratio
signifies better utilization of deposits and vice-versa. It is calculated by using
following formula-
Return on Total Deposit Ratio =NPAT
Total Deposit
Where,
NPAT = Net Profit after tax
Total deposits means those total amount deposited in various accounts i.e. current,
saving, fixed and other deposit.
(d) Return on Equity (ROE)
Equity capital of any bank is its owned capital. The prime objective of any bank is
wealth maximization or in other words to earn high profit and thereby, maximizing
return on its equity capital.
ROE is the measuring role of the profitability of bank. It reflects the extent to which
the bank has been successful to mobilize or utilize its equity capital. A high ratio
indicates higher success to mobilize its owned capital (equity) and vice-versa. This
ratio is calculated by dividing net profit by total equity capital including paid by
equity capital. P/L A/C, various reserves, general loan less provision etc. it is
calculated by using following formula-
Return on Equity =NPAT
Equity
39
3.4.3 Statistical Tools
One of the most important tasks before bankers, business man and economist these
days is to make, estimate for the future. Statistical analysis is based on the statistical
data, which are called observed or recorded at successive interval of time. It is used
to know about the past data and with the help of it we can know about the future
one. In this chapter some major and important statistical tools which are related
funds mobilizing policy of commercial like coefficient of correlation between
different variable common trend analysis of deposit utilization and its projection as
well as statistical to achieve the objectives of this study are used and analyzed and
studied which are present as follows:
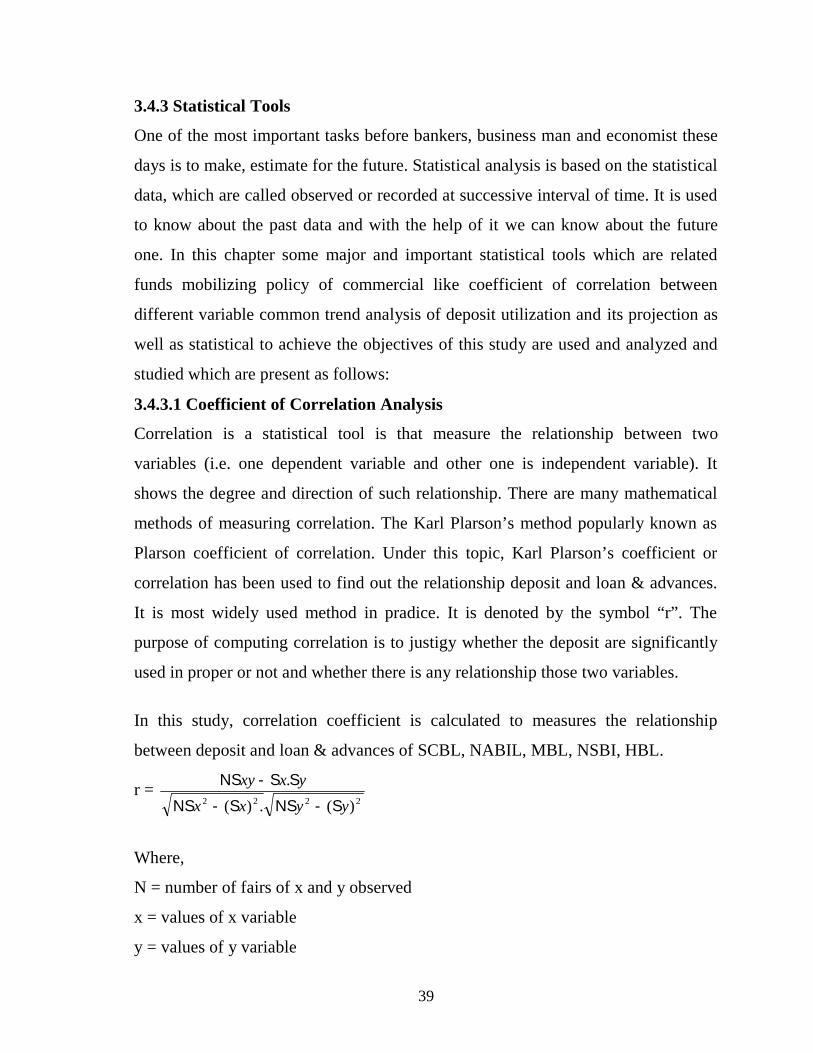
3.4.3.1 Coefficient of Correlation Analysis
Correlation is a statistical tool is that measure the relationship between two
variables (i.e. one dependent variable and other one is independent variable). It
shows the degree and direction of such relationship. There are many mathematical
methods of measuring correlation. The Karl Plarson’s method popularly known as
Plarson coefficient of correlation. Under this topic, Karl Plarson’s coefficient or
correlation has been used to find out the relationship deposit and loan & advances.
It is most widely used method in pradice. It is denoted by the symbol “r”. The
purpose of computing correlation is to justigy whether the deposit are significantly
used in proper or not and whether there is any relationship those two variables.
In this study, correlation coefficient is calculated to measures the relationship
between deposit and loan & advances of SCBL, NABIL, MBL, NSBI, HBL.
r =2222 )(.)(
.
yyxx
yxxy
Where,
N = number of fairs of x and y observed
x = values of x variable
y = values of y variable

40
xy = Sum of product of variable x and y
r = Karl Plarsons coefficient of correlation
The value of coefficient of correlation as obtained by the above formula are always
lying between -1 to +1
* When r = +1 there is perfect positive correlation
* When r = -1 there is perfect negative correlation
* When r = 0 there is perfect no correlation
* When r lies between 0.7 to 0.999 (or -0.7 to 0.999) there is a high degree of
positive (or negative) correlation.
* Where r lies between 0.5 to 0.699, there is a moderate degree of correlation.
* When r is less than 0.5 there is low degree of correlation.
However, in practice such value of r as +1, -1 and 0 rare:
3.4.3.2 Test of Significance (Probable error)
The probable error of the coefficient of correlation helps in interpreting its value. It
helps to determine the reliability of the value of the coefficient that is obtained as
follows:
Per = 0.6745N
r 21
Where,
r = coefficient of correlation
N = number of pair of observation
PE = probable error
1. if the value of r is less than the probable error than three is no evidence of
correction i.e. the value is not significant
2. if the value of r is more than six times the probable error the coefficient of
correlation is practically certain i.e. the value of r is significant.
3. coefficient of correlation is expected to be within the range of Per
41
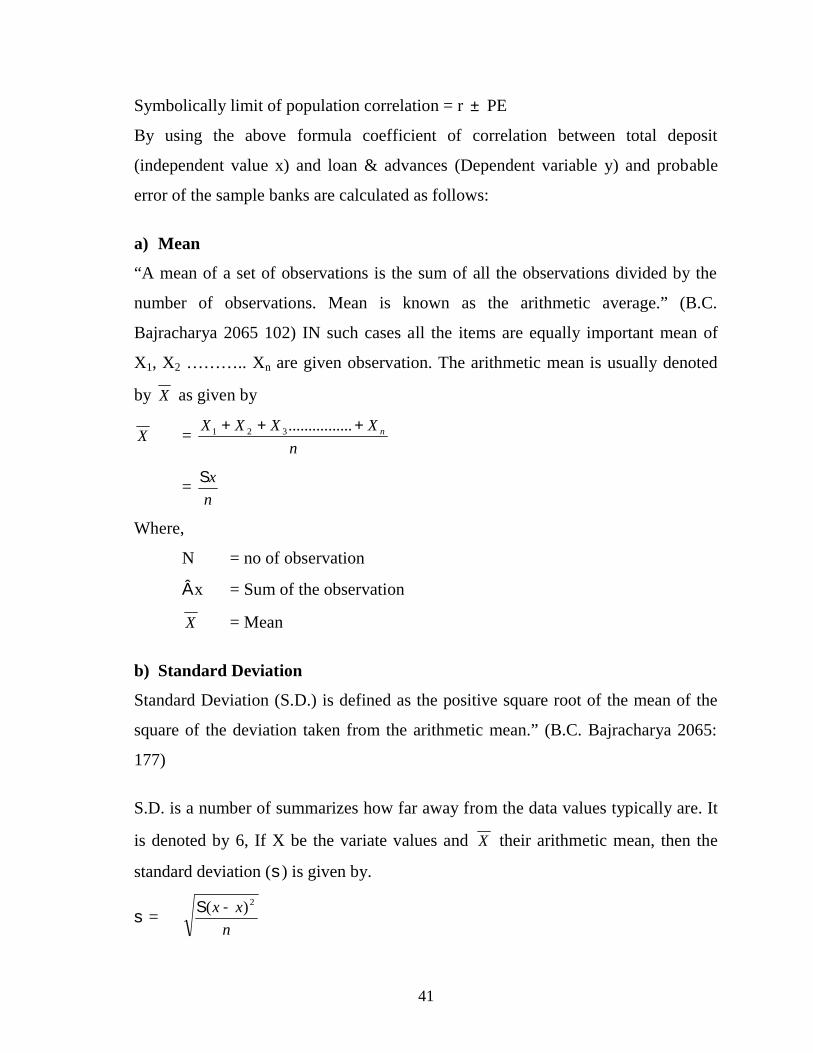
Symbolically limit of population correlation = r PE
By using the above formula coefficient of correlation between total deposit
(independent value x) and loan & advances (Dependent variable y) and probable
error of the sample banks are calculated as follows:
a) Mean
“A mean of a set of observations is the sum of all the observations divided by the
number of observations. Mean is known as the arithmetic average.” (B.C.
Bajracharya 2065 102) IN such cases all the items are equally important mean of
X1, X2 ……….. Xn are given observation. The arithmetic mean is usually denoted
by X as given by
X =n
XXXX n ................321
=n
x
Where,
N = no of observation
x = Sum of the observation
X = Mean
b) Standard Deviation
Standard Deviation (S.D.) is defined as the positive square root of the mean of the
square of the deviation taken from the arithmetic mean.” (B.C. Bajracharya 2065:
177)
S.D. is a number of summarizes how far away from the data values typically are. It
is denoted by 6, If X be the variate values and X their arithmetic mean, then the
standard deviation () is given by.
=n
xx 2)(

42
or
22
x
x
n
x
Where,
n – no of observation
c) Coefficient of Variation (C.V.)
The coefficient of variation is the standard deviation divided by the average and
summarizes the relative variability in the data as a percentage of the average for
comparing the variability of two distributions we compute the coefficient of
variation. A distribution with smaller C.V. is said to be more homogenous or
uniform or less variable than other and the series with greater C.V. is said to be
more homogenous or more variables than others. It is a relative measure which is
useful in comparing the amount of variation in data group with different means.
The formula for coefficient of variation
CV = 100.
X
DS
Where,
S.D. = Standard Deviation
x = Arithmetic Mean
It is independent of unit so two distributions can bitterly be compared with the help
of C.V. for their variability.
d) Measures of Correlation
Two variables are said to have ‘correlation’, when they are so related that the
change in the value of one variable is accompanied by the change in the value of the
other. (B.C. Bajracharya) Correlation refers to the degree of relationship, between
two variables. It measures the relationship (co-variation) between the variables.

43
There are several methods under correlation analysis. This study has used Karl
Pearson’s coefficient of correlation. It is simply denoted by ‘r’ the main purpose of
correlation analysis is to know the degree and direction of the relationship between
the variable. It two variable vary in the same direction i.e. if increase (or decrease)
in the value of other variable, then two variables are said to be have positive
correlation. If the value of ‘r’ is +1 there is perfect positive correlation, if the value
of ‘r’ is -1 there is perfect negative correlation and if the value of ‘r’ is o there is co-
variation (ie no relationship) between the variable. The actual practice, perfect
correlation is hardly found. In the present study, the correlation between deposit and
loan & advances has been examined by applying the following formula:
Coefficient of a correlation between deposit and loan & advances
rxy =2222 )()(
.
yyxx
yxxy
or
rxy =22 . xx
xy
Where r is between 0.7to 0.999 there is high degree of correlation between the
variable. If the value of r is less than 0.5 there is low degree of correlation and when
the value of r is more than 0.5 less than 0.7 is called moderate degree of correlation
between the variables.
44
CHAPTER FOUR
PRESENTATION AND ANALYSIS OF DATA
4.1 Introduction
This chapter is the main content of the study. The main objective of this study is to
examine the existing position of investment analysis of HBL, NSBI, SCBL,
NABIL, MBL on the basis of the analysis and diagnosis of the collected data. In
this chapter different type of analysis which is related with investment analysis,
such as financial analysis, statistical analysis and major finding of the study are
presented. So on balance sheet and profit and loss account from the year ended
2004 to 2008 of HBL, NSBI, SCBL, NABIL, MBL according to G.B Giles “Data
analysis is the relationship and differences supporting or conflicting with original or
new should be subjected to statistical test of to determine with what validity data
can serve to indicate any conclusion.”
4.2 Financial Analysis
Financial analysis means “A general term referring to the process of extracting and
studying information in a financial statement for the use in management decision
making financial analysis typically involves the use of ratios, comparison with prior
periods and with the budget and the other such procedures” (B.N., Anuja, p. 120)
The objective of this chapter is to study evaluate and analyze those major finance
performances which are mainly related to the investment management and fund
mobilization of NABIL, HBL, NSBI, SCBL, MBL. It is notable that all types of
financial ratios are not studies under this chapter. Only those ratios are calculated
and analyzed which are very important to evaluate find of a commercial banks.
45
4.2.1 Ratio Analysis
Ratio analysis in one of the most commonly used techniques and most powerful
tools of financial analysis. According to C.R. Kothar “Rati Analysis is a powerful
tool of financial analysis that through it the economic and financial portion of a
business unit can be fully x-rayed” (C.R. Kothari, P. 187)
An arithmetical relationship between two figures is known as ratio. It is calculate by
dividing one item with another ratio simply means one number expressed in term of
another ratio analysis is a technique and interpreting financial statement to evaluate
the financial performance of organization. It provides a to examine different
account parameters, which reflects the norms of business operation. Ratios are
calculated and compared with relevant firm’s diverge ratio or specific standards
such as past ratios of the same firm or not operating results are at satisfactory level.
The important ratios that are studied for this purpose are given below.
4.2.1.1 Liquidity Ratio
Liquidity ratios are used to judge the ability of bank of meet its short term abilities
that are likely to mature in the short-term period commercial banks maintain
satisfactory liquidity position to meet the credit need of the community. Demand for
the deposit with drawals pay maturity in time and convert non cash assets into cash
to satisfy immediate need without loss to loank and consequent impact or long run
profit.
Liquidity ratio is the comparison between the short-term obligation and short-term
resources available to meet these obligations. This ratio reflects the short-term
financial strengths and weakness of the bank. A bank must maintain adequate
liquidity. This ratio should neither be inadequate nor high. If the liquidity ratio of
the bank is not enough, it will results in bad credit ratings, less creditors confidence,
eventually may lead to the bankruptcy. If the bank has high degree of liquidity
funds. It will unnecessary tied up in current assets. Thus, the bank endeavor to
46
maintain proper balance between inadequate liquidity and unnecessary liquidity for
the survival and for avoiding the risk of insolvericy.
(i) Current Ratio
The current ratio indicates bank’s liquidity and short-term debt paying ability. It
shows the relationship between current assets and current liabilities. It is calculated
by dividing the current asset by current liabilities. Thus,
Current Ratio =Current Assets
Current Liabilities
Current assets are those asset, which can be converted into cash within short period
or time. Normally, not exceeding one-year. Cash and bank balance, money at call
and short notice, investment in government securities, sundry debtors, bills
receivable, loan advance and bill purchase, invent prepared expanses, accrued
income and miscellaneous are example of current assets.
Similarly, current liabilities are those obligation which are payable with a short
period, normally not more than one year. Current liabilities include bank overdrafts
deposit and other short-term loan, bills payable tax provision, staff bonus, proposed
dividend out standing expenses, pre-received income etc.
Generally the current assets of the company should be twice than current obligation
to be technically solvent. For many types of business 2:1 is considered to be an
adequate or ideal standard of current ratio. If the current ratio of the bank less than
2:1, the solvency position of the bank is not good. The cash not be available to pay
current liabilities. If the ratio is more than 2:1 that means company may have an
excessive investment in the current assets that do not produce return.
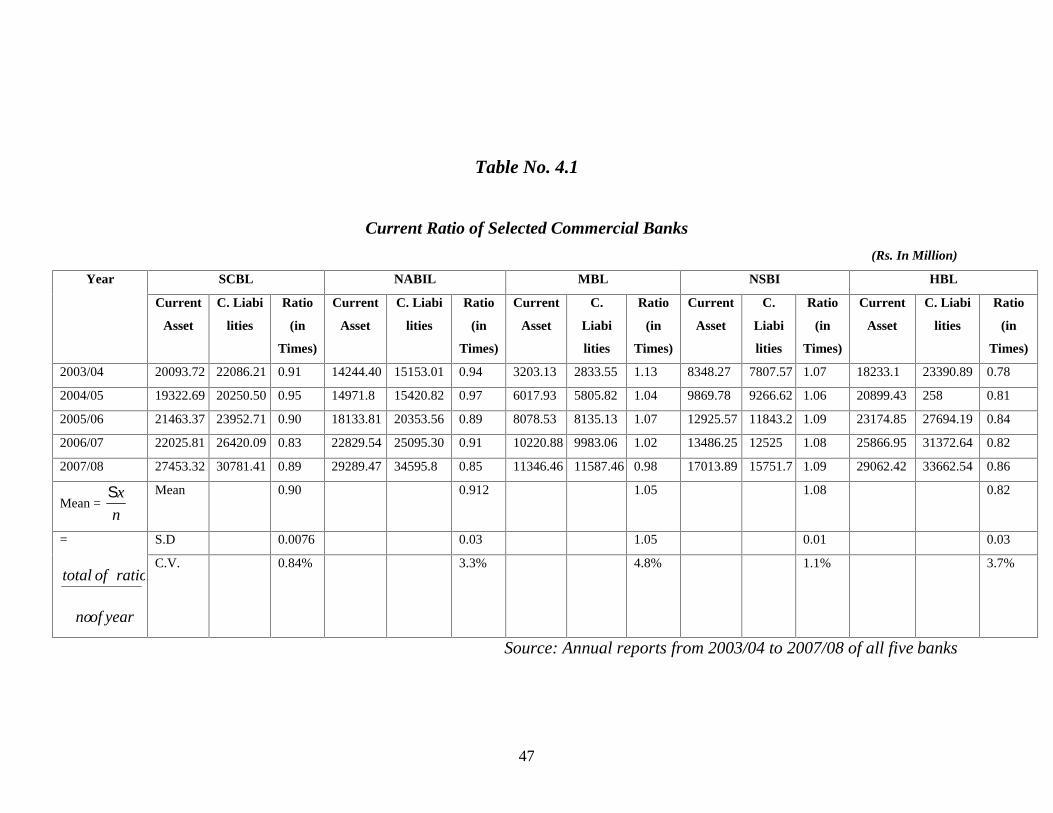
47
Table No. 4.1
Current Ratio of Selected Commercial Banks
(Rs. In Million)
Year SCBL NABIL MBL NSBI HBL
Current
Asset
C. Liabi
lities
Ratio
(in
Times)
Current
Asset
C. Liabi
lities
Ratio
(in
Times)
Current
Asset
C.
Liabi
lities
Ratio
(in
Times)
Current
Asset
C.
Liabi
lities
Ratio
(in
Times)
Current
Asset
C. Liabi
lities
Ratio
(in
Times)
2003/04 20093.72 22086.21 0.91 14244.40 15153.01 0.94 3203.13 2833.55 1.13 8348.27 7807.57 1.07 18233.1 23390.89 0.78
2004/05 19322.69 20250.50 0.95 14971.8 15420.82 0.97 6017.93 5805.82 1.04 9869.78 9266.62 1.06 20899.43 258 0.81
2005/06 21463.37 23952.71 0.90 18133.81 20353.56 0.89 8078.53 8135.13 1.07 12925.57 11843.2 1.09 23174.85 27694.19 0.84
2006/07 22025.81 26420.09 0.83 22829.54 25095.30 0.91 10220.88 9983.06 1.02 13486.25 12525 1.08 25866.95 31372.64 0.82
2007/08 27453.32 30781.41 0.89 29289.47 34595.8 0.85 11346.46 11587.46 0.98 17013.89 15751.7 1.09 29062.42 33662.54 0.86
Mean =n
x Mean 0.90 0.912 1.05 1.08 0.82
=
yearofno
ratiooftotal
S.D 0.0076 0.03 1.05 0.01 0.03
C.V. 0.84% 3.3% 4.8% 1.1% 3.7%
Source: Annual reports from 2003/04 to 2007/08 of all five banks
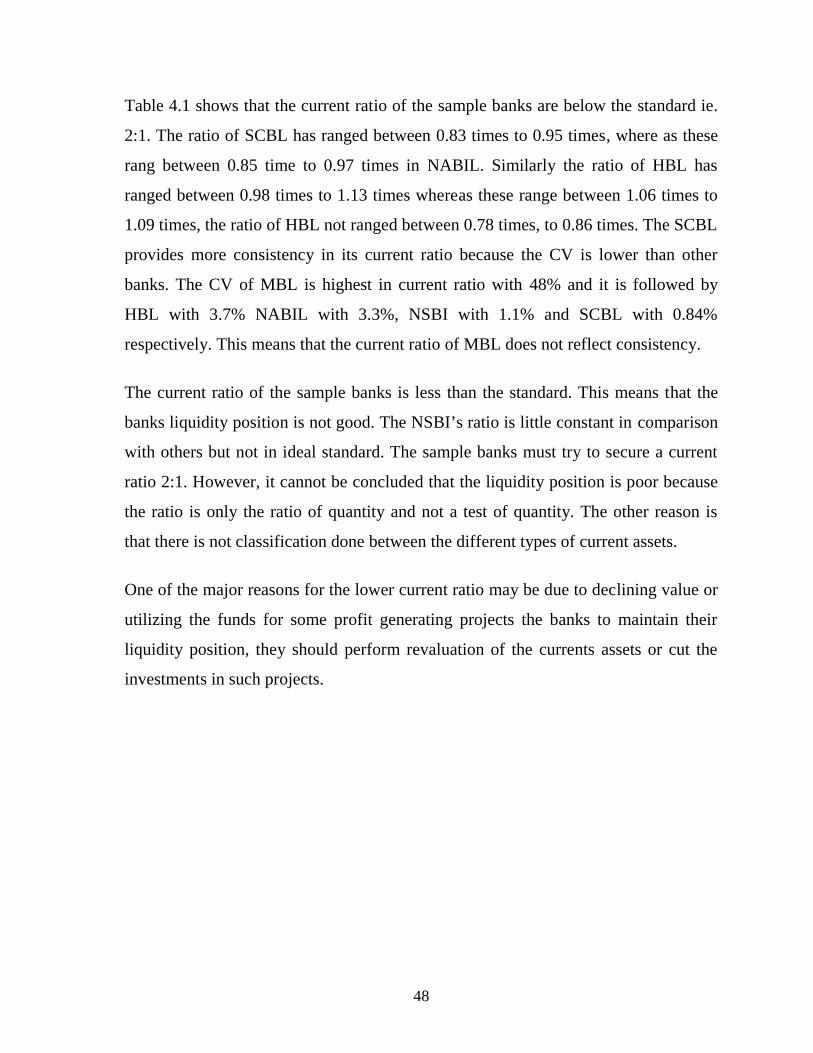
48
Table 4.1 shows that the current ratio of the sample banks are below the standard ie.
2:1. The ratio of SCBL has ranged between 0.83 times to 0.95 times, where as these
rang between 0.85 time to 0.97 times in NABIL. Similarly the ratio of HBL has
ranged between 0.98 times to 1.13 times whereas these range between 1.06 times to
1.09 times, the ratio of HBL not ranged between 0.78 times, to 0.86 times. The SCBL
provides more consistency in its current ratio because the CV is lower than other
banks. The CV of MBL is highest in current ratio with 48% and it is followed by
HBL with 3.7% NABIL with 3.3%, NSBI with 1.1% and SCBL with 0.84%
respectively. This means that the current ratio of MBL does not reflect consistency.
The current ratio of the sample banks is less than the standard. This means that the
banks liquidity position is not good. The NSBI’s ratio is little constant in comparison
with others but not in ideal standard. The sample banks must try to secure a current
ratio 2:1. However, it cannot be concluded that the liquidity position is poor because
the ratio is only the ratio of quantity and not a test of quantity. The other reason is
that there is not classification done between the different types of current assets.
One of the major reasons for the lower current ratio may be due to declining value or
utilizing the funds for some profit generating projects the banks to maintain their
liquidity position, they should perform revaluation of the currents assets or cut the
investments in such projects.
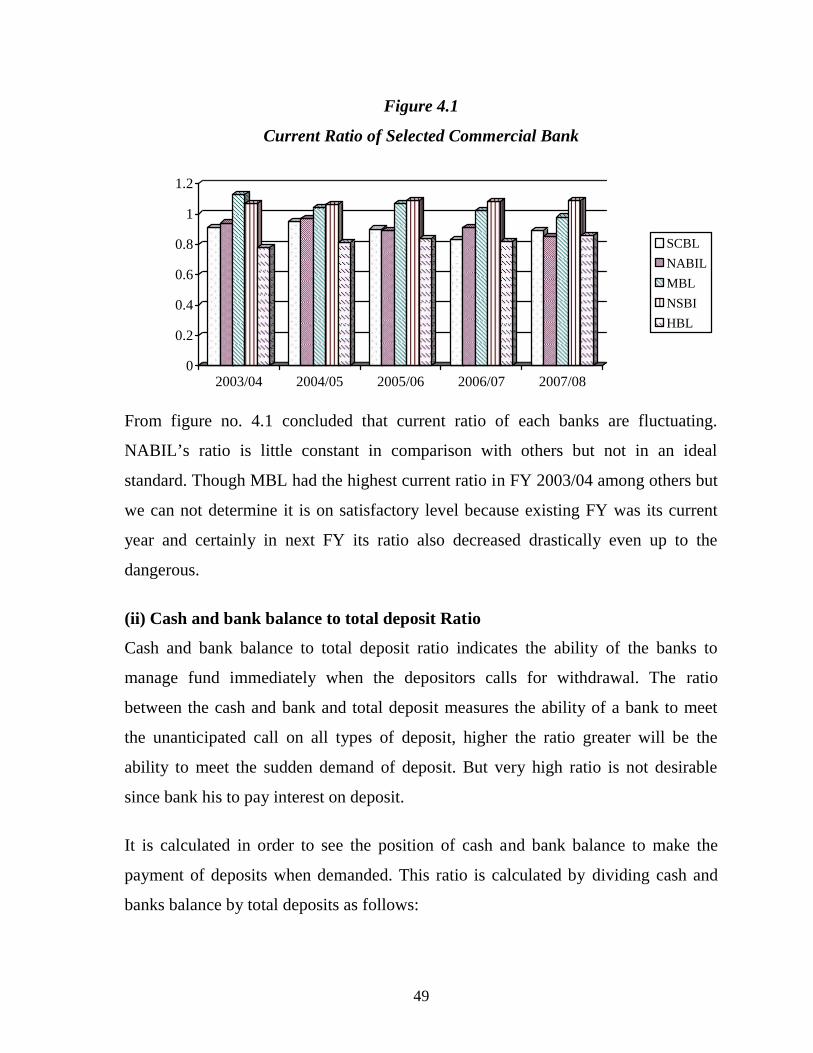
49
Figure 4.1
Current Ratio of Selected Commercial Bank
0
0.2
0.4
0.6
0.8
1
1.2
2003/04 2004/05 2005/06 2006/07 2007/08
SCBL
NABIL
MBL
NSBI
HBL
From figure no. 4.1 concluded that current ratio of each banks are fluctuating.
NABIL’s ratio is little constant in comparison with others but not in an ideal
standard. Though MBL had the highest current ratio in FY 2003/04 among others but
we can not determine it is on satisfactory level because existing FY was its current
year and certainly in next FY its ratio also decreased drastically even up to the
dangerous.
(ii) Cash and bank balance to total deposit Ratio
Cash and bank balance to total deposit ratio indicates the ability of the banks to
manage fund immediately when the depositors calls for withdrawal. The ratio
between the cash and bank and total deposit measures the ability of a bank to meet
the unanticipated call on all types of deposit, higher the ratio greater will be the
ability to meet the sudden demand of deposit. But very high ratio is not desirable
since bank his to pay interest on deposit.
It is calculated in order to see the position of cash and bank balance to make the
payment of deposits when demanded. This ratio is calculated by dividing cash and
banks balance by total deposits as follows:

50
Cash and bank balance to total deposit
ratio=
Cash & Bank Balances
Total deposits
Here, cash and bank balance include total cash in hand and total cash at banks. The
total deposit encompasses current saving fixed call, margin deposit and other
deposits. A high ratio indicates the greatest ability to meet their deposits and vice-
versa. Moreover, too high ratio is unfit as capital will be tied up and opportunity cost
will be higher.

51
Table No. 4.2
Cash & Bank Balance to Total Deposit Ratio of Selected Commercial Bank
(Rs. In Million)
Year SCBL NABIL MBL NSBI HBL
Cash &
Bank
Balance
Total
Deposit
Ratio
(in %)
Cash &
Bank
Balance
Total
Deposit
Ratio
(in %)
Cash &
Bank
Balance
Total
Deposit
Ratio
(in %)
Cash &
Bank
Balance
Total
Deposit
Ratio
(in %)
Cash &
Bank
Balance
Total
Deposit
Ratio
(in %)
2003/04 2023.16 21161.44 9.56 970.49 14199.03 6.87 410.75 2754.63 14.91 864.43 7198.33 12.01 2001.18 22010.33 9.09
2004/05 1111.12 19335.09 5.75 559.38 14586.61 3.83 431.13 5586.8 13.09 723.75 8654.77 8.36 2014.48 24814.01 8.12
2005/06 1276.24 23061.03 5.53 630.24 19347.40 3.26 813.92 7893.3 10.31 1118.16 11002.04 10.16 1717.35 23490.85 7.31
2006/07 2021.02 24647.02 8.2 1399.83 23342.29 6.0 1284.08 9475.45 13.55 1122.69 11445.29 9.81 1757.34 30048.40 5.85
2007/08 2050.24 29743.1 6.9 2071.14 1915.05 8.37 1588.57 1102.24 14.31 1342.96 13715.39 9.79 1448.14 31842.79 4.55
Mean 7.19 5.67 13.23 10.03 6.98
S.D 1.52 4.25 12.64 1.17 3.61
C.V. 21.14 74.95 95.54 11.67 51.72
Source: Annual reports from 2003/04 to 2007/08 of all five banks
52
The above table no. 4.2 show that the cash and bank balance to total deposit ratio.
The ratio of SCBL range between 5.53% to 9.56% and the ratio range of NABIL is
between 3.26% to 8.37% similarly, the ratio range of MBL is between 10.31% to
14.91% and ratio range of NSBI is between 8.36% to 12.01% whereas these range
between 4.55% to 9.09% in HBL. The cash and bank balance to total deposit of
SCBL is decreasing trend from 2003/04 to 2005/06 and then after increasing and
decreasing trend. The ratio pattern of NABIL is decreasing from 203/04 to 2005/06
and increasing trend of last two year. In the same way the trend of MBL is decreasing
with the exception of last 2 years. The ratio pattern of NSBI is decreasing trend from
2003/04 to 2004/05 and then after increase from 2004/05 to 2005/06 and sidling
decreasing in last 2 years. The trend of HBL is decreasing trend from 2003/04 to
2007/08.
The average ratio of HBL has highest mean for cash serve ratio will 13.23% and it is
followed by NSBI will 10.03 and SCBL with 7.19% and HBL with 6.98% and
NABIL with 5.67% respectively. But the CV of MBL is highest cash reserve ratio
with 95.54 and it is followed by NABIL will 74.95%, HBL with 51.72%, SCBL with
21.14% and NSBI with 11.67% respectively. It means the trend of cash and bank
balance to total deposit of MBL is not consistence whereas NSBI reflect more
consistent then other banks. Thus, the bank should maintain an appropriative ratio.
However there is no standard ratio in this aspect. It depends upon the banks
experience and other various factors.
The above ratio shows that NABIL, HBL and SCBL had similar trend of cash reserve
ratio. Through they have less amount of CRR than others but able to manage cash
liquidity their trends analysis and from them NSBI has high consistency. However,
the ratio of MBL is higher but not consistence in cash reserve ratio shows a weak
ability to cover its short term deposits in inferior than other. Too high liquidity is not
good to banks it can’t gain expected profit is it keeps money idle. As very low ratio
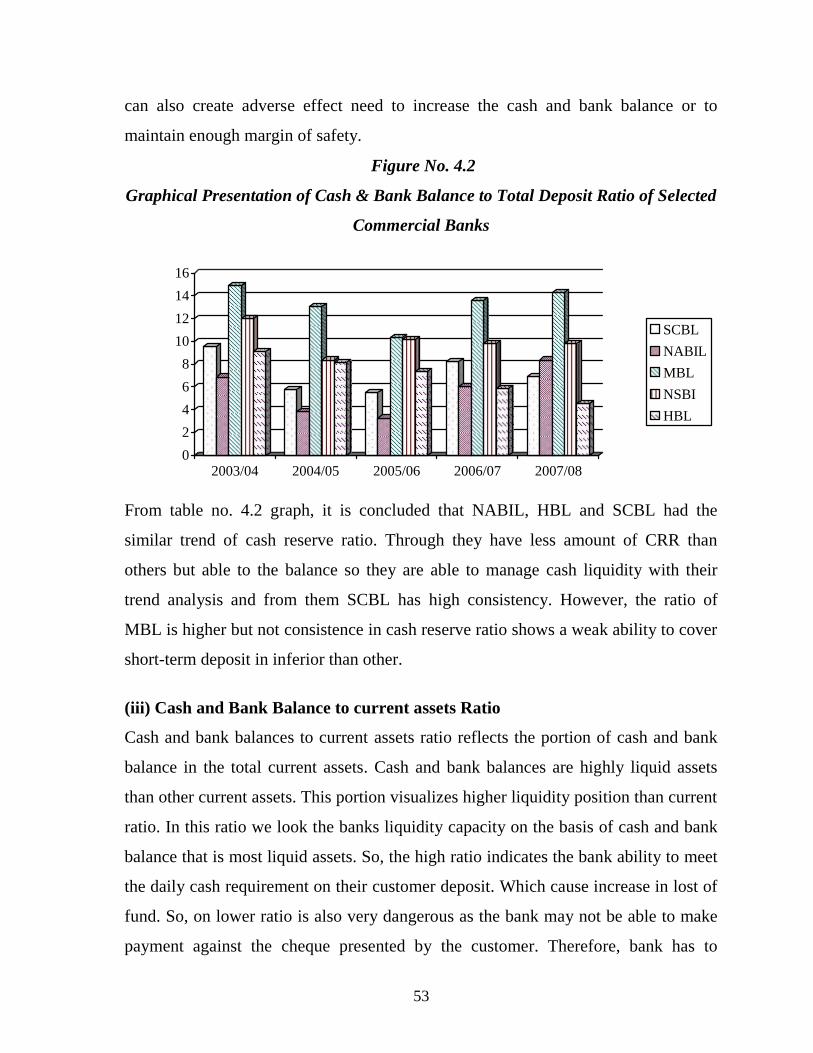
53
can also create adverse effect need to increase the cash and bank balance or to
maintain enough margin of safety.
Figure No. 4.2
Graphical Presentation of Cash & Bank Balance to Total Deposit Ratio of Selected
Commercial Banks
0
2
4
6
8
10
12
14
16
2003/04 2004/05 2005/06 2006/07 2007/08
SCBL
NABIL
MBL
NSBI
HBL
From table no. 4.2 graph, it is concluded that NABIL, HBL and SCBL had the
similar trend of cash reserve ratio. Through they have less amount of CRR than
others but able to the balance so they are able to manage cash liquidity with their
trend analysis and from them SCBL has high consistency. However, the ratio of
MBL is higher but not consistence in cash reserve ratio shows a weak ability to cover
short-term deposit in inferior than other.
(iii) Cash and Bank Balance to current assets Ratio
Cash and bank balances to current assets ratio reflects the portion of cash and bank
balance in the total current assets. Cash and bank balances are highly liquid assets
than other current assets. This portion visualizes higher liquidity position than current
ratio. In this ratio we look the banks liquidity capacity on the basis of cash and bank
balance that is most liquid assets. So, the high ratio indicates the bank ability to meet
the daily cash requirement on their customer deposit. Which cause increase in lost of
fund. So, on lower ratio is also very dangerous as the bank may not be able to make
payment against the cheque presented by the customer. Therefore, bank has to

54
balance cash and bank balance to current assets ratio in such a manner that it should
have the adequate cash for the customers demand and less interest is required to be
paid against the cash deposit. In the present study, cash and bank balance represents
total of the local currency, foreign, currencies, cheques in hand and various banks
balances in local as well as foreign banks. This ratio is calculated by using the
following formula.
Cash and bank Balance to Current
Assets=
Cash and bank Balance
Total Current Assets
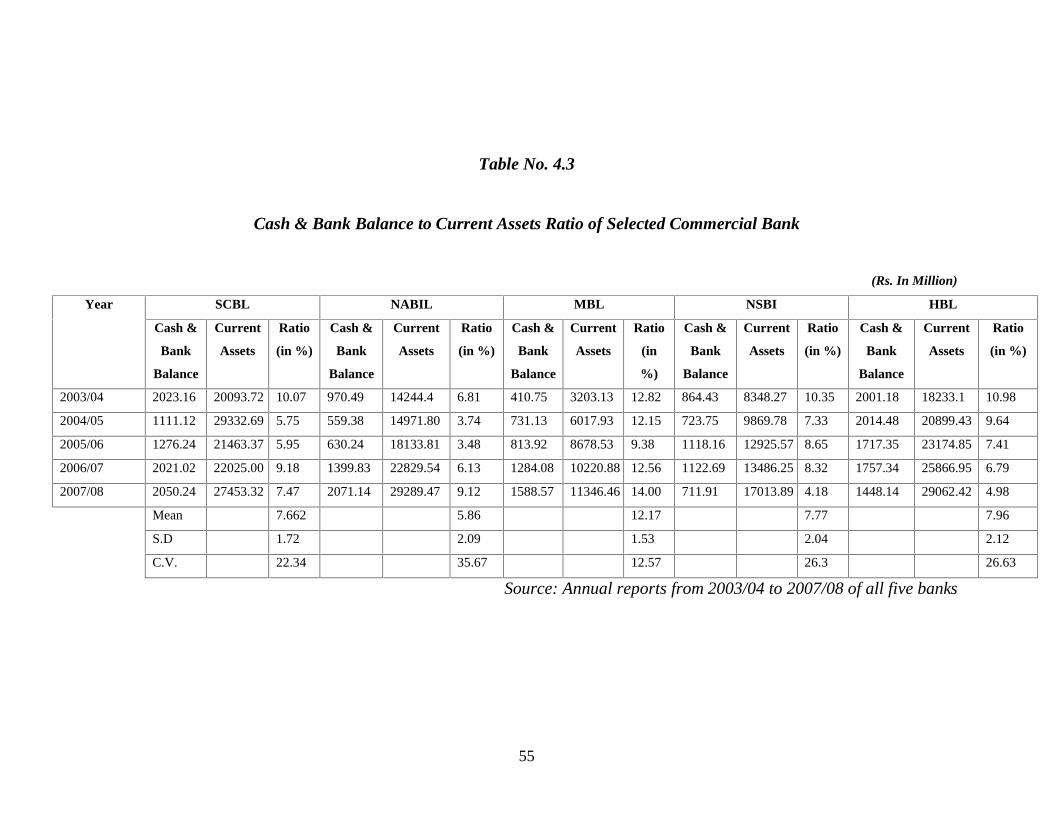
55
Table No. 4.3
Cash & Bank Balance to Current Assets Ratio of Selected Commercial Bank
(Rs. In Million)
Year SCBL NABIL MBL NSBI HBL
Cash &
Bank
Balance
Current
Assets
Ratio
(in %)
Cash &
Bank
Balance
Current
Assets
Ratio
(in %)
Cash &
Bank
Balance
Current
Assets
Ratio
(in
%)
Cash &
Bank
Balance
Current
Assets
Ratio
(in %)
Cash &
Bank
Balance
Current
Assets
Ratio
(in %)
2003/04 2023.16 20093.72 10.07 970.49 14244.4 6.81 410.75 3203.13 12.82 864.43 8348.27 10.35 2001.18 18233.1 10.98
2004/05 1111.12 29332.69 5.75 559.38 14971.80 3.74 731.13 6017.93 12.15 723.75 9869.78 7.33 2014.48 20899.43 9.64
2005/06 1276.24 21463.37 5.95 630.24 18133.81 3.48 813.92 8678.53 9.38 1118.16 12925.57 8.65 1717.35 23174.85 7.41
2006/07 2021.02 22025.00 9.18 1399.83 22829.54 6.13 1284.08 10220.88 12.56 1122.69 13486.25 8.32 1757.34 25866.95 6.79
2007/08 2050.24 27453.32 7.47 2071.14 29289.47 9.12 1588.57 11346.46 14.00 711.91 17013.89 4.18 1448.14 29062.42 4.98
Mean 7.662 5.86 12.17 7.77 7.96
S.D 1.72 2.09 1.53 2.04 2.12
C.V. 22.34 35.67 12.57 26.3 26.63
Source: Annual reports from 2003/04 to 2007/08 of all five banks
56
Table no. 4.3 reveal that the cash and bank balance to current assets ratio of five
sample banks have been very fluctuated. The ratio range of SCBL is between 5.75%
(2004/05) to 10.07% (2003/04). The cash and bank balance to current assets pattern
of SCBL has fluctuated. In the same way, the ratio in NABIL is between 3.48%
(203/04) to 9.12% (2007/08). The trend of NABIL has decreasing from 2003/04 to
2005/06 then after increasing last two years. Similarly, the ratio range of MBL is
between from 9.38% (2005/06) to 14% (2007/08) which is decreasing trend from
2003/04/ to 2005/06 then after increasing from 2006/07 to 2007/08. the ratio ranged
of NSBI is between 4.18% (2007/08) to 10.35% (2003/04). It has fluctuating ratios
for the year of study period. In cash of HBL, the highest ratio i.e. 10.98% (2003/04)
and lower ratio 4.98% (2007/08).
The average cash and bank balance of MBL is highest with 12.17% and it is followed
by HBL with 7.96%, NSBIL with 7.77%, SCBI will 7.68% and NABIL with 5.86%
respectively. This means that the liquidity position of MBL is highest than other four
banks. During the reviewed to period MBL has lowest coefficient of variation (C.V.)
with 12.57% and it is followed by SCBL 2.34%, NSBI with 26.3%, HBL with
26.65% and NABIL with 35.67% respectively. Therefore, NABIL has utilized its
fund more efficiently but not consistently where as MBL has utilized its fund more
consistently than other sample banks. Generally, properly balance of cash and bank
balance is better for banks. In this table one of the major reason for lower cash and
bank balance to current assets ratio in NABIL is the lower amount of cash in hand
and cash at bank. Therefore, NABIL have to increase cash and bank balances.
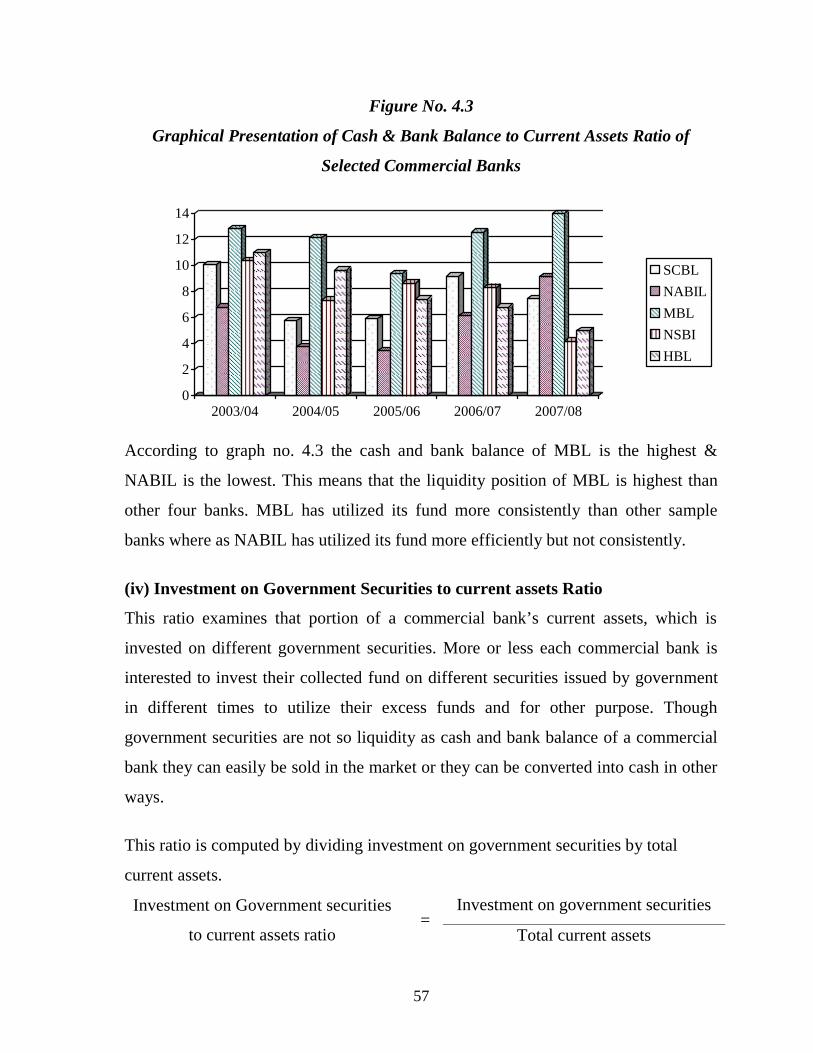
57
Figure No. 4.3
Graphical Presentation of Cash & Bank Balance to Current Assets Ratio of
Selected Commercial Banks
0
2
4
6
8
10
12
14
2003/04 2004/05 2005/06 2006/07 2007/08
SCBL
NABIL
MBL
NSBI
HBL
According to graph no. 4.3 the cash and bank balance of MBL is the highest &
NABIL is the lowest. This means that the liquidity position of MBL is highest than
other four banks. MBL has utilized its fund more consistently than other sample
banks where as NABIL has utilized its fund more efficiently but not consistently.
(iv) Investment on Government Securities to current assets Ratio
This ratio examines that portion of a commercial bank’s current assets, which is
invested on different government securities. More or less each commercial bank is
interested to invest their collected fund on different securities issued by government
in different times to utilize their excess funds and for other purpose. Though
government securities are not so liquidity as cash and bank balance of a commercial
bank they can easily be sold in the market or they can be converted into cash in other
ways.
This ratio is computed by dividing investment on government securities by total
current assets.
Investment on Government securities
to current assets ratio=
Investment on government securities
Total current assets
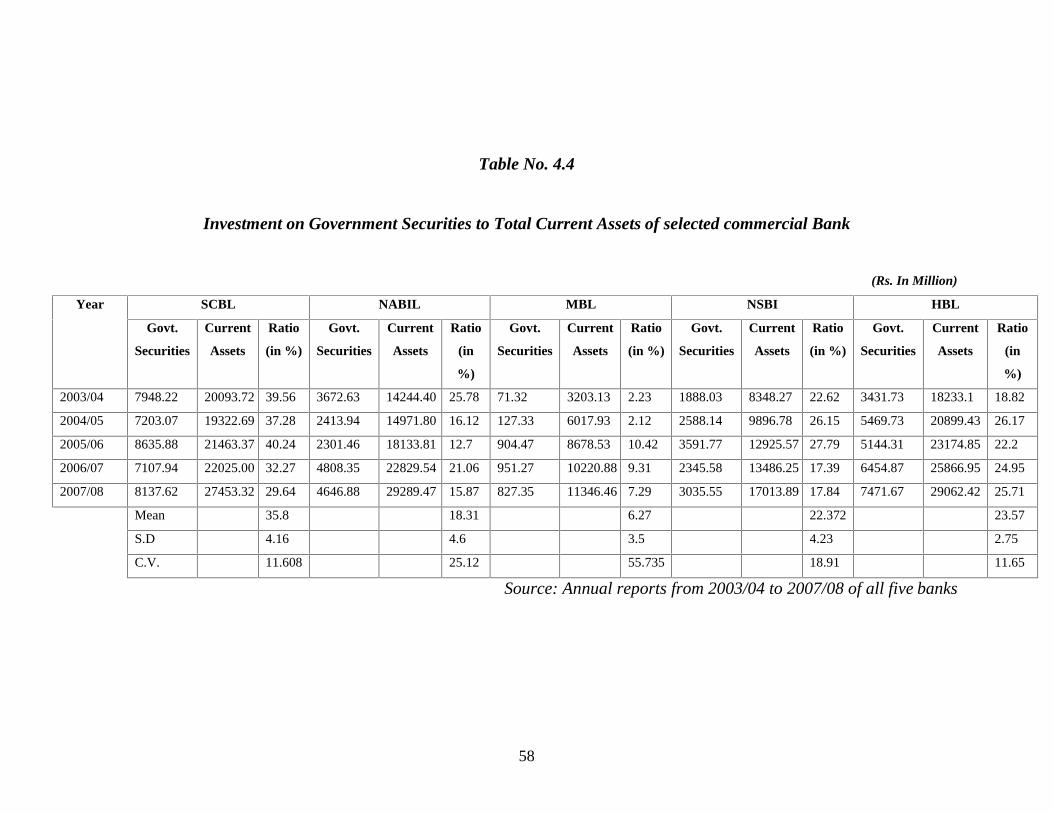
58
Table No. 4.4
Investment on Government Securities to Total Current Assets of selected commercial Bank
(Rs. In Million)
Year SCBL NABIL MBL NSBI HBL
Govt.
Securities
Current
Assets
Ratio
(in %)
Govt.
Securities
Current
Assets
Ratio
(in
%)
Govt.
Securities
Current
Assets
Ratio
(in %)
Govt.
Securities
Current
Assets
Ratio
(in %)
Govt.
Securities
Current
Assets
Ratio
(in
%)
2003/04 7948.22 20093.72 39.56 3672.63 14244.40 25.78 71.32 3203.13 2.23 1888.03 8348.27 22.62 3431.73 18233.1 18.82
2004/05 7203.07 19322.69 37.28 2413.94 14971.80 16.12 127.33 6017.93 2.12 2588.14 9896.78 26.15 5469.73 20899.43 26.17
2005/06 8635.88 21463.37 40.24 2301.46 18133.81 12.7 904.47 8678.53 10.42 3591.77 12925.57 27.79 5144.31 23174.85 22.2
2006/07 7107.94 22025.00 32.27 4808.35 22829.54 21.06 951.27 10220.88 9.31 2345.58 13486.25 17.39 6454.87 25866.95 24.95
2007/08 8137.62 27453.32 29.64 4646.88 29289.47 15.87 827.35 11346.46 7.29 3035.55 17013.89 17.84 7471.67 29062.42 25.71
Mean 35.8 18.31 6.27 22.372 23.57
S.D 4.16 4.6 3.5 4.23 2.75
C.V. 11.608 25.12 55.735 18.91 11.65
Source: Annual reports from 2003/04 to 2007/08 of all five banks
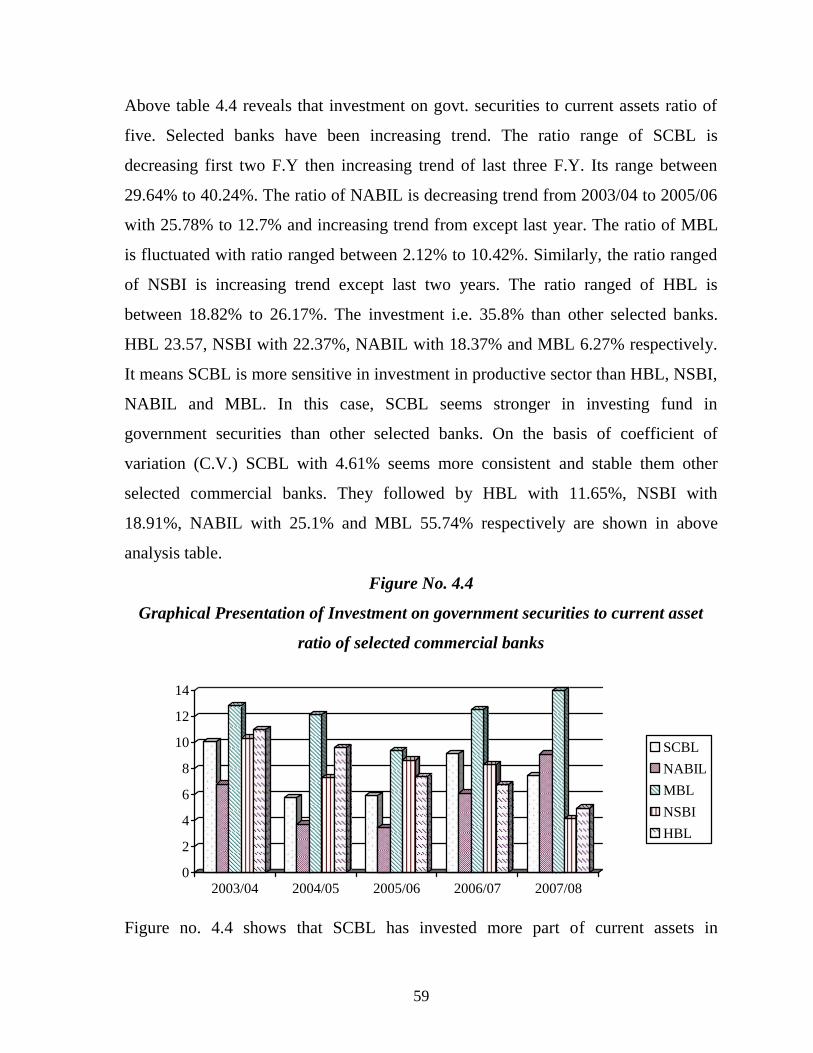
59
Above table 4.4 reveals that investment on govt. securities to current assets ratio of
five. Selected banks have been increasing trend. The ratio range of SCBL is
decreasing first two F.Y then increasing trend of last three F.Y. Its range between
29.64% to 40.24%. The ratio of NABIL is decreasing trend from 2003/04 to 2005/06
with 25.78% to 12.7% and increasing trend from except last year. The ratio of MBL
is fluctuated with ratio ranged between 2.12% to 10.42%. Similarly, the ratio ranged
of NSBI is increasing trend except last two years. The ratio ranged of HBL is
between 18.82% to 26.17%. The investment i.e. 35.8% than other selected banks.
HBL 23.57, NSBI with 22.37%, NABIL with 18.37% and MBL 6.27% respectively.
It means SCBL is more sensitive in investment in productive sector than HBL, NSBI,
NABIL and MBL. In this case, SCBL seems stronger in investing fund in
government securities than other selected banks. On the basis of coefficient of
variation (C.V.) SCBL with 4.61% seems more consistent and stable them other
selected commercial banks. They followed by HBL with 11.65%, NSBI with
18.91%, NABIL with 25.1% and MBL 55.74% respectively are shown in above
analysis table.
Figure No. 4.4
Graphical Presentation of Investment on government securities to current asset
ratio of selected commercial banks
0
2
4
6
8
10
12
14
2003/04 2004/05 2005/06 2006/07 2007/08
SCBL
NABIL
MBL
NSBI
HBL
Figure no. 4.4 shows that SCBL has invested more part of current assets in

60
government securities than other selected bank. Government securities to current
ratio of SCBL is 40.24% in FY 2007/08 which is the highest ratio of SCBL among
the five years of study period where as MBL has invested low part of current assets
in government securities than other selected bank its lowest ratio is 2.12% in FY
2004/05. In this case, SCBL seems stronger in investing fund in government
securities.
4.2.1.2 Assets Management Ratio
Assets management ratio measures the efficiency of the bank to manage its assets in
profitable and satisfactory manner. A commercial bank must manage its assets
properly to earn high profit.
Under the assets management ratio following ratios are calculated and finally the
results are interpreted below.
(i) Loan and Advances to total deposit Ratio
This ratio is found out in order to measure the extent to which the bank are able to
mobilize their total deposit on loan and advances.
Loan and advances to total deposit ratio =Loan and advances
Total Deposit
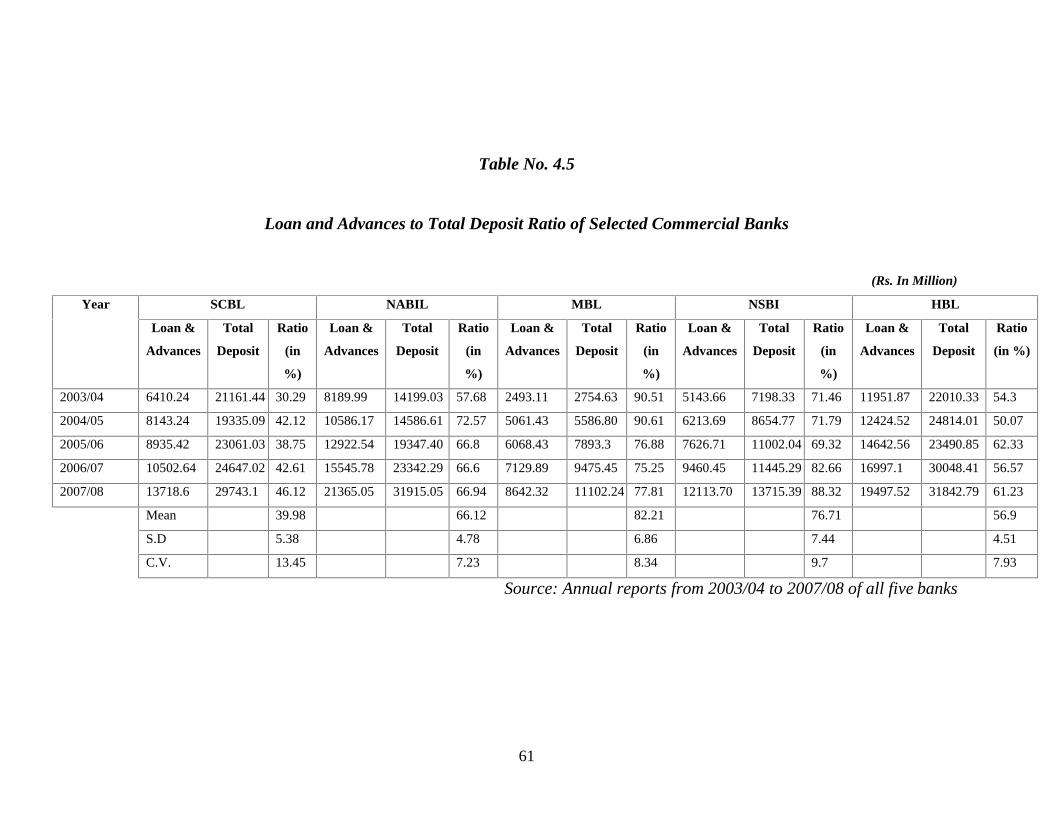
61
Table No. 4.5
Loan and Advances to Total Deposit Ratio of Selected Commercial Banks
(Rs. In Million)
Year SCBL NABIL MBL NSBI HBL
Loan &
Advances
Total
Deposit
Ratio
(in
%)
Loan &
Advances
Total
Deposit
Ratio
(in
%)
Loan &
Advances
Total
Deposit
Ratio
(in
%)
Loan &
Advances
Total
Deposit
Ratio
(in
%)
Loan &
Advances
Total
Deposit
Ratio
(in %)
2003/04 6410.24 21161.44 30.29 8189.99 14199.03 57.68 2493.11 2754.63 90.51 5143.66 7198.33 71.46 11951.87 22010.33 54.3
2004/05 8143.24 19335.09 42.12 10586.17 14586.61 72.57 5061.43 5586.80 90.61 6213.69 8654.77 71.79 12424.52 24814.01 50.07
2005/06 8935.42 23061.03 38.75 12922.54 19347.40 66.8 6068.43 7893.3 76.88 7626.71 11002.04 69.32 14642.56 23490.85 62.33
2006/07 10502.64 24647.02 42.61 15545.78 23342.29 66.6 7129.89 9475.45 75.25 9460.45 11445.29 82.66 16997.1 30048.41 56.57
2007/08 13718.6 29743.1 46.12 21365.05 31915.05 66.94 8642.32 11102.24 77.81 12113.70 13715.39 88.32 19497.52 31842.79 61.23
Mean 39.98 66.12 82.21 76.71 56.9
S.D 5.38 4.78 6.86 7.44 4.51
C.V. 13.45 7.23 8.34 9.7 7.93
Source: Annual reports from 2003/04 to 2007/08 of all five banks
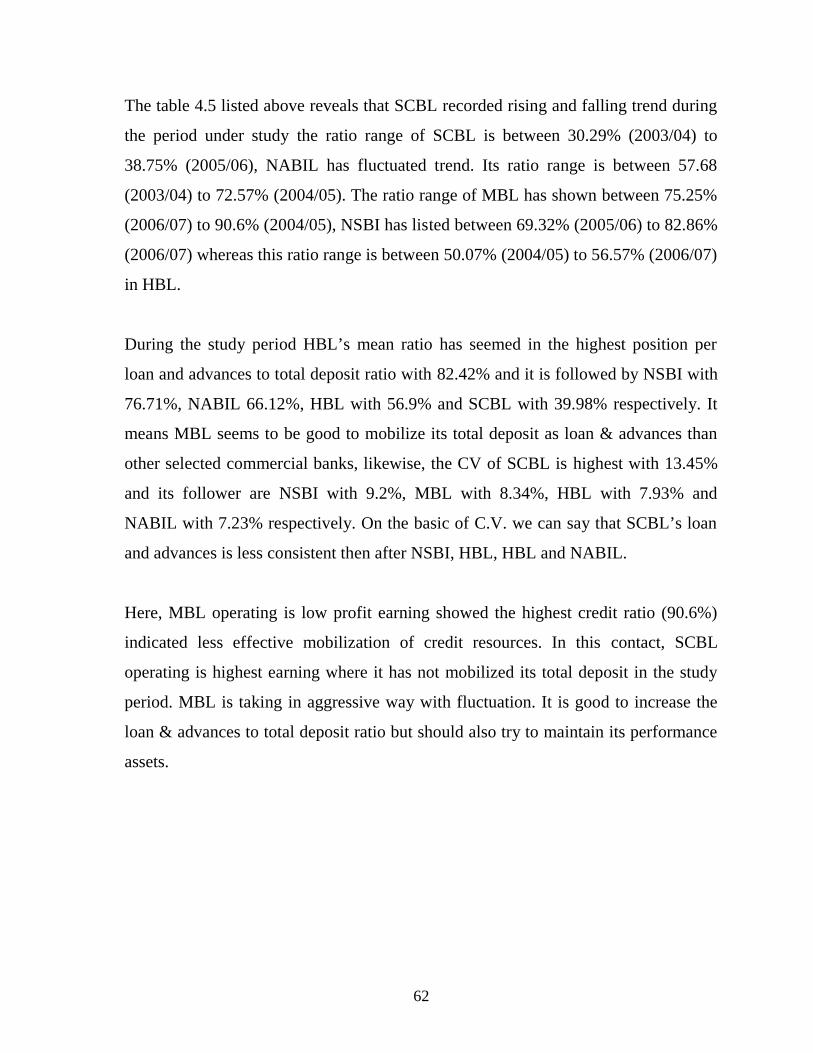
62
The table 4.5 listed above reveals that SCBL recorded rising and falling trend during
the period under study the ratio range of SCBL is between 30.29% (2003/04) to
38.75% (2005/06), NABIL has fluctuated trend. Its ratio range is between 57.68
(2003/04) to 72.57% (2004/05). The ratio range of MBL has shown between 75.25%
(2006/07) to 90.6% (2004/05), NSBI has listed between 69.32% (2005/06) to 82.86%
(2006/07) whereas this ratio range is between 50.07% (2004/05) to 56.57% (2006/07)
in HBL.
During the study period HBL’s mean ratio has seemed in the highest position per
loan and advances to total deposit ratio with 82.42% and it is followed by NSBI with
76.71%, NABIL 66.12%, HBL with 56.9% and SCBL with 39.98% respectively. It
means MBL seems to be good to mobilize its total deposit as loan & advances than
other selected commercial banks, likewise, the CV of SCBL is highest with 13.45%
and its follower are NSBI with 9.2%, MBL with 8.34%, HBL with 7.93% and
NABIL with 7.23% respectively. On the basic of C.V. we can say that SCBL’s loan
and advances is less consistent then after NSBI, HBL, HBL and NABIL.
Here, MBL operating is low profit earning showed the highest credit ratio (90.6%)
indicated less effective mobilization of credit resources. In this contact, SCBL
operating is highest earning where it has not mobilized its total deposit in the study
period. MBL is taking in aggressive way with fluctuation. It is good to increase the
loan & advances to total deposit ratio but should also try to maintain its performance
assets.
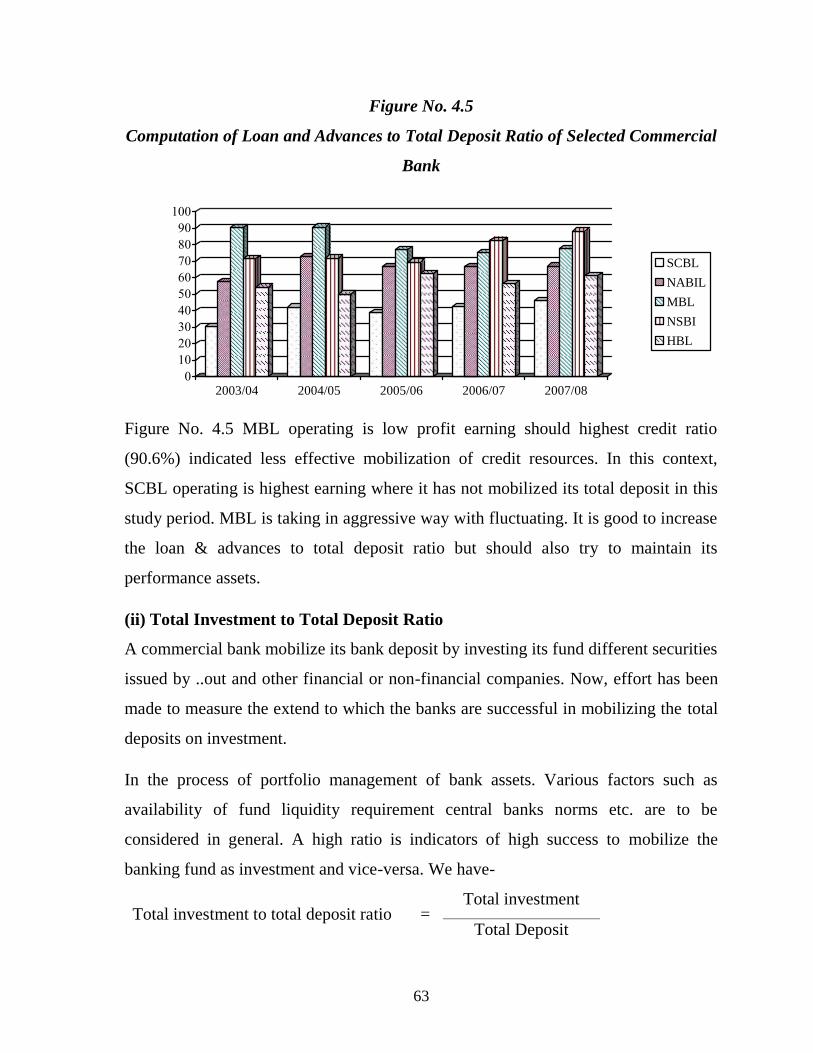
63
Figure No. 4.5
Computation of Loan and Advances to Total Deposit Ratio of Selected Commercial
Bank
0102030405060708090100
2003/04 2004/05 2005/06 2006/07 2007/08
SCBL
NABIL
MBL
NSBI
HBL
Figure No. 4.5 MBL operating is low profit earning should highest credit ratio
(90.6%) indicated less effective mobilization of credit resources. In this context,
SCBL operating is highest earning where it has not mobilized its total deposit in this
study period. MBL is taking in aggressive way with fluctuating. It is good to increase
the loan & advances to total deposit ratio but should also try to maintain its
performance assets.
(ii) Total Investment to Total Deposit Ratio
A commercial bank mobilize its bank deposit by investing its fund different securities
issued by ..out and other financial or non-financial companies. Now, effort has been
made to measure the extend to which the banks are successful in mobilizing the total
deposits on investment.
In the process of portfolio management of bank assets. Various factors such as
availability of fund liquidity requirement central banks norms etc. are to be
considered in general. A high ratio is indicators of high success to mobilize the
banking fund as investment and vice-versa. We have-
Total investment to total deposit ratio =Total investment
Total Deposit
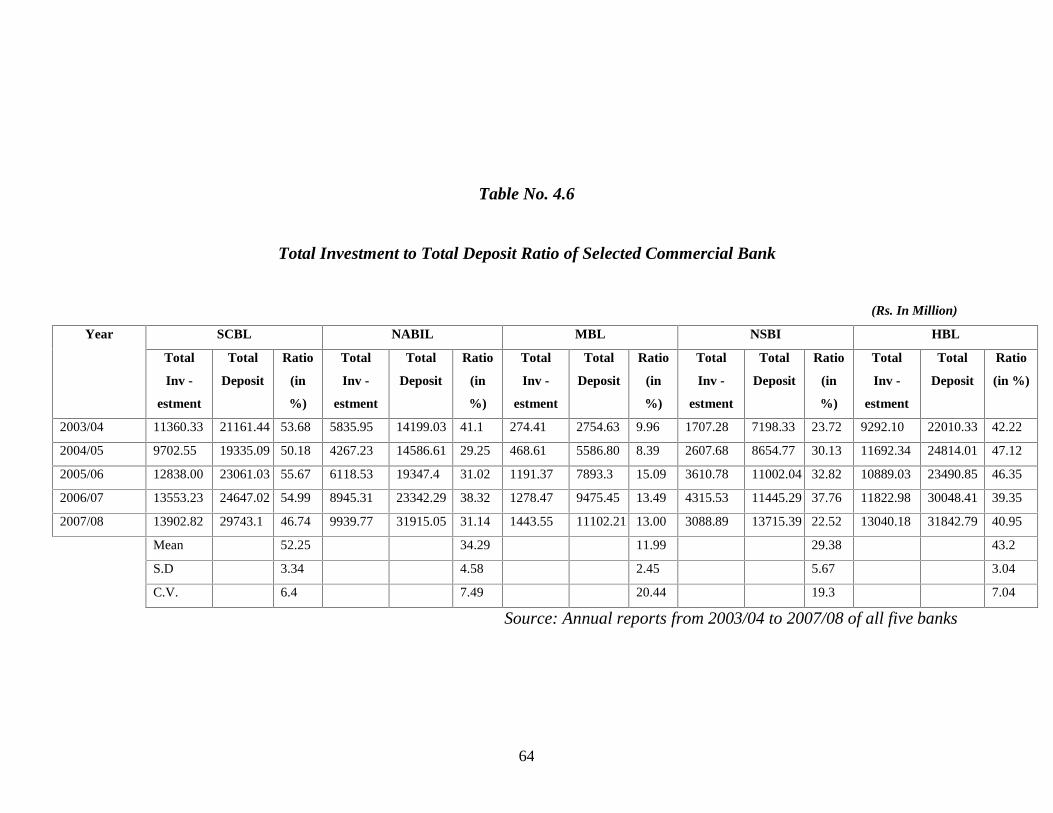
64
Table No. 4.6
Total Investment to Total Deposit Ratio of Selected Commercial Bank
(Rs. In Million)
Year SCBL NABIL MBL NSBI HBL
Total
Inv -
estment
Total
Deposit
Ratio
(in
%)
Total
Inv -
estment
Total
Deposit
Ratio
(in
%)
Total
Inv -
estment
Total
Deposit
Ratio
(in
%)
Total
Inv -
estment
Total
Deposit
Ratio
(in
%)
Total
Inv -
estment
Total
Deposit
Ratio
(in %)
2003/04 11360.33 21161.44 53.68 5835.95 14199.03 41.1 274.41 2754.63 9.96 1707.28 7198.33 23.72 9292.10 22010.33 42.22
2004/05 9702.55 19335.09 50.18 4267.23 14586.61 29.25 468.61 5586.80 8.39 2607.68 8654.77 30.13 11692.34 24814.01 47.12
2005/06 12838.00 23061.03 55.67 6118.53 19347.4 31.02 1191.37 7893.3 15.09 3610.78 11002.04 32.82 10889.03 23490.85 46.35
2006/07 13553.23 24647.02 54.99 8945.31 23342.29 38.32 1278.47 9475.45 13.49 4315.53 11445.29 37.76 11822.98 30048.41 39.35
2007/08 13902.82 29743.1 46.74 9939.77 31915.05 31.14 1443.55 11102.21 13.00 3088.89 13715.39 22.52 13040.18 31842.79 40.95
Mean 52.25 34.29 11.99 29.38 43.2
S.D 3.34 4.58 2.45 5.67 3.04
C.V. 6.4 7.49 20.44 19.3 7.04
Source: Annual reports from 2003/04 to 2007/08 of all five banks
65
Table no. 4.6 clearly evident total investment to total deposit ratio. Here, during the
FY 2003/04 SCBL had relatively the highest of 53.68% followed by HBL 42.22%,
NABIL 41.1%, NSBI 23.72% and MBL 9.96% respectively. It measures a high ratio
is invested by SCBL utilizing its outsiders fund or total deposits to generate profit. In
the context of the FY 2004/05 SCBL had the highest ratio of 50.18% followed by
HBL 47.12%, NSBI 30.13%, NABIL 29.25% respectively. In this FY SCBL still
had the highest in investment in govt. securities and treasury bills and it is followed
by HBL likewise, SCBL again had relatively highest ratio of 55.67% in the FY
2005/06 that is followed by HBL 46.35%, NSBI 32.82%, NABIL 31.62% and MBL
15.09%. IN again showed highest ratio of 54.99% followed by HBL 39.35%, NABIL
38.32%, NSBI 37.76% and 13.49 MBL during the FY 2006/07 SCBL respectively.
During the FY 2007/08 SCBL still had the highest consistency ratio in the reviewed
period indicate high success in utilization of funds, compare to the ratio we can
conclude that MBL bank is unable to investment in the non-risky securities or not
needed to invest either.
In the perspective of mean ratio during the reviewed period for total investment to
total deposit ratio, SCBL had the highest of 52.25% and its follower are HBL 43.2%,
NABIL 34.29%, NSBI 29.38% and MBL 11.99% respectively. During the reviewed
period MBL had the highest consistency ratio for total investment to total deposit
ratio i.e. coefficient of variation with 20.44% and it is followed by NSBI 19.3%,
NABIL 7.49%, HBL 7.04% and SCBL 6.4% respectively
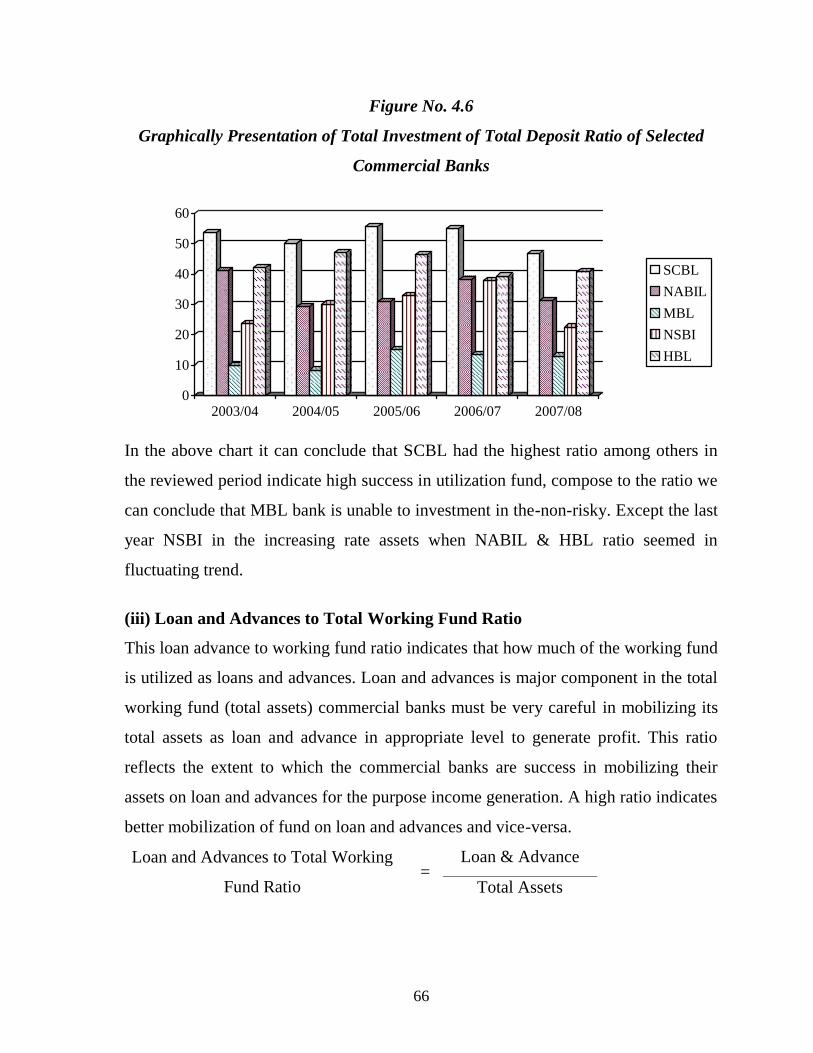
66
Figure No. 4.6
Graphically Presentation of Total Investment of Total Deposit Ratio of Selected
Commercial Banks
0
10
20
30
40
50
60
2003/04 2004/05 2005/06 2006/07 2007/08
SCBL
NABIL
MBL
NSBI
HBL
In the above chart it can conclude that SCBL had the highest ratio among others in
the reviewed period indicate high success in utilization fund, compose to the ratio we
can conclude that MBL bank is unable to investment in the-non-risky. Except the last
year NSBI in the increasing rate assets when NABIL & HBL ratio seemed in
fluctuating trend.
(iii) Loan and Advances to Total Working Fund Ratio
This loan advance to working fund ratio indicates that how much of the working fund
is utilized as loans and advances. Loan and advances is major component in the total
working fund (total assets) commercial banks must be very careful in mobilizing its
total assets as loan and advance in appropriate level to generate profit. This ratio
reflects the extent to which the commercial banks are success in mobilizing their
assets on loan and advances for the purpose income generation. A high ratio indicates
better mobilization of fund on loan and advances and vice-versa.
Loan and Advances to Total Working
Fund Ratio=
Loan & Advance
Total Assets
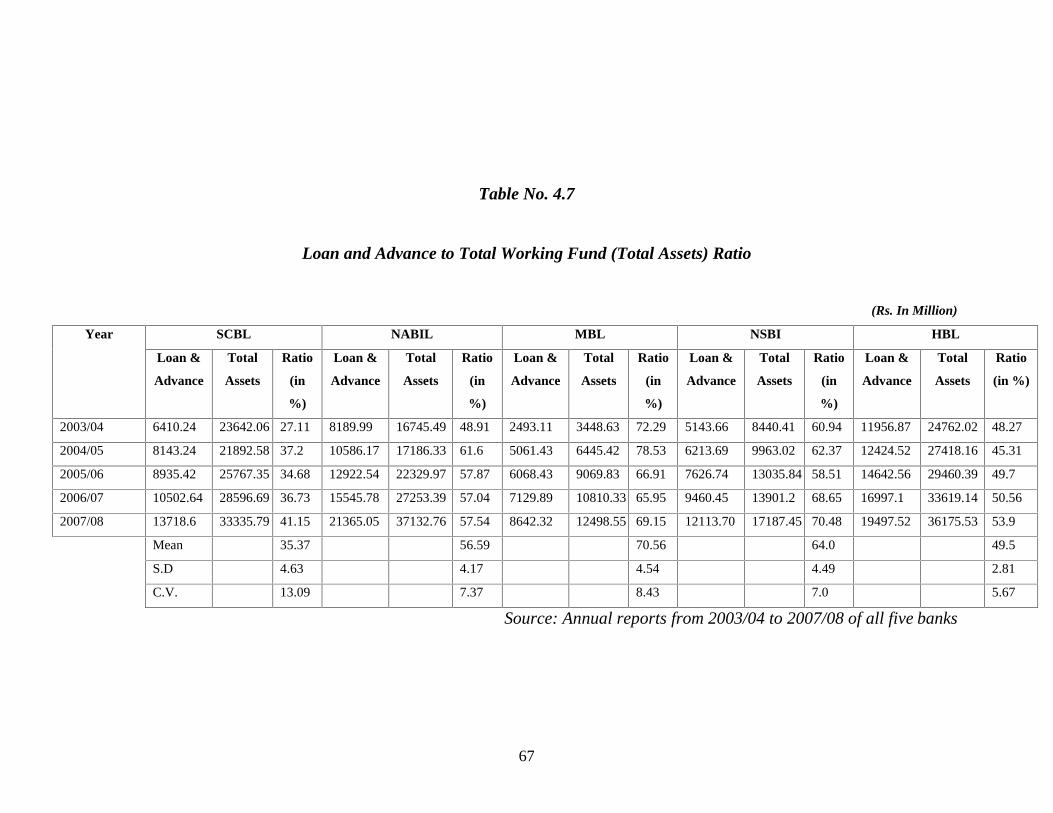
67
Table No. 4.7
Loan and Advance to Total Working Fund (Total Assets) Ratio
(Rs. In Million)
Year SCBL NABIL MBL NSBI HBL
Loan &
Advance
Total
Assets
Ratio
(in
%)
Loan &
Advance
Total
Assets
Ratio
(in
%)
Loan &
Advance
Total
Assets
Ratio
(in
%)
Loan &
Advance
Total
Assets
Ratio
(in
%)
Loan &
Advance
Total
Assets
Ratio
(in %)
2003/04 6410.24 23642.06 27.11 8189.99 16745.49 48.91 2493.11 3448.63 72.29 5143.66 8440.41 60.94 11956.87 24762.02 48.27
2004/05 8143.24 21892.58 37.2 10586.17 17186.33 61.6 5061.43 6445.42 78.53 6213.69 9963.02 62.37 12424.52 27418.16 45.31
2005/06 8935.42 25767.35 34.68 12922.54 22329.97 57.87 6068.43 9069.83 66.91 7626.74 13035.84 58.51 14642.56 29460.39 49.7
2006/07 10502.64 28596.69 36.73 15545.78 27253.39 57.04 7129.89 10810.33 65.95 9460.45 13901.2 68.65 16997.1 33619.14 50.56
2007/08 13718.6 33335.79 41.15 21365.05 37132.76 57.54 8642.32 12498.55 69.15 12113.70 17187.45 70.48 19497.52 36175.53 53.9
Mean 35.37 56.59 70.56 64.0 49.5
S.D 4.63 4.17 4.54 4.49 2.81
C.V. 13.09 7.37 8.43 7.0 5.67
Source: Annual reports from 2003/04 to 2007/08 of all five banks
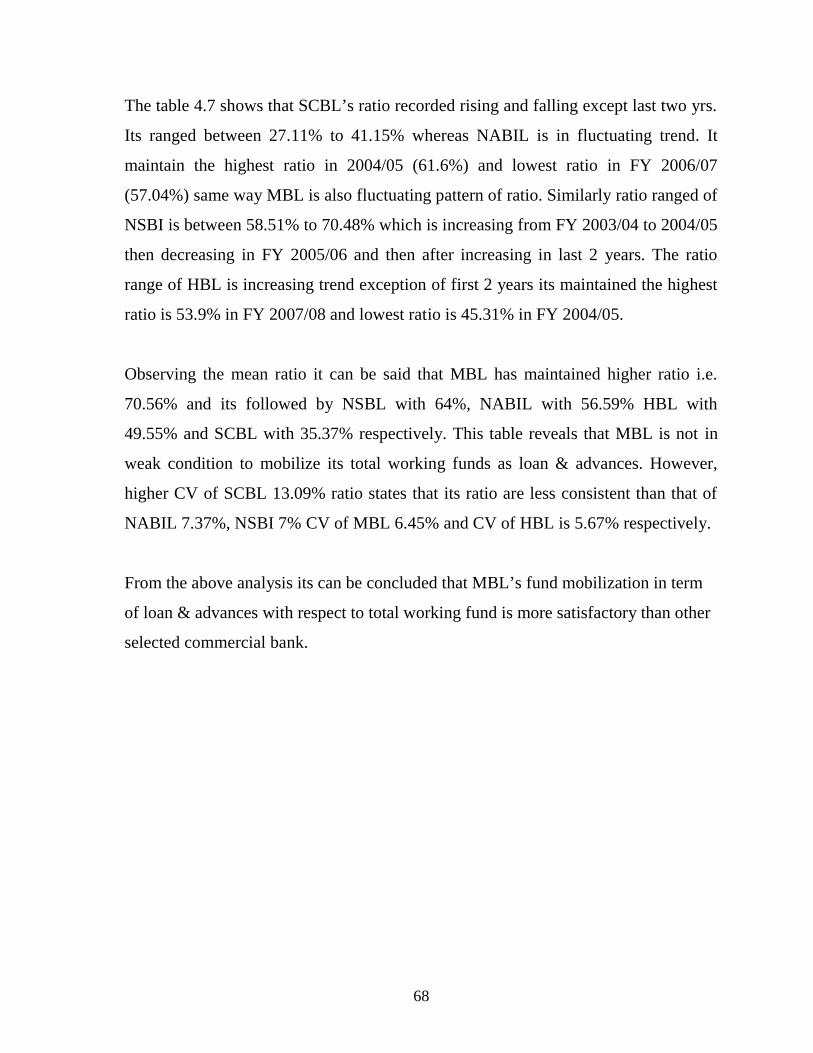
68
The table 4.7 shows that SCBL’s ratio recorded rising and falling except last two yrs.
Its ranged between 27.11% to 41.15% whereas NABIL is in fluctuating trend. It
maintain the highest ratio in 2004/05 (61.6%) and lowest ratio in FY 2006/07
(57.04%) same way MBL is also fluctuating pattern of ratio. Similarly ratio ranged of
NSBI is between 58.51% to 70.48% which is increasing from FY 2003/04 to 2004/05
then decreasing in FY 2005/06 and then after increasing in last 2 years. The ratio
range of HBL is increasing trend exception of first 2 years its maintained the highest
ratio is 53.9% in FY 2007/08 and lowest ratio is 45.31% in FY 2004/05.
Observing the mean ratio it can be said that MBL has maintained higher ratio i.e.
70.56% and its followed by NSBL with 64%, NABIL with 56.59% HBL with
49.55% and SCBL with 35.37% respectively. This table reveals that MBL is not in
weak condition to mobilize its total working funds as loan & advances. However,
higher CV of SCBL 13.09% ratio states that its ratio are less consistent than that of
NABIL 7.37%, NSBI 7% CV of MBL 6.45% and CV of HBL is 5.67% respectively.
From the above analysis its can be concluded that MBL’s fund mobilization in term
of loan & advances with respect to total working fund is more satisfactory than other
selected commercial bank.
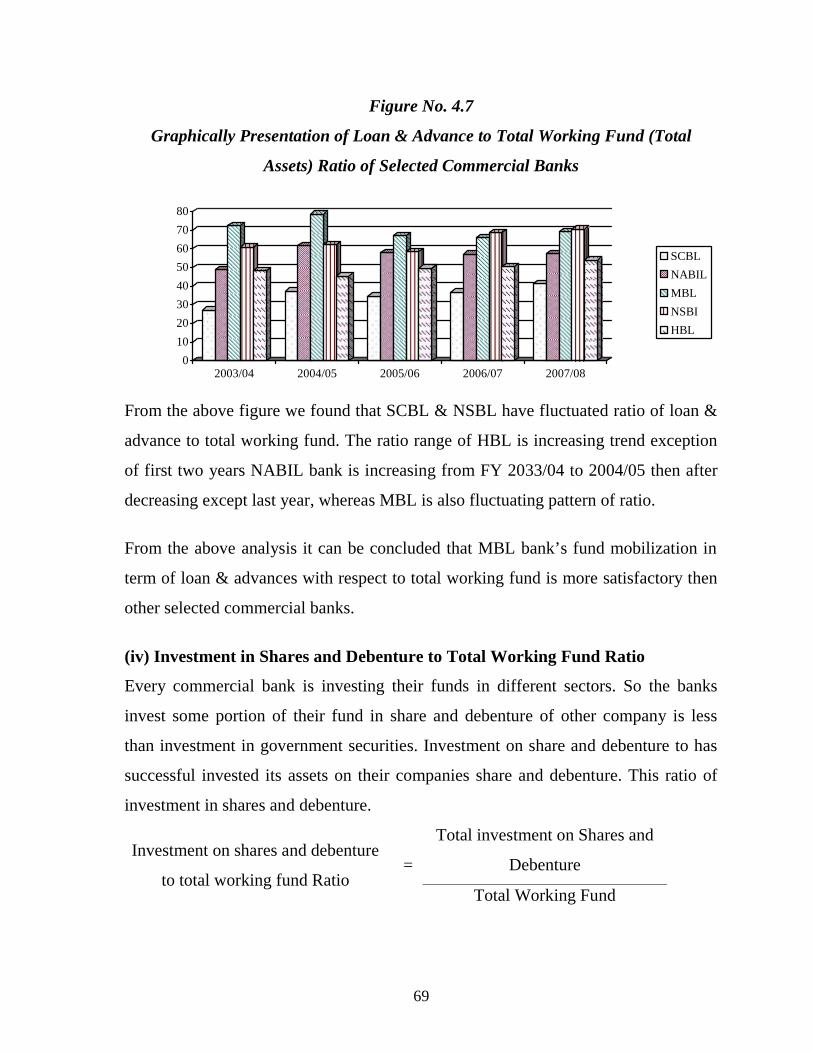
69
Figure No. 4.7
Graphically Presentation of Loan & Advance to Total Working Fund (Total
Assets) Ratio of Selected Commercial Banks
0
10
20
30
40
50
60
70
80
2003/04 2004/05 2005/06 2006/07 2007/08
SCBL
NABIL
MBL
NSBI
HBL
From the above figure we found that SCBL & NSBL have fluctuated ratio of loan &
advance to total working fund. The ratio range of HBL is increasing trend exception
of first two years NABIL bank is increasing from FY 2033/04 to 2004/05 then after
decreasing except last year, whereas MBL is also fluctuating pattern of ratio.
From the above analysis it can be concluded that MBL bank’s fund mobilization in
term of loan & advances with respect to total working fund is more satisfactory then
other selected commercial banks.
(iv) Investment in Shares and Debenture to Total Working Fund Ratio
Every commercial bank is investing their funds in different sectors. So the banks
invest some portion of their fund in share and debenture of other company is less
than investment in government securities. Investment on share and debenture to has
successful invested its assets on their companies share and debenture. This ratio of
investment in shares and debenture.
Investment on shares and debenture
to total working fund Ratio=
Total investment on Shares and
Debenture
Total Working Fund
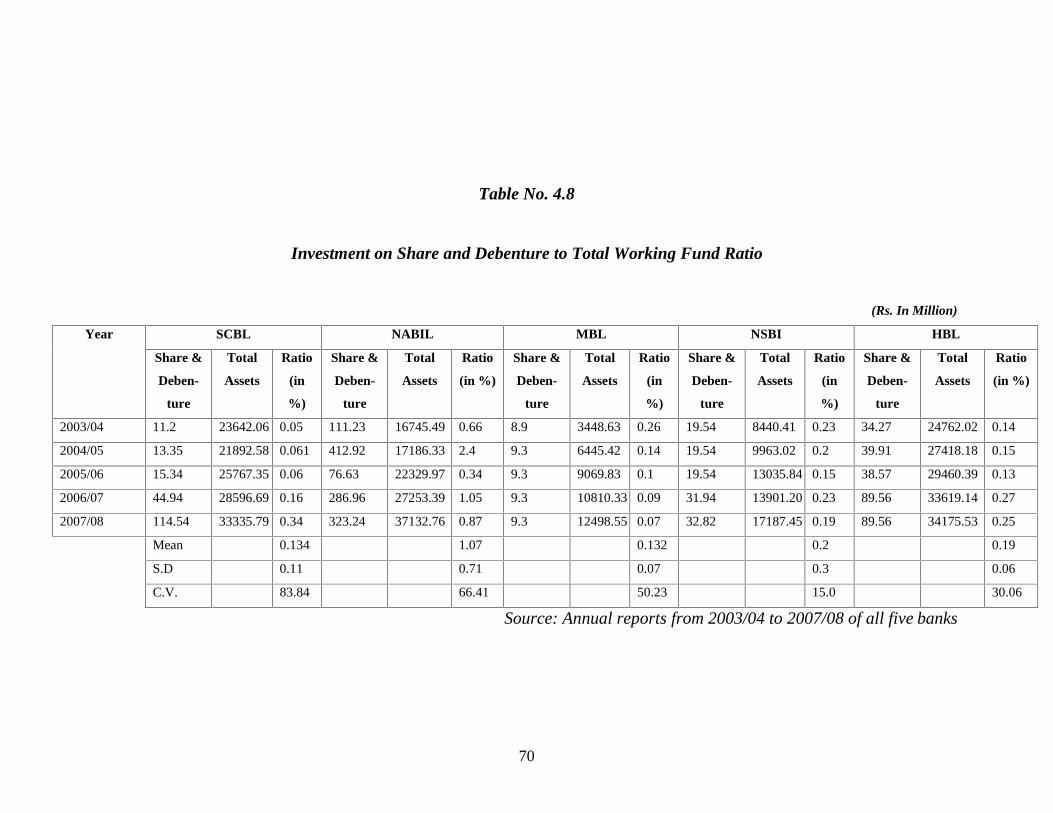
70
Table No. 4.8
Investment on Share and Debenture to Total Working Fund Ratio
(Rs. In Million)
Year SCBL NABIL MBL NSBI HBL
Share &
Deben-
ture
Total
Assets
Ratio
(in
%)
Share &
Deben-
ture
Total
Assets
Ratio
(in %)
Share &
Deben-
ture
Total
Assets
Ratio
(in
%)
Share &
Deben-
ture
Total
Assets
Ratio
(in
%)
Share &
Deben-
ture
Total
Assets
Ratio
(in %)
2003/04 11.2 23642.06 0.05 111.23 16745.49 0.66 8.9 3448.63 0.26 19.54 8440.41 0.23 34.27 24762.02 0.14
2004/05 13.35 21892.58 0.061 412.92 17186.33 2.4 9.3 6445.42 0.14 19.54 9963.02 0.2 39.91 27418.18 0.15
2005/06 15.34 25767.35 0.06 76.63 22329.97 0.34 9.3 9069.83 0.1 19.54 13035.84 0.15 38.57 29460.39 0.13
2006/07 44.94 28596.69 0.16 286.96 27253.39 1.05 9.3 10810.33 0.09 31.94 13901.20 0.23 89.56 33619.14 0.27
2007/08 114.54 33335.79 0.34 323.24 37132.76 0.87 9.3 12498.55 0.07 32.82 17187.45 0.19 89.56 34175.53 0.25
Mean 0.134 1.07 0.132 0.2 0.19
S.D 0.11 0.71 0.07 0.3 0.06
C.V. 83.84 66.41 50.23 15.0 30.06
Source: Annual reports from 2003/04 to 2007/08 of all five banks
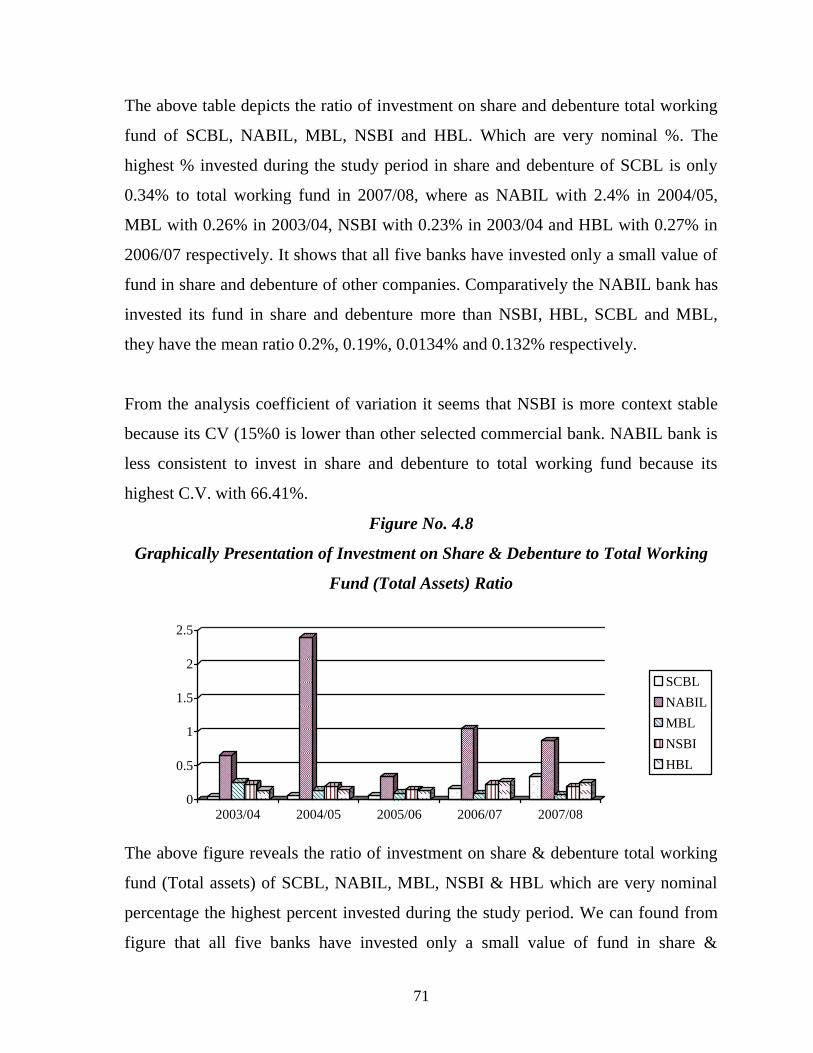
71
The above table depicts the ratio of investment on share and debenture total working
fund of SCBL, NABIL, MBL, NSBI and HBL. Which are very nominal %. The
highest % invested during the study period in share and debenture of SCBL is only
0.34% to total working fund in 2007/08, where as NABIL with 2.4% in 2004/05,
MBL with 0.26% in 2003/04, NSBI with 0.23% in 2003/04 and HBL with 0.27% in
2006/07 respectively. It shows that all five banks have invested only a small value of
fund in share and debenture of other companies. Comparatively the NABIL bank has
invested its fund in share and debenture more than NSBI, HBL, SCBL and MBL,
they have the mean ratio 0.2%, 0.19%, 0.0134% and 0.132% respectively.
From the analysis coefficient of variation it seems that NSBI is more context stable
because its CV (15%0 is lower than other selected commercial bank. NABIL bank is
less consistent to invest in share and debenture to total working fund because its
highest C.V. with 66.41%.
Figure No. 4.8
Graphically Presentation of Investment on Share & Debenture to Total Working
Fund (Total Assets) Ratio
0
0.5
1
1.5
2
2.5
2003/04 2004/05 2005/06 2006/07 2007/08
SCBL
NABIL
MBL
NSBI
HBL
The above figure reveals the ratio of investment on share & debenture total working
fund (Total assets) of SCBL, NABIL, MBL, NSBI & HBL which are very nominal
percentage the highest percent invested during the study period. We can found from
figure that all five banks have invested only a small value of fund in share &
72
debenture of other companies. Comparatively the NABIL bank has invested its fund
with 2.4% in FY 2004/05 in share and debenture more than NSBI, HBL, SCBL &
MBL.
Profitability Ratio
Profitability ratios indicate the degree of success in achieving desired profit. This
ratio measures how effectively the company manages its fund to earn profit. The
different between total revenues and total expenses over a period is known as profit.
It is regarding as the most essential element for commercial banks growth, survival
and to compete with competitor. In fact, sufficient profit must be earned to maintain
the operation of the company be able to acquire funds from investors for expansion
and to contribute towards the goal of the nation. This implies that profit is the
measuring rod of companies for the financial performance. Higher the profit ratio,
better the financial performance of commercial bank and vice-versa.
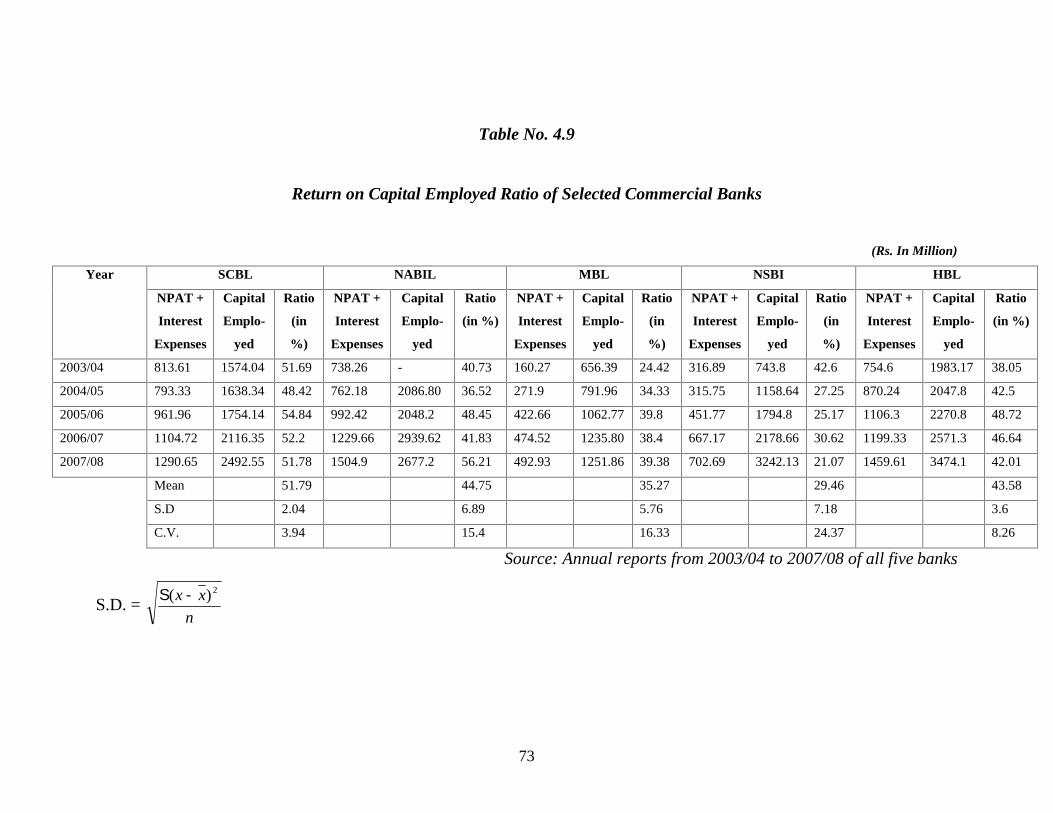
73
Table No. 4.9
Return on Capital Employed Ratio of Selected Commercial Banks
(Rs. In Million)
Year SCBL NABIL MBL NSBI HBL
NPAT +
Interest
Expenses
Capital
Emplo-
yed
Ratio
(in
%)
NPAT +
Interest
Expenses
Capital
Emplo-
yed
Ratio
(in %)
NPAT +
Interest
Expenses
Capital
Emplo-
yed
Ratio
(in
%)
NPAT +
Interest
Expenses
Capital
Emplo-
yed
Ratio
(in
%)
NPAT +
Interest
Expenses
Capital
Emplo-
yed
Ratio
(in %)
2003/04 813.61 1574.04 51.69 738.26 - 40.73 160.27 656.39 24.42 316.89 743.8 42.6 754.6 1983.17 38.05
2004/05 793.33 1638.34 48.42 762.18 2086.80 36.52 271.9 791.96 34.33 315.75 1158.64 27.25 870.24 2047.8 42.5
2005/06 961.96 1754.14 54.84 992.42 2048.2 48.45 422.66 1062.77 39.8 451.77 1794.8 25.17 1106.3 2270.8 48.72
2006/07 1104.72 2116.35 52.2 1229.66 2939.62 41.83 474.52 1235.80 38.4 667.17 2178.66 30.62 1199.33 2571.3 46.64
2007/08 1290.65 2492.55 51.78 1504.9 2677.2 56.21 492.93 1251.86 39.38 702.69 3242.13 21.07 1459.61 3474.1 42.01
Mean 51.79 44.75 35.27 29.46 43.58
S.D 2.04 6.89 5.76 7.18 3.6
C.V. 3.94 15.4 16.33 24.37 8.26
Source: Annual reports from 2003/04 to 2007/08 of all five banks
S.D. =n
xx 2)(
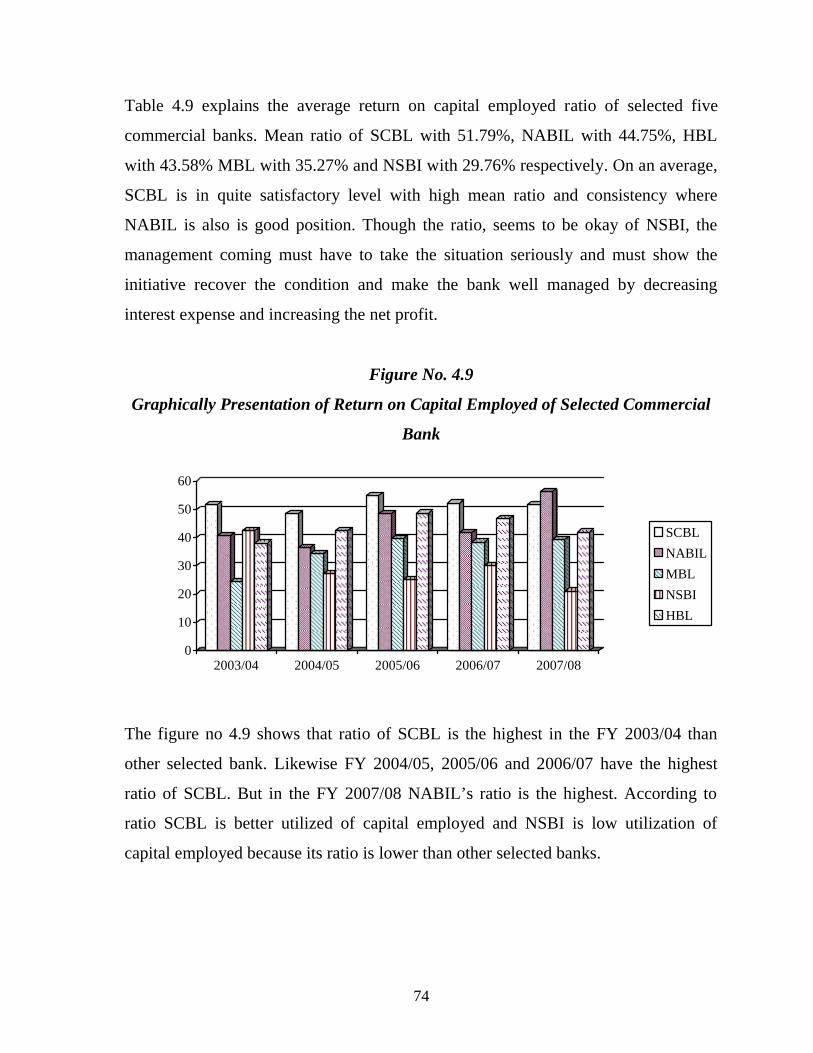
74
Table 4.9 explains the average return on capital employed ratio of selected five
commercial banks. Mean ratio of SCBL with 51.79%, NABIL with 44.75%, HBL
with 43.58% MBL with 35.27% and NSBI with 29.76% respectively. On an average,
SCBL is in quite satisfactory level with high mean ratio and consistency where
NABIL is also is good position. Though the ratio, seems to be okay of NSBI, the
management coming must have to take the situation seriously and must show the
initiative recover the condition and make the bank well managed by decreasing
interest expense and increasing the net profit.
Figure No. 4.9
Graphically Presentation of Return on Capital Employed of Selected Commercial
Bank
0
10
20
30
40
50
60
2003/04 2004/05 2005/06 2006/07 2007/08
SCBL
NABIL
MBL
NSBI
HBL
The figure no 4.9 shows that ratio of SCBL is the highest in the FY 2003/04 than
other selected bank. Likewise FY 2004/05, 2005/06 and 2006/07 have the highest
ratio of SCBL. But in the FY 2007/08 NABIL’s ratio is the highest. According to
ratio SCBL is better utilized of capital employed and NSBI is low utilization of
capital employed because its ratio is lower than other selected banks.

75
Table No. 4.10
Return on Total Assets Ratio of Selected Commercial Banks
(Rs. In Million)
Year SCBL NABIL MBL NSBI HBL
NPAT Total
Assets
Ratio
(in
%)
NPAT Total
Assets
Ratio
(in %)
NPAT Total
Assets
Ratio
(in
%)
NPAT Total
Assets
Ratio
(in
%)
NPAT Total
Assets
Ratio
(in %)
2003/04 537.8 23642.06 2.27 455.31 16745.49 2.72 46.69 3448.63 1.35 60.85 8440.41 0.72 263.05 24762.02 1.06
2004/05 539.2 21893.58 2.46 518.64 17186.33 3.02 84.87 6445.42 1.32 57.38 9963.02 0.57 308.28 27418.16 1.12
2005/06 658.76 25767.35 2.56 635.26 22329.97 2.84 133.1 9069.83 1.47 117.00 13035.84 0.90 457.46 29460.39 1.55
2006/07 691.67 28596.69 2.42 673.96 27253.39 2.47 76.8 10810.33 7.1 254.91 13901.2 1.83 431.92 23519.14 1.84
2007/08 818.92 33335.79 2.46 746.47 37132.76 2.01 85.01 12498.55 6.8 247.77 17187.45 1.44 635.38 36175.53 1.76
Mean 2.43 2.61 3.61 1.1 1.47
S.D 1.095 0.35 2.73 1.05 0.32
C.V. 3.91 13.41 75.62 95.45 21.77
Source: Annual reports from 2003/04 to 2007/08 of all five banks
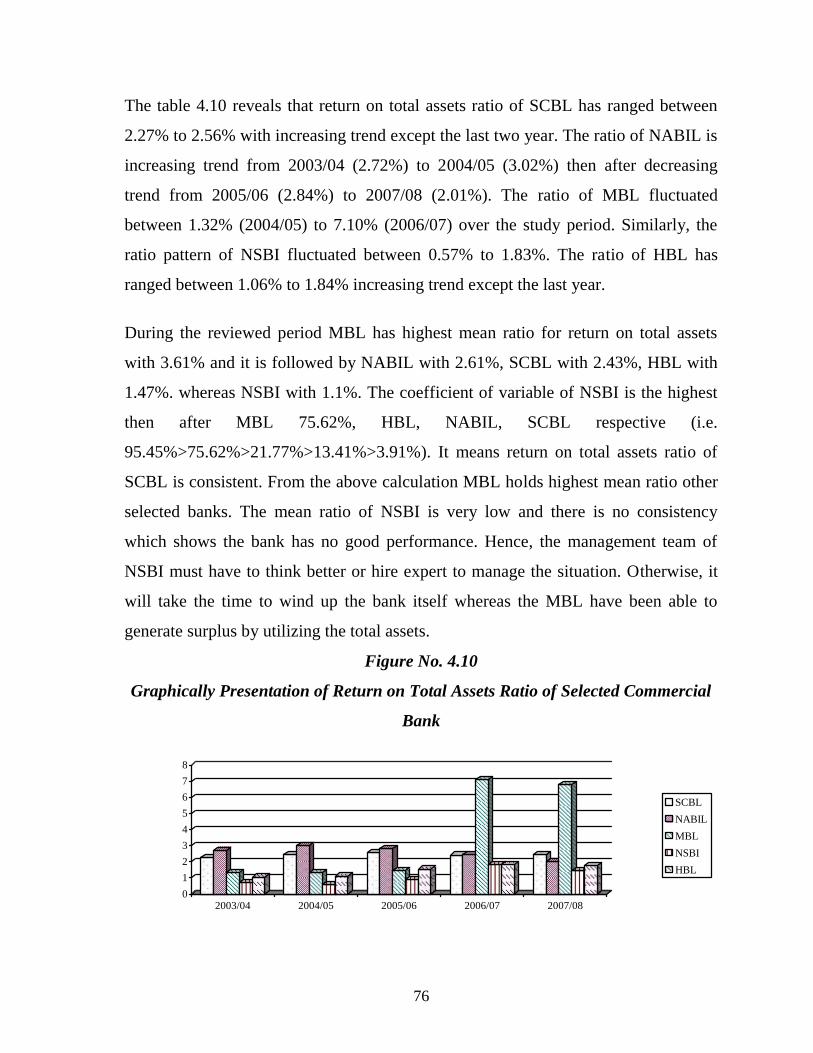
76
The table 4.10 reveals that return on total assets ratio of SCBL has ranged between
2.27% to 2.56% with increasing trend except the last two year. The ratio of NABIL is
increasing trend from 2003/04 (2.72%) to 2004/05 (3.02%) then after decreasing
trend from 2005/06 (2.84%) to 2007/08 (2.01%). The ratio of MBL fluctuated
between 1.32% (2004/05) to 7.10% (2006/07) over the study period. Similarly, the
ratio pattern of NSBI fluctuated between 0.57% to 1.83%. The ratio of HBL has
ranged between 1.06% to 1.84% increasing trend except the last year.
During the reviewed period MBL has highest mean ratio for return on total assets
with 3.61% and it is followed by NABIL with 2.61%, SCBL with 2.43%, HBL with
1.47%. whereas NSBI with 1.1%. The coefficient of variable of NSBI is the highest
then after MBL 75.62%, HBL, NABIL, SCBL respective (i.e.
95.45%>75.62%>21.77%>13.41%>3.91%). It means return on total assets ratio of
SCBL is consistent. From the above calculation MBL holds highest mean ratio other
selected banks. The mean ratio of NSBI is very low and there is no consistency
which shows the bank has no good performance. Hence, the management team of
NSBI must have to think better or hire expert to manage the situation. Otherwise, it
will take the time to wind up the bank itself whereas the MBL have been able to
generate surplus by utilizing the total assets.
Figure No. 4.10
Graphically Presentation of Return on Total Assets Ratio of Selected Commercial
Bank
0
1
2
3
4
5
6
7
8
2003/04 2004/05 2005/06 2006/07 2007/08
SCBL
NABIL
MBL
NSBI
HBL

77
From the figure no. 4.10 shows that return on total assets of SCBL is increasing trend
except of last two years. Similarly NABIL Bank’s ratio is increasing trend except of
first two years. MBL & NSBI have fluctuated trend. HBL is increasing trend from
FY 2003/04 to 2006/07 then decrease in FY 2007/08. During the review period MBL
had the highest average ratio, followed by NABIL, SCBL, HBL & NSBI.
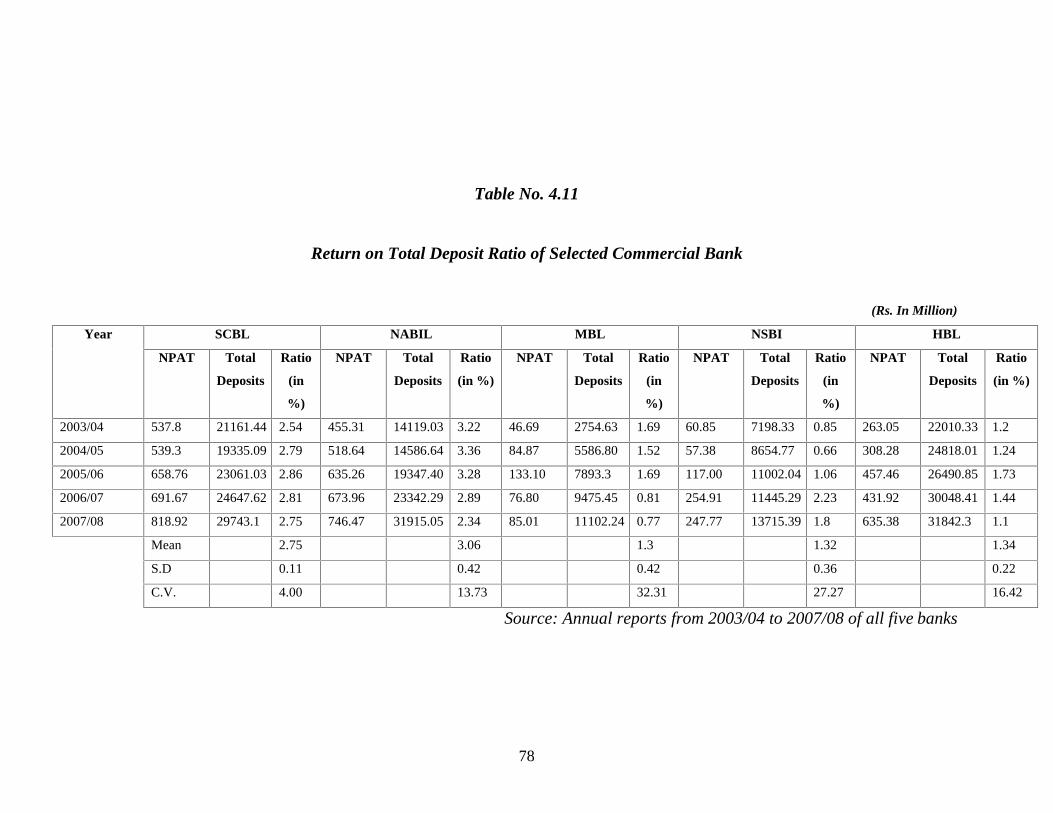
78
Table No. 4.11
Return on Total Deposit Ratio of Selected Commercial Bank
(Rs. In Million)
Year SCBL NABIL MBL NSBI HBL
NPAT Total
Deposits
Ratio
(in
%)
NPAT Total
Deposits
Ratio
(in %)
NPAT Total
Deposits
Ratio
(in
%)
NPAT Total
Deposits
Ratio
(in
%)
NPAT Total
Deposits
Ratio
(in %)
2003/04 537.8 21161.44 2.54 455.31 14119.03 3.22 46.69 2754.63 1.69 60.85 7198.33 0.85 263.05 22010.33 1.2
2004/05 539.3 19335.09 2.79 518.64 14586.64 3.36 84.87 5586.80 1.52 57.38 8654.77 0.66 308.28 24818.01 1.24
2005/06 658.76 23061.03 2.86 635.26 19347.40 3.28 133.10 7893.3 1.69 117.00 11002.04 1.06 457.46 26490.85 1.73
2006/07 691.67 24647.62 2.81 673.96 23342.29 2.89 76.80 9475.45 0.81 254.91 11445.29 2.23 431.92 30048.41 1.44
2007/08 818.92 29743.1 2.75 746.47 31915.05 2.34 85.01 11102.24 0.77 247.77 13715.39 1.8 635.38 31842.3 1.1
Mean 2.75 3.06 1.3 1.32 1.34
S.D 0.11 0.42 0.42 0.36 0.22
C.V. 4.00 13.73 32.31 27.27 16.42
Source: Annual reports from 2003/04 to 2007/08 of all five banks
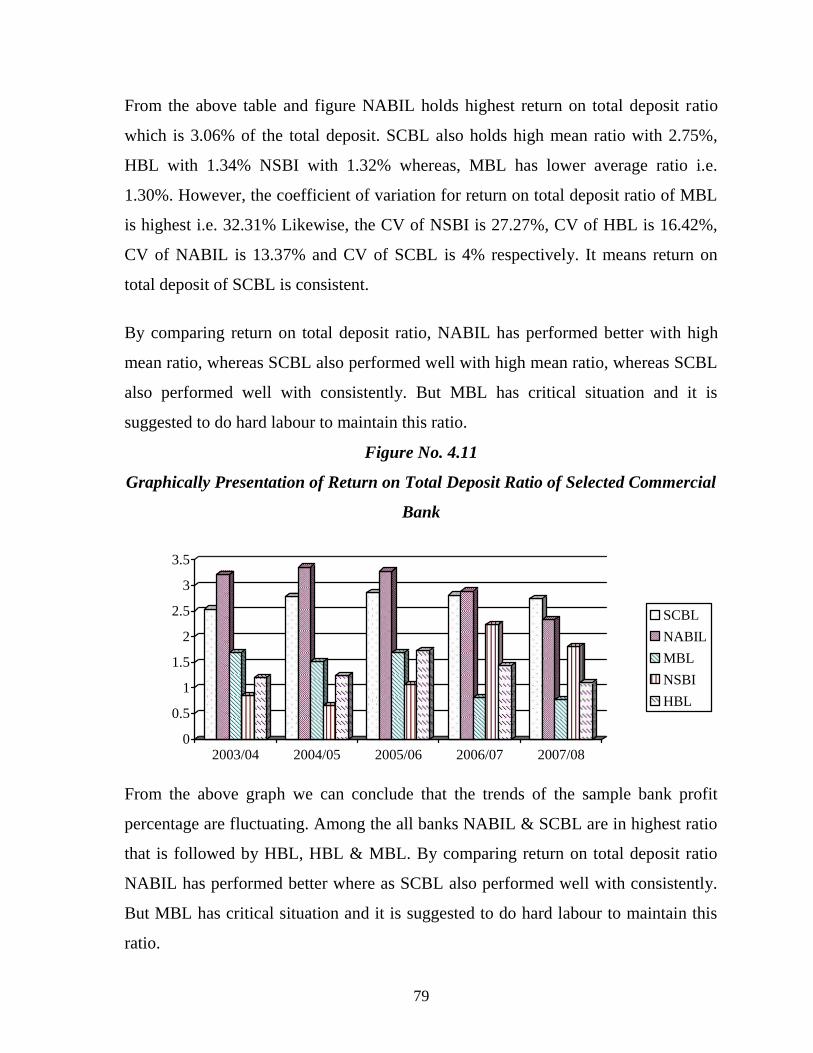
79
From the above table and figure NABIL holds highest return on total deposit ratio
which is 3.06% of the total deposit. SCBL also holds high mean ratio with 2.75%,
HBL with 1.34% NSBI with 1.32% whereas, MBL has lower average ratio i.e.
1.30%. However, the coefficient of variation for return on total deposit ratio of MBL
is highest i.e. 32.31% Likewise, the CV of NSBI is 27.27%, CV of HBL is 16.42%,
CV of NABIL is 13.37% and CV of SCBL is 4% respectively. It means return on
total deposit of SCBL is consistent.
By comparing return on total deposit ratio, NABIL has performed better with high
mean ratio, whereas SCBL also performed well with high mean ratio, whereas SCBL
also performed well with consistently. But MBL has critical situation and it is
suggested to do hard labour to maintain this ratio.
Figure No. 4.11
Graphically Presentation of Return on Total Deposit Ratio of Selected Commercial
Bank
0
0.5
1
1.5
2
2.5
3
3.5
2003/04 2004/05 2005/06 2006/07 2007/08
SCBL
NABIL
MBL
NSBI
HBL
From the above graph we can conclude that the trends of the sample bank profit
percentage are fluctuating. Among the all banks NABIL & SCBL are in highest ratio
that is followed by HBL, HBL & MBL. By comparing return on total deposit ratio
NABIL has performed better where as SCBL also performed well with consistently.
But MBL has critical situation and it is suggested to do hard labour to maintain this
ratio.
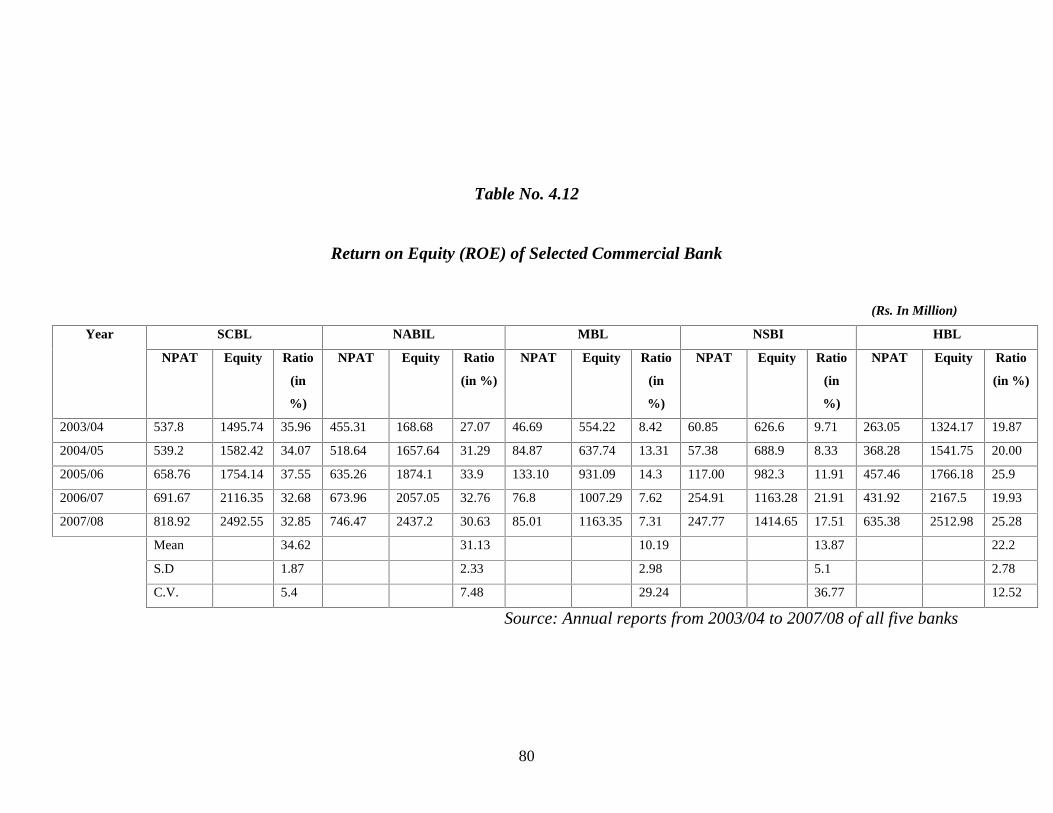
80
Table No. 4.12
Return on Equity (ROE) of Selected Commercial Bank
(Rs. In Million)
Year SCBL NABIL MBL NSBI HBL
NPAT Equity Ratio
(in
%)
NPAT Equity Ratio
(in %)
NPAT Equity Ratio
(in
%)
NPAT Equity Ratio
(in
%)
NPAT Equity Ratio
(in %)
2003/04 537.8 1495.74 35.96 455.31 168.68 27.07 46.69 554.22 8.42 60.85 626.6 9.71 263.05 1324.17 19.87
2004/05 539.2 1582.42 34.07 518.64 1657.64 31.29 84.87 637.74 13.31 57.38 688.9 8.33 368.28 1541.75 20.00
2005/06 658.76 1754.14 37.55 635.26 1874.1 33.9 133.10 931.09 14.3 117.00 982.3 11.91 457.46 1766.18 25.9
2006/07 691.67 2116.35 32.68 673.96 2057.05 32.76 76.8 1007.29 7.62 254.91 1163.28 21.91 431.92 2167.5 19.93
2007/08 818.92 2492.55 32.85 746.47 2437.2 30.63 85.01 1163.35 7.31 247.77 1414.65 17.51 635.38 2512.98 25.28
Mean 34.62 31.13 10.19 13.87 22.2
S.D 1.87 2.33 2.98 5.1 2.78
C.V. 5.4 7.48 29.24 36.77 12.52
Source: Annual reports from 2003/04 to 2007/08 of all five banks
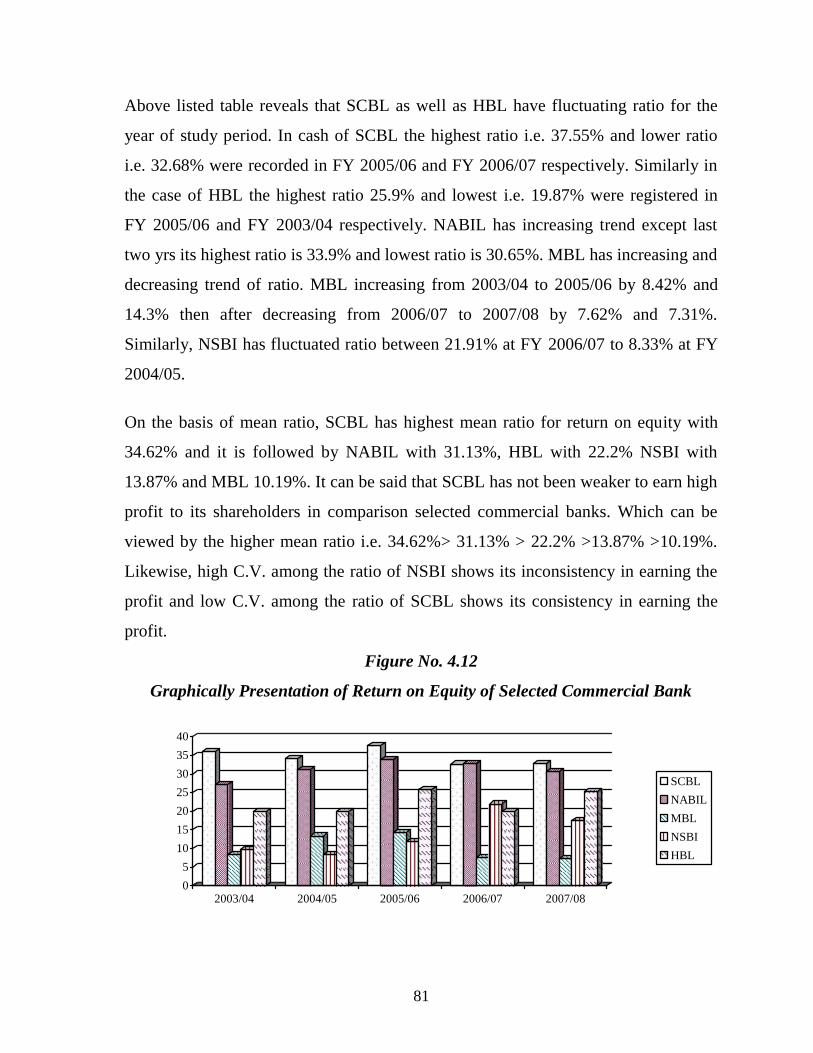
81
Above listed table reveals that SCBL as well as HBL have fluctuating ratio for the
year of study period. In cash of SCBL the highest ratio i.e. 37.55% and lower ratio
i.e. 32.68% were recorded in FY 2005/06 and FY 2006/07 respectively. Similarly in
the case of HBL the highest ratio 25.9% and lowest i.e. 19.87% were registered in
FY 2005/06 and FY 2003/04 respectively. NABIL has increasing trend except last
two yrs its highest ratio is 33.9% and lowest ratio is 30.65%. MBL has increasing and
decreasing trend of ratio. MBL increasing from 2003/04 to 2005/06 by 8.42% and
14.3% then after decreasing from 2006/07 to 2007/08 by 7.62% and 7.31%.
Similarly, NSBI has fluctuated ratio between 21.91% at FY 2006/07 to 8.33% at FY
2004/05.
On the basis of mean ratio, SCBL has highest mean ratio for return on equity with
34.62% and it is followed by NABIL with 31.13%, HBL with 22.2% NSBI with
13.87% and MBL 10.19%. It can be said that SCBL has not been weaker to earn high
profit to its shareholders in comparison selected commercial banks. Which can be
viewed by the higher mean ratio i.e. 34.62%> 31.13% > 22.2% >13.87% >10.19%.
Likewise, high C.V. among the ratio of NSBI shows its inconsistency in earning the
profit and low C.V. among the ratio of SCBL shows its consistency in earning the
profit.
Figure No. 4.12
Graphically Presentation of Return on Equity of Selected Commercial Bank
0
5
10
15
20
25
30
35
40
2003/04 2004/05 2005/06 2006/07 2007/08
SCBL
NABIL
MBL
NSBI
HBL
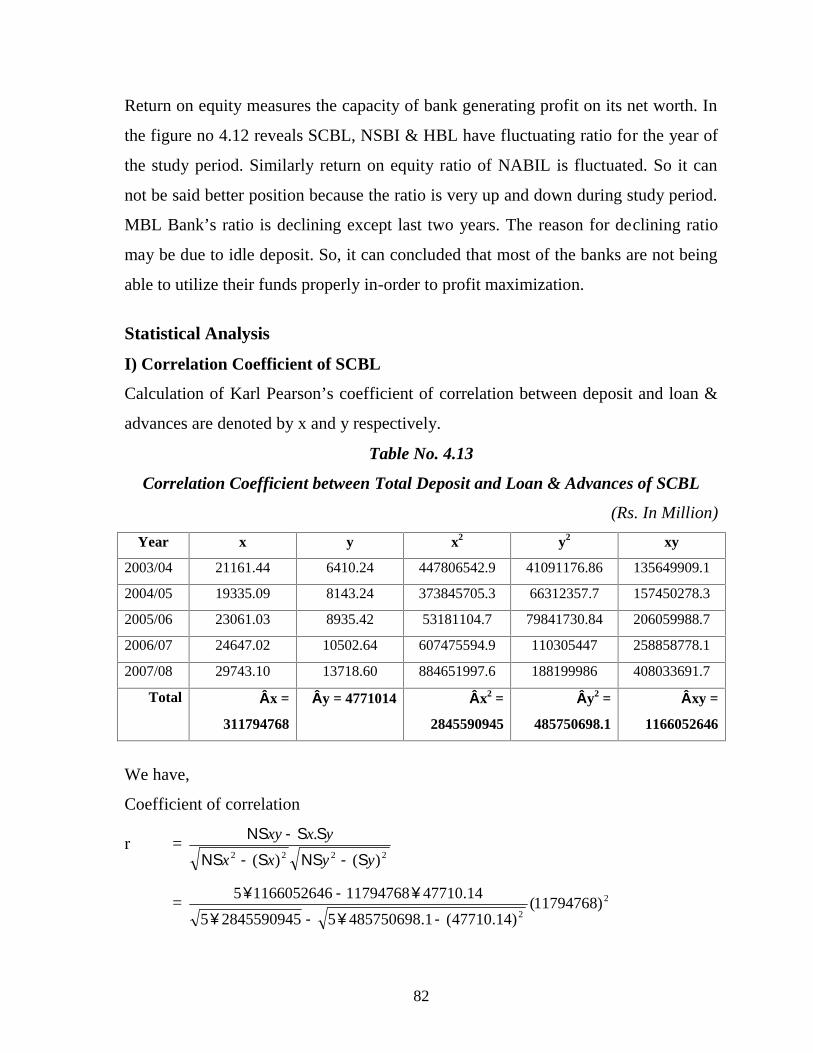
82
Return on equity measures the capacity of bank generating profit on its net worth. In
the figure no 4.12 reveals SCBL, NSBI & HBL have fluctuating ratio for the year of
the study period. Similarly return on equity ratio of NABIL is fluctuated. So it can
not be said better position because the ratio is very up and down during study period.
MBL Bank’s ratio is declining except last two years. The reason for declining ratio
may be due to idle deposit. So, it can concluded that most of the banks are not being
able to utilize their funds properly in-order to profit maximization.
Statistical Analysis
I) Correlation Coefficient of SCBL
Calculation of Karl Pearson’s coefficient of correlation between deposit and loan &
advances are denoted by x and y respectively.
Table No. 4.13
Correlation Coefficient between Total Deposit and Loan & Advances of SCBL
(Rs. In Million)
Year x y x2 y2 xy
2003/04 21161.44 6410.24 447806542.9 41091176.86 135649909.1
2004/05 19335.09 8143.24 373845705.3 66312357.7 157450278.3
2005/06 23061.03 8935.42 53181104.7 79841730.84 206059988.7
2006/07 24647.02 10502.64 607475594.9 110305447 258858778.1
2007/08 29743.10 13718.60 884651997.6 188199986 408033691.7
Total x =
311794768
y = 4771014 x2 =
2845590945
y2 =
485750698.1
xy =
1166052646
We have,
Coefficient of correlation
r =2222 )()(
.
yyxx
yxxy
= 2
2)11794768(
)14.47710(1.485750698528455909455
14.477101179476811660526465
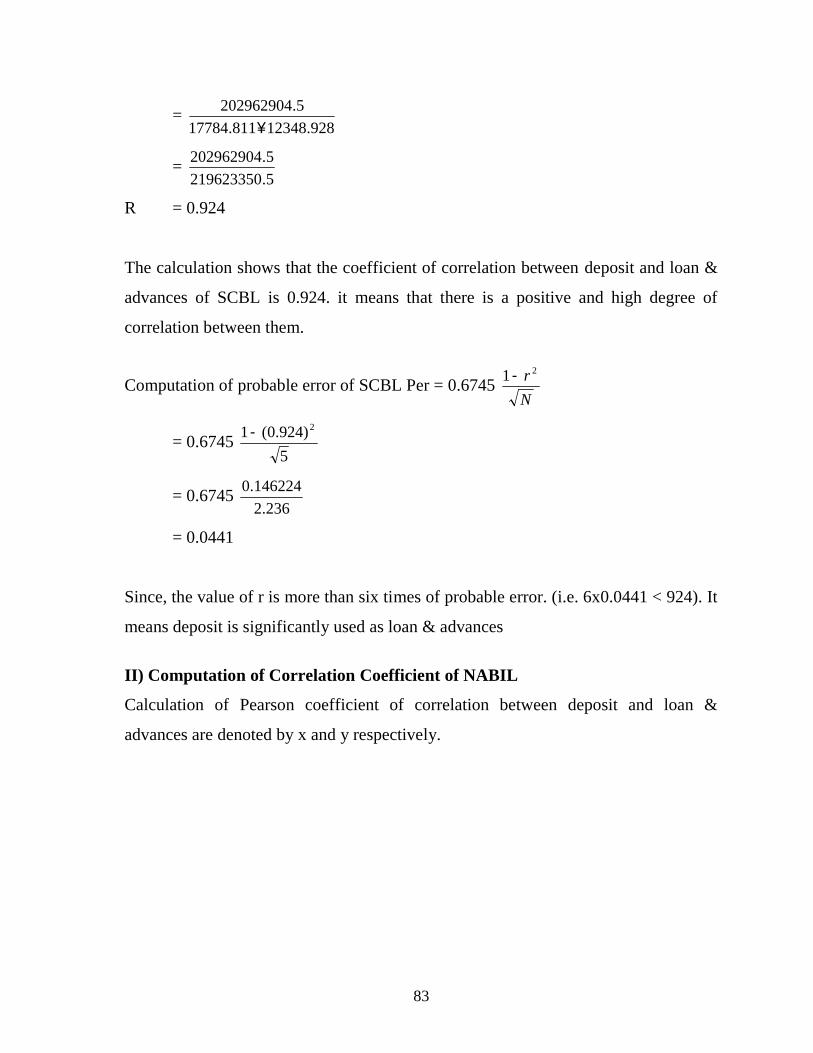
83
=928.12348811.17784
5.202962904
=5.219623350
5.202962904
R = 0.924
The calculation shows that the coefficient of correlation between deposit and loan &
advances of SCBL is 0.924. it means that there is a positive and high degree of
correlation between them.
Computation of probable error of SCBL Per = 0.6745N
r 21
= 0.67455
)924.0(1 2
= 0.6745236.2
146224.0
= 0.0441
Since, the value of r is more than six times of probable error. (i.e. 6x0.0441 < 924). It
means deposit is significantly used as loan & advances
II) Computation of Correlation Coefficient of NABIL
Calculation of Pearson coefficient of correlation between deposit and loan &
advances are denoted by x and y respectively.
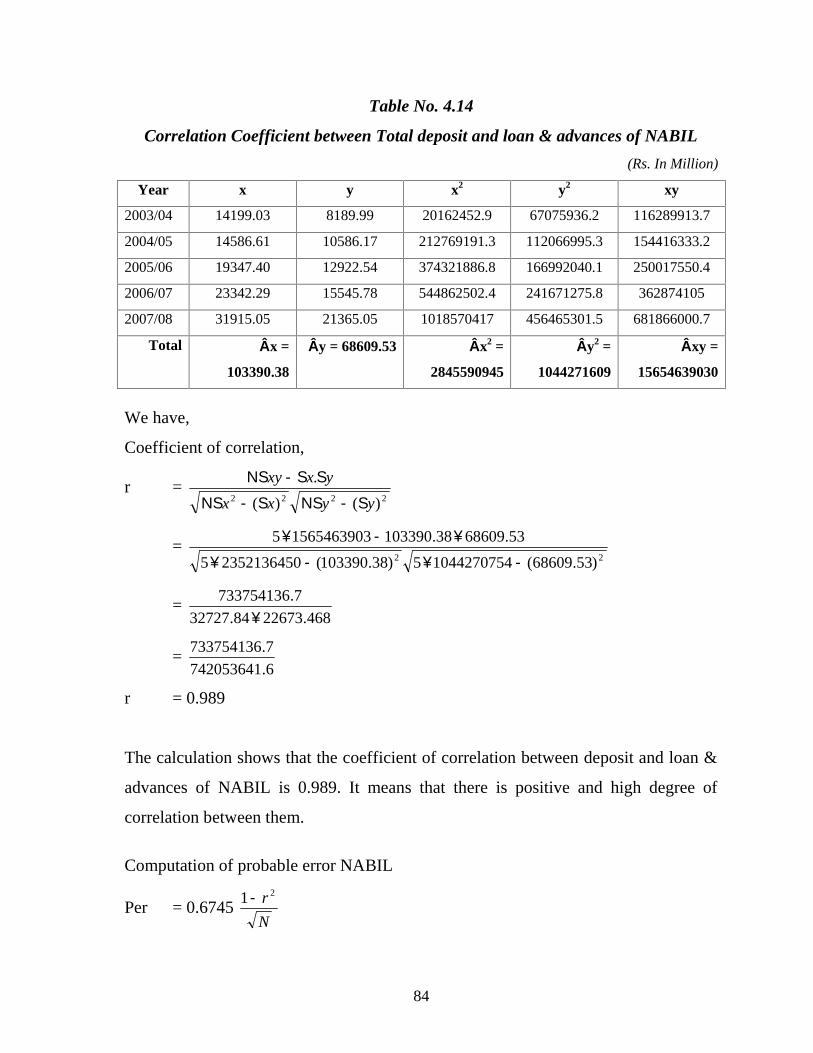
84
Table No. 4.14
Correlation Coefficient between Total deposit and loan & advances of NABIL
(Rs. In Million)
Year x y x2 y2 xy
2003/04 14199.03 8189.99 20162452.9 67075936.2 116289913.7
2004/05 14586.61 10586.17 212769191.3 112066995.3 154416333.2
2005/06 19347.40 12922.54 374321886.8 166992040.1 250017550.4
2006/07 23342.29 15545.78 544862502.4 241671275.8 362874105
2007/08 31915.05 21365.05 1018570417 456465301.5 681866000.7
Total x =
103390.38
y = 68609.53 x2 =
2845590945
y2 =
1044271609
xy =
15654639030
We have,
Coefficient of correlation,
r =2222 )()(
.
yyxx
yxxy
=22 )53.68609(10442707545)38.103390(23521364505
53.6860938.10339015654639035
=468.2267384.32727
7.733754136
=6.742053641
7.733754136
r = 0.989
The calculation shows that the coefficient of correlation between deposit and loan &
advances of NABIL is 0.989. It means that there is positive and high degree of
correlation between them.
Computation of probable error NABIL
Per = 0.6745N
r 21
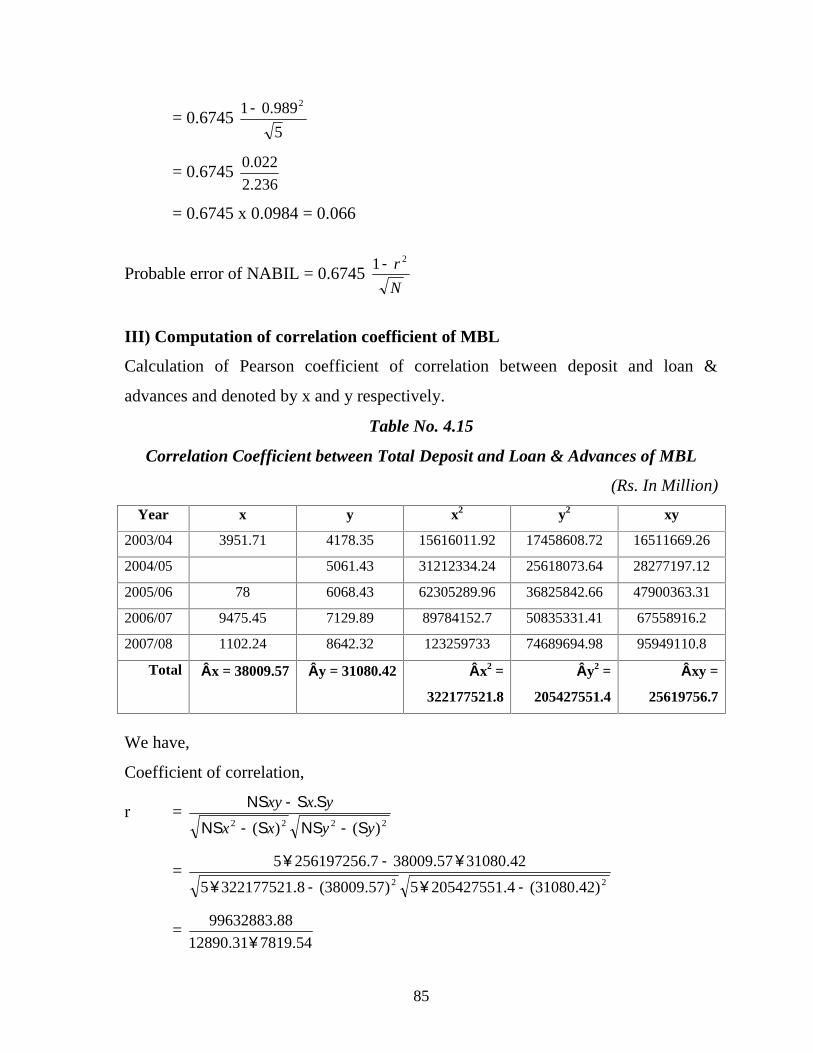
85
= 0.67455
989.01 2
= 0.6745236.2
022.0
= 0.6745 x 0.0984 = 0.066
Probable error of NABIL = 0.6745N
r 21
III) Computation of correlation coefficient of MBL
Calculation of Pearson coefficient of correlation between deposit and loan &
advances and denoted by x and y respectively.
Table No. 4.15
Correlation Coefficient between Total Deposit and Loan & Advances of MBL
(Rs. In Million)
Year x y x2 y2 xy
2003/04 3951.71 4178.35 15616011.92 17458608.72 16511669.26
2004/05 5061.43 31212334.24 25618073.64 28277197.12
2005/06 78 6068.43 62305289.96 36825842.66 47900363.31
2006/07 9475.45 7129.89 89784152.7 50835331.41 67558916.2
2007/08 1102.24 8642.32 123259733 74689694.98 95949110.8
Total x = 38009.57 y = 31080.42 x2 =
322177521.8
y2 =
205427551.4
xy =
25619756.7
We have,
Coefficient of correlation,
r =2222 )()(
.
yyxx
yxxy
=22 )42.31080(4.2054275515)57.38009(8.3221775215
42.3108057.380097.2561972565
=54.781931.12890
88.99632883
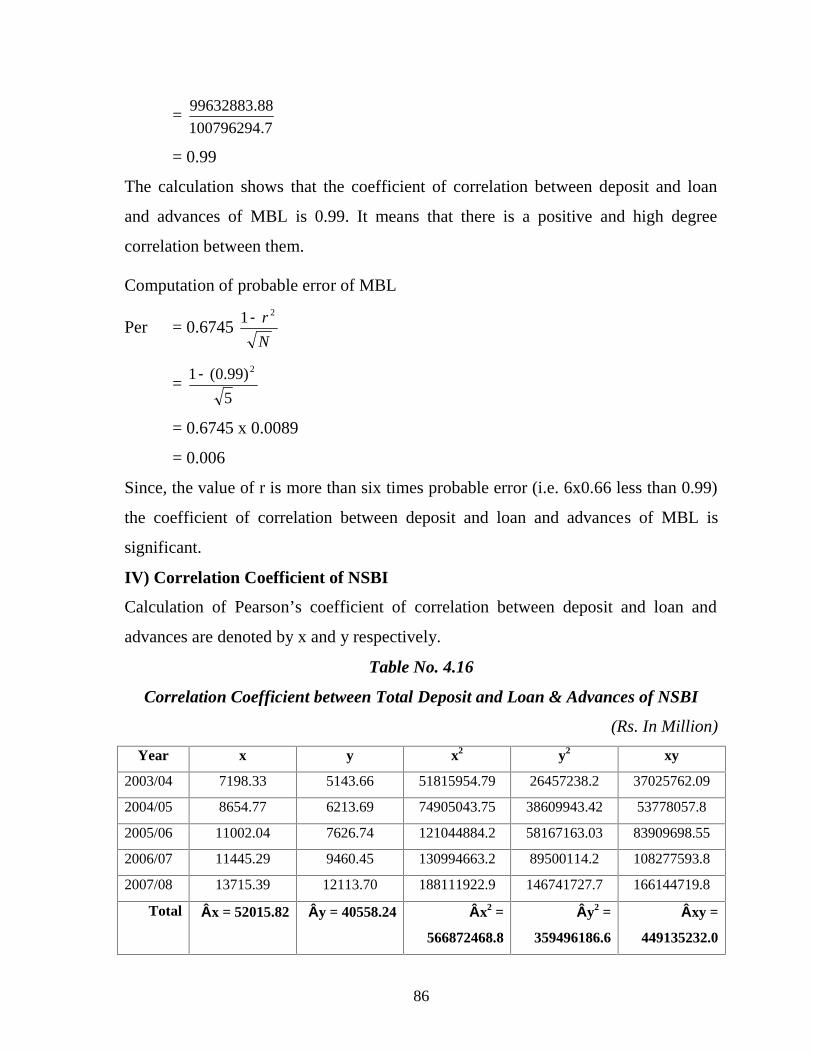
86
=7.100796294
88.99632883
= 0.99
The calculation shows that the coefficient of correlation between deposit and loan
and advances of MBL is 0.99. It means that there is a positive and high degree
correlation between them.
Computation of probable error of MBL
Per = 0.6745N
r 21
=5
)99.0(1 2
= 0.6745 x 0.0089
= 0.006
Since, the value of r is more than six times probable error (i.e. 6x0.66 less than 0.99)
the coefficient of correlation between deposit and loan and advances of MBL is
significant.
IV) Correlation Coefficient of NSBI
Calculation of Pearson’s coefficient of correlation between deposit and loan and
advances are denoted by x and y respectively.
Table No. 4.16
Correlation Coefficient between Total Deposit and Loan & Advances of NSBI
(Rs. In Million)
Year x y x2 y2 xy
2003/04 7198.33 5143.66 51815954.79 26457238.2 37025762.09
2004/05 8654.77 6213.69 74905043.75 38609943.42 53778057.8
2005/06 11002.04 7626.74 121044884.2 58167163.03 83909698.55
2006/07 11445.29 9460.45 130994663.2 89500114.2 108277593.8
2007/08 13715.39 12113.70 188111922.9 146741727.7 166144719.8
Total x = 52015.82 y = 40558.24 x2 =
566872468.8
y2 =
359496186.6
xy =
449135232.0

87
We have,
Coefficient of correlation,
r =2222 )()(
.
yyxx
yxxy
=22 )29.40558(6.3594761865)82.52015(7.5668724685
24.4055882.520150.449135232
x
=45.1234534.11345
6.136006048
=7.140063327
6.136006048
= 0.97
The calculation shows that the coefficient of correlation between deposit and loan
and advances of NSBI is 0.97. It means that there is a positive and high degree of
correlation between them.
Computation of probable error of NSBI
Per = 0.6745 xN
r 2)(1
= 0.6745 x5
)97.0(1 2
= 0.6745 x 0.0591
= 0.04
Since, the value of r is more the six times the probable error (i.e. 6x0.04 <0.97). It
means deposit is significantly used as loan and advance.
V) Correlation Coefficient of HBL
Calculation of Pearson coefficient of correlation between deposit and loan &
advances are denoted by x and y respectively.
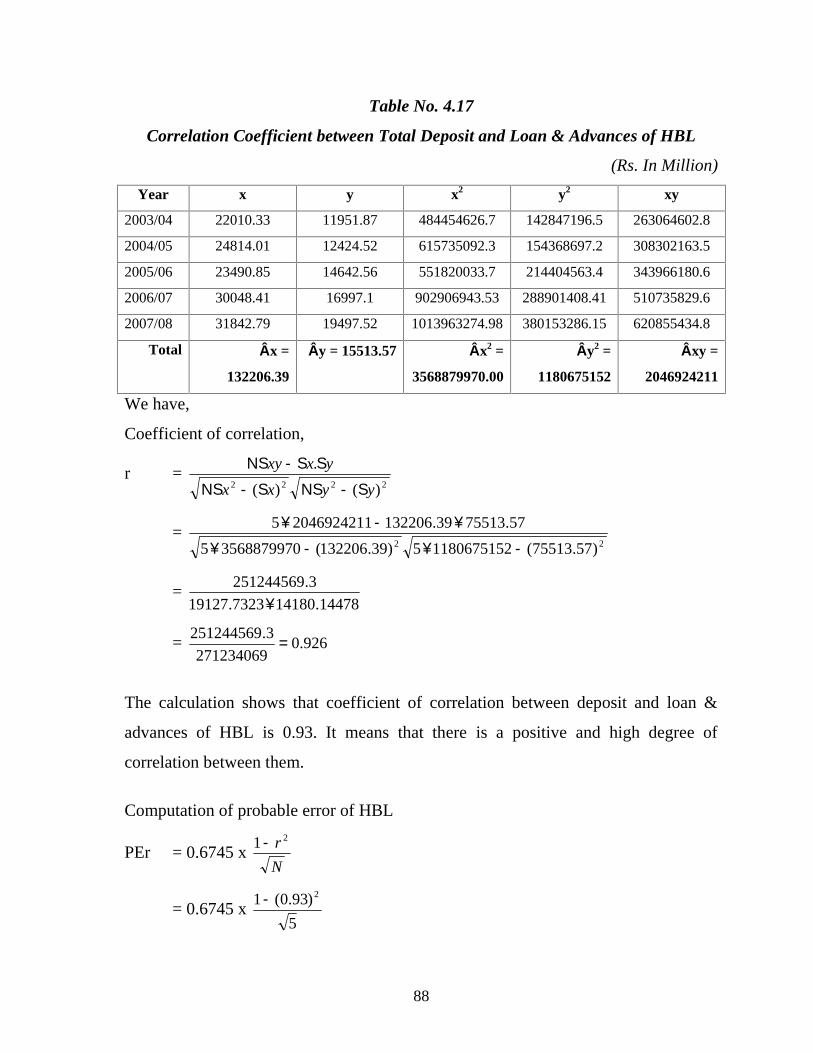
88
Table No. 4.17
Correlation Coefficient between Total Deposit and Loan & Advances of HBL
(Rs. In Million)
Year x y x2 y2 xy
2003/04 22010.33 11951.87 484454626.7 142847196.5 263064602.8
2004/05 24814.01 12424.52 615735092.3 154368697.2 308302163.5
2005/06 23490.85 14642.56 551820033.7 214404563.4 343966180.6
2006/07 30048.41 16997.1 902906943.53 288901408.41 510735829.6
2007/08 31842.79 19497.52 1013963274.98 380153286.15 620855434.8
Total x =
132206.39
y = 15513.57 x2 =
3568879970.00
y2 =
1180675152
xy =
2046924211
We have,
Coefficient of correlation,
r =2222 )()(
.
yyxx
yxxy
=22 )57.75513(11806751525)39.132206(35688799705
57.7551339.13220620469242115
=14478.141807323.19127
3.251244569
= 926.0271234069
3.251244569
The calculation shows that coefficient of correlation between deposit and loan &
advances of HBL is 0.93. It means that there is a positive and high degree of
correlation between them.
Computation of probable error of HBL
PEr = 0.6745 xN
r 21
= 0.6745 x5
)93.0(1 2
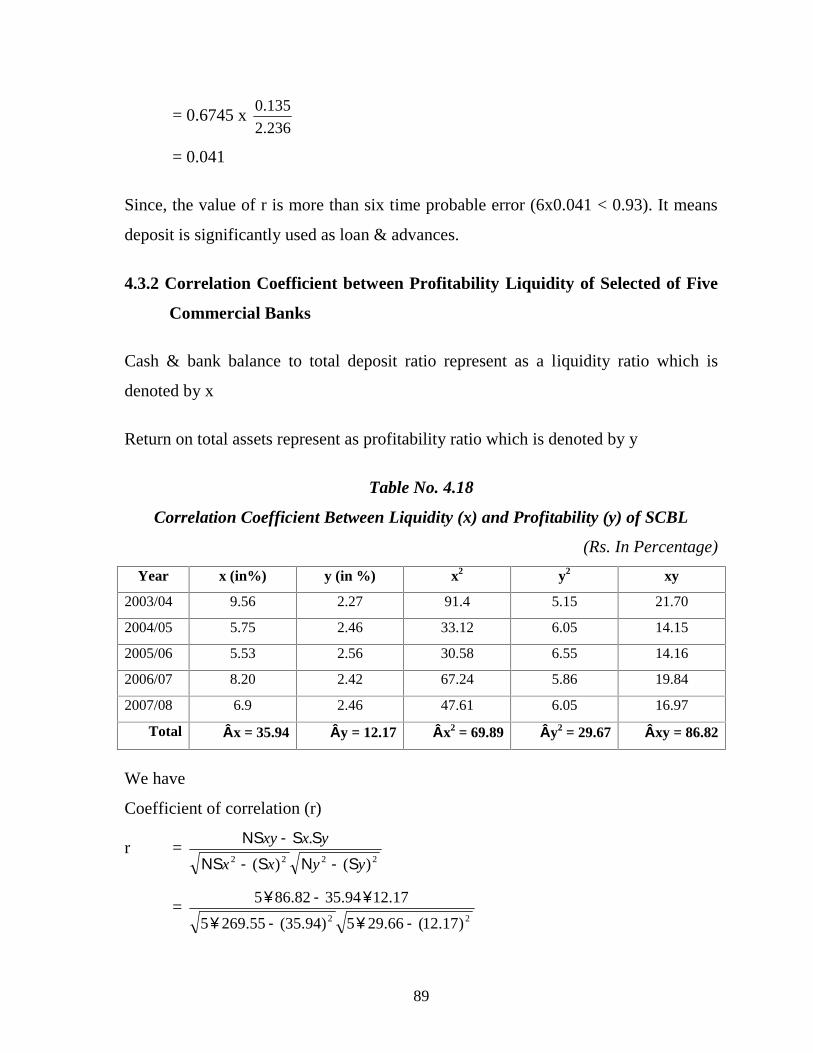
89
= 0.6745 x236.2
135.0
= 0.041
Since, the value of r is more than six time probable error (6x0.041 < 0.93). It means
deposit is significantly used as loan & advances.
4.3.2 Correlation Coefficient between Profitability Liquidity of Selected of Five
Commercial Banks
Cash & bank balance to total deposit ratio represent as a liquidity ratio which is
denoted by x
Return on total assets represent as profitability ratio which is denoted by y
Table No. 4.18
Correlation Coefficient Between Liquidity (x) and Profitability (y) of SCBL
(Rs. In Percentage)
Year x (in%) y (in %) x2 y2 xy
2003/04 9.56 2.27 91.4 5.15 21.70
2004/05 5.75 2.46 33.12 6.05 14.15
2005/06 5.53 2.56 30.58 6.55 14.16
2006/07 8.20 2.42 67.24 5.86 19.84
2007/08 6.9 2.46 47.61 6.05 16.97
Total x = 35.94 y = 12.17 x2 = 69.89 y2 = 29.67 xy = 86.82
We have
Coefficient of correlation (r)
r =2222 )()(
.
yyxx
yxxy
=22 )17.12(66.295)94.35(55.2695
17.1294.3582.865
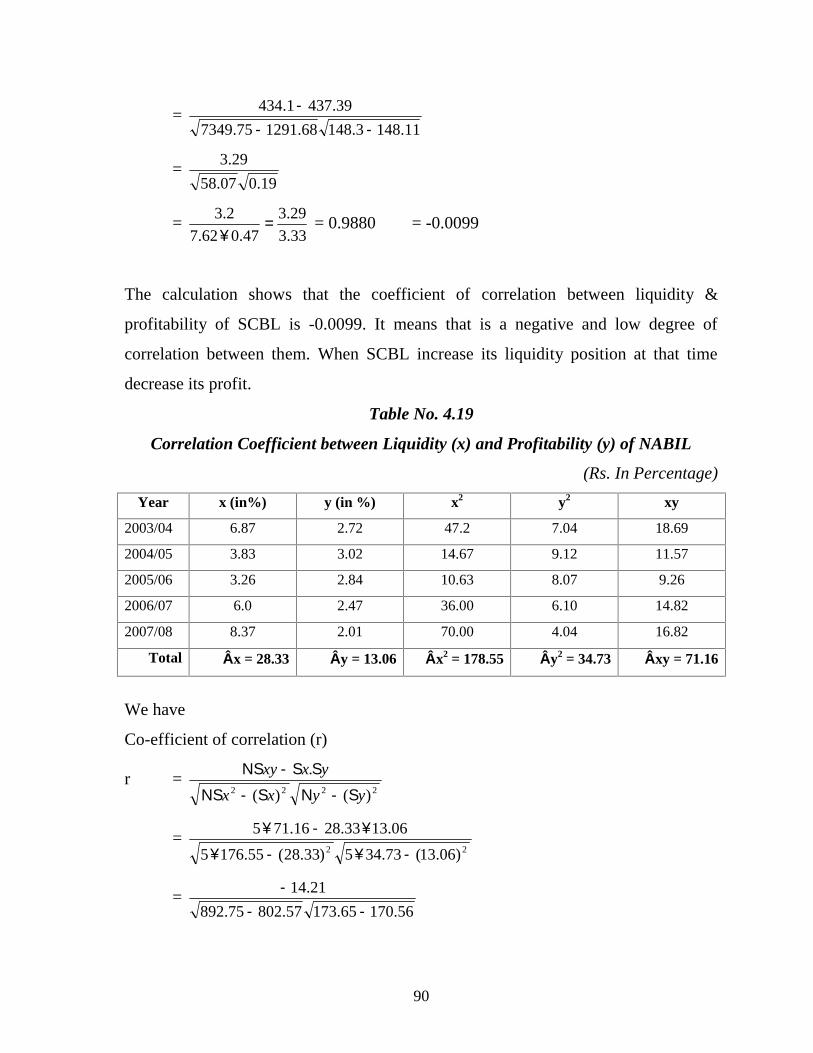
90
=11.1483.14868.129175.7349
39.4371.434
=19.007.58
29.3
=33.3
29.3
47.062.7
2.3
= 0.9880 = -0.0099
The calculation shows that the coefficient of correlation between liquidity &
profitability of SCBL is -0.0099. It means that is a negative and low degree of
correlation between them. When SCBL increase its liquidity position at that time
decrease its profit.
Table No. 4.19
Correlation Coefficient between Liquidity (x) and Profitability (y) of NABIL
(Rs. In Percentage)
Year x (in%) y (in %) x2 y2 xy
2003/04 6.87 2.72 47.2 7.04 18.69
2004/05 3.83 3.02 14.67 9.12 11.57
2005/06 3.26 2.84 10.63 8.07 9.26
2006/07 6.0 2.47 36.00 6.10 14.82
2007/08 8.37 2.01 70.00 4.04 16.82
Total x = 28.33 y = 13.06 x2 = 178.55 y2 = 34.73 xy = 71.16
We have
Co-efficient of correlation (r)
r =2222 )()(
.
yyxx
yxxy
=22 )06.13(73.345)33.28(55.1765
06.1333.2816.715
=56.17065.17357.80275.892
21.14
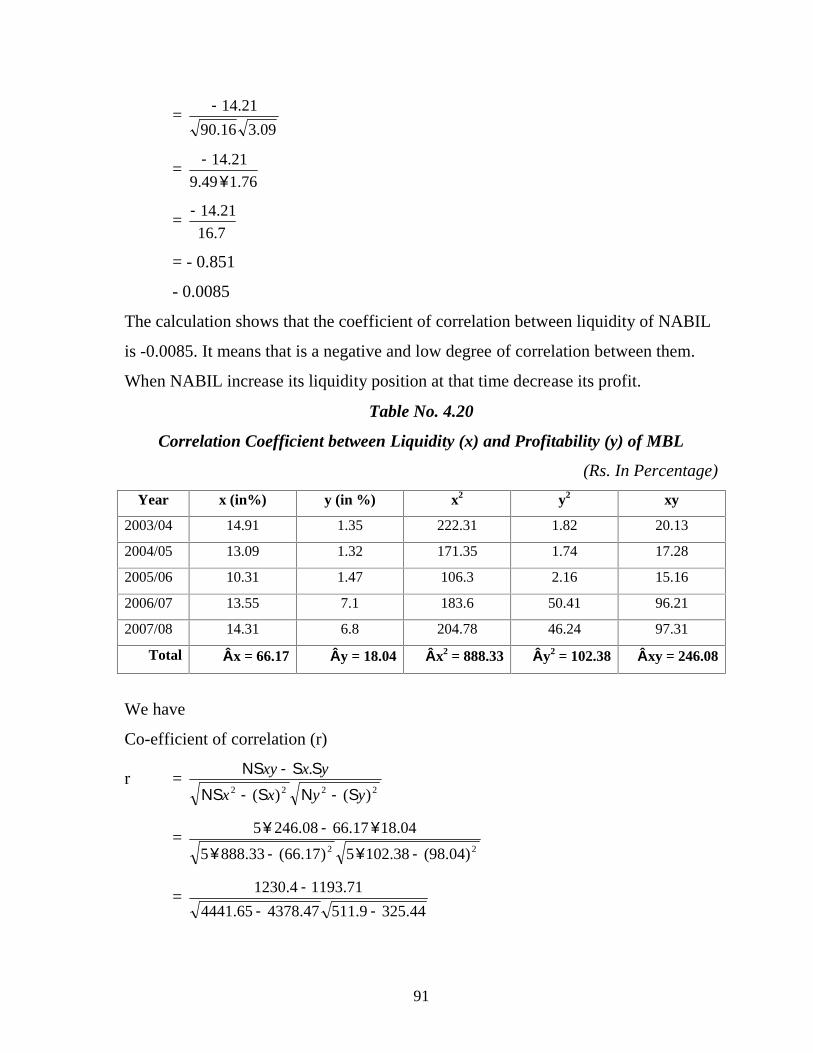
91
=09.316.90
21.14
=76.149.9
21.14
=7.16
21.14
= - 0.851
- 0.0085
The calculation shows that the coefficient of correlation between liquidity of NABIL
is -0.0085. It means that is a negative and low degree of correlation between them.
When NABIL increase its liquidity position at that time decrease its profit.
Table No. 4.20
Correlation Coefficient between Liquidity (x) and Profitability (y) of MBL
(Rs. In Percentage)
Year x (in%) y (in %) x2 y2 xy
2003/04 14.91 1.35 222.31 1.82 20.13
2004/05 13.09 1.32 171.35 1.74 17.28
2005/06 10.31 1.47 106.3 2.16 15.16
2006/07 13.55 7.1 183.6 50.41 96.21
2007/08 14.31 6.8 204.78 46.24 97.31
Total x = 66.17 y = 18.04 x2 = 888.33 y2 = 102.38 xy = 246.08
We have
Co-efficient of correlation (r)
r =2222 )()(
.
yyxx
yxxy
=22 )04.98(38.1025)17.66(33.8885
04.1817.6608.2465
=44.3259.51147.437865.4441
71.11934.1230
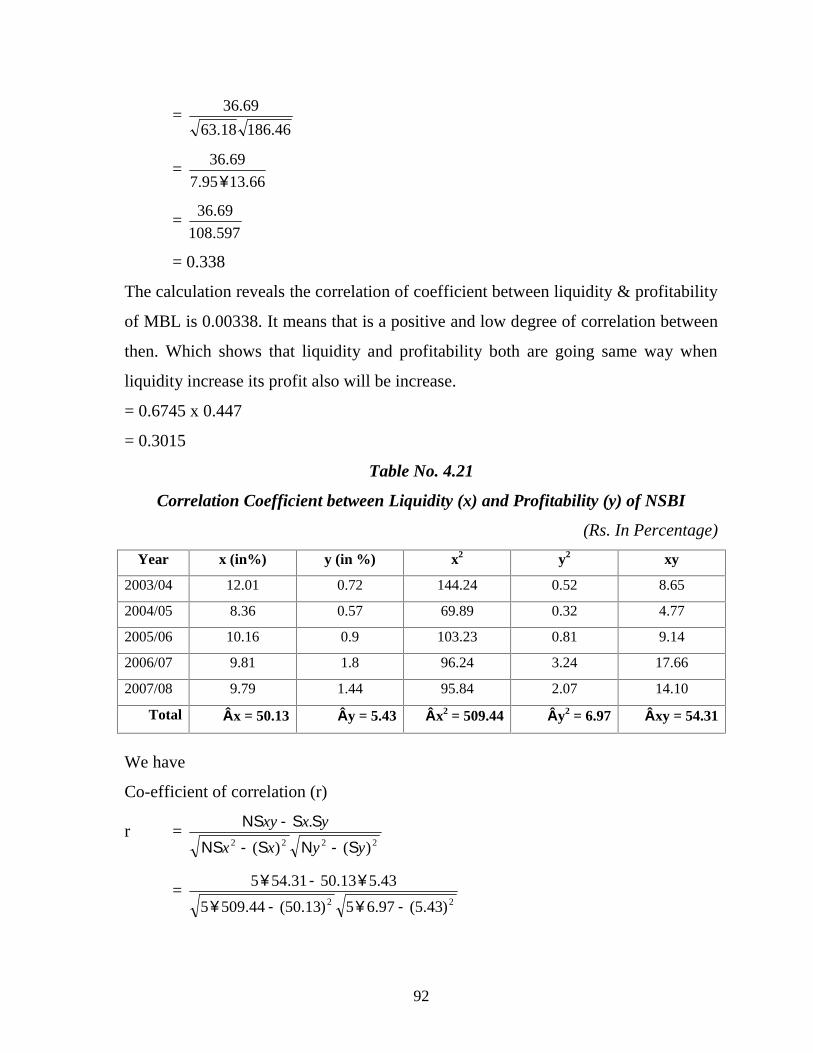
92
=46.18618.63
69.36
=66.1395.7
69.36
=597.108
69.36
= 0.338
The calculation reveals the correlation of coefficient between liquidity & profitability
of MBL is 0.00338. It means that is a positive and low degree of correlation between
then. Which shows that liquidity and profitability both are going same way when
liquidity increase its profit also will be increase.
= 0.6745 x 0.447
= 0.3015
Table No. 4.21
Correlation Coefficient between Liquidity (x) and Profitability (y) of NSBI
(Rs. In Percentage)
Year x (in%) y (in %) x2 y2 xy
2003/04 12.01 0.72 144.24 0.52 8.65
2004/05 8.36 0.57 69.89 0.32 4.77
2005/06 10.16 0.9 103.23 0.81 9.14
2006/07 9.81 1.8 96.24 3.24 17.66
2007/08 9.79 1.44 95.84 2.07 14.10
Total x = 50.13 y = 5.43 x2 = 509.44 y2 = 6.97 xy = 54.31
We have
Co-efficient of correlation (r)
r =2222 )()(
.
yyxx
yxxy
=22 )43.5(97.65)13.50(44.5095
43.513.5031.545
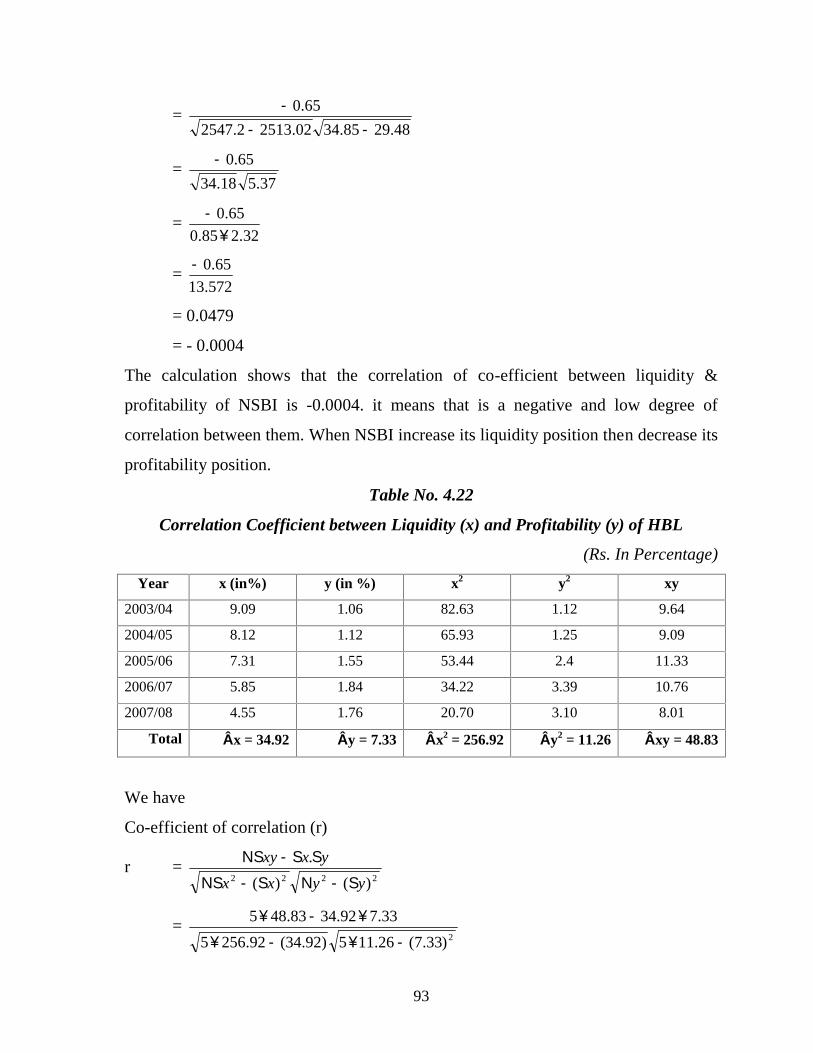
93
=48.2985.3402.25132.2547
65.0
=37.518.34
65.0
=32.285.0
65.0
=572.13
65.0
= 0.0479
= - 0.0004
The calculation shows that the correlation of co-efficient between liquidity &
profitability of NSBI is -0.0004. it means that is a negative and low degree of
correlation between them. When NSBI increase its liquidity position then decrease its
profitability position.
Table No. 4.22
Correlation Coefficient between Liquidity (x) and Profitability (y) of HBL
(Rs. In Percentage)
Year x (in%) y (in %) x2 y2 xy
2003/04 9.09 1.06 82.63 1.12 9.64
2004/05 8.12 1.12 65.93 1.25 9.09
2005/06 7.31 1.55 53.44 2.4 11.33
2006/07 5.85 1.84 34.22 3.39 10.76
2007/08 4.55 1.76 20.70 3.10 8.01
Total x = 34.92 y = 7.33 x2 = 256.92 y2 = 11.26 xy = 48.83
We have
Co-efficient of correlation (r)
r =2222 )()(
.
yyxx
yxxy
=2)33.7(26.115)92.34(92.2565
33.792.3483.485
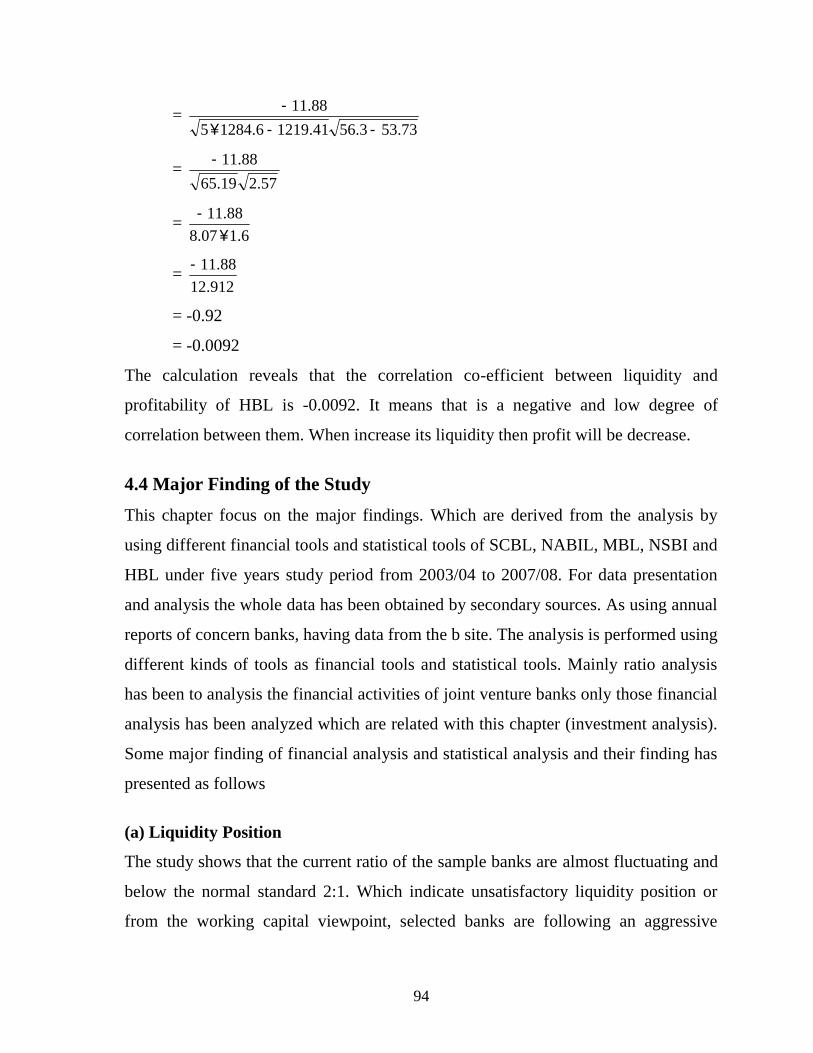
94
=73.533.5641.12196.12845
88.11
=57.219.65
88.11
=6.107.8
88.11
=912.12
88.11
= -0.92
= -0.0092
The calculation reveals that the correlation co-efficient between liquidity and
profitability of HBL is -0.0092. It means that is a negative and low degree of
correlation between them. When increase its liquidity then profit will be decrease.
4.4 Major Finding of the Study
This chapter focus on the major findings. Which are derived from the analysis by
using different financial tools and statistical tools of SCBL, NABIL, MBL, NSBI and
HBL under five years study period from 2003/04 to 2007/08. For data presentation
and analysis the whole data has been obtained by secondary sources. As using annual
reports of concern banks, having data from the b site. The analysis is performed using
different kinds of tools as financial tools and statistical tools. Mainly ratio analysis
has been to analysis the financial activities of joint venture banks only those financial
analysis has been analyzed which are related with this chapter (investment analysis).
Some major finding of financial analysis and statistical analysis and their finding has
presented as follows
(a) Liquidity Position
The study shows that the current ratio of the sample banks are almost fluctuating and
below the normal standard 2:1. Which indicate unsatisfactory liquidity position or
from the working capital viewpoint, selected banks are following an aggressive
95
working capital policy. However, NSBI & MBL have slightly higher ratio and
maintain constant in comparison of other three selected banks. Comparatively the
current assets of the NSBI & MBL only seemed adequate to meet the current
liabilities with their current assets whereas SCBL, NABIL & HBL indicates
unsatisfactory liquidity position as they are in dangerous limit below than 1:1 ratio.
During the reviewed period SCBL, NABIL, NSBI, HBL have the similar trend of
cash & bank balance to total deposit ratio where MBL seems high consistency in
comparison. Though they have less amount of cash and bank balance to total deposit
ratio than MBL cash and bank balance to total deposit ratio shows that MBL have
ability to meet the immediate deposit payment than other selected banks.
Analysis of cash and bank balance to current assets ratio shows that MBL, NSBI &
HBL have highest cash and bank balance as current assets than other banks selected
for the study in the study period. Similarly HBL & NSBI risk is also high which is
shown by the higher standard deviation. Similarly HBL is investing high in
government securities because it is risk free. Loan & Advances to total deposit ratio
of MBL & NSBI respectively is high than other selected banks. Considering the total
investment to total deposit ratio, it can be seen. The ratio of the investment to total
deposit ratio of SCBL, HBL & NABIL is also high but the ratio of the NSBI and
MBL is very low. Calculating of loan & advance to total working fund (Total assets)
ratio shows that MBL, NSBI is high its means these banks are not able to utilize their
total assets efficient. NABIL, HBL & SCBL have low ratio which seems that these
banks are able to utilize their assets.
NABIL invest more part of its investment in share and debenture is comparative too
lower than government securities, so besides giving more priority to investing only
on government securities. HABIL is recommended to mobilize its fund in purchasing
share and debenture of other companies, financial or no financial companies. This
helps to maintain sound portfolio management of the bank. Which will definitely

96
help to decrease the risk factor, on the other hand it help to decrease the risk factor,
on the other hand it help to increase the position of net profit of the bank. NABIL,
HBL, SCBL & MBL invest less part of its investment in share and debenture.
(b) Profitability Conditions
In context of return on capital employed of SCBL, HBL & NABIL are
commendable. It means that the bank is able to generate higher profit to its capital
employed. Though the ratio seems to be okay of MBL & NSBI, but the management
comity must have to take the situation by decreasing the interest expenses and
increasing the net profit.
Return on total assets of NABIL & SCBL is high and consistent but MBL has
fluctuated and HBL & NSBI is low this ratio. So it can concluded that NABIL &
SCBL have efficiently properly utilized their fund in order to profit maximization
whereas MBL, NSBI & HBL have to maintain its ratio and to do hard work to
compete with other banks.
BY Analyzing return on total deposit ratio, NABIL has performed better with high
mean ratio whereas SCB also performed well with consistently. However, MBL,
NSBI & HBL have critical situation due to low mean ratio and it is suggested to do
hard labour to maintain this ratio.
By calculating return on equity of selected commercial banks mean ratio os SCBL
then after NABIL is high which show that these banks earn profit from equity. HBL,
NSBI & MBL have low mean ratio than SCBL & NABIL it means they earn low
profit than other selected commercial banks.
(c) Coefficient of Correlation Analysis
Correlation coefficient between deposit and loan & advance of SCBL, NABIL, MBL,
NSBI & HBL shows the positive relationship of deposit and loan & advance.
Coefficient of correlation between deposit and loan & advances of SCBL, NABIL,
97
MBL, NSBI & HBL are 0.924, 0.989, 0.99, 0.97 & 0.926 respectively. It means there
is a positive and high degree correlation between them. To test the reliability, it is
found that the value of r is more then 6PE. It reveals that the value of ‘r’ is highly
significant i.e., loan and advances will go on same direction of total deposit of the
sample banks.
(d) Calculation of coefficient of correlation between profitability with liquidity
of selected five commercial banks
Here listed each bank’s variables of profitability ratio that represented through cash
& bank balance to total deposit ratio and variable of liquidity ratio represented
through return on total assets. The coefficient of correlation between profitability and
liquidity.
There is a negative and low degree relationship found between profitability ratio and
liquidity ratio. The correlation between profitability and liquidity ratio is -0.0098 of
SCBL a low degree of negative correlation.
According to the coefficient of correlation we can conclude that reverse relationship
between profitability and liquidity ratio. When banks are keeping more liquidity they
earn low profit.
Likewise, there is a negative correlation of -0.0085 a low degree of negative
correlation has been found between profitability & liquidity of NABIL. It means
increase level of liquidity will drags downward the profitability. Similarly, there is a
positive correlation of 0.00338, a low degree of positive correlation has been found
between profitability and liquidity ratio and a very low degree of positive relationship
between them with 0.00338.
In the same way this evaluation shows that there are negative correlation between
profitability & liquidity ratio with -0.0004 which is low degree coefficient of
correlation of NSBI bank.

98
Likewise calculation of coefficient of correlation shows that a negative and low
degree relationship found between profitability and liquidity ratio is -0.0092 of HBL.
99
CHAPTER FIVE
SUMMARY, CONCLUSION AND RECOMMENDATION
This chapter presents summary, conclusion, problem and discrepancies sorted out
during the study period and recommendation derived from the analysis and findings
of the study. Summary of the study and conclusion has been presented in the first
section of the chapter and the second section includes the major findings of the study.
The third section includes recommendations derived from the study and finally fourth
section includes future avenues. The study was conducted to analyze the investment
policy of the commercial banks in Nepal. Similarly the study also tried to explore the
affect of the different financial variables in the investment and explain the trend of
the different financial indicators of the commercial banks in Nepal during the study
period. For this purpose five sample commercial banks were selected for the study
based on five years data range from year 2003/04 to 2007/08.
5.1 Summary
One can understand the whole thesis, what it is about by looking this section. In this
alternating scenario of encouraging secondary market, it is timely to study the
inventions of other factors on investment and implication of the investment in the
market. At present the commercial banks are in increasing trend due to the HMG’s
economic liberalization and open market policy and they are competing for their own
existence in this competing environment. Till the end of the fiscal year 2065/066 26
commercial banks are having transaction with different paid up capital.
Shareholders have a high expectation desire and expectation from investment but
now a day due to the situation the average investment is in decreasing trend and its
growth rate is also decreasing which can be seen in growth r trend of investment in
100
previous chapter. Investment function is very important function of banks because
they are launched for the investment and get expected return. So the study is focused
on the analysis of investment in commercial banks in Nepal. During the study various
books, articles, thesis have been reviewed in national as well as international context
related to the topic of the study. Further various published thesis in the international
era as well as non published master degree dissertation related to the study have also
been reviewed. To make the study more informative as well as productive various
statistical and financial tools have been applied for the data processing procedure
collected from the secondary sources.
In this present context of information and technology generation, financial
institutions are getting high competition. In the context of Nepal the Nepalese
financial system, comprising network of institutions, instruments and markets has
mad rapid progress and acquired a high degree of width and depth since the financial
sector reforms starter. With the umbrella Act of Nepal Rastra Bank all the financial
institutions i.e. public sectors banks, private sector banks, finance companies, foreign
sectors banks and finance companies turns themselves as rivals. As those reforms
have been falls out of the general liberalization of the company. Stiff competitive
challenges have already emerged for the private sector bank from other financial
sectors. Facilities out of facilities they are providing to the customers, the stronger
banks are having stronger while weak bank are declining. So an attempt for
evaluating the financial performance of the commercial JVBs has been made in this
study on its quantitative grounds. The analysis and assumptions presented in this
thesis banks and the researcher could get benefits because financial policies of any
concern are directly or indirectly influenced by the financial performance. Thus it is a
base for a firm’s survival, growth and expansion.
Commercial banks play an important part for economic development of industry,
trade and business by investing the saving collected as deposits from public. They
101
render various services to their customers facilitating their economic and their social
life. They are the most important ingredients for integrated and speedy development
of a country. Therefore a competitive and reliable banking system is essential to
every country to develop.
Investment operation of a commercial bank is very risky one. It is the most important
function among the tree functions (investing, financing and dividend). For this
commercial banks have to pay due consideration while formulating investment
policy. A good investment policy attracts both borrowers and lenders which help to
increase the volumes and quality of deposits loans and investment.
The major sources of income of a bank are interest income from loans and the
investment and fees based on income, loans and advances are stated in the asset side
and income from them in the income statement. Most of the banks failures in the
world are due to the shrinkage in the value of loans and advances. Hence loan is
known as risky asset and investment operation of the commercial bank is very risky
one. Risky of non payment of loan is known as credit risk or default risk. The main
objective of this study to analyze the investment policy of the commercial banks in
Nepal.
5.2 Major Findings
After the observation and analysis of investment analysis of five commercial banks
the researcher has been able to drawn certain conclusions which is called major
finding. The major findings of the study can be depicted as follows:
From the secondary data analysis it is found from the liquidity point of view that
sample banks. Study of investment analysis of commercial banks shows that the
current ratio of the sample banks are almost fluctuating and below the normal
standard 2:1, which indicate unsatisfactory liquidity position or from the working
capital viewpoint, selected banks are following an aggressive working capital

102
policy. However, NSBI & MBL have slightly higher ratio and maintain constant
in comparison of other SCBL, NABIL & MBL. Comparatively the current assets
of the NSBI & MBL only seemed adequate to meet the current liabilities with
their current assets whereas SCBL, NABIL & HBL indicate unsatisfactory
liquidity position as they are in dangerous limit below than 1:1 ratio.
Cash & bank balance to total deposit ratio of MBL is highest. It shows that MBL
have ability to meet the immediate deposit payment than other selected banks.
SCBL, NABIL, NSBI & HBL have the similar trend of cash and bank balance to
total deposit ratio. They have les amount of cash & bank balance to total deposit
ratio than MBL.
During the reviewed period cash & bank balance to total assets ratio reveals that
MBL, NSBI & HBL have highest cash and bank balance as current assets than
other selected banks.
In the study period HBL is investing high in government securities because it is
risk free.
Loan & Advance to total deposit ratio of MBL & NSBI respectively high than
other selected banks. The highest loan & advances to total deposit ratio indicated
less effective mobilization of credit resources. SCBL, NABIL, HBL are
effectively mobilize their credit because they have low ratio of loan and advance
to total deposit ratio.
In context of total investment to total deposit ratio, SCBL, HBL & NABIL is
found highest among others and in increasing rate with passing year. NSBI &
MBL have total investment to total deposit ratio is low.
SCBL CV shows a highest consistency ratio than other, which follows by HBL,
NABIL, NSBI & MBL respectively. It shows that these banks are interested to
invest the higher rate of deposit in the non-risky assets.
103
Calculated of loan and advance to total working fund (Total Assets) seems that
MBL & NSBI is high it means these banks are not able to utilize their total assets
efficiently and NABIL, HBL & SCBL have low ratio which seems that these
banks are successful to utilize their assets.
NABIL invest more part of its investment in share and debenture is comparative
too lower than government securities, so besides giving more priority to investing
only one government securities. NABIL is recommended to mobilized its fund in
purchasing share and debenture of other companies, financial or no financial
companies. This helps maintain sound portfolio management of the bank. Which
is definitely help to decrease the risk factor, on the other hand it helps to increase
the position of net profit of the bank. NSBI, HBL, SCBL & MBL respectively
invest less part of its investment in share and debenture.
In the context of return on capital employed of SCBL, HBL & NABIL are
commendable. It means that the bank is able to generate higher profit to its capital
employed. Though the ratio seems to be okay of MBL & NSBI, but the
management committee must have to take the situation by decreasing the interest
expenses and increasing the net profit.
Return on total assets of NABIL & SCBL is high and consistent but MBL has
fluctuated and HBL & NSBI is low this ratio. So it can concluded that NABIL &
SCBL have efficiently properly utilized their fund in order to profit maximization
whereas MBL, NSBI & HBL have to maintain its ratio and to do hard work to
compete with other banks.
By analyzing return on total deposit ratio, NABIL has performed better with high
mean ratio whereas SCBL also performed good with consistency. However,
MBL, NSBI & HBL have critical situation due to low mean ratio and it is
suggested to do hard labour to maintain this ratio.
By calculating return on equity of selected commercial banks mean ratio of SCBL
then after NABIL is high which shows that these banks earn profit from equity.
104
HBL, NSBI & MBL have low mean ratio than SCBL & NABIL. It means they
earn low profit than other selected commercial banks.
Correlation coefficient between deposit and loan & advance of SCBL, NABIL,
MBL, NSBI & HBL reveals, the positive relationship of deposit and loan &
advance coefficient of correlation between deposit and loan & advances of SCBL,
NABIL, HBL, NSBI & HBL are 0.924, 0.989, 0.99, 0.97 & 0.926 respectively. It
means there is a positive and high degree correlation between them. To test the
reliability, it is found that the value of r is more then 6 PE. It is reveals that the
value of ‘r’ is highly significant i.e. loan and advance will go on same direction of
total deposit of the sample banks.
There is a negative and low degree relationship found between profitability ratio
& liquidity ratio. The correlation between profitability ratio & liquidity ratio is -
0.0098 of SCBL, a low degree of negative correlation according to the coefficient
of correlation we can conclude that reverse relationship between profitability &
liquidity ratio. When banks are keeping more liquidity they earn profit.
Likewise, there is a negative correlation of -0.0085, a low degree of negative
correlation has been found profitability and liquidity of NABIL. It means increase
level of liquidity will drags downward, the profitability.
Similarly, there is a positive correlation of 0.00338, low degree of positive
correlation has been found between profitability and liquidity ratio of MBL and a
very low degree of positive relationship between them with 0.00338.
In the same way this evaluation seems that there are negative correlation between
profitability and liquidity ratio with -0.0004 which is low degree coefficient of
correlation of NSBI bank.
Likewise, calculation of coefficient of correlation shows that negative and low
degree relationship found between profitability and liquidity ratio is -0.0092 of
HBL.
105
5.3 Conclusion
Researcher found certain conclusions after the observation and analysis of investment
analysis of selected commercial banks. After analyzing the different financial ratio,
the liquidity position of NSBI & MBL seem in average position in comparison with
SCBL, NABIL & HBL. Cash and bank balance to total deposit ratio of MBL is
highest than other selected banks. It means MBL have ability to meet the immediate
deposit payment than other selected banks. MBL, NSBI & HBL have highest cash
and bank balance to total assets ratio than other selected banks. In the study period
HBL seems strong position to invest on government securities. Similarly the loan &
advance to total deposit ratio of SCBL, NABIL & HBL have lower then MBL &
NSBI lower ratio of loan and advance to total deposit ratio means effectively
mobilize their credit. MBL & NSBI reveals in weak condition to mobilize its total
working fund (total assets) on loan and advance in comparing with other selected
banks. In content of total investment to total deposit ratio, SCBL, HBL & NABIL is
found highest among others selected banks NSBI, HBL, SCBL & MBL respectively
invest less part of its investment in share and debenture but NABIL invest more part
of it. In the context of return on capital employed of SCBL, HBL & NABIL are able
to generate higher profit to its capital employed. Though the ratio seems to be okay
of MBL & NSBI. Return on total assets of NABIL & SCBL is high it means they
have efficiently properly utilized their fund in order to profit maximization whereas
MBL, NSBI & HBL have to maintain its ratio. By calculating return on total deposit
ratio, NABIL has performed better whereas SCBL also performed good but MBL,
NSBI & HBL have critical situation due to low mean ratio. By analyzing return on
equity of HBL, NSBI & MBL have low mean ratio than SCBL & NABIL low ratio
shows earn low profit from equity. Correlation coefficient between deposit and loan
& advance of SCBL, NABIL, MBL, NSBI & HBL reveals that positive and high
degree correlation between them. Loan and advance will go on same direction of
total deposit of the sample banks. There is a negative and low degree relationship
found between profitability ratio & liquidity ratio. According to the coefficient of
106
correlation we can conclude that reverse relationship between profitability &
liquidity ratio. When banks are keeping more liquidity they earn profit. Likewise,
NABIL, NSBI & HBL have negative and low degree correlation coefficient
relationship between profitability and liquidity ratio. But there is a low degree of
positive correlation has been found between profitability and liquidity ratio of MBL.
5.4 Recommendation
The recommendations for future guidelines are presented have in accordance with the
observed, major finding and perceived problems. Although, these suggestion may no
be adequate and could give negative reflection, but it is hoped that these suggestions
will help improving their performance these suggestions may also have repercussion
but there is no doubt of these measure to improve the existing condition of the banks
in Nepal. The suggestion are explained as follows-
1. A clear and definite investment policy should be formulated for the consistent,
stable and satisfied level of investment. Proper investment analysis is must for the
enhancement of the nation’s economy. Therefore, the government should act in
favors of investors and bind the companies by the distinct rules regarding
investment analysis.
2. In Nepalese context, most of the investors are investing their funds haphazardly
and without analyzing the profit ability of the business. Therefore, there should be
such type of body that helps to educate the shareholders about the investment
theory i.e. investment has positive relation with the profitability.
3. The current ratio of the sample banks did not meet the standard. The major
reasons for the lower current ratio may be due to declining values or utilizing the
funds for some profit generating projects. The banks should perform revaluation
of their current assets or cut down their investment in some projects.
4. The liquidity of bank may be affected by external as well as internal factors such
as the prevailing interest rates, supply and demand position of loan, saving to
investment situations, central bank’s requirements and position of the financial

107
market. The cash and bank balance to total deposit of mean in SCBL, HBL &
NABIL were lower than that of MBL & NSBI. Hence, it is recommended that
SCBL, HBL & NABIL should increase cash and bank balance to meet its deposit
demands.
5. SCBL should more serious to improve to efficiency in utilizing the loan advances
for generating the profits. Likewise the HBL, NABIL, NSBI & MBL should keep
up their assets decentralize and search new area of investment instead of getting
aggressive in only the risky area of loan advances.
6. HBL, NABIL, NSBI & MBL are showing aggressive and spontaneously
increasing loan & advances facilities so it is suggested to updated its position and
strength spontaneously with the increasing new facilities and services provided by
their competitors banks and search for new areas for investment.
7. SCBL is more sensitive in investment in productive sector than HBL, NSBI,
NABIL and MBL. In this case, SCBL seems stronger in investing fund in
government securities than other selected banks.
8. MBL is not used more parts of its assets in loan & advance than SCBL, HBL,
NABIL & NSBI besides giving more priority to invest in other sector bank should
mobilized its fund on the sound portfolio management and bank is recommended
to follow the liberal landing policy in loan & advance. In this way bank can
increase the net profit to future.
9. Profit is essential for the survival and growth of the banks and also a
psychological impact on the shareholders and investors. It present how the
resource of the banks are being utilized for the betterment of the owner’s interest
but over the study period, the sample banks profitable ratio are not in satisfactory
level. If resource hold idles, banks have to bear more cost & result would be
lower profit margin. All of the banks recommended more to earn operational
profit either by increasing their operational efficiency or by decreasing their
operational expenses as far as possible and also concerning that there is inverse
relationship of profitable with liquidity ratio.
108
10. Dividends are the returns paid to stockholders for the use their funds by the
company and the reward of risky taken by them. There seems no any clear-cut
dividend policy of the banks. Some banks are paying unusually where some have
fluctuating pay out ratio. So a suggestion has been forwarded to maintain a
minimum standard although what is a minimum standard may a matter of dispute
and controversial issue as an ideal dividend payout ratio is based upon
shareholder’s expectation and growth requirement of the banks.
11. As social institutions living and operating in the society and for the society,
commercial banks have social responsibilities. But most of the commercial banks
are found to be centralized in the urban areas ignoring the social responsibilities.
Therefore these banks are recommended and suggested to expand their banking
services in rural areas providing special loans to the deprived and priority sectors.
12. It is suggested that the selected banks should use well-trained personnel. Well-
trained personnel will provide better services to the bank and people. This will
increase the operating efficiency of the banks.
13. The commercial banks are recommended to formulate and implement some sound
and effective financial and non-financial strategies to meet required level of
opportunity as well as social responsibility.
14. The banks control their expe.. especially those, which are unnecessary, and a
burden for the banks. The bank must formulate a strategy to control expenses
using modern banking technology, computer networking, expert advisors and
well trained personnel.
Finally, commercial banks are recommended to diversity its business thought
creating opportunities to provide foreign employment loans, personal loan and
educational loan and so on, which bank is not entertaining at the moment. These
loans specified above will definitely boost the economy and create opportunities
of the citizens of Nepal. Likewise, most of the commercial banks have national
and international links and they can encourage multinational companies to invest
109
in Nepal, because these companies are unfamiliar with local rule and regulation.
Foreign investment will definitely create more employment and will ultimately
help the over-all development of the country. And it is found that modern banking
technologies followed by JVBs in Nepal are mostly beneficial to high level
depositors. So the sample banks are suggested here to make these technologies
accessible to their all kind of depositors as far as possible.
5.5 Future Avenues
There are several future avenues for the future searcher in the area of investment
analysis of commercial bank in Nepal. Commercial banks are increasing in the
Nepalese content. Mainly most of the people have craze of investment toward
banking and financial sector. For the economic development of the country the
researchers need to study periodically about the investment of commercial bank.
Finding of all present researcher can be seen a meaningful and valuable piece of
work for academician, practitioners, researchers and investors. All the bankers and
businessman can find very important findings from this study so that they can follow
new strategy in future but researchers still can further explore many more are relating
the investment analysis of commercial banks. But the area, which the study has
attempted to explore, is very wide. This study doesn’t even cover a small pinch. A
wide area has still been neglected where further researcher can concentrate on
There are various areas for the study of investment analysis, which seems to be
studies in future.
1. For the future researcher is that the researcher can get greater insight in analyzing
the investment by expanding the study period and the number of enterprises.
2. Future efforts can improve upon this work by importing new data in many years
and adopting more satisfactory method of estimation.
3. The same topic could be carried forward taking into account the entire available
commercial banks listed in Nepal stock exchange.

110
4. An extension of the present study to test the investment portfolio measure using
the different measure like Sharpe’s measure and other measures in order to see
the investment sector of the banks and suggest them to fragment their investment
more efficiently and to minimize the risk.
5. Avenue of research is to survey the opinions of financial executives on
investment in Nepal. Finally, a direction of future research is to conduct the
household survey on investment in Nepal.

111
BIBLIOGRAPHY
Annual Reports (2003/04 to 2007/08) of SCBL, NABIL, HBL & MBL.”
Bajracharya Bodhi B. (1990), “Monetary policy and Deposit Mobilization in
Nepal.” An unpublished master level thesis, T.U., Shankar Dev Campus.
Bajarcharya B.C. (2065), “Research Methodology.” Mk Publishers & Distributors
Ktm.
Brigham Eugene F. and Houstan Joel F. (2001), “Fundamentals of Financial
Management.” Harecourt Asia Pte. Ltd. New Delhi, 9th Edition.
CRAB PETER R. (2003). “Finance and Investment using the wall street Journal.”
MC Graw Hill’s Publications, New York
Dongol Ratman and Prajapati Keshv (2059), “Accounting Analysis and Planning.”Taleju Prakashan, Kathmandu.
Dhungana Pramod (1994), “A Study of the Joint Venture Bank’s Profitability.” An
unpublished Master Degree’s Dissertation, T.U., Kantipur.
Francis. J.C. (1992) “Investment: Analysis and management.” The Dryden press
Yew York.
Ghimire Pravakar (1999), “Banijya Bank Haru Prathamikta Chhetra ma Lagani
Garna Bhanda Harjana Tirna Tayar.”
Giles G.B. Marking.
112
James C Van Horne, “Financial Management and Policy” Prentice Hall of India
Ltd. New Delhi, 11th Edition.
Kothari C.R. (1986), “Research Methodology, Method and Techniques” Wishwa
Prakashan New Delhi.
Khan, M.Y and Jain P.K, “Financial Management.” New Delhi, Tata McGraw- Hill
Publishing Company Ltd.
Meigns, W.B., Intermediate Accounting, (New York), McGraw-Hill 1978.
Ojha Kamal (1997), “A Study on priority Sector Investmetn in Banks.” An
unpublished master degree’s dissertation, T.U., Kritipur.
Pandey Deepa (2006), “Investment Analysis of the Commercial Banks in Nepal.”
An unpublished Master level thesis, Bhairahawa.
Panta Uttam (1996), “A Study of Banks Deposits and its Utilization.” An
unpublished master level thesis, T.U., Kritipur.
Pradhan M.N. (1998), “A Study on investment policy of Nepal Bank Ltd.” an
unpublished master degree’s dissertation, T.U., Kritipur.
Pradhan K. (1991), “Nepal ma Banijaya Bank Upalabdhi Tatha Chunauti.” An
unpublished master level thesis, T.U., Kritipur.
Pandey J.M. (1991), “Financial Management” Vikash Publication House Pvt. Ltd,
New Delhi.
113
Regmi Hari Prasad (2064), “Problem Banks and corporate Governance.” Arthik
Mimansa, Nepal Bittiya Sanstha Karmachari Sangh, NRB.
Singh Anjali (2007), “Investment Policy of Commercial Bank in Nepal.” An
unpublished master level thesis, Bhairahawa Multiple Campus, Bhairahawa.
Sapkota Gita (2008), “A Comparative Study of Financial Performance of Selected
Commercial Banks in Nepal.” An unpublished master degree’s thesis, Bhairahawa
Multiple Campus, Bhairahawa.
Shrestha Sunity (1993), “Investment Planning of Commercial Bank in Nepal.” PhD
Thesis, University of Delhi.
Sharp D. William F Gordon J. Alexander, Jeffer V. Valley, (1996), “Investment
Analysis and Management.” Prentice-Hall of India, New, Delhi.
Sharp and Others (1990), “Investment.” Prentice-Hall of India, New Delhi.
Shrestha Shivraj (1998), “Portfolio Management in Bank Theory and Practices.”
An unpublished master level Dissertation, Shankar Dev Campus.
Sharma Murari R. (1998), “Joint-Venture Banks in Nepal, Co-existing or crowing
out.”
Scort Harrigon and Greg Neichaus (2003), “Risk Management and Insurance
Review.”
Saravanavel P. (1990) “Research Methodology.” Allahabad, Kitab Mahal.

114
Upadhyay Basant (2006), “Financial performance of Joint Venture Commercial
Banks in Nepal.” An unpublished master level thesis, Bhairahawa Multiple Campus,
Bhairahawa.
Websites
www.nrb.com
www.riskgloosary.com
www.google.com
www.answer.com