soundness indicators for deposit takers - imf elibrary
TRANSCRIPT
7 Specification of Core Financial Soundness Indicators for Deposit Takers
I. Introduction7.1 This chapter brings together the concepts and
definitions set out so far, to explain how core financial soundness indicators (FSIs) for deposit takers (DTs) are to be calculated.1 The accounting principles and calculation methods for core FSIs presented in this chapter also apply to the additional FSIs for DTs. The availability of data reported to supervisory agencies will determine the scope of the data that can be com‑piled and disseminated.
7.2 For most of the FSIs, the Guide recommends that the data series be drawn from sectoral financial state‑ments. For each reporting DT group, data need to be com‑piled on a consolidated basis as described in Chapter 6.2
Accounting Principles
7.3 The accounting principles are discussed in Chapter 4. Except where otherwise noted, the follow‑ing principles should be applied when compiling the underlying series used to calculate FSIs:
• Transactions and positions should be recorded on an accrual basis, and only existing actual as‑sets and liabilities should be recognized (para‑graphs 4.10–4.13).
• Valuation methods should provide the most real‑istic assessment at any moment in time of the value of an instrument or item. Market value is the preferred basis of valuation of transactions, as well as for positions in traded securities. For
positions in instruments not designated for trading or available for sale,3 the Guide defers to International Financial Reporting Standards (IFRSs).
• Provisions for loan losses comprise specific pro‑visions created to cover identified non‑performing loans.4
• Transactions and positions in foreign currency should be converted into a single unit of account using the market exchange rate (see paragraphs 4.53–4.55).
• Short‑term maturity is defined as three months or less (or payable on demand), (see paragraph 5.93).
Underlying Series
7.4 The underlying series to be used in calculating individual FSIs are defined in Chapter 5. In describing the FSIs, some brief illustrations of the underlying series are introduced, together with cross‑references to the more detailed definitions provided in earlier chapters. In this, and subsequent chapters, reference is regularly made to the financial statements presented in Chapter 5.
7.5 As presented in the Guide, FSIs are compiled at an aggregated sector level and constructed as ratios where numerator and denominator are the sum of each DT group’s underlying series. As such, they repre‑sent weighted averages for the whole financial system.5
1 Some countries may also benefit from EBA Guidance Note on Compiling the IMF Financial Soundness Indicators for ‘Deposit‐Takers’ using the ITS on Supervisory Reporting, https://eba.europa.eu/documents/10180/1460270/EBA+Guidance+Note+on+compiling+IMF+FSIs+%28July+2018+update%29.pdf/d2e22fc2‑6602‑4dd0‑ad45‑a914955f6883.2 The consolidation adjustments performed within the reporting groups will depend on the consolidation basis used to compile FSIs (see Chapter 6).
3 In the terminology of the IFRS 9, these are instruments held to collect their contractual cash flows.4 Specific provisions are a memorandum series derived from the IFRS 9 calculation of expected credit loss (ECL), with the loan loss allowance allocated to specific provisions and general provisions in line with national supervisory guidance as described in Chapter 4. See BCBC Regulatory treatment of accounting provisions—interim approach and transitional arrangements (March 2017). 5 The same FSIs recommended in the Guide for the whole sector can be compiled at the individual group level to support banking supervision.
©International Monetary Fund. Not for Redistribution
Specification of Core Financial Soundness Indicators for Deposit Takers 85
Calculation of FSIs
7.6 Most FSIs consist of ratios of two underlying series. The calculation should use data with the same periodicity for both the numerator and the denomi‑nator, which, depending on the ratio being calculated, should be either flows recognized during the period, end‑period, or average period positions.
7.7 The definitions underlying data series may dif‑fer across countries. Countries may also follow differ‑ent conventions than those set out in the Guide. For transparency and cross‑country comparability, the dissemination of FSI data should be accompanied of extensive metadata.
II. Core FSIs for DTs7.8 The Guide recommends the compilation of 17
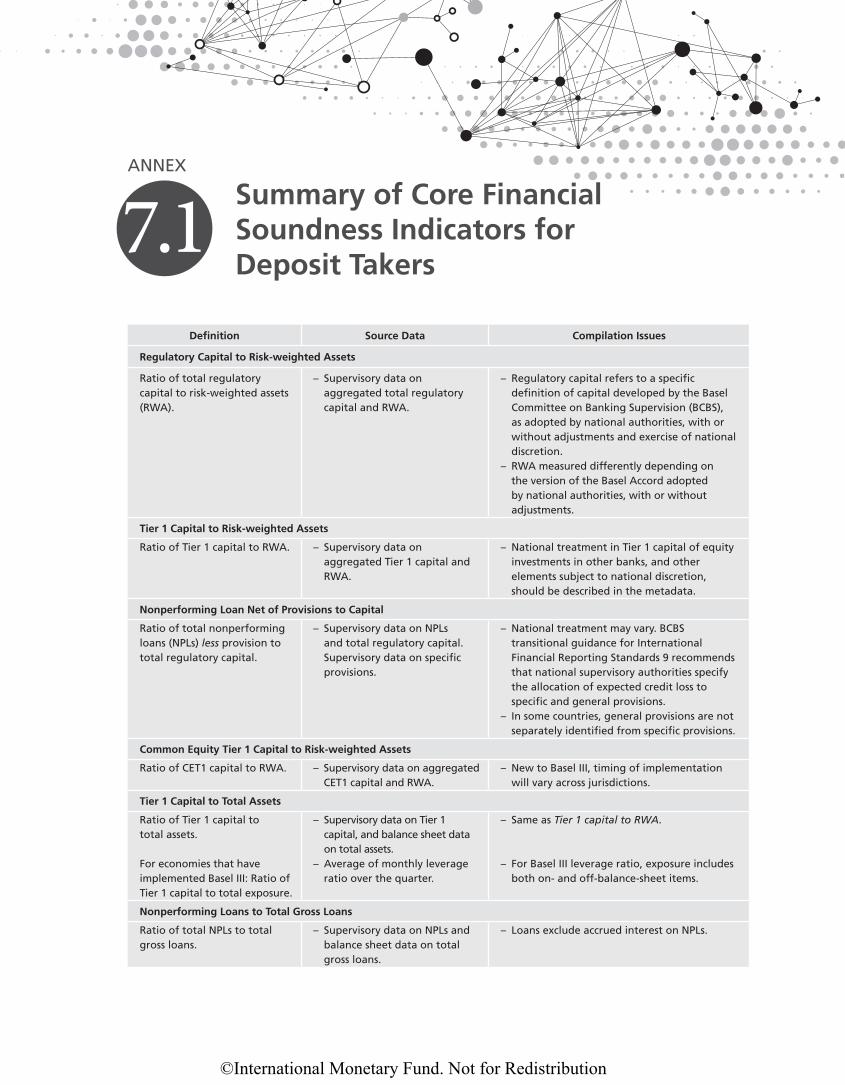
core FSIs for DTs (Table 1.1 of Chapter 1), which is a minimum set covering the most critical measures of financial soundness. However, for a more comprehen‑sive assessment of the health of the financial sector, they should be complemented with additional FSIs, including for other sectors of the economy.6 Unless otherwise stated, all the “line” comments in this chap‑ter refer to the financial statements and memorandum items of Table 5.1 in Chapter 5. Annex 7.1 summa‑rizes the concepts, calculation methods, source data, and compilation issues of the core FSIs for DTs.7
Regulatory Capital to Risk-Weighted Assets
7.9 The FSI Regulatory capital to risk‑weighted assets gauges DTs’ capital strength to withstand shocks and absorb unexpected losses. This FSI is based, as described in Chapter 3, on the definitions of total regulatory capital (line 39) and risk‑weighted assets (RWA) (line 40).
7.10 Compilers will rely on national supervisory defi‑nitions of the components of capital and specification of risk weights. The metadata should identify: (i) which ver‑sion of the Basel Capital Accord has been implemented in the jurisdiction; (ii) use, if any, of the various elements
of national discretion in the Basel standards; and (iii) any variations from the applicable Basel standard (other than specified elements of national discretion).
7.11 This FSI is a ratio where the numerator is total regulatory capital and the denominator is on‑ and off‑balance‑sheet assets weighted by risk. Total regulatory capital and RWA are defined in paragraphs 5.75–5.81 and paragraph 5.82, respectively, and use regulatory standards and concepts that do not corre‑spond directly to balance sheet capital and assets.
7.12 Regulatory capital refers to a supervisory def‑inition of capital developed by the Basel Committee on Banking Supervision (BCBS) and differs from account‑ing capital and reserve items. Current year results gen‑erally are excluded, while undisclosed reserves and valuation adjustments can be included in supplemen‑tary regulatory capital subject to specified restrictions. Goodwill, which is implicitly included in balance sheet capital, is deducted from regulatory capital. In addition, the definition adds several specified types of subordi‑nated debt instruments that meet specified restrictions, as well as general provisions up to prescribed limits. Supervisory deductions are applied to the different components of regulatory capital, netting from its total. For a detailed treatment of the elements that constitute regulatory capital, see Chapter 3.
7.13 RWA refers to the DT’s risk‑weighted assets (for credit, market and operational risks) and off‑ balance‑sheet exposures. The adopted regulatory framework (Basel I, II, or III) determines the specific way of calculating RWA. Basel I adopted a straightfor‑ward and simple way of weighting the assets with five pre defined factors for credit risk. Basel II introduced additional factors and some revised risk weighting in the Standardized Approach as well as advanced approaches that measure risk based on internal mod‑els. Basel III introduced a more granular approach to risk weights and alternatives to the use of external rat‑ings in the Standardized Approach.
7.14 The BCBS has prescribed minimum regu‑latory capital of 8 percent of RWA for all interna‑tionally active banks. Basel III effectively raises this minimum to 10.5 percent through the introduc‑tion of the 2.5 percent capital conservation buffer. National supervisors may require a higher ratio and have leeway in establishing the specific standards for their economies.
6 These additional FSIs are presented in Chapters 8, 9, and 10.7Annex 7.4 describes the business model of Islamic Deposit Takers and provides guidance on how to map the financial information from the Islamic Deposit Takers’ income statement and balance sheet to those of DTs to assist in the compilation of system FSIs for countries with dual DT systems.
©International Monetary Fund. Not for Redistribution
Financial Soundness Indicators Compilation Guide86
7.15 As with other FSIs, when analyzing this indicator, it is important to consider how numera‑tor and denominator affect its value. A higher capital adequacy ratio can be achieved either by increasing the amount of capital, or by reducing RWA, which can be done by restructuring the portfolio toward less risky assets, for example, by reducing lending and increasing holdings of low risk‑weight securities (see Box 7.1).
Tier 1 Capital to Risk-Weighted Assets
7.16 The FSI Tier 1 capital to RWA focuses on the core capital concept of the BCBS. Tier 1 capital is the most solid and readily available layer of regu‑latory capital, as it is considered permanent and absorbs losses by ranking last in the hierarchy of claims in the event of insolvency. Compared to the
regulatory capital to RWA ratio, this FSI measures the most freely and immediately available resources to absorb losses.
7.17 This FSI is a ratio where the numerator is Tier 1 capital and the denominator is RWA. The concepts of Tier 1 capital (line 33) and RWA (line 40) are defined in paragraphs 5.76, 5.77, and paragraph 5.82, respec‑tively, and are derived from regulatory standards and concepts that do not correspond directly to capital and assets shown in the balance sheet. Under Basel I and II, the minimum Tier 1 requirement is 4 percent of RWA, while Basel III increased it to 6 percent.
7.18 Source data are consolidated Tier 1 capi‑tal and consolidated RWA of each DT group in the reporting population. Data are based on supervisory concepts. The metadata provided should describe the
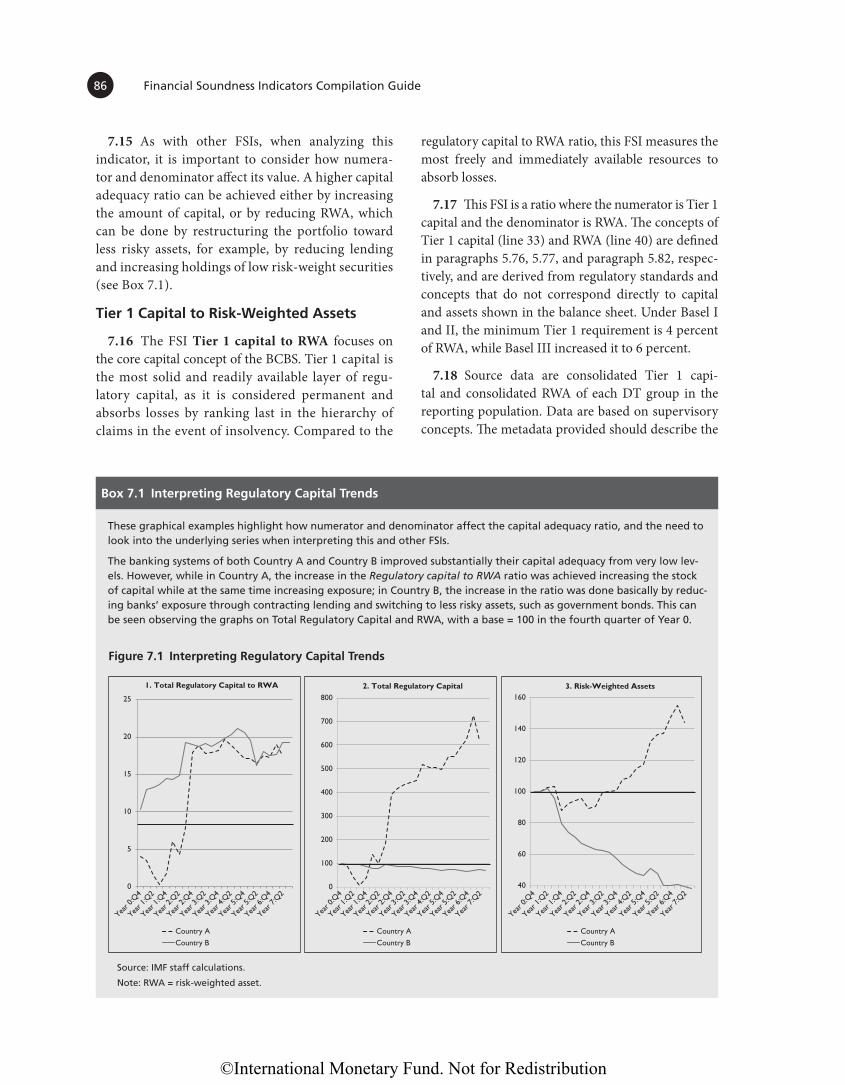
Box 7.1 Interpreting Regulatory Capital Trends
These graphical examples highlight how numerator and denominator affect the capital adequacy ratio, and the need to look into the underlying series when interpreting this and other FSIs.
The banking systems of both Country A and Country B improved substantially their capital adequacy from very low lev-els. However, while in Country A, the increase in the Regulatory capital to RWA ratio was achieved increasing the stock of capital while at the same time increasing exposure; in Country B, the increase in the ratio was done basically by reduc-ing banks’ exposure through contracting lending and switching to less risky assets, such as government bonds. This can be seen observing the graphs on Total Regulatory Capital and RWA, with a base = 100 in the fourth quarter of Year 0.
0
Year 0
:Q4
Year 1
:Q2
Year 1
:Q4
Year 2
:Q2
Year 2
:Q4
Year 3
:Q2
Year 3
:Q4
Year 4
:Q2
Year 5
:Q4
Year 5
:Q2
Year 6
:Q4
Year 7
:Q2
Year 0
:Q4
Year 1
:Q2
Year 1
:Q4
Year 2
:Q2
Year 2
:Q4
Year 3
:Q2
Year 3
:Q4
Year 4
:Q2
Year 5
:Q4
Year 5
:Q2
Year 6
:Q4
Year 7
:Q2
Year 0
:Q4
Year 1
:Q2
Year 1
:Q4
Year 2
:Q2
Year 2
:Q4
Year 3
:Q2
Year 3
:Q4
Year 4
:Q2
Year 5
:Q4
Year 5
:Q2
Year 6
:Q4
Year 7
:Q2
5
10
15
20
25
Country A
Country B
1. Total Regulatory Capital to RWA
0
100
200
300
400
500
600
700
800
Country A
Country B
2. Total Regulatory Capital
40
60
80
100
120
140
160
Country A
Country B
3. Risk-Weighted Assets
Source: IMF staff calculations.
Note: RWA = risk-weighted asset.
Figure 7.1 Interpreting Regulatory Capital Trends
©International Monetary Fund. Not for Redistribution
Specification of Core Financial Soundness Indicators for Deposit Takers 87
national treatment in Tier 1 capital of equity invest‑ments in other banks, other financial institutions, and insurance corporations; since under the BCBS, such investments may be excluded from Tier 1 capital at the discretion of the national authorities. Metadata should also indicate other elements of national dis‑cretion and any variations, other than elements of national discretion, from the version of the capital accord applied in the jurisdiction.
Common Equity Tier 1 Capital to Risk-Weighted Assets
7.19 The FSI Common equity Tier 1 (CET1) capi‑tal to RWA measures the capital adequacy of DTs based on the highest‑quality capital defined by Basel III, Common Equity Tier 1 (CET1).8 Countries that have not adopted Basel III are not required to compile this indicator. CET1 (which, together with additional tier 1 capital [AT1] is referred as “going‑concern capi‑tal”) is the most loss‑absorbing form of capital. It is a measure of the amount of capital available to a bank to absorb losses while continuing operations.
7.20 This FSI is a ratio where the numerator is CET1 capital and the denominator is RWA. The con‑cepts of CET1 capital (line 34) and RWA (line 40) are explained in paragraphs 3.27 and 3.32–3.35, and defined in paragraphs 5.77 and 5.82. They follow regulatory standards and concepts and do not corre‑spond directly to capital and assets shown in the bal‑ance sheet.
7.21 As specified in Chapter 3, Basel III splits Tier 1 capital into two components: (1) CET1 and (2) AT1. CET1 capital consists predominantly of common shares issued by the bank, stock surplus, retained earnings, and accumulated other compre‑hensive income and other disclosed reserves. AT1 capital consists of instruments that are subordinated, have fully discretionary non‑cumulative dividends or coupons, and have neither a maturity date nor an incentive to redeem. Basel III established a minimum of 4.5 percent for the CET1 to RWA ratio.
7.22 Source data, based on supervisory concepts, are the consolidated CET 1 capital and the con‑solidated RWA of each DT group in the reporting population.
Tier 1 Capital to Assets and the Basel III Leverage Ratio
7.23 The FSI Tier 1 capital to assets provides an indication of financial leverage that is, the extent to which assets are funded by other than own funds. It is another measure of capital adequacy of the DT sector. This ratio serves as a supplementary measure to the risk‑based capital requirements. An adverse trend in the ratio may signal increased exposure to risk and possible capital adequacy problems.
7.24 This FSI is calculated by using Tier 1 capital as numerator, and total (nonfinancial and financial) balance sheet assets—without risk weighting—as denominator. Unweighted assets are used in this ratio to provide insights into leverage. The concepts of Tier 1 capital (line 33) and total assets (line 14) are defined in paragraphs 5.76 and 5.77 and paragraphs 5.33–5.35, respectively.9
7.25 For jurisdictions that have implemented Basel III, this indicator would be calculated using the new Basel III leverage ratio, defined in para‑graph 3.46. In this ratio, the capital measure for the numerator is Tier 1 capital. The denominator com‑prises a new Basel III aggregate called “exposure” consists of all balance sheet assets (with an add on for potential future exposures of derivatives and securities financing transactions) and off‑balance‑sheet exposures (Supervisory‑based memorandum series).10 Off‑balance‑sheet exposures include com‑mitments, unconditionally cancellable commit‑ments, direct credit substitutes, acceptances, stand by letter of credit, trade letters of credit, failed transactions, and unsettled securities. Items that are deducted from capital are also deducted from the measure of exposure.
7.26 Regarding Tier 1 capital, source data and issues for compilers are discussed in the regulatory Tier 1 capital to RWA section. Data on total (finan‑cial and nonfinancial) assets are available from DTs’ balance sheets. The capital measure required by the Basel III leverage ratio can be obtained from super‑visory sources.
8 See Chapter 3, paragraphs 3.25–3.31.
9 The 2006 Guide recommended to use balance sheet capital as numerator. This option is eliminated.10 See paragraph 3.46.
©International Monetary Fund. Not for Redistribution
Financial Soundness Indicators Compilation Guide88
Nonperforming Loans Net of Provisions to Capital
7.27 The FSI Nonperforming loans (NPLs) net of provisions to capital is intended to gauge the poten‑tial impact on capital of the portion of NPLs not covered by specific provisions. If there is appropriate recognition of NPLs, this ratio can provide an indica‑tion of the capacity of bank capital to withstand losses on loans identified as non‑performing but not fully provisioned. While NPLs net of specific provisions is considered to be the best estimate of the realizable value of the NPLs, there is uncertainty until individual NPLs have been either fully collected, or all collection options have been exhausted and any unrecovered portion written off. Since the actual losses that will be incurred, and thus the realizable value of the NPLs are not known, the estimates of required provisions may vary from actual experience.
7.28 This FSI is calculated by taking the value of NPLs (line 49) less the value of specific loan loss pro‑visions against NPLs (line 18.ii) as the numerator,11 and total regulatory capital as the denominator.
7.29 Loans are nonperforming when payments of principal and interest are past due by 90 days or more, or interest payments corresponding to 90 days or more have been capitalized, refinanced or rolled over. In addition, NPLs should also include those loans with payments less than 90 days past due, but for which evidence exists to classify them as nonperforming, such as if the debtor files for bankruptcy. After a loan is classified as nonperforming, it (or any replacement loan[s]) should remain so classified, until written‑off or payments of interest or principal are received on this or subsequent loans that replace the original loan. Data on loans should exclude accrued interest on NPLs and lending among DTs in the reporting popu‑lation that are part of the same group.12
7.30 Provisions are defined as specific loan loss provisions against NPLs. As described in Chapter 4, specific provisions refer to the portion of expected loss calculated for loans that are classified as impaired
loans under IFRS9 or using an approach consistent with national supervisory guidance. The Guide relies on national practices in identifying specific provi‑sions, which should be documented in the metadata. Provisions for the accrual of interest on NPLs should not be included under loan loss provisions, as they are identified within (and excluded from) net interest income.
7.31 Capital is measured as total regulatory capi‑tal (line 39 and defined in paragraph 5.75–5.80).13 In measuring sector‑wide regulatory capital, intra‑sector equity investments are deducted from the overall capital in the sector, so that capital and reserves held within the sector are not double counted. In line with supervisory guidance, capital excludes the value of goodwill.
7.32 Information on NPLs and specific provisions for the reporting population are typically available from supervisory sources, although national defini‑tions of NPLs can vary.14 Similarly, regulatory capital data are available from supervisory sources.
7.33 The indicator requires the use of specific pro‑visions when netting from NPLs. Some jurisdictions may not distinguish between specific and general provisions, which is consistent with the IFRS 9 ECL approach. This can result in negative values for the indicator if total (specific and general) provisions are higher than outstanding NPLs. In jurisdictions that do not allocate ECL to general and specific provisions, the subset ECL for non‑performing loans, rather than total ECL, should be used if available to calculate the FSI, providing a more accurate indication of extent to which NPLs are covered by provisions. This empha‑sizes the importance of documenting national prac‑tices in the metadata if the dissemination of this FSI is not to be misleading.
Nonperforming Loans to Total Gross Loans
7.34 The FSI nonperforming loans to total gross loans is intended to identify problems with asset quality
11 NPLs and specific provisions are defined in paragraph 5.94 and paragraph 5.48, respectively. The dissemination of data for this indicator should be supplemented with detailed metadata on national supervisory rules for classifying loans as nonperforming and for collateral.12 See Chapter 5, paragraph 5.94 to paragraph 5.96.
13 Where a Domestic Location (DL) consolidation is used, countries have the flexibility to use total capital and reserves (line 31, defined in paragraphs 5.70–5.72) as denominator, because foreign‑owned branches might not be required to hold regulatory capital.14 When national definitions deviate from the one presented in the Guide, they should be documented in the metadata.
©International Monetary Fund. Not for Redistribution
Specification of Core Financial Soundness Indicators for Deposit Takers 89
in the loan portfolio, with an increasing ratio signal‑ing a deterioration in the quality of banks’ credit port‑folio. For a proper interpretation, it should be used in combination with the FSIs NPLs net of provisions to capital ratio described earlier and Provisions to NPLs described further.
7.35 NPLs are identified only when problems emerge, so this FSI is a lagging indicator. Neverthe‑less, it shows a trend in the quality of DTs’ portfolio over time. Appropriate recognition of NPLs is essen‑tial for this ratio to be meaningful and cross‑country comparable. The indicator can be viewed together with those for the nonfinancial corporate sector, as a deteriorating financial position for nonfinancial cor‑porations might foreshadow future deterioration of this ratio. Moreover, this indicator can also provide insights into the buildup of systemic credit risk, allow‑ing for benchmarking of financial systems in normal times with no stress, to monitor changes over time, and to compare across jurisdictions.
7.36 This FSI is calculated by taking the value of NPLs as the numerator and the total value of the loan portfolio (including NPLs, and before the deduction of specific loan loss provisions) as the denominator. Also, and as noted in paragraph 7.29, the denomina‑tor should exclude lending among DTs in the report‑ing population that are part of the same group. NPLs (line 49) and loans (line 18.i) are defined in paragraphs 5.94–5.96 and paragraphs 5.41 and 5.43, respectively.
7.37 The guidance on the definition of NPLs is the same as that provided for the previous FSI in para‑graph 7.29. Total loans correspond to the balance sheet concept (after consolidation within the bank‑ing group) and include all loans to resident and non‑resident institutional units. Data on performing and NPLs should exclude accrued interest on NPLs. Since the goal of this FSI is to gauge banks’ exposures aris‑ing from their loan portfolio, deposits with the central bank and other financial institutions should not be part of the denominator, even if national regulations allow to classify them as such.15
7.38 Information on loans should be available from the consolidated balance sheet of the reporting group and supervisory sources. Information on NPLs for the reporting population is typically available from supervisory sources, although national definitions on NPLs can vary. Equally, different legal frameworks may influence the length of time that NPLs must be kept on‑balance sheet, distorting cross‑country com‑parisons.16 For instance, if banks are not allowed to write‑off loans—even when they are fully provisioned and the losses already absorbed—until a legally estab‑lished time has lapsed; their balance sheets will indi‑cate a more vulnerable situation than if those loans had been taken off‑balance sheet, without any effect on the solvency of the institutions.
Provisions to Nonperforming Loans
7.39 The FSI provisions to NPLs gauges the extent to which NPLs are already covered by specific provi‑sions. This ratio complements the information pro‑vided by the two previous FSIs on NPLs, providing a measure of the amount of future losses that would be incurred if all NPLs were written‑off.
7.40 This FSI is calculated by taking the value of specific provisions against NPLs (line 18.ii) as the numerator, and NPLs as the denominator. NPLs and specific provisions are defined in paragraphs 5.94–5.96 and paragraph 5.48, respectively.
7.41 As noted earlier the loan loss allowance that are derived from the IFRS9 calculation are allocated to specific provisions and general provisions in line with national supervisory guidance. In jurisdictions that treat all ECL as specific provisions, the subset ECL for non‑performing loans, should be used for calculating the FSI. This should be documented in the metadata.
7.42 Regarding NPLs and specific provisions, source data and compilation issues are discussed for the FSI nonperforming loans net of provisions to capital. Due to different national standards for the classification of loans as nonperforming and the constitution of loan loss provisions, data disseminated for this indicator
15 For instance, the EU Commission Implementing Regulation 2015/1278 includes as banks’ exposures cash balances at central banks and other demand deposits. This treatment artificially inflates the denominator. Therefore, countries should follow the Guide definition and exclude such deposits when compiling this FSI.
16 For this, and other cases where national frameworks differ, the availability of metadata is crucial for the interpretation of the indicators.
©International Monetary Fund. Not for Redistribution
Financial Soundness Indicators Compilation Guide90
should be supplemented with detailed metadata on national supervisory rules for treatment of collateral in determining required provisions. The discussion in the previous section on general provisions included indistinctly from specific provisions also applies here.
Loan Concentration by Economic Activity
7.43 The FSI Loan concentration by economic activity is aimed at gauging the credit risk associated with excessive concentration of credit in a specific domestic sector or activity. A large concentration of aggregate credit exposure to a specific resident eco‑nomic sector or activity may signal an important vulnerability of the DT sector to the level of activity, prices, and profitability in that sector or activity. If conditions in sectors where banks have an excessive credit concentration deteriorate, the quality of their loan portfolio will suffer, with negative consequences for their financial health.
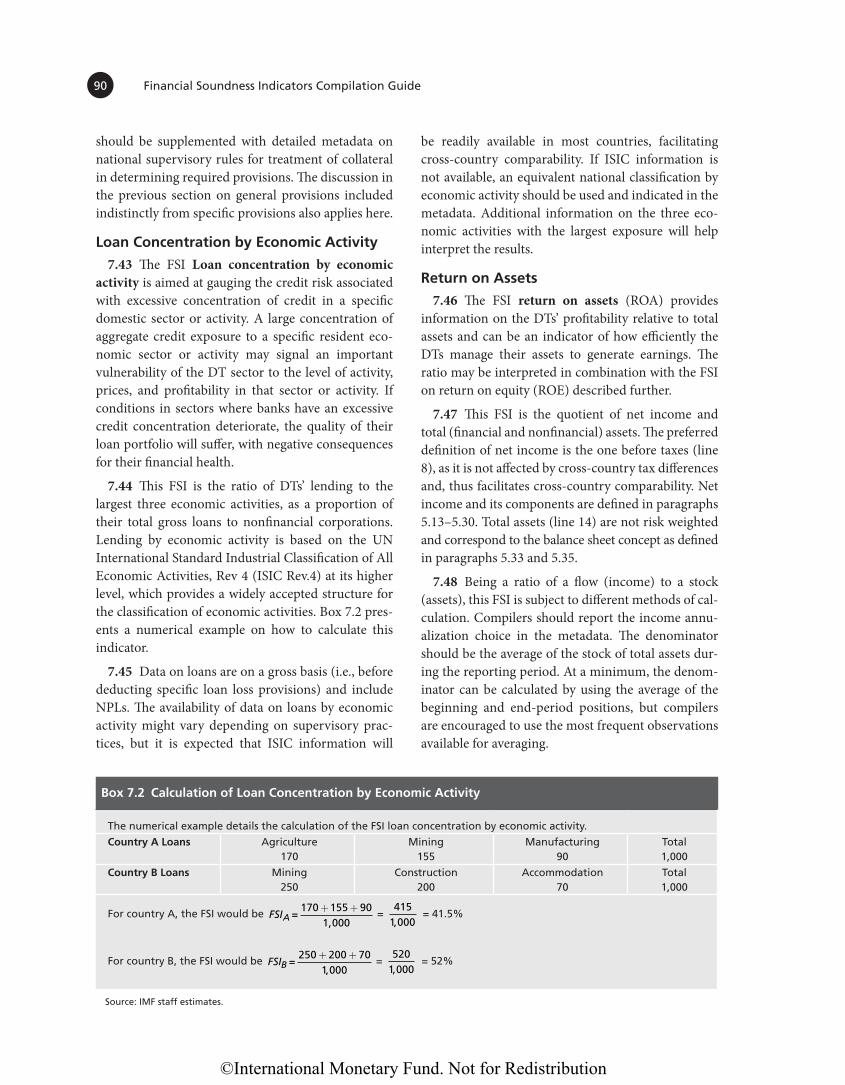
7.44 This FSI is the ratio of DTs’ lending to the largest three economic activities, as a proportion of their total gross loans to nonfinancial corporations. Lending by economic activity is based on the UN International Standard Industrial Classification of All Economic Activities, Rev 4 (ISIC Rev.4) at its higher level, which provides a widely accepted structure for the classification of economic activities. Box 7.2 pres‑ents a numerical example on how to calculate this indicator.
7.45 Data on loans are on a gross basis (i.e., before deducting specific loan loss provisions) and include NPLs. The availability of data on loans by economic activity might vary depending on supervisory prac‑tices, but it is expected that ISIC information will
be readily available in most countries, facilitating cross‑country comparability. If ISIC information is not available, an equivalent national classification by economic activity should be used and indicated in the metadata. Additional information on the three eco‑nomic activities with the largest exposure will help interpret the results.
Return on Assets
7.46 The FSI return on assets (ROA) provides information on the DTs’ profitability relative to total assets and can be an indicator of how efficiently the DTs manage their assets to generate earnings. The ratio may be interpreted in combination with the FSI on return on equity (ROE) described further.
7.47 This FSI is the quotient of net income and total (financial and nonfinancial) assets. The preferred definition of net income is the one before taxes (line 8), as it is not affected by cross‑country tax differences and, thus facilitates cross‑country comparability. Net income and its components are defined in paragraphs 5.13–5.30. Total assets (line 14) are not risk weighted and correspond to the balance sheet concept as defined in paragraphs 5.33 and 5.35.
7.48 Being a ratio of a flow (income) to a stock (assets), this FSI is subject to different methods of cal‑culation. Compilers should report the income annu‑alization choice in the metadata. The denominator should be the average of the stock of total assets dur‑ing the reporting period. At a minimum, the denom‑inator can be calculated by using the average of the beginning and end‑period positions, but compilers are encouraged to use the most frequent observations available for averaging.
The numerical example details the calculation of the FSI loan concentration by economic activity.
Country A Loans Agriculture170
Mining155
Manufacturing90
Total1,000
Country B Loans Mining250
Construction200
Accommodation70
Total1,000
For country A, the FSI would be FSIA =170 155 90
1,000+ + =
4151 000,
= 41.5%
For country B, the FSI would be FSIB =,
250 200 701 000+ + =
5201 000,
= 52%
Source: IMF staff estimates.
Box 7.2 Calculation of Loan Concentration by Economic Activity
©International Monetary Fund. Not for Redistribution
Specification of Core Financial Soundness Indicators for Deposit Takers 91
7.49 The data for net income available from super‑visory sources may depend on the national commer‑cial accounting practice, as might the extent to which they meet the definitions in the Guide. Net income is calculated based on commercial accounting and supervisory approaches.
7.50 Net income, as defined in the Guide, includes gains and losses on financial instruments valued at fair value through profit and loss, and gains and losses from the sales of fixed assets, which are measured as the difference between the sale value and the balance sheet value at the end of the previous period. Nota‑bly, compilers should be aware that the Guide recom‑mends that interest income not include the accrual of interest on nonperforming assets (paragraph 5.14). It also encourages the inclusion of realized and unreal‑ized gains and losses arising during each period on all financial instruments (financial assets and liabili‑ties, in domestic and foreign currencies) valued at FVTPL.
Return on Equity
7.51 The FSI return on equity (ROE) is intended to measure DTs’ efficiency in using capital. It also offers information on the ability of DTs to inter‑nally generate capital through retained earnings, and the attractiveness of the sector to new equity investment.
7.52 This FSI is the quotient of net income (flow) and total capital and reserves (stock) and therefore sub‑ject to different methods of calculations, which would produce different results. Compilers should report the income annualization choice in the metadata.
7.53 The Guide recommends net income after taxes (line 10), as this provides an indication of net operating income available for capitalization and profit distribution.
7.54 Net income and its components are defined in paragraphs 5.13–5.31. Capital is measured as total capital and reserves (line 31 and defined in paragraphs 5.70–5.72).
7.55 Differences in capital structure and business mix across countries affect bank performance and highlight the need to look at several operating ratios simultaneously. Banks with higher leverage (lower equity relative to assets) will generally report a higher
ROE. Hence, an analysis of profitability based exclu‑sively on ROE would tend to disregard the greater risks normally associated with high leverage. Regard‑ing net income, data sources and compilation issues are discussed in the ROA indicator.
Interest Margin to Gross Income
7.56 The FSI interest margin to gross income measures the relative share of net interest income (interest earned less interest expenses) within gross income. This ratio is a gauge of the relative importance of the income generated by the inter‑mediation business of DTs (mobilizing savings for investment).
7.57 This FSI is calculated by using net interest income (line 3) as the numerator and gross income (line 5) as the denominator. Net interest income and its components are defined in paragraphs 5.13–5.15, while gross income is defined in paragraph 5.16. Being a ratio of two flows, the Guide recommends accumulating the flows from the beginning of the year until the end of the reporting period.
7.58 Data for net interest income and gross income should be available from income statements and supervisory sources, but the extent to which they meet the definitions in the Guide could depend on national commercial accounting practice.
7.59 In the Guide, interest income should not include the accrual of interest on nonperforming assets (see paragraph 5.14). Gross income includes both net interest income and other gross income. As mentioned earlier, Other gross income items include realized and unrealized gains and losses arising during each period on all financial instru‑ments (in domestic and foreign currencies) valued at FVPTL. Gains and losses on the sale of an asso‑ciate or subsidiary (and disinvestment, of a reverse investment) are excluded from gross income (para‑graph 5.19).
Noninterest Expenses to Gross Income
7.60 The FSI noninterest expenses to gross income measures the relation between non‑intermediation expenses, often called overhead or operating expenses, and gross income (interest margin plus noninterest income). This FSI, often called the efficiency ratio, provides insights into the portion of gross revenues
©International Monetary Fund. Not for Redistribution
Financial Soundness Indicators Compilation Guide92
required to cover operating expenses, including per‑sonnel costs and occupancy expenses.
7.61 This FSI is calculated by using noninterest expenses (line 6 in Table 5.1) as the numerator and gross income (line 5) as the denominator. Noninter‑est expenses are defined in paragraph 5.25 and gross income in paragraph 5.16. The recommendation is for numerator and denominator to accumulate the flows from the beginning of the year until the end of the reporting period.
7.62 Noninterest expenses cover all expenses other than interest expenses. Provisions are not included in noninterest expenses but separately identified in the sectoral income and expense statement (line 7). Regarding gross income, issues for compilers are discussed in the interest margin to gross income summary.
7.63 The data for noninterest expenses and gross income available to supervisory sources may depend on national commercial accounting practice. Sources of gross income data are discussed in the section on Interest margin to gross income.
Liquid Assets to Total Assets
7.64 The FSI liquid assets to total assets provides an indication of the liquidity available to DTs to meet expected and unexpected cash outflows. The level of liquidity influences the ability of a banking system to withstand idiosyncratic funding shocks as well as more global market disruption.
7.65 This FSI is calculated by using the measure of liquid assets (line 47) as the numerator and total assets (line 14) as the denominator. Liquid assets are defined in paragraphs 5.90‑5.92, and nonfinancial and finan‑cial assets are defined in paragraphs 5.33 and 5.35.
7.66 Data on liquidity should be available from supervisory sources. The extent to which national approaches to measuring liquidity meet the con‑cepts in the Guide would require consideration. The available information may need to be aggregated to calculate both the numerator and denominator of this FSI.
Liquid Assets to Short-Term Liabilities and Liquidity Coverage Ratio
7.67 The FSI liquid assets to short‑term liabilities is intended to capture the liquidity mismatch of assets
and liabilities and provides an indication of the extent to which DTs could meet the short‑term withdrawal of funds without facing liquidity problems.
7.68 This FSI is calculated by using the measure of liquid assets (line 47) as the numerator and the short‑term liabilities (line 48) as the denominator. Liquid assets are defined in paragraphs 5.90–5.92, and short‑term liabilities are defined in paragraph 5.93. Short‑term liabilities are the short‑term element (within three months or less) of DTs’ debt liabilities (line 28) plus the net market value of the financial derivatives position17 (liabilities line 29 less assets line 21); including liabilities to other DTs in the reporting population.
7.69 Sources of data on liquid assets are discussed in paragraph 7.66. Data on short‑term liabilities for all debt instruments are often available on an original maturity, but not always on a remaining maturity basis.18 Data on short‑term liabilities on a remaining maturity basis might be available from supervisory sources. Data on financial derivatives should be available from accounting records and supervisory sources. The extent to which the data meet the concepts in the Guide, particularly about remaining maturity and financial derivatives, would require consideration. Any data should exclude positions within the same reporting group. The issues for compilers for liquid assets are the same as the ones described in the liquid assets to total assets section.
7.70 Jurisdictions that have implemented the liquidity standards of Basel III should compile both liquid assets to short term liabilities and the liquidity coverage ratio (LCR). If the LCR is applicable only to a subset of the DT sector, for example, large inter‑nationally active banks, the LCR should be compiled only for that subset. Liquid assets to short‑term liabil‑ities should continue to be compiled for the DT sector.
7.71 The LCR is an indicator of the ability of banks to survive a 30‑day liquidity stress scenario. The
17 The net market value position (liabilities less assets) of financial derivative liabilities should be included rather than the gross liability position. This is because of the market practice of creating offsetting contracts and the possibility of forward‑type instruments switching between asset and liability positions from one period to the next.18 The IMF External Debt Statistics—Guide for Compilers and Users (2013) outlines the presentation of remaining maturity data for banks, on an external debt basis only.
©International Monetary Fund. Not for Redistribution
Specification of Core Financial Soundness Indicators for Deposit Takers 93
numerator is High Quality Liquid Assets (HQLA), defined as assets that would be liquid in times of stress and ideally, eligible collateral for central bank liquid‑ity facilities (line 42, defined in paragraph 5.85). The denominator is net cash outflows arising from the appli‑cation of supervisor‑prescribed run‑off rates to differ‑ent categories of funding, and supervisor‑specified assumptions regarding the availability of banks’ fund‑ing sources in the stress scenario (line 43, defined in paragraph 5.86).19 Annex 7.2 provides a numerical example on how to calculate the LCR for one illustra‑tive bank.
7.72 Source data for LCR’s numerator and denomi‑nator are supervisory series reported in jurisdictions that have implemented Basel III. For the compilation of the indicator, data on HQLA and total net cash out‑flows calculated for each reporting group should be aggregated, to derive the ratio for the whole system. Application of the LCR will be challenging in many jurisdictions because of the dearth of highly rated assets traded in liquid markets that would meet the Basel definition of HQLA. This may result in national variations in definitions of HQLA. Also, there is no certainty that the Basel prescribed run‑off rates and funding assumptions are appropriate for all jurisdic‑tions, so these elements of the LCR may also be sub‑ject to national variations. The metadata should note any differences from the Basel LCR requirement in national implementation.
Net Stable Funding Ratio
7.73 The FSI net stable funding ratio (NSFR) rep‑licates the indicator introduced under Basel III. It is an indicator of banks’ ability to withstand market disrup‑tion over a one‑year‑ time horizon. The NSFR is calcu‑lated by using the amount of available stable funding (ASF) (line 44, defined in paragraph 5.87) as the numer‑ator, and the amount of required stable funding (RSF) (line 45, defined in paragraph 5.87) as the denominator.20 The BCBS minimum requirement is that this ratio should be equal to at least 100 percent on an ongoing basis.
7.74 ASF is the portion of capital and liabilities expected to be available to the bank to fund its opera‑tions over a one‑year period. It is calculated by applying
supervisor‑prescribed factors, presumed to reflect the stability of liabilities, to banks’ liabilities and capital. There are five buckets with stability factors ranging from 100 percent (capital and borrowings with resid‑ual maturities of more than one year) to 0 percent (for highly volatile funding such as derivative liabilities).
7.75 RSF is measured based on the broad charac‑teristics of the liquidity risk profile of an institution’s assets and off‑balance‑sheet exposures. It is calculated by applying supervisor‑prescribed factors intended to approximate the amount of each type of asset and off‑balance‑sheet exposure that would have to be funded over a one‑year period. The factors range from 0 percent for assets that are self‑funded such as central bank reserves to 100 percent of assets encumbered for one year or more (and thus unavailable as liquid assets).
7.76 Source data for numerator and denominator are supervisory series reported in jurisdictions that have implemented Basel III. If the NSFR has only been applied to a subset of the sector, for example, large internationally active banks, the NSFR should be compiled only for that subset. For the compila‑tion of the aggregated indicator, data on ASF and RSF calculated for each reporting group should be added, obtaining a ratio for the whole system. As with the LCR, elements of NSFR may be subject to national variations. Metadata should indicate if any elements vary from the Basel standard. Annex 7.3 contains a numerical example on how to calculate the NSFR for one institution.
Net Open Position in Foreign Exchange to Capital
7.77 The FSI net open position in foreign exchange to capital is intended to identify DTs’ exposure to exchange rate risk relative to capital. It measures the mismatch (open position) of foreign currency asset and liability positions to assess the potential vulner‑ability of the DT sector to exchange rate movements.
7.78 The most common measure of foreign exchange exposure is the net open position. Even if the sector as a whole does not have an open foreign exchange position, this might not be true for individual DTs or groups of DTs.
7.79 While a matched currency position will pro‑tect a DT against loss from movements in exchange rates, it will not necessarily protect its capital adequacy
19 See BCBC Basel III: The Liquidity Coverage Ratio and Liquidity Risk Monitoring Tools (2013).20 See BCBS Basel III: The Net Stable Funding Ratio (2014).
©International Monetary Fund. Not for Redistribution
Financial Soundness Indicators Compilation Guide94
ratio. Even if a DT has a portfolio of foreign currency assets and liabilities that is completely matched, its capital/asset ratio will fall if the domestic currency depreciates.
7.80 To calculate this FSI, the numerator is either the net open position in foreign exchange for on‑ balance‑sheet items (line 55) or the preferred approach using total (including off‑balance‑sheet items) net open position in foreign currency (line 56). Super‑visory standards generally require inclusion of off‑ balance sheet items in the determination of net open position, so the total (line 56) will generally be avail‑able to compilers from supervisory sources. In dis‑seminating data, it should be made clear which measure of the net open position is being employed. The denominator is total regulatory capital (line 39). Data for the net open position in foreign exchange and total regulatory capital from each reporting group should be aggregated to estimate the indicator for the whole system.
7.81 Deposit takers’ net open position should be calculated in accordance with BCBS guidance: it includes the sum of the net position of on‑balance‑ sheet foreign currency debt instruments; net positions in financial derivatives; on‑balance‑sheet holdings of foreign currency equity assets; net future foreign cur‑rency income and expenses not yet accrued but already fully hedged; foreign currency guarantees and similar instruments that are certain to be called and are likely to be irrecoverable; and, depending on the national commercial accounting practice, any other item rep‑resenting a profit/loss in foreign currencies of the foreign currency positions set out in a single unit of account. The Guide describes the sum of the first three items listed earlier as the “net open position in for‑eign exchange for on‑balance‑sheet items.” The extent to which the national approach to measuring the net open position varies from BCBS guidance should be disclosed in the metadata.
7.82 As described in paragraph 5.101, foreign currency items are those payable (receivable) in a currency other than the domestic currency (foreign currency denominated) and those payable in domes‑tic currency but with the amounts to be paid linked to a foreign currency (foreign currency linked). Although by definition, gold held by DTs is a non‑financial asset, due to its volatility and because DTs manage it similarly to foreign currency assets, the BCBS regards gold as foreign exchange when calcu‑lating this indicator.
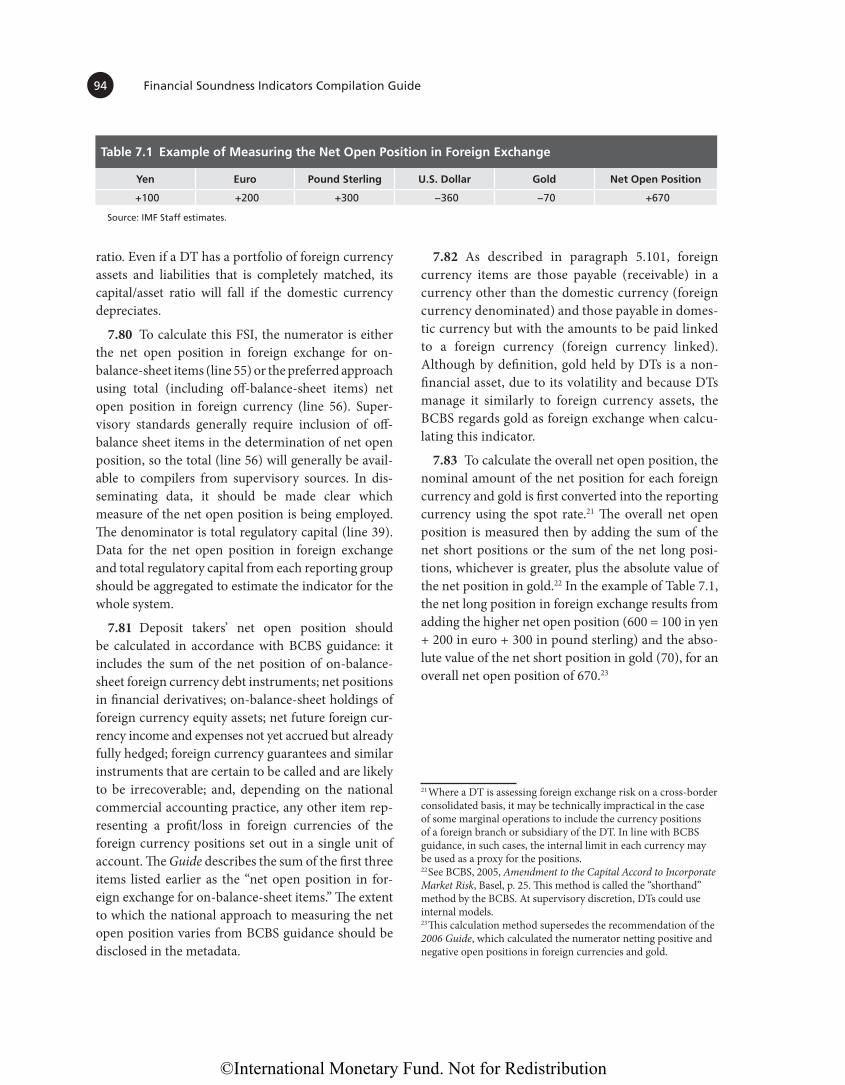
7.83 To calculate the overall net open position, the nominal amount of the net position for each foreign currency and gold is first converted into the reporting currency using the spot rate.21 The overall net open position is measured then by adding the sum of the net short positions or the sum of the net long posi‑tions, whichever is greater, plus the absolute value of the net position in gold.22 In the example of Table 7.1, the net long position in foreign exchange results from adding the higher net open position (600 = 100 in yen + 200 in euro + 300 in pound sterling) and the abso‑lute value of the net short position in gold (70), for an overall net open position of 670.23
Table 7.1 Example of Measuring the Net Open Position in Foreign Exchange
Yen Euro Pound Sterling U.S. Dollar Gold Net Open Position
+100 +200 +300 −360 −70 +670
Source: IMF Staff estimates.
21 Where a DT is assessing foreign exchange risk on a cross‑border consolidated basis, it may be technically impractical in the case of some marginal operations to include the currency positions of a foreign branch or subsidiary of the DT. In line with BCBS guidance, in such cases, the internal limit in each currency may be used as a proxy for the positions.22 See BCBS, 2005, Amendment to the Capital Accord to Incorporate Market Risk, Basel, p. 25. This method is called the “shorthand” method by the BCBS. At supervisory discretion, DTs could use internal models.23 This calculation method supersedes the recommendation of the 2006 Guide, which calculated the numerator netting positive and negative open positions in foreign currencies and gold.
©International Monetary Fund. Not for Redistribution
7.1 Summary of Core Financial Soundness Indicators for Deposit Takers
Definition Source Data Compilation Issues
Regulatory Capital to Risk-weighted Assets
Ratio of total regulatory capital to risk-weighted assets (RWA).
– Supervisory data on aggregated total regulatory capital and RWA.
– Regulatory capital refers to a specific definition of capital developed by the Basel Committee on Banking Supervision (BCBS), as adopted by national authorities, with or without adjustments and exercise of national discretion.
– RWA measured differently depending on the version of the Basel Accord adopted by national authorities, with or without adjustments.
Tier 1 Capital to Risk-weighted Assets
Ratio of Tier 1 capital to RWA. – Supervisory data on aggregated Tier 1 capital and RWA.
– National treatment in Tier 1 capital of equity investments in other banks, and other elements subject to national discretion, should be described in the metadata.
Nonperforming Loan Net of Provisions to Capital
Ratio of total nonperforming loans (NPLs) less provision to total regulatory capital.
– Supervisory data on NPLs and total regulatory capital. Supervisory data on specific provisions.
– National treatment may vary. BCBS transitional guidance for International Financial Reporting Standards 9 recommends that national supervisory authorities specify the allocation of expected credit loss to specific and general provisions.
– In some countries, general provisions are not separately identified from specific provisions.
Common Equity Tier 1 Capital to Risk-weighted Assets
Ratio of CET1 capital to RWA. – Supervisory data on aggregated CET1 capital and RWA.
– New to Basel III, timing of implementation will vary across jurisdictions.
Tier 1 Capital to Total Assets
Ratio of Tier 1 capital to total assets.
For economies that have implemented Basel III: Ratio of Tier 1 capital to total exposure.
– Supervisory data on Tier 1 capital, and balance sheet data on total assets.
– Average of monthly leverage ratio over the quarter.
– Same as Tier 1 capital to RWA.
– For Basel III leverage ratio, exposure includes both on- and off-balance-sheet items.
Nonperforming Loans to Total Gross Loans
Ratio of total NPLs to total gross loans.
– Supervisory data on NPLs and balance sheet data on total gross loans.
– Loans exclude accrued interest on NPLs.
ANNEX
©International Monetary Fund. Not for Redistribution
Financial Soundness Indicators Compilation Guide96
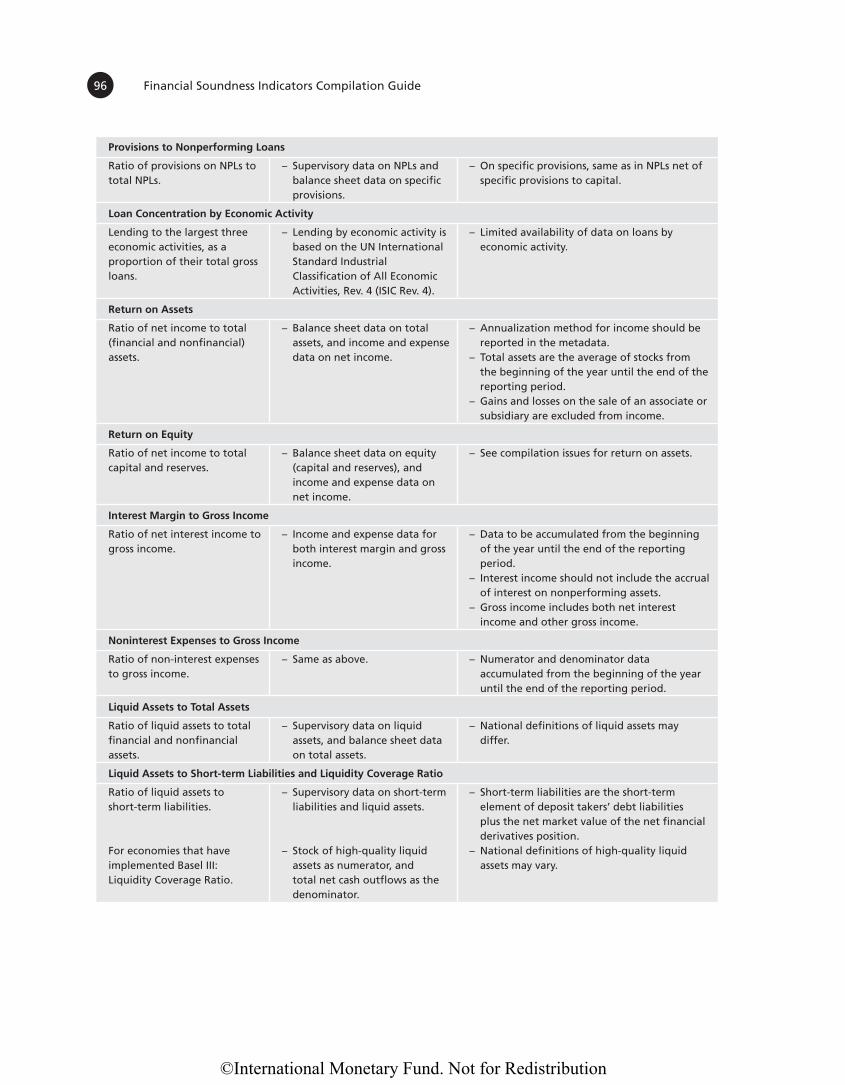
Provisions to Nonperforming Loans
Ratio of provisions on NPLs to total NPLs.
– Supervisory data on NPLs and balance sheet data on specific provisions.
– On specific provisions, same as in NPLs net of specific provisions to capital.
Loan Concentration by Economic Activity
Lending to the largest three economic activities, as a proportion of their total gross loans.
– Lending by economic activity is based on the UN International Standard Industrial Classification of All Economic Activities, Rev. 4 (ISIC Rev. 4).
– Limited availability of data on loans by economic activity.
Return on Assets
Ratio of net income to total (financial and nonfinancial) assets.
– Balance sheet data on total assets, and income and expense data on net income.
– Annualization method for income should be reported in the metadata.
– Total assets are the average of stocks from the beginning of the year until the end of the reporting period.
– Gains and losses on the sale of an associate or subsidiary are excluded from income.
Return on Equity
Ratio of net income to total capital and reserves.
– Balance sheet data on equity (capital and reserves), and income and expense data on net income.
– See compilation issues for return on assets.
Interest Margin to Gross Income
Ratio of net interest income to gross income.
– Income and expense data for both interest margin and gross income.
– Data to be accumulated from the beginning of the year until the end of the reporting period.
– Interest income should not include the accrual of interest on nonperforming assets.
– Gross income includes both net interest income and other gross income.
Noninterest Expenses to Gross Income
Ratio of non-interest expenses to gross income.
– Same as above. – Numerator and denominator data accumulated from the beginning of the year until the end of the reporting period.
Liquid Assets to Total Assets
Ratio of liquid assets to total financial and nonfinancial assets.
– Supervisory data on liquid assets, and balance sheet data on total assets.
– National definitions of liquid assets may differ.
Liquid Assets to Short-term Liabilities and Liquidity Coverage Ratio
Ratio of liquid assets to short-term liabilities.
For economies that have implemented Basel III: Liquidity Coverage Ratio.
– Supervisory data on short-term liabilities and liquid assets.
– Stock of high-quality liquid assets as numerator, and total net cash outflows as the denominator.
– Short-term liabilities are the short-term element of deposit takers’ debt liabilities plus the net market value of the net financial derivatives position.
– National definitions of high-quality liquid assets may vary.
©International Monetary Fund. Not for Redistribution
Summary of Core Financial Soundness Indicators for Deposit Takers 97
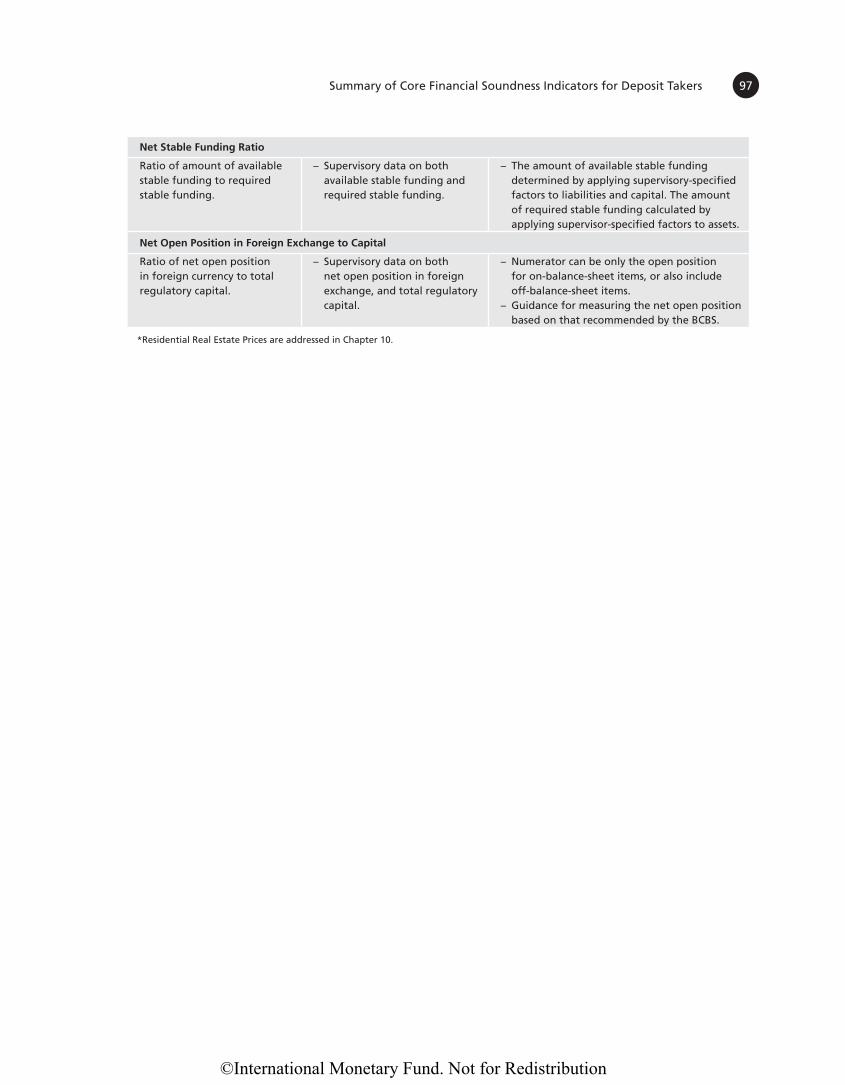
Net Stable Funding Ratio
Ratio of amount of available stable funding to required stable funding.
– Supervisory data on both available stable funding and required stable funding.
– The amount of available stable funding determined by applying supervisory-specified factors to liabilities and capital. The amount of required stable funding calculated by applying supervisor-specified factors to assets.
Net Open Position in Foreign Exchange to Capital
Ratio of net open position in foreign currency to total regulatory capital.
– Supervisory data on both net open position in foreign exchange, and total regulatory capital.
– Numerator can be only the open position for on-balance-sheet items, or also include off-balance-sheet items.
– Guidance for measuring the net open position based on that recommended by the BCBS.
*Residential Real Estate Prices are addressed in Chapter 10.
©International Monetary Fund. Not for Redistribution
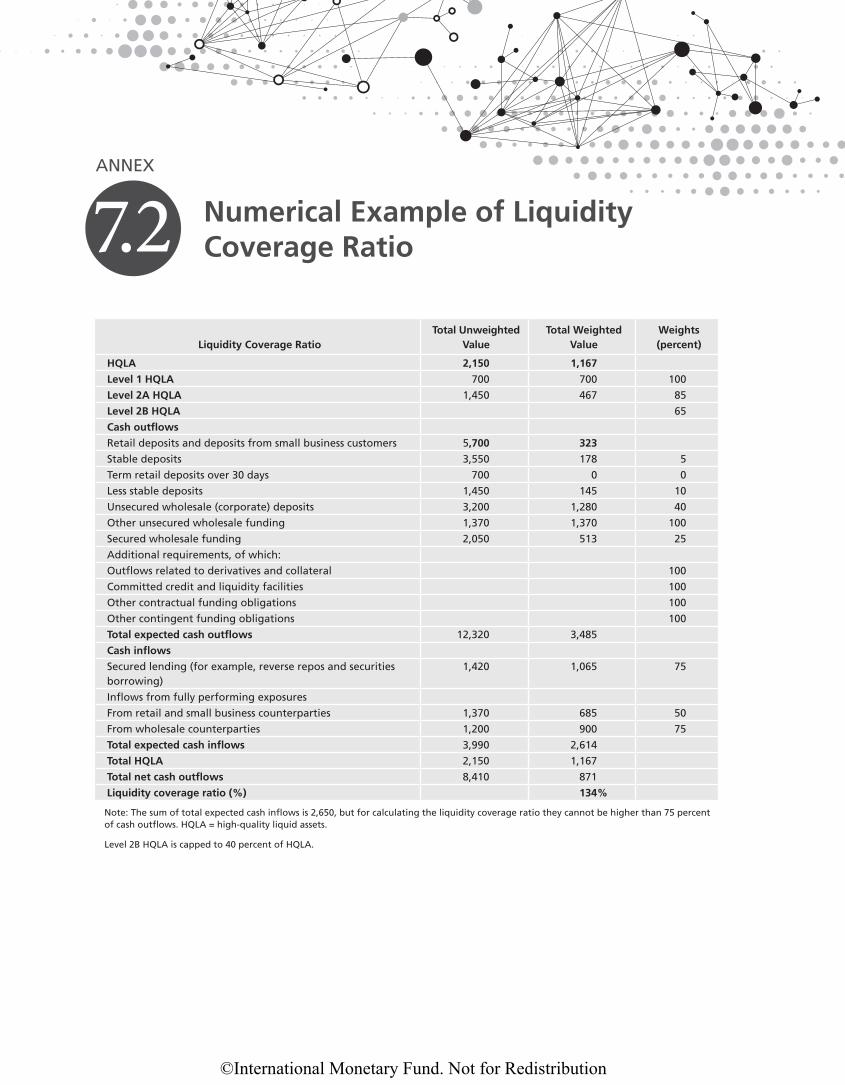
7.2 Numerical Example of Liquidity Coverage Ratio
Liquidity Coverage RatioTotal Unweighted
ValueTotal Weighted
ValueWeights (percent)
HQLA 2,150 1,167
Level 1 HQLA 700 700 100
Level 2A HQLA 1,450 467 85
Level 2B HQLA 65
Cash outflows
Retail deposits and deposits from small business customers 5,700 323
Stable deposits 3,550 178 5
Term retail deposits over 30 days 700 0 0
Less stable deposits 1,450 145 10
Unsecured wholesale (corporate) deposits 3,200 1,280 40
Other unsecured wholesale funding 1,370 1,370 100
Secured wholesale funding 2,050 513 25
Additional requirements, of which:
Outflows related to derivatives and collateral 100
Committed credit and liquidity facilities 100
Other contractual funding obligations 100
Other contingent funding obligations 100
Total expected cash outflows 12,320 3,485
Cash inflows
Secured lending (for example, reverse repos and securities borrowing)
1,420 1,065 75
Inflows from fully performing exposures
From retail and small business counterparties 1,370 685 50
From wholesale counterparties 1,200 900 75
Total expected cash inflows 3,990 2,614
Total HQLA 2,150 1,167
Total net cash outflows 8,410 871
Liquidity coverage ratio (%) 134%
Note: The sum of total expected cash inflows is 2,650, but for calculating the liquidity coverage ratio they cannot be higher than 75 percent of cash outflows. HQLA = high-quality liquid assets.
Level 2B HQLA is capped to 40 percent of HQLA.
ANNEX
©International Monetary Fund. Not for Redistribution
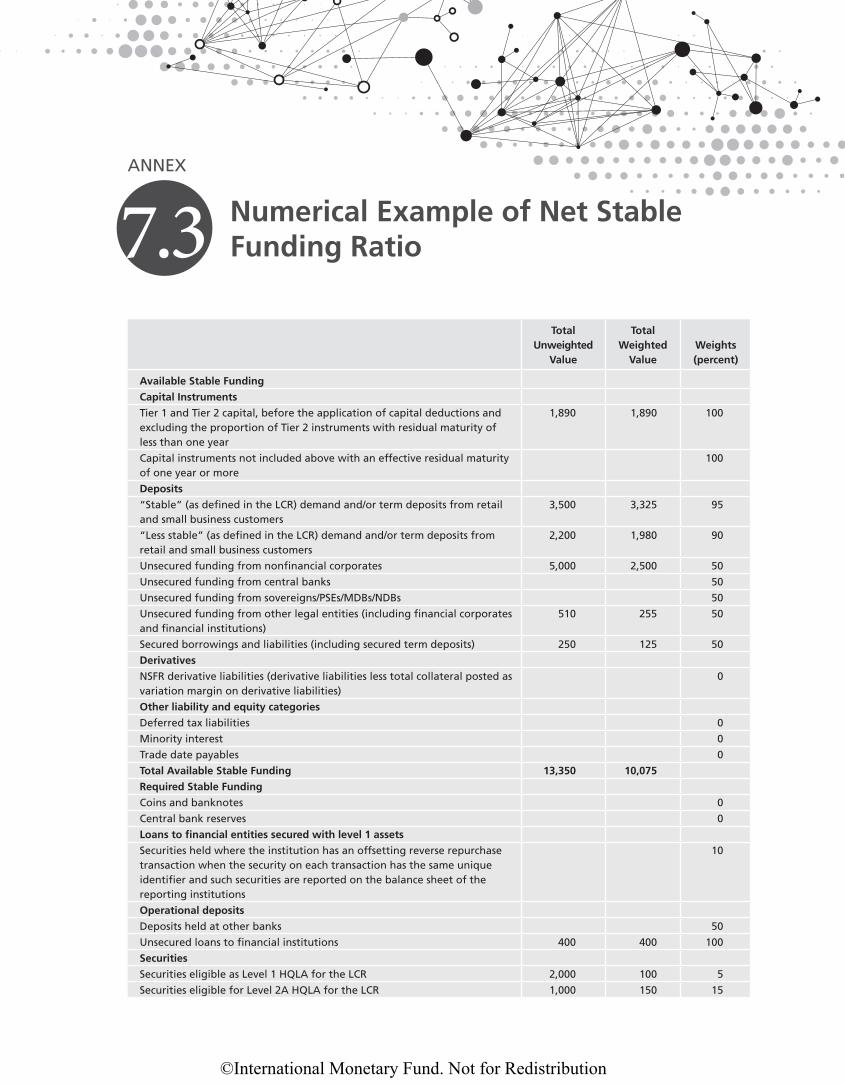
7.3 Numerical Example of Net Stable Funding Ratio
Total Unweighted
Value
Total Weighted
ValueWeights (percent)
Available Stable Funding
Capital Instruments
Tier 1 and Tier 2 capital, before the application of capital deductions and excluding the proportion of Tier 2 instruments with residual maturity of less than one year
1,890 1,890 100
Capital instruments not included above with an effective residual maturity of one year or more
100
Deposits
“Stable” (as defined in the LCR) demand and/or term deposits from retail and small business customers
3,500 3,325 95
“Less stable” (as defined in the LCR) demand and/or term deposits from retail and small business customers
2,200 1,980 90
Unsecured funding from nonfinancial corporates 5,000 2,500 50
Unsecured funding from central banks 50
Unsecured funding from sovereigns/PSEs/MDBs/NDBs 50
Unsecured funding from other legal entities (including financial corporates and financial institutions)
510 255 50
Secured borrowings and liabilities (including secured term deposits) 250 125 50
Derivatives
NSFR derivative liabilities (derivative liabilities less total collateral posted as variation margin on derivative liabilities)
0
Other liability and equity categories
Deferred tax liabilities 0
Minority interest 0
Trade date payables 0
Total Available Stable Funding 13,350 10,075
Required Stable Funding
Coins and banknotes 0
Central bank reserves 0
Loans to financial entities secured with level 1 assets
Securities held where the institution has an offsetting reverse repurchase transaction when the security on each transaction has the same unique identifier and such securities are reported on the balance sheet of the reporting institutions
10
Operational deposits
Deposits held at other banks 50
Unsecured loans to financial institutions 400 400 100
Securities
Securities eligible as Level 1 HQLA for the LCR 2,000 100 5
Securities eligible for Level 2A HQLA for the LCR 1,000 150 15
ANNEX
©International Monetary Fund. Not for Redistribution
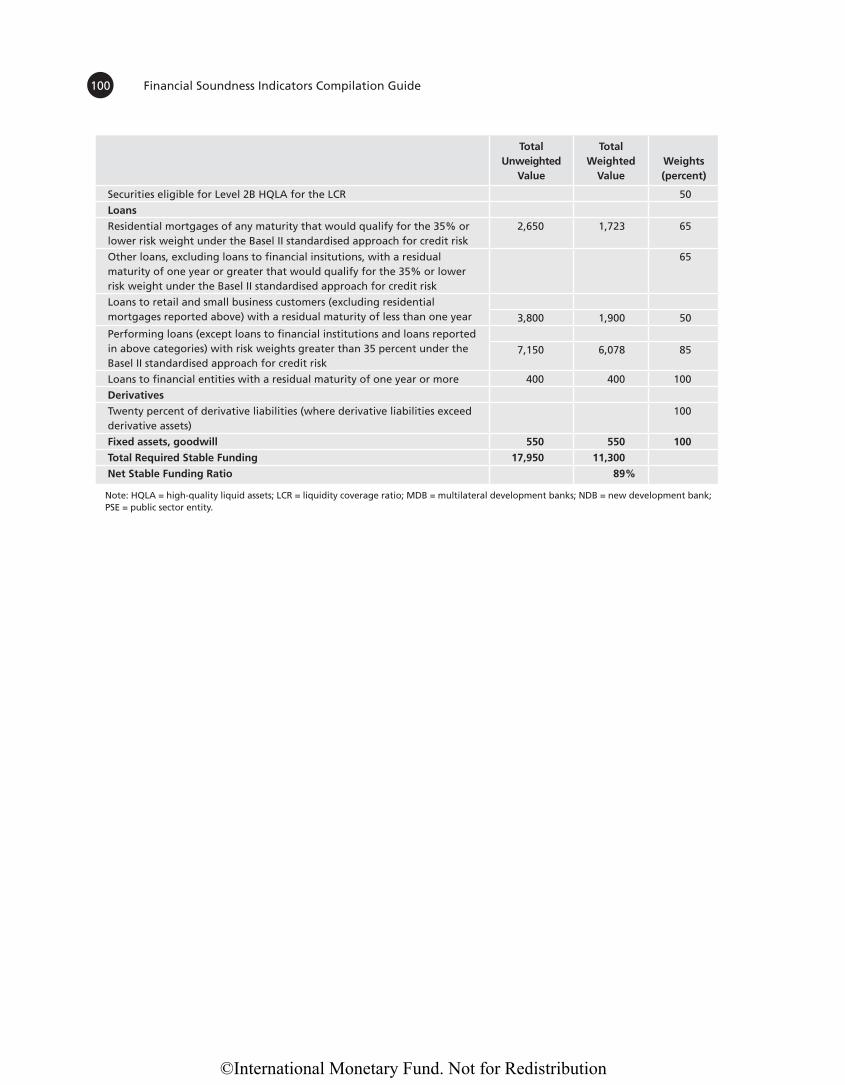
Financial Soundness Indicators Compilation Guide100
Total Unweighted
Value
Total Weighted
ValueWeights (percent)
Securities eligible for Level 2B HQLA for the LCR 50
Loans
Residential mortgages of any maturity that would qualify for the 35% or lower risk weight under the Basel II standardised approach for credit risk
2,650 1,723 65
Other loans, excluding loans to financial insitutions, with a residual maturity of one year or greater that would qualify for the 35% or lower risk weight under the Basel II standardised approach for credit risk
65
Loans to retail and small business customers (excluding residential mortgages reported above) with a residual maturity of less than one year 3,800 1,900 50
Performing loans (except loans to financial institutions and loans reported in above categories) with risk weights greater than 35 percent under the Basel II standardised approach for credit risk
7,150 6,078 85
Loans to financial entities with a residual maturity of one year or more 400 400 100
Derivatives
Twenty percent of derivative liabilities (where derivative liabilities exceed derivative assets)
100
Fixed assets, goodwill 550 550 100
Total Required Stable Funding 17,950 11,300
Net Stable Funding Ratio 89%
Note: HQLA = high-quality liquid assets; LCR = liquidity coverage ratio; MDB = multilateral development banks; NDB = new development bank; PSE = public sector entity.
©International Monetary Fund. Not for Redistribution
Islamic Deposit Takers’ Structures
7.87 Islamic financial systems structures can be grouped into two broad categories:27
(a) A dual system, where both conventional deposit‑ takers (DTs) and IDTs coexist. The IDTs can be stand‑alone entities, subsidiaries of conventional banks, or “Islamic windows.”28 Not all dual systems allow “Islamic windows” (e.g. Bahrain and Jordan).
(b) A full‑fledged Islamic financial system with vir‑tual absence of conventional DTs, where only full‑fledged IDTs are licensed to operate – for example, in the Islamic Republic of Iran and Sudan.
7.88 The principles underpinning Islamic finance generate distinct operations and risk profiles and bal‑ance sheet structures that differ in important respects from conventional banks.29 The differences may affect the compilation and meaning of the FSIs. Although the international prudential and accounting standards that apply to conventional banks are relevant, in significant measure, for IDTs, there is a need for some adjustments to address the specific features of DTs.
7.89 Standards for the Islamic banking indus‑try have been developed in recent years to comple‑ment international conventional banking standards. Specifically, the Islamic Financial Services Board (IFSB)30 has established standards and principles on
7.4 Islamic Deposit Takers and Financial Soundness Indicators
ANNEX
A. Introduction7.84 This annex describes the business model of
Islamic Deposit Takers (IDTs) and how IDTs’ finan‑cial instruments differ from conventional ones. The annex provides guidance to map IDTs’ source data to the necessary balance sheet and income state‑ment templates used to compile FSIs for systems with Islamic banking.
B. Islamic Financial System7.85 Islamic finance refers to the provision of finan‑
cial services in accordance with Shariah principles.24 Shariah bans interest charges (Riba),25 products with excessive uncertainty (Gharar), gambling (Maysir), short sales, as well as financing of prohibited activities considered harmful to society. It also requires parties to honor principles of fair treatment and the sanctity of contracts. Transactions must be underpinned by real economic activities, and there must also be shar‑ing of risks in economic transactions.
7.86 Shariah principles have existed throughout Islamic history but only began to be applied in modern Islamic financial systems in the early 1960s, with the establishment of Egypt’s Mitt Ghamar Savings Bank in 1963. Since then Islamic finance expanded rapidly in several countries in terms of value, market share, geographical reach, and number of institutions. As of end December 2017, Islamic banking had become systemically important in 13 jurisdictions, including Sudan and the Islamic Republic of Iran whose entire banking systems are Islamic banking.26
24 The industry is termed “participation finance” or “noninterest‑bearing finance” in some jurisdictions. 25 Riba is an Arabic word, which is generally translated into English as “usury” or “interest.” 26 The Islamic Financial Services Board (IFSB) defines systemically important to be 15 percent or more of total banking system assets.
27 See the Revised Compilation Guide on Prudential and Structural Islamic Financial Indicators, March 2011. 28 An Islamic Window is a department, branch, or other dedicated unit of a conventional bank that offers Islamic financial services. 29 For an elaboration of the unique risks posed by Islamic Finance, see IMF Staff Discussion Note. Islamic Finance: Opportunities, Challenges and Policy Options SDN/15/05. 30 The IFSB, which is based in Kuala Lumpur, Malaysia, is a global standard setting body for Islamic finance, which prepares prudential standards and guidelines for the regulation of banking, capital markets and Islamic insurance (Takaful). It was officially inaugurated on November 3, 2002 and started operations on March 10, 2003.
©International Monetary Fund. Not for Redistribution
Financial Soundness Indicators Compilation Guide102
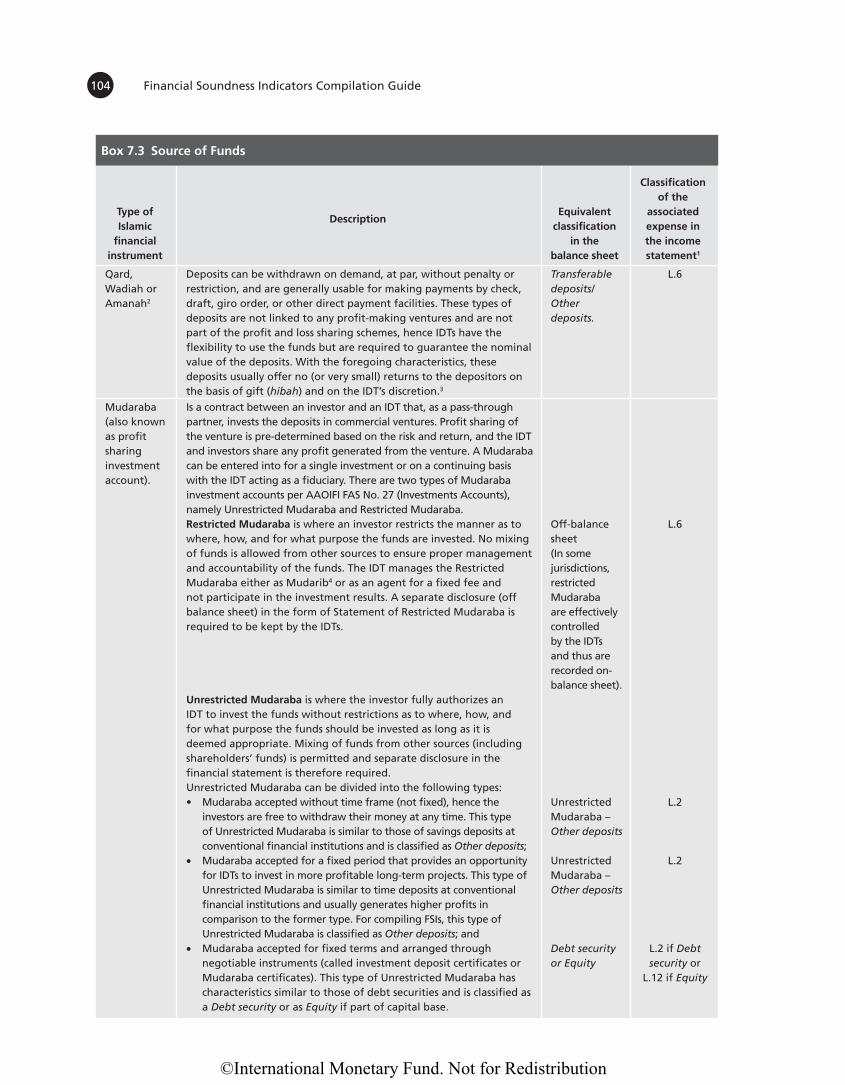
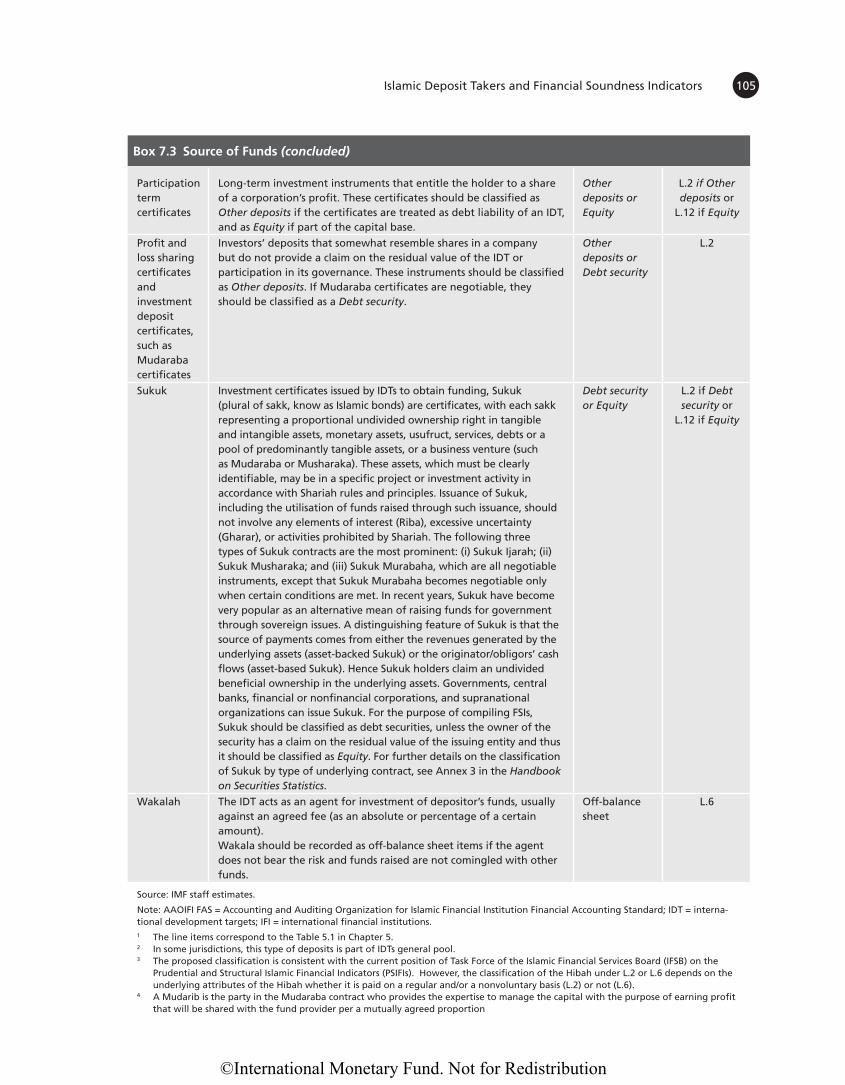
7.92 Under profit and loss sharing (PLS) arrange‑ments, the resources of the IDTs and investors are often pooled to undertake commercial ventures, and the total returns are shared among the IDTs and the investors based on a predetermined profit shar‑ing arrangement. Profits earned could be disbursed during the life of the venture or upon its conclusion. These arrangements can also be generated by issuing securities, called PLS certificates (often classified as “other Shariah‑compliant securities” – that is ‘other’ than Sukuk), that do not provide for either capital cer‑tainty or pre‑fixed positive returns.
7.93 Profit and loss sharing activities are a distin‑guishing feature of the use of funds by IDTs, as the basis of Islamic finance is risk‑sharing between the parties in an underlying asset‑based transaction. IDTs use various Shariah compliant contracts (mode of finance or instrument) or, sometimes combination of contracts, when offering a spectrum of financial structures. The three broad modes of finance are:
(a) Sale‑based contracts: IDTs provide immedi‑ate delivery of the goods or services sought by the customers in exchange for the customers promising to make a series of deferred pay‑ments to the IDTs equal to the cost of the goods or services plus a markup;
(b) Lease‑based contracts: IDTs purchase assets and lease them to the customers in return for instalments that reflect the cost of holding and maintaining the assets; and
(c) Equity‑based or PLS contracts (Mudaraba and Musharaka): IDTs provide funds to an en‑terprise in return for a share of the profits gen‑erated by these PLS arrangements. Mudaraba contracts will be operated by the enterprise with remuneration of the IDT based on pre‑agreed distributions of profits or losses, whereas Musharaka contracts a more fully partnership arrangements in which the IDT can participate in the enterprise’s decision making.
7.94 The boxes 7.3. and 7.4. present a comprehen‑sive list of Islamic financial instruments33 and discuss their classification in the balance sheets and income
31 The AAOIFI is a standard setting body for Islamic finance, which prepares accounting, auditing, and Shariah standards. It was established in 1991 and is based in Manama, Bahrain. 32 The permissibility of Islamic banks to conduct derivatives transaction is subject to the Shariah rulings in a particular jurisdiction. In some jurisdictions it is permitted for banks to use derivatives transactions for hedging purposes. The derivatives are generally structured using Tawarruq and other parallel contracts.
the regulation and supervision of Islamic financial intuitions and activities, including on capital ade‑quacy, governance, risk management and the super‑visory standards to supplement the Basel Committee on Banking Supervision (BCBS). In addition, the Accounting and Auditing Organization for Islamic Financial Institutions (AAOIFI)31 has issued stan‑dards on accounting, auditing, governance, ethics, and Shariah standards on Islamic financial institu‑tions. In order to harmonize the compilation of FSIs, this annex builds on the standard‑setting framework for conventional banks.
C. Islamic Finance Business Model7.90 Since IDTs are prohibited to pay interest, they
are funded by financial instruments without a prom‑ised ex‑ante return (e.g, Qard, Wadiah, or Amanah), as well as profit sharing investment accounts (PSIA) where investors receive returns that are determined ex post by the profitability of the IDT or the pool of assets financed by these accounts. Correspondingly, on the asset side, IDTs do not engage in interest‑based lend‑ing, but in “financing” in the form of sales, lease, profit and loss‑sharing financing, and fee‑based services. On the treasury side, Islamic banks are restricted or prohibited, in many jurisdictions, from undertaking certain types of derivatives; as a result derivatives and hedging instruments tend to have limited and slowly developing markets.32
7.91 In addition to non‑remunerative contracts such as Qard, Wadiah, and Amanah, IDTs earn income by charging fees for services (Wakala), by sharing profit (Mudaraba) or by leasing (Ijarah). Under a Wakala (agency) structure, an investor receives a profit return agreed between the parties at the outset; any profit in excess of the agreed return will be kept by the agent as a performance or incentive fee. In contrast, under a Mudaraba structure, profit/loss is divided between the investor and the bank according to pre‑agreed ratios.
33 The annex only discusses the main Islamic financial instruments and for FSI compilation.
©International Monetary Fund. Not for Redistribution
103 Islamic Deposit Takers and Financial Soundness Indicators
statements of IDTs relative to those of conventional deposit takers.
D. The Capital Adequacy Requirements for Islamic Deposit Takers34
7.95 The computation of capital adequacy ratios (CAR) is similar to the BCBS formulae, but there are important variations in the recognition of eligible capital, risk‑weighted assets, and the treatment of PSIA. In line with the global standard, the IFSB has provided more comprehensive guidance.
Eligible Capital
7.96 The definition of regulatory eligible capital to be used as the numerator in calculating the CAR is defined in Chapter 5. The PSIA are analogous to deposits and they should not be included in capital because they do not meet the requirement to con‑stitute additional Capital (Tier 2).35 The investment equalization reserves (IRR) and a portion of the profit equalization reserves (PER) that belong to the equity of investment account holders (IAH) are not part of the capital of the IDTs.36 As the purpose of a PER is to smooth the profit payouts and not to cover losses, any portion of a PER that is part of the IDTs reserves should also not be treated as part of the reg‑ulatory capital of the IDTs.
7.97 Some types of Sukuk might qualify for inclu‑sion in regulatory capital. Subject to Shariah approval, Musharaka Sukuk may be included as Additional Tier 1 if they meet loss‑absorbency requirements. Also, Mudaraba or Wakala Sukuk may qualify as Tier 2 capital, if the underlying assets are convertible into common equity at the point of non‑viability or insolvency.
Risk-weighted Assets
7.98 Islamic financial instruments are asset‑based (Murabaha, Salam, and Istisna’a), equity‑based (Musharaka and Mudaraba), leasing‑based (Ijara), or Sukuk. The asset‑based instruments bear market risk on the underlying assets and credit risk in respect to the counterparties. The risk exposure of an IDT transforms from market risk to credit risk when an asset is sold to its customer (Murabaha) as the price risk of holding that asset ceases and is replaced by credit risk. Risk‑weighting requirements for equity‑based instruments are based on credit risk require‑ments if they are loan‑like instruments and market risk requirements if they are equity‑like instruments. Sukuk may also be subject to differing approaches to risk‑weighting. Sukuk held in the trading book are subject to credit and market‑risk weighting require‑ments aligned with those for conventional instru‑ments. For the Sukuk held in the banking book, the supervisory authorities have discretion to allow the IDTs that operate within their jurisdictions to specify the internal‑rating based measurement approach to be used.
Profit Sharing Investment Accounts Treatment
7.99 A major difference between IDTs and con‑ventional DTs relates to PSIA loss absorbency. Unless the IDT is guilty of misconduct or negli‑gence, IAH are expected to bear the loss of earnings or investments that were made with their funds, but the IDT bears the costs of operations and thus might experience a net profit or loss. For the calcu‑lation of CAR, the IFSB standard provides two for‑mulas: standard and discretionary. In the standard formula, the risk‑weighted assets (RWA) exclude the assets financed by PSIA. The second formula, referred to as the supervisory discretionary for‑mula, is designed to account for displaced commer‑cial risk (DCR) as determined at the supervisor’s discretion. The DCR is a risk specific to the Islamic banking that rises when an IDT is under pressure to pay its IAHs a rate of return higher than would be payable under the “actual’ terms of the investment contact in order to remain competitive relative to other banks and thus retain customers. The IDTs have discretion to set aside some portion of the profits under special types of reserve, namely, PER
34 This section draws on Chapter 6 of the Revised Compilation Guide on Prudential and Structural Islamic Financial Indicators, March 2011, and on IFSB-15: Revised CAS for institutions offering Islamic financial services (excluding Islamic insurance (Takaful) institutions and Islamic collective investment scheme, December 2013.35 The requirements are loss absorbency, issuance process and procedure, maturity and callable option, distribution of profits, and unsecured in nature. 36Profit equalization reserves (PER) are allocated from operating income for smoothing returns to funders, prior to deducting the Mudarib’s (IDT’s) share. Investment risk reserves (IRR) are set aside from the income share of investment account holders as a cushion for future losses that they may incur.
©International Monetary Fund. Not for Redistribution
Financial Soundness Indicators Compilation Guide104
Type of Islamic
financial instrument
DescriptionEquivalent
classification in the
balance sheet
Classification of the
associated expense in the income statement1
Qard, Wadiah or Amanah2
Deposits can be withdrawn on demand, at par, without penalty or restriction, and are generally usable for making payments by check, draft, giro order, or other direct payment facilities. These types of deposits are not linked to any profit-making ventures and are not part of the profit and loss sharing schemes, hence IDTs have the flexibility to use the funds but are required to guarantee the nominal value of the deposits. With the foregoing characteristics, these deposits usually offer no (or very small) returns to the depositors on the basis of gift (hibah) and on the IDT’s discretion.3
Transferable deposits/Other deposits.
L.6
Mudaraba (also known as profit sharing investment account).
Is a contract between an investor and an IDT that, as a pass-through partner, invests the deposits in commercial ventures. Profit sharing of the venture is pre-determined based on the risk and return, and the IDT and investors share any profit generated from the venture. A Mudaraba can be entered into for a single investment or on a continuing basis with the IDT acting as a fiduciary. There are two types of Mudaraba investment accounts per AAOIFI FAS No. 27 (Investments Accounts), namely Unrestricted Mudaraba and Restricted Mudaraba.Restricted Mudaraba is where an investor restricts the manner as to where, how, and for what purpose the funds are invested. No mixing of funds is allowed from other sources to ensure proper management and accountability of the funds. The IDT manages the Restricted Mudaraba either as Mudarib4 or as an agent for a fixed fee and not participate in the investment results. A separate disclosure (off balance sheet) in the form of Statement of Restricted Mudaraba is required to be kept by the IDTs.
Unrestricted Mudaraba is where the investor fully authorizes an IDT to invest the funds without restrictions as to where, how, and for what purpose the funds should be invested as long as it is deemed appropriate. Mixing of funds from other sources (including shareholders’ funds) is permitted and separate disclosure in the financial statement is therefore required. Unrestricted Mudaraba can be divided into the following types: • Mudaraba accepted without time frame (not fixed), hence the
investors are free to withdraw their money at any time. This type of Unrestricted Mudaraba is similar to those of savings deposits at conventional financial institutions and is classified as Other deposits;
• Mudaraba accepted for a fixed period that provides an opportunity for IDTs to invest in more profitable long-term projects. This type of Unrestricted Mudaraba is similar to time deposits at conventional financial institutions and usually generates higher profits in comparison to the former type. For compiling FSIs, this type of Unrestricted Mudaraba is classified as Other deposits; and
• Mudaraba accepted for fixed terms and arranged through negotiable instruments (called investment deposit certificates or Mudaraba certificates). This type of Unrestricted Mudaraba has characteristics similar to those of debt securities and is classified as a Debt security or as Equity if part of capital base.
Off-balance sheet(In some jurisdictions, restricted Mudaraba are effectively controlled by the IDTs and thus are recorded on-balance sheet).
Unrestricted Mudaraba –Other deposits
Unrestricted Mudaraba –Other deposits
Debt security or Equity
L.6
L.2
L.2
L.2 if Debt security or
L.12 if Equity
Box 7.3 Source of Funds
©International Monetary Fund. Not for Redistribution
105 Islamic Deposit Takers and Financial Soundness Indicators
Participation term certificates
Long-term investment instruments that entitle the holder to a share of a corporation’s profit. These certificates should be classified as Other deposits if the certificates are treated as debt liability of an IDT, and as Equity if part of the capital base.
Other deposits or Equity
L.2 if Other deposits or
L.12 if Equity
Profit and loss sharing certificates and investment deposit certificates, such as Mudaraba certificates
Investors’ deposits that somewhat resemble shares in a company but do not provide a claim on the residual value of the IDT or participation in its governance. These instruments should be classified as Other deposits. If Mudaraba certificates are negotiable, they should be classified as a Debt security.
Other deposits or Debt security
L.2
Sukuk Investment certificates issued by IDTs to obtain funding, Sukuk (plural of sakk, know as Islamic bonds) are certificates, with each sakk representing a proportional undivided ownership right in tangible and intangible assets, monetary assets, usufruct, services, debts or a pool of predominantly tangible assets, or a business venture (such as Mudaraba or Musharaka). These assets, which must be clearly identifiable, may be in a specific project or investment activity in accordance with Shariah rules and principles. Issuance of Sukuk, including the utilisation of funds raised through such issuance, should not involve any elements of interest (Riba), excessive uncertainty (Gharar), or activities prohibited by Shariah. The following three types of Sukuk contracts are the most prominent: (i) Sukuk Ijarah; (ii) Sukuk Musharaka; and (iii) Sukuk Murabaha, which are all negotiable instruments, except that Sukuk Murabaha becomes negotiable only when certain conditions are met. In recent years, Sukuk have become very popular as an alternative mean of raising funds for government through sovereign issues. A distinguishing feature of Sukuk is that the source of payments comes from either the revenues generated by the underlying assets (asset-backed Sukuk) or the originator/obligors’ cash flows (asset-based Sukuk). Hence Sukuk holders claim an undivided beneficial ownership in the underlying assets. Governments, central banks, financial or nonfinancial corporations, and supranational organizations can issue Sukuk. For the purpose of compiling FSIs, Sukuk should be classified as debt securities, unless the owner of the security has a claim on the residual value of the issuing entity and thus it should be classified as Equity. For further details on the classification of Sukuk by type of underlying contract, see Annex 3 in the Handbook on Securities Statistics.
Debt security or Equity
L.2 if Debt security or
L.12 if Equity
Wakalah The IDT acts as an agent for investment of depositor’s funds, usually against an agreed fee (as an absolute or percentage of a certain amount).Wakala should be recorded as off-balance sheet items if the agent does not bear the risk and funds raised are not comingled with other funds.
Off-balance sheet
L.6
Source: IMF staff estimates.
Note: AAOIFI FAS = Accounting and Auditing Organization for Islamic Financial Institution Financial Accounting Standard; IDT = interna-tional development targets; IFI = international financial institutions.1 The line items correspond to the Table 5.1 in Chapter 5.2 In some jurisdictions, this type of deposits is part of IDTs general pool.3 The proposed classification is consistent with the current position of Task Force of the Islamic Financial Services Board (IFSB) on the
Prudential and Structural Islamic Financial Indicators (PSIFIs). However, the classification of the Hibah under L.2 or L.6 depends on the underlying attributes of the Hibah whether it is paid on a regular and/or a nonvoluntary basis (L.2) or not (L.6).
4 A Mudarib is the party in the Mudaraba contract who provides the expertise to manage the capital with the purpose of earning profit that will be shared with the fund provider per a mutually agreed proportion
Box 7.3 Source of Funds (concluded)
©International Monetary Fund. Not for Redistribution
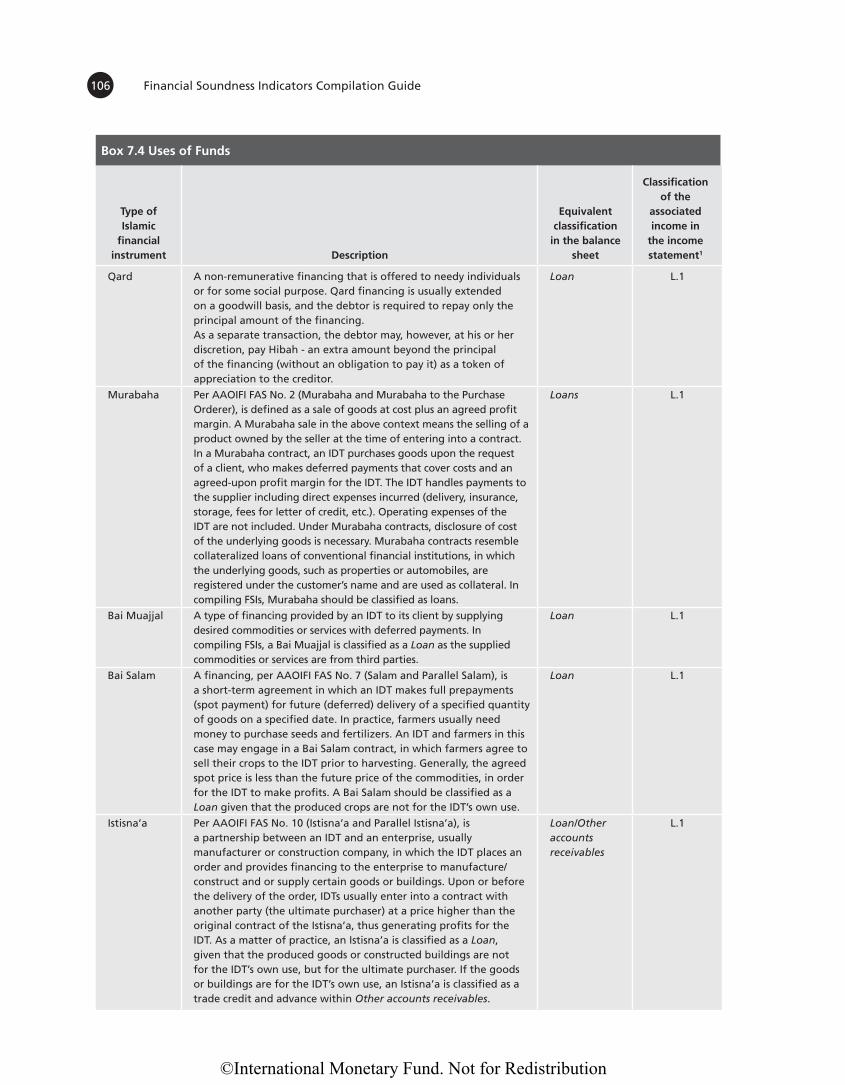
Financial Soundness Indicators Compilation Guide106
Box 7.4 Uses of Funds
Type of Islamic
financial instrument Description
Equivalent classification
in the balance sheet
Classification of the
associated income in
the income statement1
Qard A non-remunerative financing that is offered to needy individuals or for some social purpose. Qard financing is usually extended on a goodwill basis, and the debtor is required to repay only the principal amount of the financing. As a separate transaction, the debtor may, however, at his or her discretion, pay Hibah - an extra amount beyond the principal of the financing (without an obligation to pay it) as a token of appreciation to the creditor.
Loan L.1
Murabaha Per AAOIFI FAS No. 2 (Murabaha and Murabaha to the Purchase Orderer), is defined as a sale of goods at cost plus an agreed profit margin. A Murabaha sale in the above context means the selling of a product owned by the seller at the time of entering into a contract. In a Murabaha contract, an IDT purchases goods upon the request of a client, who makes deferred payments that cover costs and an agreed-upon profit margin for the IDT. The IDT handles payments to the supplier including direct expenses incurred (delivery, insurance, storage, fees for letter of credit, etc.). Operating expenses of the IDT are not included. Under Murabaha contracts, disclosure of cost of the underlying goods is necessary. Murabaha contracts resemble collateralized loans of conventional financial institutions, in which the underlying goods, such as properties or automobiles, are registered under the customer’s name and are used as collateral. In compiling FSIs, Murabaha should be classified as loans.
Loans L.1
Bai Muajjal A type of financing provided by an IDT to its client by supplying desired commodities or services with deferred payments. In compiling FSIs, a Bai Muajjal is classified as a Loan as the supplied commodities or services are from third parties.
Loan L.1
Bai Salam A financing, per AAOIFI FAS No. 7 (Salam and Parallel Salam), is a short-term agreement in which an IDT makes full prepayments (spot payment) for future (deferred) delivery of a specified quantity of goods on a specified date. In practice, farmers usually need money to purchase seeds and fertilizers. An IDT and farmers in this case may engage in a Bai Salam contract, in which farmers agree to sell their crops to the IDT prior to harvesting. Generally, the agreed spot price is less than the future price of the commodities, in order for the IDT to make profits. A Bai Salam should be classified as a Loan given that the produced crops are not for the IDT’s own use.
Loan L.1
Istisna’a Per AAOIFI FAS No. 10 (Istisna’a and Parallel Istisna’a), is a partnership between an IDT and an enterprise, usually manufacturer or construction company, in which the IDT places an order and provides financing to the enterprise to manufacture/construct and or supply certain goods or buildings. Upon or before the delivery of the order, IDTs usually enter into a contract with another party (the ultimate purchaser) at a price higher than the original contract of the Istisna’a, thus generating profits for the IDT. As a matter of practice, an Istisna’a is classified as a Loan, given that the produced goods or constructed buildings are not for the IDT’s own use, but for the ultimate purchaser. If the goods or buildings are for the IDT’s own use, an Istisna’a is classified as a trade credit and advance within Other accounts receivables.
Loan/Other accounts receivables
L.1
©International Monetary Fund. Not for Redistribution
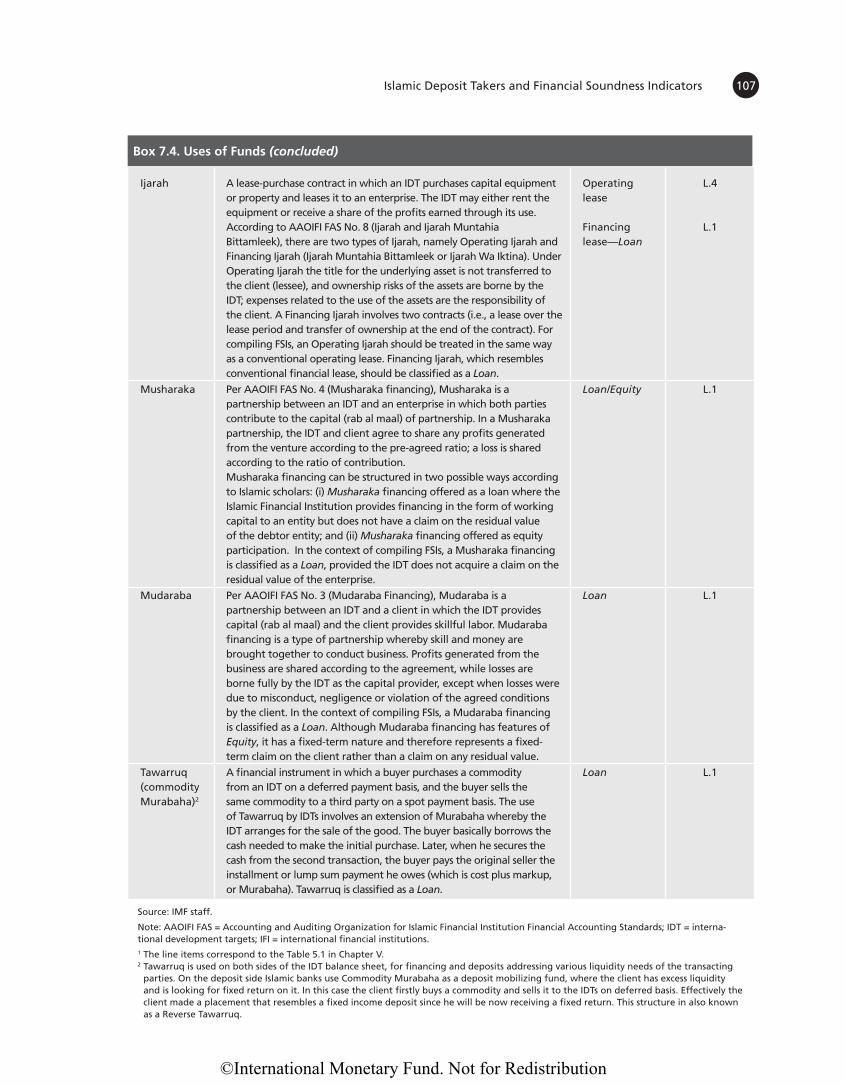
107 Islamic Deposit Takers and Financial Soundness Indicators
Ijarah A lease-purchase contract in which an IDT purchases capital equipment or property and leases it to an enterprise. The IDT may either rent the equipment or receive a share of the profits earned through its use. According to AAOIFI FAS No. 8 (Ijarah and Ijarah Muntahia Bittamleek), there are two types of Ijarah, namely Operating Ijarah and Financing Ijarah (Ijarah Muntahia Bittamleek or Ijarah Wa Iktina). Under Operating Ijarah the title for the underlying asset is not transferred to the client (lessee), and ownership risks of the assets are borne by the IDT; expenses related to the use of the assets are the responsibility of the client. A Financing Ijarah involves two contracts (i.e., a lease over the lease period and transfer of ownership at the end of the contract). For compiling FSIs, an Operating Ijarah should be treated in the same way as a conventional operating lease. Financing Ijarah, which resembles conventional financial lease, should be classified as a Loan.
Operating lease
Financing lease—Loan
L.4
L.1
Musharaka Per AAOIFI FAS No. 4 (Musharaka financing), Musharaka is a partnership between an IDT and an enterprise in which both parties contribute to the capital (rab al maal) of partnership. In a Musharaka partnership, the IDT and client agree to share any profits generated from the venture according to the pre-agreed ratio; a loss is shared according to the ratio of contribution. Musharaka financing can be structured in two possible ways according to Islamic scholars: (i) Musharaka financing offered as a loan where the Islamic Financial Institution provides financing in the form of working capital to an entity but does not have a claim on the residual value of the debtor entity; and (ii) Musharaka financing offered as equity participation. In the context of compiling FSIs, a Musharaka financing is classified as a Loan, provided the IDT does not acquire a claim on the residual value of the enterprise.
Loan/Equity L.1
Mudaraba Per AAOIFI FAS No. 3 (Mudaraba Financing), Mudaraba is a partnership between an IDT and a client in which the IDT provides capital (rab al maal) and the client provides skillful labor. Mudaraba financing is a type of partnership whereby skill and money are brought together to conduct business. Profits generated from the business are shared according to the agreement, while losses are borne fully by the IDT as the capital provider, except when losses were due to misconduct, negligence or violation of the agreed conditions by the client. In the context of compiling FSIs, a Mudaraba financing is classified as a Loan. Although Mudaraba financing has features of Equity, it has a fixed-term nature and therefore represents a fixed-term claim on the client rather than a claim on any residual value.
Loan L.1
Tawarruq (commodity Murabaha)2
A financial instrument in which a buyer purchases a commodity from an IDT on a deferred payment basis, and the buyer sells the same commodity to a third party on a spot payment basis. The use of Tawarruq by IDTs involves an extension of Murabaha whereby the IDT arranges for the sale of the good. The buyer basically borrows the cash needed to make the initial purchase. Later, when he secures the cash from the second transaction, the buyer pays the original seller the installment or lump sum payment he owes (which is cost plus markup, or Murabaha). Tawarruq is classified as a Loan.
Loan L.1
Source: IMF staff.
Note: AAOIFI FAS = Accounting and Auditing Organization for Islamic Financial Institution Financial Accounting Standards; IDT = interna-tional development targets; IFI = international financial institutions.1 The line items correspond to the Table 5.1 in Chapter V.2 Tawarruq is used on both sides of the IDT balance sheet, for financing and deposits addressing various liquidity needs of the transacting
parties. On the deposit side Islamic banks use Commodity Murabaha as a deposit mobilizing fund, where the client has excess liquidity and is looking for fixed return on it. In this case the client firstly buys a commodity and sells it to the IDTs on deferred basis. Effectively the client made a placement that resembles a fixed income deposit since he will be now receiving a fixed return. This structure in also known as a Reverse Tawarruq.
Box 7.4. Uses of Funds (concluded)
©International Monetary Fund. Not for Redistribution
Financial Soundness Indicators Compilation Guide108
to mitigate the DCR. Hence, instead of excluding all the funds that belong to the PSIA from RWA, only a portion adjusted for the DCR is excluded because it can be borne by the IDT.37 In some jurisdictions, the adjustment is made simply on the expectation that the IDT should carry greater amounts of capital as a protection for depositors. This portion of RWA is arbitrarily denoted by the Greek letter α “alpha”. The quantification and use of this alpha parameter in the CAR calculation is subject to supervisory discretion and differs considerably across jurisdictions.
7.100 Due to the national discretion in the various implementation of Basel standards, the compilers will rely on national standards for the FSIs compu‑tation and should document in the metadata any departures. At time of publication, Islamic banks in various jurisdictions operate under Basel I, Basel II, or Basel III – the standard used should always be described in metadata.
E. Financial Soundness Indicators for Islamic Deposit Takers
7.101 The limited availability of statistical informa‑tion on the Islamic financial services industry world‑wide has hindered accurate and comprehensive analysis and assessment of developments in the industry. More specifically, the lack of cross‑country historical data with sufficiently long time‑series has been identified as one of the major challenges faced by the IFSB in devel‑oping its international prudential standards.
7.102 For this reason, the IFSB has developed FSI equivalents for IDTs—Prudential and Structural Islamic Financial Indicators (PSIFIs).38 The PSIFI Compilation Guide was issued in 2008 and revised in March 2011. Furthermore, in November 2014 a sup‑plement for the PSIFI Compilation Guide was issued to update the list of indicators to be compiled by IDTs under the IFSB’s project on the implementation of PSIFIs.
7.103 The changes in the list of PSIFIs reflect les‑sons learned during the global financial crisis that began in 2007, revisions to global regulatory frame‑work in Basel III and corresponding IFSB standards,
modifications to the list of IMF’s FSIs, proposals by the Statistical, Economic, and Social Research and Train‑ing Centre for Islamic Countries (SESRIC), and expe‑riences of the IFSB and IMF in working with countries to compile and disseminate soundness indicators.
7.104 The prudential indicators are divided into core indicators and additional indicators. The core indicators, which closely correspond to the Core FSIs specified in the Guide, are commonly used banking indicators, and are analyzed in the IFSB’s annual Islamic Financial Services Industry Stability Report.39 The set of core indicators includes series related to Basel III items or which have demon‑strated importance during the crisis. The struc‑tural indicators are indications of the size and structure of the Islamic banking sector. The IFSB recommended that all countries with Islamic bank‑ing should compile separate sets of prudential and structural indicators for stand‑alone IDTs and Islamic windows of conventional DTs because of differences in their capital structure and liquidity arrangements. All the indicators remain the same for IDTs and Islamic windows except for some dif‑ference in the structural indicators.
F. Mapping Islamic Deposit Takers’ Financial Statements40
7.105 This section provides guidance on how to map the financial information from the IDTs income statement, balance sheet, and other related infor‑mation to the FSI’s financial statements for deposit takers (income statement, balance sheet, and memo‑randum series) as recommended in this Guide.
7.106 Due to differences in business models across IDTs and DTs, some core FSIs for DTs, such as the margin between interest receipts and payments income and expense, do not apply to IDTs. However, for countries with dual DT systems, in order to com‑pile the system’s FSIs, there is a need to map the Islamic
39 The IFSB also developed a series of structural indicators for IDTs to capture information on features of Islamic banking sectors not otherwise available; number of institutions, number of windows, total assets, total revenues, earnings, financing by type of Islamic financial instrument, assets of systemically important IDTs, etc.40 This section draws on Chapter 4 of the Revised Compilation Guide on Prudential and Structural Islamic Financial Indicators, March 2011.
37 IFSB Guidance Note 15 provides more details. 38 See the Revised Compilation Guide on Prudential and Structural Islamic Financial Indicators, March 2011.
©International Monetary Fund. Not for Redistribution
109 Islamic Deposit Takers and Financial Soundness Indicators
financial instruments to the conventional ones. For example, the profits generated from loan and deposit‑like instruments and Shariah‑compliant securities, will be analogous to interest income/expense.
7.107 The reporting of the financial statements and the FSIs should be based on the table 5.1 of Chapter 5 which is intended to provide guidance to countries in preparing and producing the aggregated financial statements and the memorandum series for the whole deposit takers sector that encompass both IDTs and DTs. To ensure cross‑country comparability Table 7.1 shows a suggested mapping of Islamic instruments to the required line items of the Table 5.1. These sug‑gested items in italic format as mentioned in Table 7.1 are not to be reported but are shown as a guidance for compilers.
7.108 The mapping set out in the Table 7.1. speci‑fies the data sources to draw from for the compilation of the full range of FSIs in this Guide. One key chal‑lenge is the classification of the PER and IRR. Unlike conventional banks, the IDTs undertake some risk‑sharing activities with their fund providers and/or depositors. For harmonizing the FSIs compilation, it is necessary to consider the specificities of the Islamic finance and to classify the PER and IRR to best equiv‑alent financial instruments. For the FSIs compilation, these instruments should be associated with their PSIA, under deposits.
7.109 One key issue in the compilation of FSIs for IDT is how to classify the returns on deposits/financ‑ing, financial lease, and Islamic bonds (Sukuk) as interest. In this section, as Islamic rules and principles (Sharia), prohibits usurious payment (riba), including predetermined returns on borrowed funds. Therefore, for FSI purposes, the term adopted to distinguish the Islamic return from conventional interest is “financing and investment income.”41
7.110 Some of the series required to calculate the FSIs are not directly available from the financial state‑ments. They are included as memorandum items to the financial statements. The supervisory‑based items for the IDTs series are different from those of conventional banks, regarding the CAR. Although the Basel Capital Accord was not intended for IDTs, the IFSB developed a parallel Capital Adequacy Standard (CAS) for IDTs. Table 7.1 highlights selected memorandum series that require additional guidance information for compiling these series for the IDTs.
41 Under the auspices of the Inter Secretariat Working Group on National Accounts (ISWGNA) work is ongoing to reconcile the classification of the property income associated with Islamic financial instruments as interest within the System of National Accounts (SNA) and the prohibition of interest in the Shariah law.
©International Monetary Fund. Not for Redistribution
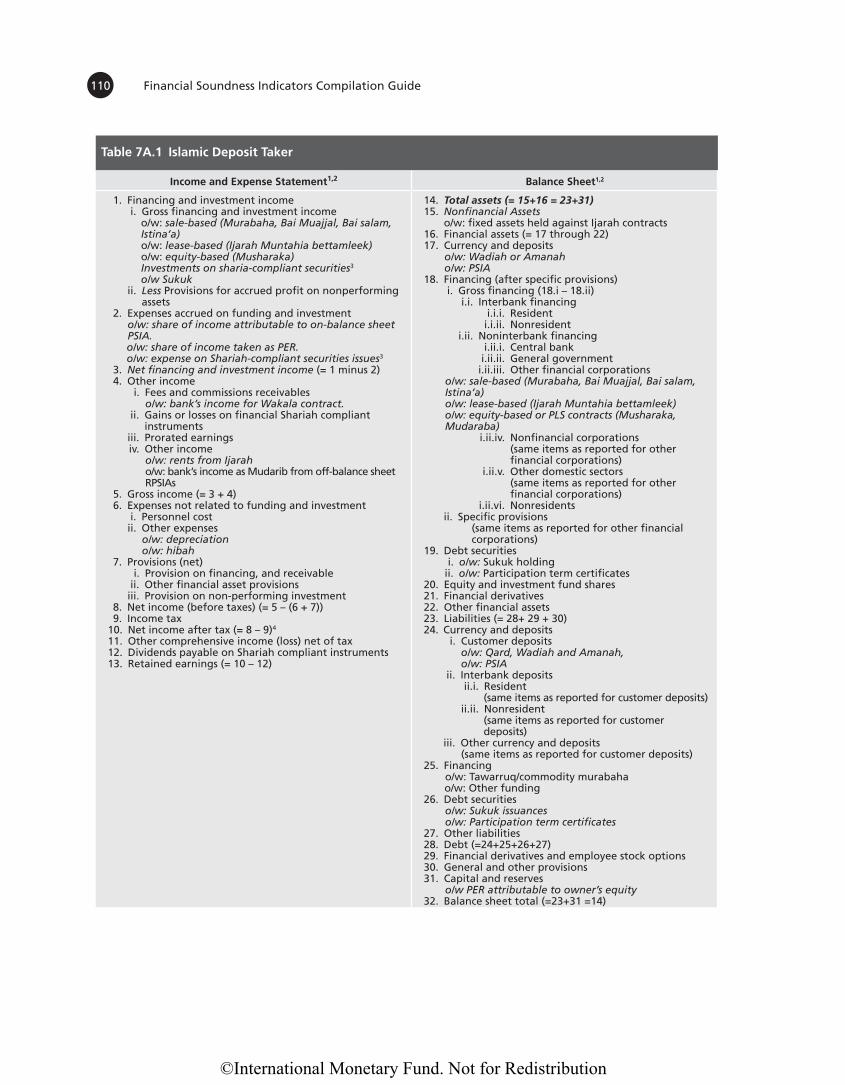
Financial Soundness Indicators Compilation Guide110
Table 7A.1 Islamic Deposit Taker
Income and Expense Statement1,2 Balance Sheet1,2
1. Financing and investment income i. Gross financing and investment income o/w: sale-based (Murabaha, Bai Muajjal, Bai salam,
Istina’a) o/w: lease-based (Ijarah Muntahia bettamleek) o/w: equity-based (Musharaka) Investments on sharia-compliant securities3 o/w Sukuk ii. Less Provisions for accrued profit on nonperforming
assets 2. Expenses accrued on funding and investment o/w: share of income attributable to on-balance sheet
PSIA. o/w: share of income taken as PER. o/w: expense on Shariah-compliant securities issues3
3. Net financing and investment income (= 1 minus 2) 4. Other income
i. Fees and commissions receivables o/w: bank’s income for Wakala contract. ii. Gains or losses on financial Shariah compliant
instruments iii. Prorated earnings
iv. Other income o/w: rents from Ijarah o/w: bank’s income as Mudarib from off-balance sheet
RPSIAs 5. Gross income (= 3 + 4) 6. Expenses not related to funding and investment i. Personnel cost ii. Other expenses o/w: depreciation o/w: hibah 7. Provisions (net)
i. Provision on financing, and receivable ii. Other financial asset provisions iii. Provision on non-performing investment
8. Net income (before taxes) (= 5 – (6 + 7)) 9. Income tax 10. Net income after tax (= 8 – 9)4
11. Other comprehensive income (loss) net of tax12. Dividends payable on Shariah compliant instruments 13. Retained earnings (= 10 – 12)
14. Total assets (= 15+16 = 23+31) 15. Nonfinancial Assets o/w: fixed assets held against Ijarah contracts16. Financial assets (= 17 through 22) 17. Currency and deposits o/w: Wadiah or Amanah o/w: PSIA 18. Financing (after specific provisions) i. Gross financing (18.i – 18.ii)
i.i. Interbank financing i.i.i. Resident i.i.ii. Nonresident
i.ii. Noninterbank financing i.ii.i. Central bank i.ii.ii. General government i.ii.iii. Other financial corporations
o/w: sale-based (Murabaha, Bai Muajjal, Bai salam, Istina’a)
o/w: lease-based (Ijarah Muntahia bettamleek) o/w: equity-based or PLS contracts (Musharaka,
Mudaraba) i.ii.iv. Nonfinancial corporations
(same items as reported for other financial corporations)
i.ii.v. Other domestic sectors (same items as reported for other
financial corporations) i.ii.vi. Nonresidents
ii. Specific provisions (same items as reported for other financial
corporations)19. Debt securities i. o/w: Sukuk holding ii. o/w: Participation term certificates 20. Equity and investment fund shares 21. Financial derivatives 22. Other financial assets 23. Liabilities (= 28+ 29 + 30) 24. Currency and deposits
i. Customer deposits o/w: Qard, Wadiah and Amanah, o/w: PSIA
ii. Interbank deposits ii.i. Resident
(same items as reported for customer deposits) ii.ii. Nonresident
(same items as reported for customer deposits)
iii. Other currency and deposits (same items as reported for customer deposits)
25. Financing o/w: Tawarruq/commodity murabaha o/w: Other funding 26. Debt securities o/w: Sukuk issuances o/w: Participation term certificates27. Other liabilities 28. Debt (=24+25+26+27) 29. Financial derivatives and employee stock options30. General and other provisions31. Capital and reserves o/w PER attributable to owner’s equity32. Balance sheet total (=23+31 =14)
©International Monetary Fund. Not for Redistribution
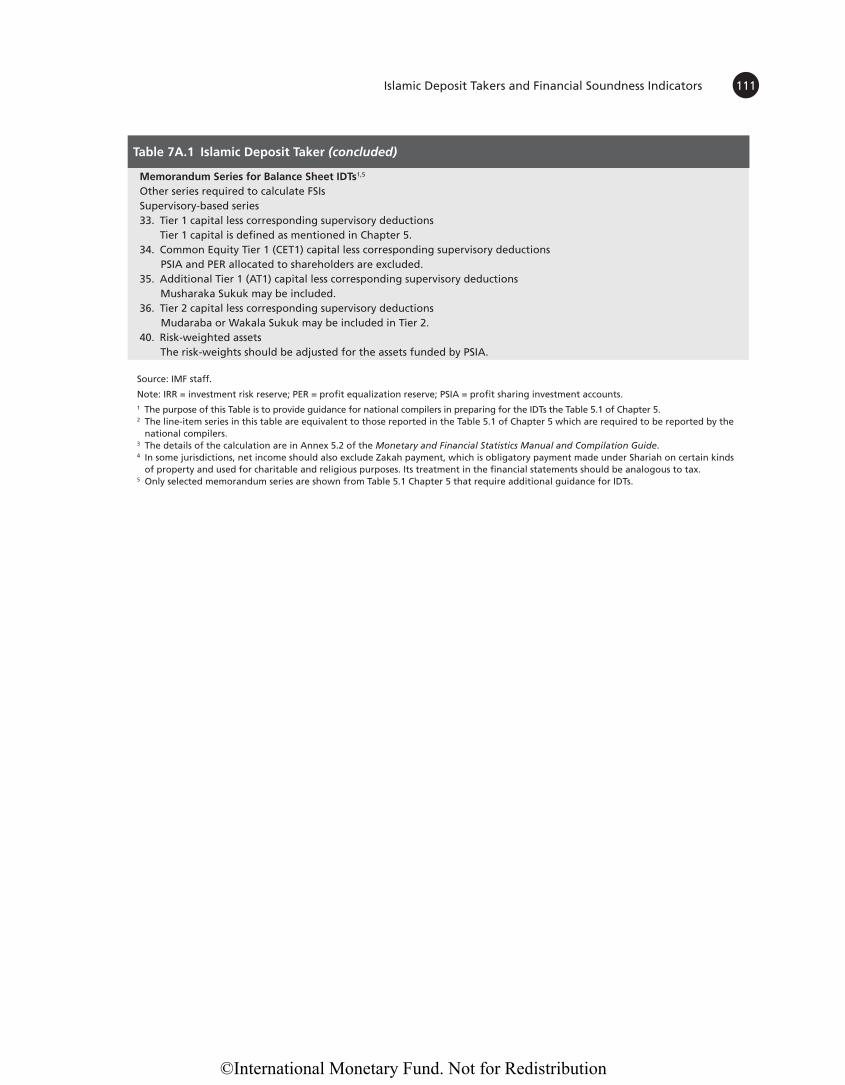
111 Islamic Deposit Takers and Financial Soundness Indicators
Table 7A.1 Islamic Deposit Taker (concluded)
Memorandum Series for Balance Sheet IDTs1,5
Other series required to calculate FSIs Supervisory-based series33. Tier 1 capital less corresponding supervisory deductions Tier 1 capital is defined as mentioned in Chapter 5. 34. Common Equity Tier 1 (CET1) capital less corresponding supervisory deductions PSIA and PER allocated to shareholders are excluded. 35. Additional Tier 1 (AT1) capital less corresponding supervisory deductions Musharaka Sukuk may be included. 36. Tier 2 capital less corresponding supervisory deductions Mudaraba or Wakala Sukuk may be included in Tier 2.40. Risk-weighted assets The risk-weights should be adjusted for the assets funded by PSIA.
Source: IMF staff.
Note: IRR = investment risk reserve; PER = profit equalization reserve; PSIA = profit sharing investment accounts.1 The purpose of this Table is to provide guidance for national compilers in preparing for the IDTs the Table 5.1 of Chapter 5.2 The line-item series in this table are equivalent to those reported in the Table 5.1 of Chapter 5 which are required to be reported by the
national compilers.3 The details of the calculation are in Annex 5.2 of the Monetary and Financial Statistics Manual and Compilation Guide.4 In some jurisdictions, net income should also exclude Zakah payment, which is obligatory payment made under Shariah on certain kinds
of property and used for charitable and religious purposes. Its treatment in the financial statements should be analogous to tax. 5 Only selected memorandum series are shown from Table 5.1 Chapter 5 that require additional guidance for IDTs.
©International Monetary Fund. Not for Redistribution