the kindest cut
TRANSCRIPT
The Kindest Cut: Enhancing the User Experience of Mobile TV through Adequate Zooming
Hendrik Knoche Dept. of Computer Science University College London
Gower st London, WC1E 6BT, UK
+44 207 679 3642 [email protected]
Marco Papaleo DEIS/ARCES University of Bologna
Via V. Toffano, 2/2 40125 – Bologna, Italy
+39 051 2095407 [email protected]
M. Angela Sasse
Dept. of Computer Science University College London Gower st
London, WC1E 6BT, UK +44 207 679 7212
Alessandro Vanelli-Coralli DEIS University of Bologna
Via V. Toffano, 2/2 40125 – Bologna, Italy
+39 051 209 3063 [email protected]
ABSTRACT The growing market of Mobile TV requires automated adaptation of standard TV footage to small size displays. Especially extreme long shots (XLS) depicting distant objects can spoil the user experience, e.g. in soccer content. Automated zooming schemes can improve the visual experience if the resulting footage meets user expectations in terms of the visual detail and quality but does not omit valuable context information. Current zooming schemes are ignorant of beneficial zoom ranges for a given target size when applied to standard definition TV footage. In two experiments 84 participants were able to switch between original and zoom enhanced soccer footage at three sizes - from 320x240 (QVGA) down to 176x144 (QCIF). Eye-tracking and subjective ratings showed that zoom factors between 1.14 and 1.33 were preferred for all sizes. Interviews revealed that a zoom factor of 1.6 was too high for QVGA content due to low perceived video quality, but beneficial for QCIF size. The optimal zoom depended on the target display size. We include a function to compute the optimal zoom for XLS depending on the target device size. It can be applied in automatic content adaptation schemes and should stimulate further research on the requirements of different shot types in video coding.
Categories and Subject Descriptors H.5.1 Multimedia Information services – Evaluation/ methodology. H5.2 User Interfaces [user-centered design]
General Terms Design, Experimentation, Human Factors
Keywords Zooming, Mobile TV, multimedia content enhancement, video, user experience, mobile devices, eye-tracking.
1. INTRODUCTION Recent research shows that an estimated 69 million people will make use of mobile TV through a variety of services by 2009 [32]. Sports coverage, especially soccer is one of the most popular content types for Mobile TV [4]. By 2012, the worldwide capital expenditure of mobile operators will exceed $150 billion to improve coverage and rollout advanced services such as mobile TV [1]. Mobile TV has become available in several countries and in several forms, but the number of users currently lags behind expectations. The quality of video content delivered at restricted bandwidth and onto small screens deters customers - particularly those who have not experienced it first hand [14]. Service providers are seeking ways to enhance the quality of experience of mobile TV. The user experience in mobile TV is dominated by the limited presentation space and the failure to adapt broadcast content to these limitations. Content providers such as ESPN [8] and academic research [17] have identified extreme long shots, which depict objects from a great distance, as one of the key problems on small, low-resolution displays. Removing extreme long shots through bespoke editing and content creation is expensive [32] and service providers are therefore looking for automated ways of adapting existing TV content to mobile devices. The most promising approach to enhancing extreme long shots on mobile devices is zooming, i.e., showing only part of the original footage but with greater level of detail compared to the whole pictures resized to the target resolution. A number of necessary partial solutions such as scene boundary detection [20], shot type identification of frames [34], and regions of interest (RoI) within a frame [2] [18] have already been developed to support automated zooming. For soccer content an automatic zooming method exists which is based on domain-specific features but the size of the zooming window was left for future research [25].
However, to date there has been no empirical research on what zoom factors produce the best user experience and how they vary depending on the target display size. There are a number of factors that affect the perceived quality of resized video footage from TV to mobile resolutions.
Permission to make digital or hard copies of all or part of this work for personal or classroom use is granted without fee provided that copies are not made or distributed for profit or commercial advantage and that copies bear this notice and the full citation on the first page. To copy otherwise, or republish, to post on servers or to redistribute to lists, requires prior specific permission and/or a fee. MM’07, September 23–28, 2007, Augsburg, Bavaria, Germany. Copyright 2007 ACM 978-1-59593-701-8/07/0009...$5.00.
87

1. The resolution of standard TV footage is limited and therefore can only afford a finite amount of zoom. Due to the high motion nature of sports the content is resource demanding in terms of encoding bandwidth and the picture quality degrades in bandwidth constrained delivery scenarios typical for mobile TV.
2. Viewers have higher standards for the sharpness of smaller and far away objects in still pictures [7], [13], [5]. Downsizing pictures increases the perceived sharpness but zooming reduces this benefit and might expose to a greater extent these perceptual imperfections.
3. Extreme long shots contain far away objects that are in general more subject to e.g. blur due to camera shake.
4. In extreme long shots of field sports regions of interest are harder to decide as information is scattered across the screen and zooming can remove valuable context information.
The aim of the research presented in this paper is to determine the optimal zoom factors depending on the target device size in terms of its native resolution. In two studies, we evaluated the impact of three different zoom factors on user perception. We looked at extreme long shots in soccer content at three sizes. Our results show that a significant majority of participants preferred extreme long shots of soccer, which were presented at zoom factors between 1.13 and 1.44 for all tested sizes over the original footage. A zoom factor of 1.6 had adverse effects on the perceived video quality for content presented at QVGA (320x240) size. We collected explicit preference ratings and verbal feedback on the experience from 84 participants. Additionally, we monitored user preferences through eye-tracking, which allowed for a scene-by-scene comparison of viewing preferences for the two different formats. Our results are based on conservative estimates, which can be generalized to other content types from standard definition (SD) TV employing extreme long shots.
In section 2, we review previous work on user experience with multimedia content on mobile devices and low resolution. We then present the first and second study and analyze their combined findings in the discussion section. A summary concludes the paper.
2. BACKGROUND Multimedia services on mobile devices are becoming increasingly popular. Mobile TV and video can be viewed on a growing number of devices, from video Ipods to portable play stations, and DVB-H enabled video phones. However, the limited screen size of those devices deters people who have not watched multimedia content on portable devices [14]. Service providers are looking for ways to improve the visual experience on mobile devices. In sports coverage for mobile devices, ESPN aims to minimize the use of long shots in its coverage [8], instead using more high-lights with close-up shots. However, producing bespoke mobile content is expensive, and most customers are reluctant to pay a premium for mobile content [19]. Thus, service providers look for automated, low-cost solutions to repurpose existing material and which maximize the user experience on mobile devices. Sports content coverage is one example of content that has a great appeal to those who consider watching it live [14] and they might follow it for more than the 10 minute intervals that are otherwise
typical for mobile TV use spurts [28]. Like most field sports, soccer footage relies heavily on extreme long shots, which are also common in other content types. Earlier studies showed that even in highlights footage of soccer goals produced for TV the share of XLSs was larger than 50% [17]. The amount of detail is important in the presentation of the players on the screen for recognition and ease of following the ball. McCarthy et al. showed that visual detail in soccer footage took precedence over the presentation of smooth motion through high frame rates [22]. Despite high encoding bitrates and corresponding video quality, soccer content was not acceptable to a large part of the audience because of a lack of detail and viewing comfort at sizes below 168x128 [16]. Apart from zooming, previous research has addressed the problem of miniaturization in sports content by highlighting and increasing the size of the object that yields the highest amount of interest, e.g. the ball in soccer or the puck in ice-hockey. While increasing the contrast of the ball had a positive effect on the user experience, increasing the size of the ball to enhance recognition made the presentation worse unless the video was encoded at very low bitrates (e.g. 28, 32kbps) [24]. Unfortunately, many studies have shown that low encoding bitrates do not appeal to the majority of the audience [16], which limits the use of scaling a single object. In Figure 1 we depict the most common shot types for soccer footage from the most detailed medium shot (MS) to the extreme long shot (XLS) that shows the largest portion of the playing field. Previous research indicated that the acceptability of MS and XLS declined more than the other shot types when soccer footage was rendered at small sizes [17]. Field sports in general contain a lot strategic information that can be conveyed best through XLS. Zooming reduces the amount of contextual information. Soccer thereby provides an ideal ground to study possible trade-offs in zooming on extreme long shots.
Figure 1: Shot types used in sports coverage from top left
clockwise: Medium shot (MS), long shot (LS), extreme long shot (XLS), very long shot (VLS)
2.1 Zooming The most obvious solution to increasing the amount of detail is to zoom in on part of the material and crop off the remainder. This is
XLS
LS
VLS
MS
88

similar to the pan-and-scan approach when presenting wide-screen cinema footage on 4:3 TV screens without black ‘letterboxing’ bars. Cropping can be done in two ways: 1. Static window: TV content is produced so that misalignments of the receiving analogue TV sets do not impair the viewing experience. The content contains a so-called safe zone outside of which no important information should be presented [33]. Static cropping could therefore zoom in on the safe zone theoretically without omitting important information. In XLS of field sports, however, information outside the safe area might be of interest. 2. Moving window: Zooming in on the area displaying the most important aspects [6] [9], which can be done in a number of ways. For example, in [2] this is done algorithmically by calculating the region of interest (ROI) based on the human visual system (HVS). In [6] the solution entails employing a human observer to make the decision of the focal point for cropping on-the-fly by means of eye-tracking technology. Moving windows introduce additional movement on top of the pans and zooms of the original footage. This additional panning needs to be controlled because viewers object to both sudden jumps as well as excessive panning in the footage. The latter has been likened to drunken camera operators [9]. On top of this the amount of zoom and the area that is cropped off can be dynamically adjusted, which appears as additional zooming not existent in the original footage. In [2] a dynamic zooming approach was compared to an approach with a fixed zoom factor. Some user evaluation took place in which dynamic zooming was rated better than a fixed zoom but the published paper fails to report how the tests were conducted exactly. The human requirements and preferences for both the additional pans and the additional zooms are insufficiently understood. To our knowledge no study has evaluated if, to what degree and for which target size zooming can improve the user experience. In terms of soccer and other sports, reducing the amount of visual context might impair the viewing experience. The extreme long shots that make up the majority of this content type cover a large amount of the pitch, and the audience can benefit from seeing potential pass receivers or other strategic information. This could also be a matter of taste. Another problem with TV viewing is that people do not necessarily want to interact with the content in order to initiate or control a zoom. However, broadcast content needs to be adapted to the different resolution and screen sizes of mobile devices in use. Default values for zooming for the different sizes could help with this.
2.2 Video on small screens Normal 20/20 vision is classified as the ability to resolve 1 minute of arc (1/60º) [21] and translates to a resolution of 60 pixels per degree. In the context of TV approximately 22 cycles (44 pixels) per degree is perceived as a sharp image [26]. On handheld devices, people could easily enjoy HDTV resolution on a screen of 8cm height when held at arm’s length. However, mobile TV broadcast does not exceed QVGA resolution at present. A number of studies have addressed the perception of content on small size handheld screens e.g. [29], [16] and [12]. All content types received poor ratings when their nominal size at encoding and at presentation time was smaller than 168x126 [16]. Despite a high encoding bitrate and QVGA size soccer content was not acceptable to 20% of the participants [16]. They objected
most to the in general insufficient visual detail. The preferred sizes of depicted objects in video in passive viewing contexts on portable devices have not been researched.
2.3 Viewing distance and resolution We could not find any previous research in the literature on preferred angular resolutions or picture angles for mobile TV viewing distances and display sizes. Jesty found evidence for an optimal viewing distance [11] on stills. When faced with the decision of where to place a chair to view projected pictures of a fixed size, observers chose their viewing distance in a way that took only the resolution of the picture into account. The quotient of picture height and optimal viewing distance was constant for a given resolution. Findings by Westerink et al. confirmed the existence of an optimal viewing distance and showed that at constant viewing distance subjective picture quality of still pictures was influenced both by the resolution of the pictures and their width [35]. The optimal viewing distance of still pictures was chosen such that the resolution equaled 16 cycles per degree independent of the picture width. For pixel based displays this translates to 32 pixels per degree. This indicates that the gains in perceived visual quality from achieving a higher visual resolution beyond 16 cycles per degree are not big enough to compensate for the detriment from the reduction in picture angle.
2.4 Effect of shot types We found surprisingly little previous research on how perceived visual quality is affected by shot types and much less so for video content. The only study we were able to find in the domain of mobile video content about the effect of depicting shot types at very small sizes showed that the perceived quality of shot types depended on the content type. In soccer content the XLS was the least acceptable shot type when presented at sizes smaller than 240x180 [17]. The reasons for that were mostly ascribed to a lack of visual detail. In the domain of pictures XLS appear less sharp than shots that depict closer objects. In 1962 Frieser & Bierman reported that portrait pictures (equivalent to an MS in Figure 1) received consistently higher quality ratings in comparison to other scenes (similar to the XLS type in Figure 1) despite the fact that they were of equal objective quality [7]. Kingslake pointed out that people can detect blurring for distant objects more readily and ascribed this to the fact that they are small [13]. Corey et al. reported that “subjective print quality [of pictures] depends upon scene magnification (or equivalently camera-to-subject distance)” [5]. Taken together, the seemingly self-evident benefits of greater detail through zooming might be curbed by exacerbating the perceived quality of XLS, which are already perceived to be of lower visual quality than other shot types. Hence there might be inherent limits to beneficial zoom factors for this shot type regardless of the content type. However, no studies have addressed the potential benefits and constraints on the zooming of mobile multimedia content. It also is not clear that the perceived gain in visual detail will outweigh the information lost due to zooming in. This may be especially true for sports, such as football and soccer. To test for possible effects we chose to use a fixed and rather large zoom factor of 1.6 in our first study and applied it to soccer footage displayed at the top and low end of the mobile display size range. In order to keep the study simple and not to blow up the experimental design we concentrated on one
89

shot type and did not include further visual enhancements e.g. increasing the contrast of the ball.
3. STUDY 1 People might have different preferences for zoom factors in general and in conjunction with reduced context information in soccer footage in particular. The aim of the experimental approach of this study was to give the participants a choice of following two clips playing in parallel by watching either the left or the right half of a screen. Since it only takes the viewer a fraction of a second to change focus, this setup allowed for a low-cost switching between the presented video clips in terms of time and attention. This method interferes much less with the activity of watching TV content then any of the other methods discussed in [23]. This study was intended to test the benefits of zooming by taking a fixed, relative high zoom factor (1.6) and presenting it at the two extremes of the mobile size spectrum. Although VGA-capable mobile devices exist, the currently highest targeted resolution for DVB-H content is QVGA (320x240). The smallest feasible size for following soccer content is at around QCIF (176x144). A previous study found that soccer presented at 168x126 was acceptable to 51% or participants at high encoding bandwidths but at 120x90 only 33% still found watching soccer acceptable [16]. Due to inadequate previous research on dynamic zooming and to keep the experimental design simple this study addresses static moving zoom window on one albeit the most important shot type in comparison with non-zoome Besides researching the subjective preferences for zoomed mobile content through preference data and individual interviews we trialed eye-tracking technology to gather objective data on the participants’ viewing pattern.
3.1 Method To find out whether participants preferred the zoomed material, we reviewed techniques used in video quality assessment. To assess gains or differences in quality between two versions of a video clip we can
1. present them sequentially one after the other, 2. display them side by side on one or more screens 3. present one at a time but let the participant toggle back
and forth between them by means of an input device. We decided to use the side-by-side approach on one screen because it allowed for subtle differences in video quality to be detectable and a very low involvement of the subjects in terms of head movement and required feedback [31]. In this experiment controlling for equal viewing distances and angular resolutions of both clips took precedence over presenting the clips on (two) mobile devices. All of our material was presented as a choice between two video clips on one screen. We chose this preference method instead of using e.g. mean opinion scores (MOS) on the video quality as defined [10]. In the domain of subjective assessment individual preferences within a population may result in non-normal distributions e.g. a binomial distribution. The aggregate MOS scores would incorrectly compound these distributions and possibly not do any of the participants’ perceived quality justice as noted in [30].
3.2 Material We recorded soccer footage through free-view DVB-T (MPEG2 TS) at 758x576 and prepared it for the clips. First, we cropped off surrounding black bars and adapted the aspect ratio of the content to 4:3. Then we resized the material to 640x480 (VGA) using the Lanczos3 filter in VirtualDub. During this process we removed text, i.e. the score of the game, using the MSU LogoRemover filter. This measure was motivated by the fact that text legibility has been shown to have a major influence on the acceptability of overall video quality [17] and we wanted to avoid any text related effects in this study. These steps resulted in uncompressed source footage, without text, at a size of 640x480. From this, we produced a zoomed and a non-zoomed version of the material. To create the non-zoomed version, we resized the base footage to the two final sizes using a custom built C++ application. For the zoomed version we emulated a moving window approach by screening the footage displaying extreme long shots frame by frame. To emulate a fixed zoom we selected which 400x300 area of each of the 640x480 frames was most important and made sure that we did not introduce unnecessary pans which degrade the viewing experience [9]. The area surrounding the window (61% of the pixel area of the original footage ) was cropped off by the aforementioned C++ application, which then resized the remaining selected window to the final size. All other shot types remained unchanged and were identical for both resulting clips. To these zoomed and non-zoomed clips without text we added the current score text using VirtualDub’s logo filter. For the QCIF size clips these scores used abbreviations of the club names (see Figure 2).
Figure 2: Zoomed (left) and non-zoomed material (right) with
a zoom of 1.6 at 176x144 The score had the same pixel size for the zoomed and the non-zoomed clips of the same size. Next, we used VirtualDub’s logo filter to superimpose the current score of the game and compressed the resulting clips at 384kbps with Microsoft’s MPEG4 V3 for the video and the audio at 16 bit PCM. In [15] these parameter combinations had maximized the acceptability of the video quality on mobile devices at our intended sizes. In order to illustrate the difference between the two resulting clips we have included example screen shots depicting the same scene for the zoomed and non-zoomed clip in Figure 2. The participants followed the clips at a viewing distance of approximately 60cm, which is a little more than the typical viewing distance of mobile TV consumption (around 45cm); however people with 100% visual acuity can still discriminate all pixels at this distance (see Table 1 for the dimensions).
90
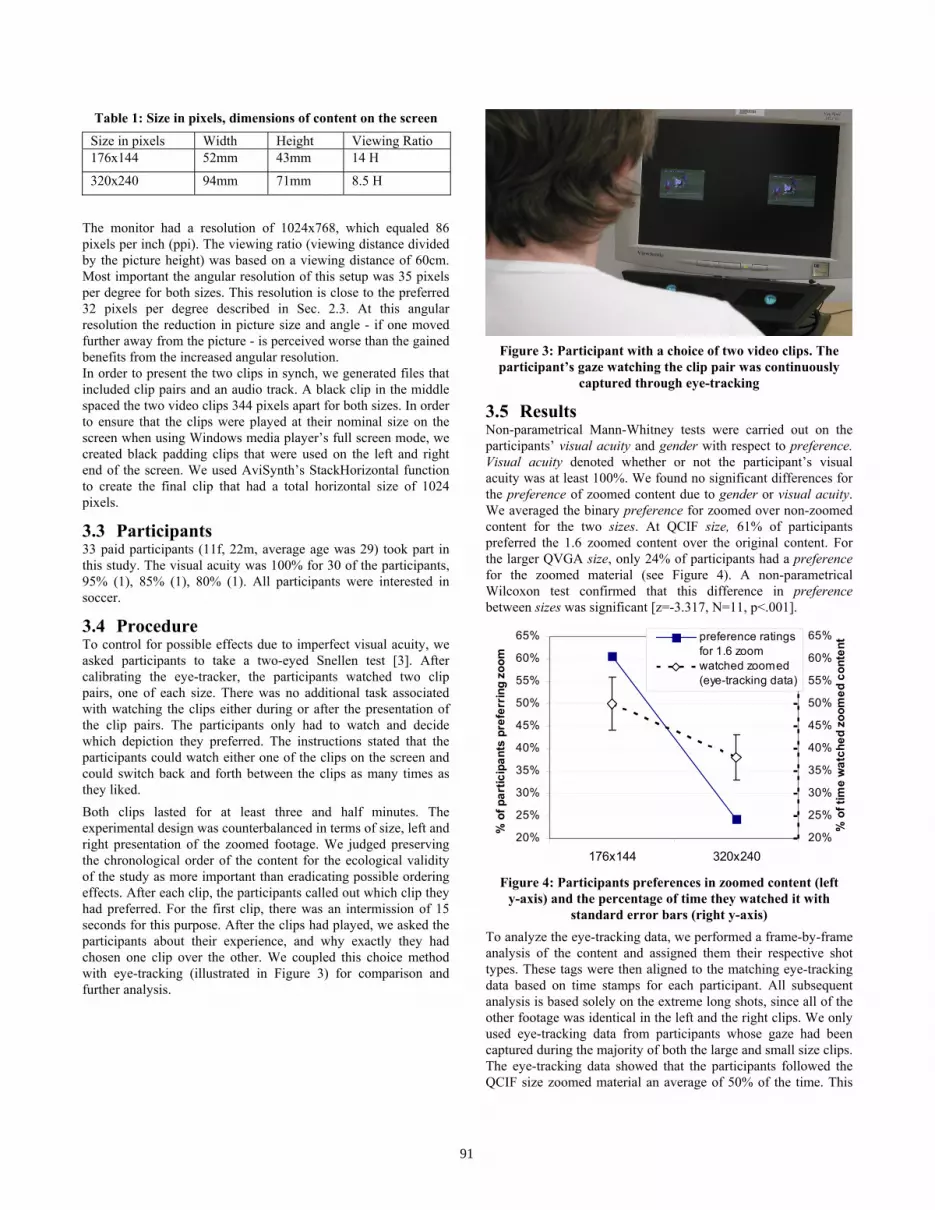
Table 1: Size in pixels, dimensions of content on the screen
Size in pixels Width Height Viewing Ratio 176x144 52mm 43mm 14 H
320x240 94mm 71mm 8.5 H
The monitor had a resolution of 1024x768, which equaled 86 pixels per inch (ppi). The viewing ratio (viewing distance divided by the picture height) was based on a viewing distance of 60cm. Most important the angular resolution of this setup was 35 pixels per degree for both sizes. This resolution is close to the preferred 32 pixels per degree described in Sec. 2.3. At this angular resolution the reduction in picture size and angle - if one moved further away from the picture - is perceived worse than the gained benefits from the increased angular resolution. In order to present the two clips in synch, we generated files that included clip pairs and an audio track. A black clip in the middle spaced the two video clips 344 pixels apart for both sizes. In order to ensure that the clips were played at their nominal size on the screen when using Windows media player’s full screen mode, we created black padding clips that were used on the left and right end of the screen. We used AviSynth’s StackHorizontal function to create the final clip that had a total horizontal size of 1024 pixels.
3.3 Participants 33 paid participants (11f, 22m, average age was 29) took part in this study. The visual acuity was 100% for 30 of the participants, 95% (1), 85% (1), 80% (1). All participants were interested in soccer.
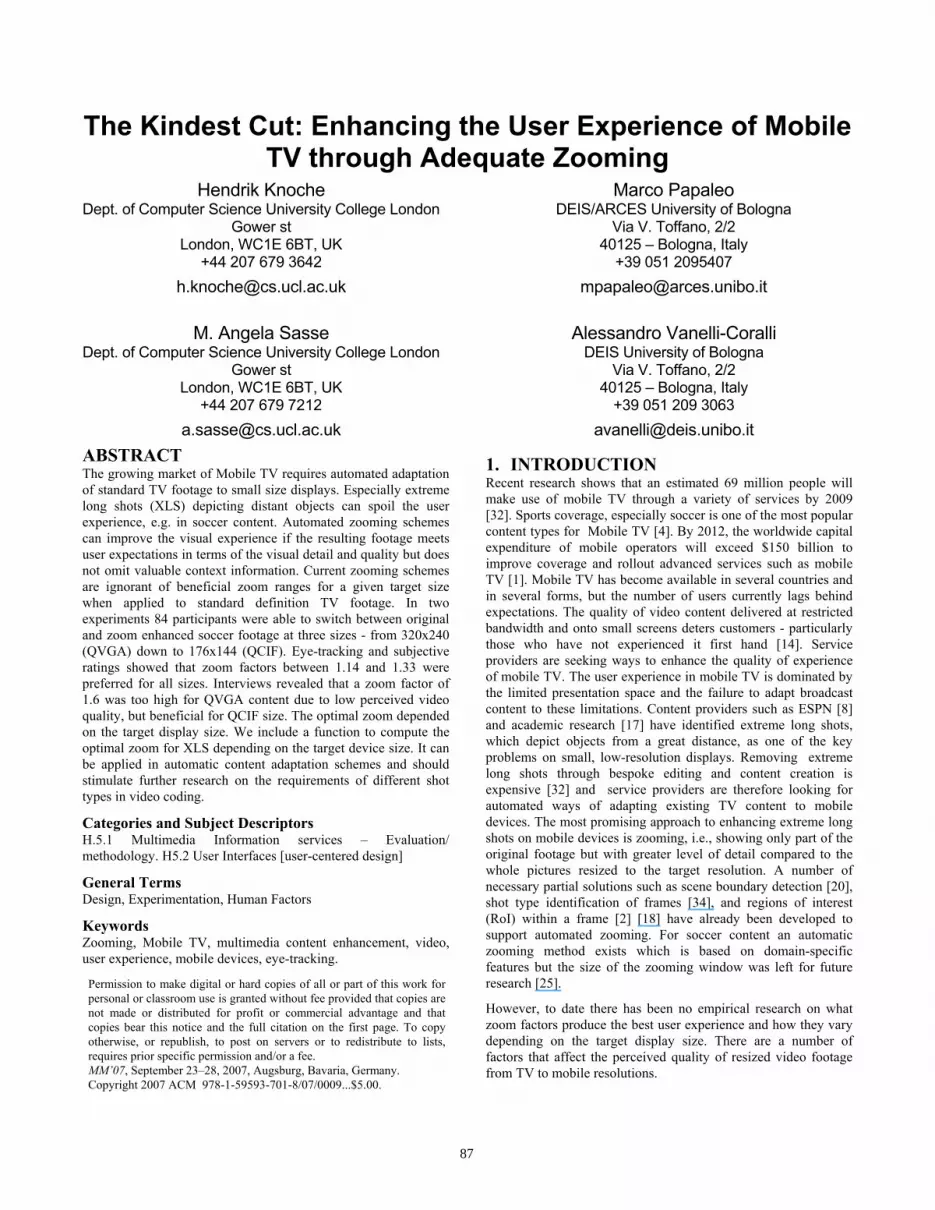
3.4 Procedure To control for possible effects due to imperfect visual acuity, we asked participants to take a two-eyed Snellen test [3]. After calibrating the eye-tracker, the participants watched two clip pairs, one of each size. There was no additional task associated with watching the clips either during or after the presentation of the clip pairs. The participants only had to watch and decide which depiction they preferred. The instructions stated that the participants could watch either one of the clips on the screen and could switch back and forth between the clips as many times as they liked. Both clips lasted for at least three and half minutes. The experimental design was counterbalanced in terms of size, left and right presentation of the zoomed footage. We judged preserving the chronological order of the content for the ecological validity of the study as more important than eradicating possible ordering effects. After each clip, the participants called out which clip they had preferred. For the first clip, there was an intermission of 15 seconds for this purpose. After the clips had played, we asked the participants about their experience, and why exactly they had chosen one clip over the other. We coupled this choice method with eye-tracking (illustrated in Figure 3) for comparison and further analysis.
Figure 3: Participant with a choice of two video clips. The participant’s gaze watching the clip pair was continuously
captured through eye-tracking
3.5 Results Non-parametrical Mann-Whitney tests were carried out on the participants’ visual acuity and gender with respect to preference. Visual acuity denoted whether or not the participant’s visual acuity was at least 100%. We found no significant differences for the preference of zoomed content due to gender or visual acuity. We averaged the binary preference for zoomed over non-zoomed content for the two sizes. At QCIF size, 61% of participants preferred the 1.6 zoomed content over the original content. For the larger QVGA size, only 24% of participants had a preference for the zoomed material (see Figure 4). A non-parametrical Wilcoxon test confirmed that this difference in preference between sizes was significant [z=-3.317, N=11, p<.001].
20%
25%
30%
35%
40%
45%
50%
55%
60%
65%
176x144 320x240
% o
f par
ticip
ants
pre
ferr
ing
zoom
20%
25%
30%
35%
40%
45%
50%
55%
60%
65%
% o
f tim
e w
atch
ed z
oom
ed c
onte
nt
preference ratingsfor 1.6 zoom watched zoomed(eye-tracking data)
Figure 4: Participants preferences in zoomed content (left
y-axis) and the percentage of time they watched it with standard error bars (right y-axis)
To analyze the eye-tracking data, we performed a frame-by-frame analysis of the content and assigned them their respective shot types. These tags were then aligned to the matching eye-tracking data based on time stamps for each participant. All subsequent analysis is based solely on the extreme long shots, since all of the other footage was identical in the left and the right clips. We only used eye-tracking data from participants whose gaze had been captured during the majority of both the large and small size clips. The eye-tracking data showed that the participants followed the QCIF size zoomed material an average of 50% of the time. This
91
ratio dropped to 38% when the same content was presented at QVGA size. The participants’ averaged time for which they watched the zoomed content was not significantly different for the two sizes according to a paired T-test [t(23)=1.793; p=0.086]. Figure 4 summarizes both the subjective preference data and the relative amount of time spent watching the zoomed material at the two sizes. In the post-experimental interviews, 55% of the participants stated that they based their choice on the perceived visual quality of the video, in particular for the QVGA clips. The participants’ most frequent complaint was about the visual quality of the zoomed material at QVGA size which they described as ‘fuzzy’, ‘grainy’ or ‘blurry’. The non-zoomed material was described as ‘crisp’ and ‘clear’. One participant’s quote summarized this complaint: “[the zoomed in]... looked like a blurry podcast. If I’m close I want to see more detail”. 25% participants were not deterred by the reduced quality for the QVGA zoomed material - they preferred it for its larger size, which they found easier to follow. For the smaller QCIF size clips, few participants found the visual quality of the zoomed footage inferior to the non-zoomed. For the QCIF size, 61% preferred the zoomed clip. The most frequently given reason for watching the zoomed footage, especially at QCIF size, was ‘not being able to recognize the players’ or ‘to see the ball’. This is line with previous results, where recognizing players in soccer content was found key to a satisfying experience [22]. 24% percent of participants made reference to the effort they had to put into following the non-zoomed clips at QCIF size. ‘Squinting’, ‘having to concentrate’ or ‘looking hard’ were common complaints about the non-zoomed material. The participants that were opposed to zooming even for the QCIF size were keen to be able to see as much as possible on the screen. Many participants made use of the zoom when they wanted to see a player in a tackle in more detail, or wanted to be able to better see the players’ feet and the ball. Some people mentioned that it would be nice to have both views accessible. An overview of the most important reasons for which people chose the zoomed or not zoomed view is presented in Figure 5.
The most important reason to watch preferred clips
0 5 10 15 20 25
situational overview
less effort
understand what's going on
be able to ID players, ball
more overview
visual quality
Number of comments
zoomednon-zoomed
Figure 5: Preferences for watching clips zoomed or not
In the interviews, we asked the participants if they had looked back to the other clip after they had selected their preferred clip. Participants gave several reasons for switching away from their chosen clip. First, the situation was novel and many wanted to make sure that the quality of the clip they were not following had
not changed, especially when close-up shots came up. This might have partly been instigated by the fact that the visual had, indeed, changed since only the extreme long shots had the zoom applied and the rest of the material was identical. Many participants reported switching away from the main clip during close-up shots. Participants also switched to the non-zoomed view for more overview during long passes, corners, free kicks and crosses. They switched to the zoomed view for tackles, dribbles or actions in the goal box for which they deemed detail of the players more important.
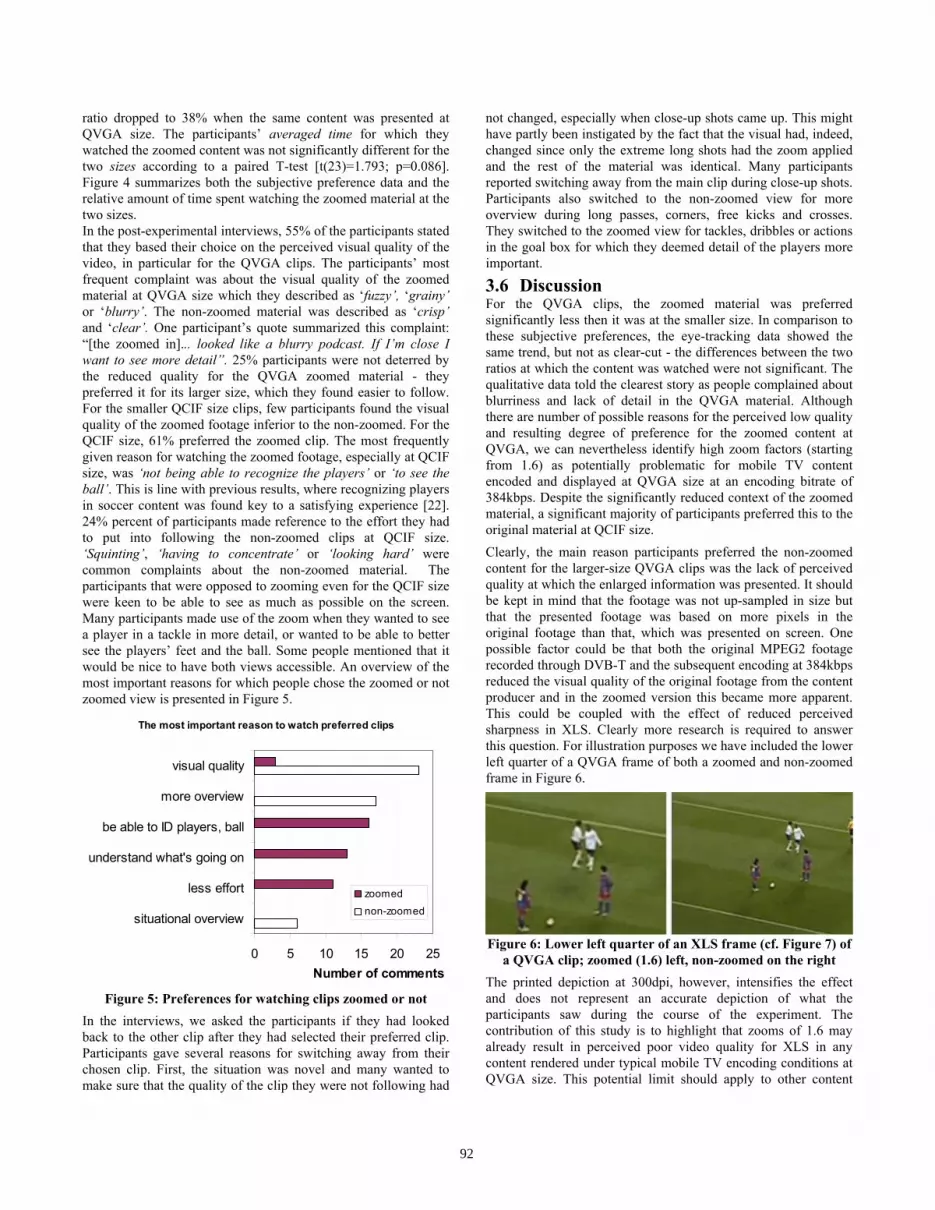
3.6 Discussion For the QVGA clips, the zoomed material was preferred significantly less then it was at the smaller size. In comparison to these subjective preferences, the eye-tracking data showed the same trend, but not as clear-cut - the differences between the two ratios at which the content was watched were not significant. The qualitative data told the clearest story as people complained about blurriness and lack of detail in the QVGA material. Although there are number of possible reasons for the perceived low quality and resulting degree of preference for the zoomed content at QVGA, we can nevertheless identify high zoom factors (starting from 1.6) as potentially problematic for mobile TV content encoded and displayed at QVGA size at an encoding bitrate of 384kbps. Despite the significantly reduced context of the zoomed material, a significant majority of participants preferred this to the original material at QCIF size. Clearly, the main reason participants preferred the non-zoomed content for the larger-size QVGA clips was the lack of perceived quality at which the enlarged information was presented. It should be kept in mind that the footage was not up-sampled in size but that the presented footage was based on more pixels in the original footage than that, which was presented on screen. One possible factor could be that both the original MPEG2 footage recorded through DVB-T and the subsequent encoding at 384kbps reduced the visual quality of the original footage from the content producer and in the zoomed version this became more apparent. This could be coupled with the effect of reduced perceived sharpness in XLS. Clearly more research is required to answer this question. For illustration purposes we have included the lower left quarter of a QVGA frame of both a zoomed and non-zoomed frame in Figure 6.
Figure 6: Lower left quarter of an XLS frame (cf. Figure 7) of
a QVGA clip; zoomed (1.6) left, non-zoomed on the right The printed depiction at 300dpi, however, intensifies the effect and does not represent an accurate depiction of what the participants saw during the course of the experiment. The contribution of this study is to highlight that zooms of 1.6 may already result in perceived poor video quality for XLS in any content rendered under typical mobile TV encoding conditions at QVGA size. This potential limit should apply to other content
92
types when taken from standard definition (SD) TV as the largest complaint about visual quality was not content specific. From the participants’ feedback about their individual preferences on detail or context, it is evident that current zoom solutions, e.g. [27], are not optimal for all viewers that have different preferences depending on the situations on the field. At the same time many participants traded off viewing comfort for being able to see more of the available context at the QCIF size. In light of this it appears to be a good idea to provide end user devices with zooming facilities that can be configured to their preferences. Considering the many reasons participants had for switching away from their preferred clip, it is not surprising that the percentage of time watching the preferred clip was not as clear cut as the subjective preference data.
4. STUDY 2 Due to the adverse effects of the 1.6 zoom on the participants’ perception of video quality on the QVGA clips, we designed a follow-up study and tested two smaller zooms on three sizes.
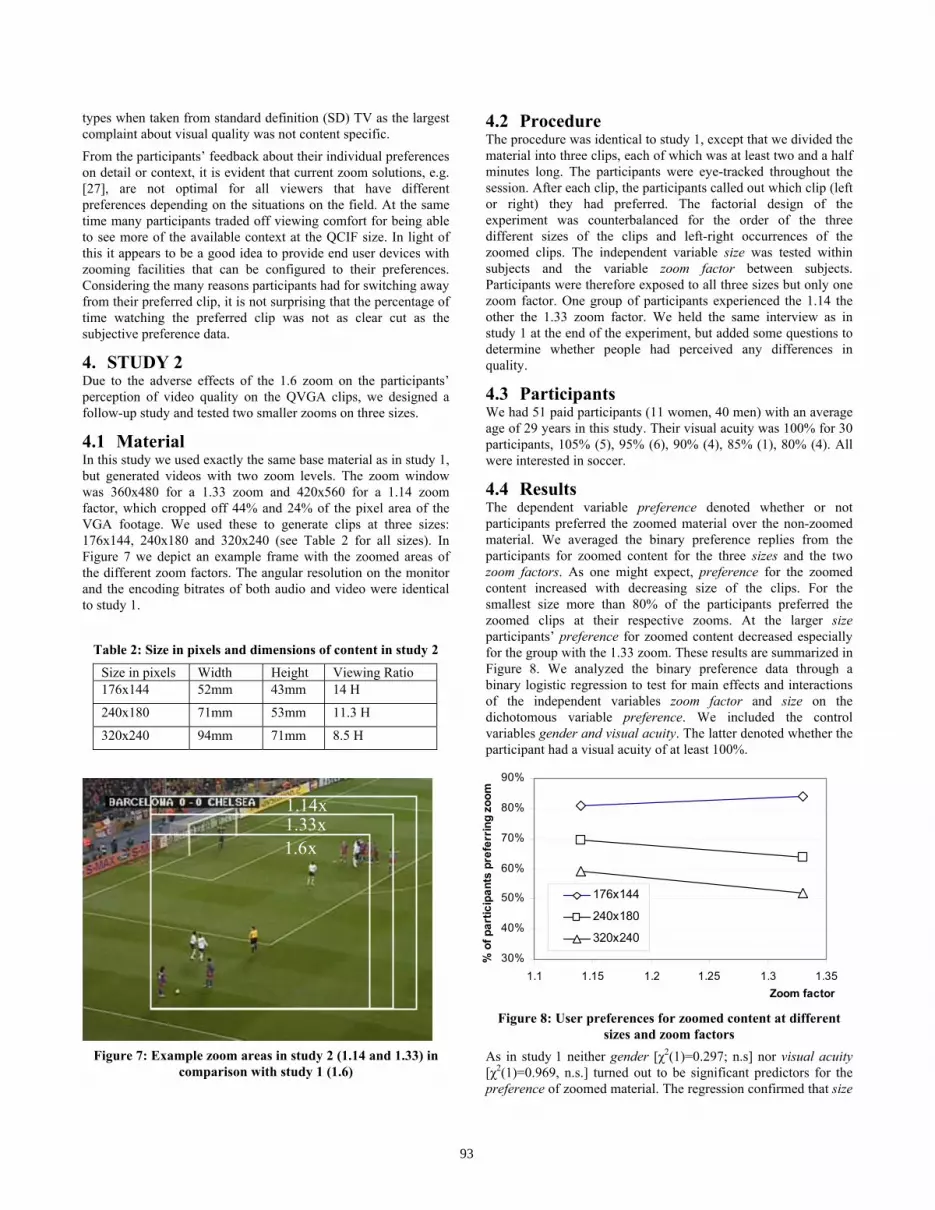
4.1 Material In this study we used exactly the same base material as in study 1, but generated videos with two zoom levels. The zoom window was 360x480 for a 1.33 zoom and 420x560 for a 1.14 zoom factor, which cropped off 44% and 24% of the pixel area of the VGA footage. We used these to generate clips at three sizes: 176x144, 240x180 and 320x240 (see Table 2 for all sizes). In Figure 7 we depict an example frame with the zoomed areas of the different zoom factors. The angular resolution on the monitor and the encoding bitrates of both audio and video were identical to study 1.
Table 2: Size in pixels and dimensions of content in study 2
Size in pixels Width Height Viewing Ratio 176x144 52mm 43mm 14 H
240x180 71mm 53mm 11.3 H
320x240 94mm 71mm 8.5 H
Figure 7: Example zoom areas in study 2 (1.14 and 1.33) in
comparison with study 1 (1.6)
4.2 Procedure The procedure was identical to study 1, except that we divided the material into three clips, each of which was at least two and a half minutes long. The participants were eye-tracked throughout the session. After each clip, the participants called out which clip (left or right) they had preferred. The factorial design of the experiment was counterbalanced for the order of the three different sizes of the clips and left-right occurrences of the zoomed clips. The independent variable size was tested within subjects and the variable zoom factor between subjects. Participants were therefore exposed to all three sizes but only one zoom factor. One group of participants experienced the 1.14 the other the 1.33 zoom factor. We held the same interview as in study 1 at the end of the experiment, but added some questions to determine whether people had perceived any differences in quality.
4.3 Participants We had 51 paid participants (11 women, 40 men) with an average age of 29 years in this study. Their visual acuity was 100% for 30 participants, 105% (5), 95% (6), 90% (4), 85% (1), 80% (4). All were interested in soccer.
4.4 Results The dependent variable preference denoted whether or not participants preferred the zoomed material over the non-zoomed material. We averaged the binary preference replies from the participants for zoomed content for the three sizes and the two zoom factors. As one might expect, preference for the zoomed content increased with decreasing size of the clips. For the smallest size more than 80% of the participants preferred the zoomed clips at their respective zooms. At the larger size participants’ preference for zoomed content decreased especially for the group with the 1.33 zoom. These results are summarized in Figure 8. We analyzed the binary preference data through a binary logistic regression to test for main effects and interactions of the independent variables zoom factor and size on the dichotomous variable preference. We included the control variables gender and visual acuity. The latter denoted whether the participant had a visual acuity of at least 100%.
30%
40%
50%
60%
70%
80%
90%
1.1 1.15 1.2 1.25 1.3 1.35Zoom factor
% o
f par
ticip
ants
pre
ferr
ing
zoom
176x144
240x180
320x240
Figure 8: User preferences for zoomed content at different
sizes and zoom factors As in study 1 neither gender [χ2(1)=0.297; n.s] nor visual acuity [χ2(1)=0.969, n.s.] turned out to be significant predictors for the preference of zoomed material. The regression confirmed that size
1.6 x 1.33 x 1.14 x
93

was a significant predictor for the participants’ preference for zoomed content [χ2(1)=7.68, p<0.01]. Neither the zoom factor nor the interaction between the zoom factor and size turned out to be a significant predictor. In Figure 8 the results of the participants’ preference are shown. We found a trend of habituation: over time, participants’ preference for watching the zoomed material increased. For the first two minute clip, the average preference for watching the zoomed content was only 57%, which rose to 71% for the third clip. When introduced into the regression analysis, however, this parameter turned out not to be a significant predictor for the participants preference for watching the zoomed footage [χ2(1)=2.42;n.s.]. This trend can most likely be attributed to differences in the material presented in the XLS in the three clips. Considering this explanation and that mobile TV watching spurts typically last 5-10 minutes we decided to keep all of the existing data in the analysis for greater validity. The analysis of the eye-tracking data showed similar results for the smallest and largest sizes. Their trends followed the preference data. At QCIF, the 1.33 zoom clips were followed 54% of the time and at the 1.14 zoom 64% of the time. At the QVGA size the zoomed content was followed less at the 1.33 zoom (50%) than at the 1.14 zoom (52%). The percentages of time, at which people watched the zoomed material at 240x180 had a trend in the opposite direction of the preference data. At the 1.14 zoom, participants watched the zoomed clips 56% whereas the group with the 1.33 zoom followed it 60% of the time. This difference, however, was not significant. A two factor mixed design ANOVA showed a significant effect for size on the dependent variable time watched zoomed content F(2,86)=3.261; p<.05. Neither zoom nor the interaction of zoom and size turned out to be significant. The eye-tracking data are summarized in Figure 9.
45%
50%
55%
60%
65%
70%
1.1 1.15 1.2 1.25 1.3 1.35Zoom factor
% o
f tim
e w
atch
ing
zoom
ed c
lip
176x144
240x180
320x240
Figure 9: Eye tracking data: the percentage of time zoomed
content was watched with standard error bars The generally higher preference for zoomed clips was also mirrored by the qualitative feedback obtained in the interviews. The participants made 107 comments about the criteria on which they had based their choice. The summary of the most frequent reasons is presented in Figure 10.
We found that visual quality again was a very important criterion. However, in this study with smaller zooms, most participants deemed the zoomed material of better quality in general – many described it as ‘clearer’. This was not unanimous. Nine comments described the zoomed content as ‘blurry’ and the non-zoomed material as ‘clearer’. The most important reason for not watching the zoomed material was that participants wanted to see more of the pitch in general or in specific situations like corners, passes and free kicks. The participants who preferred the zoomed material explained it was more comfortable to follow and required less effort. Similar to the results in study 1 people watched it to see the players and follow the ball better. They preferred to be closer to the action in general and specifically in tackle, dribble and goal box situations. In accordance with the preference data many participants who favored overview over detail and viewing comfort said that at smaller and especially the smallest size they preferred the zoomed material as the non-zoomed material was too small and too hard to watch.
Reasons for watching preferred clip
0 5 10 15 20 25
situational detail
liked zoom, closer to action
see ball and players
more overview
less effort, more comfort
better visual quality
Number of comments
zoomednon-zoomed
Figure 10: Reasons for watching preferred clip
5. DISCUSSION Across both studies, the results showed that a majority of the participants preferred the zoomed content when presented at a size smaller then 320x240. However, even at the largest size a majority of participants preferred a small zoom (1.14) to the original. Since both studies were conducted in the same way and were based on the same footage we performed a binary logistic regression on the combined preference data from study 1 and 2. As in both individual analyses size was a significant predictor of preference [χ2(1)=12.75; p<0.001]. The regression also revealed zoom factor as a significant predictor for the preference for zoomed content [χ2(1)=16.002; p<0.001]. The interaction between the two independent variables was not a significant predictor for preferring the zoomed content. We combined the preference results from study 1 and 2, shown in Figure 11. The graphs shown in Figure 11 include an assumed 50% chance preference for identical a zoom factor of 1, at which zoomed content would be identical to the non-zoomed material. We also added an interpolated value for the 240x180 size for the zoom factor 1.6.
94

20%
30%
40%
50%
60%
70%
80%
90%
100%
1 1.1 1.2 1.3 1.4 1.5 1.6Zoom factor
% o
f par
ticip
ants
pre
ferr
ing
zoom
176x144
240x180
320x240
Figure 11: Combined data from study 1 (black), study 2
(white) and assumption about the origin (zoom factor 1). The optimal zooms are marked with an X.
Based on these graphs, we computed second order polynomial trend lines (dotted) for each size, all of which had an R2 of at least 0.94. From these graphs we can derive the preferred zooms for extreme long shots for the three sizes: 320x240 (1.18), 240x180 (1.26) and 176x144 (1.32). The zoom factors for these values can be approximated (R2=0.99) with the following linear function: f(x) = -0.0015x + 1.53; where x is the amount of horizontal pixels. This function should return the optimal zoom factor for all sizes that are within the studied range of this paper. It should be kept in mind that the zooming window in our experiment was based on human decision making and that automated approaches might sub-optimally crop off more useful context information. Considering the participants’ various mentions of the recognition of players and required detail, e.g. the feet, we sampled typical sizes of players on the screen in extreme long shots who were close to the focal point of action. The average in the original VGA material was about 42 pixels. With the above optimal zooms this resulted in players’ sizes from 17 pixels for QCIF to 25 pixels in QVGA equaling a preferred angular size for the depiction of people in XLS of 0.5 and 0.7 degree respectively. The size of the ball ranged between 2 and 3 pixels. Using the eye-tracking results as an indicator for preference, results were not as clear-cut from participants’ subjective preferences. Participants reported that they switched back and forth many times for comparison reasons, out of curiosity, novelty of the setup, reassurance that they made the right decision, induced by camera pans or action going from left to the right on the screen or vice versa. Considering these results we are skeptical about approaches, e.g. [6], that rely on a single human observer to make the decision on what to zoom in on.
6. CONCLUSIONS The requirements for enhancing the QoE of mobile TV through zooming will depend on the content. We started the research necessary in this area by targeting one of the most popular mobile content types - field sports. In two studies we investigated three possible zooms on extreme long shots (XLS) in soccer content for three target sizes ranging from QCIF to QVGA. The majority of participants preferred the zoomed in version of the XLS for sizes smaller than QVGA. We found that zoom factors of 1.6 can have
adverse effects on people’s viewing experience of standard definition TV footage at QVGA size, the high end of the mobile TV resolution spectrum. As these complaints were based on the perceived visual quality they will apply to the XLS of any content when presented at small sizes. Based on the data from 84 participants, we found optimal zooms for XLS on the current mobile TV size range and provide a function to compute them dependent on the targets mobile TV display size. Extreme long shots presented at these optimal zooms appeared to a majority of participants to have better visual quality, required less effort to watch, and made recognizing players and the ball easier. Our results complete the missing link for automated zooming approaches e.g. [25]. These are currently driven by the detection of regions of interests, and do neither consider user preferences nor the perceived visual quality resulting from the zoom factors. Content producers, broadcasters and mobile TV service providers can employ the results to increase quality of experience of their customers on a very prominent content type. They can use the provided zoom factors in conjunction with the automated zooming approaches to address the range of mobile display sizes through their current delivery approaches. Ideally, these practitioners would provide their costumers with choices between zoomed or non-zoomed content as some of the purists preferred as much context as possible. It should be kept in mind in our study the regions of interest were carefully selected in a manual process. Current automated zooming schemes might result in worse material in which more useful context information gets cropped off. However, a lot of people might still prefer these sub-optimal zooms to the non-zoomed material for the increased viewing comfort. The substantive findings of our studies showed that display size represents a significant factor for the determination of optimal zooms. Display size and resolution were also key determinants for people’s perceived visual quality in previous mobile TV research [16]. Content adaptation will yield sub-optimal results if the adaptation is agnostic of the target display size. Preference data showed that people objected to the visual quality of depictions of XLS of high zooms that did not up-sample the base content. The method of presenting two clips in parallel worked well and all participants were able to make straightforward judgments in terms of preference. By using preference data instead of e.g. mean opinion scores (MOS) per clip we retained the information about the relative sizes of the groups that did or did not prefer the zoom. The compounded results of MOS would have been misleading. The debriefing interviews helped greatly to disambiguate the obtained results and guided the research along. Other researchers can use the results and the method to pursue their research into possible improvements of other shot types or content types. Further, research can apply these findings and identify which angular resolutions result in the best user experience in mobile use contexts and validate our angular size requirements for the depiction of people in XLS. In conjunction with comparable data for high definition (HD) base content on XLS our results could feed into an overall adaptation model for mobile video content. Those combined results would clarify how much influence the angular size of the depicted people in XLS had in comparison to the resolution of the players and the possible interactions of these factors. Furthermore, studies on the acceptability of mobile TV
95
footage could evaluate how much the optimal zooms on XLS can improve the overall acceptability of the content on small screens. The main limitation to our studies is that our participants were quite young on average and for older people other zoom values might yield a better experience. Field sports that are not as sensitive to loss of context as soccer might have slightly higher optimal zooms for XLS.
7. ACKNOWLEDGMENTS This work was supported by the IST-2005-27034 universal Satellite Home Connection (UNIC) project. It forms part of the service and user requirements assessment effort within the UNIC project. The authors would like to thank the anonymous reviewers for the constructive comments to improve the paper.
8. REFERENCES [1] 3G.co.uk, 3G WCDMA Will Receive the Highest CAPEX Investment
by Mobile Operators., http://www.3g.co.uk/PR/Sept2006/3633.htm. 2006
[2] Agarwal, G., Anbu, A., Sinha, A. A Fast Algorithm To find The Region-Of-Interest in the Compressed MPEG Domain in Proceedings International Conference on Multimedia and Expo, p. 133-6, 2003
[3] Bennett, A. G. Ophthalmic test types Br.J.Physiol.Opt., 22, p. 238-71, 1965.
[4] Cane, A., Football forces mobile television out of the lab., http://www.ft.com/cms/s/70cea448-0123-11db-af16-0000779e2340,dwp_uuid=80ae8cee-4a2f-11da-b8b1-0000779e2340.html. 2006
[5] Corey, G. P., Clayton, M. J., Cupery, K. N. Scene Dependence of image quality Society of Photographic Scientists and Engineers, 27 (1), p. 9-13, Jan-Feb1983.
[6] Dal Lago, G., Microdisplay Emotions., http://www.srlabs.it/articoli_uk/ics.htm. 2006
[7] Frieser, H. & Biedermann, K. Experiments on image quality in relation to the modulation transfer function and graininess of photographs Photographic Science and Engineering, 7 (28) 1963.
[8] Gwinn, E. & Hughlett, M., Mobile TV for your cell phone., Chicago Tribune. at: http://home.hamptonroads.com/stories/story.cfm?story=93423&ran=38197 2005
[9] Holmstrom, D. Content based pre-encoding video filter for mobile TV. Umea University, 2003
[10] ITU-R Methodology for the subjective assessment of the quality of television pictures. (Rep. No. BT.500-7) , 2004.
[11] Jesty, L. C. The relation between picture size, viewing distance and picture quality in Proc.Inst.Electr.Eng., p. 425-39, 1958
[12] Jumisko-Pyykkö, S. & Häkkinen, J. "I would like see the face and at least hear the voice": Effects of Screen Size and Audio-video Bitrate Ratio on Perception of Quality in Mobile Television in Proceedings of EuroITV '06, 2006
[13] Kingslake, R. Lenses on Photography New York, NY: Barnes & Co, 1963
[14] Knoche, H. & McCarthy, J. Mobile Users' Needs and Expectations of Future Multimedia Services in Proceedings of the WWRF12, 2004
[15] Knoche, H. & McCarthy, J. Design Requirements for Mobile TV in Proceedings of Mobile HCI, p. 69-76, 2005
[16] Knoche, H., McCarthy, J., Sasse, M. A. Can Small Be Beautiful? Assessing Image Resolution Requirements for Mobile TV in Proc.of ACM Multimedia 2005, p. 829-38, ACM, 2005
[17] Knoche, H., McCarthy, J., Sasse, M. A. A close-up on Mobile TV: The effect of low resolutions on shot types in Proc.of EuroITV '06, 2006
[18] Kopf, S., Lampi, F., King, T., Effelsberg, W. Automatic Scaling and Cropping of Videos for Devices with Limited Screen Resolution in Proceedings of the 14th annual ACM international conference on Multimedia, p. 957-8, 2006
[19] KPMG Consumers and Convergence Challenges and opportunities in meeting next generation customer needs, 2006.
[20] Lienhart, R. Comparison of Automatic Shot Boundary Detection Algorithms in Proc.of SPIE Storage and Retrieval for Image and Video Databases VII, p. 290-301, 1999
[21] Luther, A. C. Principles of Digital Audio and Video Boston, London: Artech House Publishers, 1996
[22] McCarthy, J., Sasse, M. A., Miras, D. Sharp or smooth? Comparing the effects of quantization vs. frame rate for streamed video in Proc.CHI, p. 535-42, 2004
[23] Nemethova, O., Ries, M., Dantcheva, S., Fikar, S., Rupp, M. Test Equipment of Time-Variant Subjective Perceptual Video Quality in Mobile Terminals in Proc.of HCI, 2005
[24] Nemethova, O., Zahumensky, M., Rupp, M. Preprocessing of Ball Game Video-Sequences for Robust Transmission over Mobile Networks in Proceedings of the CIC 2004 The 9th CDMA International Conference, 2004
[25] Seo, K. & Kim, C. A Context-Aware Video Display Scheme for Mobile Devices in R. Creutzburg, J. H. Takala, & C. W. Chen (Eds.) Proceedings of SPIE-IS&T, p. 278-87, SPIE-IS&T, 2006
[26] Silbergleid, M. & Pescatore, M. The Guide To Digital Television (3rd ed.) Miller Freeman Psn Inc, 2000
[27] Sinha, A. & Agarwal, G. A method of dynamic cropping and resizing of video frames in DVB-H to Mobile in GPSx 2005, 2005
[28] Södergård, C. Mobile television - technology and user experiences Report on the Mobile-TV project (Rep. No. P506) VTT Information Technology, 2003.
[29] Song, S., Won, Y., Song, I. Empirical Study of User Perception Behavior for Mobile Streaming in Proceedings of the tenth ACM international conference on Multimedia, p. 327-30, New York, NY, USA: ACM Press, 2004
[30] Sporer, T. Evaluating Small Impairments with the Mean Opinion Scale - Reliable or Just a Guess? in 101st Audio Engineering Society Convention, 1996
[31] Stanger, L., Submission to G-2.1.6 Progress Report of Task Force to define a Unit of Measure and Means of Calibration for Video Quality Analysis., http://grouper.ieee.org/groups/videocomp/lsrpt3d1.html. 2006
[32] Sylvers, E., Italia hails growth of its mobile TV service., http://www.iht.com/articles/2006/07/20/technology/italia.php. 2006
[33] Thompson, R. Grammar of the shot Elsevier Focal Press, 1998 [34] Voldhaug, J. E., Johansen, S., Perkis, A. Automatic Football Video
Highlights Extraction in NORSIG-05, 2005 [35] Westerink, J. H. & Roufs, J. A. Subjective Image Quality as a
Function of Viewing Distance, Resolution, and Picture Size SMPTE Journal, 1989.
96