parametric study for wire cut electrical
TRANSCRIPT
DOI: 10.2478/scjme-2019-0002, Print ISSN 0039-2472, On-line ISSN 2450-5471 2019 SjF STU Bratislava
Journal of MECHANICAL ENGINEERING – Strojnícky časopis,
VOL 69 (2019), NO 1, 17 - 38
PARAMETRIC STUDY FOR WIRE CUT ELECTRICAL DISCHARGE
MACHINING OF SINTERED TITANIUM
DWAIPAYAN De 1, TITAS Nandi 2, ASISH Bandyopadhyay3
1Jadavpur University, Mechanical Engineering Department, Kolkata - 700032, Indi,
e – mail: [email protected] 2Jadavpur University, Mechanical Engineering Department, Kolkata - 700032, India 3Jadavpur University, Mechanical Engineering Department, Kolkata - 700032, India
Abstract: In 21st century, it has been observed that Wire Cut Electrical Discharge Machining (WEDM) has
evolved as one of the most important non-traditional machining process. The popularity and its success lies
because of its uniqueness towards producing different components which are very difficult to machine like
titanium, tungsten carbide, Inconel materials etc and provides a platform in producing intricate complex shape
which in many cases become impossible to machine by traditional machining methods. Pure sintered titanium
bears very high specific strength, abrasion and corrosion resistances and thus machining this type of materials by
conventional techniques becomes very difficult though this material finds immense applications in bio-plant and
aerospace components. In the present work, WEDM on pure sintered titanium is studied. The different input
parameters of WEDM like, pulse on time, pulse off time, wire tension and wire feed have been varied to
investigate the output response like MRR, Surface Roughness (Ra), Kerf Width and Over Cut. A response
surface methodology (4 factors 3 level) design of experiment (DOE) has been applied in this context to examine
the machining ability of pure sintered titanium and results are found to be satisfactory and verified by
confirmatory test. The machining parameters like pulse on time, pulse off time, wire tension and wire feed shows
immense effect on the output responses and present study provide an optimal conditions of these input
parameters to get the best output responses through RSM
KEYWORDS: WEDM; titanium; input parameters; output response; response surface methodology.
1 Introduction
Today’s Mechanical Engineering world demands materials which have high hardness,
toughness, impact resistance, excellent strength to weight ratio, light weight, excellent
corrosion resistance and much more. Such materials like alloy ceramic composites, alloy
materials or hard materials like Titanium, Tungsten Carbide are also evolving to meet today’s
demand. With the inception of these materials major concern is coming to machine these
types of materials because such materials are difficult to be machined by traditional
machining methods. Hence, non-traditional machining methods like electrochemical
machining, ultrasonic machining, abrasive jet machining, electrical discharging machine
(EDM) etc. are used to machine such complicated to machine materials. Wire electrical
discharge machining (WEDM) is a widely accepted non-traditional material removal process
used to manufacture components with intricate shapes and profiles. WEDM process uses a
thin wire as an electrode for transforming electrical energy to thermal energy for cutting
materials. It is considered as a unique adaptation of the conventional EDM process which use
a continuously wire as tool (electrode) made of thin copper, brass or tungsten of diameter
0.05mm-0.3mm to machine alloy steels, conductive ceramics and aerospace materials
irrespective of their hardness and toughness. As WEDM is capable of producing a fine,
precise, corrosion and wear resistant surfaces, it has been taken into consideration in the
present research work. Pure Titanium has been considered as the base material in the present
18 2019 SjF STU Bratislava Volume 69, No. 1, (2019)
research work because of its excellent properties which is relevant to meet present world
needs. The primary attributes that make titanium an attractive material include an excellent
strength-to-weight ratio, providing weight savings attractive to the aerospace and
petrochemical industries; corrosion resistance, particularly appealing to the aerospace,
chemical, petrochemical and architectural industries; and biological compatibility, of interest
to the medical industry. Titanium has the highest strength to weight ratio of all metals. The
feed rate of a milling machine for aluminium or steel and the thickness of chips will be
approximately equal but Titanium due to its strength will have chips about half as thick as the
feed rate which made it difficult to machine in conventional machining setup. Another reason
titanium is difficult to machine is as the tool cuts it generates significantly more heat than
aluminium or steel and this heat will heat-treat the titanium making it much harder than
carbide cutting tools, resulting in breakage of the tool. In annealed condition, the hardness of
Titanium will be similar to stainless steel. All these reasons provide the platform for the
present research to use Titanium as the material which can be machined by Wire Cut
Electrical Discharge Machine (WEDM) process. Anish Kumar et al. [1] have focussed on the
Wire Electric Discharge Machining process. In this research work the researchers’ shows
intensive study on the WEDM research involving the optimization of the process parameters
surveying the influence of the various factors affecting the machining performance and
productivity. G. Selvakumar et al. [5] aimed at the selection of the most optimal machining
parameter combination for wire electrical discharge machining (WEDM) of 5083 aluminium
alloy. S. K. Garg et al. [6] presents an experimental investigation of the machining
characteristics and the effect of wire EDM process parameters during machining of newly
developed Al / ZrO2 particulate reinforced metal matrix composite material. N. Z. Khan et al.
[7] carried out an investigation into wire electric discharge machining of high strength and
low alloy (HSLA) steels. A. Goswami et al. [8] investigates the influence of machining
parameters on cutting speed and material removal rate for machining of Nimonic 80A with
brass wire as tool electrode during wire electrical discharge machining process. Statistical and
regression analysis of kerf width using design of experiments has been proposed for WEDM
operations by V. Parashar et al. [9] in their research work. Quadratic Mathematical models
have been derived to represent the process behaviour of wire electrical discharge machining
(WEDM) operation by S. Datta et al. [10] in their research work. The recent upgradation of
newer and harder materials has made the machining task in WEDM quite challenging and
thus for the optimum use of all the resources it is essential to make the optimum use of
parameters to get the best output to increase the productivity which has been clearly explained
in R.A. Shah et al. [11] research paper. A. K. Singh et al. [13] in this research paper describe
about the importance of electrical discharge machining in modern times and also presented a
detail report of wide acceptance of EDM process for machining of super alloys. Wire EDM is
most progressive non-conventional machining process in mechanical industries and there are
so many parameters that affect the performance of wire-EDM. S. V. Subrahmanyam et al.
[16] in their research work demonstrate the optimization of Wire Electrical Discharge
Machining process parameters for the machining of H13 hot die steel with multiple responses
material removal rate (MRR), surface roughness (Ra) based on the Grey-Taguchi method. R.
A. Shah et al. [17] in their research work review the various notable works in the field of
WEDM and magnifies on effect of electrode material of some diameter on MRR, kerf width
and surface roughness. Norliana Mohd Abbas et al. [18] in their research paper reviews the
research trends in EDM on ultrasonic vibration, dry EDM machining, EDM with powder
additives, EDM in water and modelling technique in predicting EDM performances. Along
with this they also give the fundamental knowledge about EDM process. K.H. Ho et al. [19]
in their paper reviews the vast array of research work carried out from the spin-off from the
EDM process to the development of the WEDM. The researchers also report on the WEDM

Volume 69, No. 1, (2019) 2019 SjF STU Bratislava 19
research involving the optimisation of the process parameters surveying the influence of the
various factors affecting the machining performance and productivity. This research paper
also highlights the adaptive monitoring and control of the process investigating the feasibility
of the different control strategies of obtaining the optimal machining conditions. A wide range
of WEDM industrial applications are reported together with the development of the hybrid
machining processes. The final part of the research paper discusses these developments and
outlines the possible trends for future WEDM research. Mu-Tian Yan et al. [20] in their
paper, a closed-loop wire tension control system for a wire-EDM machine is presented to
improve the machining accuracy. Dynamic models of the wire feed control apparatus and
wire tension control apparatus are derived to analyze and design the control system. PI
controller and one-step-ahead adaptive controller are employed to investigate the dynamic
performance of the closed-loop wire tension control system. In order to reduce the vibration
of wire tension during wire feeding, dynamic absorbers are added to the idle rollers of wire
transportation mechanism. Experimental results in this research paper not only demonstrate
that the developed control system with dynamic absorbers can obtain fast transient response
and small steady-state error than an open-loop control system, they also indicate that the
geometrical contour error of corner cutting is reduced with approximately 50% and the
vertical straightness of a workpiece can be improved significantly. Aniza Alias et al. [21] in
their research paper highlights the importance of process parameters and different machining
conditions on kerf width, MRR, surface roughness (Ra) and surface topography. Following a
brief summary of the process, J Simao et al [22] in their research paper reviews published
work on the deliberate surface alloying of various workpiece materials using EDM. Details
are given of operations involving powder metallurgy (PM) tool electrodes and the use of
powders suspended in the dielectric fluid, typically aluminium, nickel, titanium, etc.
Following this, the research paper also contains experimental results which are presented on
the surface alloying of AISI H13 hot work tool steel during a die sink operation using
partially sintered WC / Co electrodes operating in a hydrocarbon oil dielectric. An L8
fractional factorial Taguchi experiment was used in this research paper to identify the effect
of key operating factors on output measures (electrode wear, workpiece surface hardness,
etc.). Giovanna Gautier et al. [23] in their paper investigates the interactions between
common process parameters of WEDM and final quality of the generated surface, through
analysis of variance (ANOVA) and regression models based on experimental results. In
particular, the paper is focused on the effects of pulse on time, pulse off time, servo-reference
voltage, and wire tension on the surface finish during the WEDM of a Ti-48Al-2Cr-2Nb (at.
%) γ-TiAl alloy. In their research work results are discussed and compared with reference to
the models available in literature. C. Poletti et al [24] in their work highlights that Titanium
alloys exhibit high specific strength and stiffness that fit structural applications demanding
lightweight construction. They also show in their work that Ceramic reinforcements can
improve specific strength and stiffness, and also the wear resistance. Higher specific strength
and Young’s modulus is expected when reinforcing titanium by SiC particles compared to
other reinforcements. The production of a SiC reinforced titanium alloy using conventional
powder metallurgy methods (PM) yields porosity and silicides formation. PM processing
methods are discussed in this research work with equal channel angular pressing, Spark
plasma sintering, sintering using an induction oven and hot extrusion. Daniel M. Madyira et
al. [25] focus on the Grade 5 titanium (Ti6Al4V) which is considered as the workhorse
material when it comes to automotive and aerospace applications. According to their research
Grade 5 Titanium (Ti6Al4V) is widely referred to as an aerospace alloy and is relatively a
new engineering material and the main attraction of this material is its high strength to weight
ratio when compared to such common engineering materials such as steel and aluminium
alloys. The purpose of this research paper is to conduct a study on the effect of wire EDM on
20 2019 SjF STU Bratislava Volume 69, No. 1, (2019)
the fracture toughness of this aerospace material. Standard test procedure using compact
tension (CT) specimen is used to measure the fracture toughness. Four specimens are
produced using wire EDM. This includes the pre-crack which is usually produced by fatigue
cycling. Obtained results in this research paper indicate a slight decrease in fracture toughness
compared to that reported in literature. In addition to this the researchers also concluded in
this paper that wire EDM can be used as an alternative to fatigue pre-cracking in fracture
toughness testing of titanium alloys. Himanshu Prasad Raturi et al. [26] provide the
information about the parametric study on a wire-cut electro discharge machine which was
carried out by using Taguchi Method. A statistical analysis of variance (ANOVA) was
performed in their research work to identify the process parameters that were statistically
significant. The observation received in the present research paper that the MRR decreases
with increase in the percentage weight fraction of SiC and Al2O3 particles in the MMCs and
HMMCs, whereas, the surface roughness parameter increases with increase in the percentage
weight fraction of SiC and Al2O3 particles due to the hardness of MMCs and HMMCs
composites. Moi Subhas Chandra et al. [27] in their research paper explain about the Box-
Behnken design of response surface methodology and the process of their employment to
formulate the experimental plan to identify the effect of process parameters. Srinivasa Rao
Mallipudi et al. [28] employed in their research work Response surface methodology (RSM) to
construct a mathematical regression model. Three-factor five-level central composite design was
adopted for experimentation and provides the information about the process design in their
research work. RSM was successfully used to showcase their research work.
Within the scope of literature survey the researchers failed to find any conclusion about the
machining characteristics of WEDM processes in terms of Material Removal Rate (MRR),
Surface Roughness (Ra), Kerf Width and Over Cut when machining with Pure Titanium.
Thus the present work has been initiated to machine sintered pure Titanium using non-
conventional (WEDM) machining and study of machining characteristics and also
optimization of machining parameters like Pulse on Time, Pulse off Time, Wire Feed and
Wire Tension to get best machining condition in terms of MRR, Ra, Kerf Width and Over Cut
for this sintered Pure Titanium. For this purpose 4 factors 3 levels experiments have been
planned using response surface methodology (RSM) design matrix. Mathematical model has
been developed on the experimental results. A Box–Behnken design (BBD) based on
response surface methodology is employed for multi objective optimization.
2 Experimental Setup and Procedure
In the present experimental work, Material Removal Rate (MRR), Surface Roughness
(Ra), Kerf Width and Over Cut have been considered for evaluating the machining
performance. MRR, Ra, Kerf Width and Over-Cut are correlated with input machining
parameters such as Pulse on Time, Pulse of Time, Wire Feed and Wire Tension. The
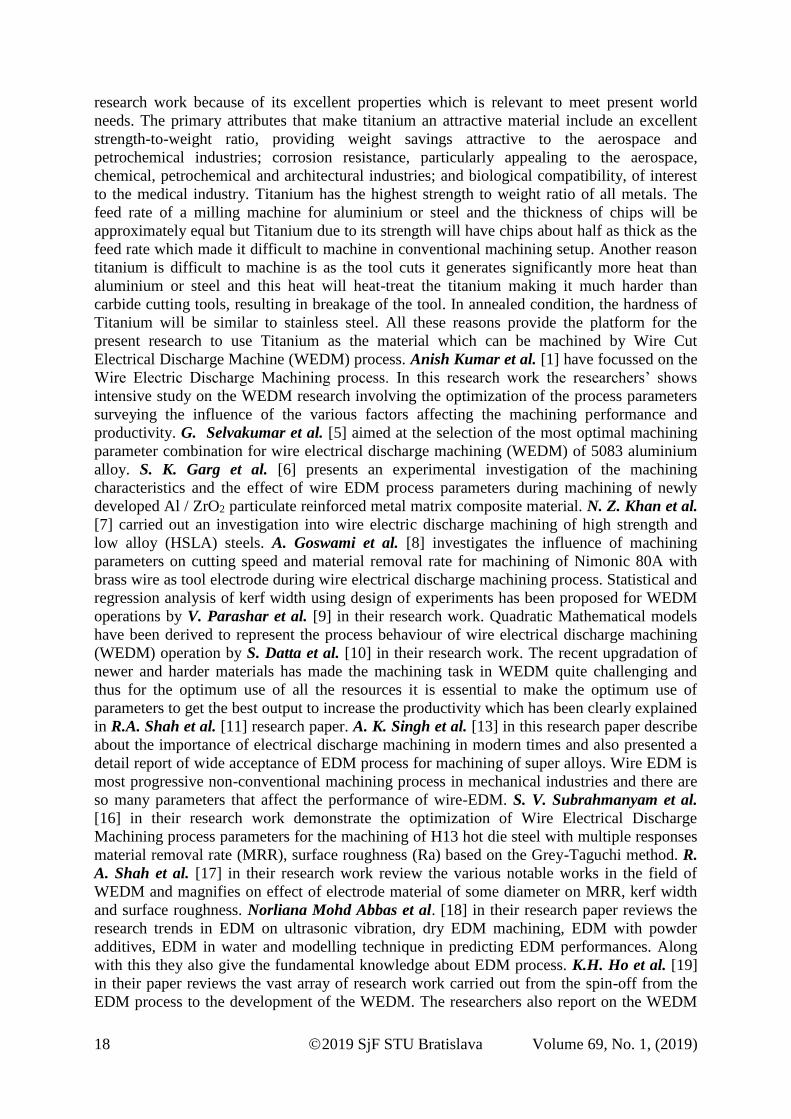
experiments were conducted on a WT 355 JOEMARS (TAIWAN) CNC Wire cut EDM. Fig.
1 shows the used experimental setup attached with CNC WEDM machine. The wire Electrode
material used in the WEDM process was made from brass with diameter 0.25 mm. During
machining, de-ionised water was circulated as the dielectric fluid around wire and with side
flushing technique. Pulse on time (TON), Pulse off time (TOFF), Wire Feed (WF) and Wire
Tension (WT) were variable and these chosen parameters and their limits are given in Table
1. These are chosen through reviews of experience, literature surveys and some preliminary
investigations. The workpiece material used in these experiments is sintered pure Titanium
metal fabricated from Alfa Aesar make Titanium powder -325 mesh, 99.5% (Metal basis)
having CAS no 7440-32-6 by sintering process in tube furnace at 13500 C in pure Argon -
Hydrogen gas mixture (Ar -97% & H2 - 3%) with a hold time of 2 hours. It can be classified
as a difficult to cut material, not suitable for traditional machining. Twenty seven experiments
Volume 69, No. 1, (2019) 2019 SjF STU Bratislava 21
have been conducted as per Box–Behnken designs (BBD) on sintered pure Titanium of
diameter 50 mm and thickness 9 mm. The material removal rate is calculated using the
relation MRR = (Thickness of the sample) X (Cutting Velocity) X (Kerf Width). The
roughness average (Ra) for each specimen has been measured by Surface Roughness Tester
(Talysurf Surtronic 3+, Taylor-Hobson, UK) shown in Fig 2. Each surface roughness value
has been obtained by averaging five measurements. Twenty seven experiments have been
conducted as per Box–Behnken designs (BBD) on sintered pure Titanium of diameter 50 mm
and thickness 9 mm. Twenty seven experiments are used to cut down 9 square pieces from the
sample and each square piece has been cut down using three different experiments on three
faces of the square piece respectively to measure the surface roughness for each case. Twenty
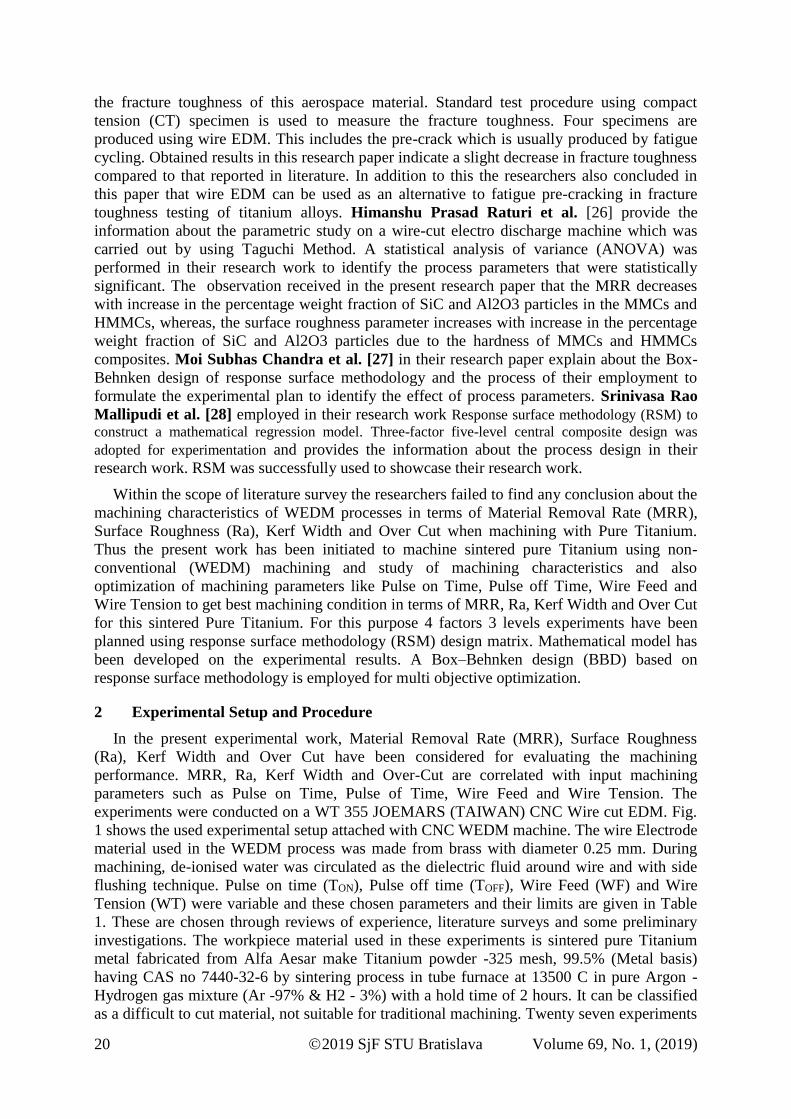
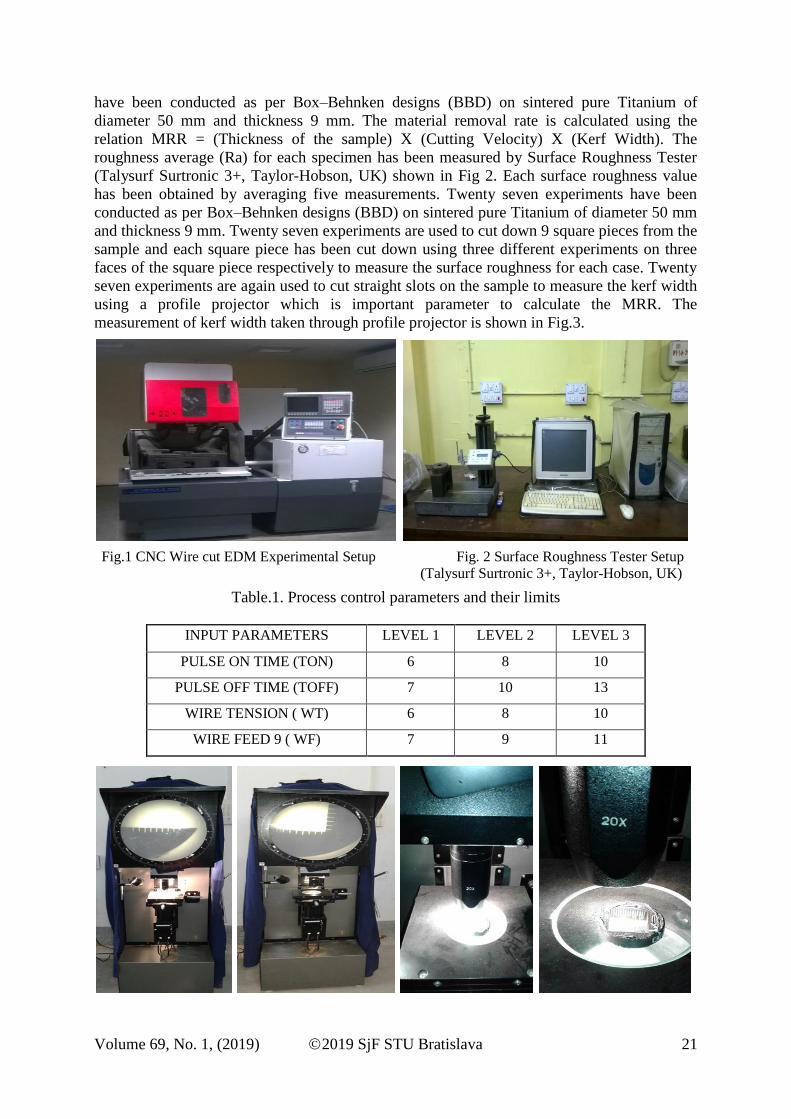
seven experiments are again used to cut straight slots on the sample to measure the kerf width
using a profile projector which is important parameter to calculate the MRR. The
measurement of kerf width taken through profile projector is shown in Fig.3.
Fig.1 CNC Wire cut EDM Experimental Setup Fig. 2 Surface Roughness Tester Setup
(Talysurf Surtronic 3+, Taylor-Hobson, UK)
Table.1. Process control parameters and their limits
INPUT PARAMETERS LEVEL 1 LEVEL 2 LEVEL 3
PULSE ON TIME (TON) 6 8 10
PULSE OFF TIME (TOFF) 7 10 13
WIRE TENSION ( WT) 6 8 10
WIRE FEED 9 ( WF) 7 9 11
22 2019 SjF STU Bratislava Volume 69, No. 1, (2019)
Fig. 3 Kerf Width measurement of the sample through Profile Projector setup
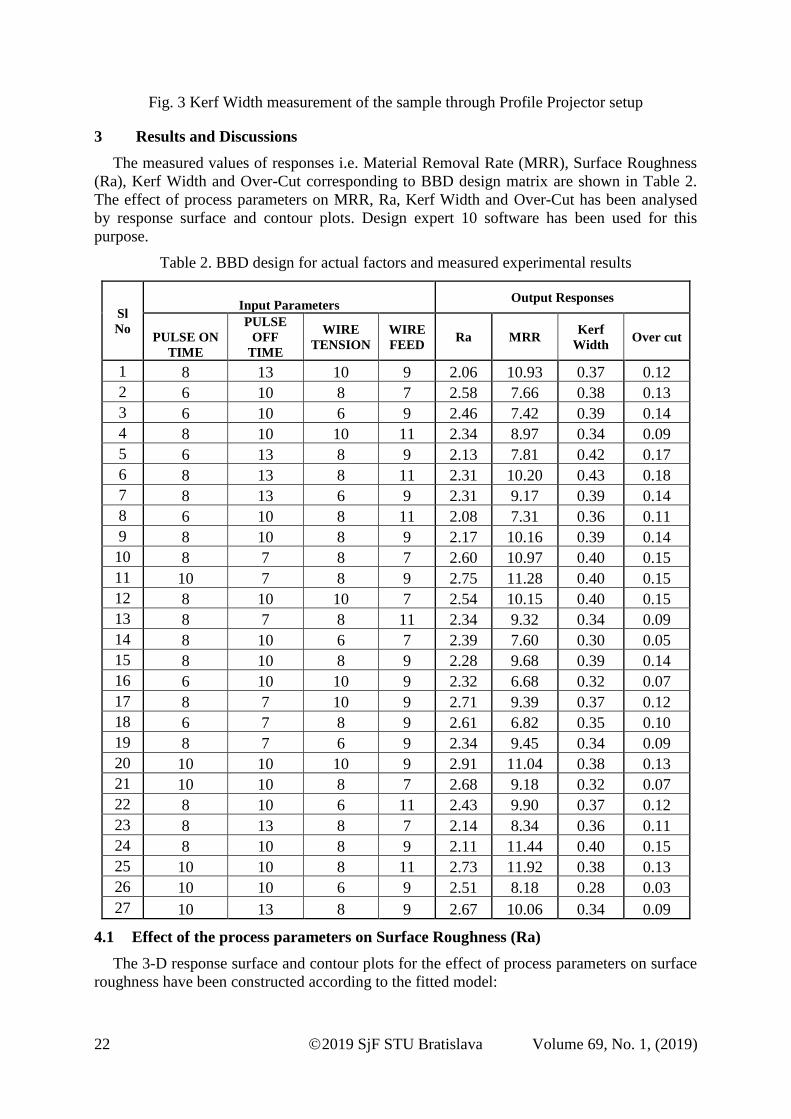
3 Results and Discussions
The measured values of responses i.e. Material Removal Rate (MRR), Surface Roughness
(Ra), Kerf Width and Over-Cut corresponding to BBD design matrix are shown in Table 2.
The effect of process parameters on MRR, Ra, Kerf Width and Over-Cut has been analysed
by response surface and contour plots. Design expert 10 software has been used for this
purpose.
Table 2. BBD design for actual factors and measured experimental results
Sl
No
Input Parameters Output Responses
PULSE ON
TIME
PULSE
OFF
TIME
WIRE
TENSION
WIRE
FEED Ra MRR
Kerf
Width Over cut
1 8 13 10 9 2.06 10.93 0.37 0.12
2 6 10 8 7 2.58 7.66 0.38 0.13
3 6 10 6 9 2.46 7.42 0.39 0.14
4 8 10 10 11 2.34 8.97 0.34 0.09
5 6 13 8 9 2.13 7.81 0.42 0.17
6 8 13 8 11 2.31 10.20 0.43 0.18
7 8 13 6 9 2.31 9.17 0.39 0.14
8 6 10 8 11 2.08 7.31 0.36 0.11
9 8 10 8 9 2.17 10.16 0.39 0.14
10 8 7 8 7 2.60 10.97 0.40 0.15
11 10 7 8 9 2.75 11.28 0.40 0.15
12 8 10 10 7 2.54 10.15 0.40 0.15
13 8 7 8 11 2.34 9.32 0.34 0.09
14 8 10 6 7 2.39 7.60 0.30 0.05
15 8 10 8 9 2.28 9.68 0.39 0.14
16 6 10 10 9 2.32 6.68 0.32 0.07
17 8 7 10 9 2.71 9.39 0.37 0.12
18 6 7 8 9 2.61 6.82 0.35 0.10
19 8 7 6 9 2.34 9.45 0.34 0.09
20 10 10 10 9 2.91 11.04 0.38 0.13
21 10 10 8 7 2.68 9.18 0.32 0.07
22 8 10 6 11 2.43 9.90 0.37 0.12
23 8 13 8 7 2.14 8.34 0.36 0.11
24 8 10 8 9 2.11 11.44 0.40 0.15
25 10 10 8 11 2.73 11.92 0.38 0.13
26 10 10 6 9 2.51 8.18 0.28 0.03
27 10 13 8 9 2.67 10.06 0.34 0.09
4.1 Effect of the process parameters on Surface Roughness (Ra)
The 3-D response surface and contour plots for the effect of process parameters on surface
roughness have been constructed according to the fitted model:

Volume 69, No. 1, (2019) 2019 SjF STU Bratislava 23
Ra = + 15.21917-1.67979 * TON -0.29833 * TOFF - 0.32333 * WT - 0.79458* WF
+ 0.016667 * TON * TOFF + 0.033750* TON * WT + 0.034375* TON * WF -
0.025833 * TOFF * WT + 0.018333 * TOFF* WF - 0.015000 * WT * WF +
0.063750 * TON2 + 7.91667E-003 * TOFF
2 +0.029062 * WT 2 + 0.023750 * WF2
(1)
Table 3. ANOVA table for Surface Roughness (Ra)
Source Sum of
Squares
DF Mean
Square
F
Value
P-value
Prob> F
Model 1.37 14 0.098 21.67 < 0.0001 Significant
A-Pulse on Time 0.36 1 0.36 79.14 < 0.0001 Significant
B-Pulse off Time 0.25 1 0.25 55.92 < 0.0001 Significant
C-Wire Tension 0.016 1 0.016 3.58 0.0830 not significant
D-Wire Feed 0.040 1 0.040 8.79 0.0118 Significant
AB 0.040 1 0.040 8.87 0.0115 Significant
AC 0.073 1 0.073 16.16 0.0017 Significant
AD 0.076 1 0.076 16.76 0.0015 Significant
BC 0.096 1 0.096 21.30 0.0006 Significant
BD 0.048 1 0.048 10.73 0.0066 Significant
CD 0.014 1 0.014 3.19 0.0993 not significant
A2 0.35 1 0.35 76.87 < 0.0001 Significant
B2 0.027 1 0.027 6.00 0.0306 Significant
C2 0.072 1 0.072 15.97 0.0018 Significant
D2 0.048 1 0.048 10.67 0.0068 Significant
Residual 0.054 12 4.512E-003
Lack of Fit 0.039 10 3.928E-003 0.53 0.7991 not significant
Pure Error 0.015 2 7.433E-003
Core Total 1.42 26
R-Squared 0.9619 Pred R-Squared 0.8175
Adj R-Squared 0.9175 Adeq Precision 16.112
The Model F-value of 21.67 implies the model is significant. Values of "Prob> F" less than
0.0500 indicate model terms are significant. In this case A, B, D, AB, AC, AD, BC, BD, A2,
B2, C2, D2 are significant model terms. Values greater than 0.1000 indicate the model terms
are not significant. The "Lack of Fit F-value" of 0.53 implies the Lack of Fit is not significant
relative to the pure error. There is a 79.91% chance that a "Lack of Fit F-value" this large
could occur due to noise. The "Pred R-Squared" of 0.8175 is in reasonable agreement with the
"Adj R-Squared" of 0.9175; i.e. the difference is less than 0.2."Adeq Precision" measures the
signal to noise ratio. A ratio greater than 4 is desirable and in the present study the ratio of
16.112 indicates an adequate signal. This model can be used to navigate the design space.
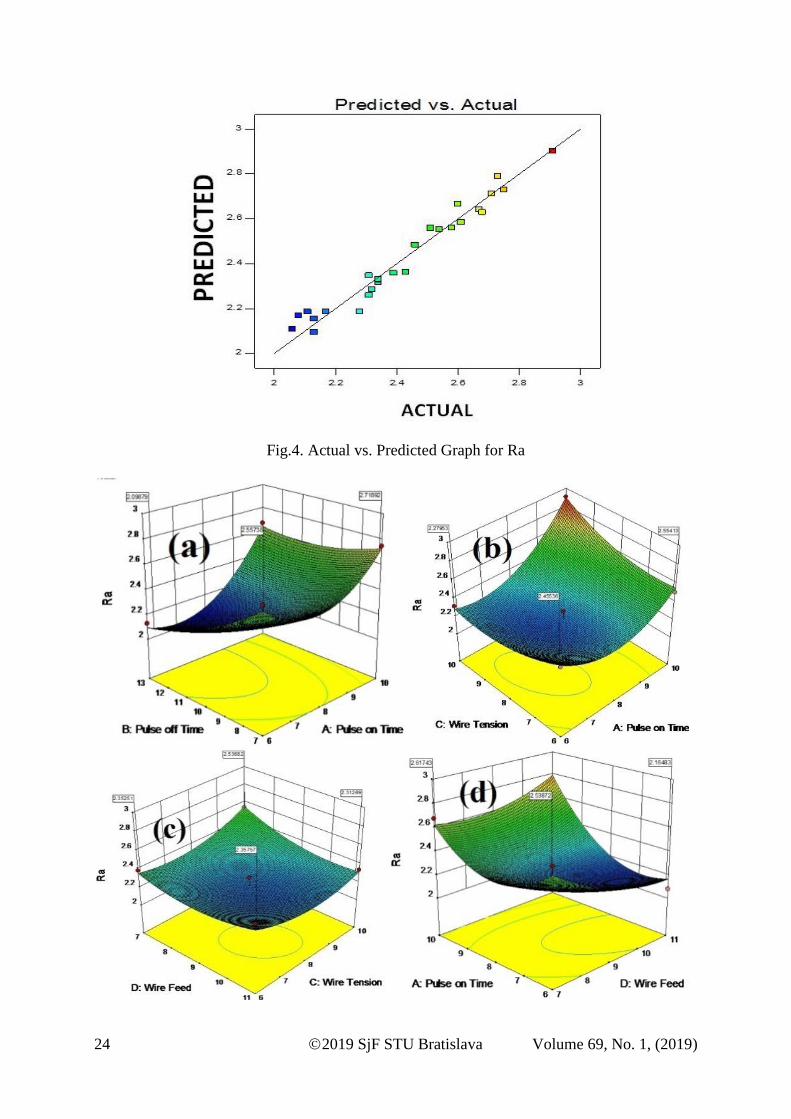
Fig. 4 shows the predicted vs. actual response plot for surface roughness. It is observed that
the predicted response points are very close to the actual experimental data. This confirms the
good agreement between the predicted model and the experimental results.
24 2019 SjF STU Bratislava Volume 69, No. 1, (2019)
Fig.4. Actual vs. Predicted Graph for Ra
Volume 69, No. 1, (2019) 2019 SjF STU Bratislava 25
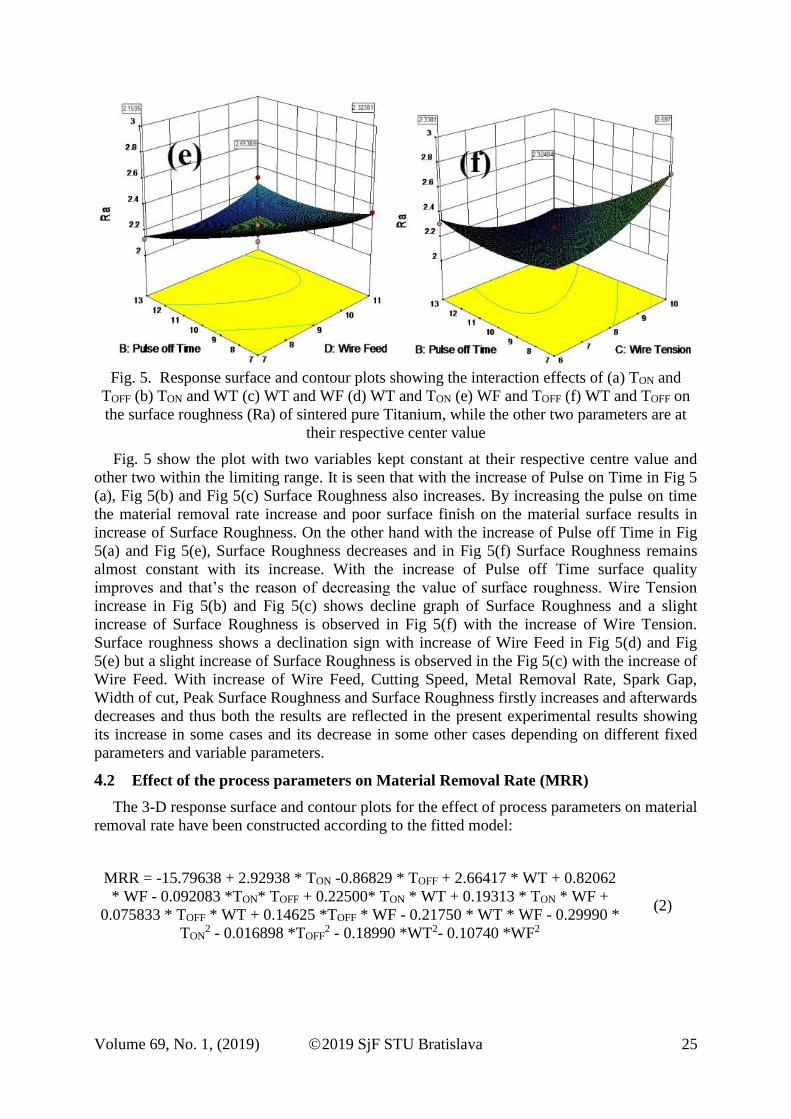
Fig. 5. Response surface and contour plots showing the interaction effects of (a) TON and
TOFF (b) TON and WT (c) WT and WF (d) WT and TON (e) WF and TOFF (f) WT and TOFF on
the surface roughness (Ra) of sintered pure Titanium, while the other two parameters are at
their respective center value
Fig. 5 show the plot with two variables kept constant at their respective centre value and
other two within the limiting range. It is seen that with the increase of Pulse on Time in Fig 5
(a), Fig 5(b) and Fig 5(c) Surface Roughness also increases. By increasing the pulse on time
the material removal rate increase and poor surface finish on the material surface results in
increase of Surface Roughness. On the other hand with the increase of Pulse off Time in Fig
5(a) and Fig 5(e), Surface Roughness decreases and in Fig 5(f) Surface Roughness remains
almost constant with its increase. With the increase of Pulse off Time surface quality
improves and that’s the reason of decreasing the value of surface roughness. Wire Tension
increase in Fig 5(b) and Fig 5(c) shows decline graph of Surface Roughness and a slight
increase of Surface Roughness is observed in Fig 5(f) with the increase of Wire Tension.
Surface roughness shows a declination sign with increase of Wire Feed in Fig 5(d) and Fig
5(e) but a slight increase of Surface Roughness is observed in the Fig 5(c) with the increase of
Wire Feed. With increase of Wire Feed, Cutting Speed, Metal Removal Rate, Spark Gap,
Width of cut, Peak Surface Roughness and Surface Roughness firstly increases and afterwards
decreases and thus both the results are reflected in the present experimental results showing
its increase in some cases and its decrease in some other cases depending on different fixed
parameters and variable parameters.
4.2 Effect of the process parameters on Material Removal Rate (MRR)
The 3-D response surface and contour plots for the effect of process parameters on material
removal rate have been constructed according to the fitted model:
MRR = -15.79638 + 2.92938 * TON -0.86829 * TOFF + 2.66417 * WT + 0.82062
* WF - 0.092083 *TON* TOFF + 0.22500* TON * WT + 0.19313 * TON * WF +
0.075833 * TOFF * WT + 0.14625 *TOFF * WF - 0.21750 * WT * WF - 0.29990 *
TON2 - 0.016898 *TOFF
2 - 0.18990 *WT2- 0.10740 *WF2
(2)
26 2019 SjF STU Bratislava Volume 69, No. 1, (2019)
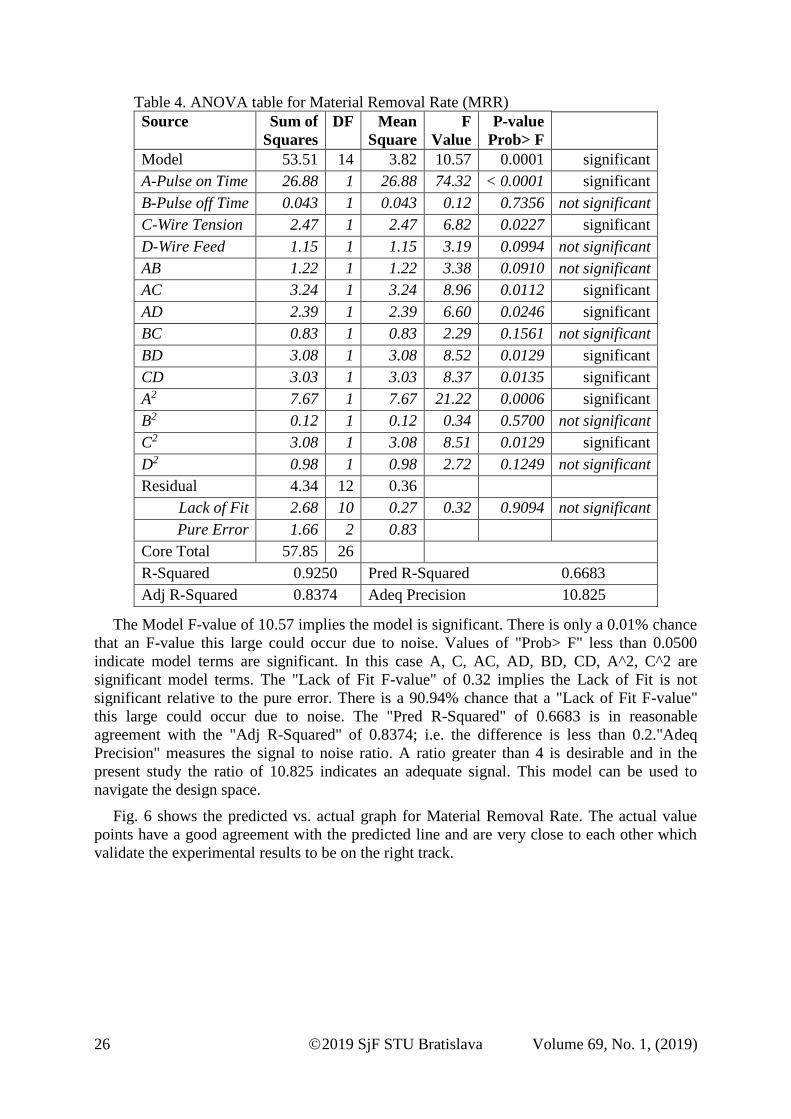
Table 4. ANOVA table for Material Removal Rate (MRR)
Source Sum of
Squares
DF Mean
Square
F
Value
P-value
Prob> F
Model 53.51 14 3.82 10.57 0.0001 significant
A-Pulse on Time 26.88 1 26.88 74.32 < 0.0001 significant
B-Pulse off Time 0.043 1 0.043 0.12 0.7356 not significant
C-Wire Tension 2.47 1 2.47 6.82 0.0227 significant
D-Wire Feed 1.15 1 1.15 3.19 0.0994 not significant
AB 1.22 1 1.22 3.38 0.0910 not significant
AC 3.24 1 3.24 8.96 0.0112 significant
AD 2.39 1 2.39 6.60 0.0246 significant
BC 0.83 1 0.83 2.29 0.1561 not significant
BD 3.08 1 3.08 8.52 0.0129 significant
CD 3.03 1 3.03 8.37 0.0135 significant
A2 7.67 1 7.67 21.22 0.0006 significant
B2 0.12 1 0.12 0.34 0.5700 not significant
C2 3.08 1 3.08 8.51 0.0129 significant
D2 0.98 1 0.98 2.72 0.1249 not significant
Residual 4.34 12 0.36
Lack of Fit 2.68 10 0.27 0.32 0.9094 not significant
Pure Error 1.66 2 0.83
Core Total 57.85 26
R-Squared 0.9250 Pred R-Squared 0.6683
Adj R-Squared 0.8374 Adeq Precision 10.825
The Model F-value of 10.57 implies the model is significant. There is only a 0.01% chance
that an F-value this large could occur due to noise. Values of "Prob> F" less than 0.0500
indicate model terms are significant. In this case A, C, AC, AD, BD, CD, A^2, C^2 are
significant model terms. The "Lack of Fit F-value" of 0.32 implies the Lack of Fit is not
significant relative to the pure error. There is a 90.94% chance that a "Lack of Fit F-value"
this large could occur due to noise. The "Pred R-Squared" of 0.6683 is in reasonable
agreement with the "Adj R-Squared" of 0.8374; i.e. the difference is less than 0.2."Adeq
Precision" measures the signal to noise ratio. A ratio greater than 4 is desirable and in the
present study the ratio of 10.825 indicates an adequate signal. This model can be used to
navigate the design space.
Fig. 6 shows the predicted vs. actual graph for Material Removal Rate. The actual value
points have a good agreement with the predicted line and are very close to each other which
validate the experimental results to be on the right track.

Volume 69, No. 1, (2019) 2019 SjF STU Bratislava 27
Fig 6. Predicted vs. Actual graph for MRR
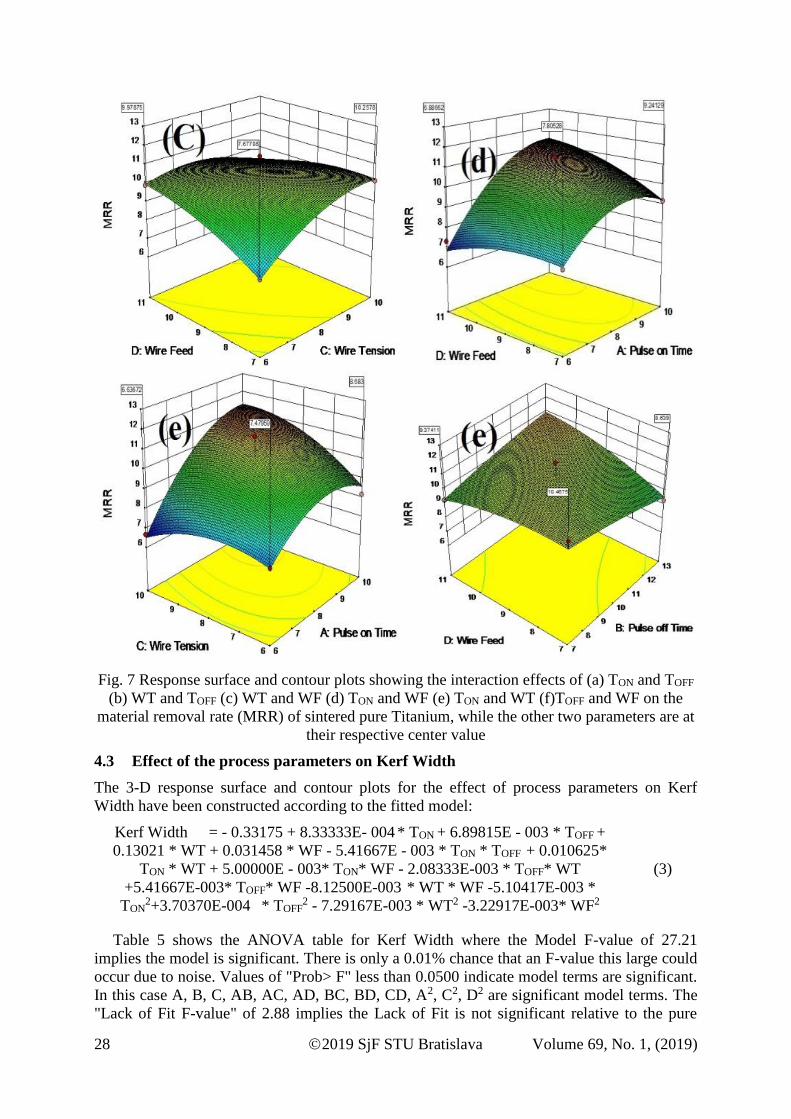
Fig.7 show the plot with two variables kept constant at their respective centre value and
other two within the limiting range. Pulse on Time has a greater impact on MRR and thus
MRR always increases (irrespective of other parameters effect) with the increase of Pulse on
Time as shown in Fig 7(a), 7(d) and Fig 7(e). Pulse Off-time is the time during which re-
ionization of the dielectric take place. An insufficient off time can lead to erratic cycling and
retraction of the advancing servo thereby slowing down the operation cycle and thus MRR
decreases with its increase as shown in Fig 7(b) and Fig 7(f). Wire Tension depends on other
parameters and thus with its increase MRR increases when Pulse on Time and Pulse off Time
is constant at centre point in Fig 7(c), MRR decreases when Wire Feed and Pulse off time is at
centre point as in Fig 7(e) and MRR remains constant when Pulse on time and Wire Feed is at
centre point as in Fig 7(b). MRR decreases with the increase of Wire Feed as shown in Fig
7(d) and Fig 7(f) but MRR increases with its increase in Fig 7(c) as Wire Feed depends on
other parameters and their respective positions.
28 2019 SjF STU Bratislava Volume 69, No. 1, (2019)
Fig. 7 Response surface and contour plots showing the interaction effects of (a) TON and TOFF
(b) WT and TOFF (c) WT and WF (d) TON and WF (e) TON and WT (f)TOFF and WF on the
material removal rate (MRR) of sintered pure Titanium, while the other two parameters are at
their respective center value
4.3 Effect of the process parameters on Kerf Width
The 3-D response surface and contour plots for the effect of process parameters on Kerf
Width have been constructed according to the fitted model:
Kerf Width = - 0.33175 + 8.33333E- 004 * TON + 6.89815E - 003 * TOFF +
0.13021 * WT + 0.031458 * WF - 5.41667E - 003 * TON * TOFF + 0.010625*
TON * WT + 5.00000E - 003* TON* WF - 2.08333E-003 * TOFF* WT
+5.41667E-003* TOFF* WF -8.12500E-003 * WT * WF -5.10417E-003 *
TON2+3.70370E-004 * TOFF
2 - 7.29167E-003 * WT2 -3.22917E-003* WF2
(3)
Table 5 shows the ANOVA table for Kerf Width where the Model F-value of 27.21
implies the model is significant. There is only a 0.01% chance that an F-value this large could
occur due to noise. Values of "Prob> F" less than 0.0500 indicate model terms are significant.
In this case A, B, C, AB, AC, AD, BC, BD, CD, A2, C2, D2 are significant model terms. The
"Lack of Fit F-value" of 2.88 implies the Lack of Fit is not significant relative to the pure

Volume 69, No. 1, (2019) 2019 SjF STU Bratislava 29
error. There is a 28.56% chance that a "Lack of Fit F-value" this large could occur due to
noise. The "Pred R-Squared" of 0.8311 is in reasonable agreement with the "Adj R-Squared"
of 0.9338; i.e. the difference is less than 0.2. "Adeq Precision" measures the signal to noise
ratio. A ratio greater than 4 is desirable and in the present case the ratio found to be 21.533
indicates an adequate signal. This model can be used to navigate the design space.
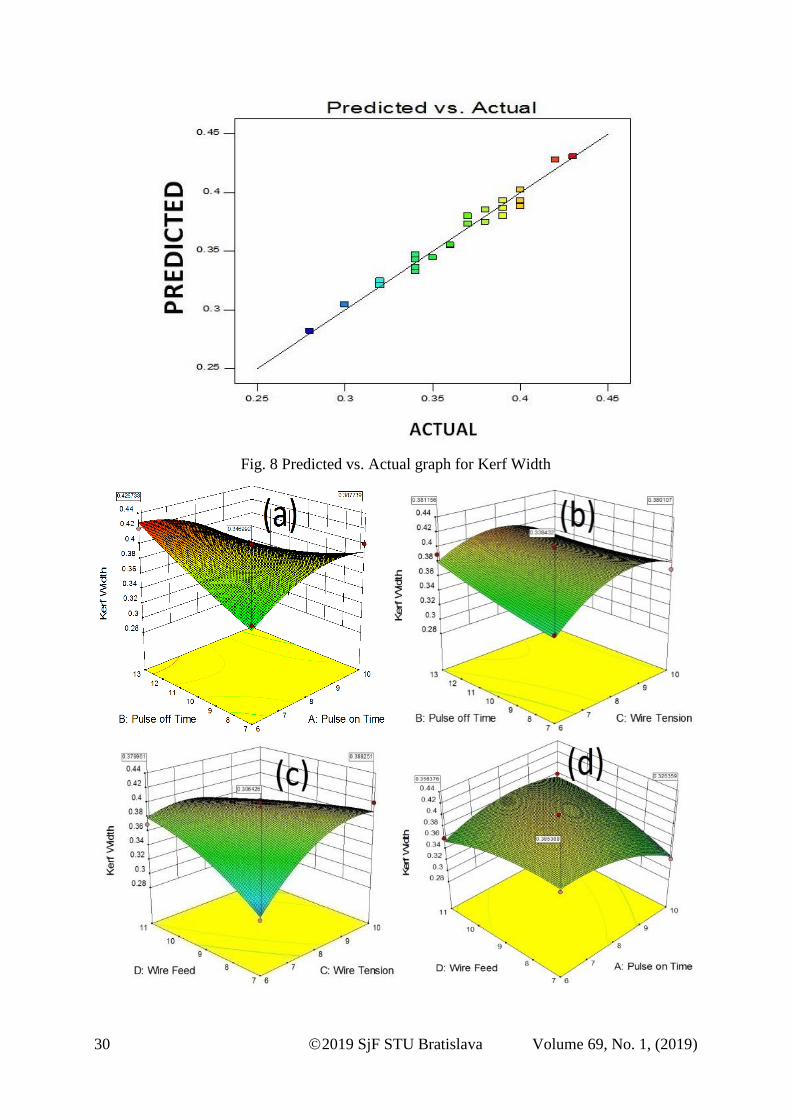
Fig 8 indicates a close agreement of the predicted line with the actual values. The actual
value points are very close to the predicted line which clearly provides the information that
the experimental values are justifying the predicted results.
Table 5. ANOVA table for Kerf Width
Source Sum of
Squares
DF Mean
Square
F
Value
p-value
Prob> F
Model 0.033 14 2.324E-003 27.21 < 0.0001 significant
A-Pulse on Time 1.200E-003 1 1.200E-003 14.05 0.0028 significant
B-Pulse off Time 1.008E-003 1 1.008E-003 11.80 0.0049 significant
C-Wire Tension 1.008E-003 1 1.008E-003 11.80 0.0049 significant
D-Wire Feed 3.000E-004 1 3.000E-004 3.51 0.0855 not significant
AB 4.225E-003 1 4.225E-003 49.46 < 0.0001 significant
AC 7.225E-003 1 7.225E-003 84.59 < 0.0001 significant
AD 1.600E-003 1 1.600E-003 18.73 0.0010 significant
BC 6.250E-004 1 6.250E-004 7.32 0.0191 significant
BD 4.225E-003 1 4.225E-003 49.46 < 0.0001 significant
CD 4.225E-003 1 4.225E-003 49.46 < 0.0001 significant
A2 2.223E-003 1 2.223E-003 26.03 0.0003 significant
B2 5.926E-005 1 5.926E-005 0.69 0.4212 not significant
C2 4.537E-003 1 4.537E-003 53.12 < 0.0001 significant
D2 8.898E-004 1 8.898E-004 10.42 0.0073 significant
Residual 1.025E-003 12 8.542E-005
Lack of Fit 9.583E-004 10 9.583E-005 2.88 0.2856 not significant
Pure Error 6.667E-005 2 3.333E-005
Core Total 0.034 26
R-Squared 0.9695 Pred R-Squared 0.8311
Adj R-Squared 0.9338 Adeq Precision 21.533
30 2019 SjF STU Bratislava Volume 69, No. 1, (2019)
Fig. 8 Predicted vs. Actual graph for Kerf Width
Volume 69, No. 1, (2019) 2019 SjF STU Bratislava 31
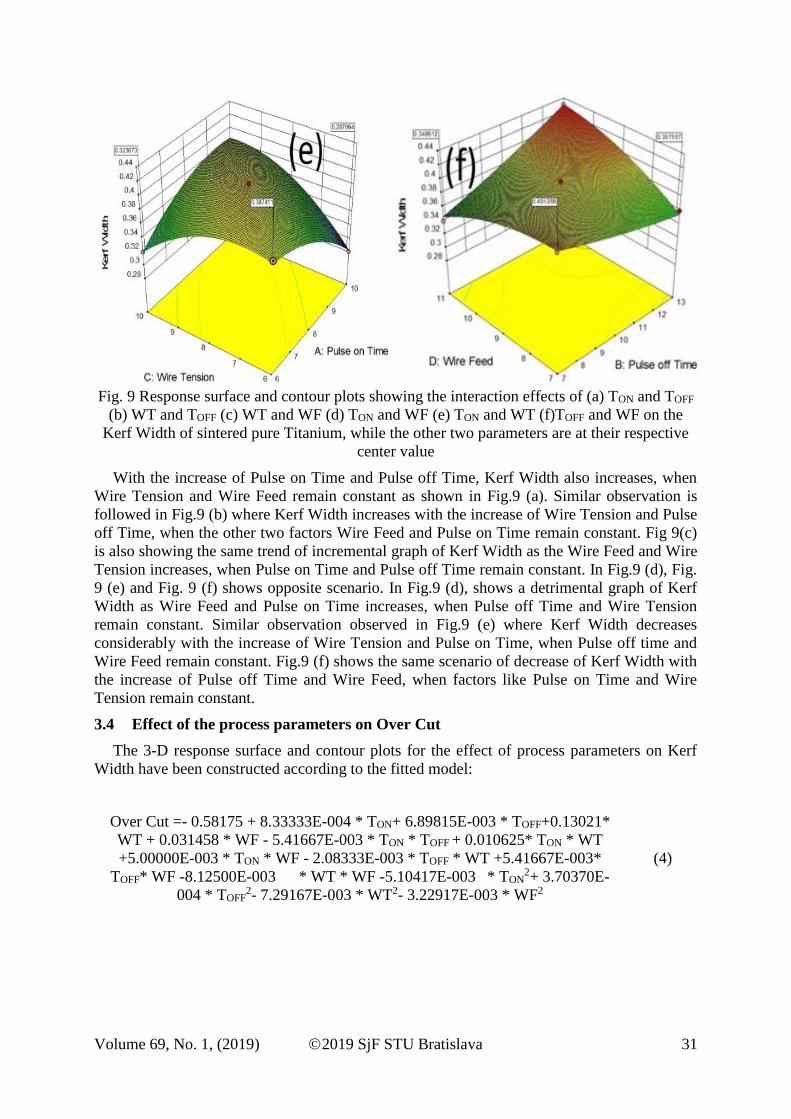
Fig. 9 Response surface and contour plots showing the interaction effects of (a) TON and TOFF
(b) WT and TOFF (c) WT and WF (d) TON and WF (e) TON and WT (f)TOFF and WF on the
Kerf Width of sintered pure Titanium, while the other two parameters are at their respective
center value
With the increase of Pulse on Time and Pulse off Time, Kerf Width also increases, when
Wire Tension and Wire Feed remain constant as shown in Fig.9 (a). Similar observation is
followed in Fig.9 (b) where Kerf Width increases with the increase of Wire Tension and Pulse
off Time, when the other two factors Wire Feed and Pulse on Time remain constant. Fig 9(c)
is also showing the same trend of incremental graph of Kerf Width as the Wire Feed and Wire
Tension increases, when Pulse on Time and Pulse off Time remain constant. In Fig.9 (d), Fig.
9 (e) and Fig. 9 (f) shows opposite scenario. In Fig.9 (d), shows a detrimental graph of Kerf
Width as Wire Feed and Pulse on Time increases, when Pulse off Time and Wire Tension
remain constant. Similar observation observed in Fig.9 (e) where Kerf Width decreases
considerably with the increase of Wire Tension and Pulse on Time, when Pulse off time and
Wire Feed remain constant. Fig.9 (f) shows the same scenario of decrease of Kerf Width with
the increase of Pulse off Time and Wire Feed, when factors like Pulse on Time and Wire
Tension remain constant.
3.4 Effect of the process parameters on Over Cut
The 3-D response surface and contour plots for the effect of process parameters on Kerf
Width have been constructed according to the fitted model:
Over Cut =- 0.58175 + 8.33333E-004 * TON+ 6.89815E-003 * TOFF+0.13021*
WT + 0.031458 * WF - 5.41667E-003 * TON * TOFF + 0.010625* TON * WT
+5.00000E-003 * TON * WF - 2.08333E-003 * TOFF * WT +5.41667E-003*
TOFF* WF -8.12500E-003 * WT * WF -5.10417E-003 * TON2+ 3.70370E-
004 * TOFF2- 7.29167E-003 * WT2- 3.22917E-003 * WF2
(4)
32 2019 SjF STU Bratislava Volume 69, No. 1, (2019)
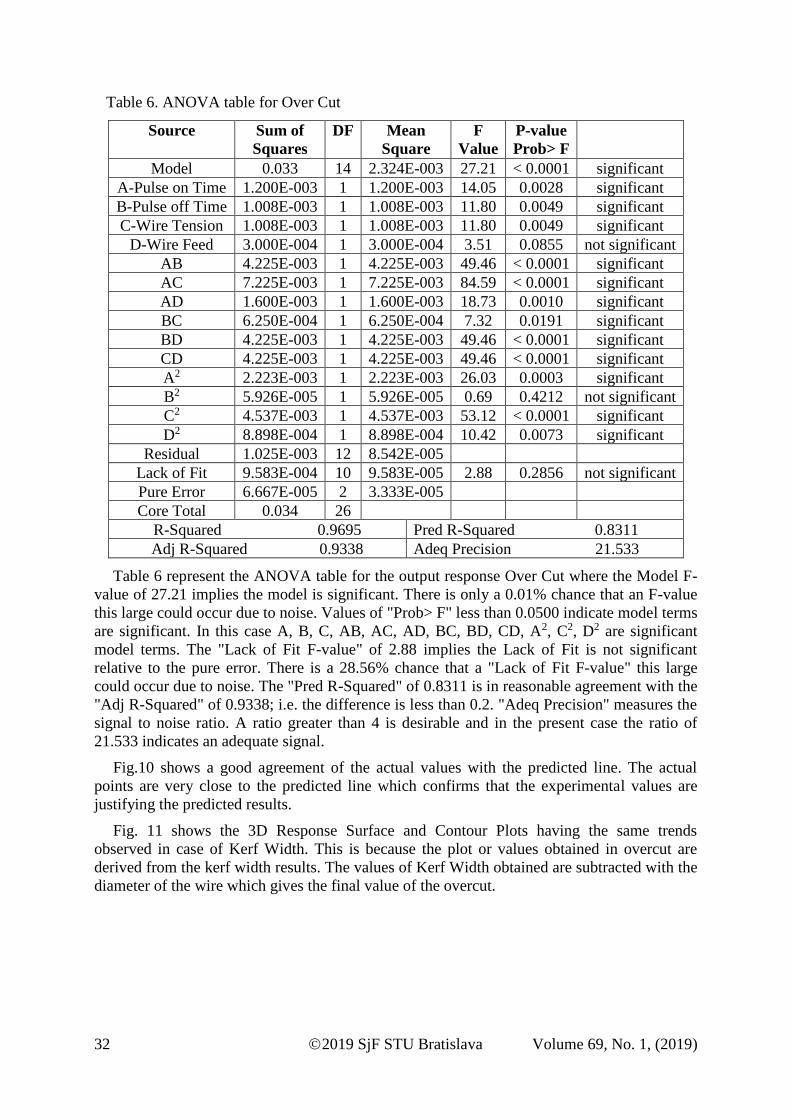
Table 6. ANOVA table for Over Cut
Source Sum of
Squares
DF Mean
Square
F
Value
P-value
Prob> F
Model 0.033 14 2.324E-003 27.21 < 0.0001 significant
A-Pulse on Time 1.200E-003 1 1.200E-003 14.05 0.0028 significant
B-Pulse off Time 1.008E-003 1 1.008E-003 11.80 0.0049 significant
C-Wire Tension 1.008E-003 1 1.008E-003 11.80 0.0049 significant
D-Wire Feed 3.000E-004 1 3.000E-004 3.51 0.0855 not significant
AB 4.225E-003 1 4.225E-003 49.46 < 0.0001 significant
AC 7.225E-003 1 7.225E-003 84.59 < 0.0001 significant
AD 1.600E-003 1 1.600E-003 18.73 0.0010 significant
BC 6.250E-004 1 6.250E-004 7.32 0.0191 significant
BD 4.225E-003 1 4.225E-003 49.46 < 0.0001 significant
CD 4.225E-003 1 4.225E-003 49.46 < 0.0001 significant
A2 2.223E-003 1 2.223E-003 26.03 0.0003 significant
B2 5.926E-005 1 5.926E-005 0.69 0.4212 not significant
C2 4.537E-003 1 4.537E-003 53.12 < 0.0001 significant
D2 8.898E-004 1 8.898E-004 10.42 0.0073 significant
Residual 1.025E-003 12 8.542E-005
Lack of Fit 9.583E-004 10 9.583E-005 2.88 0.2856 not significant
Pure Error 6.667E-005 2 3.333E-005
Core Total 0.034 26
R-Squared 0.9695 Pred R-Squared 0.8311
Adj R-Squared 0.9338 Adeq Precision 21.533
Table 6 represent the ANOVA table for the output response Over Cut where the Model F-
value of 27.21 implies the model is significant. There is only a 0.01% chance that an F-value
this large could occur due to noise. Values of "Prob> F" less than 0.0500 indicate model terms
are significant. In this case A, B, C, AB, AC, AD, BC, BD, CD, A2, C2, D2 are significant
model terms. The "Lack of Fit F-value" of 2.88 implies the Lack of Fit is not significant
relative to the pure error. There is a 28.56% chance that a "Lack of Fit F-value" this large
could occur due to noise. The "Pred R-Squared" of 0.8311 is in reasonable agreement with the
"Adj R-Squared" of 0.9338; i.e. the difference is less than 0.2. "Adeq Precision" measures the
signal to noise ratio. A ratio greater than 4 is desirable and in the present case the ratio of
21.533 indicates an adequate signal.
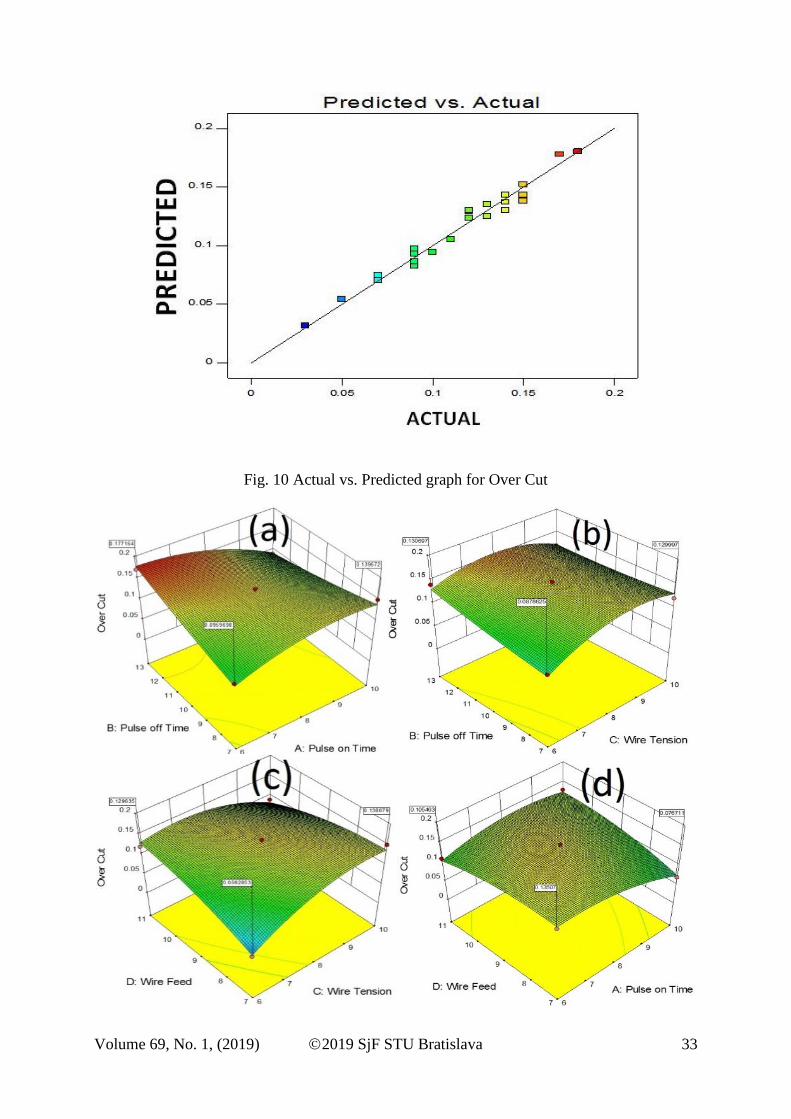
Fig.10 shows a good agreement of the actual values with the predicted line. The actual
points are very close to the predicted line which confirms that the experimental values are
justifying the predicted results.
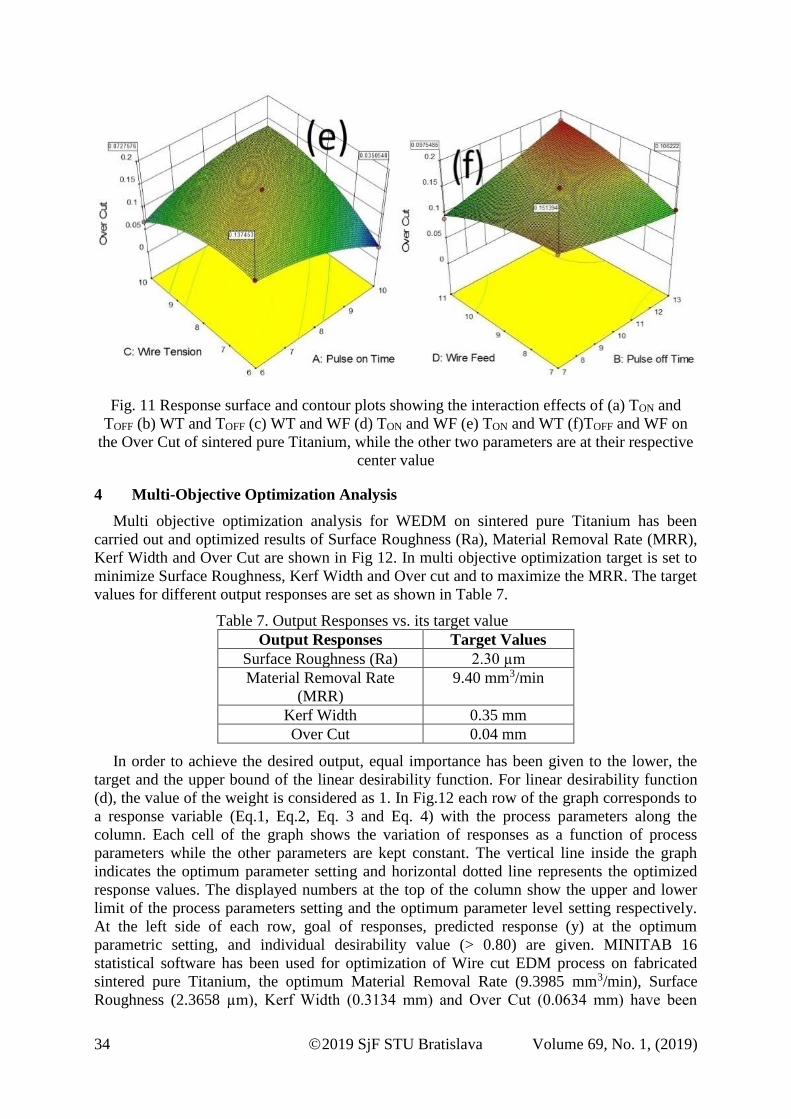
Fig. 11 shows the 3D Response Surface and Contour Plots having the same trends
observed in case of Kerf Width. This is because the plot or values obtained in overcut are
derived from the kerf width results. The values of Kerf Width obtained are subtracted with the
diameter of the wire which gives the final value of the overcut.
Volume 69, No. 1, (2019) 2019 SjF STU Bratislava 33
Fig. 10 Actual vs. Predicted graph for Over Cut
34 2019 SjF STU Bratislava Volume 69, No. 1, (2019)
Fig. 11 Response surface and contour plots showing the interaction effects of (a) TON and
TOFF (b) WT and TOFF (c) WT and WF (d) TON and WF (e) TON and WT (f)TOFF and WF on
the Over Cut of sintered pure Titanium, while the other two parameters are at their respective
center value
4 Multi-Objective Optimization Analysis
Multi objective optimization analysis for WEDM on sintered pure Titanium has been
carried out and optimized results of Surface Roughness (Ra), Material Removal Rate (MRR),
Kerf Width and Over Cut are shown in Fig 12. In multi objective optimization target is set to
minimize Surface Roughness, Kerf Width and Over cut and to maximize the MRR. The target
values for different output responses are set as shown in Table 7.
Table 7. Output Responses vs. its target value
Output Responses Target Values
Surface Roughness (Ra) 2.30 µm
Material Removal Rate
(MRR)
9.40 mm3/min
Kerf Width 0.35 mm
Over Cut 0.04 mm
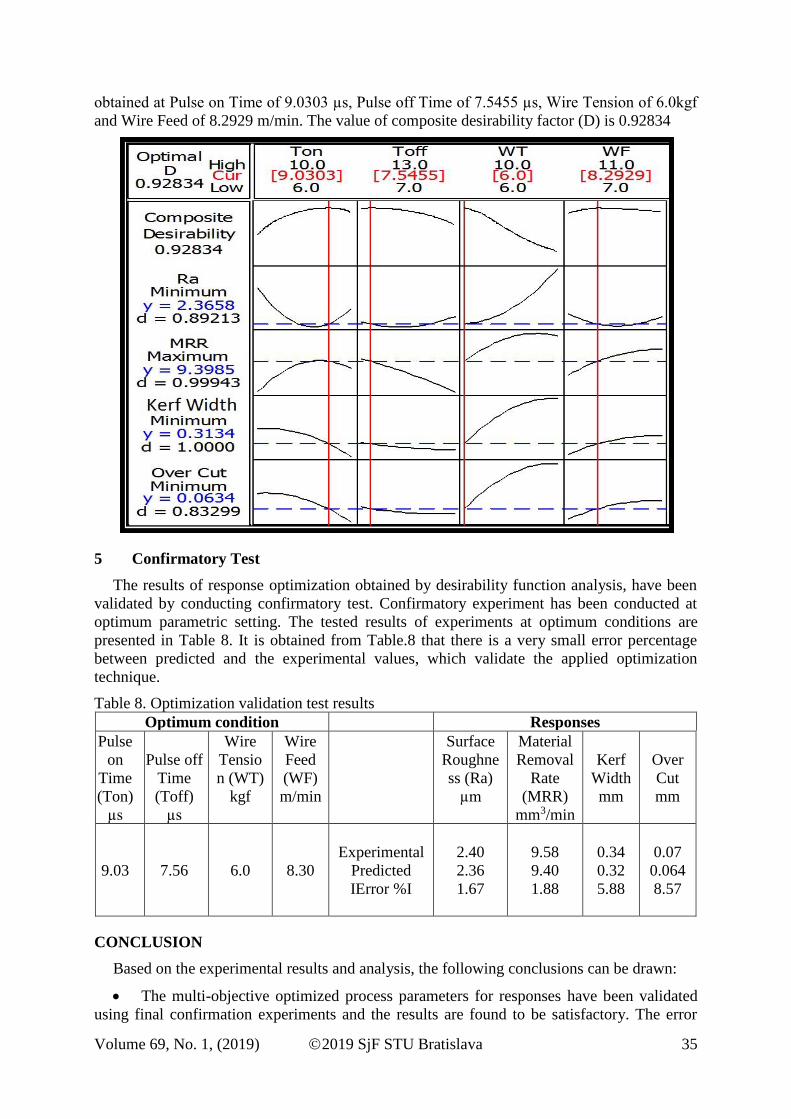
In order to achieve the desired output, equal importance has been given to the lower, the
target and the upper bound of the linear desirability function. For linear desirability function
(d), the value of the weight is considered as 1. In Fig.12 each row of the graph corresponds to
a response variable (Eq.1, Eq.2, Eq. 3 and Eq. 4) with the process parameters along the
column. Each cell of the graph shows the variation of responses as a function of process
parameters while the other parameters are kept constant. The vertical line inside the graph
indicates the optimum parameter setting and horizontal dotted line represents the optimized
response values. The displayed numbers at the top of the column show the upper and lower
limit of the process parameters setting and the optimum parameter level setting respectively.
At the left side of each row, goal of responses, predicted response (y) at the optimum
parametric setting, and individual desirability value (> 0.80) are given. MINITAB 16
statistical software has been used for optimization of Wire cut EDM process on fabricated
sintered pure Titanium, the optimum Material Removal Rate (9.3985 mm3/min), Surface
Roughness (2.3658 µm), Kerf Width (0.3134 mm) and Over Cut (0.0634 mm) have been
Volume 69, No. 1, (2019) 2019 SjF STU Bratislava 35
obtained at Pulse on Time of 9.0303 µs, Pulse off Time of 7.5455 µs, Wire Tension of 6.0kgf
and Wire Feed of 8.2929 m/min. The value of composite desirability factor (D) is 0.92834
5 Confirmatory Test
The results of response optimization obtained by desirability function analysis, have been
validated by conducting confirmatory test. Confirmatory experiment has been conducted at
optimum parametric setting. The tested results of experiments at optimum conditions are
presented in Table 8. It is obtained from Table.8 that there is a very small error percentage
between predicted and the experimental values, which validate the applied optimization
technique.
Table 8. Optimization validation test results
Optimum condition Responses
Pulse
on
Time
(Ton)
µs
Pulse off
Time
(Toff)
µs
Wire
Tensio
n (WT)
kgf
Wire
Feed
(WF)
m/min
Surface
Roughne
ss (Ra)
µm
Material
Removal
Rate
(MRR)
mm3/min
Kerf
Width
mm
Over
Cut
mm
9.03
7.56
6.0
8.30
Experimental
Predicted
IError %I
2.40
2.36
1.67
9.58
9.40
1.88
0.34
0.32
5.88
0.07
0.064
8.57
CONCLUSION
Based on the experimental results and analysis, the following conclusions can be drawn:
• The multi-objective optimized process parameters for responses have been validated
using final confirmation experiments and the results are found to be satisfactory. The error
36 2019 SjF STU Bratislava Volume 69, No. 1, (2019)
percentage between the optimization model prediction and the final confirmation experiments
are found to be approx ~ 1.67% for Surface Roughness, approx ~ 1.88% for Material
Removal Rate, approx ~ 5.88% for Kerf Width and approx ~ 8.57 % for Over cut.
• The 3-D response surface and contour plots show that Pulse on Time (TON) plays a
vital role as input parameters and influences the output responses. With the increase in TON
both MRR and Ra value increases simultaneously. Pulse on Time (TON) shows this behaviour
irrespective of other parameters position in center line value.
• For Kerf Width and Over Cut it has been observed in 3-D response surface and
contour plots that Pulse On Time, Pulse off Time, Wire Feed and Wire Tension shows
different results in different cases because these factors depends on other parameters position
in centre line value.
• The actual vs. predicted graph in case of both the responses (Ra and MRR) shows
good agreement with each other and satisfies the present work to be on the right track.
ACKNOWLEDGEMENT
The help rendered by Mr. M. Naskar of M/s. Naskar Ceramics, Howrah in sample preparation
is gratefully acknowledged by the author.
REFERENCES
[1] Kumar, A., Kumar, V., Kumar, J. “A review on the state of the art in wire electric
discharge machining (WEDM) process”, International Journal of Mechanical
Engineering Research and Development (IJMERD) 1 (1), pp. 23 – 39, 2011.
[2] Kumar, R., Singh, S. “Current research trends in Wire Electrical Discharge Machining:
An overview”, International Journal on Emerging Technologies 3 (1), pp. 33 – 40, 2012.
[3] Chakraborty, S., Debnath, D., Mallick, A. R., Das P. K. “Mechanical and thermal
properties of hot pressed ZrB2 system with TiB2”, International Journal of Refractory
Metals and Hard Materials 46, pp. 35 – 42, 2014.
[4] Jalaly, M., Bafghi, M. Sh., Tamizifar, M., Gotor F. J. “Formation mechanism of ZrB2 -
Al2O3nano-composite powder by mechanically induced self-sustaining reaction” J.
Mater Science 48, pp. 7557 – 7567, 2013.
[5] Selvakumar, G., Sornalatha, G., Sarkar, S., Mitra, S. “Experimental investigation and
multi-objective optimization of wire electrical discharge machining (WEDM) of 5083
aluminium alloy”, Trans. Nonferrous Met. Soc. China 24, pp. 373 – 379, 2013.
[6] Garg, Sanjeev, K. R., Alakesh, M., Ajai, J. “Multi-objective optimization of machining
characteristics during wire electrical discharge machining of Al / ZrO2 particulate
reinforced metal matrix composite”, Journal of Engineering Research 1 (3), pp. 145 –
160, 2013.
[7] Khan, N. Z, Wahid, M., Singh, S., Siddiquee, A. N., Khan Z. A. “A study on micro
hardness in wire electrical discharge machining based on Taguchi method”,
International Journal of Mechanical and Production Engineering 1 (1), pp. 10 – 15,
2013.
[8] Goswami, A., Kumar, J. “An investigation into the machining characteristics of
Nimonic 80A using CNC Wire - EDM”, International Journal of Advanced Engineering
Technology III (1), pp. 170 – 174, 2012.
Volume 69, No. 1, (2019) 2019 SjF STU Bratislava 37
[9] Parashar, V., Rehman, A., Bhagoria, J. L., Puri, Y. M. “Kerfs width analysis for wire
cut electro discharge machining of SS 304L using design of experiments”, Indian
Journal of Science and Technology 3 (4), pp. 369 – 373, 2010.
[10] Datta, S., Sankar Mahapatra, S. “Modelling, simulation and parametric optimization of
wire EDM process using response surface methodology coupled with grey-Taguchi
technique”, International Journal of Engineering, Science and Technology 2 (5), pp. 162
– 183, 2010.
[11] Rutvik A. Shah, Darji, A. “A literature review on effect of machining parameters in
Wire-EDM”, IJSRD - International Journal for Scientific Research & Development, 1
(9), pp. 1840 – 1842, 2013.
[12] Kumar, A., Kumar, V. Kumar, J. “Prediction of surface roughness in wire electric
discharge machining (WEDM) process based on Response Surface Methodology”
International Journal of Engineering and Technology 2 (4), pp. 708 – 719, 2012.
[13] Singh, A. K., Kumar, S., Singh, V. P. “Electrical discharge machining of super alloys:
A Review”, IJRMET - International Journal of Research in Mechanical Engineering &
Technology 3 (2), pp. 157 – 161, 2013.
[14] Prajapati, S. B., Patel, N.S. “Effect of process parameters on performance measures of
wire - EDM for AISI AS tool steel”, International Journal of Computational
Engineering Research 03 (4), pp. 274 – 278, 2013.
[15] Geetha, Bezawada Sreenivasulu, M., Harinath Gowd, G. “Modelling & Analysis of
performance characteristics of wire EDM of SS304” IJITEE - International Journal of
Innovative Technology and Exploring Engineering 3 (4), pp. 122 – 125, 2013.
[16] Subrahmanyam, S. V. Sarcar, M. M. M. “Evaluation of optimal parameters for
machining with wire cut EDM using Greay-Taguchi method”, International Journal of
Scientific and Research Publications 3 (3), pp. 1 – 9, 2013.
[17] Shah, R. A., Darji, A. “A Review: An experimental effect of electrode material on
MRR, kerf width and surface roughness of AISI D2 tool steel in WEDM”, Indian
Journal of Applied Research 3 (12), pp. 211 – 213, 2013.
[18] Abbas, N. M., Solomon, D. G., Md. Bahari, F. ” A review on current research trends in
electrical discharge machining (EDM)”, International Journal of Machine Tools and
Manufacture 47 (7 – 8), pp. 1214 – 1228, 2007.
[19] Ho, K. H., Newman, S.T., Rahimifard, S., Allen, R. D. “State of the art in wire electrical
discharge machining (WEDM)” (2004), International Journal of Machine Tools and
Manufacture 44 (12 – 13), pp. 1247 – 1259, 2004.
[20] Yan, M.-T., Huang, P.-H. “Accuracy improvement of wire-EDM by real-time wire
tension control”, International Journal of Machine Tools and Manufacture 44 (7–8), pp.
807 – 814, 2004.
[21] Alias, A., Abdullah, B., Abbas, N. M. “Influence of Machine Feed Rate in WEDM of
Titanium Ti-6Al-4V with Constant Current (6A) Using Brass Wire”, Procedia
Engineering 41, pp. 1806 – 1811, 2012.
[22] Simao, J., Lee, H. G., Aspinwall, D.K., Dewes R.C., Aspinwall E.M. “Workpiece
surface modification using electrical discharge machining”, International Journal of
Machine Tools and Manufacture 43 (2), pp. 121 – 128, 2003.
38 2019 SjF STU Bratislava Volume 69, No. 1, (2019)
[23] Gautier, G., Priarone, P. C., Rizzuti, S., Settineri, L., Tebaldo, V. “A Contribution on
the Modelling of Wire Electrical Discharge Machining of a γ-TiAl Alloy”, Procedia
CIRP 31, pp. 203 – 208, 2015. DOI: https://doi.org/10.1016/j.procir.2015.03.019
[24] Poletti, C., Balog, M., Schubert, T., Liedtke, V., Edtmaier, C. “Production of titanium
matrix composites reinforced with SiC particles”, Composites Science and Technology
68, pp. 2171 – 2177, 2008.
[25] Madyira, D. M., Akinlabi, E. T. “Effects of Wire Electrical Discharge Machining on
Fracture Toughness of Grade 5 Titanium Alloy”, Proceedings of the World Congress on
Engineering II, 2014.
[26] Himanshu, P. R., Lalta, P., Mayank, P., Vineet, T. “An Estimating The Effect Of
Process Parameters On Metal Removal Rate And Surface Roughness In WEDM Of
Composite AL6063/SIC/AL2O3 By Taguchi Method”, Journal of Mechanical
Engineering – Strojnícky časopis 67 (2), pp. 25 – 36, 2017. DOI: 10.1515/scjme-2017-
0015.
[27] Moi, S. Ch., Pal P. K., Bandyopadhyay, A., Rudrapati, R. “Determination Of Tungsten
Inert Gas Welding Input Parameters To Attain Maximum Tensile Strength Of 316L
Austenitic Stainless Steel”, Journal of Mechanical Engineering – Strojnícky časopis 68
(3), pp. 231 – 248, 2018. DOI: 10.2478/scjme-2018-0037.
[28] Srinivasa Rao, M., Ramanaiah, N. “Optimization Of Process Parameters For FSW Of
Al-Mg-Mn-Sc-Zr Alloy Using CCD And RSM”, Journal of Mechanical Engineering –
Strojnícky časopis, 68 (3), pp. 195 – 224, 2018. DOI: 10.2478/scjme-2018-0035