which tad and caltad cut-offs best predict cut- out risk
TRANSCRIPT
Page 1/16
Which TAD and CALTAD Cut-Offs Best Predict Cut-Out Risk for Intramedullary Fixation of ProximalFemur Fractures?Gaetano Caruso ( [email protected] )
University of FerraraNicola Corradi
University of FerraraAntonio Caldaria
University of FerraraDaniele Bottin
Arcispedale Sant'AnnaDario Lo Re
University of FerraraVincenzo Lorusso
Arcispedale Sant'AnnaChiara Morotti
Arcispedale Sant'AnnaGiorgia Valpiani
Arcispedale Sant'AnnaLeo Massari
University of Ferrara
Research Article
Keywords: Pertrochanteric fractures, cut-out, tip-apex distance, calcar-referenced tip-apex distance, TAD,CalTAD
Posted Date: April 20th, 2021
DOI: https://doi.org/10.21203/rs.3.rs-425355/v1
License: This work is licensed under a Creative Commons Attribution 4.0 International License. Read Full License
Page 2/16
AbstractPurpose: Cut-out is one of the most common mechanical failures in the internal �xation of trochanterichip fractures. The tip-apex distance (TAD), and the calcar-referenced tip apex distance (CalTAD) are theradiographic parameters that most predict the risk of cut-out. The optimal CalTAD value has not yet beende�ned, but the optimal TAD value is reported as 25 mm or less. However, this cut-off is highly speci�cbut poorly sensitive. The aim of this study was to determine highly speci�c and sensitive TAD andCalTAD values and shed light on the role of other clinical variables.
Methods: A total of 604 patients were included in this retrospective cross-sectional study. For eachpatient the following data were recorded: number of cut-out, AO/OTA classi�cation, quality of thereduction, type of nail, cervicodiaphyseal angle, type of distal locking, post-operative weight-bearing, TADand CalTAD values, and the position of the screw head in the femoral head according to the Clevelandsystem.
Results: The incidence of cut-out across the sample was 3.1%. The median TAD in the cut-out group was38.72, while in the no cut-out group it was 22.16. The median CalTAD in the cut-out group was 39.34,while in the no cut-out group it was 22.19. The cut-off values for TAD and CalTAD with highest value ofsensitivity and speci�city for the risk of cut-out were 34.8 and 35.2, respectively.
Conclusions: The incidence of cut-out can be reduced by performing careful minimal reduction andensuring stable �xation by avoiding TAD>34.8mm and CalTAD>35.2 mm.
IntroductionPertrochanteric fracture is common in elderly patients worldwide, and its incidence is expected to reach6.3 million/year by 2050 [1,2]. There is a close correlation between proximal femur fractures andincreased risk of death and major complications, especially in elderly patients [3,4].
Several authors have pointed out the bene�ts of surgery, and early surgical treatment to reduce relatedmortality is strongly recommended [5,6,7]. Nowadays, both extramedullary and intramedullary �xationsare viable options [8], but due to its biochemical and biological advantages, intramedullary nailing hasbecome the most used �xation device in pertrochanteric fractures worldwide, especially in unstablefractures [9,10].
The most common cause of failure for this type of �xation is nail cut-out, which is de�ned as extrusion ofthe cephalic screw as a consequence of a varus collapse of the neck–shaft angle [11]. The prevalence ofcut-out is estimated at between 1.85%–16.5% [12,13], and several factors are thought to be related to thiscomplication, including bone stock quality, cephalic screw positioning and length, tip–apex distance(TAD), calcar tip-apex distance (CalTAD) and fracture reduction [14, 15, 16]. In particular, Baumgaertner etal. identi�ed a higher cut-out risk when the TAD was greater than 25 mm; the 25 mm TAD cut-off wascon�rmed by a biomechanical study by Kuzy et al., who introduced CalTAD as a new parameter in
Page 3/16
predicting cut-out. Consequently, most of current literature identi�es a TAD shorter than 25 mm ascorrelating with a lower cut-out risk [15, 16, 17], but while this cut-off is highly speci�c, it is poorlysensitive. Furthermore, several authors have reported that longer TADs and CalTADs do not, in fact,increase cut-out risk [18, 19].
Hence, the main aim of our study was to evaluate the best TAD and CalTAD cut-off values to de�ne thecut-out risk. A further objective was to analyse the reliability of multiple other factors as predictors of therisk of lag-screw cut-out, speci�cally TAD and CalTAD values, Cleveland method, postoperative bearing,type of fracture, quality of reduction, laterality and age.
Materials And MethodsThis was a retrospective cross-sectional study on consecutive patients with pertrochanteric femurfracture treated with closed reduction and internal �xation with short intramedullary nails, admittedbetween January 2014 and December 2019 to our Orthopaedic and Traumatology Unit in the northeast ofItaly (catchment area of roughly 350,000 inhabitants).
The adult patients undergoing surgery for pertrochanteric fractures were identi�ed retrospectively from ahospital discharge database. The fractures were classi�ed according to the AO-Müller/OrthopaedicTrauma Association fracture and dislocation classi�cation (AO/OTA) [20]. Patients included in the studywere those with an isolated proximal femur fracture type 31-A who underwent surgical intervention withproximal femur short nail (Gamma3 Trochanteric Nail 180 -Stryker – US or Trigen IntertanIntertrochanteric Antegrade Nail - Smith & Nephew - UK).
The exclusion criteria were as follows: proximal femoral fracture involving femur diaphysis orsubtrochanteric fractures; pertrochanteric femoral fracture treated with open reduction and internal�xation with long intramedullary nails, extramedullary �xation or other devices; patients withoutminimum follow-up period of 3 months; pathological fractures induced by tumours or metastatic lesions;and poor-quality x-rays.
For each patient the following data were recorded: number of cut-outs or other complications; AO/OTAclassi�cation for trochanteric fractures (31-A1, 31-A2, 31-A3) based on pre-operative radiographicevaluation on anteroposterior and cross-table lateral projections; quality of the reduction (poor,acceptable, good) based on post-operative radiographic evaluation according to Baumgaertner’s criteria(normal or slight valgus alignment on antero-posterior radiograph, <20° angulation on lateral radiographand fracture gap equal to or less than 4 mm were considered as good reduction); type of nail (Gamma3or Trigen Intertan), specifying the cervicodiaphyseal angle (120°, 125°, 130°) and the type of distal lockingused (static, dynamic or unlocked); whether post-operative weight-bearing was allowed or not; TAD andCalTAD values; and the position of the screw head in the femoral head according to the Cleveland system[15, 17,19,21].
Page 4/16
TAD and CalTAD were calculated on postoperative x-rays in two projections, namely a standardanteroposterior projection of the lower limbs rotated internally by 15°, and cross-table lateral projectionswith the contralateral limb �exed and abducted. Measurements were performed with the aid ofCarestream Vue Picture Archiving and Communication system (PACs, version 12.2.5.00397) software. Asingle observer (a consultant trauma surgeon) measured the TAD and the CalTAD, the screw positionaccording to Cleveland method, and the fracture reduction, in order to eliminate inter-observer variability.
The study was approved by the local University-Hospital Human Subject Research Ethics Committee(Comitato Etico Indipendente di Area Vasta Emilia Centro - CE-AVEC 696/2020/Oss/AOUFe 23/07/2020),consent to participation were not required for retrospective studies and data collection and analysis wereperformed in compliance with the Declaration of Helsinki. The study was designed and written accordingto STROBE guidelines [22]
Statistical analysis
The Shapiro–Wilk test was used to test the normality of distribution of the continuous variables. In thepresence of symmetrical distributions, the variables are represented as mean and standard deviation(SD), while non-normal distributions are expressed as a median and interquartile range (IQR). Categoricaldata are expressed as absolute numbers and percentages. Statistical comparisons of categoricalvariables were assessed using Pearson’s χ2 test or Fisher’s exact test, depending on the minimal expectedcount in each crosstab. Statistical comparisons of continuous variables were assessed using Student’s t -test for normally distributed variables, and the Mann–Whitney U-test in the case of non-normaldistribution. Univariate analysis was used to estimate the ROC curves for TAD and CalTAD, in order tomeasure testing accuracy; the area under the curve (AUC) re�ected test accuracy as follows:uninformative if AUC = 0.5; low accuracy if 0.5 < AUC ≤ 0.7; moderate accuracy if 0.7 < AUC ≤ 0.9; veryhigh accuracy if 0.9 < AUC < 1; and perfect if AUC = 1. The thresholds for TAD and CalTAD were de�nedas the optimal cut-off that maximized the distance to the identity (diagonal) line in the ROC curveaccording to Youden’s J statistic. Two multivariate linear regression models were used to identify factorsassociated with the presence of cut-out, one using standard TAD and CalTAD thresholds, and the otherone using the TAD and CalTAD thresholds determined in our analysis via Youden’s J statistic.
All analyses were performed using Stata 15.1 SE (Stata Corporation, College Station, Texas, USA); a p-value <0.05 was de�ned as statistically signi�cant.
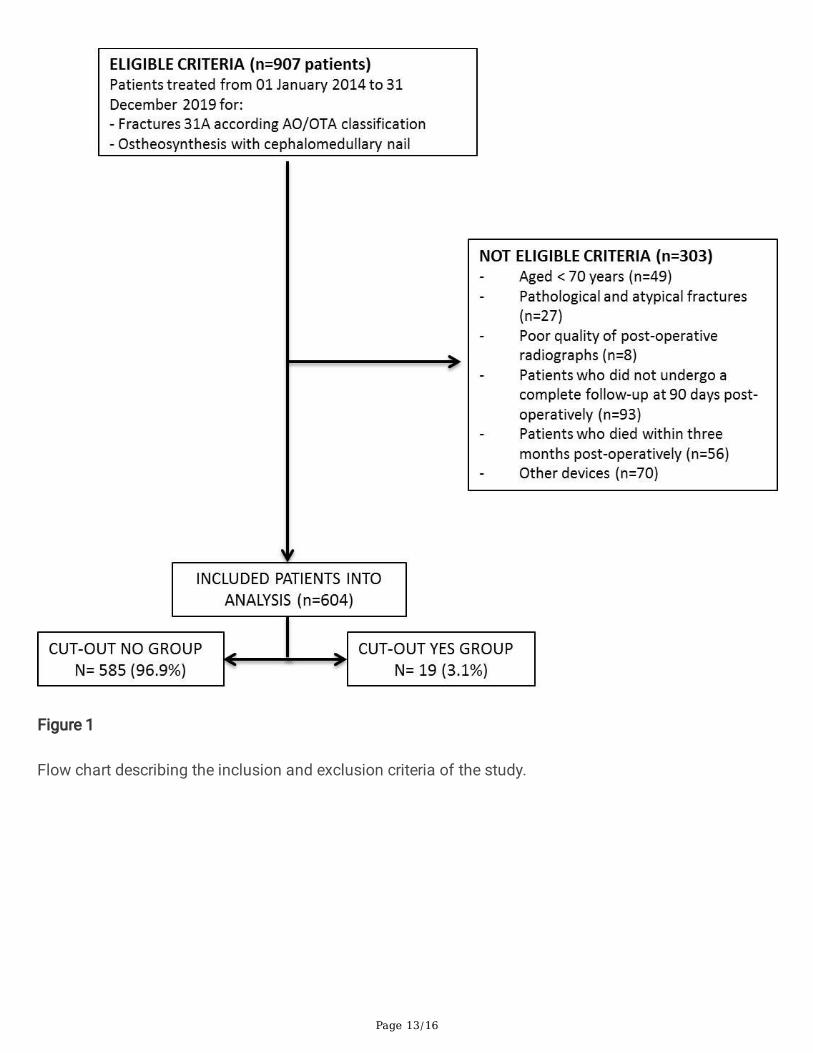
ResultsA total of 907 patients were identi�ed; of these, only 604 patients met the inclusion criteria and weretherefore eligible for this study. The most frequent causes of exclusion from the study were death, afollow-up period shorter than three months after surgical intervention, and the use of osteosynthesisdevices different from those under study (Figure 1). Among the 604 patients who were reviewed, lag-screw cut-out was observed in 19 cases—an incidence of 3.1%. Table 1 synthesizes the factors that weidenti�ed as possibly associated with the risk of cut-out. Speci�cally, while median age, fracture side and
Page 5/16
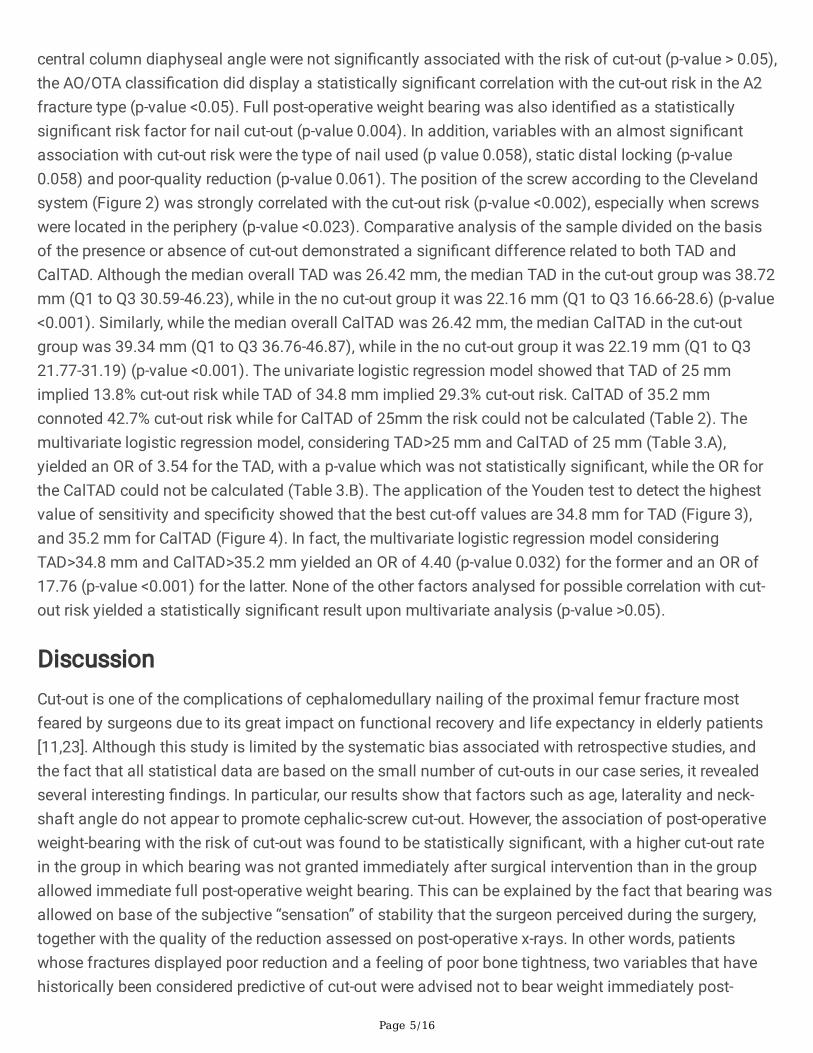
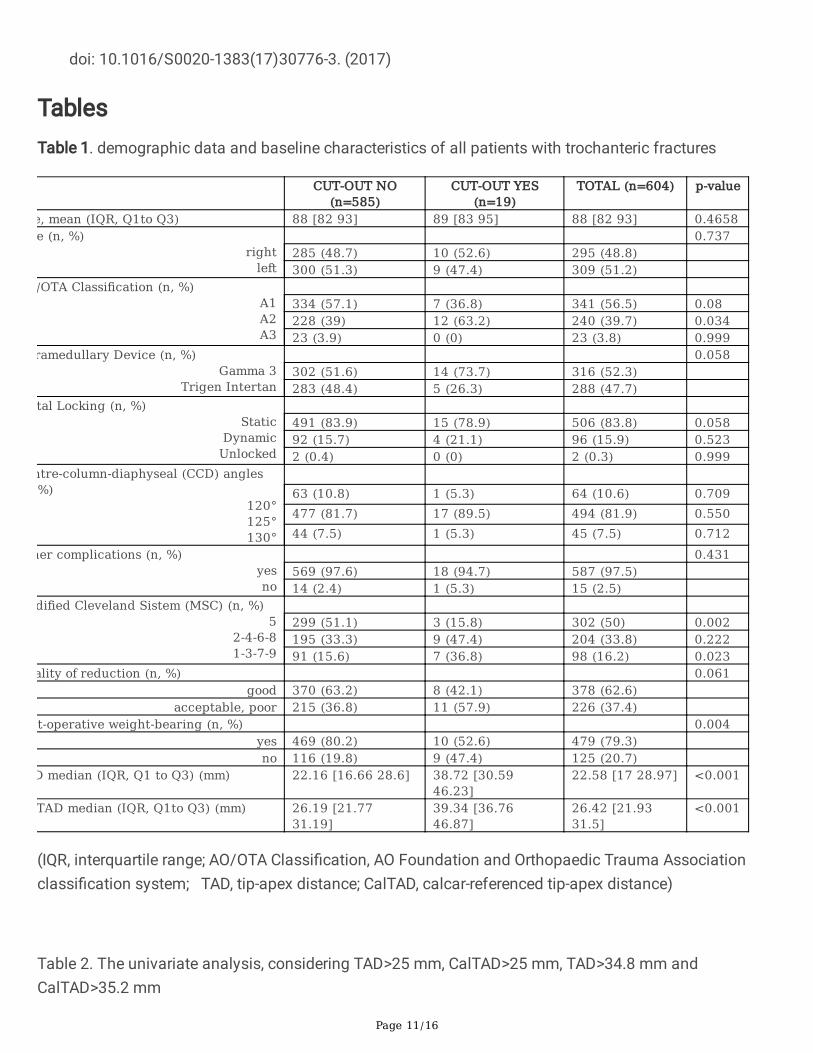
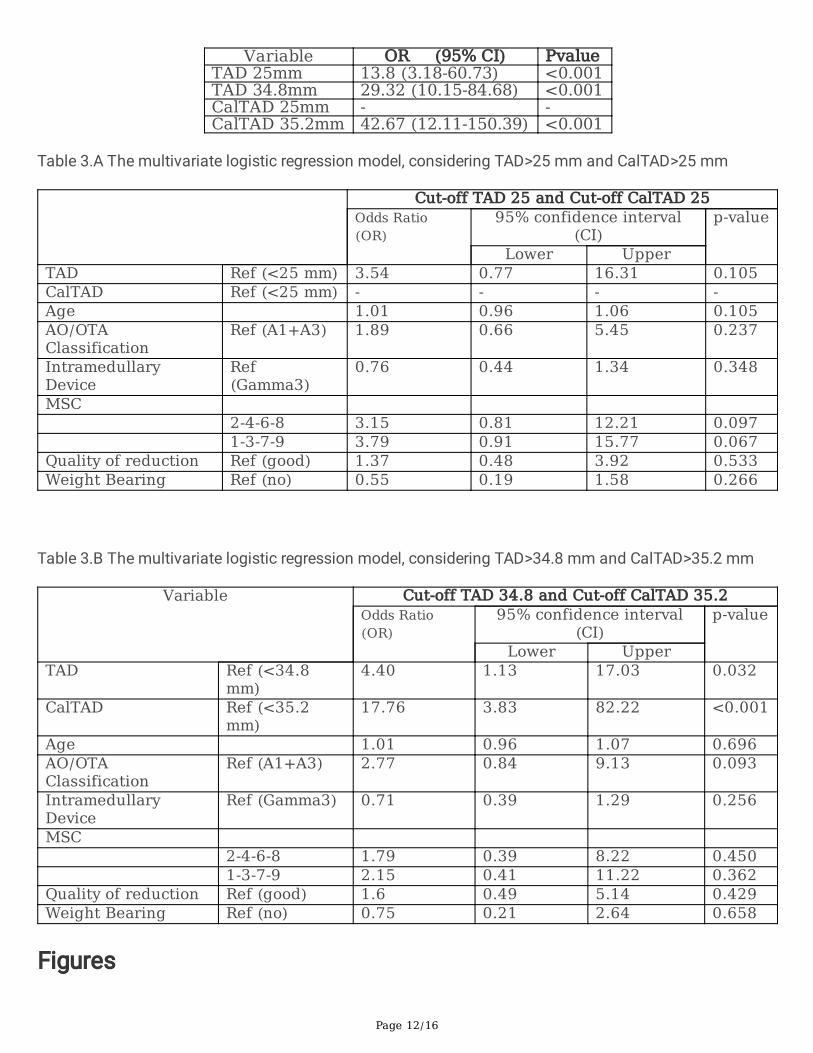
central column diaphyseal angle were not signi�cantly associated with the risk of cut-out (p-value > 0.05),the AO/OTA classi�cation did display a statistically signi�cant correlation with the cut-out risk in the A2fracture type (p-value <0.05). Full post-operative weight bearing was also identi�ed as a statisticallysigni�cant risk factor for nail cut-out (p-value 0.004). In addition, variables with an almost signi�cantassociation with cut-out risk were the type of nail used (p value 0.058), static distal locking (p-value0.058) and poor-quality reduction (p-value 0.061). The position of the screw according to the Clevelandsystem (Figure 2) was strongly correlated with the cut-out risk (p-value <0.002), especially when screwswere located in the periphery (p-value <0.023). Comparative analysis of the sample divided on the basisof the presence or absence of cut-out demonstrated a signi�cant difference related to both TAD andCalTAD. Although the median overall TAD was 26.42 mm, the median TAD in the cut-out group was 38.72mm (Q1 to Q3 30.59-46.23), while in the no cut-out group it was 22.16 mm (Q1 to Q3 16.66-28.6) (p-value<0.001). Similarly, while the median overall CalTAD was 26.42 mm, the median CalTAD in the cut-outgroup was 39.34 mm (Q1 to Q3 36.76-46.87), while in the no cut-out group it was 22.19 mm (Q1 to Q321.77-31.19) (p-value <0.001). The univariate logistic regression model showed that TAD of 25 mmimplied 13.8% cut-out risk while TAD of 34.8 mm implied 29.3% cut-out risk. CalTAD of 35.2 mmconnoted 42.7% cut-out risk while for CalTAD of 25mm the risk could not be calculated (Table 2). Themultivariate logistic regression model, considering TAD>25 mm and CalTAD of 25 mm (Table 3.A),yielded an OR of 3.54 for the TAD, with a p-value which was not statistically signi�cant, while the OR forthe CalTAD could not be calculated (Table 3.B). The application of the Youden test to detect the highestvalue of sensitivity and speci�city showed that the best cut-off values are 34.8 mm for TAD (Figure 3),and 35.2 mm for CalTAD (Figure 4). In fact, the multivariate logistic regression model consideringTAD>34.8 mm and CalTAD>35.2 mm yielded an OR of 4.40 (p-value 0.032) for the former and an OR of17.76 (p-value <0.001) for the latter. None of the other factors analysed for possible correlation with cut-out risk yielded a statistically signi�cant result upon multivariate analysis (p-value >0.05).
DiscussionCut-out is one of the complications of cephalomedullary nailing of the proximal femur fracture mostfeared by surgeons due to its great impact on functional recovery and life expectancy in elderly patients[11,23]. Although this study is limited by the systematic bias associated with retrospective studies, andthe fact that all statistical data are based on the small number of cut-outs in our case series, it revealedseveral interesting �ndings. In particular, our results show that factors such as age, laterality and neck-shaft angle do not appear to promote cephalic-screw cut-out. However, the association of post-operativeweight-bearing with the risk of cut-out was found to be statistically signi�cant, with a higher cut-out ratein the group in which bearing was not granted immediately after surgical intervention than in the groupallowed immediate full post-operative weight bearing. This can be explained by the fact that bearing wasallowed on base of the subjective “sensation” of stability that the surgeon perceived during the surgery,together with the quality of the reduction assessed on post-operative x-rays. In other words, patientswhose fractures displayed poor reduction and a feeling of poor bone tightness, two variables that havehistorically been considered predictive of cut-out were advised not to bear weight immediately post-
Page 6/16
operatively. However, it appears from our data that abstention from post-operative weight-bearing doesnot represent a protective factor for cut-out if adequate reduction is not achieved.
Indeed, in our sample the quality of reduction, along with distal locking and the choice of nail, displayed acorrelation with the risk of cut-out approaching statistical signi�cance. Speci�cally, we found a higherpercentage of cut-out associated with poor or acceptable reductions, and with dynamic distal locking andthe use of a mono-cephalic nail. Although not statistically signi�cant, this data suggests that a goodfracture reduction should be achieved and an integrated two-screw cephalomedullary nail with distalstatic locking used to reduce the risk of cut-out. That being said, none of these variables displayed asigni�cant statistical correlation with cut-out in the multivariate statistical analysis. Similar results werealso found in other recent studies, suggesting that these variables are still able to increase the risk of cut-out, but only if associated with stronger predictive factors [14,24-26].
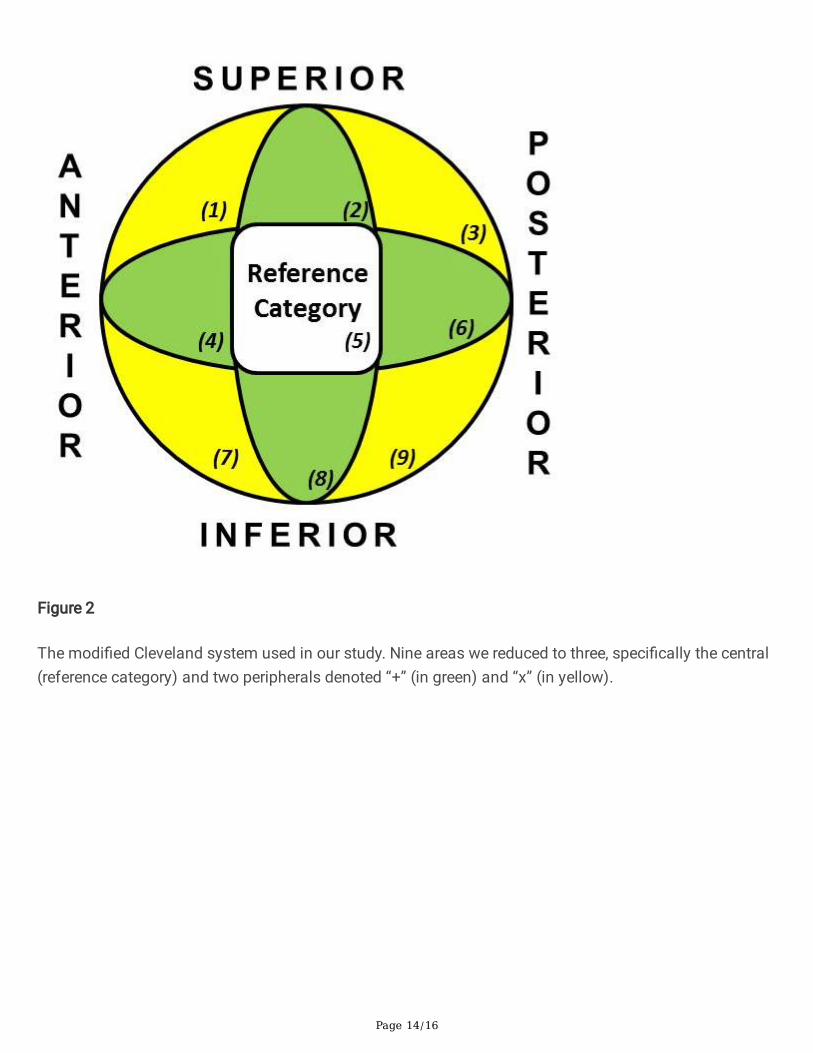
On this topic, it is widely reported in the literature that positioning the lag screw in the upper quadrants,according to the Cleveland system diagram [12, 14-19,21], increases the risk of cut-out. However, it is stillunder discussion whether the best screw position is the centre-centre or the inferior-centre quadrant. Inour analysis, position 5 demonstrated a statistically signi�cant correlation with a reduction in the risk ofcut-out (p < 0.002). In contrast, positioning the lag screw in peripheral positions (zones 1, 3, 7 or 9)displayed a statistically signi�cant correlation with an increased risk of cut-out (p< 0.02). These �ndingsmirror those reported in 2017 by Caruso et al. on a series of 571 patients [19].
In 1995, Baumgaertner et al. introduced the de�nition of the tip–apex-distance (TAD) as the sum of thedistance, measured on anteroposterior and lateral radiographs, between the tip of the lag screw and thefemur head apex. They de�ned the optimal cut-off for TAD as 25 mm [15]. In 2012, Kuzyk et al. identi�eda new parameter associated with lag-screw cut-out risk, which they termed the calcar tip–apex distance(CalTAD), de�ned as the distance between the lag screw tip and the calcar femorale [16]. Some authorsconsider CalTAD as the best indicator of the lag screw position and the best cut-out predictor, as theyobserved no cut-out in association with values of CalTAD lower than 20.88mm [13]. However, node�nitive CalTAD cut-off has yet been established [13, 16], and CalTAD does not appear to be superiorthan TAD in predicting cut-out [30-31].
On one hand, there is a large amount of literature supporting a TAD value of 25 mm or less [15, 17, 27-29],but on the other several authors have highlighted that Baumgaertner’s TAD cut-off of 25 mm is notsupported by clinical evidence. Yam et al. raised the traditional TAD cut-off from 25 mm to 27 mm [18],and others have reported that a limit of 25 mm has no biomechanical justi�cation and should in fact beadjusted according to femur head size [18, 32–33].
In our analysis, TAD>25 mm yielded an OR of 3.54 with a p-value that is not statistically signi�cant, andan unmeasurable OR for CalTAD<25 mm, as no cut-out was seen with CalTAD<25 mm. In contrast,TAD>34.8 mm yielded an OR of 4.40 (p-value 0.032) and CalTAD>35.2 mm an OR of 17.76 (p-value<0.001). Therefore, there are reasonable grounds for raising the TAD cut-off from 25 mm to 34.8 mm, andan acceptable CalTAD cut-off would appear to be 35.2mm. Indeed, these new cut-offs intercepted most of
Page 7/16
the lag-screw cut-outs encountered in our study. Speci�cally, our cohort presented 5 cut-outs with TADlower than 34.8 mm and 14 cut-outs with TAD greater than 34.8 mm, while 3 cut-outs were reported withCalTAD<35.2 mm and 16 with CalTAD>35.2 mm.
These �ndings have an important impact on clinical practice. Aihara et al. suggested the importance ofadvocating weight-bearing restrictions in those patients at high risk of cut-out [34]. Pending validation,the new TAD and CalTAD cut-offs we propose would seem to be a safer and more selective method forthe establishment of weight-bearing and mobilization restrictions, allowing these restrictions to beimposed on a smaller patient cohort. In fact, in our cohort TAD>34.8 mm would suggest restrictions foronly 65 patients instead of the 239 presenting TAD>25 mm, while a CalTAD>35.2 mm cut-off would haveimposed weight-bearing restrictions on only 81 patients rather than the 350 patients that displayedCalTAD>25 mm.
In conclusion, in order to reduce the incidence of cut-out, particularly in 31-A2 fractures, it is advisable toperform careful, minimal reduction, and achieve stable synthesis, avoiding TAD>34.8 mm andCalTAD>35.2 mm. Moreover, if possible, it appears to be preferable to use a nail with double cephalicscrew and static distal locking, and to position the screw in Cleveland zone 5. In the event of poorreduction and/or unstable synthesis, unconstrained weight bearing alone is not su�cient to prevent theonset of cut-out.
DeclarationsFunding:
No bene�ts in any form have been received or will be received from a commercial party related directly orindirectly to the subject of this article.
Con�icts of Interest:
The authors have no con�icts of interest to declare.
Availability of data and material:
The datasets used and/or analysed during the current study are available from the corresponding authoron reasonable request.
Code availability:
Not applicable
Authors’ Contributions:
G.Caruso: Conceptualized the study, Conducted the project administration and supervision, Reviewed andedited the manuscript .
Page 8/16
N. Corradi, A. Caldaria, D. Bottin, D. Lo Re: Conducted the formal analysis and investigation, Wrote theoriginal draft.
G. Valpiani and C. Morotti: Conducted the data analysis and data interpretation.
v. Lorusso and L. Massari: Contributed to the project concept, Reviewed and edited the manuscript
Ethics approval:
The study was approved by the local Ethics Committee (Comitato Etico Indipendente di Area Vasta EmiliaCentro - CE AVEC: 696/2020/Oss/AOUFe 23/07/2020).
Consent to participate:
Not applicable for retrospective study. Data collection and analysis was performed in compliance withthe Declaration of Helsinki.
Consent for publication:
We con�rm that this manuscript has not been published elsewhere and is not under consideration byanother journal. All authors have approved the manuscript and agree with submission to Scienti�cReports.
References1. Rapp, K. et al. Epidemiology of hip fractures: Systematic literature review of German data and an
overview of the international literature. Z Gerontol Geriatr. Feb. 52 (1), 10–16https://doi.org/10.1007/s00391-018-1382-z (2019).
2. Kannus, P. et al. Epidemiology of hip fractures. Bone. Jan. 18 (1 Suppl),https://doi.org/10.1016/8756-3282(95)00381-9 (1996). :57S-63S
3. Wolinsky, F. D., Fitzgerald, J. F. & Stump, T. E. The effect of hip fracture on mortality, hospitalization,and functional status: a prospective study. Am J Public Health. Mar. 87 (3), 398–403https://doi.org/10.2105/ajph.87.3.398 (1997).
4. Bentler, S. E. et al. The aftermath of hip fracture: discharge placement, functional status change, andmortality. Am J Epidemiol. Nov. 15 (10), 1290–1299 https://doi.org/10.1093/aje/kwp266 (2009).
5. Tay, E. Hip fractures in the elderly: operative versus nonoperative management. Singapore Med J.Apr. 57 (4), 178–181 https://doi.org/10.11622/smedj.2016071 (2016).
�. Simunovic, N. et al. Effect of early surgery after hip fracture on mortality and complications:systematic review and meta-analysis. CMAJ. Oct 19;182(15):1609-16. doi: 10.1503/cmaj.092220.Epub 2010 Sep 13. (2010)
7. Pincus, D. et al. Association Between Wait Time and 30-Day Mortality in Adults Undergoing HipFracture Surgery. JAMA. 2017 Nov. 28 (20), 1994–2003 https://doi.org/10.1001/jama.2017.17606
Page 9/16
(2017).
�. Evaniew, N. & Bhandari, M. Cochrane in CORR ®: Intramedullary nails for extracapsular hip fracturesin adults (review). Clin Orthop Relat Res. Mar. 473 (3), 767–774 https://doi.org/10.1007/s11999-014-4123-7 (2015).
9. Forte, M. L. et al. Geographic variation in device use for intertrochanteric hip fractures. J Bone JointSurg Am. Apr. 90 (4), 691–699 https://doi.org/10.2106/JBJS.G.00414 (2008).
10. Yeganeh, A., Taghavi, R. & Moghtadaei, M. Comparing the Intramedullary Nailing Method VersusDynamic Hip Screw in Treatment of Unstable Intertrochanteric Fractures. Med Arch. Feb;70 (1), 53–56 https://doi.org/10.5455/medarh.2016.70.53-56Epub 2016 Jan 31 (2016).
11. Mavrogenis, A. F. et al. Complications After Hip Nailing for Fractures. Orthopedics. Jan-Feb. 39 (1),e108–16 https://doi.org/10.3928/01477447-20151222-11 (2016).
12. Pascarella, R. et al. How evolution of the nailing system improves results and reduces orthopediccomplications: more than 2000 cases of trochanteric fractures treated with the Gamma Nail System.Musculoskelet Surg. Apr. 100 (1), 1–8 https://doi.org/10.1007/s12306-015-0391-y (2016).
13. Kashigar, A. et al. Predictors of failure for cephalomedullary nailing of proximal femoral fractures.Bone Joint J. Aug. 96-B (8), 1029–1034 https://doi.org/10.1302/0301-620X.96B8.33644 (2014).
14. De Bruijn, K., den Hartog, D., Tuinebreijer, W. & Roukema, G. Reliability of predictors for screw cutoutin intertrochanteric hip fractures. J Bone Joint Surg Am. Jul 18;94(14):1266-72. doi:10.2106/JBJS.K.00357. (2012)
15. Baumgaertner, M. R., Curtin, S. L., Lindskog, D. M. & Keggi, J. M. The value of the tip-apex distance inpredicting failure of �xation of peritrochanteric fractures of the hip. J Bone Joint Surg Am. 1995Jul;77(7):1058-64. doi: 10.2106/00004623-199507000-00012. (1995)
1�. Kuzyk, P. R. et al. Femoral head lag screw position for cephalomedullary nails: a biomechanicalanalysis. J Orthop Trauma. Jul. 26 (7), 414–421 https://doi.org/10.1097/BOT.0b013e318229acca(2012).
17. Rubio-Avila, J., Madden, K., Simunovic, N. & Bhandari, M. Tip to apex distance in femoralintertrochanteric fractures: a systematic review. J Orthop Sci. Jul. 18 (4), 592–598https://doi.org/10.1007/s00776-013-0402-5 (2013).
1�. Yam, M., Chawla, A. & Kwek, E. Rewriting the tip apex distance for the proximal femoral nail anti-rotation. Injury. Aug. 48 (8), 1843–1847 https://doi.org/10.1016/j.injury.2017.06.020 (2017).
19. Caruso, G. et al. A six-year retrospective analysis of cut-out risk predictors in cephalomedullarynailing for pertrochanteric fractures: Can the tip-apex distance (TAD) still be considered the bestparameter? Bone Joint Res. Aug. 6 (8), 481–488 https://doi.org/10.1302/2046-3758.68.BJR-2016-0299.R1 (2017).
20. van Embden, D., Rhemrev, S. J., Meylaerts, S. A. & Roukema, G. R. The comparison of twoclassi�cations for trochanteric femur fractures: the AO/ASIF classi�cation and the Jensenclassi�cation. Injury. Apr. 41 (4), 377–381 https://doi.org/10.1016/j.injury.2009.10.007 (2010).
Page 10/16
21. Cleveland, M., Bosworth, D. M., Thompson, F. R., Wilson, H. J. Jr & Ishizuka, T. A ten-year analysis ofintertrochanteric fractures of the femur.J Bone Joint Surg Am. Dec;41-A:1399 – 408. (1959)
22. Cuschieri, S. The STROBE guidelines. Saudi J Anaesth. Apr. 13 (Suppl 1), S31–S34https://doi.org/10.4103/sja.SJA_543_18 (2019).
23. Caruso, G. et al. The impact of warfarin on operative delay and 1-year mortality in elderly patientswith hip fracture: a retrospective observational study. J Orthop Surg Res. Jun. 4 (1), 169https://doi.org/10.1186/s13018-019-1199-5 (2019).
24. Buyukdogan, K., Caglar, O., Isik, S., Tokgozoglu, M. & Atilla, B. Risk factors for cut-out of double lagscrew �xation in proximal femoral fractures. Injury. Feb. 48 (2), 414–418https://doi.org/10.1016/j.injury.2016.11.018 (2017).
25. Lobo-Escolar, A., Joven, E., Iglesias, D. & Herrera, A. Predictive factors for cutting-out in femoralintramedullary nailing. Injury. Dec. 41 (12), 1312–1316 (2010).
2�. Bojan, A. J. et al. Critical factors in cut-out complication after Gamma Nail treatment of proximalfemoral fractures. BMC Musculoskelet Disord. Jan. 2, 141 https://doi.org/10.1186/1471-2474-14-1(2013).
27. Aicale, R. & Maffulli, N. Greater rate of cephalic screw mobilisation following proximal femoralnailing in hip fractures with a tip-apex distance (TAD) and a calcar referenced TAD greater than 25mm. J Orthop Surg Res. May 2;13(1):106. doi: 10.1186/s13018-018-0814-1. (2018)
2�. Fujii, T. et al. Tip-Apex Distance Is Most Important of Six Predictors of Screw Cutout After InternalFixation of Intertrochanteric Fractures in Women. JB JS Open Access. Nov 2;2(4):e0022. doi:10.2106/JBJS.OA.16.00022. (2017)
29. Geller, J. A., Sai�, C., Morrison, T. A. & Macaulay, W. Tip-apex distance of intramedullary devices as apredictor of cut-out failure in the treatment of peritrochanteric elderly hip fractures. Int Orthop. Jun.34 (5), 719–722 https://doi.org/10.1007/s00264-009-0837-7 (2010).
30. Lopes-Coutinho, L., Dias-Carvalho, A., Esteves, N. & Sousa, R. Traditional distance "tip-apex" vs. newcalcar referenced "tip-apex" - which one is the best peritrochanteric osteosynthesis failure predictor?Injury. Mar;51(3):674–677. doi: 10.1016/j.injury.2020.01.024. (2020)
31. Caruso, G. et al. Can TAD and CalTAD predict cut-out after extra-medullary �xation with newgeneration devices of proximal femoral fractures? A retrospective study. J Clin Orthop Trauma. Jan-Mar. 8 (1), 68–72 https://doi.org/10.1016/j.jcot.2016.09.009 (2017).
32. Go�n, J. M., Jenkins, P. J., Ramaesh, R., Pankaj, P. & Simpson, A. H. What is the relevance of the tip-apex distance as a predictor of lag screw cut-out? PLoS One. Aug. 28 (8), e71195https://doi.org/10.1371/journal.pone.0071195 (2013).
33. Li, S. et al. A mathematical simulation of the tip-apex distance and the calcar-referenced tip-apexdistance for intertrochanteric fractures reduced with lag screws. Injury. Jun. 47 (6), 1302–1308https://doi.org/10.1016/j.injury.2016.03.029 (2016).
34. Aihara, L. J. et al. Late postoperative analysis of the tip-apex distance (TAD) in pertrochantericfractures: is there an accommodation of the implant within the bone? Injury. Oct;48 Suppl 4:S54-S56.
Page 11/16
doi: 10.1016/S0020-1383(17)30776-3. (2017)
TablesTable 1. demographic data and baseline characteristics of all patients with trochanteric fractures
CUT-OUT NO(n=585)
CUT-OUT YES(n=19)
TOTAL (n=604) p-value
e, mean (IQR, Q1to Q3) 88 [82 93] 89 [83 95] 88 [82 93] 0.4658e (n, %)
rightleft
0.737285 (48.7) 10 (52.6) 295 (48.8) 300 (51.3) 9 (47.4) 309 (51.2)
/OTA Classification (n, %)A1A2A3
334 (57.1) 7 (36.8) 341 (56.5) 0.08228 (39) 12 (63.2) 240 (39.7) 0.03423 (3.9) 0 (0) 23 (3.8) 0.999
ramedullary Device (n, %)Gamma 3
Trigen Intertan
0.058302 (51.6) 14 (73.7) 316 (52.3) 283 (48.4) 5 (26.3) 288 (47.7)
tal Locking (n, %)Static
DynamicUnlocked
491 (83.9) 15 (78.9) 506 (83.8) 0.05892 (15.7) 4 (21.1) 96 (15.9) 0.5232 (0.4) 0 (0) 2 (0.3) 0.999
ntre-column-diaphyseal (CCD) angles%)
120°125°130°
63 (10.8) 1 (5.3) 64 (10.6) 0.709477 (81.7) 17 (89.5) 494 (81.9) 0.55044 (7.5) 1 (5.3) 45 (7.5) 0.712
her complications (n, %)yesno
0.431569 (97.6) 18 (94.7) 587 (97.5) 14 (2.4) 1 (5.3) 15 (2.5)
dified Cleveland Sistem (MSC) (n, %)5
2-4-6-81-3-7-9
299 (51.1) 3 (15.8) 302 (50) 0.002195 (33.3) 9 (47.4) 204 (33.8) 0.22291 (15.6) 7 (36.8) 98 (16.2) 0.023
ality of reduction (n, %) 0.061good 370 (63.2) 8 (42.1) 378 (62.6)
acceptable, poor 215 (36.8) 11 (57.9) 226 (37.4) t-operative weight-bearing (n, %) 0.004
yes 469 (80.2) 10 (52.6) 479 (79.3) no 116 (19.8) 9 (47.4) 125 (20.7)
D median (IQR, Q1 to Q3) (mm) 22.16 [16.66 28.6] 38.72 [30.5946.23]
22.58 [17 28.97] <0.001
TAD median (IQR, Q1to Q3) (mm) 26.19 [21.7731.19]
39.34 [36.7646.87]
26.42 [21.9331.5]
<0.001
(IQR, interquartile range; AO/OTA Classi�cation, AO Foundation and Orthopaedic Trauma Associationclassi�cation system; TAD, tip-apex distance; CalTAD, calcar-referenced tip-apex distance)
Table 2. The univariate analysis, considering TAD>25 mm, CalTAD>25 mm, TAD>34.8 mm andCalTAD>35.2 mm
Page 12/16
Variable OR (95% CI) PvalueTAD 25mm 13.8 (3.18-60.73) <0.001TAD 34.8mm 29.32 (10.15-84.68) <0.001CalTAD 25mm - -CalTAD 35.2mm 42.67 (12.11-150.39) <0.001
Table 3.A The multivariate logistic regression model, considering TAD>25 mm and CalTAD>25 mm
Cut-off TAD 25 and Cut-off CalTAD 25Odds Ratio(OR)
95% confidence interval(CI)
p-value
Lower UpperTAD Ref (<25 mm) 3.54 0.77 16.31 0.105CalTAD Ref (<25 mm) - - - -Age 1.01 0.96 1.06 0.105AO/OTAClassification
Ref (A1+A3) 1.89 0.66 5.45 0.237
IntramedullaryDevice
Ref(Gamma3)
0.76 0.44 1.34 0.348
MSC 2-4-6-8 3.15 0.81 12.21 0.097 1-3-7-9 3.79 0.91 15.77 0.067Quality of reduction Ref (good) 1.37 0.48 3.92 0.533Weight Bearing Ref (no) 0.55 0.19 1.58 0.266
Table 3.B The multivariate logistic regression model, considering TAD>34.8 mm and CalTAD>35.2 mm
Variable Cut-off TAD 34.8 and Cut-off CalTAD 35.2Odds Ratio(OR)
95% confidence interval(CI)
p-value
Lower UpperTAD Ref (<34.8
mm)4.40 1.13 17.03 0.032
CalTAD Ref (<35.2mm)
17.76 3.83 82.22 <0.001
Age 1.01 0.96 1.07 0.696AO/OTAClassification
Ref (A1+A3) 2.77 0.84 9.13 0.093
IntramedullaryDevice
Ref (Gamma3) 0.71 0.39 1.29 0.256
MSC 2-4-6-8 1.79 0.39 8.22 0.450 1-3-7-9 2.15 0.41 11.22 0.362Quality of reduction Ref (good) 1.6 0.49 5.14 0.429Weight Bearing Ref (no) 0.75 0.21 2.64 0.658
Figures
Page 13/16
Figure 1
Flow chart describing the inclusion and exclusion criteria of the study.
Page 14/16
Figure 2
The modi�ed Cleveland system used in our study. Nine areas we reduced to three, speci�cally the central(reference category) and two peripherals denoted “+” (in green) and “x” (in yellow).
Page 15/16
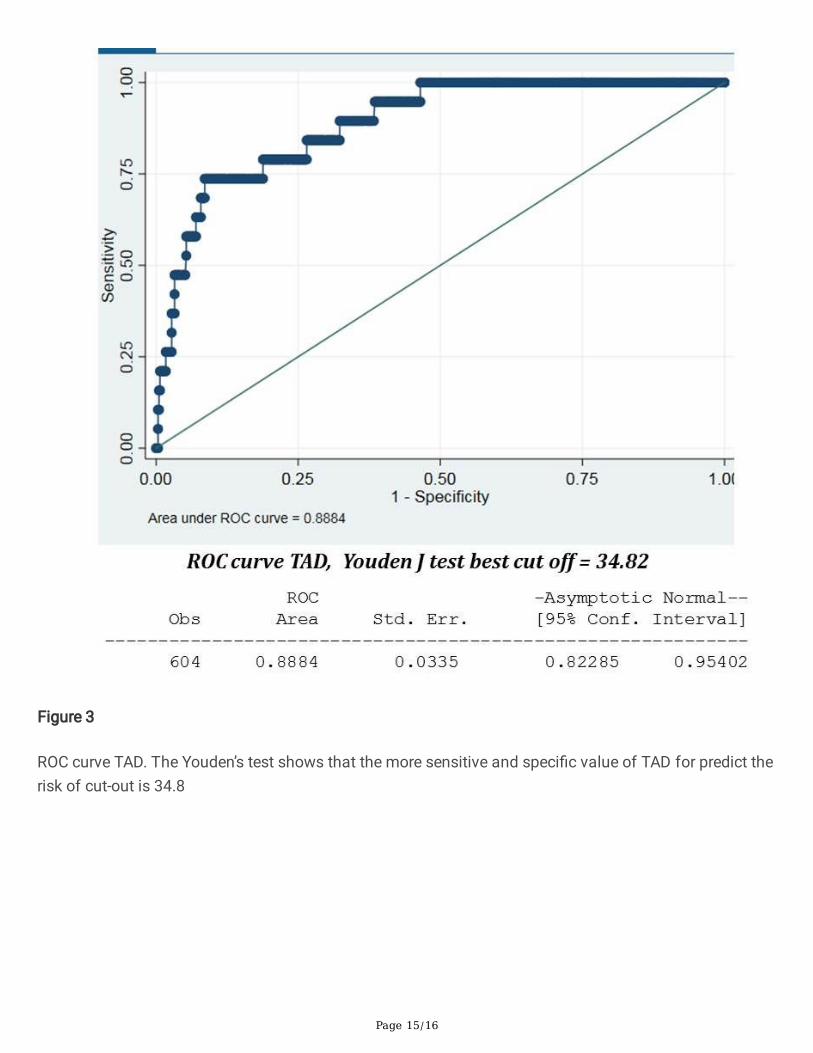
Figure 3
ROC curve TAD. The Youden’s test shows that the more sensitive and speci�c value of TAD for predict therisk of cut-out is 34.8
Page 16/16
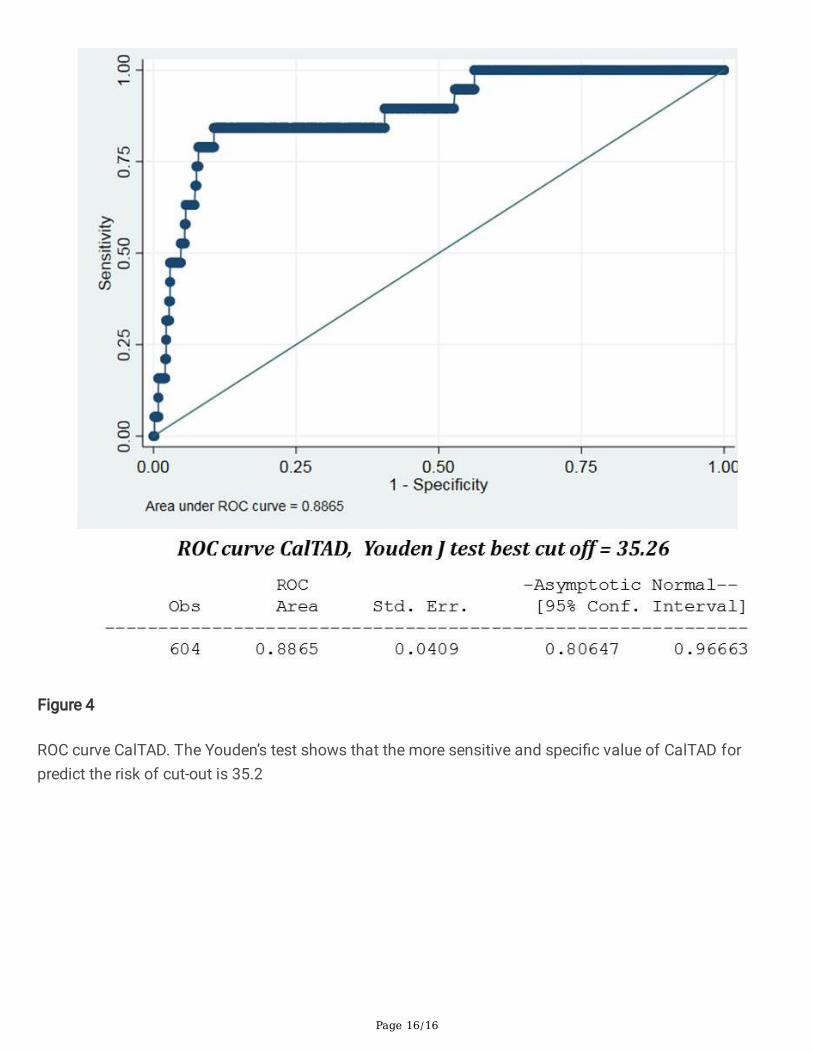
Figure 4
ROC curve CalTAD. The Youden’s test shows that the more sensitive and speci�c value of CalTAD forpredict the risk of cut-out is 35.2