the endocannabinoid system controls food intake via olfactory processes
TRANSCRIPT

©20
14 N
atu
re A
mer
ica,
Inc.
All
rig
hts
res
erve
d.
nature neurOSCIenCe advance online publication
a r t I C l e S
It is a common experience that internal states can affect sensory perception, thereby regulating specific behaviors1–5. For instance, body and interoceptive signals can modulate time perception and consequent behaviors in humans2. One of the most prominent exam-ples of these processes is the ability of hunger to increase olfactory performance to facilitate the retrieval and the ingestion of food4–8. However, the brain mechanisms governing the link between hunger, olfaction and food intake remain poorly understood. The endocan-nabinoid system is an important component of the central regu-lation of energy balance, and cannabinoid intoxication increases food intake9,10. Recently, the use of conditional mutant mice lack-ing the expression of the type-1 cannabinoid (CB1) receptor (also known as Cnr1) from cortical glutamatergic neurons in the dorsal telencephalon, including neurons located in neocortex, paleocor-tex and archicortex (Glu-CB1
−/−) revealed that (endo)cannabinoid-dependent control of excitatory neurotransmission from cortical glutamatergic neurons is necessary to promote fasting-induced food intake11. Notably, cannabinoid drugs alter sensory perception, including olfaction12,13, suggesting a potential link between these two effects of brain (endo)cannabinoid signaling. However, the specific brain regions, neuronal circuits and mechanisms involved have not yet been identified. We addressed this issue and found that
CB1 receptor–dependent control of excitatory drive from centrifugal feedback projections to the olfactory bulb determines the efficiency of olfactory processes and food intake in fasted mice.
RESULTSCB1 receptor expression in glutamatergic projections to the MOBAs a result of the low levels of CB1 receptor expression in cortical gluta-matergic neurons14,15, detailed anatomical analysis of CB1 receptor protein expression detected no or only minor differences between Glu-CB1
−/− mice and wild-type littermates in many brain regions11,16 (data not shown). However, a clear reduction of CB1 receptor stain-ing was evident in the MOB of mutant mice (Fig. 1a–e). In wild-type MOB, CB1 receptor protein was virtually absent from the external plexiform layer and the mitral cell layer (MCL), was expressed at low levels in the glomerular layer, and was expressed at moderate levels in the internal plexiform layer (IPL; Fig. 1a,d). Conversely, CB1 receptor immunoreactivity was densely observed in the granule cell layer (GCL) of wild-type mice (Fig. 1a,d). In Glu-CB1
−/− mice, we detected a marked reduction of CB1 receptor immunoreactivity in the GCL (Fig. 1a,b,d–f and Supplementary Table 1), accompanied by a slight, decrease in the IPL (Fig. 1a,b,d–f and Supplementary Table 1). In the glomerular layer, the levels of CB1 protein staining were too
1INSERM, U862 NeuroCentre Magendie, Endocannabinoids and Neuroadaptation, Bordeaux, France. 2University of Bordeaux, NeuroCentre Magendie U862, Bordeaux, France. 3Department of Biochemistry and Molecular Biology I, School of Biology, Complutense University and CIBERNED, Madrid, Spain. 4Department of Neurosciences, Faculty of Medicine and Dentistry, University of the Basque Country UPV/EHU, Leioa, Spain. 5Laboratory for Perception and Memory, Institut Pasteur, Paris, France. 6CNRS UMR 3571, Paris, France. 7CNRS UMR 8165, IMNC, Univ. Paris Diderot & Sud, Orsay, France. 8Institute of Physiological Chemistry, University Medical Center of the Johannes Gutenberg University, Mainz, Germany. 9Institut fuer Physiologie I, Westfaelische Wilhelms-Universitaet, Muenster, Germany. 10Department of Medical and Surgical Sciences, University of Bologna, Bologna, Italy. 11INRA, Nutrition et Neurobiologie Intégrée, UMR 1286, Bordeaux, France. 12These authors contributed equally to this work. 13These authors jointly directed this work. Correspondence should be addressed to G.M. ([email protected]).
Received 26 July 2013; accepted 9 January 2014; published online 9 February 2014; doi:10.1038/nn.3647
The endocannabinoid system controls food intake via olfactory processesEdgar Soria-Gómez1,2,12, Luigi Bellocchio3,12, Leire Reguero4, Gabriel Lepousez5,6, Claire Martin7, Mounir Bendahmane7, Sabine Ruehle8, Floor Remmers8, Tifany Desprez1,2, Isabelle Matias1,2, Theresa Wiesner1,2, Astrid Cannich1,2, Antoine Nissant5,6, Aya Wadleigh1,2, Hans-Christian Pape9, Anna Paola Chiarlone3, Carmelo Quarta10, Daniéle Verrier1,2, Peggy Vincent1,2, Federico Massa1,2, Beat Lutz8, Manuel Guzmán3, Hirac Gurden7, Guillaume Ferreira11, Pierre-Marie Lledo5,6, Pedro Grandes4,13 & Giovanni Marsicano1,2,13
Hunger arouses sensory perception, eventually leading to an increase in food intake, but the underlying mechanisms remain poorly understood. We found that cannabinoid type-1 (CB1) receptors promote food intake in fasted mice by increasing odor detection. CB1 receptors were abundantly expressed on axon terminals of centrifugal cortical glutamatergic neurons that project to inhibitory granule cells of the main olfactory bulb (MOB). Local pharmacological and genetic manipulations revealed that endocannabinoids and exogenous cannabinoids increased odor detection and food intake in fasted mice by decreasing excitatory drive from olfactory cortex areas to the MOB. Consistently, cannabinoid agonists dampened in vivo optogenetically stimulated excitatory transmission in the same circuit. Our data indicate that cortical feedback projections to the MOB crucially regulate food intake via CB1 receptor signaling, linking the feeling of hunger to stronger odor processing. Thus, CB1 receptor–dependent control of cortical feedback projections in olfactory circuits couples internal states to perception and behavior.

©20
14 N
atu
re A
mer
ica,
Inc.
All
rig
hts
res
erve
d.
advance online publication nature neurOSCIenCe
a r t I C l e S
low to provide reliable quantitative data, but no evident alteration of expression was observed in Glu-CB1
−/− mice (Fig. 1a,b,d,e). The GCL is mainly composed of inhibitory GABAergic neurons that receive important glutamatergic projections from cortical regions, includ-ing the anterior olfactory nucleus (AON) and the piriform cortex, which are known as the centrifugal glutamatergic innervation of the olfactory bulb17–20. Electron microscopy inspection revealed that the GCL contains mainly type I presumably excitatory asymmetric syn-apses, with a minority of type II presumably inhibitory symmetric synapses18 (Fig. 1g–i). Semi-quantitative evaluation of immunogold labeling revealed that approximately 30% and 10% of total synaptic terminals contained CB1 receptor immunoparticles in the GCL of wild-type (281 counted terminals) and Glu-CB1
−/− mice (143 counted terminals), respectively (Fig. 1g,h). Approximately 1% of synapses displayed background staining in global CB1
−/− mice (143 counted terminals; Fig. 1i). In wild-type mice, more than 30% of unequivo-cally identified type I synapses were CB1 receptor immunopositive (108 counted terminals; Fig. 1g). In both Glu-CB1
−/− and CB1−/− mice,
less than 2% of type I synapses contained CB1 particles (52 and 73 counted terminals, respectively; Fig. 1h,i), suggesting that most of the CB1 receptors present at excitatory synapses are ablated in the GCL of Glu-CB1
−/− mice.CB1 (Cnr1) mRNA was present at low levels in the MOB of wild-
type mice (Supplementary Fig. 1). In particular, the transcript was present in sparse intrinsic dopaminergic (positive for tyrosine hydroxylase) and GABAergic neurons (expressing glutamic acid decarboxylase 65 kDa, GAD65), but not in glutamatergic neurons (positive for vesicular glutamate transporter 1, VGluT1), of different layers of the MOB (Supplementary Fig. 1). However, Glu-CB1
−/− mice did not display any evident reduction of CB1 mRNA levels in any of the MOB subpopulations (Supplementary Fig. 1). Conversely, CB1
mRNA was abundantly present in the AON (Fig. 1j). In cortical areas, including the AON, CB1 mRNA is expressed in two main neuronal populations14,21–23: approximately half of GABAergic interneurons contain very high levels of the transcript, whereas the majority of pyramidal glutamatergic neurons display moderate-to-low levels of CB1 mRNA14,21–23. Similarly to other cortical areas11,23, the AON of Glu-CB1
−/− mice contained cells expressing high levels of CB1 mRNA (presumably GABAergic), whereas low-to-moderate CB1 receptor–expressing neurons were not detectable (Fig. 1k), confirming the specific deletion of CB1 in cortical glutamatergic neurons21–23.
Thus, presynaptic CB1 receptors14,24,25 in the MOB reside mostly on axon terminals of cortical glutamatergic centrifugal projections, which are primarily located in the GCL and partly in the IPL. Altogether, these data suggest that CB1 receptor modulation of fasting-induced food intake might involve the control of feedback glutamatergic pro-jections from cortical olfactory areas to the MOB.
CB1 in the MOB is necessary for hyperphagia after fastingAs expected26, a 24-h fast increased the levels of the endocannabinoid anandamide (AEA) in the hypothalamus, but not in the cerebellum of C57BL/6N mice (Supplementary Fig. 2 and Supplementary Table 2). Notably, a similar increase of AEA levels was also observed in the olfactory bulb of fasted mice (Fig. 2a and Supplementary Table 1), whereas the levels of the other main endocannabinoid, 2-arachidonoyl-glycerol (2-AG), were not altered (Fig. 2a, Supplementary Fig. 2, and Supplementary Tables 1 and 2). Notably, local infusion of the CB1 receptor antagonist AM251 (4 µg per side) into the GCL of fasted C57BL/6N mice before re-feeding substan-tially decreased food intake (Fig. 2b, Supplementary Fig. 3, and Supplementary Tables 1 and 2), indicating that CB1 receptor activation in the GCL is necessary for fasting-induced food intake. To determine
GL
WT Glu-CB1–/– CB1
–/–
MCL
GCL
IPLEPL
GL
WT Glu-CB1–/–
MCL
GCL
IPL
EPL
WT
PfCtx
AON
Glu-CB1–/–
PfCtx
AON
120 WTGlu-CB1
–/–100
80
60
40
20
CB
1 pr
otei
n ex
pres
sion
(A.U
.)
0GCL IPL
*****
fa b c
g h i j k
d e
Figure 1 CB1 receptor is expressed in centrifugal glutamatergic projections to the MOB. (a–c) Light microscopy of CB1 receptor immunohistochemistry in the MOB of wild-type (WT, a), Glu-CB1
−/− (b) and CB1−/− mice (c). Representative images of 3 mice per genotype
are shown. EPL, external plexiform layer; GL, glomerular layer. (d,e) Higher magnification of boxed regions in a and b showing CB1 expression in the different layers of the MOB in detail. (f) CB1 immunostaining quantification in the GCL and IPL of wild-type and Glu-CB1
−/− mice. Data are presented as mean ± s.e.m. **P < 0.01, ***P < 0.001. See Supplementary Table 1 for detailed statistics. (g–i) Electron microscopy of immunogold staining for CB1 receptor in wild-type (g), Glu-CB1
−/− (h) and CB1−/− (i) mice. Blue arrowheads indicate type-I asymmetric synapses and green
arrowheads indicate type-II symmetric synapses. Red arrows point to CB1 particles. (j,k) Micrographs of fluorescent in situ hybridization detecting CB1 mRNA in the AON of wild-type (j) and Glu-CB1
−/− mice (k) (n = 3 per genotype). Lower panels are higher magnifications of the boxed AON regions in the top panels. PfCtx, prefrontal cortex. Scale bars represent 700 µm (a–c), 0.5 µm (g–i) and 100 µm (d,e,j,k).

©20
14 N
atu
re A
mer
ica,
Inc.
All
rig
hts
res
erve
d.
nature neurOSCIenCe advance online publication
a r t I C l e S
whether endocannabinoid signaling in the GCL regulates food intake through inhibi-tion of glutamatergic transmission, we infused the NMDA receptor antagonist MK801 (1 or 2 µg per side) into the GCL of wild-type and Glu-CB1
−/− littermates. As expected11, vehicle-treated mutant mice ate less than control mice (Fig. 2c and Supplementary Table 1). However, intra-GCL injections of MK801 dose-dependently abolished the phenotype of Glu-CB1
−/− littermates (Fig. 2c and Supplementary Table 1), indicating that this phenotype is a result of excessive gluta-matergic signaling in the MOB. To further corroborate this idea, we checked the effects of fasting on neuronal activation in the MOB of wild-type and Glu-CB1
−/− littermates. Staining of the early immediate gene c-Fos (a widely used marker of neuronal activation) revealed that 24-h fasting did not induce any measurable alteration of neuronal activity in the MCL or the glomerular layer of the MOB (Fig. 2d and Supplementary Table 1), or in the AON (data not shown) of wild-type control mice. In contrast, 24-h fasting strongly decreased c-Fos staining in the GCL of wild-type mice, but not in the corresponding area of mutant Glu-CB1
−/− littermates (Fig. 2d and Supplementary Table 1), indicating that CB1 receptors on glutamatergic terminals in the GCL are required for the fasting-induced decrease of activity of GCL neurons. Overall, these data indicate that the orexigenic func-tions of the endocannabinoid system after fasting involve a reduction
of glutamatergic transmission in the MOB, mediated by CB1 receptors expressed at corticofugal terminals.
CB1 in the MOB is sufficient for hyperphagia after fastingIn Glu-CB1
−/− mice, CB1 is deleted in glutamatergic neurons of many cortical areas11,23. To limit the deletion to specific olfactory cortical regions, we injected an adeno-associated virus encod-ing Cre recombinase (AAV-Cre) into the AON and the anterior piriform cortex (APC) of mice carrying a loxP-flanked CB1 gene (CB1-flox)23,27,28 to generate mice displaying an almost com-plete absence of CB1 mRNA in the injected brain region (AON/APC-CB1
−/− mice; Fig. 3a). Notably, AON/APC-CB1−/− mice had
significantly reduced CB1 receptor protein at centrifugal glutama-tergic terminals in the GCL (Fig. 3b,c and Supplementary Table 1), but not in the IPL (Supplementary Fig. 4 and Supplementary Table 2) or in the glomerular layer (Fig. 3b). AON/APC-CB1
−/− mice displayed a clear hypophagic phenotype in fasting–re-feeding conditions, very similar to Glu-CB1
−/− and CB1−/− mice12 (Fig. 3d and Supplementary
Table 1). Notably, a clear positive correlation was observed between the levels of CB1 receptor expression in the GCL (but not in the IPL) and food intake (Fig. 3e, Supplementary Fig. 4, and
b
1 20
0.5
1.0
1.5
***
VEHAM251
Time (h)
Foo
d in
take
(g)
c WT Glu-CB1–/–
VEH
1.0
µg2.
0 µg
VEH
1.0
µg
2.0
µg0
0.2
0.4
0.6
0.8
1.0
MK801 MK801
*****
Foo
d in
take
(g)
MCLGlu-CB1
–/–WT
0
1
2
3
Num
ber
of c
-Fos
posi
tive
cells
(lo
g)
Faste
d
Contro
l
Faste
d
Contro
l
Num
ber
of c
-Fos
posi
tive
cells
(lo
g)
WTGL Glu-CB1
–/–
0
1
2
3
Faste
d
Contro
l
Faste
d
Contro
l
Num
ber
of c
-Fos
posi
tive
cells
(lo
g)
Glu-CB1–/–WT
GCL
0
1
2
3
*
Faste
d
Contro
l
Faste
d
Contro
l
a
0
10
20
30
40
0
Faste
d
Contro
l
Faste
d
Contro
l
10
20
30
40Anandamide 2-AG
*
Ana
ndam
ide
leve
ls(f
mol
mg–1
tiss
ue)
2-AG
levels(pm
ol mg
–1 protein)
dControl
WT
Glu-CB1–/–
GCL
GL
MCL
Fasted
Figure 2 Endocannabinoid signaling in the MOB is activated by fasting and promotes food intake by dampening glutamatergic transmission. (a) Anandamide and 2-AG levels in the MOB of control and 24-h fasted C57BL/6N mice. (b) Food intake of 24-h fasted C57BL/6N mice injected intra-MOB with vehicle or AM251 (4 µg per side). (c) Food intakes of fasted wild-type and Glu-CB1
−/− littermates injected intra-MOB with vehicle or MK801 (1 or 2 µg per side). (d) Left, representative micrographs of c-Fos expression in MOB of control and fasted Glu-CB1
−/− mice and wild-type littermates. Right, quantification of c-Fos–positive cells in mitral cell layer, glomerular layer and granule cell layer cells of the MOB. Scale bar represents 500 µm. Data are presented as mean ± s.e.m. *P < 0.05, **P < 0.01, ***P < 0.001. See Supplementary Table 1 for detailed statistics.
AAV-Ctrl
aAAV-Cre
CB1
VGlut1
Merge
c
e
AON/APC-CB1–/–
**
AAV-Ctrl AAV-Cre
80
60
40
20
0
80
60
40
20
0
0.2 0.4 0.6Food intake 1 h (g)
0.8 1.0
CB
1 pr
otei
n ex
pres
sion
(A.U
.)C
B1
prot
ein
expr
essi
on(A
.U.)
bAAV-Ctrl AAV-Cre
d AON/APC-CB1–/–
CB1-flox AAV-Ctrl
CB1-flox AAV-Cre
***
1.5
1.0
0.5
1 2Time (h)
Foo
d in
take
(g)
0
Figure 3 CB1 receptors on GCL-projecting feedback glutamatergic cortical neurons are necessary for fasting-induced hyperphagia. (a) Micrograph showing fluorescent in situ hybridization of CB1 receptor and VGlut1 mRNA in the AON of CB1-flox mice injected intra-AON with an empty AAV (AAV-Ctrl) or AAV-Cre. Scale bar represents 500 µm. (b,c) CB1 receptor immunohistochemistry (b) and semi-quantification (c) in the GCL of the MOB of CB1-flox AAV-Ctrl (AAV-Ctrl) and AON/APC-CB1
−/− mice (CB1-flox AAV-Cre). (d) Food intakes of CB1-flox-AAV-Ctrl and AON/APC- CB1
−/− mice. (e) Correlation between the levels of CB1 protein expression in the GCL of the MOB and food intake in CB1-flox-AAV-Ctrl (black symbols) and AON/APC-CB1
−/− mice (gray symbols). Values are the same as in c and d. VGlut1, vesicular glutamate transporter-1. Data are presented as mean ± s.e.m. *P < 0.05, **P < 0.01. Scale bars represent 500 µm. See Supplementary Table 1 for detailed statistics.
©20
14 N
atu
re A
mer
ica,
Inc.
All
rig
hts
res
erve
d.
advance online publication nature neurOSCIenCe
a r t I C l e S
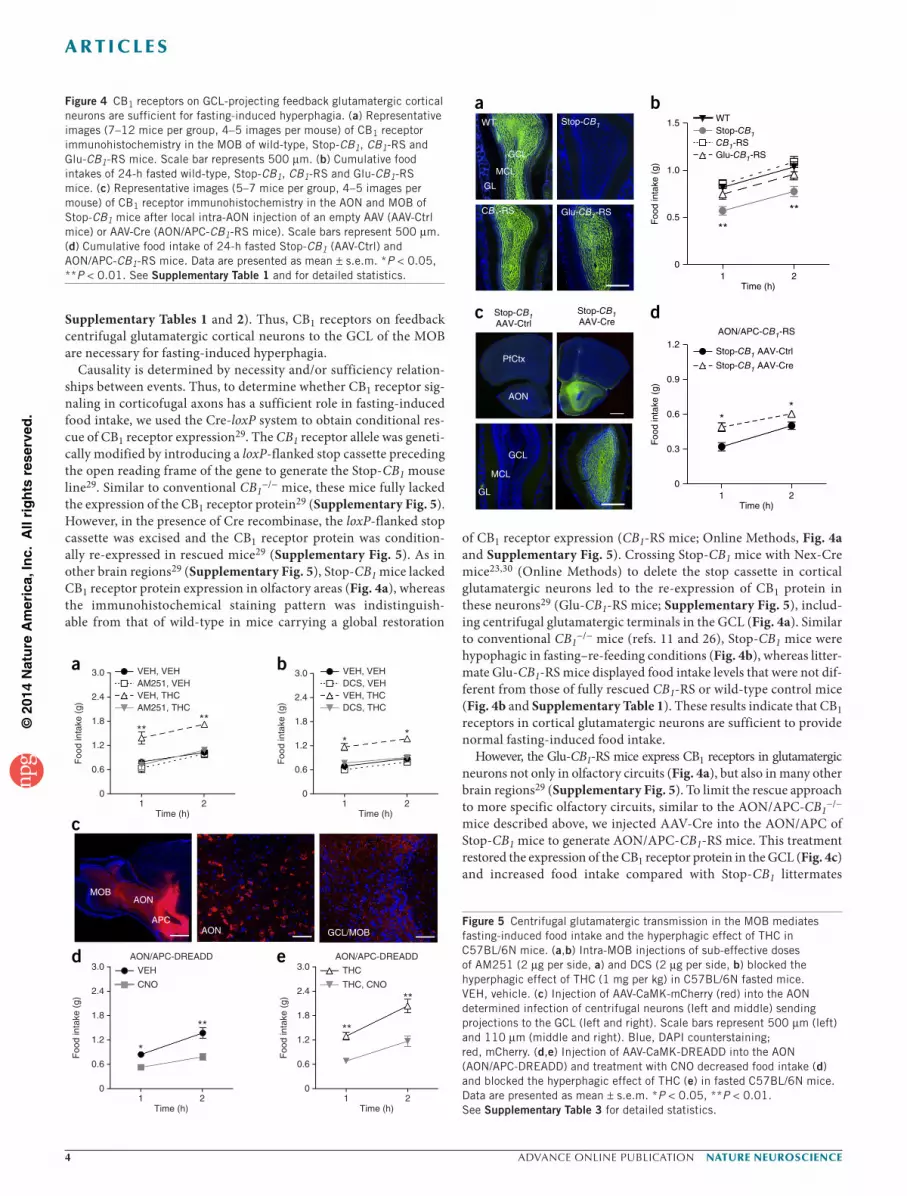
Supplementary Tables 1 and 2). Thus, CB1 receptors on feedback centrifugal glutamatergic cortical neurons to the GCL of the MOB are necessary for fasting-induced hyperphagia.
Causality is determined by necessity and/or sufficiency relation-ships between events. Thus, to determine whether CB1 receptor sig-naling in corticofugal axons has a sufficient role in fasting-induced food intake, we used the Cre-loxP system to obtain conditional res-cue of CB1 receptor expression29. The CB1 receptor allele was geneti-cally modified by introducing a loxP-flanked stop cassette preceding the open reading frame of the gene to generate the Stop-CB1 mouse line29. Similar to conventional CB1
−/− mice, these mice fully lacked the expression of the CB1 receptor protein29 (Supplementary Fig. 5). However, in the presence of Cre recombinase, the loxP-flanked stop cassette was excised and the CB1 receptor protein was condition-ally re-expressed in rescued mice29 (Supplementary Fig. 5). As in other brain regions29 (Supplementary Fig. 5), Stop-CB1 mice lacked CB1 receptor protein expression in olfactory areas (Fig. 4a), whereas the immunohistochemical staining pattern was indistinguish-able from that of wild-type in mice carrying a global restoration
of CB1 receptor expression (CB1-RS mice; Online Methods, Fig. 4a and Supplementary Fig. 5). Crossing Stop-CB1 mice with Nex-Cre mice23,30 (Online Methods) to delete the stop cassette in cortical glutamatergic neurons led to the re-expression of CB1 protein in these neurons29 (Glu-CB1-RS mice; Supplementary Fig. 5), includ-ing centrifugal glutamatergic terminals in the GCL (Fig. 4a). Similar to conventional CB1
−/− mice (refs. 11 and 26), Stop-CB1 mice were hypophagic in fasting–re-feeding conditions (Fig. 4b), whereas litter-mate Glu-CB1-RS mice displayed food intake levels that were not dif-ferent from those of fully rescued CB1-RS or wild-type control mice (Fig. 4b and Supplementary Table 1). These results indicate that CB1 receptors in cortical glutamatergic neurons are sufficient to provide normal fasting-induced food intake.
However, the Glu-CB1-RS mice express CB1 receptors in glutamatergic neurons not only in olfactory circuits (Fig. 4a), but also in many other brain regions29 (Supplementary Fig. 5). To limit the rescue approach to more specific olfactory circuits, similar to the AON/APC-CB1
−/− mice described above, we injected AAV-Cre into the AON/APC of Stop-CB1 mice to generate AON/APC-CB1-RS mice. This treatment restored the expression of the CB1 receptor protein in the GCL (Fig. 4c) and increased food intake compared with Stop-CB1 littermates
a b
c d
WT Stop-CB1
Glu-CB1-RSCB1-RS
PfCtx
AON
GCL
MCL
GL
GCL
MCL
GL
Stop-CB1 AAV-Ctrl
Stop-CB1 AAV-Cre
AON/APC-CB1-RS1.2
0.9
01 2
Time (h)
Foo
d in
take
(g)
**
Stop-CB1AAV-Ctrl
Stop-CB1AAV-Cre
0.6
0.3
WTStop-CB1CB1-RSGlu-CB1-RS
1.5
1.0
0.5
01 2
Time (h)
Foo
d in
take
(g)
**
**
Figure 4 CB1 receptors on GCL-projecting feedback glutamatergic cortical neurons are sufficient for fasting-induced hyperphagia. (a) Representative images (7–12 mice per group, 4–5 images per mouse) of CB1 receptor immunohistochemistry in the MOB of wild-type, Stop-CB1, CB1-RS and Glu-CB1-RS mice. Scale bar represents 500 µm. (b) Cumulative food intakes of 24-h fasted wild-type, Stop-CB1, CB1-RS and Glu-CB1-RS mice. (c) Representative images (5–7 mice per group, 4–5 images per mouse) of CB1 receptor immunohistochemistry in the AON and MOB of Stop-CB1 mice after local intra-AON injection of an empty AAV (AAV-Ctrl mice) or AAV-Cre (AON/APC-CB1-RS mice). Scale bars represent 500 µm. (d) Cumulative food intake of 24-h fasted Stop-CB1 (AAV-Ctrl) and AON/APC-CB1-RS mice. Data are presented as mean ± s.e.m. *P < 0.05, **P < 0.01. See Supplementary Table 1 and for detailed statistics.
c
MOBAON
AON GCL/MOBAPC
e3.0 THC
THC, CNO2.4
1.8
**
**
Foo
d in
take
(g)
1.2
0.6
01 2
Time (h)
AON/APC-DREADDd3.0 VEH
CNO2.4
1.8
*
**
Foo
d in
take
(g)
1.2
0.6
01 2
Time (h)
AON/APC-DREADD
a3.0
2.4
1.8**
**
Foo
d in
take
(g)
1.2
0.6
01 2
Time (h)
AM251, THCVEH, THC
VEH, VEHAM251, VEH
DCS, THCVEH, THC
VEH, VEHDCS, VEH
b3.0
2.4
1.8
**
Foo
d in
take
(g)
1.2
0.6
01 2
Time (h)
Figure 5 Centrifugal glutamatergic transmission in the MOB mediates fasting-induced food intake and the hyperphagic effect of THC in C57BL/6N mice. (a,b) Intra-MOB injections of sub-effective doses of AM251 (2 µg per side, a) and DCS (2 µg per side, b) blocked the hyperphagic effect of THC (1 mg per kg) in C57BL/6N fasted mice. VEH, vehicle. (c) Injection of AAV-CaMK-mCherry (red) into the AON determined infection of centrifugal neurons (left and middle) sending projections to the GCL (left and right). Scale bars represent 500 µm (left) and 110 µm (middle and right). Blue, DAPI counterstaining; red, mCherry. (d,e) Injection of AAV-CaMK-DREADD into the AON (AON/APC-DREADD) and treatment with CNO decreased food intake (d) and blocked the hyperphagic effect of THC (e) in fasted C57BL/6N mice. Data are presented as mean ± s.e.m. *P < 0.05, **P < 0.01. See Supplementary Table 3 for detailed statistics.

©20
14 N
atu
re A
mer
ica,
Inc.
All
rig
hts
res
erve
d.
nature neurOSCIenCe advance online publication
a r t I C l e S
treated with a control AAV (Fig. 4d and Supplementary Table 1). For unknown reasons, lower levels of food intake were consistently observed in Stop-CB1 mice, which underwent surgery for local virus infusion, compared with intact mice of the same genotype (Fig. 4b,d). However, the relative rescue of the hypophagic phenotype of respec-tive Stop-CB1 control mice was similar in CB1-RS, Glu-CB1-RS and AON/APC-CB1-RS mice (Supplementary Fig. 5). These data indicate that CB1 receptor expression in corticofugal pathways to the MOB is necessary and sufficient to promote fasting-induced food intake.
CB1 controls feeding via olfactory corticofugal circuitsExogenous administration of the plant-derived CB1 receptor agonist ∆9-tetrahydrocannabinol (THC) at low doses (1 mg per kg of body weight) enhanced fasting-induced food intake in wild-type mice11 (Fig. 5a,b and Supplementary Table 3). This effect was fully blocked by the local infusion of a sub-effective dose of the CB1 receptor antag-onist AM251 (2 µg per side; Fig. 5a and Supplementary Table 3) or of the allosteric NMDA receptor enhancer d-cycloserine (DCS)
into the GCL (2 µg per side; Fig. 5b and Supplementary Table 3), as previously shown with systemic treatments11. Thus, the hyperphagic effect of THC requires activation of CB1 receptors and inhibition of glutamatergic transmission in the GCL, suggesting that centrifu-gal excitation of the GCL is inversely correlated to food intake in fasted animals. To directly test this hypothesis, we injected an AAV expressing a designer receptor exclusively activated by designer drugs (Gq-DREADD)31,32 under the control of a minimal Camk2a promoter (AAV-CaMK-DREADD) or a control AAV expressing the fluores-cent protein mCherry in the AON/APC region of C57BL/6N mice to obtain AON/APC-DREADD mice (Fig. 5c and Supplementary Fig. 6). The specific Gq-DREADD synthetic agonist clozapine-N-oxide (CNO), which activates neurons expressing Gq-DREADD32 (Supplementary Fig. 6), did not alter food intake in control AAV–injected mice (Supplementary Fig. 6). However, AON/APC-DREADD mice displayed a strong hypophagia after CNO treatment (Fig. 5d and Supplementary Table 3). Notably, the CNO treatment also abolished the hyperphagic effect of THC in the same conditions (Fig. 5e and Supplementary Table 3).
CB1 signaling in the MOB couples olfaction to feedingWe next investigated whether CB1 receptor signaling in the MOB modulates food intake by altering olfactory processes in 24-h fasted C57BL/6N mice. First, we measured olfactory habituation by exposing the mice twice to the same odor (almond or banana, diluted at 0.1%, widely used as attractive, but food-unrelated, odors for rodents)33 and scoring their exploration of the source of the odor. As expected33–35, vehicle-treated mice displayed increased exploration of the odor com-pared with those treated with an odorless oil control (Fig. 6a). These values returned to control levels (oil) at the second exposure to the same odor (Fig. 6a), indicating habituation to olfactory stimuli33–35. Notably, THC (1 mg per kg) impaired olfactory habituation in wild-type mice (Fig. 6a–c, Supplementary Fig. 7, and Supplementary Tables 2 and 3), but not in Glu-CB1
−/− mice (Fig. 6b, Supplementary Fig. 7, and Supplementary Tables 2 and 3) or in mice receiving an intra-GCL injection of DCS (Fig. 6c, Supplementary Fig. 7, and Supplementary Tables 2 and 3).
These results apparently suggest that the decrease of olfactory habit-uation might represent a causal link between CB1 receptor–dependent control of glutamatergic transmission in the GCL and food intake.
a Olfactory habituation
VEHTHC
Oil O1 O20
5
10
15
20**
Exp
lora
tion
(s)
b
Glu-CB1–/–WT
VEHTHC
–0.2
0
0.2
0.4
0.6
0.8
1.0
***
Hab
ituat
ion
inde
x
cVEHTHC
Hab
ituat
ion
inde
x
VEH DCS–0.2
0
0.2
0.4
0.6
0.8
1.0
**
Figure 6 CB1 receptor activation decreases olfactory habituation in fasted mice. (a) Olfactory habituation under vehicle or THC treatment (1 mg per kg). (b,c) Habituation indexes under vehicle or THC treatment in fasted Glu-CB1
−/− mice and wild-type littermates (b) and in wild-type mice injected intra-MOB with DCS (2 µg per side, c). Data are presented as mean ± s.e.m. **P < 0.01, ***P < 0.001. See Supplementary Table 3 for detailed statistics.
a b
0 1 2 3
0
0.5
1.0
1.5
2.0
AUC threshold
Foo
d in
take
(g)
Exp
lora
tion
(s)
0 0.001 0.01 0.10
5
10
15
20
25
**
*
[Odor] (%)
g h
Foo
d in
take
(g)
AUC threshold
0 1 2 3
0
0.5
1.0
1.5
2.0
Exp
lora
tion
(s)
[Odor] (%)
0 0.001 0.01 0.10
5
10
15
20
URBVEH
*** ***
c d
Foo
d in
take
(g)
AUC threshold
0 1 2 3
0
0.5
1.0
1.5
2.0
Exp
lora
tion
(s)
[Odor] (%)
0 0.001 0.01 0.10
5
10
15DCS-VEHVEH-VEH
VEH-THCDCS-THC
* *
e f
Foo
d in
take
(g)
[Odor] (%)
0 0.001 0.01 0.10
5
10
15
20
25
WT THC
WT VEHGlu-CB1
–/– VEH
Glu-CB1–/– THC**
***
*
AUC threshold
0 1 2 3
0
0.5
1.0
1.5
2.0
Exp
lora
tion
(s)
THCVEH
Figure 7 CB1 receptor signaling in the MOB enhances olfactory detection in fasted mice and proportionally promotes food intake. (a,c,e,g) Exploration of increasing concentrations of an odor (almond or banana) under vehicle or THC treatment (1 mg per kg) in C57BL/6N (a), in wild-type mice injected intra-MOB with DCS (2 µg per side) (c), in Glu-CB1
−/− mice and wild-type littermates (e), and in wild-type mice systemically injected with URB597 (URB, 10 mg per kg, g). (b,d,f,h) Significant correlations were detected between food intake and area under the curve (AUC) of odor detection threshold (data from a,c,e,g). Data are presented as mean ± s.e.m. *P < 0.05, **P < 0.01, ***P < 0.001. See Supplementary Table 3 for detailed statistics.
©20
14 N
atu
re A
mer
ica,
Inc.
All
rig
hts
res
erve
d.
advance online publication nature neurOSCIenCe
a r t I C l e S
However, when food intake was measured after olfactory habitua-tion, there was no correlation between food intake and exploration (data not shown). Moreover, it is important to note that Glu-CB1
−/− mice, in addition to not responding to THC, did not show any evident spontaneous phenotype in olfactory habituation experiments (Fig. 6b, Supplementary Fig. 7, and Supplementary Tables 2 and 3), whereas they were hypophagic. Thus, alterations of olfactory habituation likely represent a parallel effect of THC, which might be unrelated to food intake (lack of positive correlation) and might not be physiologically regulated by endocannabinoid signaling (lack of phenotypic alteration of Glu-CB1
−/− mice).To find additional (endo)cannabinoid-dependent olfactory proc-
esses, which might reliably explain the control of fasting-induced food intake, we measured threshold for odor detection as an index of odor sensitivity34. After scoring baseline exploration of odorless oil, mice were exposed to increasing concentrations of the same odor (almond or banana33, from 0.001% to 0.1%) and exploration of the odor source was recorded34,35. THC (1 mg per kg) decreased the threshold of odor detection (Fig. 7a and Supplementary Table 3) and this effect was clearly correlated with successive food intake (Fig. 7b and Supplementary Table 3). THC is known to exert a biphasic effect on stimulated food intake10,11. Consistently, neither a lower nor a higher dose of THC (0.25 mg per kg and 1.75 mg per kg, respectively) altered food intake (Supplementary Fig. 8 and Supplementary Table 2), nor did they alter odor detection, with no correlation between these two behaviors (Supplementary Fig. 8 and Supplementary Table 2). Intra-GCL infusion of a sub-effective dose of DCS fully blocked the effect of 1 mg per kg THC on odor detec-tion and proportionally reduced the hyperphagic effect of the CB1
receptor agonist (Fig. 7c,d and Supplementary Table 3), suggesting that the effect of THC depends on local decrease of glutamatergic transmission. THC had no effect on odor detection in Glu-CB1
−/− mice (Fig. 7e and Supplementary Table 3), and these mice displayed a spontaneous decrease of odor detection under vehicle conditions (Fig. 7e and Supplementary Table 3). Food intake in vehicle- or THC-treated Glu-CB1
−/− mice and wild-type littermates was posi-tively correlated with odor detection threshold, further suggesting a potential causal relationship between these two processes (Fig. 7f and Supplementary Table 3). Moreover, the inhibitor of the anandamide- degrading enzyme fatty acid amide hydroxylase (FAAH) URB597 (ref. 36) proportionally increased food intake and odor detection in a dose-dependent manner (Fig. 7g,h, Supplementary Fig. 8, and Supplementary Tables 2 and 3). Together, these data indicate that both pharmacological and physiological activation of CB1 receptors in the GCL promote odor detection and proportionally increase food intake in fasted mice.
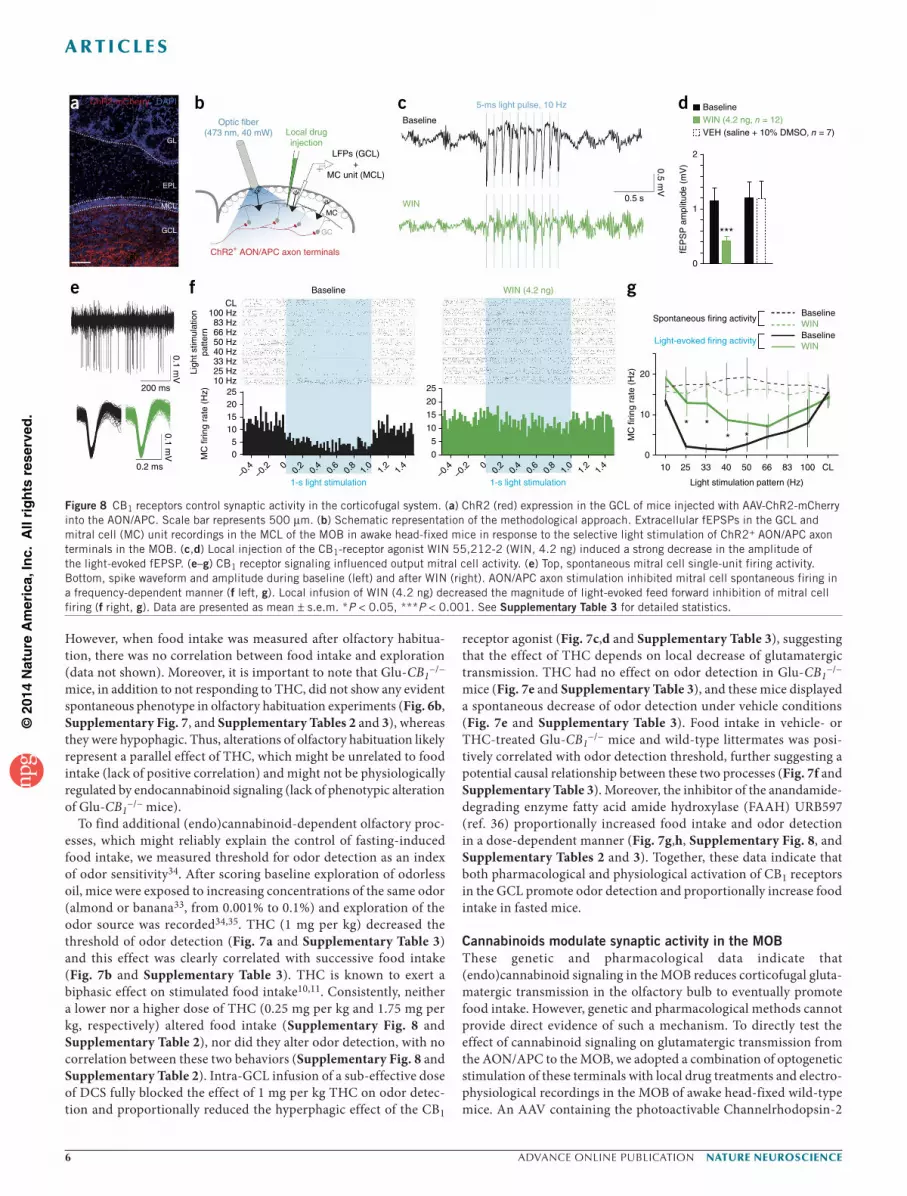
Cannabinoids modulate synaptic activity in the MOBThese genetic and pharmacological data indicate that (endo)cannabinoid signaling in the MOB reduces corticofugal gluta-matergic transmission in the olfactory bulb to eventually promote food intake. However, genetic and pharmacological methods cannot provide direct evidence of such a mechanism. To directly test the effect of cannabinoid signaling on glutamatergic transmission from the AON/APC to the MOB, we adopted a combination of optogenetic stimulation of these terminals with local drug treatments and electro-physiological recordings in the MOB of awake head-fixed wild-type mice. An AAV containing the photoactivable Channelrhodopsin-2
200 ms
0.2 ms
0.1 mV
0.1 mV
e
ChR2-mCherry DAPI
GL
GCL
MCL
EPL
a
ChR2+ AON/APC axon terminals
Optic fiber(473 nm, 40 mW) Local drug
injectionLFPs (GCL)
+MC unit (MCL)
MC
GC
b 5-ms light pulse, 10 Hz
WIN
Baseline
0.5 s
0.5 mV
c
2
1
0
fEP
SP
am
plitu
de (
mV
)
d
***
Baseline
VEH (saline + 10% DMSO, n = 7)WIN (4.2 ng, n = 12)
20
Spontaneous firing activity
Light-evoked firing activity
10
010 25
* ** *
33 40
Light stimulation pattern (Hz)
50 66 83 100 CL
MC
firin
g ra
te (
Hz)
gBaselineWINBaselineWIN
Baseline
100 Hz83 Hz66 Hz50 Hz40 Hz33 Hz25 Hz
CL
10 Hz
Ligh
t stim
ulat
ion
patte
rn
f
2520151050
–0.4
–0.2 0
0.2
0.4
1-s light stimulation0.
60.
81.
01.
21.
4
MC
firin
g ra
te (
Hz)
WIN (4.2 ng)
25
20
15
10
5
0
–0.4
–0.2 0
0.2
0.4
1-s light stimulation0.
60.
81.
01.
21.
4
Figure 8 CB1 receptors control synaptic activity in the corticofugal system. (a) ChR2 (red) expression in the GCL of mice injected with AAV-ChR2-mCherry into the AON/APC. Scale bar represents 500 µm. (b) Schematic representation of the methodological approach. Extracellular fEPSPs in the GCL and mitral cell (MC) unit recordings in the MCL of the MOB in awake head-fixed mice in response to the selective light stimulation of ChR2+ AON/APC axon terminals in the MOB. (c,d) Local injection of the CB1-receptor agonist WIN 55,212-2 (WIN, 4.2 ng) induced a strong decrease in the amplitude of the light-evoked fEPSP. (e–g) CB1 receptor signaling influenced output mitral cell activity. (e) Top, spontaneous mitral cell single-unit firing activity. Bottom, spike waveform and amplitude during baseline (left) and after WIN (right). AON/APC axon stimulation inhibited mitral cell spontaneous firing in a frequency-dependent manner (f left, g). Local infusion of WIN (4.2 ng) decreased the magnitude of light-evoked feed forward inhibition of mitral cell firing (f right, g). Data are presented as mean ± s.e.m. *P < 0.05, ***P < 0.001. See Supplementary Table 3 for detailed statistics.
©20
14 N
atu
re A
mer
ica,
Inc.
All
rig
hts
res
erve
d.
nature neurOSCIenCe advance online publication
a r t I C l e S
fused to mCherry (ChR2-mCherry)37 was injected into the AON/APC of wild-type mice to obtain AON/APC-ChR2 mice, which express ChR2 mainly in the GCL (Fig. 8a). We recorded extracellular field excitatory postsynaptic potentials (fEPSPs) in the GCL of AON/APC-ChR2 mice in response to local light stimulation (Fig. 8b,c). Local injection of the CB1 receptor agonist WIN 55,212-2 (WIN, 4.2 ng) induced a strong decrease in the amplitude of the light-evoked fEPSPs (–61.4 ± 4.5%; Fig. 8c,d and Supplementary Table 3) without affecting spontaneous field activities such as gamma oscillations (40–100 Hz; change in gamma power, +2.7 ± 8.9%, P = 0.28, paired t test). Thus, cannabinoid signaling can suppress glutamatergic transmission from AON/APC projections onto the MOB.
We next examined the effect of WIN on the activity of mitral cell projection neurons in response to the photoactivation of AON/APC axon terminals. We recorded spontaneous mitral cell single-unit firing activity (Fig. 8e) in response to light train stimulation with increas-ing frequencies up to continuous light stimulation. We observed that patterned AON/APC axon stimulation mainly inhibited mitral cell spontaneous firing in a frequency-dependent manner (Fig. 8f,g and Supplementary Table 3), suggesting that AON/APC cortical feedback mostly induces feedforward inhibition onto mitral cell19,20. Notably, local infusion of WIN decreased the magnitude of light-evoked feed-forward inhibition of mitral cells firing without affecting mitral cell spontaneous firing rate (Fig. 8f,g and Supplementary Table 3). Thus, CB1 receptor activation selectively reduces the cortical inhibition of mitral cell spiking activity.
DISCUSSIONHunger is a physiological condition driving the search for and inges-tion of food. Our results suggest that CB1 receptor–dependent control of olfactory processes has a determinant role in coupling this internal state with the execution of the behavior (Supplementary Fig. 9).
When mice are fed standard chow, the control of cortical glutama-tergic transmission by CB1 receptors is dispensable for the modula-tion of food intake in non-fasting conditions11. This suggests that specific factors associated with fasting likely trigger the hyperphagic function of the endocannabinoid system in these circuits. Feeding-related molecules, such as ghrelin, orexins or leptin, which alter food intake and olfactory processes6,7, might participate in this CB1 receptor–dependent mechanism. In addition, a lack of specific nutrients9 might induce CB1 receptor potentiation of olfactory processes. On the other hand, CB1 receptors located on cortical glutamatergic neurons determine the ingestion of novel palatable food in non-fasting condi-tions11. Although we did not test this condition, it will be interesting to extend the involvement of olfactory processes to different modali-ties of stimulated food intake, such as exposure to palatable food, deprivation of specific nutrients or hormonal treatments. Indeed, our electrophysiological in vivo recordings, performed in non-fasted mice, revealed that cannabinoids can decrease glutamatergic centrifu-gal activity in these conditions, suggesting that additional endog-enous (for example, negative energetic status) or exogenous factors (for example, palatability of the food) are necessary to translate the effect of cannabinoid signaling in the MOB network into increased sensory perception and food intake.
Hyperphagic doses of exogenous cannabinoids are able to modulate both olfactory habituation and odor detection. However, the lack of a spontaneous phenotype in Glu-CB1
−/− mice in olfactory habituation and the lack of clear correlations between habituation and successive food intake in individual mice suggests that this pharmacological effect might be unrelated to cannabinoid control of food intake. Conversely, olfactory detection, as measured by the odor threshold
assay34, is strongly correlated with food intake. Detection of low- concentration odors was decreased in hypophagic Glu-CB1
−/− mice and was augmented by increasing the endogenous levels of ananda-mide. Thus, these data suggest that the enhancement of olfactory detection is likely the main mechanism linking (endo)cannabinoid signaling in the olfactory bulb to increased food intake.
We used almond and banana to analyze odor habituation and detection. Despite the fact that these molecules are generally used as non-food–related odors for naive rodents33, we cannot exclude that their attractiveness and the (endo)cannabinoid-dependent control of their perception are a result of an innate link to food. Future experi-ments will be needed to determine whether the (endo)cannabinoid- dependent potentiation of olfactory processes and food intake acts on different odor categories, such as neutral or aversive essences.
Olfactory processes are generally considered to be weaker determi-nants of behavior in humans than in animals. However, this concept might be biased by the fact that olfactory information is processed at lower conscious levels than other sensory inputs in humans. In fact, humans make important decisions unconsciously using olfaction. For instance, partner selection is influenced by unconscious olfaction38 and odorant cues can alter visual perception39. Food intake disorders are often associated with an impaired sense of smell40–42, suggesting causal relationships between these processes. Cannabinoids alter both hunger and smell in humans10,12. To the best of our knowledge, a direct causal relationship between these two effects of cannabinoids has not been shown in humans, and specific experiments should be performed to test this hypothesis.
We found that CB1 receptor signaling in the olfactory bulb increases odor detection and proportionally promotes food intake, thereby link-ing hunger, olfaction and food intake (Supplementary Fig. 9). These functions of CB1 receptors are exerted by the presynaptic inhibition of glutamatergic transmission from cortical projections to the MOB. Two recent optogenetic studies revealed the precise functional connec-tions between cortical olfactory areas and the MOB19,20. In particular, a previous study19 showed that the projections from AON impinge mainly onto granule cells and partly onto mitral cells of the MOB. However, mitral cells also receive a strong di-synaptic inhibition via granule cells19. These data are consistent with our c-Fos expression study showing that the inhibitory effect of CB1 receptor signaling on glutamatergic transmission during fasting led to a decrease of neu-ronal activity in granule cells of the MOB. An alternative possibility is that activation of CB1 receptors in the MOB might indirectly affect glutamatergic transmission via different mechanisms. However, our optogenetic in vivo electrophysiological recordings in awake mice directly demonstrate that cannabinoids can decrease excitatory local field potentials induced by centrifugal glutamatergic activity mainly onto inhibitory feedforward granule cells19, thereby dis-inhibiting the activity of mitral cells. Nevertheless, our c-Fos data did not show higher numbers of fasting-induced activated mitral cells in wild-type or Glu-CB1
−/− mice, which could be expected by the decrease in feed-forward inhibition. This could be a result of the opposite simultane-ous effect of CB1 receptor activation on glutamatergic centrifugal terminals onto granule cells (decreasing feedforward inhibition of mitral cells) and on direct projections to mitral cells19 (decreasing excitation of these neurons). Indeed, Glu-CB1
−/− and AON/APC-CB1
−/− mice present a slight decrease of CB1 protein expression in the IPL, where corticofugal projections likely synapse onto mitral cells18,19. Thus, fasting and endocannabinoid signaling might deter-mine the activation of specific network patterns linked to olfactory control of food intake without altering the total number of activated mitral cells. Recent data suggest that cannabinoid effect on inhibitory

©20
14 N
atu
re A
mer
ica,
Inc.
All
rig
hts
res
erve
d.
advance online publication nature neurOSCIenCe
a r t I C l e S
synaptic activity in the periglomerular area of the MOB might regulate olfactory processes13. However, the participation of periglomerular cells in (endo)cannabinoid control of food intake in our experimental conditions is unlikely. In fact, none of our manipulations altered the expression of CB1 receptors or c-Fos in this area. Thus, the most parsi-monious interpretation of our data is that activation of CB1 receptors on terminals of feedback cortical centrifugal glutamatergic neurons in the MOB directly reduced the excitatory drive onto granule cells, thereby regulating mitral cell activity to eventually increase odor detection and food intake (Supplementary Fig. 9).
The effects of THC on odor detection might be based on alterations of memory processes43. However, higher doses of THC are usually needed to substantially alter memory performance in rodents. For instance, the 1 mg per kg hyperphagic dose of THC does not affect object recognition memory in either the long-term44 or short-term version of this task (A. Busquets-García, R. Maldonado, A. Ozaita, personal communication). Thus, although a memory component cannot be excluded, cannabinoid-induced alterations of memory and odor processing likely rely on distinct mechanisms and circuits. Another possibility is that THC might increase the motivation of the individuals45 to explore the odor source. However, this is rather unlikely, as the enhancing effect of THC in odor source exploration in our detection experiments is present only at lower odor con-centrations (0.001% and 0.01%), whereas it vanishes at the highest concentration (0.1%). If THC increased the motivation to explore the odor source, this effect should logically be present at any odor concentration. Thus, despite the fact that memory and motivational confounders cannot be completely ruled out, the data strongly suggest a primary effect of (endo)cannabinoids on odor perception in our experimental conditions.
In conclusion (Supplementary Fig. 9), we found that the endocannabinoid-mediated control of cortical glutamatergic trans-mission in the olfactory bulb links an internal state (hunger) to sen-sory processing (olfaction) and, eventually, to behavior (food intake). Our results might also contribute to new conceptual frameworks for tackling pathological states. Indeed, altered sensory processes characterize several relevant food intake–related diseases, such as obesity, cachexia and anorexia40–42. Thus, specific interference with CB1 receptor–dependent hunger–olfaction–food intake circuits will likely help contrasting symptoms and development of these pathological conditions.
METHODSMethods and any associated references are available in the online version of the paper.
Note: Any Supplementary Information and Source Data files are available in the online version of the paper.
AcknowledgmenTSWe thank D. Gonzales, N. Aubailly and all of the personnel of the Animal Facility of the NeuroCentre Magendie for mouse care and genotyping, A. Desprez for help with the odor task set-up, D. Herrera and S. Rahayel (NutriBrain School 2012) for help with some experiments, all of the members of the Marsicano laboratory for useful discussions, A. Bacci, D. Cota, V. Deroche and M. Valley for critically reading the manuscript, and K. Deisseroth (Stanford University) and B.L. Roth (University of North Carolina) for providing the plasmids coding for ChR2 and DREADD, respectively. This work was supported by INSERM (G.M.), EU-Fp7 (REPROBESITY, HEALTH-F2-2008-223713, G.M.), European Research Council (ENDOFOOD, ERC-2010-StG-260515, G.M.), Fondation pour la Recherche Medicale (FRM-DRM-20101220445, G.M.), Region Aquitaine (G.M.), LABEX BRAIN (ANR-10-LABX-43), Fyssen Foundation (E.S.-G.), EMBO Post-doc Fellowship (L.B.), RTA, I.S. Carlos III (RD12/0028/0004, P.G.), Basque Country Government BCG IT764-13 (P.G.), University of the Basque Country UFI11/41 (P.G.),
MINECO BFU2012-33334 (P.G.), Postdoctoral Specialization Contract from the University of the Basque Country UPV/EHU (L.R.), MINECO SAF2012-35759 (M.G.), Deutsche Forschungsgemeinschaft (SFB-TRR 58, B.L. and H.-C.P.), CONACyT (E.S.-G.). The Lledo laboratory is part of the École des Neurosciences de Paris Ile-de-France network, a member of the Bio-Psy Labex and is supported partially by “AG2R-La-Mondiale”.
AUTHoR conTRIBUTIonSE.S.-G., G.F., P.-M.L. and G.M. designed the experiments. E.S.-G., L.B., L.R., G.L., C.M., M.B., S.R., F.R., T.D., I.M., T.W., A.C., A.N., A.W., A.P.C., D.V. and P.V. performed the experiments. H.-C.P. provided reagents. E.S.-G., L.B., L.R., G.L., F.M., B.L., M.G., C.Q., H.G., G.F., P.-M.L., P.G. and G.M. analyzed the data. E.S.-G., and G.M. wrote the manuscript. All of the authors edited the manuscript.
comPeTIng FInAncIAl InTeReSTSThe authors declare no competing financial interests.
Reprints and permissions information is available online at http://www.nature.com/reprints/index.html.
1. Kato, H.K., Chu, M.W., Isaacson, J.S. & Komiyama, T. Dynamic sensory representations in the olfactory bulb: modulation by wakefulness and experience. Neuron 76, 962–975 (2012).
2. Meissner, K. & Wittmann, M. Body signals, cardiac awareness, and the perception of time. Biol. Psychol. 86, 289–297 (2011).
3. Bechara, A., Damasio, H., Tranel, D. & Damasio, A.R. The Iowa Gambling Task and the somatic marker hypothesis: some questions and answers. Trends Cogn. Sci. 9, 159–162; discussion 162–154 (2005).
4. Goetzl, F.R. & Stone, F. Diurnal variations in acuity of olfaction and food intake. Gastroenterology 9, 444–453 (1947).
5. Cameron, J.D., Goldfield, G.S. & Doucet, E. Fasting for 24 h improves nasal chemosensory performance and food palatability in a related manner. Appetite 58, 978–981 (2012).
6. Julliard, A.K. et al. Changes in rat olfactory detection performance induced by orexin and leptin mimicking fasting and satiation. Behav. Brain Res. 183, 123–129 (2007).
7. Tong, J. et al. Ghrelin enhances olfactory sensitivity and exploratory sniffing in rodents and humans. J. Neurosci. 31, 5841–5846 (2011).
8. Albrecht, J. et al. Olfactory detection thresholds and pleasantness of a food-related and a non-food odor in hunger and satiety. Rhinology 47, 160–165 (2009).
9. DiPatrizio, N.V. & Piomelli, D. The thrifty lipids: endocannabinoids and the neural control of energy conservation. Trends Neurosci. 35, 403–411 (2012).
10. Pagotto, U., Marsicano, G., Cota, D., Lutz, B. & Pasquali, R. The emerging role of the endocannabinoid system in endocrine regulation and energy balance. Endocr. Rev. 27, 73–100 (2006).
11. Bellocchio, L. et al. Bimodal control of stimulated food intake by the endocannabinoid system. Nat. Neurosci. 13, 281–283 (2010).
12. Tart, C.T. Marijuana intoxication common experiences. Nature 226, 701–704 (1970).
13. Wang, Z.J., Sun, L. & Heinbockel, T. Cannabinoid receptor–mediated regulation of neuronal activity and signaling in glomeruli of the main olfactory bulb. J. Neurosci. 32, 8475–8479 (2012).
14. Kawamura, Y. et al. The CB1 cannabinoid receptor is the major cannabinoid receptor at excitatory presynaptic sites in the hippocampus and cerebellum. J. Neurosci. 26, 2991–3001 (2006).
15. Marsicano, G. & Kuner, R. Anatomical distribution of receptors, ligands and enzymes in the brain and the spinal cord: circuitries and neurochemistry. in Cannabinoids and the Brain (ed. Kofalvi, A.) 161–202 (Springer, New York, 2008).
16. Steindel, F. et al. Neuron type–specific cannabinoid-mediated G protein signaling in mouse hippocampus. J. Neurochem. 124, 795–807 (2013).
17. Davis, B.J. & Macrides, F. The organization of centrifugal projections from the anterior olfactory nucleus, ventral hippocampal rudiment, and piriform cortex to the main olfactory bulb in the hamster: an autoradiographic study. J. Comp. Neurol. 203, 475–493 (1981).
18. Shepherd, G.M.C.W.R. & Greer, C.A. Olfactory bulb. in The Synaptic Organization of the Brain (ed. Shepherd, G.M.) 165–216 (Oxford University Press, Oxford (UK), 2004).
19. Markopoulos, F., Rokni, D., Gire, D.H. & Murthy, V.N. Functional properties of cortical feedback projections to the olfactory bulb. Neuron 76, 1175–1188 (2012).
20. Boyd, A.M., Sturgill, J.F., Poo, C. & Isaacson, J.S. Cortical feedback control of olfactory bulb circuits. Neuron 76, 1161–1174 (2012).
21. Marinelli, S., Pacioni, S., Cannich, A., Marsicano, G. & Bacci, A. Self-modulation of neocortical pyramidal neurons by endocannabinoids. Nat. Neurosci. 12, 1488–1490 (2009).
22. Marsicano, G. & Lutz, B. Expression of the cannabinoid receptor CB1 in distinct neuronal subpopulations in the adult mouse forebrain. Eur. J. Neurosci. 11, 4213–4225 (1999).
23. Monory, K. et al. The endocannabinoid system controls key epileptogenic circuits in the hippocampus. Neuron 51, 455–466 (2006).

©20
14 N
atu
re A
mer
ica,
Inc.
All
rig
hts
res
erve
d.
nature neurOSCIenCe advance online publication
a r t I C l e S
24. Kano, M., Ohno-Shosaku, T., Hashimotodani, Y., Uchigashima, M. & Watanabe, M. Endocannabinoid-mediated control of synaptic transmission. Physiol. Rev. 89, 309–380 (2009).
25. Piomelli, D. The molecular logic of endocannabinoid signaling. Nat. Rev. Neurosci. 4, 873–884 (2003).
26. Di Marzo, V. et al. Leptin-regulated endocannabinoids are involved in maintaining food intake. Nature 410, 822–825 (2001).
27. Marsicano, G. et al. CB1 cannabinoid receptors and on-demand defense against excitotoxicity. Science 302, 84–88 (2003).
28. Monory, K. et al. Genetic dissection of behavioural and autonomic effects of Delta(9)-tetrahydrocannabinol in mice. PLoS Biol. 5, e269 (2007).
29. Ruehle, S. et al. Cannabinoid CB1 receptor in dorsal telencephalic glutamatergic neurons: distinctive sufficiency for hippocampus-dependent and amygdala-dependent synaptic and behavioral functions. J. Neurosci. 33, 10264–10277 (2013).
30. Goebbels, S. et al. Genetic targeting of principal neurons in neocortex and hippocampus of NEX-Cre mice. Genesis 44, 611–621 (2006).
31. Krashes, M.J. et al. Rapid, reversible activation of AgRP neurons drives feeding behavior in mice. J. Clin. Invest. 121, 1424–1428 (2011).
32. Rogan, S.C. & Roth, B.L. Remote control of neuronal signaling. Pharmacol. Rev. 63, 291–315 (2011).
33. Yang, M. & Crawley, J.N. Simple behavioral assessment of mouse olfaction. Curr. Protoc. Neurosci. Ch. 8, Unit 8 24 (2009).
34. Witt, R.M., Galligan, M.M., Despinoy, J.R. & Segal, R. Olfactory behavioral testing in the adult mouse. J. Vis. Exp. published online, doi:10.3791/949 (28 January 2009).
35. Sánchez-Andrade, G., James, B.M. & Kendrick, K.M. Neural encoding of olfactory recognition memory. J. Reprod. Dev. 51, 547–558 (2005).
36. Mor, M. et al. Cyclohexylcarbamic acid 3′- or 4′-substituted biphenyl-3-yl esters as fatty acid amide hydrolase inhibitors: synthesis, quantitative structure-activity relationships, and molecular modeling studies. J. Med. Chem. 47, 4998–5008 (2004).
37. Zhang, F. et al. Optogenetic interrogation of neural circuits: technology for probing mammalian brain structures. Nat. Protoc. 5, 439–456 (2010).
38. Jacob, S., McClintock, M.K., Zelano, B. & Ober, C. Paternally inherited HLA alleles are associated with women’s choice of male odor. Nat. Genet. 30, 175–179 (2002).
39. Zhou, W., Jiang, Y., He, S. & Chen, D. Olfaction modulates visual perception in binocular rivalry. Curr. Biol. 20, 1356–1358 (2010).
40. Palouzier-Paulignan, B. et al. Olfaction under metabolic influences. Chem. Senses 37, 769–797 (2012).
41. Brisbois, T.D., Hutton, J.L., Baracos, V.E. & Wismer, W.V. Taste and smell abnormalities as an independent cause of failure of food intake in patients with advanced cancer–an argument for the application of sensory science. J. Palliat. Care 22, 111–114 (2006).
42. Aschenbrenner, K., Scholze, N., Joraschky, P. & Hummel, T. Gustatory and olfactory sensitivity in patients with anorexia and bulimia in the course of treatment. J. Psychiatr. Res. 43, 129–137 (2008).
43. Marsicano, G. & Lafenetre, P. Roles of the endocannabinoid system in learning and memory. Curr. Top. Behav. Neurosci. 1, 201–230 (2009).
44. Puighermanal, E. et al. Cannabinoid modulation of hippocampal long-term memory is mediated by mTOR signaling. Nat. Neurosci. 12, 1152–1158 (2009).
45. Maldonado, R., Valverde, O. & Berrendero, F. Involvement of the endocannabinoid system in drug addiction. Trends Neurosci. 29, 225–232 (2006).
©20
14 N
atu
re A
mer
ica,
Inc.
All
rig
hts
res
erve
d.
nature neurOSCIenCe doi:10.1038/nn.3647
ONLINE METHODSmice. All experimental procedures were approved by the Committee on Animal Health and Care of INSERM and French Ministry of Agriculture and Forestry (authorization number, 3306369). Maximal efforts were made to reduce the suf-fering and the number of mice used. Male mice, aged 2–5 months, were main-tained under standard conditions with food and water ad libitum. CB1-flox and Glu-CB1
−/− mice were obtained, maintained and genotyped as described11,27,23.Rescue lines were generated as described29. Briefly, to generate the Stop-CB1
mouse line, the endogenous CB1 gene (also known as Cnr1) was silenced by insertion of a loxP-flanked stop cassette in the 5′ UTR of the CB1 receptor start codon29. To generate the CB1-RS mouse line for global rescue of CB1 recep-tor expression, the Stop-CB1 line was crossed with a Cre-deleter mouse line (EIIa-Cre)46. To generate the Glu-CB1-RS mouse line for a selective rescue of CB1 receptors on cortical glutamatergic neurons, Stop-CB1 mice were crossed with a mouse line expressing Cre recombinase under the regulatory elements of the Nex gene (also known as Neurod6), which is the same mouse line used to obtain Glu-CB1
−/− mice23,29. Mutant mice were in a mixed genetic background with predominance of C57BL/6N (CB1-flox and Glu-CB1
−/−, 6 or 7 generations) or C57BL/6J (Stop-CB1, CB1-RS and Glu-CB1-RS).
All mice used in experiments involving mutant mice were littermates, except in the experiments depicted in Figure 4b, where CB1-RS mice originated from independent breedings. Wild-type C57BL/6N mice were purchased from Janvier (France). Experimenters were always blind to genotypes and/or treatments.
Virus generation. Control and CRE virus constructs were prepared as described before23. hM3Dq fused to mCherry (kindly provided by B.L. Roth, University of North Carolina), or mCherry alone for the control virus, were subcloned into an AAV expression vector (kindly provided by K. Deisseroth, Stanford University) with the minimal promoter of calcium calmodulin kinase II α (CaMKIIα-P) by using standard molecular cloning techniques. For behavioral experiments, rAAV were of a mixed serotype AAV1/AAV2 and were generated by calcium phosphate transfection of HEK 293T cells and purified as described before23. For electrophysiological studies, high titer AAV2/9 vectors (3 × 10¹³ genome copies per ml, qPCR) containing pAAV-hSyn-ChR2(H134R)-mCherry (kindly provided by K. Deisseroth, Addgene #26976) was produced by the INSERM IRT1 Vector platform (Nantes, http://www.vectors.univ-nantes.fr/).
Surgery and drug/virus administration. Mice were anesthetized by intraperi-toneal injection of a mixture of ketamine (100 mg per kg, Imalgene 500, Merial) and xylazine (10 mg per kg, Rompun, Bayer) and placed into a stereotaxic appa-ratus (David Kopf Instruments) with mouse adaptor and lateral ear bars. For intra–olfactory bulb injections of drugs, mice were bilaterally implanted with 3-mm stainless steel guide cannulae (Plastics One) targeting the olfactory bulb with the following coordinates: AP +4.2, L ±1.0, DV −2.0, according to Paxinos and Franklin47. Guide cannulae were secured in place with dental cement. Mice were allowed to recover for 7–10 d in individual cages before the beginning of the experiments. Mice were weighed daily and individuals that failed to regain the pre-surgery body weight were excluded from following experiments. For viral intra-AON delivery, mice were submitted to stereotaxic surgery (as above) and AAV vectors were injected with the help of a microsyringe attached to a pump (UMP3-1, World Precision Instruments). Mice were injected with AAV-Cre or AAV-empty vector directly into the AON (0.5 µl per injection), with the following coordinates: AP +2.6, L ± 0.5, DV −3.5, and into the APC: AP +2.3, L ± 1.5, DV −3.7, according to Paxinos and Franklin47. For electrophysiological experiments, mice were injected in the AON (AP, +2.6; ML, ±1.2; DV, −3.5; 0.1 µl) and APC (AP, +2.1; ML, ±1.85; DV, −3.6; 0.4 µl) using pulled glass capillaries connected to a Nanoinjector System (Drummond). Mice were used for experiments 5 weeks after injection to get an optimal deletion or re-expression, depending of the mouse line, of CB1 receptors in olfactory circuits. CB1 deletion and re-expression was verified by in situ hybridization and/or immunohistochemistry (see below). Mice injected with DREAAD or mCherry virus went for a washout period of 1 week after behavioral experiments. Then they were injected with saline or CNO and perfused 30 min later. Brains were post fixed and then slices of the MOB and the AON were made at 20 µm on a cryostat (Leica) and mounted on gelatin-coated microscope slides. Some slides were just counterstained with DAPI for correct visualization of red fluorescence/injection site. Other slides were processed for P-CREB immunohistochemistry by using rabbit antibody to P-CREB (1:500,
Cell Signaling, mAb No. 9198) and EnVision FLEX kit (DAKO) according to manufacturer instructions.
electrophysiology. 1 month after intra-AON/APC injection, anesthetized mice were implanted with a L-shaped metal bar fixed with dental acrylic to the cau-dal part of the skull. After recovery (7 d), implanted mice were progressively habituated to stay quiet while head-fixed (7 d). 1 d before recording, the mouse was anesthetized and the bone covering one of the two bulbs was thinned and removed using a microdrill and then protected with a silicone sealant (Kwik-Cast, WPI). Mitral cell spiking activity and GCL local field potential (LFP) were recorded in the ventral and dorsal part of the bulb using an array of four 3-MΩ tungsten electrodes (FHC, tip distance = 400–500 µm) glued parallel to a mini-ature cannula (polyimide tubing, 0.0035 inches, Neuralynx) connected to a 10-µl Hamilton syringe for subsequent drug infusion. Light stimulation was performed using an optic fiber (multimode, 430-µm diameter, NA 0.39, Thorlabs) coupled to a DPSS laser (473 nm, 150 mW, CNI Lasers) via a custom-built fiber launcher and controlled by PS-H-LED laser driver connected to the CED interface. After lowering the electrodes into the craniotomy and positioning the optic fiber on the surface of the dura, a drop of Kwik-Cast was applied to protect the brain during the recording and to improve recordings stability. Light stimulation consisted of a 1-s train stimulus at different frequency (5-ms light pulse, 40-mW output inten-sity, 10 Hz for fEPSP analysis, 10–100 Hz for mitral cell activity) or continuous light stimulation and was presented every 10 s for ten sweeps. Awake recording sessions lasted 2–3 h and mice were given a 0.2 ml of a 15% glucose solution (wt/vol) through a plastic pipette every 30 min. We performed two recording sessions per mice (one per hemisphere), which were made at least 2 d apart. The craniotomy was cleaned and covered with Kwik-Cast between sessions. Both LFPs and spiking activity were preamplified (unitary gain head-stage, WPI), amplified (×10,000, WPI), altered (1–300 Hz for LFP, 0.3–8 kHz for spikes) and digitized at 25 kHz (Micro1401-3 A/D interface, CED). The identity of mitral cell units were established on the basis of several criteria: 1) stereotaxic coordinates of the MCL, 2) decrease in the gamma oscillation amplitude in the MCL, compared with the LFP recorded in the GCL or EPL, where the current source/sink of gamma oscil-lation are localized48, 3) increase in background spiking activity in a narrow band of 100–150 µm corresponding to the MCL, and 4) typical spontaneous activity patterns coarsely time-locked to the respiration rhythm49. Signals were continuously recorded from 30 min before and 80 min after local acute micro-infusion through the miniature cannula lying ~300 µm above the tip of the electrodes (injection volume = 0.1 µl, speed = 0.05 µl min−1). Spike detection, spike sorting, spike clustering function and spike waveform analysis were per-formed using Spike2 software (CED) followed by a manual adjustment of the clusters. For single-unit validation, all sorted cells displaying more than 1% of their interspike intervals below a 3.5-ms refractory period were discarded from the analysis. Careful attention was also taken to discard any unit that showed some significant changes in spike amplitude or waveform caused by the local infusion of drugs. For light-evoked field potentials, the absolute fEPSP peak amplitude of the first pulse was measured and averaged over the ten sweeps. Fast-fourier transform (Hanning-window, 2.44-Hz resolution) was used to obtain the spectral power of the gamma oscillation band (40–100 Hz) from 1-min-long epoch before and ~10 min after injection. For mitral cell activity, peri-light stimulus histograms were calculated for each stimulation pattern and the mean firing rate during the 1-s stimulation was compared with the mean firing rate in the 1-s period preceding the light stimulation. For post hoc histological analysis, mice were intracardially perfused (ice-cold 4% paraformaldehyde (wt/vol) in 0.1 M phosphate buffer). The brain was removed and postfixed in the same fixative overnight. Brain sections were cut on a vibratome (40-µm-thick slices), rinsed in phosphate-buffered solution, counterstained with DAPI, mounted with a fluo-rescence mounting medium (Mowiol) and observed with a confocal microscope (LSM 700, Zeiss).
drugs. All drugs were purchased from Sigma-Aldrich, except AM251 and WIN55212-2, which were purchased from Tocris, and URB597, which was purchased from Cayman. For intraperitoneal injections, the vehicle for THC was sterile saline solution (92%, vol/vol), ethanol (4%, vol/vol) and cremophore (4%, vol/vol), whereas the vehicle for URB597 was 5% DMSO (vol/vol) in saline. Drugs or vehicle were injected 30 min before refeeding (see below) or olfactory tests (see below). For intra-MOB injections, AM251 was dissolved in a mixture of
©20
14 N
atu
re A
mer
ica,
Inc.
All
rig
hts
res
erve
d.
nature neurOSCIenCedoi:10.1038/nn.3647
saline (0.9% NaCl, vol/vol) with 10% DMSO and 10% Chremophor EL, whereas DCS, MK801 and CNO were dissolved in saline solution. All drugs were prepared fresh just before the experiments.
Fasting-induced food intake. Mice were housed under a 12-h: 12-h dark/light cycle (light on 7 a.m., light off 7 p.m.). Before the experiments, mice were singly housed for at least 7 d. 2 h after the light onset, mice were food deprived for 24 h and then given free access to a pre-weighed amount of standard chow (Standard Rodent Diet A03, SAFE). Food intake was recorded 1 and 2 h after refeeding11. Under these conditions, spillage of food was minimal. It was however controlled by inspection of litter and calculated as not eaten food. In these procedures, drugs were administered 30 min before refeeding, and pre-treatments, including CNO, were administered 15 min before drugs.
olfactory tests. Olfactory tests were adapted according to refs. 33,50–52.
olfactory habituation. Two different neutral33 odors were used during the test: benzaldehyde (almond) and isopentyl acetate (banana) (Sigma-Aldrich). The odors were diluted with mineral oil. For odor presentations, 5 µl of diluted odor-ant (0.1%) or plain mineral oil were deposited onto filter paper and then placed inside a holder. Mice were tested after 24 h of fasting and from 4–8 h after the onset of the light cycle that corresponds to the same range used for assessing feeding behavior. Drug injections (immunoprecipitate and intra-MOB) were performed 30 min before the test. For testing, mice were placed into a plastic cage box (testing cage, identical to their home cage) without bedding or food, located in a room different of the housing room. The task consisted of 5-min odor presentations separated by 5-min inter-trial intervals. In a given session, mice were first presented with the holder containing the mineral oil only. They were then presented with the first odorant during two successive trials (habituation). Subsequently, they were presented the second odorants (control odor) (data not shown). Exploration of the odor source was defined as directing the nose at a dis-tance <1 cm from the tip of the holder, with the vibrissae moving, and/or touching it with the nose. The exploration was not scored when the mouse was chewing the object. The testing cage was cleaned with ethanol 70% and water between the sessions. The two odorants used were presented according to a counterbalanced schedule. To evaluate odor thresholds, we used the same protocol, but only one odor was presented at different concentrations starting at 0.001% and then 0.01% and 0.1% subsequently. After testing, mice were returned to the housing room and replaced in their home cage with pre-weighed food. Then, food intake was measured after 1 h.
endocannabinoids measurements. Mice were killed under fasting or food ad libitum conditions. Brains were quickly removed and the olfactory bulb, hypothalamus and cerebellum dissected, flash frozen, and stored at −80 °C until analysis. Measurements of AEA and 2-AG were carried out as previously described53. Briefly, tissues were homogenized and extracted with chloroform/methanol/Tris-HCl (50 mM, pH 7.5, 2:1:1, vol/vol) containing internal deuterated standards (AEA-d4 and 2-AG-d5). Mass spectral analyses were performed on a TSQ Quantum triple quadrupole instrument (Thermo-Finnigan) equipped with an atmospheric pressure chemical ionization source and operating in positive ion mode. The amounts of anandamide were determined by isotope-dilution using a calibration curve. Endocannabinoid levels were then normalized by the weight of fresh tissue.
Immunohistochemistry. Mice were anesthetized with chloral hydrate (400 mg per kg body weight), transcardially perfused with phosphate-buffered solution (0.1 M, pH 7.4) and then fixed by 500 ml of 4% formaldehyde (wt/vol) prepared at 4 °C. Serial coronal or sagittal vibrosections were cut at 40 µm and collected in 0.1 M phosphate-buffered solution (pH 7.4) at 20–22 °C. Sections were pre- incubated in a blocking solution of 10% donkey serum, 0.1% sodium azide (wt/vol) and 0.3% Triton X-100 (vol/vol) prepared in 0.1 M phosphate- buffered solution for 30 min at 20–22 °C. Free-floating sections were incubated with goat polyclonal antibodies raised against a 31 amino acid C-terminal sequence (NM007726) of mouse CB1 receptor (CB1-Go-Af450-1, 2 µg ml−1, Frontier Science, 1-777-12) for 48 h at 4 °C. The antibody was prepared in 10% donkey serum and phosphate-buffered solution containing 0.1% sodium azide and 0.5% Triton X-100. After several washes, the tissue was incubated with fluorescent
antibody to goat conjugated to Alexa 488 (1:200, Jackson ImmunoResearch, cat. no. 305-546-003) for 4 h and then washed in 0.1 M phosphate-buffered solu-tion at 20–22 °C, before being incubated with DAPI (1:20,000) for 10 min. Finally, sections were washed, mounted, dried and coverslipped with DPX (Fluka Chemie AG). The slides were analyzed with an epifluorescence Leica DM6000 microscope (Leica). For light microscopy, the same procedure was used, with the following modifications Briefly, the fixative solution to perfuse mice was made up of 4% formaldehyde (freshly depolymerized from paraformaldehyde), 0.2% picric acid and 0.1% glutaraldehyde (vol/vol) in 0.1 M phosphate-buffered solution. Blocking solution was made of 10% normal horse serum (NHS, vol/vol), 0.1% sodium azide and 0.5% Triton X-100 prepared in Tris-HCl buffered saline (TBS), and primary antibody was prepared in this blocking solution. After incubation with the primary antibody, tissue sections were incubated in a secondary biotinylated horse antibody to goat IgG (1:200, Vector Laboratories, cat. no. BA-9500). After washing, sections were processed by a conventional avidin-biotin peroxidase complex method (ABC Elite, Vector Laboratories). Tissue was incubated in the avidin-biotin complex (1:50) prepared in the washing solution for 1 h at 20–22 °C. Then, sections were washed and incubated with 0.05% diaminoben-zidine (wt/vol) in 0.1 M phosphate-buffered solution with 0.5% Triton X-100 and 0.01% hydrogen peroxide (vol/vol), for 5 min at 20–22 °C. Finally, tissue was mounted, dehydrated in graded alcohols (50°, 70°, 96°, 100°) to xylol and coverslipped with DPX. Sections were observed and photographed with a light microscope Zeiss Axiophot. For CB1 detection by light microscopy after viral injection in the AON, we applied the same protocol described above with some modifications. To sum up, olfactory bulbs were dissected from non-perfused brains and directly placed in paraformaldehyde (4%). After washing in 0.1 M phosphate-buffered solution and cryoprotection with 15% and 30% sucrose, coronal sections were cut at 40 µm in a cryotome, collected in 0.1 M phosphate-buffered solution and incubated in 1% hydrogen peroxide in 0.1 M phosphate-buffered solution for 30 min at 20–22 °C.
Analysis of cB1 expression in the olfactory bulb. 40-µm-thick olfactory bulb sections from mice of each condition (at least n = 3 each) were analyzed. Image-J (version 1.43u, US National Institutes of Health) was used to quantify CB1 immunolabeling density (mean gray value) in different layers of the MOB.
c-Fos. The protocol was identical as for CB1 immunofluorescence with some modifications. Primary antibody to c-Fos (1:2,000, Santa Cruz Biotechnology, cat. no. sc-52) was incubated overnight at 4 °C. After washing, the tissue was incubated with fluorescent antibody to rabbit conjugated to Alexa 555 (1:2,000, Invitrogen, cat. no. A-21428) for 4 h. Sections were washed, mounted, dried and coverslipped. The slides were analyzed with an epifluorescence Leica DM6000 microscope (Leica).
Quantification of c-Fos expression in the olfactory bulb. c-Fos–positive cells were counted using the software Metamorph (V 7.0). All images were acquired (CoolSNAP HQ2, Photometrics) with the same exposition time. The image analysis system measure the optic density in a surface area, quantifying the number of cell nuclei in the area delimited by the drawn contour surrounding the GCL, MCL and glomerular layer according to an automated cell count. This method detects objects (cells) on basis of a group of pixels with values of optical density above the threshold, which are expressed as number of cells. In each section, the detection level (gray scaling) was chosen above the background level.
electron microscopy. Mice were perfused with a fixative solution made up of 4% formaldehyde (freshly depolymerized from paraformaldehyde), 0.2% picric acid and 0.1% glutaraldehyde in 0.1 M phosphate-buffered solution. Vibrosections (40 µm) were preincubated in a blocking solution of 10% bovine serum albumin (BSA, vol/vol), 0.1% sodium azide and 0.02% saponin (vol/vol) in TBS for 30 min at room temperature. Then they were incubated in the primary polyclonal goat antibody to CB1 as described above prepared in the blocking solution, but with 0.04% saponin, on a shaker for 2 d at 4 °C. After several washes with 1% BSA in TBS, tissue sections were incubated in a secondary 1.4-nm nanogold antigoat antibody (1:100, Fab′ fragment, Nanoprobes) prepared in the same solution as the primary antibody for 3 h on a shaker at 20–22 °C. Then, tissue was washed over-night at 4 °C and postfixed in 1% glutaraldehyde for 10 min. After several washes in double distilled water, gold particles were silver-intensified with a HQ Silver
©20
14 N
atu
re A
mer
ica,
Inc.
All
rig
hts
res
erve
d.
nature neurOSCIenCe doi:10.1038/nn.3647
Kit (Nanoprobes) for 12 min in the dark. Then tissue was extensively washed in double distilled water and in 0.1M phosphate-buffered solution and osmicated in 1% osmium tetroxide (wt/vol) for 20 min. After washing in 0.1 M phosphate- buffered solution, sections were dehydrated in graded alcohols (50°, 70°, 96°, 100°) to propylene oxide and embedded in Epon resin 812. 80-nm ultrathin sections were collected on mesh nickel grids, stained with 2.5% lead citrate for 20 min and examined in a PHILIPS EM208S electron microscope. Tissue prepara-tions were photographed by using a digital camera coupled to the electron micro-scope. Figure compositions were made at 600 dots per inch (dpi). Labeling and minor adjustments in contrast and brightness were done using Adobe Photoshop (CS, Adobe Systems).
Electron micrographs were taken from grids (132-µm side) containing silver- intensified gold particles, all of them showing a similar labeling intensity indi-cating that selected areas were at the same depth. Furthermore, to avoid false negatives, only ultrathin sections in the first 1.5 µm from the surface of the tissue block were examined. Positive labeling was considered if at least one immuno-particle was within approximately 30 nm from the plasmalemma. Metal particles on synaptic membranes were visualized and counted. Semi-quantification of immunogold labeling on unequivocally identified type-I and type-II synapses was performed one mouse of each genotype (wild-type, Glu-CB1
−/− and CB1−/−).
Semiquantification of immunogold labeling on total synaptic terminals and on axon buttons forming type-I and type-II synapses was performed counting a total of 567 profiles from GCL of one mouse of each genotype (wild-type, 62 pictures; Glu-CB1
−/−, 27 pictures; CB1−/−, 35 pictures). Briefly, CB1-immunopositive and
CB1-immunonegative synaptic terminals were identified as described above and counted. Then, the percentage of CB1 immunolabeled terminals was calculated for each animal genotype. The same method was followed to obtain the propor-tion of CB1-immunopositive axon terminals forming unequivocal type-I and type-II synapses based on ultrastructural features.
In situ hybridization. The procedure was performed as described11,22. Mice were killed by cervical dislocation. Their brains were isolated, quickly frozen on dry ice and stored at −80 °C until sectioning in a cryostat (14 µm, Microm HM 500M, Microm Microtech). FITC-labeled riboprobes against mouse CB1 receptor and DIG-labeled riboprobes against mouse GAD65, VGluT1 and tyrosine hydroxylase were prepared as decribed1,14. For signal amplification, we used the
TSA Plus System Cyanine 3/Fluorescein (PerkinElmer). Blocking buffer TNB and wash buffer TNT were prepared according to the manufacturer’s protocol. Slides were analyzed by epifluorescence microscopy (Leica).
data collection. No statistical methods were used to pre-determine sample sizes, but they are similar to those reported in previous publications11,54. Data collection and analysis were performed blind to the conditions of the experiment. All mice were assigned randomly to the different experimental conditions.
Statistical analyses. Data were analyzed by Student’s t test or ANOVA (repeated, one-way and two-way) where appropriate. For ANOVA, only when signifi-cant effects of main factors were detected, post hoc analyses (Bonferroni’s) were performed. However, as normality could not be calculated for all groups, non-parametric tests (Mann-Whitney or Kruskall-Wallis) were also used, which provided virtually the same results. For detailed statistical analysis see Supplementary Tables 1–3.
46. Lakso, M. et al. Efficient in vivo manipulation of mouse genomic sequences at the zygote stage. Proc. Natl. Acad. Sci. USA 93, 5860–5865 (1996).
47. Paxinos, G. & Franklin, K.B.J. The Mouse Brain in Stereotaxic Coordinates (Academic Press, San Diego, 2001).
48. Neville, K.R. & Haberly, L.B. Beta and gamma oscillations in the olfactory system of the urethane-anesthetized rat. J. Neurophysiol. 90, 3921–3930 (2003).
49. Rinberg, D. & Gelperin, A. Olfactory neuronal dynamics in behaving animals. Semin. Cell Dev. Biol. 17, 454–461 (2006).
50. McNamara, A.M., Magidson, P.D., Linster, C., Wilson, D.A. & Cleland, T.A. Distinct neural mechanisms mediate olfactory memory formation at different timescales. Learn. Mem. 15, 117–125 (2008).
51. Fadool, D.A. et al. Kv1.3 channel gene-targeted deletion produces “Super-Smeller Mice” with altered glomeruli, interacting scaffolding proteins, and biophysics. Neuron 41, 389–404 (2004).
52. Ferguson, J.N. et al. Social amnesia in mice lacking the oxytocin gene. Nat. Genet. 25, 284–288 (2000).
53. Lourenço, J., Matias, I., Marsicano, G. & Mulle, C. Pharmacological activation of kainate receptors drives endocannabinoid mobilization. J. Neurosci. 31, 3243–3248 (2011).
54. Bellocchio, L. et al. Activation of the sympathetic nervous system mediates hypophagic and anxiety-like effects of CB1 receptor blockade. Proc. Natl. Acad. Sci. USA 110, 4786–4791 (2013).