dietary intake of competitive bodybuilders
TRANSCRIPT

1 23
Sports Medicine ISSN 0112-1642Volume 45Number 7 Sports Med (2015) 45:1041-1063DOI 10.1007/s40279-015-0329-4
Dietary Intake of Competitive Bodybuilders
Jessica Spendlove, Lachlan Mitchell,Janelle Gifford, Daniel Hackett,Gary Slater, Stephen Cobley & HelenO’Connor
1 23
Your article is protected by copyright and
all rights are held exclusively by Springer
International Publishing Switzerland. This e-
offprint is for personal use only and shall not
be self-archived in electronic repositories. If
you wish to self-archive your article, please
use the accepted manuscript version for
posting on your own website. You may
further deposit the accepted manuscript
version in any repository, provided it is only
made publicly available 12 months after
official publication or later and provided
acknowledgement is given to the original
source of publication and a link is inserted
to the published article on Springer's
website. The link must be accompanied by
the following text: "The final publication is
available at link.springer.com”.

SYSTEMATIC REVIEW
Dietary Intake of Competitive Bodybuilders
Jessica Spendlove1• Lachlan Mitchell1 • Janelle Gifford1
• Daniel Hackett1•
Gary Slater2• Stephen Cobley1
• Helen O’Connor1
Published online: 30 April 2015
� Springer International Publishing Switzerland 2015
Abstract
Background Competitive bodybuilders are well known
for extreme physique traits and extremes in diet and
training manipulation to optimize lean mass and achieve a
low body fat. Although many of the dietary dogmas in
bodybuilding lack scientific scrutiny, a number, including
timing and dosing of high biological value proteins across
the day, have more recently been confirmed as effective by
empirical research studies. A more comprehensive under-
standing of the dietary intakes of bodybuilders has the
potential to uncover other dietary approaches, deserving of
scientific investigation, with application to the wider
sporting, and potential health contexts, where manipulation
of physique traits is desired.
Objective Our objective was to conduct a systematic re-
view of dietary intake practices of competitive body-
builders, evaluate the quality and currency of the existing
literature, and identify research gaps to inform future
studies.
Methods A systematic search of electronic databases was
conducted from the earliest record until March 2014. The
search combined permutations of the terms ‘bodybuilding’,
‘dietary intake’, and ‘dietary supplement’. Included studies
needed to report quantitative data (energy and
macronutrients at a minimum) on habitual dietary intake of
competitive bodybuilders.
Results The 18 manuscripts meeting eligibility criteria
reported on 385 participants (n = 62 women). Most studies
were published in the 1980–1990s, with three published in
the past 5 years. Study methodological quality was
evaluated as poor. Energy intake ranged from 10 to
24 MJ/day for men and from 4 to 14 MJ/day for women.
Protein intake ranged from 1.9 to 4.3 g/kg for men and from
0.8 to 2.8 g/kg for women. Intake of carbohydrate and fat
was\6 g/kg/day and below 30 % of energy, respectively.
Carbohydrate intakes were below, and protein (in men)
intakes were higher than, the current recommendations for
strength athletes, with no consideration for exploration of
macronutrient quality or distribution over the day. Energy
intakes varied over different phases of preparation, typically
being highest in the non-competition ([6 months from
competition) or immediate post-competition period and
lowest during competition preparation (B6 months from
competition) or competition week. The most commonly
reported dietary supplements were protein powders/liquids
and amino acids. The studies failed to provide details on
rationale for different dietary intakes. The contribution of
diet supplements was also often not reported. When sup-
plements were reported, intakes of some micronutrients
were excessive (*1000 % of US Recommended Dietary
Allowance) and above the tolerable upper limit.
Conclusion This review demonstrates that literature de-
scribing the dietary intake practices of competitive body-
builders is dated and often of poor quality. Intake reporting
required better specificity and details of the rationale
underpinning the use. The review suggests that high-qual-
ity contemporary research is needed in this area, with the
potential to uncover dietary strategies worthy of scientific
exploration.
& Helen O’Connor
Jessica Spendlove
1 Discipline of Exercise and Sport Science, Faculty of Health
Sciences, The University of Sydney, 75 East St, Lidcombe,
NSW 2141, Australia
2 University of the Sunshine Coast at Sippy Downs,
Sippy Downs, QLD, Australia
123
Sports Med (2015) 45:1041–1063
DOI 10.1007/s40279-015-0329-4
Author's personal copy

Key Points
Much of the existing research on the dietary intake of
bodybuilders is dated and of limited quality.
A number of dietary strategies long used by
bodybuilders, particularly the timing and dosing of
protein around training have been ‘ahead of the
science’.
Contemporary research on the dietary strategies used
by bodybuilders has the potential to uncover dietary
approaches worthy of future research.
1 Introduction
Competitive bodybuilders are dedicated to rigorous diet
and training practices with the aim of achieving an ex-
tremely muscular, symmetrical, and well-proportioned
physique [1–3]. The use of dietary supplements is ubiqui-
tous and, in a subset of bodybuilders, drugs designed to
enhance the accumulation of lean mass, reduce body fat, or
improve appearance are also a factor in ‘sculpting’ a more
perfect physique [4–6]. Historical evidence supports the
notion that the ideal body desired by competitive body-
builders has evolved substantially over time from some-
thing previously considered widely socially desirable to the
extreme manifestations that exist in order to win compe-
titions such as Mr. Olympia (considered the pinnacle of
bodybuilding) today [7]. For example, one of the heaviest
Mr. Olympia winners, Ronnie Coleman (weighing in at
133 kg in 2009), was some 50 kg heavier than Frank Zane,
who won Mr. Olympia on three consecutive occasions
during the 1970s, Such huge gains in muscle mass across
the decades are likely a consequence of several factors,
including more evidence-based diet and training support,
but also likely as a consequence of anabolic agent abuse
[7–14]. Low body fat is also a hallmark of bodybuilding,
with levels reported to be below 5 % for competition in
men [2, 8] and 10 % for women [1]. The combination of
both high muscle mass and low body fat enables modern
bodybuilders to display a ‘shredded’, ‘vascular’, and what
has been likened to a superhero or ‘Incredible Hulk’-type
appearance [9, 10]. Although bodybuilding has evolved
over the years, a commitment to strict dietary intake re-
mains [1, 7].
1.1 Evolution of Competitive Bodybuilding
Information on diet, supplementation, and drug use in
bodybuilding has historically been passed on by successful
competitors and bodybuilding magazines but increasingly
now via the internet [15, 16]. Although many dietary
dogmas lack scientific scrutiny, several have more recently
been evaluated by empirical research, with practices such
as consumption of protein around the time of training [17],
use of high biological value protein supplements, and fre-
quent dosing of protein ingestion over the day gaining
scientific support [13]. In fact, athletes and coaches often
emulate the diet and training strategies used by body-
builders to enhance their own physique or athletic perfor-
mance [18]. Only in more recent years have scientists taken
greater interest in examining the potential efficacy of some
of these diet strategies, a number of which are now being
applied to both athletes and clinical populations seeking to
increase lean muscle mass and reduce body fat [17, 19, 20].
In the late 1970s, bodybuilding widened its scope to
incorporate a drug-free natural bodybuilding competition
[21]. This change was prompted by concerns about the
negative health effects of drug use in bodybuilding [21].
The physiques of competitors had reached such an extreme
that they were no longer aesthetically pleasing to a wider
audience, resulting in a downturn in popularity with par-
ticipants and spectators [7, 11]. Other less extreme body-
building categories have since been introduced (e.g.,
figure/physique, sports/fitness, and swimsuit/bikini). For
example, in 2013, the Mr. Olympia contest introduced a
physique category for men, one that aims to attract com-
petitors with less extreme physiques. Greater participation
by women in newer bodybuilding categories is evident
[22]. In fact, it should be acknowledged that resistance
training and non-competitive bodybuilding is prevalent
across a wide spectrum of the population for the purpose of
improving strength, athletic performance, injury reha-
bilitation, weight management, and health promotion as
well as physical appearance [23].
1.2 Purpose of this Systematic Review
Many of the dietary approaches used in bodybuilding have
been developed and refined by bodybuilders themselves
well before efficacy was confirmed by scientific research
[13]. A more comprehensive understanding of the dietary
intakes of bodybuilders has the potential to identify ef-
fective and unique dietary approaches deserving of addi-
tional research to assist in the development of lean mass
and reducing body fat. As lean mass gains and fat loss is
commonly desired by athletes and the general community,
there is wider interest in the potential benefit of such
strategies. Evidence also exists that a number of the dietary
strategies used by bodybuilders, including multiple or
heavy supplement use, may be detrimental to health and
that these are increasingly filtering through to the general
community [24–26].
1042 J. Spendlove et al.
123
Author's personal copy

The primary aim of this study was to systematically
review the dietary intake practices of competitive body-
builders. A secondary aim was to evaluate the quality and
currency of the existing literature and identify research
gaps to inform future studies. Bodybuilding in this review
was limited to resistance training with the specific goal of
improving muscularity (size and tone) purely for the aes-
thetic benefit to physique assessed at amateur and profes-
sional bodybuilding competitions.
2 Methods
2.1 Design
A systematic search of electronic databases, including
Allied Complementary Medicine (via OvidSP), Cumula-
tive Index to Nursing, and Allied Health Literature (via
EBSCO), MEDLINE (via OvidSP), SPORTDiscus (via
EBSCO), and Web of Science, was performed from earliest
record until March 2014. The search strategy combined the
terms ‘body building’, ‘body-building’, ‘bodybuilding’,
‘body builder’, ‘body-builder’, and ‘body builder’ with
diet, diet intake, diet supplement, and dietary supplement.
Due to the large volume of magazine and lay articles (see
Fig. 1), the search was limited to peer-reviewed journal
manuscripts. Following the search, a PRISMA (Preferred
Reporting Items for Systematic Reviews and Meta-A-
nalyses) informed systematic review process was com-
pleted [27].
2.2 Selection of Studies
To be included, studies needed to explicitly describe di-
etary energy and macronutrient consumption with or
without micronutrient and dietary supplement intake in
male and/or female bodybuilders. Participants had to be
engaged in training specifically for amateur or professional
bodybuilding competitions across any category (e.g., nat-
ural body building, sport fitness model, etc.). Dietary in-
takes needed to be described quantitatively (e.g., kcal/kJ, g,
lg) rather than qualitatively (e.g., menus, food group
servings, etc.). Studies of any phase of training or com-
petition preparation were eligible for inclusion. These
phases were divided into four distinct periods: non-com-
petition (NC:[ 6 months from competition), competition
preparation (CP: B 6 months from competition), competi-
tion (C: week of competition), and post-competition (P:
immediate days after competition). When the phase of data
collection was not specified (NS), this was also noted.
Although all study designs (e.g., randomized controlled
trials, cohort, and observational) were potentially eligible
for inclusion, only baseline data describing habitual intake
was used for intervention studies. As the study aim was to
describe free-living intakes of male and female body-
builders, studies that only provided a description of an
experimentally manipulated dietary intake (due to the study
imposing a diet or supplement prescription) were excluded,
as were studies of participants training to improve physique
but not specifically to be competitive in bodybuilding or
studies that provided only the mean of intakes for men and
women combined (as this does not provide realistic infor-
mation on the habitual intake consumed for either sex).
In longitudinal studies where dietary intake may have
been described across the different competition phases
outlined above, data from each phase described were ex-
tracted. Where multiple time points were described in a
particular phase, the data closest to the mean were calcu-
lated (if two time points), or the median (if three or more
time points) for that phase were used. When studies de-
scribed dietary intake with and without the contribution of
dietary supplements, both data sets were extracted, but the
data set with supplements incorporated was used in sum-
mary weighted means as this was considered to more ac-
curately describe total intake of nutrients. Diet intake from
food without supplements was included when it was not
possible to add on the intake derived from supplements
(i.e., they were described qualitatively not quantitatively).
When supplement intake was quantified and provided
separately to the intake from food, the intake from sup-
plements was added to the intake from food to calculate the
total nutrient intake. Drug use was noted when reported.
Studies in which participants were preparing to compete in
competition where drug testing was conducted were as-
sumed to not use prohibited substances unless otherwise
reported. Studies that only examined supplements without
reporting dietary intake from food, or case studies with
only one participant, were excluded.
Anthropometric (height, mass) and body composition
data (percent fat) was extracted for each phase described in
the manuscript. When multiple time points were provided
within a particular phase, the highest and lowest body mass
and percent fat was extracted to reflect the range and
change in these parameters across the different phases of
training and competition. The method used to measure
body composition was also extracted.
After eliminating duplicates, the search results were
screened by one reviewer (HO) against the eligibility cri-
teria. Those references that were not eliminated by title or
abstract were retrieved and independently reviewed for
inclusion by two reviewers (JS, HO). Abstracts, thesis
dissertations, and reviews were excluded. Reference lists of
all retrieved papers were manually hand searched for ad-
ditional potentially relevant manuscripts. Papers from all
languages were included; however, these were excluded if
a translation could not be made. Where a journal article
Dietary Intake of Competitive Bodybuilders 1043
123
Author's personal copy

contained insufficient information, attempts were made to
contact authors to obtain missing details.
2.3 Data Extraction, Conversions, and Statistics
Data extracted from studies included participant charac-
teristics such as age, sex, years of training, competition
caliber, weight, height, and body composition. Dietary in-
take from food, with or without supplements, notably en-
ergy, macronutrient, micronutrient, type and number of
supplements used, and method of dietary assessment used
(e.g., food diary, questionnaire, 24-h recall) were also ex-
tracted. Anthropometric parameters reported in imperial
(e.g., pounds) and dietary energy reported in kilocalories
were converted to kg and kJ (1 kg = 2.2 pounds; 1 k-
cal = 4.2 kJ), respectively. Body mass index (BMI) was
calculated [(weight/height)2] from the mean height (m) and
body mass (kg). When required, Atwater factors were used
to calculate grams of a nutrient into percent of energy
(protein 17 kJ/g or 4 kcal/g; fat 37 kJ/g or 9 kcal/g; car-
bohydrate 16 kJ/g or 4 cal/g; alcohol 29 kJ/g or 7 cal/g)
[28]. Extracted data were presented as mean and standard
deviation (SD) when SD was reported. When standard er-
ror was used, SD was calculated and used in the data tables.
Weighted means were calculated for age, anthropometric
variables, energy, and macronutrient intakes.
Macronutrient intake was compared with existing rec-
ommendations specific to nutrition for athletic performance
[29]. Adequacy of micronutrient intakes as a percent of the
Recommended Dietary Allowance (RDA) set by the
country in which the study was conducted was extracted
when reported. When not reported, adequacy was assessed
Identified through database search
(n =319)
Duplicates
(n = 166)
Identified through other sources(n = 2)
Screened for inclusion(n = 155)
Excluded on bases of title/abstract(n = 111)
Screened for eligibility(n = 44)
Included in analysis(n =18)
Excluded by criteria (n = 26)
Nil or inadequate data on habitual diet 9 Republished data 3 Case study (n = 1) 1 Letter 1 Abstract only 1 Mixed sex cohort 1 Non-relevant cohort 10
Fig. 1 Search strategy and
results
1044 J. Spendlove et al.
123
Author's personal copy
against the current US RDA [30], as the majority of papers
(11/18) were from the USA, and mean intakes for each
nutrient were used. The US tolerable upper intake levels
were also used [30] to assess intakes that may have reached
or exceeded these recommendations. As some studies
analysed the dietary contribution of food separately from
supplements (while in other studies supplements were in-
corporated into this calculation), the methodology of how
the food/supplement intake was calculated was extracted.
All data were independently extracted twice (JS, LM, HO),
with disagreements resolved by discussion with a third
researcher (GS, JG) if required.
2.4 Assessment of Methodological Quality
The quality of 17 (of the 18) studies meeting inclusion
criteria were independently assessed by two researchers
(JG and LM) using a modified assessment scale devised
by Downs and Black [31]. One study, by Cho et al. [15],
could not be rated for quality since an adequate English
language translation of all text was not possible. Using
the scale, 13 of the 27 criteria that logically applied
(items 4, 8, 9, 12–15, 17, 21, 23–27 were excluded) to the
identified studies were used. Two additional items ad-
dressing nutrition methodology from a nutrition-specific
quality criteria checklist were incorporated [32]. The two
items added were ‘‘Were nutrition measures appropriate
to question and outcomes of concern?’’ and ‘‘Were the
observations and measurements based on standard, valid,
and reliable data collection instruments/tests/procedures?’’
When each paper was reviewed, each reviewer checked
for internal (intra-rater) consistency across categories be-
fore scores were amalgamated. Disagreements were re-
solved by discussion with a third researcher for consensus
(HO).
3 Results
3.1 Identification and Selection of Studies
The original search netted 319 potential articles. After the
removal of duplicates (n = 166), a further 111 were re-
moved after screening using title and abstract. The full text
of the remaining 44 articles, along with an additional two
identified by hand searching, were retrieved. Of these, 28
were excluded due to not meeting the eligibility criteria,
resulting in 18 eligible manuscripts. A summary of the
systematic PRISMA process is shown in Fig. 1. One paper
[33] was excluded after attempts to contact the authors in
an effort to obtain more specific information about par-
ticipant characteristics and dietary details failed.
3.2 Demographic Characteristics, Competition
Phase/Calibre and Drug Use
Participant demographic characteristics are outlined in
Tables 1 and 2 for the male and female participants, re-
spectively. The 18 studies described a total of 385 par-
ticipants (323 men and 62 women). The majority of papers
were published in the 1980 and 1990s; four papers were
published in 2000, 2007, 2010, and 2011. The weighted
mean age of the men was 26.9 ± 4.7 years (range 21.5–30)
and of the women was 28.6 ± 4.2 years (range 18–30). Of
the 18 studies, ten described men only, three described
women only, and five contained male and female cohorts.
Most (n = 11) studies were conducted in the USA, while
two were from Korea, one was from South Africa, and the
remaining four were from Europe (Tables 1, 2). The males
had trained for a mean of 6.1 years (range 2–9.5) and the
females for 3.5 years (range 1.7–7.5). Use of anabolic
agents was reported by the participants in five of the 18
studies, with no use reported in seven studies (or implied
via the competition being a drug-tested event), leaving the
drug-taking status within the remaining six studies
unknown.
The competition caliber of the participants was not al-
ways described, but only six of the 18 studies reported
recruiting participants competing at the national level and
only one study reported inclusion of participants at the
international level. None of the studies reported whether
participants were competing in newer bodybuilding com-
petition categories (e.g., figure, model, swimsuit, etc.) and
only two papers [6, 15] reported details of the weight class
for which the competitors were preparing.
The competition phase of data collection varied across
studies, with the non-competition phase described in five,
competition preparation in four, and competition week in
eight studies (Tables 1, 2). Six papers described more than
one competition phase. A total of seven studies failed to
identify the phase of the training/competition cycle. Only
one study (in women only) reported on the post-competi-
tion period.
3.3 Anthropometric and Body Composition
Characteristics
The weighted mean height of the men and women was
175.7 ± 6.4 cm (range 169.9–180) and 163.3 ± 5.8 cm
(range 160–172), respectively (Tables 1, 2). The weighted
mean body mass, fat-free mass, and percent fat of the men
was 83.7 ± 9.1 kg (range 77.6–94.9), 77.8 ± 7.6 kg (range
67.7–83.1), and 12.1 ± 2.5 % (range 4.7–17), respectively. In
women, these parameters were 54.2 ± 5.1 kg (range
52.3–60), 48.8 ± 4.3 kg (range 47.4–51.8), and 9.3 ± 2.1 %
(range 8.4–11.1), respectively. In studies that measured body
Dietary Intake of Competitive Bodybuilders 1045
123
Author's personal copy

Ta
ble
1Maleparticipantcharacteristics
References
nAge,
years
Country
Training,
years
(caliber)
Comp
phase
Height,cm
Weight,kg
BMI,kg/m
2FFM,kg
Fat,%
Baldo-Enzi
etal.
[38]D
(Y&N)
14 D(Y
)26.6
±5.3
Italy
3.9
NS
172.3
±6.1
82.4
±8.5
27.7
±2.1
72.2
±6.5
13.8
±3.1
B
17 D(N
)24.9
±3.8
Italy
3.9
NS
175.7
±5.7
77.6
±8.3
25.1
±1.9
68.4
±7.1
16.1
±2.0
B
Bazzare
etal.[8]D
(T)
13
30.0
±4.0
USA
11.9
(N)
C171.0
±7.0
80.0
±12.0
27.7
76.1
4.9
±1.6SF(7)
Choet
al.[15]D
(NS)
34
27.0
±2.1
Korea
4.9
(N)
NS
173.5
±5.0
82.3
±9.1
27.3
±2.5
NR
8.3
±0.6SF(5)
Faber
andBenade
[37]D
(NS)
76
27.4
±6.5
S.Africa
7.2
NC
177.4
±6.6
81.9
±9.0
25.9
±1.2
NR
15.4
±2.9
W
Giada[34]D
(N)
20
25.0
±4.0
3.5
NS
175.0
±6.0
76.8
±8.6
24.9
±19
67.7
±7.3
12.8
±2.0
B
Heywardet
al.[1]D
(NS)
927.8
±5.7
USA
3.6
(Ci,R,
S,N)
CP,C
177.1
±3.7
CP:91.5
±9.2
CP:29.1
CP:82.7
CP:9.7
±3.1
C:86.1
±9.5
C:27.8
C:81.1
±10.4
C:5.9
±3.2
HW
Keith
etal.[4]D
(Y)
19
26.0
±6.0
USA
7.2
(R,S)
NC
177.1
±8.0
93.0
±12.5
29.8
±2.5
NR
NR
Kim
etal.[80]D
(N)
821.5
±2.6
Korea
2.0
(N)
NC
175.5
±6.0
94.9
±12.9
30.7
±2.6
74.4
±8.7
17.0
±4.4
B
Kleiner
etal.[5]D
(Y&N)
18D(Y
)29.5
±6.5
USA
9.5
±5.6
NC
176.8
±7.9
87.2
±9.6
28.1
NR
13.1
±2.8
HW
17D(N
)25.6
±4.8
USA
6.6
±3.7
NC
179.8
±7.9
88.5
±11.2
27.7
NR
13.9
±4.2
HW
Kleiner
etal.[6]D
(Y)
19
28.0
±4.0
USA
8.2
(N)
C169.9
±7.5
80.1
±11.7
27.6
75.3
6.0
±1.8SF(7)
Linseisen
etal.[35]D
(Y)
13
24.6
±4.2
Germany
4.5
NC
180.0
±6.5
89.5
±8.4
27.4
±1.9
75.5
±5.3
15.4
±3.9
SF(4)
Maestuet
al.[36]D
(N)
728.3
±10.3
Estonia
N,I
C175.3
±5.4
82.3
±9.3
26.7
±2.8
72.9
±8.4
9.6
±2.3DXA
New
tonet
al.[2]D
(NS)
626.5
USA
7(S,N)
CP,C
173.6
CP:91.0
±4.4
CP:30.2
CP:82.7
±3.6
CP:9.2
±1.2
C:83.7
±2.0
C:27.8
C:80.3
±1.2
C:4.1
±1.3
HW
PoortmansandDellalieux
[81]D
(N)
20
29±
1Belgium
UK
NS
NR
86.4
±1.7
NR
NR
NR
Sandoval
etal.[3]D
(NS)
525.0
±3.3
USA
3.6
(Ci,R,
S)
C176.7
±3.6
82.2
±9.7
26.3
±9.2
81.1
±10.4
7.2
±1.6HW
VegaandJackson
[40]D
(NS)
828.5
±5.5
USA
6.3
NS
175.0
±6.0
84.6
±11.6
27.6
NA
NR
Weightedmean(range)
26.9
±4.7
(21.5–30.0)
6.1 (2
.0–9.5)
175.7
±6.4
(169.9–180.0)
83.7
±9.1
(77.6–94.9)
27.9
±3.7
(24.9–30.7)
77.8
±7.6
(67.7–81.3)
12.1
±2.5
(4.1–17.0)
Dataarepresentedas
mean±
SD
ormean(range)
unless
otherwiseindicated
Bbioelectrical
impedance,BMIbodymassindex,Cicity,C
competition,compphase
competitionphase,
CPcompetitionpreparation,D(N)participants
did
notconsumedrugs,D(NS)not
specified
whether
participants
useddrugs,D(T)participants
competed
incompetitionwheredrugtestingis
perform
ed,DXAdual-energyX-ray
absorptiometry,D(Y)participants
consumed
drugs,FFM
fat-free
mass,HW
hydrostatic
weighing/underwater
weighing,Iinternational,N
national,NAnotavailable,NC
non-competition,NRnotreported,NSnotspecified,Rregional,
Sstate,
SD
standarddeviation,SF(n)skin
fold
sites(n
=number
ofsites),UK
unknown,W
weightonly
1046 J. Spendlove et al.
123
Author's personal copy

Ta
ble
2Fem
aleparticipantcharacteristics
References
nAge,
years
Country
Training,years
(caliber)
Comp
phase
Height,cm
Weight,kg
BMI,
kg/m
2FFM,kg
Fat,%
Bazzare
etal.[8]D
(T)
17
29±
3USA
7.5
(N)
C160.0
±7.0
53.0
±6.0
20.7
48.3
9.1
±1.4
SF(7)
Heywardet
al.[1]D
(NS)
12
28.7
±7.2
USA
2.2
(Ci,S,N)
CP,C
162.4
±7.0
CP:58.3
±5.2
CP:
22.4
CP:48.5
±5.7
CP:16.8
±4.5
C:52.3
±4.5
C: 19.8
C:47.4
±4.9
C:9.5
±3.3HW
Kleiner
etal.[6]D
(Y)
828.0
±4.0
USA
3.4
±1.4
C165.6
±7.5
57.4
±9.2
20.8
51.8
9.8
±1.5
SF(7)
Lam
ar-H
ildebrandet
al.
[41]D
(NS)
6(18–30)
USA
RCP,C
NR
C:53.2
±4.9
NR
NR
NR
New
tonet
al.[2]D
(NS)
2(25–37)
USA
4(S)
CP,C
162.0
CP:58.0
±0.2
22.3
CP:49.4
±1.4
14.8
±2.2
HW
C:55.6
±3.2
21.2
C:49.4
±3.0
11.1
±0.2
Sandoval
etal.[3]D
(NS)
627.8
±4.1
USA
1.7
(Ci,R,S)
C162.9
±4.1
52.5
±3.1
19.8
48.1
±3.3
8.4
±3.2
(HW)
VegaandJackson
[40]D
(NS)
529.8
±4.6
USA
3.2
±1.9
NS
172.0
±6.8
60.0
±3.7
20.0
NR
NR
Walberg-Rankin
etal.
[41]D
(N)
627.3
±5.1
USA
2.8
(R)
CP,C,P
165.0
±4.4
CP:57.0
±2.5
21.1
NR
12.7
±1.7
SF(3)
C:54.3
±2.2
20.0
P:58.2
±2.7
21.5
Weightedmean(range)
25.8
±4.2
(18–30)
3.5
(1.7–7.5)
163.3
±5.8
(160.0–172.0)
54.2
±5.1
(52.3–60.0)
NR
48.7
±4.23
(47.4–51.8)
9.3
±2.1
(8.4–11.1)
Dataarepresentedas
mean±
SD
orrangeunless
otherwiseindicated
BMIbodymassindex,Ccompetition,Cicity,compphase
competitionphase,CPcompetitionpreparation,D(N)participantsdid
notconsumedrugs,D(NS)notspecified
whether
participants
useddrugs,D(T)participantscompeted
incompetitionwheredrugtestingisperform
ed,DXAdual-energyX-ray
absorptiometry,D(Y)participantsconsumed
drugs,FFM
fat-free
mass,HW
hydrostatic
weighing/underwater
weighing,Iinternational,Nnational,NCnon-competition,NRnotreported,NSnotspecified,Ppost-competition,Rregional,Sstate,
SD
standarddeviation,
SF(n)skin
fold
sites(n
=number
ofsites),UK
unknown,W
weightonly
Dietary Intake of Competitive Bodybuilders 1047
123
Author's personal copy
Ta
ble
3Dietary
intakein
men
References
nPhase
Energy,kJ/day
(kJ/kg)
Protein
aCHO
Fat
Alcoholb
Datacollectionmethod
Baldo-Enzi
etal.[38]-
S14
NS
11,327±
3112(138)
253;(3.1)31
333;(4.0)47
66.1;22
NR;CAL0
FD(4)
17
NS
13,759±
3355(173)
159;(2.1)20
439;(5.7)51
106.4;29
NR;CAL0
FD
(4)
Bazzare
etal.[8]SNR
13
11,004±
3372(138)
247±
105;(3.1)40
334±
194;(4.2)49
33±
19;11
NR;CAL0
FD(3)
Choet
al.[15]SNR
34
NS
10,851±
3672(132)
157±
91;(1.9)27
367±
133(4.5)64
50±
34;9
NR;CAL0
24HR
Faber
andBenade[37]?
S,c,?S,d
76
NS
15,455(189)
188;(2.3)21
337;(4.4)35
168±
50;40
11±
18;4
FD(7)
Giada[34]-
S20
NS
15,473±
4368(202)
166;(2.2)18
534;(7.0)55
121;29
13±
16;2
FD(4)
Heywardet
al.[1]?
S,c
9CP
15,078±
4867(165)
215±
59;(2.3)25
457±
148;(5.0)52
110±
71;26
NR;CAL0
C9790±
1088(114)
163±
59;(1.9)28
365±
76;(4.2)63
32±
18;13
NR;CAL0
Kim
etal.[80]?
S,d
8NC
22,099±
5690(233)
406±
101;(4.3)30
470;(5.0)34
215;36
NR;CAL0
FD(3)?
S
Keith
etal.[4]SNR
14
NC
18,770±
5905(202)
252±
109;(2.7)23
544±
193;(5.8)46
151±
9330
NR;CAL0
FD(3)
Kleiner
etal.[5]?
S,d
35
NS
24,104±
10,500(276)
324±
163;(3.7)23
637±
7;(7.2)42
241±
109;33
NR;CAL;17;2
EFD
(3)
Kleiner
etal.[6]-
S19
C8463±
4452(106)
169.9
±94;(2.1)34
243±
121;(3.0)50
40±
51;15
NR;CAL0
FD(7)
Linseisen
etal.[35]?
S,d,S
13
NC
17,165±
3007(192)
219±
85;(2.5)22
497±
138;(5.6)49
118±
51;26
6±
17;1
Maestu[36]SNR
7CP
14,646±
4250(178)
205.8
±42.2;(2.5)24
447.1
±183.6;(5.4)49
90.1
±16;22.8
NR;CAL;23;5
FR(3)
C13,587±
4015(165)
195.7
±36.7;(2.4)25
387.6
±84.8;(4.7)46
93.2
±15.4;25
NR;CAL;21;5
New
tonet
al.[2]?
S,d,-S
6CP
10,802±
2675(124)
244±
62;(2.8)38
363±
143;(4.1)56
33±
10;14
NR;CAL0
FD(3)
C8572±
2461(102)
168±
86;(2.0)33
290±
73;(3.5)57
19±
18;8
NR;CAL;6;2
PoortmansandDellalieux[81]-
S20
NS
16,413±
1130(190)
169±
13;(2.0)18
NR
NR
NR
FD(7)
Sandoval
etal.[3]-
S5
C9857±
924(120)
199±
65;(2.4)34
305±
91(3.7)52
41±
19;16
NR;CAL0
FD(3)
VegaandJackson[40]SNR
816,107±
6250(190)
262±
104;(3.1)28
506±
281(6.0)50
89±
53;20.4
NR;CAL;9;2
Competitionphase
NC
66
NC
15,988±
4059(184)
240.6;(2.8)25
454;(5.3)47
122.8;28
–
CP
22
CP
13,774±
4073(158)
220;(2.5)28
428;(4.9)52
82.7;22
–
C63
C10,029±
3162(123)
194.5
(2.4)34
310(3.8)52
41;14
–
NS
193
NS
16,339±
5636(196)
205.9
(2.5)22
421.1
(5.0)45
148.0;30
–
Dataarepresentedas
mean±
SD
g/day
(g/kg/day)%
ofenergyintakeunless
otherwiseindicated
ACSM
American
CollegeofSportsMedicine,
Ccompetition,CALcalories,CHO
carbohydrate,CPcompetitionpreparation,EFD
estimated
fooddiary,FD(n)fooddiary
(number
ofdays
collected),NC
non-competition,NRnotreported,NSnotspecified,SNRsupplements
notreported,-Sdietary
supplements
excluded
from
theanalysis,?Sdietary
supplements
included
in
analysis,24HR24-h
recall
aRecommended
protein,CHO,andfatintakeforathleticperform
ance
accordingto
ACSM
PositionStand:protein
1.2–1.7
g/kg/day
(10–35%),CHO
6–10g/kg/day,fat(20–35%)
bAustralian
publichealthrecommendationsforalcoholintake:
nomore
than
10gofethanolper
day
forwomen
and20gofethanolper
day
formen,with2alcohol-free
days
cProtein
powder
only
dAllsupplements
(protein
powder,vitam
insandminerals)
1048 J. Spendlove et al.
123
Author's personal copy

composition in non-competition/competition preparation
versus competition phases, body mass and fat was substan-
tially less at competition in both men (*5–7 kg lighter and
*4–5 % lower body fat) and women (*3–6 kg lighter and
*5–7 % lower body fat). When body composition was
assessed, studies used hydrodensitometry (n = 4), surface
anthropometry (n = 5), bioelectrical impedance (n = 3), or
dual energy X-ray absorptiometry (n = 1).
3.4 Dietary Intake in Men
3.4.1 Energy and Macronutrient Intake in Men
The intake of energy and macronutrients for the men are
reported in Table 3, which also shows the phase (i.e., non-
competition, competition, or non-specified) and whether
intakes included the contribution of dietary supplements.
Of the 16 studies that reported data in men, only six in-
cluded dietary supplements in the nutritional analysis, with
five of these including both powder/liquid and pill-form
supplements (the remaining study analyzed only sports
food supplements). Two of these six studies also provided
nutritional analysis without supplements, enabling the
contribution of dietary supplements to be assessed. Of the
remaining ten studies in men, six failed to specify whether
supplements were included in the analysis and four only
provided an analysis of intake from foods consumed,
omitting supplements. No studies in men reported on the
post-competition period, and a large number of participants
were from studies in which the phase of preparation was
not specified (n = 193). The majority of participants were
described in the non-competition (n = 66) or competition
(n = 63) phase, with a smaller number described in the
competition preparation phase (n = 22). Limited details
were provided on the types of dietary approaches or ra-
tionale used by the participants in these phases, i.e., whe-
ther they were ‘bulking’, ‘cutting’, restricting fluids or
sodium, etc.; rather, just the nutritional analysis was
provided.
The energy intake in the men across the 16 studies
ranged from 8572 kJ/day (102 kJ/kg/day) through to
24,104 kJ (276 kJ/kg/day) (Table 3). Energy intake varied
across competition phases, with weighted means showing it
was highest (excluding the non-specified phase data) in the
non-competition phase (15,988 kJ/day; 184 kJ/kg/day) and
lowest in the competition phase (10,029 kJ/day; 123 kJ/
kg/day) (Table 3). The protein intake in men ranged from
157 g/day (1.9 g/kg/day) to 406 g/day (4.3 g/kg/day). The
proportion of energy from protein ranged from 17.5 to
40 %. Weighted means showed that the absolute intake of
protein was highest in the non-competition phase
(220 g/day; 2.5 g/kg) and lowest in the competition phase
(194.5 g/day; 2.4 g/kg/day) (Table 3).
Carbohydrate intake across the studies in men ranged
from 243 g/day (3.0 g/kg/day) through to 637 g/day (7.2 g/
kg/day). The proportion of energy from carbohydrate ran-
ged from 34 to 64 %. Weighted means indicated the ab-
solute intake of carbohydrate was highest in the non-
competition phase (454 g/day; 5.3 g/kg/day) and lowest
during the competition phase (310 g/day; 3.8 g/kg/day)
(Table 3). The absolute intake of fat across the studies
ranged from 19 g/day (8 % of energy) through to
241 g/day (33 % of energy). Weighted means indicated the
highest absolute fat intake (aside from the mean of studies
where phase of data collection was not specified) was
during the non-competition phase (123 g/day; 28 %) and
lowest during the competition phase at 41 g/day (14 % of
energy) (Table 3).
Most studies failed to report a value for alcohol con-
sumption, so this was calculated via difference from the
sum of the proportions derived from protein, fat, and car-
bohydrate and found in most cases to be zero (Table 3).
However, this calculation was problematic for some studies
[1–3, 34], as the sum of the percent energy contribution
from protein, fat, and carbohydrate exceeded 100 %,
indicating the authors had made an error with the reported
data (see quality ratings, Table 9). Half (n = 8) of the
papers in men were found (five via calculation) to have an
energy contribution from alcohol that ranged from 1 %
[35] to 5 % of energy [36]. The absolute highest mean
intake of alcohol in any study was 23 g/day [36].
3.4.2 Micronutrient Intake in Men
Vitamin intake was reported in nine of the 16 studies in
men (Table 4). However, only five of these studies pro-
vided a comprehensive analysis of intake, which included
the contribution of dietary supplements [1, 2, 5, 35, 37].
Two of these five papers were also analysed without sup-
plements for comparison [2, 35]. The remainder (n = 4)
failed to specify whether supplements were included in the
nutrient analysis. A total of nine vitamins were reported on
across the studies, including folate, retinol equivalents, and
vitamins B1, B2, B3, B6, B12, C, and E. Of these, only
vitamins B2 and B3 had intakes below the RDA from at
least one study. Most striking was the substantially high
intakes of certain nutrients, and this occurred more often in
the intakes where supplements were included in the nutri-
tional analysis. Some nutrients were consumed at levels
more than 1000 % above the RDA. Nutrients consumed
above the upper limit (according to US recommendations)
[30] were folate, vitamin B6, and vitamin C. As intakes of
vitamin A were reported as retinol equivalents, it was not
possible to assess the upper limit (Table 4).
Mineral intake was reported in 12 of the 16 studies in
men (Table 5). Of these, six studies calculated intake with
Dietary Intake of Competitive Bodybuilders 1049
123
Author's personal copy
Ta
ble
4Vitam
inintakes
inmen
References
nPhase
Folate,lg
VitA,RE
VitB1
VitB2
VitB3
VitB6
VitB12
VitC
VitE
Bazzareet
al.[8]
13
CSNR
NR
NR
NR
NR
NR
NR
NR
272±
258
(453)
NR
Choet
al.[15]
34
NSSNR
NA
1143±
1208(181)
1±
1(114)
2±
01(86)
53±
41
(312)
NR
NR
181±
134
(273)
NR
Faber
andBenade
[37]
45
NS?S,a
632(158)
16,127(323)
4(329)
6(375)
47(261)
5(223)
17(563)
260(433)
NR
30
NS?S,b
845(211)
23,736(475)
17(1238)
16(981)
92(511)
17(759)
68(2250)
970(1616)
NR
Heywardet
al.[1]
7CP?S,a
NR
NR
3±
1(171)
2±
1(138)
58±
16
(323)
42±
18(311)
NR
154±
94
(256)
17±
10
(165)
C?S,b
NR
NR
2.1
±0.8
(125)
3±
6(242)
59±
24
(327)
41±
24(30)
NR
171±
82
(285)
10±
3
(100)
Keith
etal.[4]
14
NCSNR
753±
477
(376)
15,386±
9167(304)
4±
2(173)
6±
3(204)
73±
36
(245)
5±
3(236)
12±
8
(603)
222±
237
(370)
15±
20
(100)
Kleiner
etal.[5]
35
NS?S,a
NR
17,709±
29,990
(1968)c
9±
14
(750)c
11±
15
(846)c
84±
50
(525)c
NR
NR
493±
326
(548)c
NR
Linseisenet
al.[35]
13
NC?S,b
732±
553
(488)
1±
1(110)
12±
13
(553)
10±
9(398)
46±
23
(258)
55±
155
(1263)
NR
321±
233
(428)
39±
34
(321)
NC-S
236±
88
(157)
1±
1(58)
2±
1(72)
3±
1(129)
24±
12
(136)
3±
1(66)
NR
140±
61
(187)
13±
5
(111)
New
tonet
al.[2]
6CP?S,b
(174)
(376)
(1353)
(1180)
(463)
(4782)
(7239)
(2483)
(213)
CP–S
(114)
(274)
(150)
(150)
(399)
(224)
(227)
(285)
(93)
6C?S,b
(174)
(436)
(1329)
(1145)
(380)
(3829)
(7659)
(1880)
(369)
C-S
(96)
(352)
(106)
(90)
(251)
(157)
(248)
(308)
(129)
Sandoval
etal.[3]
5CSNR
NR
NR
2±
1(157)
2±
0(133)
78±
32
(244)
5±
1(211)
NR
137±
71
(229)
NR
Range%RDA
96–488
58–1968
72–1353
86–1180
136–525
66–1263
227–7659
187–2483
93–369
Dataarepresentedas
mean±
SD
mg(%
RDA)unless
otherwiseindicated
Ccompetition,CPcompetitorpreparation,NC
non-competition,NRnotreported,NSnotspecified,RDArecommended
dietary
allowance
orintakeofthecountryin
whichthestudywas
conducted,REretinolequivalents,SDstandarddeviation,SNRsupplementsnotreported,-Sdietary
supplementsexcluded
from
theanalysis,?Sdietary
supplementsincluded
inanalysis,Vit
vitam
in,%RDApercentoftheRDA/AIin
thecountryfrom
whichdatawerecollected
aProtein
powder
only
bAllsupplements
(protein
powder,vitam
ins,andminerals)
cCalculatedas
relevantage(from
groupmean)andsexpercentRDA
oftheUSA
because
%RDA
from
countryoforigin
was
notreported
inthepaper
1050 J. Spendlove et al.
123
Author's personal copy
Ta
ble
5Mineral
intakes
inmen
References
nPhase
Calcium
Copper
Iron
Magnesium
Phosphorus
Potassium
Sodium
aZinc
Bazzare
etal.1992[8]
13
CSNR
917±
953(98)b
2±
1(233)b
24±
6(300)b
700±
318
(175)b
NR
NR
NR
14.3
±5.4(95)
Choet
al.[15]
34
NSSNR
551±
302(79)
NR
17±
7(135)
NR
NR
NR
NR
NR
Faber
andBenade[37]
45
NS?S,c
2502(313)
5(180)
41(410)
620(177)
3404(426)
5471
3306
30(200)
30
NS?S,d
2718(340)
5(204)
52(520)
670(190)
3547(443)
5685
NR
3279
NR
32.4
(216)
Heywardet
al.[1]
7CP?S,c
2141±
1672
(267)
NR
29±
10(286)
631±
204
(180)
NR
6222±
2481
(166)
3971±
2475
(132)
24±
12(163)
C?S,d
416±
209(52)
NR
19±
7(188)
494±
146
(141)
NR
5163±
1276
(138)
1451±
842(48)
12±
4(81)
Keith
etal.[4]
14
NCSNR
2277±
1666
(259)
NR
37±
16(343)
688±
376
(192)
3561±
1890
(412)
6950±
3533
(148)b
5511±
2003
(367)b
24.7
±13.0
(165)
Kim
etal.[80]
8NC?S,d
2177±
1588
(218)b
NR
NR
NR
3269±
1023
(467)b
5952±
2136
(127)b
4905±
3168
(327)b
NR
Kleiner
etal.[5]
35
NS?S,d
2987±
1825
(299)b
NR
44±
31(550)b
NR
4717±
2475
(674)b
NR
6693±
3175
(446)b
40±
31(364)b
Kleiner
etal.[6]
19
C–S
605±
586(75)
3±
2(111)
16±
9(156)
345±
214(98)
NR
4420±
2769
(94)b
1442±
1300
(96)b
11±
6(71)
Linseisen
etal.[35]
13
NC?S,d
2319±
896(232)
NR
26±
8(260)
744±
232
(213)
3189±
1000
(456)
5940±
1650
(126)b
3650±
980
(243)b
NR
NC-S
2082±
759(208)
NR
22±
5(220)
687±
237
(196)
3066±
915(438)
5800±
1620
(123)a
3550±
1000
(237)b
NR
New
tonet
al.[2]
6CP?S,d
(213)
NR
(354)
(173)
(283)
(148)
NR
(362)
CP-S
(119)
NR
(246)
(165)
(278)
(148)
NR
(103)
6C?S,d
(152)
NR
(332)
(166)
(178)
(106)
NR
(550)
C-S
(49)
NR
(187)
(117)
(170)
(106)
NR
(69)
PoortmansandDellalieux
[81]
20
NC-S
1898±
307(90)b
NR
NR
NR
NR
NR
NR
NR
Sandoval
etal.[3]
5CSNR
433.0
±189.0
(54)
NR
18.8
±6.0
(188)
NR
NR
NR
NR
NR
Range%RDA/AIe
49–340
111–233
135–550
98–213
170–674
94–166
48–446
71–550
Dataarepresentedas
mean±
SD
mg(%
RDA)unless
otherwiseindicated
AIadequateintake,
Ccompetition,CPcompetitionpreparation,NCnon-competition,NRnotreported,NSnotspecified,Ppost-competition,RDArecommended
dietary
allowance,SNRsupplementsnot
reported,-Sdietary
supplementsexcluded
from
theanalysis,?Sdietary
supplements
included
inanalysis,%RDApercentoftheRDA/AIin
thecountryfrom
whichdatawerecollected
aSodium
from
food,does
notincludeadded
salt
bCalculatedas
relevantage(from
groupmean)andsexpercentRDA,oftheUSA
because
%RDA
from
countryoforigin
was
notreported
inthepaper
cProtein
powder
only
dAllsupplements
(protein
powder,vitam
ins,andminerals)
eWhen
dietintakereported
withandwithoutsupplements,rangegiven
withsupplements
Dietary Intake of Competitive Bodybuilders 1051
123
Author's personal copy
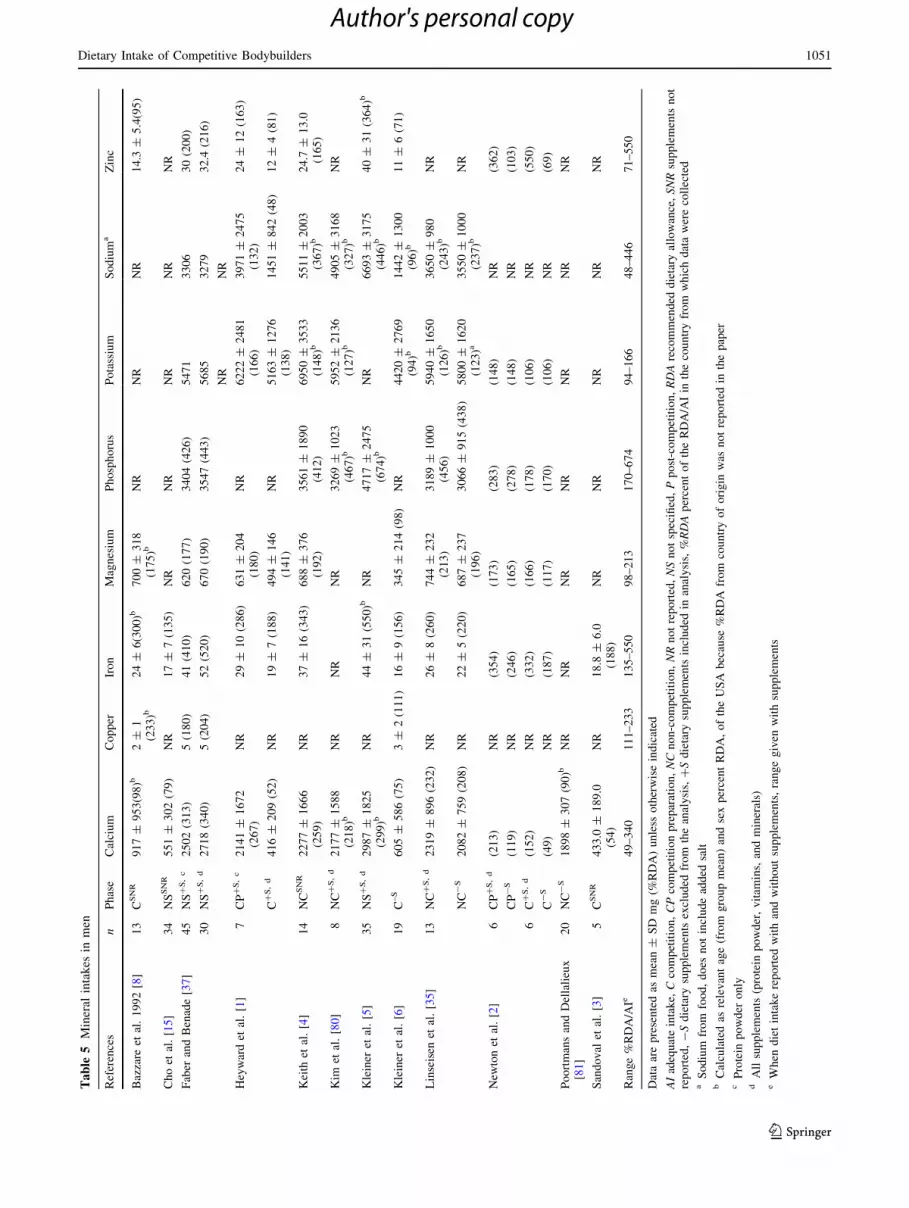
supplements included. The minerals reported by the studies
included calcium, copper, iron, magnesium, phosphorus,
potassium, sodium, and zinc. Of these nutrients, at least
one study reported intake of calcium, magnesium, potas-
sium, sodium, and zinc below the RDA (range 48–98 %
RDA). Despite this, most of the intakes were well above
the RDA (Table 5). Comparing the mineral intakes with
the US recommendations for upper limit of intake showed
that calcium and sodium (which did not include discre-
tionary use) were above the upper limit in at least one
study, and zinc was consumed around the upper limit in
one study. No studies reported the vitamin or mineral in-
takes against the estimated average requirements (EAR). A
number of studies only reported the percent of the RDA
rather than quantifying the actual micronutrient intake.
3.4.3 Dietary Supplements and Drugs in Men (Qualitative
Data)
Six of the 16 studies in men provided a qualitative de-
scription of the dietary supplements consumed, which in-
cluded protein powders/liquid, amino acids, vitamins,
minerals, and liver tablets. Five studies reported the use of
anabolic steroids in men [4–6, 35, 38], with two of these
studies dividing cohorts into participants using anabolic
agents and participants who were not [5, 38]. Other drugs
reported to be used by participants included diuretics and
laxatives [6].
3.5 Dietary Intake in Women
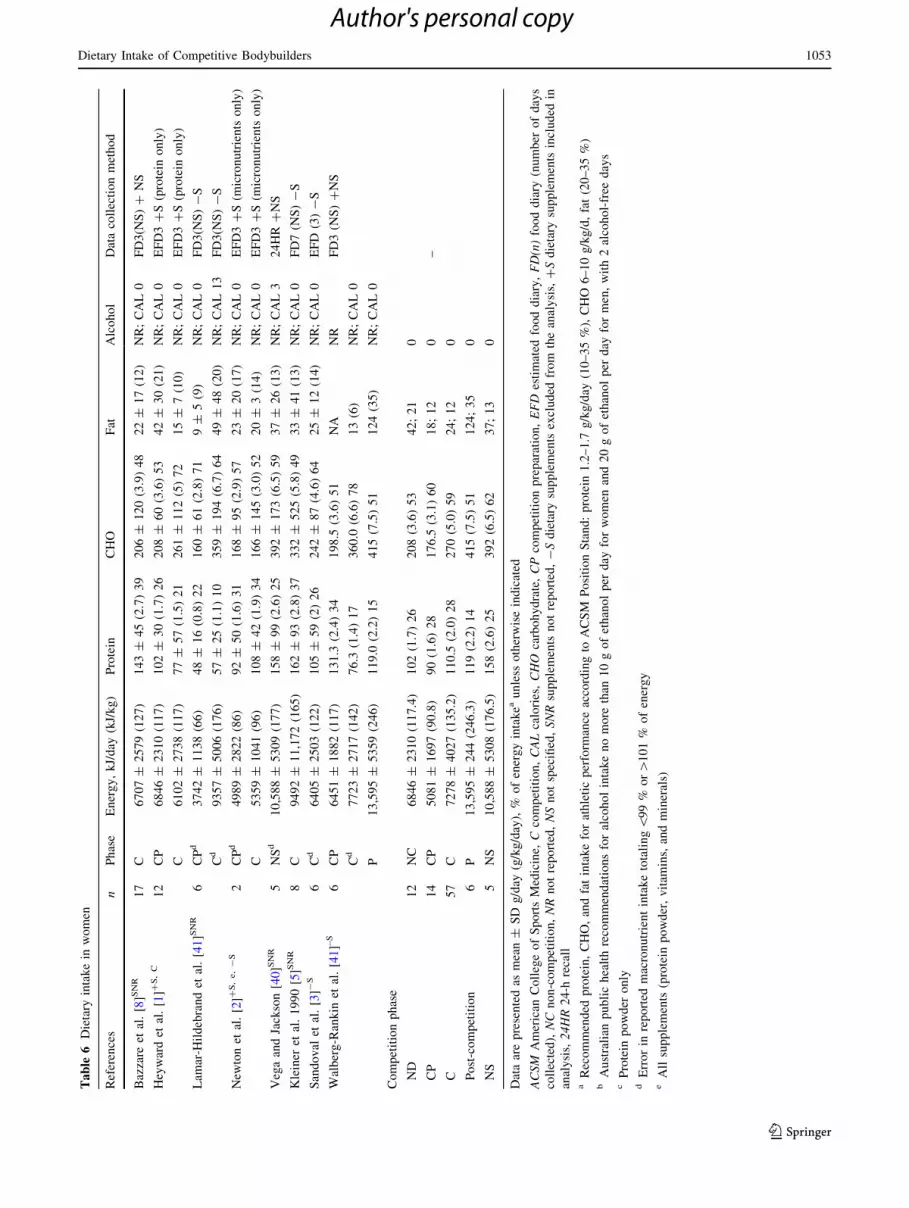
3.5.1 Energy and Macronutrient Intake in Women
The intake of energy and macronutrients for the women are
reported in Table 6, which also shows the phase when the
data was collected and whether intakes included the con-
tribution of dietary supplements. Only two of the eight
studies in women provided an analysis that included di-
etary supplements and only one of these included both
powder/liquid and pill-form supplements. Four studies
failed to specify whether supplements were included in the
analysis, and the remaining two only provided an analysis
of intake from foods consumed, omitting supplements.
Most of the participants were described in the competition
phase (n = 57), followed by competition preparation
(n = 14) and non-competition (n = 12), with a small
number of participants (n = 5) for whom the phase of
competition was not described. Again, as with the men,
limited details were provided on the types of dietary ap-
proaches or rationale used by the participants in these
phases, i.e., whether they were ‘bulking’, ‘cutting’ (see
Sect. 4.3), restricting fluids or sodium etc.; instead, just the
nutritional analysis was provided.
The energy intake in women ranged from 3742 kJ/day
(66 kJ/kg/day) through to 13,595 kJ (246 kJ/kg/day)
(Table 6). The intake varied across competition phases,
with weighted means showing it was highest in the post-
competition period (13,595 ± 244 kJ/day; 246 kJ/kg/day)
and lowest in the competition preparation phase
(5081 ± 1697 kJ/day; 91 kJ/kg/day) (Table 6). The pro-
tein intake in women ranged from 48 ± 16 g/day (0.8 g/
kg/day) to 162 ± 93 g/day (2.8 g/kg/day). The proportion
of energy from protein ranged from 10 to 39 % of energy.
Weighted means showed that the absolute intake of protein
was highest in the post-competition period (119 g/day;
2.2 g/kg) and lowest in the pre-competition period
(90 g/day; 1.6 g/kg/day) (Table 6).
Carbohydrate intake across the studies in women ranged
from 160 g/day (2.8 g/kg/day) through to 415 g/day (7.5 g/
kg/day). The proportion of energy from carbohydrate ran-
ged from 48 to 78 %. Weighted means indicated the ab-
solute intake of carbohydrate was lowest during the
competition preparation phase (176 g/day; 3.1 g/kg/day)
and highest in the post-competition phase (415 g/day;
7.5 g/kg/day) (Table 6). The intake of fat across the studies
of women ranged from 9 g/day (9 % of energy) through to
124 g/day (34.5 % of energy). Weighted means indicated
the highest intake was during the post-competition period
(124 g/day; 34.5 %) and lowest (as percent of energy)-
during competition (24 g/day; 12.2 % of energy) (Table 6).
Most studies failed to report a value for alcohol con-
sumption, so this was calculated via difference from the
sum of the proportions derived from protein, fat, and car-
bohydrate and, in most cases, was found to be zero
(Table 6). As with the data for men, this calculation was
problematic for some studies [1–3, 39], as the sum of the
percent energy contribution from protein, fat, and carbo-
hydrate exceeded 100 %, indicating the authors had made
an error in the reported data (see Table 6). Only two of the
papers in women were found (via calculation) to have an
energy contribution from alcohol, which was 3 % (non-
specified competition period) [40] and 13 % (an analysis of
competition week, which incorporated the day after com-
petition) [41] (Table 6).
3.5.2 Micronutrient Intake in Women
Vitamin intake was reported in six of the eight studies in
women (Table 7). Of these, only one study [2] provided
analysis of total intake with the contribution of supple-
ments included. Another paper [1] included the contribu-
tion of protein powders but not pill-form supplements. Two
papers failed to specify whether dietary supplements were
included in the analysis. Despite the lack of inclusion of
micronutrients from supplements in a number of the stud-
ies, intakes were generally above the RDA for most of the
1052 J. Spendlove et al.
123
Author's personal copy
Ta
ble
6Dietary
intakein
women
References
nPhase
Energy,kJ/day
(kJ/kg)
Protein
CHO
Fat
Alcohol
Datacollectionmethod
Bazzare
etal.[8]SNR
17
C6707±
2579(127)
143±
45(2.7)39
206±
120(3.9)48
22±
17(12)
NR;CAL0
FD3(N
S)?
NS
Heywardet
al.[1]?
S,C
12
CP
6846±
2310(117)
102±
30(1.7)26
208±
60(3.6)53
42±
30(21)
NR;CAL0
EFD3?S(protein
only)
C6102±
2738(117)
77±
57(1.5)21
261±
112(5)72
15±
7(10)
NR;CAL0
EFD3?S(protein
only)
Lam
ar-H
ildebrandet
al.[41]SNR
6CPd
3742±
1138(66)
48±
16(0.8)22
160±
61(2.8)71
9±
5(9)
NR;CAL0
FD3(N
S)-S
Cd
9357±
5006(176)
57±
25(1.1)10
359±
194(6.7)64
49±
48(20)
NR;CAL13
FD3(N
S)-S
New
tonet
al.[2]?
S,e,-S
2CPd
4989±
2822(86)
92±
50(1.6)31
168±
95(2.9)57
23±
20(17)
NR;CAL0
EFD3?S(m
icronutrients
only)
C5359±
1041(96)
108±
42(1.9)34
166±
145(3.0)52
20±
3(14)
NR;CAL0
EFD3?S(m
icronutrients
only)
VegaandJackson[40]SNR
5NSd
10,588±
5309(177)
158±
99(2.6)25
392±
173(6.5)59
37±
26(13)
NR;CAL3
24HR
?NS
Kleiner
etal.1990[5]SNR
8C
9492±
11,172(165)
162±
93(2.8)37
332±
525(5.8)49
33±
41(13)
NR;CAL0
FD7(N
S)-S
Sandoval
etal.[3]-
S6
Cd
6405±
2503(122)
105±
59(2)26
242±
87(4.6)64
25±
12(14)
NR;CAL0
EFD
(3)-S
Walberg-Rankin
etal.[41]–S
6CP
6451±
1882(117)
131.3
(2.4)34
198.5
(3.6)51
NA
NR
FD3(N
S)?NS
Cd
7723±
2717(142)
76.3
(1.4)17
360.0
(6.6)78
13(6)
NR;CAL0
P13,595±
5359(246)
119.0
(2.2)15
415(7.5)51
124(35)
NR;CAL0
Competitionphase
ND
12
NC
6846±
2310(117.4)
102(1.7)26
208(3.6)53
42;21
0
CP
14
CP
5081±
1697(90.8)
90(1.6)28
176.5
(3.1)60
18;12
0–
C57
C7278±
4027(135.2)
110.5
(2.0)28
270(5.0)59
24;12
0
Post-competition
6P
13,595±
244(246.3)
119(2.2)14
415(7.5)51
124;35
0
NS
5NS
10,588±
5308(176.5)
158(2.6)25
392(6.5)62
37;13
0
Dataarepresentedas
mean±
SD
g/day
(g/kg/day),%
ofenergyintakea
unless
otherwiseindicated
ACSM
American
CollegeofSportsMedicine,
Ccompetition,CALcalories,CHO
carbohydrate,CPcompetitionpreparation,EFD
estimated
fooddiary,FD(n)fooddiary
(number
ofdays
collected),NC
non-competition,NRnotreported,NSnotspecified,SNRsupplements
notreported,-Sdietary
supplements
excluded
from
theanalysis,?Sdietary
supplements
included
in
analysis,24HR24-h
recall
aRecommended
protein,CHO,andfatintakeforathleticperform
ance
accordingto
ACSM
PositionStand:protein
1.2–1.7
g/kg/day
(10–35%),CHO
6–10g/kg/d,fat(20–35%)
bAustralian
publichealthrecommendationsforalcoholintakenomore
than
10gofethanolper
day
forwomen
and20gofethanolper
day
formen,with2alcohol-free
days
cProtein
powder
only
dErrorin
reported
macronutrientintaketotaling\99%
or[101%
ofenergy
eAllsupplements
(protein
powder,vitam
ins,andminerals)
Dietary Intake of Competitive Bodybuilders 1053
123
Author's personal copy
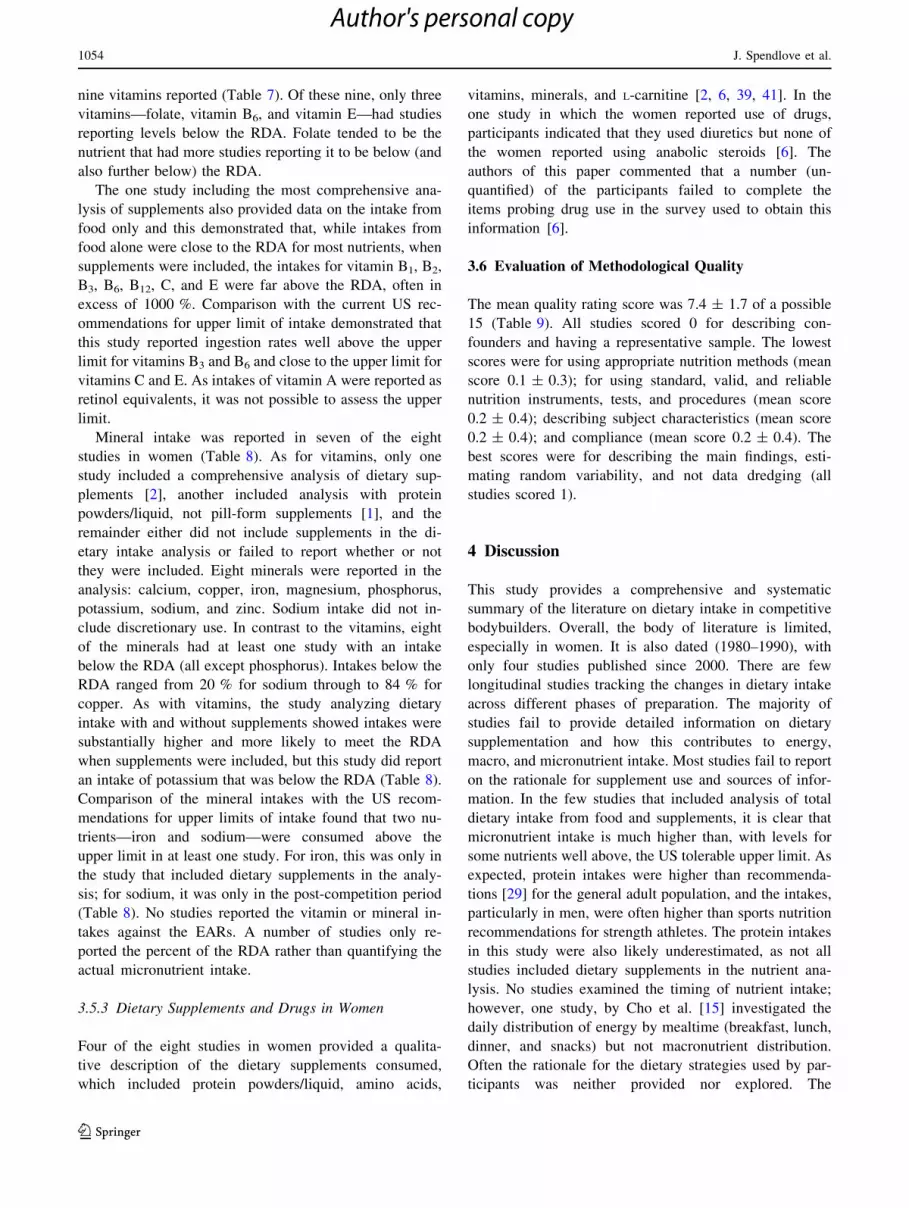
nine vitamins reported (Table 7). Of these nine, only three
vitamins—folate, vitamin B6, and vitamin E—had studies
reporting levels below the RDA. Folate tended to be the
nutrient that had more studies reporting it to be below (and
also further below) the RDA.
The one study including the most comprehensive ana-
lysis of supplements also provided data on the intake from
food only and this demonstrated that, while intakes from
food alone were close to the RDA for most nutrients, when
supplements were included, the intakes for vitamin B1, B2,
B3, B6, B12, C, and E were far above the RDA, often in
excess of 1000 %. Comparison with the current US rec-
ommendations for upper limit of intake demonstrated that
this study reported ingestion rates well above the upper
limit for vitamins B3 and B6 and close to the upper limit for
vitamins C and E. As intakes of vitamin A were reported as
retinol equivalents, it was not possible to assess the upper
limit.
Mineral intake was reported in seven of the eight
studies in women (Table 8). As for vitamins, only one
study included a comprehensive analysis of dietary sup-
plements [2], another included analysis with protein
powders/liquid, not pill-form supplements [1], and the
remainder either did not include supplements in the di-
etary intake analysis or failed to report whether or not
they were included. Eight minerals were reported in the
analysis: calcium, copper, iron, magnesium, phosphorus,
potassium, sodium, and zinc. Sodium intake did not in-
clude discretionary use. In contrast to the vitamins, eight
of the minerals had at least one study with an intake
below the RDA (all except phosphorus). Intakes below the
RDA ranged from 20 % for sodium through to 84 % for
copper. As with vitamins, the study analyzing dietary
intake with and without supplements showed intakes were
substantially higher and more likely to meet the RDA
when supplements were included, but this study did report
an intake of potassium that was below the RDA (Table 8).
Comparison of the mineral intakes with the US recom-
mendations for upper limits of intake found that two nu-
trients—iron and sodium—were consumed above the
upper limit in at least one study. For iron, this was only in
the study that included dietary supplements in the analy-
sis; for sodium, it was only in the post-competition period
(Table 8). No studies reported the vitamin or mineral in-
takes against the EARs. A number of studies only re-
ported the percent of the RDA rather than quantifying the
actual micronutrient intake.
3.5.3 Dietary Supplements and Drugs in Women
Four of the eight studies in women provided a qualita-
tive description of the dietary supplements consumed,
which included protein powders/liquid, amino acids,
vitamins, minerals, and L-carnitine [2, 6, 39, 41]. In the
one study in which the women reported use of drugs,
participants indicated that they used diuretics but none of
the women reported using anabolic steroids [6]. The
authors of this paper commented that a number (un-
quantified) of the participants failed to complete the
items probing drug use in the survey used to obtain this
information [6].
3.6 Evaluation of Methodological Quality
The mean quality rating score was 7.4 ± 1.7 of a possible
15 (Table 9). All studies scored 0 for describing con-
founders and having a representative sample. The lowest
scores were for using appropriate nutrition methods (mean
score 0.1 ± 0.3); for using standard, valid, and reliable
nutrition instruments, tests, and procedures (mean score
0.2 ± 0.4); describing subject characteristics (mean score
0.2 ± 0.4); and compliance (mean score 0.2 ± 0.4). The
best scores were for describing the main findings, esti-
mating random variability, and not data dredging (all
studies scored 1).
4 Discussion
This study provides a comprehensive and systematic
summary of the literature on dietary intake in competitive
bodybuilders. Overall, the body of literature is limited,
especially in women. It is also dated (1980–1990), with
only four studies published since 2000. There are few
longitudinal studies tracking the changes in dietary intake
across different phases of preparation. The majority of
studies fail to provide detailed information on dietary
supplementation and how this contributes to energy,
macro, and micronutrient intake. Most studies fail to report
on the rationale for supplement use and sources of infor-
mation. In the few studies that included analysis of total
dietary intake from food and supplements, it is clear that
micronutrient intake is much higher than, with levels for
some nutrients well above, the US tolerable upper limit. As
expected, protein intakes were higher than recommenda-
tions [29] for the general adult population, and the intakes,
particularly in men, were often higher than sports nutrition
recommendations for strength athletes. The protein intakes
in this study were also likely underestimated, as not all
studies included dietary supplements in the nutrient ana-
lysis. No studies examined the timing of nutrient intake;
however, one study, by Cho et al. [15] investigated the
daily distribution of energy by mealtime (breakfast, lunch,
dinner, and snacks) but not macronutrient distribution.
Often the rationale for the dietary strategies used by par-
ticipants was neither provided nor explored. The
1054 J. Spendlove et al.
123
Author's personal copy

Ta
ble
7Vitam
inintakes
inwomen
References
nPhase
Folate,lg
VitA,RE
VitB1
VitB2a
VitB3
VitB6
VitB12
VitC
VitE
Bazzare
etal.[8]
11
CSNR
NR
NR
NR
NR
NR
NR
NR
196±
168
(261)b
NR
Heywardet
al.[1]
1CP?S,C
NR
NR
1±
1
(119)
2±
1
(125)
32±
11
(250)
2±
1.0
(118)
NR
133±
80(221)
7.9
±4.0
(99)
2C?S,C
NR
NR
3±
8
(310)
1±
1
(108)
30±
16
(230)
3±
2(154)
NR
187±
109
(311)
5.5
±2.8
(68)
Lam
ar-H
ildebrandet
al.
[41]
6CPSNR
(\66)
NR
NR
NR
NR
NR
(\66)
NA
(\66)
CSNR
(\66)
NR
NR
NR
NR
NR
(\66)
NA
(\66)
New
tonet
al.[2]
2CP?S,D
(334)
(441)
(13,026)
(1106)
(1328)
(10,733)
(2084)
(2023)
(1268)
CP-S
(34)
(241)
(100)
(103)
(184)
(84)
(118)
(106)
(56)
2C?S,D
(355)
(430)
(13,036)
(13,026)
(1467)
(10,786)
(2056)
(1205)
(1267)
C-S
(47)
(190)
(92)
(100)
(311)
(106)
(344)
(140)
(55)
Sandoval
etal.[3]
6C-S
NR
NR
2±
1
(164)
3±
2
(236)
42±
22
(190)
3±
2(146)
NR
166±
103
(277)
NR
Walberg-Rankin
etal.
[41]
6CP-S
225±
101
(75)b
4945±
3652
(706)e
1±
0
(100)b
2±
1
(173)b
61±
35
(437)b
3±
2(207)b
NR
100±
42
(133)b
NR
C-S
181±
96(60)b
3247±
4480
(468)e
2±
2
(209)b
2±
1
(145)b
32±
13
(229)b
3±
1
(207)b
NR
151±
106
(201)b
NR
P-S
313±
129
(104)b
5500±
1449
(784)e
2±
1
(173)b
2±
1
(218)b
32±
10
(232)b
2±
1
(169)b
NR
111±
90
(149)b
NR
Range%RDAf
60–355
430–784
100–13,026
108–13,026
184–1328
\66–10,786
2056–2084
60–133
\66–1268
Dataarepresentedas
mean±
SD
mg(%
RDA)unless
otherwiseindicated
Ccompetition,CPcompetitionpreparation,NRnotreported,Ppost-competition,RDArecommended
dietary
allowance,REretinolequivalent,SD
standarddeviation,SNRsupplementsnot
reported,?Sdietary
supplementsincluded
inanalysis,-Sdietary
supplementsexcluded
from
theanalysis,vitvitam
in,%RDApercentoftheRDAin
thecountryfrom
whichdatawerecollected
aNiacin,notniacinequivalents
bCalculatedas
relevantage(from
groupmean)andsex%RDA
oftheUSA
because
%RDA
from
countryoforigin
was
notreported
inthepaper
cProtein
powder
only
dAllsupplements
(protein
powder,vitam
ins,andminerals)
eGiven
asretinolequivalents
fWhen
dietintakereported
withandwithoutsupplements,rangegiven
withsupplements
Dietary Intake of Competitive Bodybuilders 1055
123
Author's personal copy

Ta
ble
8Mineral
intakes
inwomen
References
nPhase
Calcium
Copper
Iron
Magnesium
Phosphorus
Potassium
Sodium
aZinc
Bazzare
etal.[8]
11
CSNR
418±
198(42)b
1±
1
(122)b
17±
10
(91.6)b
424±
158
(137)b
NR
NR
NR
9±
5(114)b
Heywardet
al.[1]
12
NC?S,C
705±
390(88)
NR
14±
4(78)
304±
103(101)
NR
3028±
1139
(81)
1920±
1204(64)
9±
4(62)
C?S,C
272±
140(34)
NR
11±
5(63)
280±
168(93)
NR
3561±
1498
(95)
603±
458(20)
8±
5(50)
Kleiner
etal.[6]
8C-S
293±
231(36)
2±
1(84)
24±
40(160)
254±
107(91)
NR
2931±
1392
(62)b
1874±
2585
(125)b
9±
5(75)
Lam
ar-H
ildebrandet
al.
[41]
6CPSNR
348±
213(34.8)b
NR
12±
4(66.7)b
NR
NR
NR
NR
(\66)
CSNR
709±
662(\66)
NR
12±
6(66.7)b
NR
NR
NR
NR
(\66)
New
tonet
al.[2]
2CP?S,D
(163)
NR
(347)
(250)
(140)
(70)
NR
(260)
CP-S
(45)
NR
(59)
(83)
(116)
(64)
NR
(57)
2C?S,D
(169)
NR
(363)
(256)
(154)
(77)
NR
(250)
C-S
(49)
NR
(70)
(87)
(140)
(66)
NR
(57)
Sandoval
etal.[3]
6C-S
478.0
±339.0
(60)
NR
14±
5(76)
NR
NR
NR
NR
NR
Walberg-Rankin
etal.[41]
6CP-S
473.7
±306.5
(47)b
1±
1
(133)b
14±
4(76.1)b
251±
118(81)b
NR
NR
1741±
884(116)b
7±
3(85)b
C-S
280.1
±121.0
(28)
2±
1
(200)b
18±
6(101)b
298±
112
(96.2)b
NR
NR
1554±
1768
(104)b
5±
2(66)b
P-S
1262.3
±572.8
(126)b
2±
1(199)
19±
5(108)b
306±
94(99)b
NR
NR
4540±
1910
(303)b
12±
6
(154)b
RangeRDA/AI%
e28–169
84–211
63–347
81–137
140–154
62–95
20–255
50–134
Dataarepresentedas
mean±
SD
mg(%
RDA)unless
otherwiseindicated
AIadequateintake,
Ccompetition,CPcompetitionpreparation,NRnotreported,Ppost-competition,RDArecommended
dietary
allowance,SD
standarddeviation,SNRsupplements
not
reported,-Sdietary
supplements
excluded
from
theanalysis,?Sdietary
supplements
included
inanalysis,%RDApercentoftheRDA/AIin
thecountryfrom
whichdatawerecollected
aSodium
from
food,does
notincludeadded
salt
bCalculatedas
relevantage(from
groupmean)andsex%
RDA
oftheUSA
because
%RDA
from
countryoforigin
was
notreported
inthepaper
cProtein
powder
only
dAllsupplements
(protein
powder,vitam
ins,andminerals)
eWhen
dietintakereported
withandwithoutsupplements,rangegiven
withsupplements
1056 J. Spendlove et al.
123
Author's personal copy
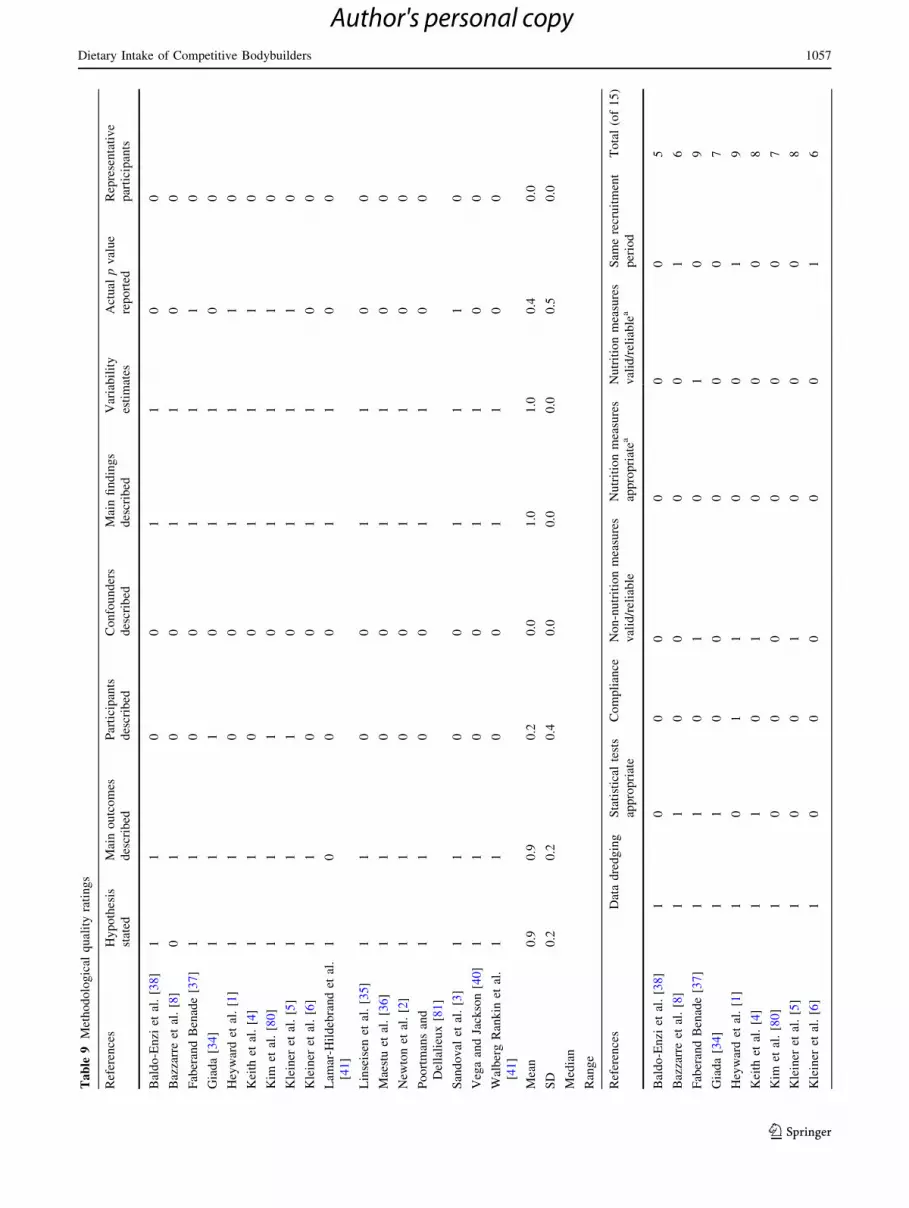
Ta
ble
9Methodological
qualityratings
References
Hypothesis
stated
Mainoutcomes
described
Participants
described
Confounders
described
Mainfindings
described
Variability
estimates
Actual
pvalue
reported
Representative
participants
Baldo-Enzi
etal.[38]
11
00
11
00
Bazzarreet
al.[8]
01
00
11
00
FaberandBenade[37]
11
00
11
10
Giada[34]
11
10
11
00
Heywardet
al.[1]
11
00
11
10
Keith
etal.[4]
11
00
11
10
Kim
etal.[80]
11
10
11
10
Kleiner
etal.[5]
11
10
11
10
Kleiner
etal.[6]
11
00
11
00
Lam
ar-H
ildebrandet
al.
[41]
10
00
11
00
Linseisen
etal.[35]
11
00
11
00
Maestuet
al.[36]
11
00
11
00
New
tonet
al.[2]
11
00
11
00
Poortmansand
Dellalieux[81]
11
00
11
00
Sandoval
etal.[3]
11
00
11
10
VegaandJackson[40]
11
00
11
00
WalbergRankin
etal.
[41]
11
00
11
00
Mean
0.9
0.9
0.2
0.0
1.0
1.0
0.4
0.0
SD
0.2
0.2
0.4
0.0
0.0
0.0
0.5
0.0
Median
Range
References
Datadredging
Statistical
tests
appropriate
Compliance
Non-nutritionmeasures
valid/reliable
Nutritionmeasures
appropriatea
Nutritionmeasures
valid/reliablea
Sam
erecruitment
period
Total(of15)
Baldo-Enzi
etal.[38]
10
00
00
05
Bazzarreet
al.[8]
11
00
00
16
FaberandBenade[37]
11
01
01
09
Giada[34]
11
00
00
07
Heywardet
al.[1]
10
11
00
19
Keith
etal.[4]
11
01
00
08
Kim
etal.[80]
10
00
00
07
Kleiner
etal.[5]
10
01
00
08
Kleiner
etal.[6]
10
00
00
16
Dietary Intake of Competitive Bodybuilders 1057
123
Author's personal copy

methodological quality of the studies was poor, and several
were identified as reporting data with obvious analysis
errors in the nutrient intakes [1–3, 34, 39]. This review
highlights that contemporary, high-quality research on di-
etary intake in bodybuilders is needed.
4.1 Anthropometry, Body Composition, and use
of Anabolic Agents
As expected, the participants included in the studies were
lean with percent body fat below 11 % for women
(8.4–11.1) and 17 % for men (4.1–17.0). The caliber of
bodybuilders was not well described, and fewer studies
report on national or internationally representative com-
petitors. A number also failed to nominate the phase of
preparation during which the data were collected. This is
likely why the studies in women appear to have an upper
range of body fat lower than that of the men. However, in
studies reporting both competition preparation and com-
petition phases, there was a clear and often substantial
reduction in both body mass and fat of approximately
3–6 kg and 4–7 %, respectively (Tables 1, 2) that occurred
in the preparation for competition. All four of the papers in
women [1–3, 6] that quantified body fat percentage in the
week of competition reported mean body fat percentages
below the estimated minimum level of body fat (12 %) as
per the American College of Sports Medicine guidelines [9,
29]. Two of the six male competition week papers reported
a mean body fat percentage below the estimated minimum
level of body fat compatible with long-term health out-
comes (5 %) [10, 29]. Few of the studies reported the use
of anabolic agents; however, in one of the two studies [8]
reporting on participants who used versus those who did
not use anabolic steroids, body mass was substantially
higher in those bodybuilders using steroids.
The men, as expected, were substantially heavier than
the women, with a weighted mean body mass of ap-
proximately 84 versus 54 kg for the women. These body
masses are below what is typically seen in winners of
Mr. and Ms. Olympia where men typically weigh in
excess of 120 kg [9, 10] and women 60 kg [42]. As
stated above, range of competition caliber (and inclusion
of only one study with internationally competitive par-
ticipants) likely explains the lower mass seen in the in-
cluded studies. Most of the studies failed to report the
weight category (if any) for which competitors were
aiming; details on this would have been useful to provide
context to the anthropometric data. It is also important to
consider that the manuscripts are dated, and the mean
body mass of competitors in professional competitions
post the year 2000 is reported to be greater than in the
1980s and 1990s, when most of the included studies were
published [10, 42].Ta
ble
9continued
References
Datadredging
Statistical
tests
appropriate
Compliance
Non-nutritionmeasures
valid/reliable
Nutritionmeasures
appropriatea
Nutritionmeasures
valid/reliablea
Sam
erecruitment
period
Total(of15)
Lam
ar-H
ildebrandet
al.[41]
10
00
00
15
Linseisenet
al.[35]
11
01
11
09
Maestuet
al.[36]
11
01
00
07
New
tonet
al.[2]
11
01
00
18
PoortmansandDellalieux[81]
11
11
10
09
Sandoval
etal.[3]
11
11
01
111
VegaandJackson[40]
11
00
00
17
WalbergRankin
etal.[41]
10
00
00
05
Mean
1.0
0.6
0.2
0.5
0.1
0.2
0.4
7.4
SD
0.0
0.5
0.4
0.5
0.3
0.4
0.5
1.7
Median
7
Range
5–11
SD
standarddeviation
aFrom
theAustralian
Departm
entofHealth[23]
1058 J. Spendlove et al.
123
Author's personal copy

4.2 Energy Intake
The absolute energy intake of the male bodybuilders
(10–16 MJ/day;[13 MJ/day except for competition) was
substantially higher than that reported in a study of male
Australian Olympic athletes where mean absolute energy
intake was around 13 MJ/day (166 kJ/kg/day) [43]. Com-
pared with the energy intake of Australian Rugby League
players, that of the bodybuilders was closer to the higher
end, with a reported mean of 17 MJ/day [44]. In terms of
kJ/kg/day, the intake of the bodybuilders was at least
similar and typically higher across all phases except the
competition phase, where it was substantially lower
(123 kJ/kg/day) than that of the male Olympic athletes
[43]. In the women bodybuilders, weighted mean absolute
energy intake ranged from 5 to 10.5 MJ/day (91–176 kJ/
kg/day). In the same study of Olympic athletes reported
above [43], the female Olympians had an average absolute
energy intake of 9 MJ/day (144 kJ/kg/day) [43], which was
within a similar range to that of the female bodybuilders in
this study. Lack of empirical data on energy requirements
of resistance training makes it difficult to assess the energy
needs of bodybuilders. Unfortunately, accurately quanti-
fying the energy expenditure of a heavy resistance training
session is challenging [45–48].
In the current study, energy intakes in the men were
greater during the non-competition phase, where they
would typically undertake ‘bulking’, and lowest in the
competition phase, where the ‘cutting’ occurs (Table 3). In
the women, lowest intakes were during the competition
preparation phase (Table 4). Given the extreme changes in
training practices across the training phases, dietary needs
are of utmost importance when aiming to achieve a com-
petitive physique [49]. Unfortunately, the level of detail in
the papers in this review prohibits a comprehensive
evaluation of the dietary strategies used across the different
phases and how dietary supplements (and in some cases
drugs) and training were incorporated to manipulate energy
balance.
4.3 Macronutrient Intake
4.3.1 Protein Intake
The macronutrient intakes of the bodybuilders were gen-
erally what was expected, with a protein intake either
similar to or higher than the recommendation of 1.2–1.7 g/
kg/day for strength-training athletes [29]. The protein in-
takes in men did not fall below 2 g/kg/day and peaked at
4.3 g/kg/day. The intakes of the women were lower and
often below 2 g/kg/day, with the highest intake being
2.8 g/kg/day. The weighted mean protein intakes tended to
be higher than those reported in the abovementioned study
of male and female Australian Olympic athletes (1.7 and
1.3 g/kg/day, respectively) [43].
Research has emerged, particularly over the past
10–15 years, that supports the benefit of a higher protein
intake in athletes than is recommended for sedentary in-
dividuals [29]. Rather than an absolute need or require-
ment, protein intake in athletes could be considered within
the context of supporting optimal development of muscle
mass [50], clearly a desirable outcome for bodybuilders.
Both acute [51] and longitudinal training studies [52, 53]
support the benefit of the timing of protein intake around
resistance training sessions, with the strongest support for
ingestion of 20–25 g of high biological value protein (e.g.,
dairy, egg or lean meat) within 2 h post-training [54]. High
biological value proteins that contain all of the essential
amino acids have been shown to be superior [54], with
strong support available for dairy proteins such as whey,
with a high leucine content [55]. Up-regulation of muscle
protein synthesis has been found to be particularly re-
sponsive to signaling driven predominantly by leucine [55].
Notably, none of the studies in the review focused on
timing of protein intake.
Emerging evidence also supports the benefit of regular
protein intake over the day [13]. A recent study investi-
gating the effectiveness of different protein dosing regi-
mens compared ingestion of 80 g of additional high
biological value protein distributed as either two 40 g
doses, four 20 g doses, or eight 10 g doses of protein (whey
protein isolate) within the 12 h of recovery post-resistance
training [13]. The study found the four 20 g doses were
superior for stimulating protein synthesis, a dose (as out-
lined above) similar to that found effective for optimizing
protein synthesis post-training [56]. Bodybuilders have
also been reported to use higher protein intakes to promote
proportionally greater gains in lean mass when in energy
surplus, specifically during ‘bulking’ or predominantly
mass gaining phases of training. A recent study by Bray
et al. [57] and others supports this approach, at least in non-
athletes, demonstrating that when sedentary participants
were in a 40 % energy surplus, a higher protein diet (25 %
of energy) was superior for gaining lean mass and
minimizing fat gain [compared with a low (5 %) and
normal (15 %) protein diet] [57]. Similarly, a systematic
review by Weinheimer et al. [58] and others demonstrated
superior retention of lean mass with a higher protein diet
when in energy deficit (typically used by bodybuilders
during the ‘cutting’ phase).
A number of studies in this review raised concerns re-
garding chronic higher protein intake and health, including
increased calcium excretion and risk of bone reabsorption
and detrimental effects on renal function. A recent review
[59] on higher protein diets and bone health indicates a
positive rather than a negative relationship with bone
Dietary Intake of Competitive Bodybuilders 1059
123
Author's personal copy

density [60]. Large volumes of resistance training in
bodybuilders would also be strongly protective of bone
mass [60]. Additionally, a recent review on high-protein
diets and renal function fails to support a detrimental effect
in healthy individuals without a history of renal disease
[60]. Only one study included in this review measured
renal function parameters and it found no adverse effects
on renal function.
4.3.2 Carbohydrate Intake
The carbohydrate intake of the bodybuilders in this review
was generally lower than the sports nutrition recommen-
dations of 6–10 g/kg/day [29]. Only one study in men
exceeded the 6 g of carbohydrate/kg/day, although several
in women were above this level. Carbohydrate intakes
tended to be higher in the non-competition phase, where
bodybuilders typically aim to increase lean mass (‘bulk-
ing’) but are often less concerned with the accumulation of
additional body fat [10, 42]. Carbohydrate intake tended to
be lower in the competition phase for men (weighted mean
3.8 g/kg/day) but was higher for women (weighted mean
5 g/kg/day). Again, the small sample of women (especially
in the phases other than competition) is likely not as rep-
resentative as the men. However, the intake of carbohy-
drate was not dissimilar to the previously mentioned study
on Australian Olympic athletes who were reported to
consume 5.4 g or 4.9 g/kg/day in men and women, re-
spectively [43].
One important issue with the reported intakes was the
variability in measurement days, especially over the com-
petition week. This is important for carbohydrate intake
because evidence exists that some bodybuilders use car-
bohydrate loading during the competition week to promote
a fuller muscle appearance [61]. It is also relevant that
during the 1980s and 1990s, higher carbohydrate diets were
more popular than from the early 2000s when lower car-
bohydrate diets such as Atkins became more popular in the
wider community [62]. However, carbohydrate intakes
were around 5 g/kg/day, at least in the two studies in men
published since 2010, so not as low as recommended by
Atkins [63] and the more recent Paleo diets [64]. Again, as
not all studies included supplements, the intake of carbo-
hydrates may also be underestimated.
Although direct empirical evidence is limited, at least
one study [65] has demonstrated the importance of muscle
glycogen for resistance training, showing three sets of bi-
cep curls (8–10 repetitions per set) at 80 % of one repeti-
tion max reduced local muscle glycogen content by around
35 % [65]. Haff [66] reported a significant benefit of
consuming a carbohydrate supplement versus a placebo
during resistance training, with those taking the supplement
better able to perform a greater number of sets and
repetitions. Additionally, muscle glycogen depletion in
conjunction with aerobic exercise has been found to com-
promise muscular strength performance [67]. Therefore,
resistance training performance will be enhanced when diet
or supplementation allows the maintenance of intramus-
cular glycogen stores.
4.3.3 Total Fat and Alcohol Intake
As expected, the total dietary fat intakes of the body-
builders were low and generally well below 30 % of en-
ergy intake [29]. A number of studies reported on the
higher saturated fat intake. Although individual saturated
fatty acids do not always have a negative effect on plasma
lipid levels [68, 69], some may still negatively impact
blood lipids, vascular function, blood pressure, and in-
flammation and have other detrimental health effects [69].
Use of anabolic steroids also contributes to cardiovascular
disease risk [5, 38]. Most of the papers failed to report on
alcohol intake but by difference this was nil or negligible
across the studies. High intakes of alcohol, specifically
binge drinking, has been shown as detrimental to lean mass
gain [70].
4.4 Micronutrient Intake
Micronutrient intake across the studies was often excessive,
[1000 % of the RDA, and above the tolerable upper limit,
especially when dietary supplements were included. Use of
multiple supplements increases the risk of excessive nu-
trient consumption [25]. Unfortunately, the dietary
methodology used across the studies to assess micronutri-
ent intake was weak. However, the risk of inadequate in-
take would seem low.
4.5 Dietary Supplement Intake
Most of the supplements reported in the included papers
were vitamins, minerals, protein powders/liquid, and amino
acids. However, the majority of the papers were dated, and
a wide range of newer supplements are now available. In a
recent study, male competitive bodybuilders reported using
a combination of approximately three types of supplements
during the ‘bulking’ phase (the most popular being protein
shakes, creatine, branched-chain amino acids, and glu-
tamine) and a similar number of supplements during the
‘cutting’ phase, with the exception of a moderate propor-
tion of respondents reportedly using ephedrine/caffeine-
containing products [71]. Dietary supplements probably
pose less of a threat to the health of a bodybuilder than do
anabolic steroids [26, 43, 51, 72].
1060 J. Spendlove et al.
123
Author's personal copy

4.6 Methodological Quality
The quality of the literature in this review rated poorly.
Confounding factors such as steroid use and training pro-
grams were typically not considered. Selection criteria
(inclusion and exclusion) and representativeness of the
participants was usually not adequately described. Only
two of 17 studies employed nutrition methodology appro-
priate to the outcomes reported. Many studies described
micronutrient intakes with 3-day food records, when most
micronutrients require more than 7 days for accurate
assessment (some more than a month) [73, 74]). Although
collection of self-reported dietary data is notorious [75, 76]
for under-reporting and evident in individuals with high
energy expenditure (e.g., athletes) [77–79], monitoring and
compliance was mostly not indicated. None of the studies
utilized statistical techniques, a secondary measure of di-
etary intake, or measured energy expenditure or weight
stability during recording to give an indication of internal
validity, and most did not include a referenced statement of
validity for the methodology employed.
Only seven studies specifically indicated that the ex-
pertise of qualified dietitians was utilized for dietary data
collection or analysis (although two others listed investi-
gators who were dietitians). Five studies did not indicate
computer analysis of dietary data, and nutrient intake was
presumably calculated by hand. Of five studies where er-
rors and inconsistencies were noted in Tables 3 and 4, three
collected information on foods or supplements that were
added to the main database for analysis, one collected
further information and most likely added this to the
database for analysis (although not indicated), and one
appeared to calculate nutrient intakes without the use of a
computer. These factors may have contributed to errors in
the dietary analysis.
4.7 Strengths, Limitations, and Future Directions
The strengths of this study include the systematic nature of
the search and the rigorous nature of data extraction and
quality assessment of the papers. The quality of the papers
was a major limitation. Representation of women in studies
was also inadequate. The majority of the papers failed to
adequately incorporate the contribution made by dietary
supplements. As dietary supplements are known to be used
extensively by bodybuilders, not incorporating them into
the dietary analysis, particularly those providing energy
and macronutrients, seriously compromised the accuracy of
the intakes. The phases of preparation could also only be
generally defined. As preparation time frames vary from
one bodybuilder to another, a better approach would be to
capture different dietary strategies used, i.e., ‘cutting’,
‘bulking’, ‘carbohydrate loading’, so that the parameters of
these practices can be more accurately defined. Collection
of rationale with the dietary intakes would also be useful to
better understand how and why bodybuilders take the di-
etary approaches they do. A wider variety of body com-
position assessment methods are also now available, so
these, when used in combination, may provide a better
description of participant physique.
Bodybuilding has evolved from a sport that was un-
dertaken by relatively few individuals to now incorporate a
range of newer categories with less extreme muscular de-
velopment required to be competitive. Participation has
expanded, particularly in women [22]. Little is known of
the dietary strategies of these newer bodybuilder groups.
The lack of rigor in many of the included studies clearly
indicates that a comprehensive and contemporary descrip-
tion of the dietary practices of the traditional categories of
bodybuilding is still needed.
Greater involvement of more individuals in bodybuild-
ing and the wider use of resistance training to optimize
health, athletic performance, and rehabilitation, and for the
management of a range of diseases, brings the community
in closer contact with bodybuilders. Clearly, bodybuilders
have pioneered a number of highly effective dietary
strategies for optimizing the development of lean mass and
reducing body fat. Some of these strategies, particularly
those revolving around the timing and dosing of high-
quality proteins are translatable to elite athletes and the
wider community. However, we also need to understand
the translation of some of the riskier practices of body-
builders, which include the use of drugs and multiple
supplements (which may also contain prohibited sub-
stances), which filters out into the community, including to
elite athletes and adolescents.
5 Conclusion
This review demonstrates a number of research gaps and
weaknesses in the current literature. It highlights that
bodybuilders have a strong commitment to dietary ma-
nipulation and that many of the strategies used have been
‘ahead of the science’. A deeper and rigorous approach to
evaluating the dietary strategies of bodybuilders would
inform future research that may benefit groups other than
bodybuilders who aim to increase lean mass and reduce
body fat. This review supports that high-quality contem-
porary research is needed in this area.
Acknowledgments The authors would like to acknowledge funding
support of Sports Dietitians Australia, which assisted in the prepa-
ration of this manuscript. The authors declare that there are no con-
flicts of interest that are directly relevant to the context of this review.
Dietary Intake of Competitive Bodybuilders 1061
123
Author's personal copy

References
1. Heyward VH, Sandoval WM, Colville BC. Anthropometric, body
composition and nutritional profiles of body builders during
training. J Appl Sport Sci Res. 1989;3(2):22–9.
2. Newton LE, Hunter G, Bammon M, et al. Changes in psycho-
logical state and self-reported diet during various phases of
training in competitive bodybuilders. J Strength Cond Res.
1993;7(3):153–8.
3. Sandoval WM, Heyward VH, Lyons TM. Comparison of body
composition, exercise and nutritional profiles of female and male
body builders at competition. J Sports Med Phys Fit.
1989;29(1):63–70.
4. Keith RE, Stone MH, Carson RE, et al. Nutritional status and
lipid profiles of trained steroid-using bodybuilders. Int J Sport
Nutr. 1996;6(3):247–54.
5. Kleiner SM, Calabrese LH, Fiedler KM, et al. Dietary influences
on cardiovascular disease risk in anabolic steroid-using and
nonusing bodybuilders. J Am Coll Nutr. 1989;8(2):109–19.
6. Kleiner SM, Bazzarre TL, Litchford MD. Metabolic profiles, diet,
and health practices of championship male and female body-
builders. J Am Diet Assoc. 1990;90(7):962–7.
7. History of bodybuilding; 2014. http://historyofbodybuilding.org.
Accessed 05 March 2014.
8. Bazzarre TL, Kleiner SM, Ainsworth BE. Vitamin C intake and
lipid profiles of competitive male and female bodybuilders. Int J
Sport Nutr. 1992;2(3):260–71.
9. Constantinescu R. Quantitative analysis and rank prediction for
Mr. Olympia contest. Body Build Sci J. 2010;2(4):57.
10. Kennedy RH. Encyclopedia of bodybuilding: the complete A–Z
book on muscle building. 21st century edn. Toronto: Robert
Kennedy Publishing; 2008.
11. Dutton KR, Laura RS. Towards a history of bodybuilding. Sport
Tradit. 1989;6(1):25–41.
12. Applegate EA, Grivetti LE. Search for the competitive edge: a
history of dietary fads and supplements. J Nutr.
1997;127:8695–735.
13. Areta JL, Burke LM, Ross ML, et al. Timing and distribution of
protein ingestion during prolonged recovery from resistance ex-
ercise alters myofibrillar protein synthesis. J Physiol.
2013;591(9):2319–31.
14. Kutscher EC, Lund BC, Perry PJ. Anabolic steroids. Sports Med.
2002;32(5):285–96.
15. Cho S, Lee H, Kim K. Physical characteristics and dietary pat-
terns of strength athletes; bodybuilders, weight Lifters. Kor J
Community Nutr. 2007;12(6):864–72.
16. Philen RM, Oritz DI, Auerbach SB, et al. Survey of advertising
for nutritional supplements in health and bodybuilding maga-
zines. JAMA. 1992;268(8):1008–11.
17. Cribb PJ, Williams AD, Carey MF, et al. The effect of whey
isolate and resistance training on strength, body composition and
plasma glutamine. Int J Sport Nutr Exerc Metab.
2006;16:494–509.
18. Goston JL, Correia MITD. Intake of nutritional supplements
among people exercising in gyms and influencing factors.
Nutrition. 2010;26:604–11.
19. Paddon-Jones D, Rasmussen BB. Dietary protein recommenda-
tions and the prevention of sarcopenia. Curr Opin Clin Nutr
Metab Care. 2009;12(1):86–90.
20. Esmarck B, Andersen JL, Olsen S, et al. Timing of postexercise
protein intake is important for muscle hypertrophy with resistance
training in elderly humans. J Physiol. 2001;535(1):301–11.
21. INBA World Headquarters—History; 2014. http://www.
naturalbodybuilding.com/pages/pages/history.php. Accessed 30
April 2014.
22. International Natural Bodybuilding Association. INBA—Results;
2014. https://www.inba.com.au/index.php?option=com_content
&task=view&id=30&Itemid=57. Accessed 30 April 2014.
23. Australian Government Department of Health. Australia;s phy-
sical activity and sedentary behaviour guidelines for adults
(18–64 years). Australian Government Department of Health,
Canberra; 2014. http://www.health.gov.au/internet/main/
publishing.nsf/content/health-pubhlth-strateg-phys-act-guidelines
#apaadult. Accessed 15 Jan 2014.
24. Giampreti A, Lonati D, Locatelli C, et al. Acute neurotoxicity
after yohimbine ingestion by a bodybuilder. Clin Toxicol.
2009;47:827–9.
25. Grunwald KK, Bailey RS. Commercially marketed supplements
for bodybuilding athletes. Sports Med. 1993;15(2):90–103.
26. Prosser JM, Majlesi N, Chan GM, et al. Adverse effects associ-
ated with arginine alpha-ketoglutarate containing supplements.
Hum Exp Toxicol. 2009;28:259–62.
27. Liberati A, Altman DG, Tetzlaff J, et al. The PRISMA statement
for reporting systematic reviews and meta-analyses of studies that
evaluate health care interventions: explanation and elaboration.
Ann Intern Med. 2009;15(4):65–94.
28. Mann J, Truswell S. Essentials of human nutrition. 3rd ed. Ox-
ford: Oxford University Press; 2007.
29. Rodriguez NR, Di Marco MN, Langley S, et al. American Col-
lege of Sports Medicine position stand. Nutrition and athletic
performance. Med Sci Sports Exerc. 2009;41(3):709–31.
30. US Department of Agriculture. Dietary reference intakes (DRIs):
estimated average requirements; 2011.http://www.iom.edu/
Activities/Nutrition/SummaryDRIs/*/media/Files/Activity%20
Files/Nutrition/DRIs/5_Summary%20Table%20Tables%201-4.
pdf. Accessed 30 April 2014.
31. Downs S, Black N. The feasibility of creating a checklist for the
assessment of the methodological quality both of randomised and
non-randomised studies of health care Interventions. J Commu-
nity Health. 1998;52:377–84.
32. Academy of Nutrition and Dietetics. Evidence analysis manual:
steps in the academy evidence analysis process. Chicago: Acad
Nutr Diet; 2012.
33. Monteiro JCV, Pimentel GD, Sousa MV. Relationship between
body mass index with dietary fiber intake and skinfolds-differ-
ences among bodybuilders who train during morning and noc-
turne period. Nutr Hosp. 2012;27(3):929–35. doi:10.3305/nh.
2012.27.3.5578.
34. Giada F, Zuliani G, Baldo-Enzi G, et al. Lipoprotein profile, diet
and body composition in athletes practicing mixed an anaerobic
activities. J Sports Med Phys Fit. 1996;36(3):211–6.
35. Linseisen J, Metges CC, Wolfram G. Dietary habits and serum
lipids of a group of German amateur body-builders. Z Er-
nahrungswiss. 1993;32(4):289–300.
36. Maestu J, Eliakim A, Jurimae J, et al. Anabolic and catabolic
hormones and energy balance of the male bodybuilders during the
preparation for the competition. J Strength Cond Res.
2010;24(4):1074–81.
37. Faber M, Benade AJ. Nutrient intake and dietary supplementation
in body-builders. S Afr Med J. 1987;72(12):831–4.
38. Baldo-Enzi G, Giada F, Zuliani G, et al. Lipid and apoprotein
modifications in body builders during and after self-administra-
tion of anabolic steroids. Metabolism. 1990;39(2):203–8.
39. Walberg-Rankin J, Edmonds CE, Gwazdauskas FC. Diet and
weight changes of female bodybuilders before and after compe-
tition. Int J Sport Nutr. 1993;3(1):87–102.
40. Vega F, Jackson RT. Dietary habits of bodybuilders and other
regular exercisers. Nutr Res. 1996;16(1):3–10. doi:10.1016/0271-
5317(95)02054-3.
1062 J. Spendlove et al.
123
Author's personal copy

41. Lamar-Hildebrand N, Saldanha L, Endres J. Dietary and exercise
practices of college-aged female bodybuilders. J Am Diet Assoc.
1989;89(9):1308–10.
42. Richardson N. Introduction to part 1: ‘‘What is the practice’’ of
body building? In: Locks A, Richardson N, editors. Critical
readings in bodybuilding. London: Routledge; 2013.
43. Burke LM, Slater G, Broad EM, et al. Eating patterns and meal
frequency of elite Australian athletes. Int J Sport Nutr Exerc
Metab. 2003;13:521–38.
44. Lundy B, O’Connor H, Pelly F, et al. Anthropometric charac-
teristics and competition dietary intakes of professional rugby
league players. Int J Sport Nutr Exerc Metab.
2006;16(2):199–213.
45. Beckham S, Earnest C. Metabolic cost of free weight circuit
weight training. J Sports Med Phys Fit. 2000;40:118–25.
46. Bloomer R. Energy cost of moderate-duration resistance and
aerobic exercise. J Strength Cond Res. 2005;19:878–82.
47. Haddock BL, Wilkin LD. Resistance training volume and post
exercise energy expenditure. Int J Sports Med. 2006;27:143–8.
48. Mazzetti S, Douglass M, Yocum A, et al. Effect of explosive
versus slow contraction and exercise intensity on energy expen-
diture. Med Sci Sports Exerc. 2007;39:1291–301.
49. Lambert CP, Frank LL, Evans WJ. Macronutrient considerations
for the sport of bodybuilding. Sports Med. 2004;34(5):317–27.
50. Phillips S. Protein requirements and supplementation in strength
sports. Nutrition. 2004;20:689–95.
51. RasmussenBB, TiptonKD,Miller SI. An oral essential amino acid-
carbohydrate supplement enhances muscle protein anabolism after
resistance exercise. J Appl Physiol. 2000;88:386–92.
52. Esmark B, Anderson JL, Olsen S. Timing of post exercise protein
intake is important for muscle hypertrophy with resistance
training in elderly humans. J Physiol. 2001;535:301–11.
53. Holm L, Esmark B, Mizuno M. The effect of protein and car-
bohydrate supplementation on strength training outcome of re-
habilitation in ACI patients. J Orthop Res. 2006;24:2114–23.
54. Phillips S. Defining optimum intakes for athletes in sports nu-
trition. Chichester: Wiley Blackwell Publishing; 2014. p. 136–46.
55. Tang JE, Phillips SM. Maximizing muscle protein anabolism: the
role of protein quality. Curr Opin Clin Nutr Metab Care.
2009;12:66–71.
56. Moore D, Robinson M, Fry J, et al. Ingested protein dose re-
sponse of muscle and albumin protein synthesis after resistance
exercise in young men. Am J Clin Nutr. 2009;89:161–8.
57. Bray G, Smith S, De J. Effect of dietary protein content on weight
gain, energy expenditure and body composition during overeat-
ing: a randomised controlled trial. JAMA. 2012;307:45–55.
58. Weinheimer EM, Sands LP, Campbell WW. A systematic review
of the separate and combined effects of energy restriction and
exercise on fat-free mass in middle-aged and older adults: im-
plications for sarcopenic obesity. Nutr Rev. 2010;68(7):375–88.
59. Bonjour JO. Dietary protein: an essential nutrition for bone
health. J Am Coll Nutr. 2005;24:S26S–36S.
60. Calvez J, Pourin N, Chesneau C. Protein intake, calcium balance
and health consequences. Eur J Clin Nutr. 2012;66:281–95.
61. Balon TW, Horowitz JF, Fitzsimmons KM. Effects of carbohy-
drate loading and weight-lifting on muscle girth. Int J Sport Nutr.
1992;2:328–34.
62. Astrup A, Larsen TM, Harper A. Atkins and other low-carbo-
hydrate diets: hoax or an effective tool for weight loss? Lancet.
2004;364(9437):897–9.
63. Atkins RC. Dr Atkins’ new diet revolution. New York: Harper
Collins; 2009.
64. Cordain L. The Paleo diet: lose weight and get healthy by eating
the foods you were designed to eat. New York: Houghton Mifflin
Harcourt; 2010.
65. Macdougal JD, Ray S, Sale D. Muscle metabolism during in-
tense, heavy-resistance exercise. Eur J Appl Physiol.
1999;55:209–15.
66. Haff GG. The effect of carbohydrate supplementation on multiple
sessions and bouts of resistance exercise. J Strength Cond Res.
1999;13(2):111–7.
67. Leveritt M, Abernathy PJ. Effects of carbohydrate restriction on
strength performance. J Strength Cond Res. 1999;13(1):52–7.
68. Astrup A, Dyerberg J, Elwood P. The role of reducing intakes of
saturated fat in the prevention of cardiovascular disease: where
does the evidence stand in 2010? Am J Clin Nutr.
2011;93(4):684–8.
69. Iggman D, Riserus U. Role of different dietary saturated fatty
acids for cardiometabolic risk. J Clin Lipidol. 2011;6(2):209–23.
70. Parr EB, Camera DM, Areta JL, et al. Alcohol ingestion impairs
maximal post-exercise rates of myofibrillar protein synthesis
following a single bout of concurrent training. PLoS One.
2014;9(2):1–9.
71. Hackett D, Johnson NA, Chow C. Training practices and er-
gogenic aids used by male bodybuilders. J Strength Cond Res.
2013;27(6):1609–17.
72. Reports C. Alert: protein drinks; 2010. http://www.
consumerreports.org. Accessed 27 Apr 2014
73. Basiotis P, Welsh S, Cronin F. Number of days of food-intake
records required to estimate individual and group nutrient intakes
with defined confidence. J Nutr. 1987;117:1638–41.
74. Nelson M, Black AE, Morris JA, Cole TJ. Between-and within-
subject variation in nutrient intake from infancy to old-age: es-
timating the number of days required to rank dietary intakes with
desired precision. Am J Clin Nutr. 1989;50(1):155–67.
75. Hill R, Davies P. The validity of self-reported energy intake as
determined using the doubly labelled water technique. Br J Nutr.
2001;85:415–30.
76. Trabulsi J, Schoeller D. Evaluation of dietary assessment in-
struments against doubly labeled water, a biomarker of habitual
energy intake. Am J Physiol Endocrinol Metab.
2001;281:E891–9.
77. Barnard J, Tapsell L, Davies P, et al. Relationship of high energy
expenditure and variation in dietary intake with reporting accu-
racy on 7 day food records and diet histories in a group of healthy
adult volunteers. Eur J Clin Nutr. 2002;56(4):358–67.
78. Carlsohn A, Scharhag-Rosenberger F, Schapp L. Validity of the
determination of energy input from a dietary record in persons of
normal weight - dependence on the level of energy input com-
parison between elite sportsmen with very high energy intake and
a control group of persons of normal weight. Ernahrungs Um-
schau. 2012;59:572–7.
79. Rush E, Plank L, Laulu M. Accuracy of dietary energy reporting
in young New Zealand men and women: relationships to body
composition, physical activity level and ethnicity. Int J Body
Compos Res. 2004;2:125–30.
80. Kim H, Lee S, Ryowon C. Metabolic response to high protein
diet in Korean elite bodybuilders with high-intensity resistance
exercise. J Int Soc Sports Nutr. 2011;8:10.
81. Poortmans J, Dellalieux O. Do regular high protein diets have
potential health risks on kidney function in athletes? Int J Sport
Nutr Exerc Metab. 2000;10:28–38.
Dietary Intake of Competitive Bodybuilders 1063
123
Author's personal copy