factors influencing competitive advantage within
TRANSCRIPT
FACTORS INFLUENCING COMPETITIVE ADVANTAGE WITHIN
THE BEER MANUFACTURING SECTOR IN KENYA: A CASE
STUDY OF EAST AFRICA BREWERIES LIMITED
BY
RACHAEL WAMBUI NJOGU
UNITED STATES INTERNATIONAL UNIVERSITY-AFRICA
SPRING 2019
FACTORS INFLUENCING COMPETITIVE ADVANTAGE WITHIN
THE BEER MANUFACTURING SECTOR IN KENYA: A CASE
STUDY OF EAST AFRICA BREWERIES LIMITED
BY
RACHAEL WAMBUI NJOGU
A Research Project Report Submitted to the Chandaria School of Business in Partial
Fulfillment of the Requirement for the Degree of Masters in Business
Administration (MBA)
UNITED STATES INTERNATIONAL UNIVERSITY-AFRICA
SPRING 2019
ii
STUDENT’S DECLARATION
I, the undersigned, declare that this is my original work and has not been submitted to any
other college, institution or university other than the United States International
University-Africa for academic credit.
Signed: _____________________________ Date: _________________________
Rachael Wambui Njogu (ID No: 633585)
This research project report has been presented for examination with my approval as the
appointed supervisor.
Signed: _____________________________ Date: _________________________
Prof. Peter Lewa
Signed: _____________________________ Date: _________________________
Dean, Chandaria School of Business
iii
COPYRIGHT
Copyright © Rachael Wambui Njogu, 2019.
All rights reserved. No part of this research project report may be produced or transmitted
in any form or by any means, electronic, mechanical, including photocopying, recording
or any information storage without prior written permission from the author.
iv
ABSTRACT
This study examined the factors that influence competitive advantage within the beer
manufacturing sector in Kenya with a focus on East Africa Breweries Limited (EABL).
The study was guided by the following research questions: what is the influence of
organizational factors on the firm’s competitive advantage? how do organizational
capabilities provide the firm with competitive advantage? and what is the influence of
organizational strategies on the firm’s competitive advantage?
The study was modelled on a descriptive design. The population of the study was all staff
that worked in all the departments at EABL who were 50 in total. The sample frame
involved employees in EABL and was obtained from the human resource office in
Ruaraka. Census method was used in the study, thus the sample size for the study was all
the 50 employees. Primary data was collected using self-administered questionnaire
which was piloted for reliability and consistency. Data was analyzed using descriptive
statistics. Percentages were used to analyze the study and gave presentations of how many
respondents agreed to a particular item within the questionnaire. Means were used to
weigh the strength/ significance of the rated items in the questionnaire. Standard
deviations were also employed to examine the difference among the responses that were
obtained from the population. Inferential analysis of correlations and regressions were
used in the study. Analyzed data was presented using tables and figures.
The study revealed that EABL has a management training structure in place that
facilitates the development of competence skills, as well as evaluation systems that ensure
its standards are maintained. The firm’s current assets and liabilities are well managed in
order to determine short-term financial performance, and its competition in the market is
not large enough to affect its market, because the firm has leveraged on technology to
adapt quickly to its changing conditions and environment.
The study indicated that EABL has ensured that all its employees are doing the right
things by ensuring that its management puts in place strategies that govern the use of its
resources. The firm has acquired and developed attributes, like developing strategic
partnerships with suppliers in order to deliver the right products at the right time, which
allow it to outperform its competitors. The firm determines the values that its customers
v
want in order to satisfy their needs, and because it has recognized the importance of
understanding its competitors as well as its customers.
The study showed that EABL considers service as an intrinsic part of its products to the
end market. Thus, its competitive advantage is tied to the quantity and quality of its
services, as well as its competitive strategies that enhance its ability to utilize its resources
effectively. The company manufactures superior value products that are created through
lower costs, and this helps the firm to stand out against its direct competitors at the price
and product factor, thus, providing the firm with a positional advantage in the industry as
a cost leader.
The study concludes that, legal legislation changes have increased the cost of working
practice for the firm, meaning that the legal regulatory framework impact the firm’s
growth immensely. However, the firm has policy makers who examine the entire business
environment to identify regulations and policies that affect the company. The firm
specializes only in developing technologies that have pivotal importance to its business,
and it ensure that these competitive activities are compatible with its ability to manage
possible radical organizational changes.
The study recommends that EABL managers to ensure that their organizational
capabilities are matching with their competitive advantage. The focus on capabilities
should ensure that the firm is not driven by performance, which may force managers to
overlook their capability as a company.
vi
TABLE OF CONTENTS
STUDENT’S DECLARATION ....................................................................................... ii
STUDENT’S DECLARATION ........................................................................................ ii
COPYRIGHT ....................................................................................................................iii
ABSTRACT ....................................................................................................................... iv
LIST OF TABLES ..........................................................................................................viii
LIST OF FIGURES .......................................................................................................... ix
LIST OF ACRONYMS ..................................................................................................... x
CHAPTER ONE ................................................................................................................ 1
1.0 INTRODUCTION........................................................................................................ 1
1.1 Background of the Study ............................................................................................... 1
1.2 Statement of the Problem ............................................................................................... 5
1.3 Purpose of the Study ...................................................................................................... 6
1.4 Research Questions ........................................................................................................ 6
1.5 Significance of the Study ............................................................................................... 6
1.6 Scope of the Study ......................................................................................................... 7
1.7 Definition of Terms........................................................................................................ 7
1.8 Chapter Summary .......................................................................................................... 8
CHAPTER TWO ............................................................................................................... 9
2.0 LITERATURE REVIEW ........................................................................................... 9
2.1 Introduction .................................................................................................................... 9
2.2 Organizational Factors and Competitive Advantage ..................................................... 9
2.3 Organizational Capabilities and Competitive Advantage ............................................ 13
2.4 Organizational Strategies and Competitive Advantage ............................................... 18
2.5 Chapter Summary ........................................................................................................ 23
vii
CHAPTER THREE ......................................................................................................... 24
3.0 RESEARCH METHODOLOGY ............................................................................. 24
3.1 Introduction .................................................................................................................. 24
3.2 Research Design........................................................................................................... 24
3.3 Population and Sampling Design ................................................................................. 25
3.4 Data Collection Methods ............................................................................................. 26
3.5 Research Procedures .................................................................................................... 26
3.6 Data Analysis Methods ................................................................................................ 27
3.7 Chapter Summary ........................................................................................................ 28
CHAPTER FOUR ............................................................................................................ 29
4.0 RESULTS AND FINDINGS ..................................................................................... 29
4.1 Introduction .................................................................................................................. 29
4.2 Demographic Information ............................................................................................ 30
4.3 Organizational Factors and Competitive Advantage ................................................... 32
4.4 Organizational Capabilities and Competitive Advantage ............................................ 36
4.5 Organizational Strategies and Competitive Advantage ............................................... 40
4.6 Chapter Summary ........................................................................................................ 46
CHAPTER FIVE ............................................................................................................. 47
5.0 DISCUSSIONS, CONCLUSIONS AND RECOMMENDATIONS ...................... 47
5.1 Introduction .................................................................................................................. 47
5.2 Summary of the Study ................................................................................................. 47
5.3 Discussions .................................................................................................................. 49
5.4 Conclusions .................................................................................................................. 53
5.5 Recommendations ........................................................................................................ 55
REFERENCES ................................................................................................................. 56
APPENDICES .................................................................................................................. 61
APPENDIX I: QUESTIONNAIRE ................................................................................ 61
viii
LIST OF TABLES
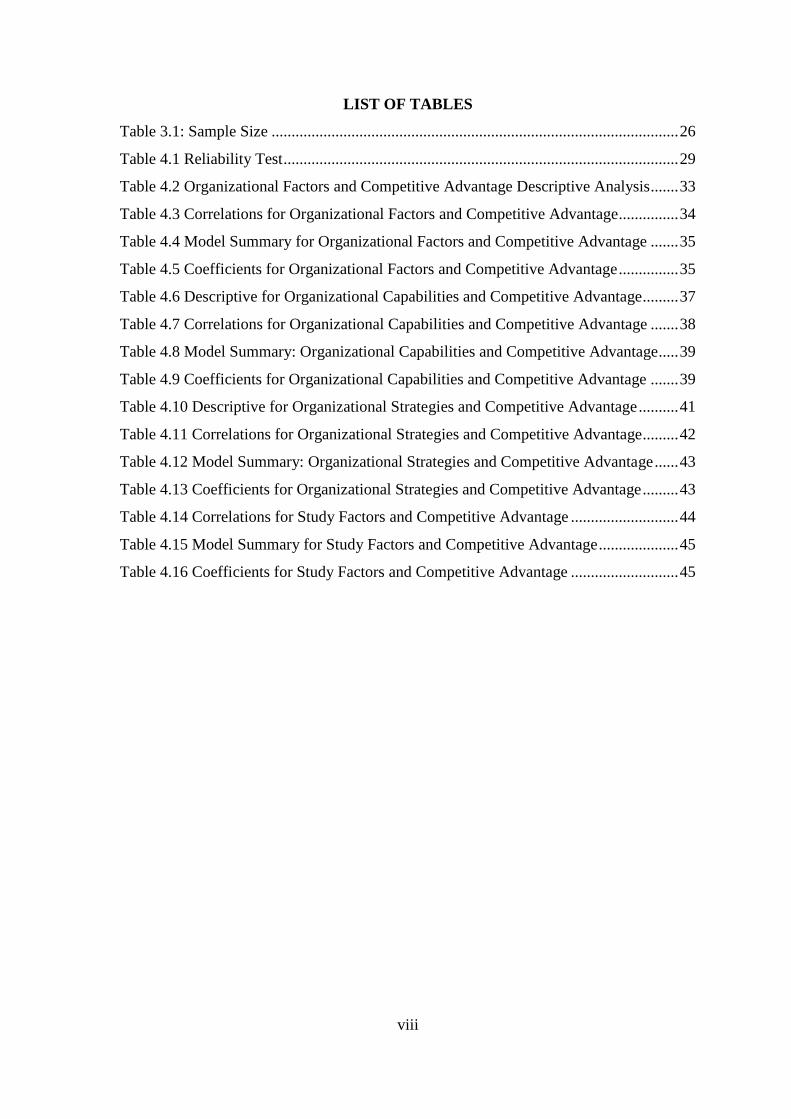
Table 3.1: Sample Size ...................................................................................................... 26
Table 4.1 Reliability Test ................................................................................................... 29
Table 4.2 Organizational Factors and Competitive Advantage Descriptive Analysis ....... 33
Table 4.3 Correlations for Organizational Factors and Competitive Advantage ............... 34
Table 4.4 Model Summary for Organizational Factors and Competitive Advantage ....... 35
Table 4.5 Coefficients for Organizational Factors and Competitive Advantage ............... 35
Table 4.6 Descriptive for Organizational Capabilities and Competitive Advantage ......... 37
Table 4.7 Correlations for Organizational Capabilities and Competitive Advantage ....... 38
Table 4.8 Model Summary: Organizational Capabilities and Competitive Advantage ..... 39
Table 4.9 Coefficients for Organizational Capabilities and Competitive Advantage ....... 39
Table 4.10 Descriptive for Organizational Strategies and Competitive Advantage .......... 41
Table 4.11 Correlations for Organizational Strategies and Competitive Advantage ......... 42
Table 4.12 Model Summary: Organizational Strategies and Competitive Advantage ...... 43
Table 4.13 Coefficients for Organizational Strategies and Competitive Advantage ......... 43
Table 4.14 Correlations for Study Factors and Competitive Advantage ........................... 44
Table 4.15 Model Summary for Study Factors and Competitive Advantage .................... 45
Table 4.16 Coefficients for Study Factors and Competitive Advantage ........................... 45
ix
LIST OF FIGURES
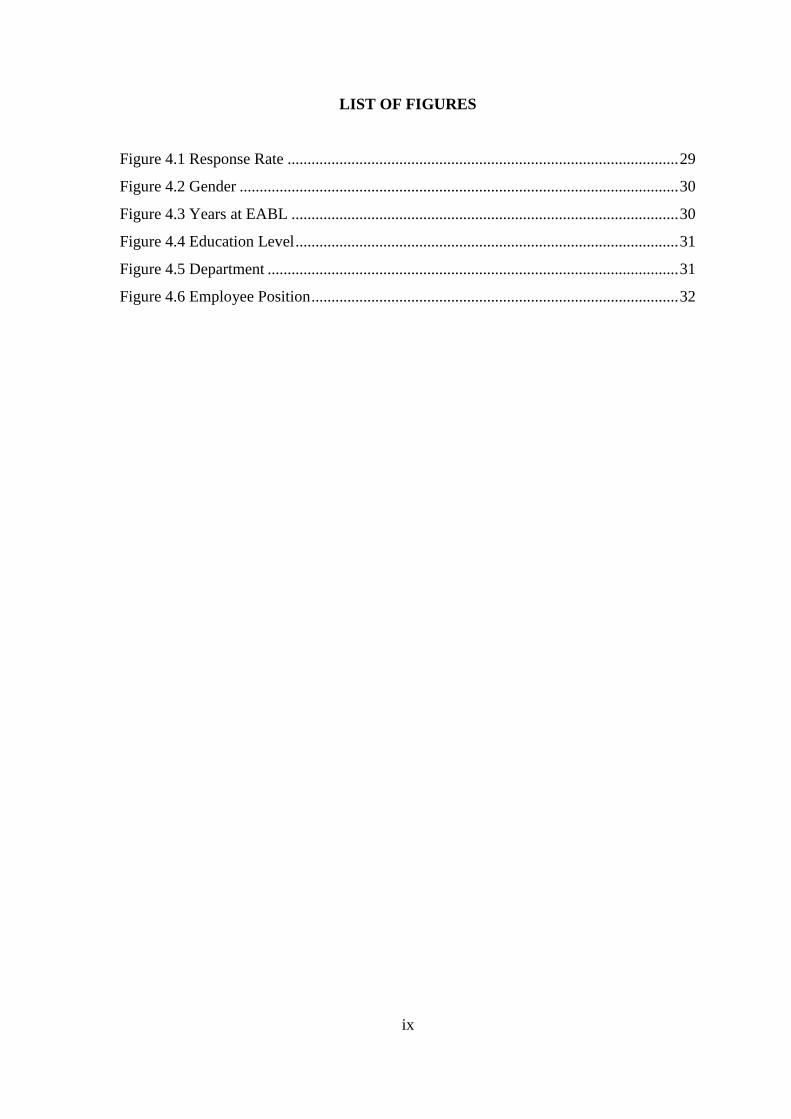
Figure 4.1 Response Rate .................................................................................................. 29
Figure 4.2 Gender .............................................................................................................. 30
Figure 4.3 Years at EABL ................................................................................................. 30
Figure 4.4 Education Level ................................................................................................ 31
Figure 4.5 Department ....................................................................................................... 31
Figure 4.6 Employee Position ............................................................................................ 32
x
LIST OF ACRONYMS
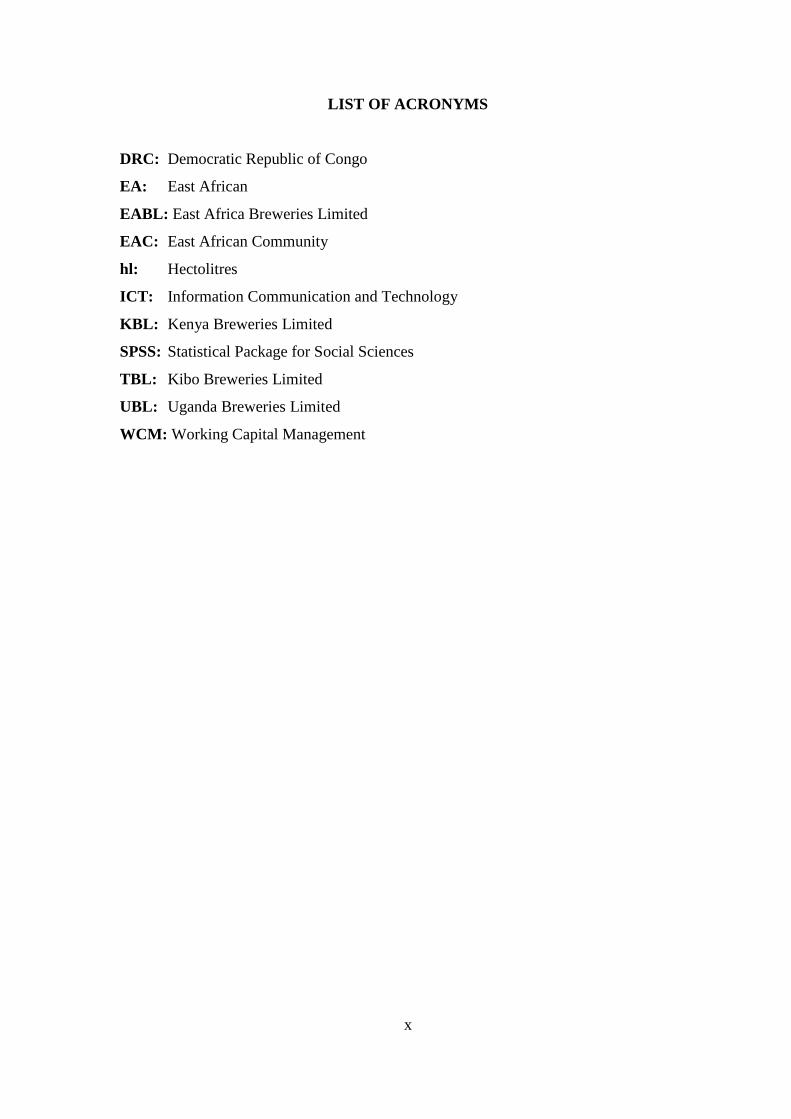
DRC: Democratic Republic of Congo
EA: East African
EABL: East Africa Breweries Limited
EAC: East African Community
hl: Hectolitres
ICT: Information Communication and Technology
KBL: Kenya Breweries Limited
SPSS: Statistical Package for Social Sciences
TBL: Kibo Breweries Limited
UBL: Uganda Breweries Limited
WCM: Working Capital Management
1
CHAPTER ONE
1.0 INTRODUCTION
1.1 Background of the Study
A company has a competitive advantage whenever it has an edge over its rivals in
securing customers and defending itself against competitive forces (Huang, Dyerson, Wu
& Harindranath, 2015). Competitive advantage is born out of core competencies that
yield the long-term benefit to the company. Porter (1985) noted that a core competence as
an area of specialized expertise that is the result of harmonizing complex streams of
technology and work activity. According to Schwenker and Wulf (2013), competitive
advantage can be developed from a particular resources and capabilities that the firm
possesses that are not available to competitors. The transformation of available skills and
resources into a strategic position can only take place under conditions that provide
customer benefit, and normally requires the transformation of multiple competitive
methods. The ability to implant cost leadership, differentiation, or focus strategy is
dependent on a firm’s ability to develop a specific set of competitive methods. This
becomes the basis for the firm to be able to achieve above average in its industry
(Urbancova, 2013).
Schwenker and Wulf (2013) argue that competitive methods consist of skills and
resources that are available for use by firms in a competitive industry. They define
superior skills in terms of staff capability, systems, or marketing savvy not possessed by a
competitor. Breweries customer’s customers are sensitive to services and prices and seek
to manufacture quality beers and maintain performance advantage over competitors’ that
pursue another generic strategy type or those that are stuck-in-the-middle (Bingham,
Heimeriks, Schijven & Gates, 2015). One central measure of organizational effectiveness
is the creation and continued dominance in the market. Many broad initiatives such as
efficiency, core competency advancement, actualization of customer-centric products and
services, and limitation of the fixed costs of manufacturing beer is achieved through
competitive advantage within the market place (Wang, Senaratne & Rafiq, 2015).
The resources held by a beer company and the business strategy will have a profound
impact on generating competitive advantage (Bingham et al., 2015). Powell (2001) views
business strategy as the tool that manipulates the resources and create competitive
2
advantage, hence, viable business strategy may not be adequate unless it possesses control
over unique resources that has the ability to create such a unique advantage. Competitive
advantage is a key determinant of superior performance and it will ensure survival and
prominent placing in the market, and it gives the company the ability to stay ahead of
present or potential competition and influence achieving of market leadership in beer
manufacturing sectors (Grant, 2010).
The term competitive advantage has traditionally been described in terms of the attributes
and resources of an organization that allow it to outperform others in the same industry or
product market (Bingham et al., 2015). The new paradigm of international
competitiveness is a dynamic one, based on innovation. Competitiveness at the industry
level arises from superior productivity; either in terms of lower costs than rivals or the
ability to offer products with superior value (value adding) that justifies a premium price
(Huang et al., 2015). Detailed case studies of hundreds of industries, based in dozens of
countries, reveal that internationally competitive companies are not those with the
cheapest inputs or the largest scale, but those with the capacity to improve and innovate
continually. Competitive advantage, then, rests not on static efficiency or on optimizing
within fixed constraints, but on the capacity for innovation and improvement that shift the
constraints (Urbancova, 2013)
According to Porter (1996), competitive advantage is an important concept of strategic
management. It defines the uniqueness of an organization verses its competitors.
Competitive strategy of the organization is the road map towards gaining competitive
advantage. The strategy by which the competitive advantage is gained is known as
business level strategy of the organization. Sources of competitive advantage include high
quality products, superior customer service and achieving lower costs than its rivals
(Bingham et al., 2015). The search for competitive advantage has been the dominant
theme in the study of strategy for many years (Porter, 1996). Competitive advantage is a
journey and not a destination - it is like tomorrow which is inescapable but never arrives.
Competitive advantage only becomes meaningful when this journey is experienced
(Schwenker & Wulf, 2013). For most organizations, however, the problem is how to
identify where the journey lies. In fast moving competitive environments, the nature of
the journey itself keeps changing in an unpredictable fashion (Huang et al., 2015).
3
The beer brewing industry is on the rise especially in the developed countries. This has
been propelled by economic growth, technology advancement, high per capita beer
consumption, improved quality and globalization of markets that has provided better
market opportunities (Ascher, 2018). Likewise, some of the developing countries with
better economic indexes are expected to experience growth as well. Production of beer in
developed countries is forecasted to increase to an annual growth rate of 2.3 percent
through 2020 to a volume of about 153 billion liters (Euro Monitor International, 2018).
In most of the developing nations, demand is expected to rise with the strongest gains
being in Asia especially China and Eastern Europe. This is propelled by economic
recovery, expanding population, rising disposable income, improvement in beer quality,
efficient distribution systems, high per capita consumption levels, and rising popularity of
beer at the expense of traditional beverages, especially among women, youth and more
affluent consumers (Ascher, 2018).
In Africa, the beer industry has either declined or is stagnant as a result of economic
recession, health and social concern, negative influence on globalization of markets, lack
of donor funding support, and lack of industrial brewing technology (Tremblay, J.,
Tremblay, C. & Iwasaki, 2017). The growth in beer production has been remarkable in
Asia, Europe, America, and while in Africa, the production growth rate has remained at
less than 1% (Euro Monitor International, 2018). Demand in the developing world will
continue to be restrained by health and social concerns, high taxes and competition from
alternative beverages, although favorable demographic patterns will help to boost
consumption (Tremblay et al., 2017).
Beer production in the East African Community (EAC) region has been stagnant. Kenya
leads with beer production of 2.8 million hectolitres (hl) for the year 2016, Tanzania 2.1
million hl and Uganda 1.3 million hl. It is important to note that besides being a market
leader in this sub sector, Kenya has extended beer production operations to each of the
EAC member countries (EABL, 2016). The beer market trend in EAC has gone down by
4%. The consumption by volume has also been declining at an annual rate of 5% and
consequently beer per capita consumption down from 14 litres to 8 litres for the last
decade (Euro Monitor International, 2018). The basic attributes to beer industry non-
performance are the critical challenge of taxes, which account for 50 % of beer
4
production cost, gradual consumption decline as a result of economic hardship and
competitive price on other alcoholic beverages (EABL, 2017).
Beer industry in Kenya dates back to 1922 when two brothers from England, George and
Charles Hurst, started brewing beer in Kenya. The two formally incorporated their
business as a private company under the name of Kenya Breweries Limited (KBL). In
1929 the first malted barley beer was brewed and the first batch delivered to New Stanley
Hotel where it was opened with mixed reaction. In 1930, the first lager beer was brewed
and released into the market (Muigai, 2017). By 1938 the company was recognized for its
beer after it won the first brewing award in an international competition. Bottled beer
consumption was exclusive for whites in pre-colonial era until 1947 when Africans were
allowed to drink formal sector beer (EABL, 2014).
KBL became a public limited company in 1934, after which it incorporated Tanganyika
Breweries and changed its name to East Africa Breweries Limited (EABL) making the
first move into the East African (EA) market (EABL, 2015). The company became a
holding company after merging with beer makers Allsopps EA Ltd in 1962 and KBL was
re-established as a major partner in Nairobi and Mombasa. In 1964 it acquired equity
interest in Tanzania’s Kilimanjaro Brewery and a year later, Guinness East Africa was
incorporated in Kenya. By 1972 EABL had the largest public share issue in Kenya of up
to more than 23,000 shares making it the only key player in beer and barley production
since 1947 (Muigai, 2017).
To break with tradition of selling only malted beer, the company started brewing 100%
non-malted beer (Citizen Lager) in 1997. The company has also diversified into non-
alcoholic beverages like Malta Guinness in the backdrop of beer demand (EABL, 2016).
EABL has extensive beer operations within the EAC member states having three
independent brewing entities namely: KBL-Nairobi, Kenya 80% ownership, Uganda
Breweries Limited (UBL) Kampala, Uganda) 98% ownership, and Kibo Breweries
Limited (TBL) Moshi Tanzania 20% ownership. Other subsidiaries include, Kenya
Malting Limited solely for barley farming and malt processing, and Central Glass
Limited, which dominates local glass packaging market and exports to Ethiopia, Rwanda
Democratic Republic of Congo (DRC) and Seychelles (Muigai, 2017).
5
1.2 Statement of the Problem
Competitive advantage plays a critical role in organizations in pursuit of policies that
create high-quality goods to sell at high prices in the market. Porter and Kramer (2006)
emphasize productivity as the focus of national strategies. Competitive advantage rests on
the notion that manufacturing companies seek strategies to improve on offering quality
product and services better than the competition in the market. Competitive advantage
influences maximizing scale economies in goods and services that garner premium prices
in the market (Schwenker & Wulf, 2013).
Competitive advantage among mature competitors increasingly requires building strategy
on a foundation of multiple competencies. As the largest beer maker in the world,
Anheuser-Busch can achieve a single competency commonly referred to as economies of
scale, whereby its larger size creates opportunities for greater efficiencies. But its
interaction of well-planned, multiple competencies leads to deeply embedded synergies,
such as greater product availability and increased brewery yields, that reinforces the
original competitive advantages (Bingham et al., 2015).
EABL continues to dominate sales in 2007 with the majority market share. Its dominance
is basically driven by continued effective marketing campaigns like promotions,
advertisements and sponsorship of public events and offering quality alcoholic and non-
alcoholic drinks (EABL, 2015). The pervasive influence of new and more advanced
technologies as well as the realities of global infrastructure makes it necessary for EABL
to play a proactive role in leading and transforming the beer industry in Kenya (EABL,
2017). The company has loyalty among consumers to particular brands and has adopted
effective marketing strategies. This has enabled the company to achieve superior
performance and guaranteed survival and prominent placing in the market (EABL, 2014).
Despite the gain of competitive advantage in East African Breweries Limited, the factors
influencing the same have not been determined.
Locally, there are studies which have focused on achieving sustainable competitive
advantage in banks. For instance, Gathuiya (2011) carried out a study on achieving
sustainable competitive advantage through innovation strategies in commercial Banks.
Kibera and Waruingi (2014) found that creation and sustenance of competitive advantage
6
was achieved through product differentiation in companies. They found out that
companies strive to survive and succeed in competition by pursuing strategies that enable
them to perform better than their competitors. Despite East Africa Breweries Limited
implementing competitive strategies, empirical study on the role of competitive
advantage in the company has not been established. This study sought to fill this gap by
determining the factors that influence competitive advantage in EABL.
1.3 Purpose of the Study
The purpose of this study was to determine factors influencing competitive advantage
within the beer manufacturing sector in Kenya, while focusing on EABL.
1.4 Research Questions
The following research questions guided the study:
1.4.1 What is the influence of organizational factors on the firm’s competitive advantage?
1.4.1 How do organizational capabilities provide the firm with competitive advantage?
1.4.2 What is the influence of organizational strategies on the firm’s competitive
advantage?
1.5 Significance of the Study
1.5.1 EABL Managers
The primary beneficiaries of this study were EABL managers. This study on factors
influencing competitive advantage within the beer manufacturing sector in Kenya may
help EABL managers understand how the various strategies adopted influence their
competitive advantage. The study provides recommendations that these managers may
adopt to increase their competitive advantage.
1.5.2 Managers of other Beer Companies
This study on factors influencing competitive advantage within the beer manufacturing
sector in Kenya may also be of importance to other beer manufacturing companies, since
it provides an overview of how selection of various strategies influences company
positioning while improving competitive advantage. These managers may benchmark on
this study to improve their companies’ overall competitive positioning.
7
1.5.3 Government
The government is the custodian of all its citizens regardless whether it has the ability to
address their plight. Information gathered through this study may help the government to
formulate policies beneficial and the best practices in application of competitive
advantage in the brewing sectors in Kenya.
1.5.4 Further Researchers
The study provides a platform for further research in the area of competitive advantage in
the in the brewery industry. The findings of the study may be of use to trainers’ in
strategic management in that it may assist them in knowing the areas which should be
given concentration when training managers on competitive advantage and related topics
in their organizations.
1.6 Scope of the Study
This study determines factors that influence competitive advantage within the beer
manufacturing sector in Kenya. The study focused on EABL which currently is the
largest beer manufacturing company in EAC. The study was carried out on the firm’s
headquarters located in Nairobi - Ruaraka. The results of the study were limited to EABL
and data was collected from EABL employees between March and April 2019.
1.7 Definition of Terms
1.7.1 Competitive Advantage
Competitive advantage is defined as the state of a firm having an edge over its rivals in
securing customers and defending itself against competitive forces (Huang et al., 2015).
1.7.2 Business Strategy
Powell (2001) views business strategy as the tool that manipulates the resources and
create competitive advantage, hence, viable business strategy may not be adequate unless
it possesses control over unique resources that has the ability to create such a unique
advantage.
8
1.7.3 Core Competence
Core competence is defined as an area of specialized expertise within an organization that
is the result of harmonizing complex streams of technology and work activity (Porter,
1985).
1.8 Chapter Summary
This chapter has discussed in detail the nature and scope of competitive advantage within
the beer manufacturing globally, regionally and locally. The chapter has provided the
problem statement which has shown the gap that this study sought to fill. The purpose of
the study has also been provided and the research questions that guided the study. The
chapter has also discussed the significance and scope of the study in terms of who may
benefit from the study and who were covered in the study. The chapter also provides the
definition of key terms used. The second chapter provides the literature review of the
study, while chapter three presents the research methodology that was used in the study.
The forth chapter presents the results and findings of the study while the fifth chapter
provides the study’s discussions, conclusions and recommendations.
9
CHAPTER TWO
2.0 LITERATURE REVIEW
2.1 Introduction
This chapter provides literature review on the factors that influence competitive
advantage within the beer manufacturing sector in Kenya. The chapter provides literature
on organizational factors and how they influence a firm’s competitive advantage,
organizational capabilities and how they provide a firm with competitive advantage, and
organizational strategies and how they influence a firm’s competitive advantage.
2.2 Organizational Factors and Competitive Advantage
According Barone and DeCarlo (2013) building a competitive advantage will involve
understanding the needs of the market (customers), and devising a strategy to make use of
the resources that are available (or can be obtained) to set the business apart from the
competition. Research in the field of strategic management has attempted to discuss what
competitive advantage involves. Tuan and Yoshi (2014) assert that competitive advantage
and performance are terms that have been interchangeably used as they are based on the
definition of Porter (1985), which asserts that competitive advantage and performance is
more or less the same thing.
In addition Powell (2001), indicates a unidirectional correlation: that competitive
advantage leads to improved performance, not the opposite. Therefore, studies such as
Powell (2001) assert that among the possible relationships between organizational
capabilities, competitive advantage and performance, a direct relationship between
organizational capabilities and competitive advantage likely exists rather than a
relationship straight from that to performance. This section discusses how organizational
factors like competence, working capital management, flexibility, regulatory framework
and sales growth aid in competitive advantage.
2.2.1 Competence
Chappell (2012), suggests that competence is a contested concept, the meaning of which
is shaped by those who use it. This is particularly problematic in a multi-cultural or
multinational context, because multiple meanings will make empirical analysis almost
impossible. For some researchers, competence appears to be an internal personality trait
10
residing within the individual (Goodstein et al., 2016). That is, someone has a set of traits
that make them more likely to be ‘competent’ than someone who does not possess these
traits. From this perspective, it could be claimed that someone is born with specific
characteristics that make them more likely to be ‘competent’. Based on this approach, the
key to an organization’s efficiency and effectiveness is to determine who within the
organization has these traits and who does not (Chappell, 2012).
A second approach views competence as a set of skills or learned behaviors (Bratton,
2015). In this case, competence is defined as internal to the individual, but learned over
time. Analyzing the situation further, researchers have tried to distinguish between skills
and behaviors (McAuley, 2014). They have focused on establishing a difference between
identifiable skills and patterns of behaviors. Ultimately, theirs may be a redundant path of
research because the only way to measure skill is as a behavior, building an inevitable
confound (Hamel, 2016).
From the perspective that competence is learned, it is unlikely that someone will be
competent within the company immediately, but will learn how things are done within the
organization and their competence will increase over time. For the organization, there are
several implications. First, not only must recruiting be exercised carefully, but there must
also be a management training structure in place to facilitate the development of
competence skills. Second, the prospect of 'growing' competent managers is possible
under this approach (Ross et al., 2016). Therefore, organic growth and hiring from within
are not only possible but also desirable, because an internal candidate already has
knowledge of the internal systems and does not have to relearn it (Enhardt & Brigham,
2009).
A third perspective posits that competence is a standard of behavior that does not reside
within the individual, but is a function of how the organization performs (Pitt et al.,
2016). Instead of focusing on the individual and evaluating how she or he works, this
perspective focuses on the work group/Strategic Business Unit and uses an external
benchmark of competence (Pandey, 2012). The implication of this approach is that not
only must the organization seek out those with management skills and ‘competence’, but
11
also structure itself to facilitate competent management and develop evaluation systems
to ensure that standards are being maintained (Hamel, 2016).
2.2.2 Working Capital Management
The management of working capital is a vital element in all firms. It poses problems both
in respect of individual components of assets and the volume and maturity of liabilities
(Pandey, 2012). Working capital management implicates the administration of current
assets as well as current liabilities (Weston, 2016). WCM is the main part of a firm’s
short-term financial planning since it encompasses the management of cash, inventory
and accounts receivable (Enhardt & Brigham, 2009). These three components and the
way in which they are managed determine some of a company’s most vital financial
ratios, e.g. the ‘inventory turnover’, the ‘average collection period’ and the ‘quick ratio’
(Ross et al., 2016). Hence, working capital management reflects a firm’s short-term
financial performance.
Business is often associated with competition as most companies are in competition with
at least one other firm over the same group of customers (Hamel, 2016). Competition, in
economics refers to rivalry in supplying or acquiring an economic service or good. Sellers
compete with other sellers, and buyers with other buyers. In its perfect form, there is
competition among many small buyers and sellers, none of whom is too large to affect the
market as a whole (Enhardt & Brigham, 2009). The classical theory of perfect
competition, as developed by economists from Adam Smith to Alfred Marshall, takes a
reduced-form approach: it depicts the outcome of competition, but not the activity of
competing. Much of what is interesting and important about competition is hidden in the
background (McAuley, 2014). Generally, firms are in competition with each other if they
sell goods and services to the same groups of customers or try to employ factors sourced
from the same group of suppliers (Weston, 2016).
2.2.3 Flexibility
Flexibility is considered to be a major source of competitiveness for small and medium
sized business compared to larger enterprises. The use of information communication and
technology (ICT) could now on the one hand increase the competitiveness of business as
they enable the creation of more flexible links with trading partners because of faster and
12
more reliable communication channels (Muller-Falcke, 2015). On the other hand, ICTs
could help bigger enterprises to increase their flexibility through a restructuring of the
organization which will enable them to adapt quicker to changing conditions. Therefore,
the competitive advantage of medium sized businesses could also decline (Tuan & Yoshi,
2014).
In general, most small firms rely much more on informal information systems than larger
enterprises. To get the relevant information that is needed for a rational decision is not
costless especially as in small forms usually there is only one decision maker – the
owner/manager – whose personal resources (time, knowledge, and capabilities) are
restricted. However, small firms have the advantage of smaller internal coordination
costs, as all decisions are made by one or few people (Barone & DeCarlo, 2013).
2.2.4 Regulatory Framework
Legal changes are happening on a daily basis, and as a result, can have a large influence
on what is happening within the business environment. Health and safety legislative
changes may increase costs, or force working practices to change (McCormick, 2012).
This is particularly important when considering new businesses, such as companies
trading online (Barkham, 2016). Legal legislation changes may increase the cost of
working practice to changes. This is particularly important when considering a new
business venture, such as diversifying into the internet market. Changes to minimum
wage, the standard working week and employee contracts need also to be taken into
consideration (Pandey, 2012).
Empirical studies on legal regulatory framework indicate that an appropriate legal and
regulatory framework can impact on the growth of a business. Harper (2015) states that a
tightly regulated economy works against small enterprises since large firms have capacity
and resources to get around regulations or bend the rules in their favor but small
enterprises are caught in them and this affect their growth. McCormick (2012) argues that
laws have an effect in business entry and growth and even if they are not enforced, they
increase uncertainty in the business environment since nobody knows when the law will
be enforced. She concludes that policy makers should examine the entire business
13
environment and identify regulations and policies that affect entry and growth of small
enterprises.
2.2.5 Sales Growth
There is no general agreement on how firm size should be measured and therefore there is
a wide variation on the growth variables used by researchers. A firm size may be
measured according to its revenue or profits or by the amount of human and physical
capital it employs (Barkham, 2016). This study considers sales and employment as
growth indicators for the following reasons. First, the use of sales and employment
measures are the most widely used in empirical growth research (Delmar, 2015). Second,
those growth indicators are the only ones available in the present study for all the firms of
interest. Sales are a relatively good indicator of size and therefore growth. Sales may be
considered a precise indicator of how a firm is competing within a market, and indeed
firms themselves tend to use it as a measure of their own performance. An analysis of
company growth should at least in part be based on changes in turnover (Barkham, 2016).
However, sales are not the perfect indicator for growth for all purposes. Sales are
sensitive to inflation and currency exchange rates, while employment is not. It is not
always true that sales lead the growth process. For high technology startups and the
startup of new activities in established firms, it is possible that assets and employment
will grow before any sales occur (Delmar, 2015). Obvious drawback of employment as a
growth indicator are that this measure is affected by labor productivity increases, machine
for man substitution, degree of integration and other make or buy decisions. A firm can
grow considerably in output and assets without a growth in employment especially
technology-based firms. Therefore, the combination of turnover and employment makes
the measure more reliable (Barkham, 2016).
2.3 Organizational Capabilities and Competitive Advantage
2.3.1 Strategic Management
Porter (1998) observed that strategic responses involves a change in the competitive
position a firm occupies in the competitive industry. A change in the competitive position
will require a company to decide on which generic strategy to adopt. The choice involves
cost leadership, niche focus and differentiation. This choice is essential in the strategic
14
planning process since it determines the superiority total organization performance. All
the strategic planning variables will fall in place once a clear choice of the basic generic
strategy has been determined.
Strategic management is getting everybody in the company to do the right things. It
entails deciding what things are right for company under some given set of consumer
expectations and competitive circumstances (Delmar, 2015). Davidson et al. (2014)
defined strategic management as the process of deciding on the mission of the enterprise,
the basic goals and objectives that it seeks to achieve and the major strategies that will
govern the use of firm’s resources to achieve its objectives. A fully developed retail
marketing strategy identifies: the specific markets and market segments that the firm
intends to pursue, the consumer and competitive performance that the firm desires in its
selected markets, the specific means by which the firm intends to appeal to its target
customers and establish its competitive position (Delmar, 2015).
2.3.2 Resource Allocation
Competitive advantage occurs when an organization acquires or develops an attribute or
combination of attributes that allows it to outperform its competitors. This attribute can
include access to natural resources, inexpensive power, or access to highly trained and
skilled personnel human resources (Clulow et al., 2013). New technologies such as
robotics and information technology can provide competitive advantage, whether as a part
of the product itself, as an advantage to the making of the product, or as a competitive aid
in the business process (Porter, 1985).
Lack of enough capital affects this industry due to the huge capital required. In deed this
is a strong barrier of entry to small upcoming companies. This is a barrier to product
innovation as well. These theories require financial investment and management
commitment (Hasty & Reardon, 2014). Unpredicted changes in customer preferences,
many substitute products, and lack of investing in new products. Other barriers
considered not severe included poor financial controls, failure to cope with competition,
lack of clear vision and goals, failure to respond to changes, lack of storage and
preservation facilities, security, transportation and employees wanting higher pay (Clulow
et al., 2013). Three areas that are vital for the successful execution of a relationship
15
strategy are: the interaction process as the core of relationship marketing, the planned
communication process supporting the development and enhancement of relationship and
the value process as the output of relationship marketing (Hasty & Reardon, 2014).
Large and small alcoholic beverage companies are now developing strategic partnerships
with suppliers in order to deliver the right product to the alcoholic beverages at the right
time. These changes are partly the advances in the information technology and the
relatively the increasing power of large alcoholic beverages (Clulow et al., 2013). Not
only must the alcoholic beverage companies and the supplier agree on the price and the
amount of merchandise to be bought or sold, but the terms of sale and the terms of
payment must be agreed on as well (Hasty & Reardon, 2014).
Today, many organizations are fast changing to cope with the needs of the dynamic
environment. However, the focus of their effort is often day to day management and
dealing with the current issues or crisis. While many small firms survive and prosper this
way, to establish a secure business and develop the capability to grow significantly
requires some long term thinking in form of a strategy (Davidson et al., 2014). The
importance of developing a strategy that is sufficiently proactive to drive a small firm not
only to achieve long term success, but to be flexible enough to cope with the continual
change in the environment is paramount (Hasty & Reardon, 2014). A strategy is needed
by any organization that is faced with intelligent opposition that can affect the
organizations desired outcome. To operate in environments that are potentially vulnerable
to competitive actions and so they need a strategy to determine the way in which they
intend to compete in the market place (Clulow et al., 2013).
2.3.3 Market Planning
2.3.3.1 Capturing Target Market
The growing complexity of large, diversified retail enterprises, the rapid change in
consumer markets and the intensifying competitive environment make it imperative that
the retail firms have a thoroughly well thought out strategic plan detailing how it intends
to capture the target market (Davidson et al., 2014). Companies are therefore evaluating
their retail services with an aim of coming up with more focused strategies that help them
meet their unit and companywide objectives. They are working towards developing
16
coherent strategies on how to differentiate and add value to retail customers. Companies
are therefore pursuing marketing strategies to not only win and grow their businesses but
to also stay a head of the competition, towards this end, the most commonly pursued
marketing strategies are; product portfolio management, pricing, distribution and
relationship marketing or customer services and promotion strategies (Hasty & Reardon,
2014). Renart (2014) argues that the conventional wisdom was that leadership in the
market place could be attained by means of designing and implementing a sound
marketing plan. Such a plan entails first defining the four P’s later evolved to six elements
of the marketing mix: Market segmentation (product or service), Pricing, channels of
distribution, sales team management, advertising, promotions and public relations.
An alcoholic beverage companies can view the total consumer market as being made up
of a collection of segments, each one representing a distinct and separate set of customer
expectations (Hasty & Reardon, 2014). Alcoholic beverage firms view of market segment
consists of those customers who share a common set of expectations regarding retail
stores, and consequently tend to respond favorably to a particular combination of value
offers, consisting not only attributes of physical products but also of services, atmosphere
and any other sources of potential satisfaction (Davidson et al., 2014).
2.3.3.2 Market Segmentation
Market segmentation is the process of dividing the heterogeneous market into segments.
The various segments identified should be homogeneous within themselves, but
heterogeneous without (i.e. different from other segments). The goal is to facilitate the
development of unique and effective marketing programs that will be most effective for
these specific segments (David & Albert, 2012).
Smith (2012) articulated the view that to sustain growth in apparently non-growth
scenarios, companies had to adopt the concept of market segmentation. The essential
logic behind the proposition was that by acquiring a deeper understanding of variations in
customer needs, companies could develop new products specifically aimed at satisfying
different groups of customers. Market Segmentation starts with the belief that there are
identifiable differences among a product’s various consumers and that the differences are
relevant to their buying and store patronage behavior. The goal of market segmentation
17
therefore is to identify smaller, homogeneous submarkets within the larger heterogeneous
mass market (Lewinson & Delozier, 2012).
Cahill (2014) argued that the possible benefits of segmentation were; by specialization,
companies could stimulate greater consumption and thereby market expansion. If there
are few competitors within a given segment, promotional costs might be reduced. For the
alcoholic beverages, it is essential that a decision to use a market segmentation strategy
should rest on consideration of four important criteria that affect its profitability. The
market must be; identifiable, measurable, accessible, substantial, and responsive.
Lewinson and Delozier (2012) state that, there are a number of variables that can be used
to segment a market. Generally, those variables can be grouped into two broad categories;
customer characteristics and buying situations. The traditional bases for segmentation
have been classified as geographic, demographic, socioeconomic conditions (whether
upscale or down scale), psychographic and behavioral, nature of housing, fashion interest
and the concept of value. In retail operations approach, Cahill (2014) states that, the
alcoholic beverages examine factors that might enhance or limit operations. Several
factors influence directly the alcoholic beverages’ chances to operate successfully namely
distribution, competition, promotion and legal considerations.
Lewinson and Dolozier (2012) argue that a crucial problem that affects an alcoholic
beverage companies is getting the product into the store. This problem involves inventory
control; overstocking increase in carrying costs, whereas stock outs because lost sales and
customer ill will. The alcoholic beverage companies must therefore consider
transportation and handling costs, delivery time, and reliability of delivery services. The
alcoholic beverage companies must also consider the location and delivery practices of
suppliers and the market area’s ability to support distribution facilities. It is imperative
that the alcoholic beverage firms take into account the reality of the competition when
identifying markets areas (David & Albert, 2012). An alcoholic beverage firm that
depends heavily on promotional activities can identify market areas by analyzing the
advertising media within each market area and the behavior of the competitive alcoholic
beverages. Other companies have segmented their markets based on regions. An approach
known as identifying markets areas. It consists of determining the right region of the
18
country and the right part of the region for example urban, per-urban and rural markets
(Cahill, 2014).
2.3.3.3 Marketing Orientation
Marketing orientation is firstly customer focused. Becoming customer oriented requires
finding out what values buyers’ want to help satisfy their needs. According to Becherer
(2013), Blankson et al. (2012), market orientation requires a culture in which
organizations strive to create superior value for their customers (and superior
performance for the business) by focusing on customers’ needs and long-term
profitability.
A marketing-oriented organization recognizes the importance of understanding its
competitors as well as the customers. Thirdly, a market-oriented organization is effective
in getting all business functions working together to provide superior customer value (to
Becherer et al., 2013). Organizations that are market oriented begin strategic analysis
with a penetrating view of the market and competition.
2.4 Organizational Strategies and Competitive Advantage
Mintzberg (1994) suggests that a strategy is about making plans for the future, based on a
set of objectives, policies and plans that, when taken together, define the scope of the
enterprise and how it intends to survive and achieve success. There must be a strategic fit
of the many activities that are intertwined to provide competitive advantage and
ultimately, sustainability for the organization.
Several key strategies are needed at every stage in the lifetime of an enterprise (Blankson
et al., 2012). The ability of a firm to identify market segments or niches where they can
build customer bases founded on their distinctive advantages and the ability to exploit
non-price competitive advantages using relevant technologies and being innovative. Thus,
the concept of strategy is essential to organizations in that it helps in: defining the
organization’s business, mission and goals; identifying and framing organizations growth
opportunities; formulating marketing strategies; budgeting, marketing, financial and
production resources; and developing reformulation and recovery strategies.
19
2.4.1 Product/Service Advantage
In a competitive market place, consumers perceive the products/services or organization’s
performance on specific attributes relative to that of the competitors (Kotler, 1994). Thus,
manufacturing companies have to either reinforce or modify customers’ perception or
image. Competitive advantage in products and services in beer manufacturing companies
plays a pivotal role in marketing strategy, since it links market analysis, segment analysis
and competitive analysis to internal corporate analysis (Stacey, 2013). In more recent
times a new competitive factor, product or service advantage, is reported to play a major
role in the achievement of organization superior performance. Service makes it possible
to better qualify the supply of products, innovative manufacturers consider it as an
intrinsic part of the product offered to the end market. The manufacturers combine
products and services due to customers’ change in behavior and preferences (Passemard,
2015).
Customers not only expect lower prices, but also a wide and varied range of products,
shorter delivery times, good technical assistance, improved payment terms and efficient
distribution channels (Passemard, 2015). The company through competitive advantage
therefore influence development of strategies based on customer service, enhancing
differentiation of their products and to maintain competitive advantage making it more
lasting than that just guaranteed by low prices. An advantage seems to be particularly tied
to the quantity and quality of services that cannot be imitated by competitors (Ferrero,
2016).
2.4.2 Resource Utilization
Dynamic capabilities integrate; reconfigure, gain, and release resources to match and
even create market change. Therefore, organizational processes shaped by the company’s
asset position and molded by its evolutionary and co-evolutionary paths, explain the
essence of the company’s dynamic capabilities and its competitive advantage (Barney,
2015). Dynamic capabilities involve path dependencies that leverage the growth of
related resources, which are called weak form dynamic capabilities, and also use new and
unrelated ones called strong form dynamic capabilities (Morgan et al., 2014).
20
Competitive strategies enhance firm's ability to utilize its resources effectively. An
example of a capability is the ability to bring a product to market faster than competitors.
Such capabilities are embedded in the routines of the organization and are not easily
documented as procedures and thus are difficult for competitors to replicate (Barney,
2015). The firm's resources and capabilities together form its distinctive competencies.
These competencies enable innovation, efficiency, quality, and customer responsiveness,
all of which can be leveraged to create a cost advantage or a differentiation advantage,
(Christensen, 2014).
Competitive advantage influences the use of resources and capabilities to achieve either a
lower cost structure or a differentiated product (Porter, 1985). Another important decision
is how broad or narrow a market segment to target. Porter formed a matrix using cost
advantage, differentiation advantage, and a broad or narrow focus to identify a set of
generic strategies that the firm can pursue to create and sustain a competitive advantage.
The firm use competitive advantage to continue with value creating activities in a way
that it creates more overall value than competitors. Firms through competitive advantage
improve manufacturing of superior value created through lower costs or superior benefits
to the consumer (Christensen, 2014).
2.4.3 Cost Advantage
The cost advantage of manufacturing enables the company systematic efforts to increase
efficiency in its operations and results in the production cost per unit, lower cost of goods
sold and selling price to end-user in the export markets (Morgan et al., 2014). The
companies with cost advantage create more value for their customers by offering their
products and services at a lower price, mainly due to the economies or diseconomies of
scale for each activity, learning that improves knowledge and processes independently of
scale, the patterns of capacity utilization, and the linkages that are present when the way
one activity is performed affects another activity (Day & Wensley, 2016).
In the firm’s behavior oriented by cost leadership, competitive advantage is pursued
through economies of scale, exploitation of the experience curve and rigorous control of
overhead costs (Christensen, 2014). Differentiation policies rest upon the entrepreneur’s
ability to stand out against its direct competitors not only at the price factor, but also as
21
regards the upgrading of products, the technical assistance given to customers and the
selection of efficient distribution channels, that is the non-price factors of competition
(Lau, 2012).
Cost advantages are known as positional advantages since they describe the firm's
position in the industry as a leader in cost. A resource-based view emphasizes that a firm
utilizes its resources and capabilities to create a competitive advantage that ultimately
results in superior value creation (Lau, 2012). Lower cost advantage to a section of
market segments with basic services offered to higher priced market leaders is also a
strategy acceptable in the corporate world. It results to similar products to much higher
priced products that can also be acceptable to sufficient customers in the market (Clulow,
Gerstman & Barry, 2013).
It concentrates on a narrow segment and within that segment it attempts to achieve cost
advantage. The premise is that the need of the group can be better serviced by focusing
entirely on it; hence enjoy high degree of customer loyalty, which discourages other firms
from competing directly (Lau, 2012). Cost leadership is achieved not only by rational
management of the production function, but also by skillful maneuvering of all the inter-
functional relationships within the enterprise system in order to reduce coordination costs
and enables the firm to use the price weapon with some discretion (Clulow, Gerstman &
Barry, 2013).
2.4.4 Differentiation Advantage
Product differentiation, is obtained by suitably mixing marketing elements other than
price, i.e. the ability to modify the tangible and intangible characteristics of the goods or
services provided to the consumer (this policy enhances the non-price competitiveness of
the firm) (Parker, 2012). The ability of differentiation to help the firm achieve a low-cost
position depends on two factors: the extent to which expenditure on differentiation
significantly increases demand, shifting the demand curve to the right; and the extent to
which significant reductions in unit costs arise from increasing volume (Hill, 2016).
22
Both of these factors are situation dependent, and they form the basis for the contingency
framework. Hill (2016) explained that the immediate effect of differentiation will be to
increase unit costs. However, if costs fall with increasing volume, the long-run effect may
be to reduce unit costs. Three sources of declining costs can be identified: learning
effects, economies of scale, and economies of scope.
The impact that differentiation has on demand depends on three major contingencies; the
ability of the firm to differentiate its product, the competitive nature of the product market
environment, and the commitment of consumers to the products of rival firms (Knox,
2012). The number of attributes inherent in a product creates scope for differentiation.
However, there is not a direct linear relationship between number of attributes and
opportunities for differentiation. It is possible to differentiate a relatively homogeneous
product if the psychological characteristics of consumers are diverse (Hill, 2016).
2.4.5 Innovation Advantage
Demands for innovation and technological advancement are increasingly crucial
components of competitive strategy for many manufacturing firms (Miller, 2015). Most
manufacturing companies face serious competitive challenges due to the rapid pace and
unpredictability of technology change and failure to utilize innovation as a competitive
advantage (Gaynor, 2012). Given the array of capabilities needed to sustain effective
corporate entrepreneurship, competitive advantage provides the company with an
attractive source of innovations to create positive synergy for the firm. Likewise, if the
innovation process or the outcomes of innovation are difficult to copy, then it becomes an
increasingly important ingredient in sustaining competitive advantage (Parker, 2012).
Clark (2014) suggested that beer manufacturing products from, function, pricing, and
distribution offer potential avenues for reducing limitability for innovative advantage.
Others argue that managerial innovations advantages, such as the strategic management
of human resources (Schuler & Jackson, 2015), or information-based innovations, such as
new market research techniques, provide more durable routes to competitive positioning
that can be gained from product innovations. Parker (2012), recommended that firms
could only specialize in developing technologies that have pivotal importance to their
23
business in order to protect limitability of key competitive elements. The common thread
is identifying outcomes that are difficult for other firms to replicate (Knox, 2012).
The competitive advantage outcomes are no better if a firm chooses to resist change as it
innovates and diversifies. The consequences of neglected structural and cultural
implications of increased diversification and organizational differentiation particularly
where new products often require new structures to foster market exploitation. Therefore,
competitive activities must be compatible with a firm's ability to manage potentially
radical organizational change (Gaynor 2012).
According to Gaynor (2012), innovative advantage and subsequent requirements for
sustained exploitation, provides incentives for change in the strategic configuration.
Innovative advantage might enable a firm to broaden its market appeal by introducing
cost savings as well as unique features. Successful adaptability requires both knowing
when to change and knowing when change is not appropriate. Innovation advantage that
help a firm make correct choices will have a greater probability of maintaining
competitive advantage. As Clark (2014) points out, the foundation of competitive
advantage influences a firm’s utilization of capabilities such as human skills and
relationships, material resources, and relevant knowledge that a firm uses to build
products and deliver services having a market place appeal.
2.5 Chapter Summary
This chapter has provided literature review on the factors that influence competitive
advantage within the beer manufacturing sector in Kenya. The chapter has provided
literature on organizational factors and how they influence a firm’s competitive
advantage, organizational capabilities and how they provide a firm with competitive
advantage, and organizational strategies and how they influence a firm’s competitive
advantage. The next chapter focuses on research methodology.
24
CHAPTER THREE
3.0 RESEARCH METHODOLOGY
3.1 Introduction
The research methodology adopted by the study is presented in this chapter. The elements
in this chapter include the research design, population and sample design, data collection
methods, research procedures and the data analysis method. The summary of the whole
chapter is provided at the end of this chapter.
3.2 Research Design
Cooper and Schindler (2014) find research design to be the structure and organization of a
study regarded to obtain answers to research questions. The research design reveals the
structure of the research problem and the program of investigation used to obtain
empirical evidence. Babbie and Mouton (2010) on the other hand find research design as
a structured framework or plan that helps a researcher to solve a research problem and
minimize knowledge gap. By use of a perfectly developed and clear research framework,
readers can enhance confidence in the methods used as the researcher maximizes validity
and minimizes error or rather mistakes.
The proposed study was modelled on a descriptive design. According to Cooper and
Schindler (2014), a descriptive study is concerned with finding out who, what, where and
how of a phenomenon which was the concern of the study. The study intended to
determine factors influencing competitive advantage in alcoholic beverages, where and
how the alcoholic beverages companies in Kenya had adopted and whether they had led
to a sustainable competitive advantage, which fits into the design. Njoroge (2003),
Mazrui (2003), Kamau (2004) and Mukule (2006) used descriptive study in the related
studies. In this research descriptive research was used to determine factors influencing
competitive advantage within the beer manufacturing sector in Kenya. Descriptive studies
are not only restricted to facts findings but may often result in the formulation of
important principles of knowledge and solutions to significant problems.
25
3.3 Population and Sampling Design
3.3.1 Population
Mugenda and Mugenda (1999) describe the target population as the complete set of
individual case or object with some common characteristics to which the researchers want
to generalize the result of the study. The study targeted all the staff that worked in all the
departments at EABL who were 50 in total.
3.3.2 Sample Design
3.3.2.1 Sample Frame
Cooper and Schindler (2008) found that a proper and complete list of all factors of a
population facilitates the development of a sample population is known as a sample
frame. In this study the sample frame involved employees in EABL and the sample frame
was obtained from the human resource office in Ruaraka to ensure all employees were
involved in this process and were not left out making the sample frame for this study
relevant, current and complete.
3.3.2.2 Sampling Technique
Census method was used in the study. Babbie and Mouton (2010) defines a census as the
procedure of systematically acquiring and recording information about the members of a
given population. Saunders et al. (2012) states that, census data are commonly used for
research, business marketing, and planning, and as a baseline for designing sample
surveys by providing a sampling frame such as an address register. Babbie and Mouton
(2010) adds that, census counts are necessary to adjust samples to be representative of a
population by weighting them as is common in opinion polling.
3.3.2.3 Sample Size
Saunders et al. (2012) state that the sampling technique applied by a researcher when
conducting a study, denotes the size and the accuracy of the final sample size that he/she
chooses for the study. As noted, the study applied a census study, and as a result, the
sample size for the study were all 50 employees that worked at EABL.
26
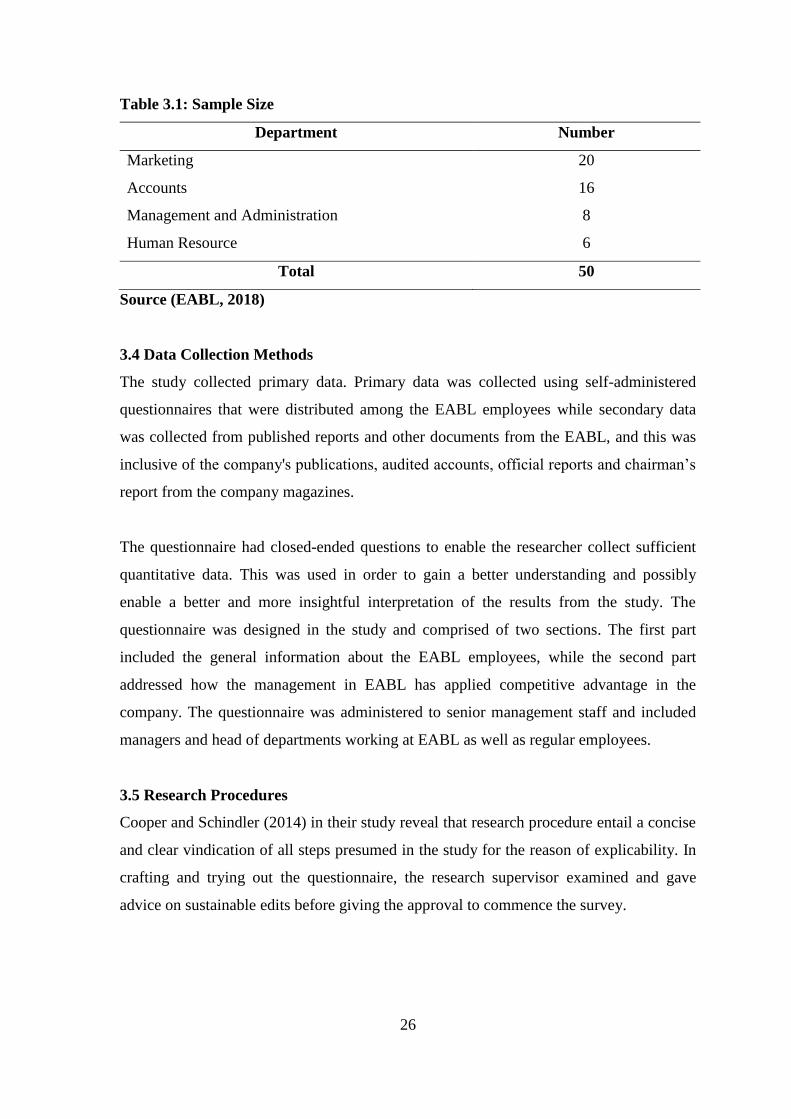
Table 3.1: Sample Size
Department Number
Marketing 20
Accounts 16
Management and Administration 8
Human Resource 6
Total 50
Source (EABL, 2018)
3.4 Data Collection Methods
The study collected primary data. Primary data was collected using self-administered
questionnaires that were distributed among the EABL employees while secondary data
was collected from published reports and other documents from the EABL, and this was
inclusive of the company's publications, audited accounts, official reports and chairman’s
report from the company magazines.
The questionnaire had closed-ended questions to enable the researcher collect sufficient
quantitative data. This was used in order to gain a better understanding and possibly
enable a better and more insightful interpretation of the results from the study. The
questionnaire was designed in the study and comprised of two sections. The first part
included the general information about the EABL employees, while the second part
addressed how the management in EABL has applied competitive advantage in the
company. The questionnaire was administered to senior management staff and included
managers and head of departments working at EABL as well as regular employees.
3.5 Research Procedures
Cooper and Schindler (2014) in their study reveal that research procedure entail a concise
and clear vindication of all steps presumed in the study for the reason of explicability. In
crafting and trying out the questionnaire, the research supervisor examined and gave
advice on sustainable edits before giving the approval to commence the survey.
27
A pilot program was carried out and amendments done to the final questionnaires that
were prepared and for data collection. The researcher used 5 employees to test the
validity and reliability of the questionnaire. The Cronbach Alpha test on the Statistical
Package for Social Sciences (SPSS) tool was used to examine the reliability. Any items
that had less than 0.07 Alpha coefficients were excluded from the final questionnaire.
This was done to ensure that the final instrument was reliable and valid to the study.
After the pilot, the researcher followed up with the research office for an official
introductory letter to send to the management of EABL for consent to carry the research
in the company. The researcher explained the purpose of the study. The approval from the
human resource department gave the researcher the permission to administer the
questionnaires to the employees during their working hours. In order to ensure high
response rate, the researcher gave respondents two weeks to fill the questionnaire and
frequent reminders were sent to the respondents.
3.6 Data Analysis Methods
Cooper and Schindler (2014) found that data analysis as a research technique for the
systematic and qualitative description of the clear content of a communication. To
enhance research quality, quantitative method of data analysis will be utilized. Babbie and
Mouton (2010) found that descriptive statistics entails a process of changing raw data to
tables and charts. Frequency distribution and percentages are critical in making sense of
data. SPSS program was used to analyze data. The findings were presented using tables
and figures.
Descriptive statistics was significant among the quantitative analysis. Before processing
the responses, the completed questionnaire was edited for completeness and consistency.
Percentages were used to analyze the study and gave presentations of how many
respondents agreed to a particular item within the questionnaire. Means were used to
weigh the strength/ significance of the rated items in the questionnaire. Standard
deviations were also employed to examine the difference among the responses that were
obtained from the population. This indicated the level of variance between responses that
had been obtained.
28
Inferential analysis was also be used in the study. Correlations analysis was used to
identify significant independent study factors (organizational factors, organizational
capabilities and organizational strategies) that influenced the dependent variable of the
study (competitive advantage). Simple regression in the form of Y= a + B1X1 + B2X2 +
B3X3 + ɛ. This was used to examine how each independent variable influenced the
dependent variable.
Where: a = Constant
B1 = Organizational Factors
B2 = Organizational Capabilities
B3 = Organizational Strategies
e = Error Value
3.7 Chapter Summary
This chapter has discussed the research methodology that was used in the study looking at
the different methods and procedures and research that was adopted to conduct the study.
The chapter has discussed in detail the research design, population and sampling design,
data collection methods, research procedures and the data analysis methods that were
used in the study. The next chapter presents the findings of the study.
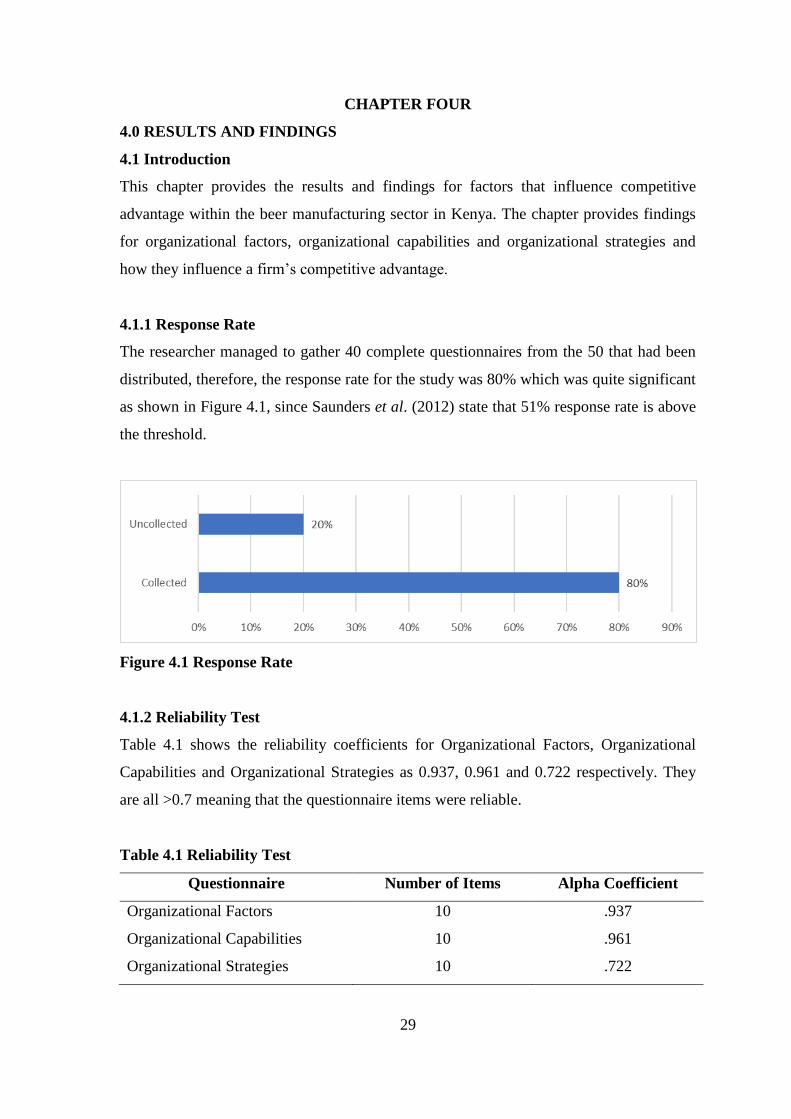
29
CHAPTER FOUR
4.0 RESULTS AND FINDINGS
4.1 Introduction
This chapter provides the results and findings for factors that influence competitive
advantage within the beer manufacturing sector in Kenya. The chapter provides findings
for organizational factors, organizational capabilities and organizational strategies and
how they influence a firm’s competitive advantage.
4.1.1 Response Rate
The researcher managed to gather 40 complete questionnaires from the 50 that had been
distributed, therefore, the response rate for the study was 80% which was quite significant
as shown in Figure 4.1, since Saunders et al. (2012) state that 51% response rate is above
the threshold.
Figure 4.1 Response Rate
4.1.2 Reliability Test
Table 4.1 shows the reliability coefficients for Organizational Factors, Organizational
Capabilities and Organizational Strategies as 0.937, 0.961 and 0.722 respectively. They
are all >0.7 meaning that the questionnaire items were reliable.
Table 4.1 Reliability Test
Questionnaire Number of Items Alpha Coefficient
Organizational Factors
Organizational Capabilities
Organizational Strategies
10
10
10
.937
.961
.722
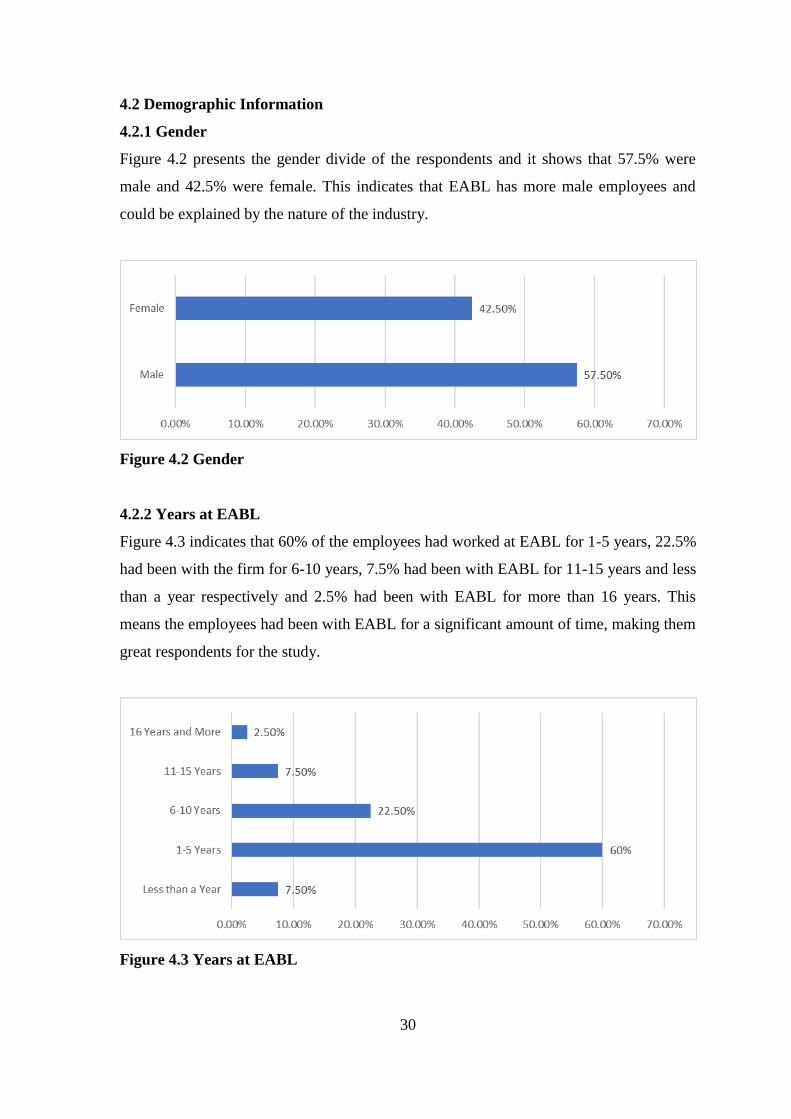
30
4.2 Demographic Information
4.2.1 Gender
Figure 4.2 presents the gender divide of the respondents and it shows that 57.5% were
male and 42.5% were female. This indicates that EABL has more male employees and
could be explained by the nature of the industry.
Figure 4.2 Gender
4.2.2 Years at EABL
Figure 4.3 indicates that 60% of the employees had worked at EABL for 1-5 years, 22.5%
had been with the firm for 6-10 years, 7.5% had been with EABL for 11-15 years and less
than a year respectively and 2.5% had been with EABL for more than 16 years. This
means the employees had been with EABL for a significant amount of time, making them
great respondents for the study.
Figure 4.3 Years at EABL
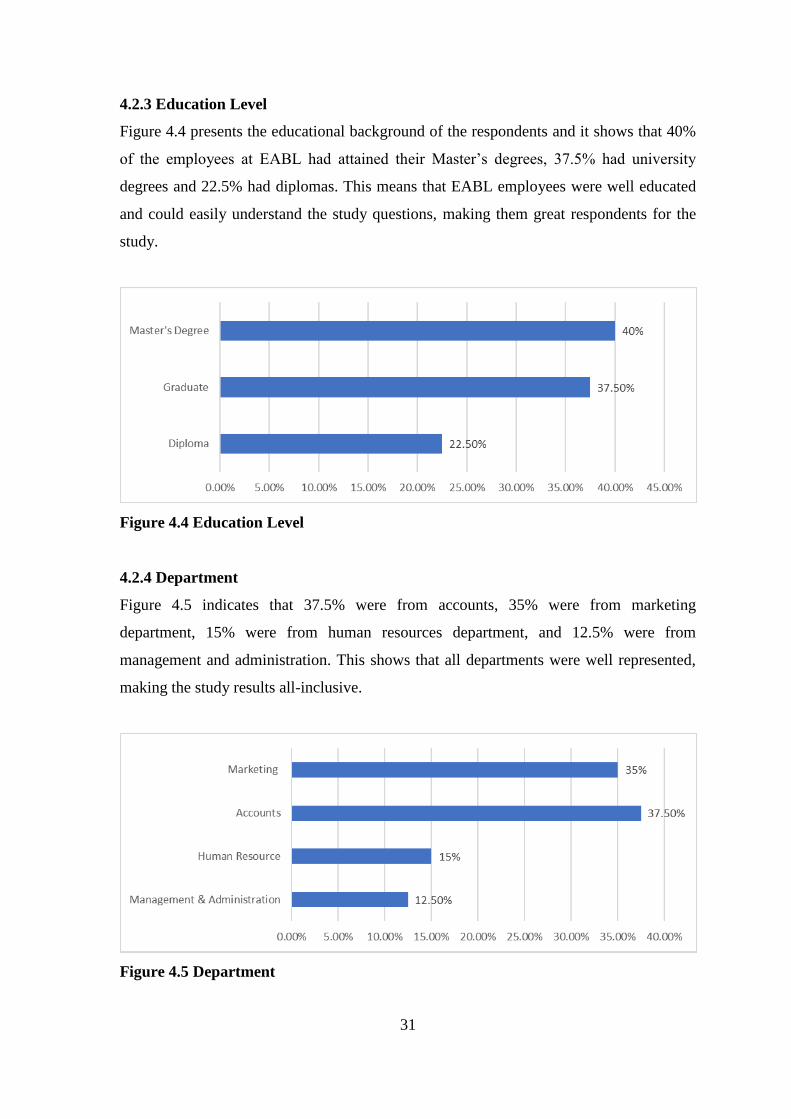
31
4.2.3 Education Level
Figure 4.4 presents the educational background of the respondents and it shows that 40%
of the employees at EABL had attained their Master’s degrees, 37.5% had university
degrees and 22.5% had diplomas. This means that EABL employees were well educated
and could easily understand the study questions, making them great respondents for the
study.
Figure 4.4 Education Level
4.2.4 Department
Figure 4.5 indicates that 37.5% were from accounts, 35% were from marketing
department, 15% were from human resources department, and 12.5% were from
management and administration. This shows that all departments were well represented,
making the study results all-inclusive.
Figure 4.5 Department
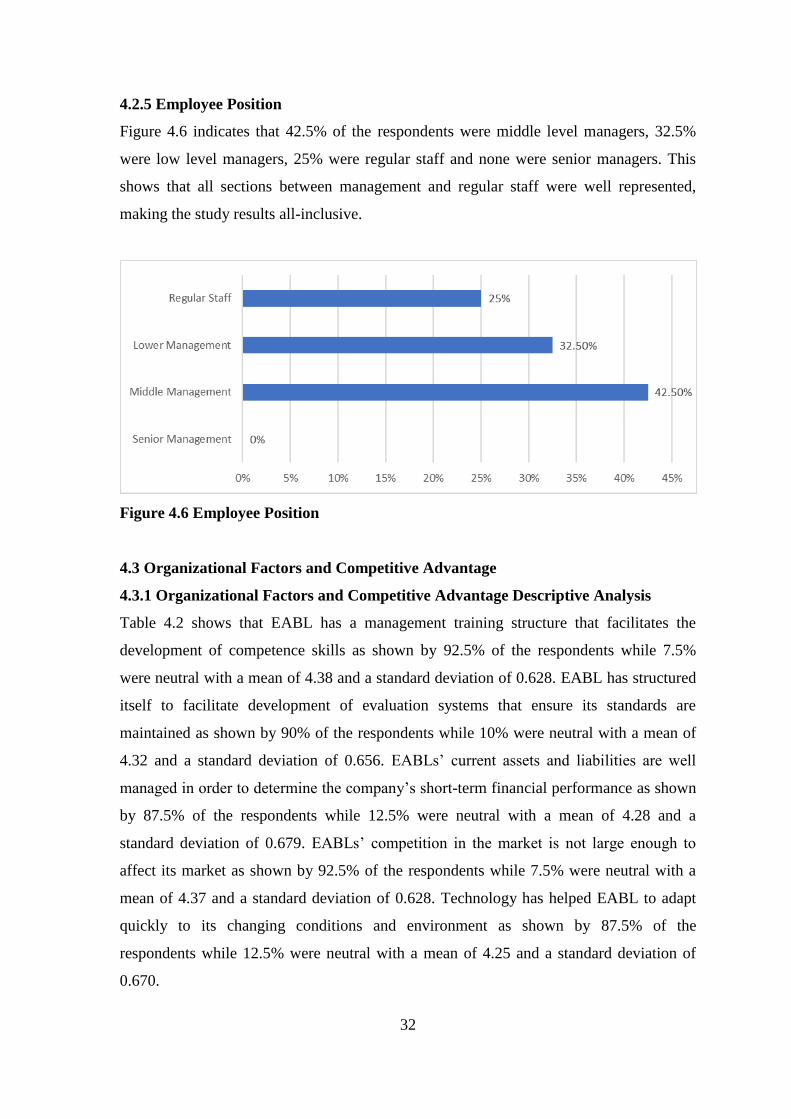
32
4.2.5 Employee Position
Figure 4.6 indicates that 42.5% of the respondents were middle level managers, 32.5%
were low level managers, 25% were regular staff and none were senior managers. This
shows that all sections between management and regular staff were well represented,
making the study results all-inclusive.
Figure 4.6 Employee Position
4.3 Organizational Factors and Competitive Advantage
4.3.1 Organizational Factors and Competitive Advantage Descriptive Analysis
Table 4.2 shows that EABL has a management training structure that facilitates the
development of competence skills as shown by 92.5% of the respondents while 7.5%
were neutral with a mean of 4.38 and a standard deviation of 0.628. EABL has structured
itself to facilitate development of evaluation systems that ensure its standards are
maintained as shown by 90% of the respondents while 10% were neutral with a mean of
4.32 and a standard deviation of 0.656. EABLs’ current assets and liabilities are well
managed in order to determine the company’s short-term financial performance as shown
by 87.5% of the respondents while 12.5% were neutral with a mean of 4.28 and a
standard deviation of 0.679. EABLs’ competition in the market is not large enough to
affect its market as shown by 92.5% of the respondents while 7.5% were neutral with a
mean of 4.37 and a standard deviation of 0.628. Technology has helped EABL to adapt
quickly to its changing conditions and environment as shown by 87.5% of the
respondents while 12.5% were neutral with a mean of 4.25 and a standard deviation of
0.670.
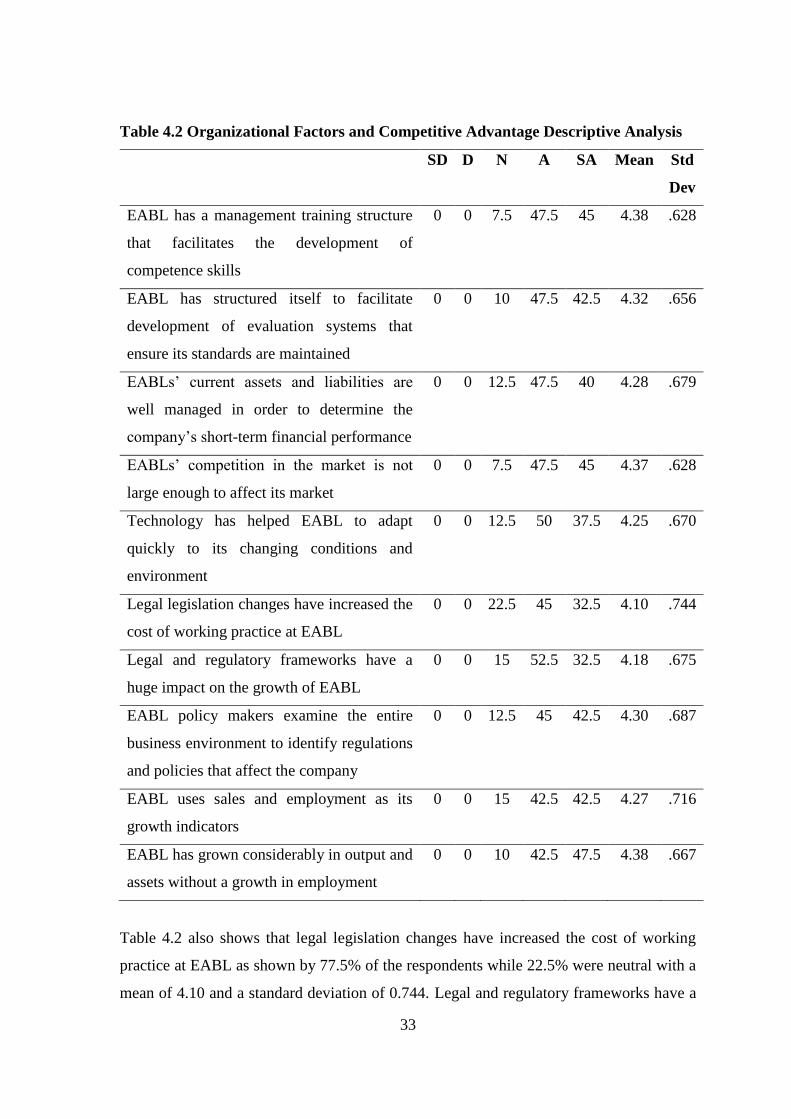
33
Table 4.2 Organizational Factors and Competitive Advantage Descriptive Analysis
SD D N A SA Mean Std
Dev
EABL has a management training structure
that facilitates the development of
competence skills
0 0 7.5 47.5 45 4.38 .628
EABL has structured itself to facilitate
development of evaluation systems that
ensure its standards are maintained
0 0 10 47.5 42.5 4.32 .656
EABLs’ current assets and liabilities are
well managed in order to determine the
company’s short-term financial performance
0 0 12.5 47.5 40 4.28 .679
EABLs’ competition in the market is not
large enough to affect its market
0 0 7.5 47.5 45 4.37 .628
Technology has helped EABL to adapt
quickly to its changing conditions and
environment
0 0 12.5 50 37.5 4.25 .670
Legal legislation changes have increased the
cost of working practice at EABL
0 0 22.5 45 32.5 4.10 .744
Legal and regulatory frameworks have a
huge impact on the growth of EABL
0 0 15 52.5 32.5 4.18 .675
EABL policy makers examine the entire
business environment to identify regulations
and policies that affect the company
0 0 12.5 45 42.5 4.30 .687
EABL uses sales and employment as its
growth indicators
0 0 15 42.5 42.5 4.27 .716
EABL has grown considerably in output and
assets without a growth in employment
0 0 10 42.5 47.5 4.38 .667
Table 4.2 also shows that legal legislation changes have increased the cost of working
practice at EABL as shown by 77.5% of the respondents while 22.5% were neutral with a
mean of 4.10 and a standard deviation of 0.744. Legal and regulatory frameworks have a
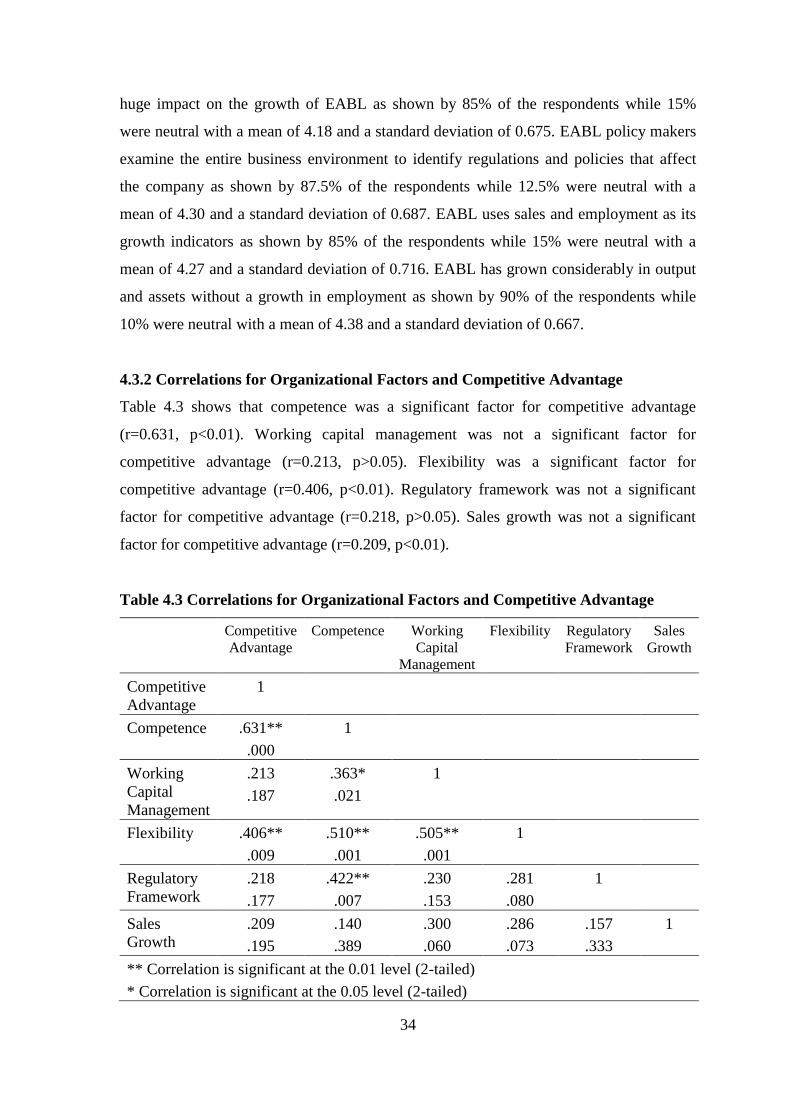
34
huge impact on the growth of EABL as shown by 85% of the respondents while 15%
were neutral with a mean of 4.18 and a standard deviation of 0.675. EABL policy makers
examine the entire business environment to identify regulations and policies that affect
the company as shown by 87.5% of the respondents while 12.5% were neutral with a
mean of 4.30 and a standard deviation of 0.687. EABL uses sales and employment as its
growth indicators as shown by 85% of the respondents while 15% were neutral with a
mean of 4.27 and a standard deviation of 0.716. EABL has grown considerably in output
and assets without a growth in employment as shown by 90% of the respondents while
10% were neutral with a mean of 4.38 and a standard deviation of 0.667.
4.3.2 Correlations for Organizational Factors and Competitive Advantage
Table 4.3 shows that competence was a significant factor for competitive advantage
(r=0.631, p<0.01). Working capital management was not a significant factor for
competitive advantage (r=0.213, p>0.05). Flexibility was a significant factor for
competitive advantage (r=0.406, p<0.01). Regulatory framework was not a significant
factor for competitive advantage (r=0.218, p>0.05). Sales growth was not a significant
factor for competitive advantage (r=0.209, p<0.01).
Table 4.3 Correlations for Organizational Factors and Competitive Advantage
Competitive
Advantage
Competence Working
Capital
Management
Flexibility Regulatory
Framework
Sales
Growth
Competitive
Advantage
1
Competence .631**
.000
1
Working
Capital
Management
.213
.187
.363*
.021
1
Flexibility .406**
.009
.510**
.001
.505**
.001
1
Regulatory
Framework
.218
.177
.422**
.007
.230
.153
.281
.080
1
Sales
Growth
.209
.195
.140
.389
.300
.060
.286
.073
.157
.333
1
** Correlation is significant at the 0.01 level (2-tailed)
* Correlation is significant at the 0.05 level (2-tailed)
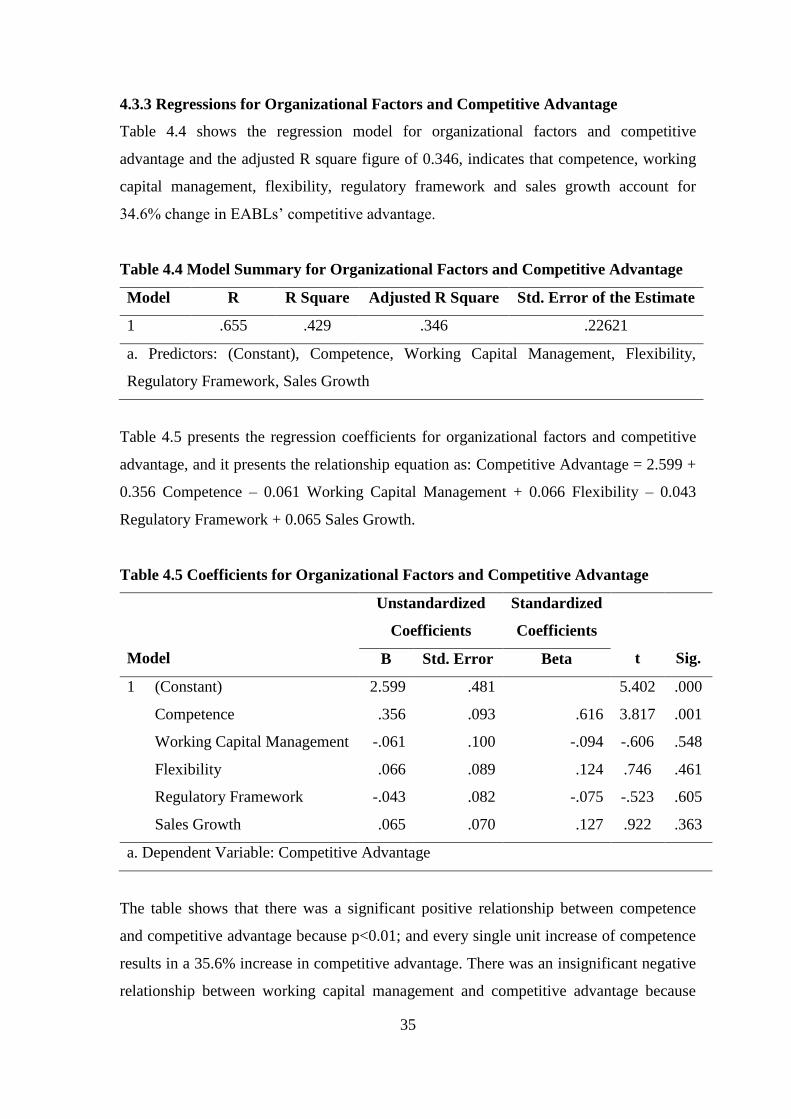
35
4.3.3 Regressions for Organizational Factors and Competitive Advantage
Table 4.4 shows the regression model for organizational factors and competitive
advantage and the adjusted R square figure of 0.346, indicates that competence, working
capital management, flexibility, regulatory framework and sales growth account for
34.6% change in EABLs’ competitive advantage.
Table 4.4 Model Summary for Organizational Factors and Competitive Advantage
Model R R Square Adjusted R Square Std. Error of the Estimate
1 .655 .429 .346 .22621
a. Predictors: (Constant), Competence, Working Capital Management, Flexibility,
Regulatory Framework, Sales Growth
Table 4.5 presents the regression coefficients for organizational factors and competitive
advantage, and it presents the relationship equation as: Competitive Advantage = 2.599 +
0.356 Competence – 0.061 Working Capital Management + 0.066 Flexibility – 0.043
Regulatory Framework + 0.065 Sales Growth.
Table 4.5 Coefficients for Organizational Factors and Competitive Advantage
Model
Unstandardized
Coefficients
Standardized
Coefficients
t
Sig. B Std. Error Beta
1 (Constant)
Competence
Working Capital Management
Flexibility
Regulatory Framework
Sales Growth
2.599
.356
-.061
.066
-.043
.065
.481
.093
.100
.089
.082
.070
.616
-.094
.124
-.075
.127
5.402
3.817
-.606
.746
-.523
.922
.000
.001
.548
.461
.605
.363
a. Dependent Variable: Competitive Advantage
The table shows that there was a significant positive relationship between competence
and competitive advantage because p<0.01; and every single unit increase of competence
results in a 35.6% increase in competitive advantage. There was an insignificant negative
relationship between working capital management and competitive advantage because
36
p>0.05; and every single unit increase of working capital management results in a 6.1%
decrease in competitive advantage because of the reverse relationship. This shows that
there was an insignificant positive relationship between flexibility and competitive
advantage because p>0.05; and every single unit increase of flexibility results in a 6.6%
increase in competitive advantage.
There was an insignificant negative relationship between regulatory framework and
competitive advantage because p>0.05; and every single unit increase of regulatory
framework results in a 4.3% decrease in competitive advantage because of the reverse
relationship. This shows that there was an insignificant positive relationship between
sales growth and competitive advantage because p>0.05; and every single unit increase of
sales growth results in a 6.5% increase in competitive advantage.
4.4 Organizational Capabilities and Competitive Advantage
4.4.1 Organizational Capabilities and Competitive Advantage Descriptive Analysis
Table 4.6 shows that EABL has ensured that it has every employee in the company doing
the right things as shown by 80% of the respondents while 20% were neutral with a mean
of 4.05 and a standard deviation of 0.667. EABL’s management has major strategies in
place that govern the use of the firm’s resources as shown by 87.5% of the respondents
while 12.5% were neutral with a mean of 4.32 and a standard deviation of 0.694. EABL
has acquired and developed attributes that allow it to outperform its competitors as shown
by 87.5% of the respondents while 12.5% were neutral with a mean of 4.28 and a
standard deviation of 0.679. EABL has developed strategic partnerships with suppliers in
order to deliver the right products at the right time as shown by 70% of the respondents
while 30% were neutral with a mean of 3.92 and a standard deviation of 0.730.
EABL is fast changing in order to cope with the needs of its dynamic environment as
shown by 90% of the respondents while 10% were neutral with a mean of 4.22 and a
standard deviation of 0.620. EABL has a well thought out strategic plan that details how
the firm intends to capture its target market as shown by 85% of the respondents while
15% were neutral with a mean of 4.18 and a standard deviation of 0.675. EABL maintains
leadership in the market place by designing and implementing sound marketing plans as
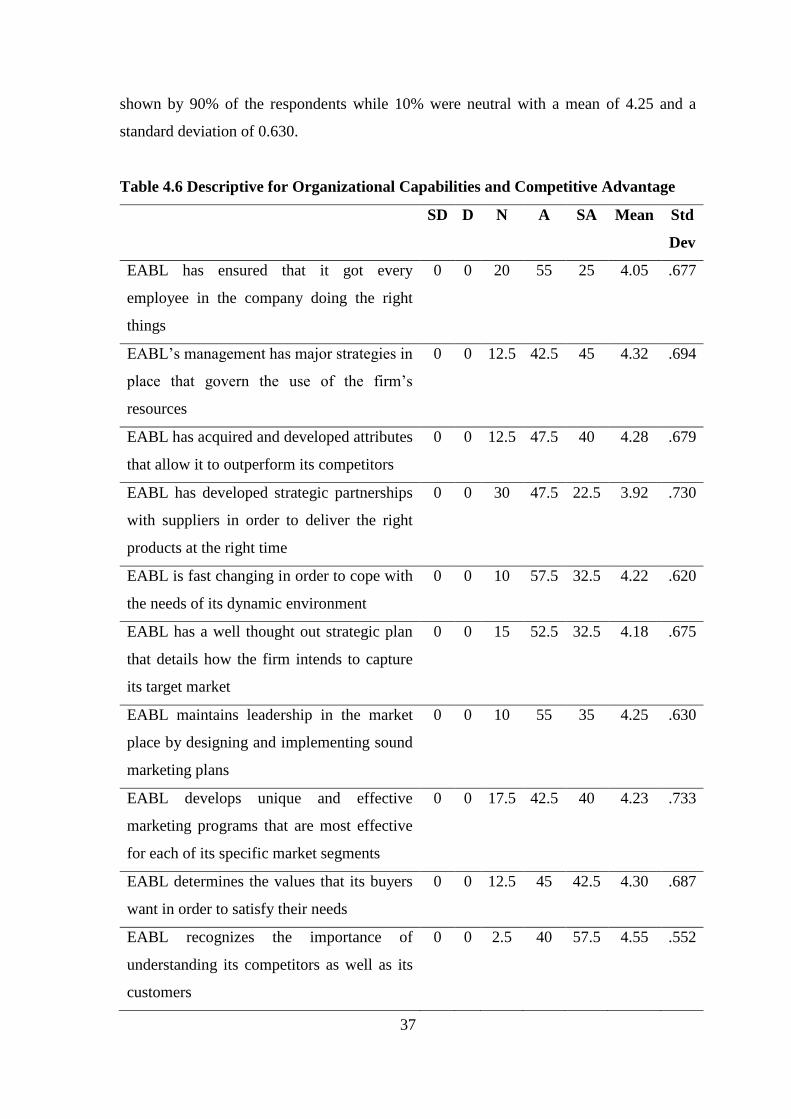
37
shown by 90% of the respondents while 10% were neutral with a mean of 4.25 and a
standard deviation of 0.630.
Table 4.6 Descriptive for Organizational Capabilities and Competitive Advantage
SD D N A SA Mean Std
Dev
EABL has ensured that it got every
employee in the company doing the right
things
0 0 20 55 25 4.05 .677
EABL’s management has major strategies in
place that govern the use of the firm’s
resources
0 0 12.5 42.5 45 4.32 .694
EABL has acquired and developed attributes
that allow it to outperform its competitors
0 0 12.5 47.5 40 4.28 .679
EABL has developed strategic partnerships
with suppliers in order to deliver the right
products at the right time
0 0 30 47.5 22.5 3.92 .730
EABL is fast changing in order to cope with
the needs of its dynamic environment
0 0 10 57.5 32.5 4.22 .620
EABL has a well thought out strategic plan
that details how the firm intends to capture
its target market
0 0 15 52.5 32.5 4.18 .675
EABL maintains leadership in the market
place by designing and implementing sound
marketing plans
0 0 10 55 35 4.25 .630
EABL develops unique and effective
marketing programs that are most effective
for each of its specific market segments
0 0 17.5 42.5 40 4.23 .733
EABL determines the values that its buyers
want in order to satisfy their needs
0 0 12.5 45 42.5 4.30 .687
EABL recognizes the importance of
understanding its competitors as well as its
customers
0 0 2.5 40 57.5 4.55 .552
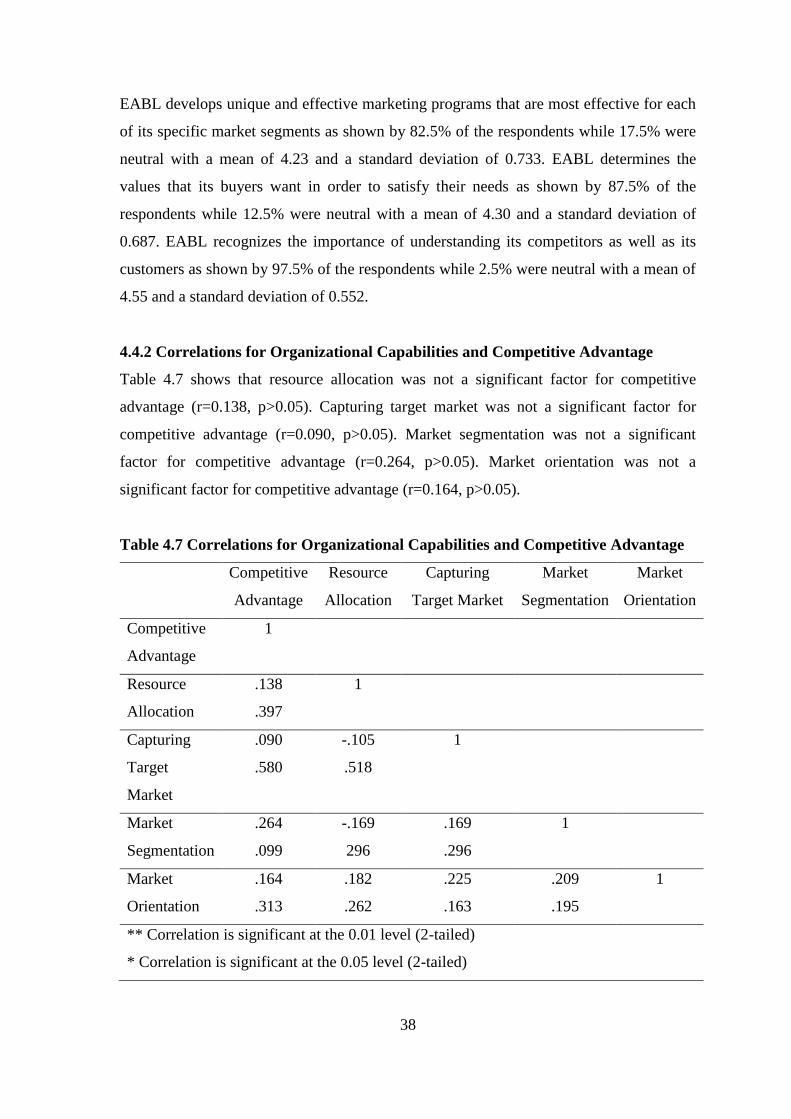
38
EABL develops unique and effective marketing programs that are most effective for each
of its specific market segments as shown by 82.5% of the respondents while 17.5% were
neutral with a mean of 4.23 and a standard deviation of 0.733. EABL determines the
values that its buyers want in order to satisfy their needs as shown by 87.5% of the
respondents while 12.5% were neutral with a mean of 4.30 and a standard deviation of
0.687. EABL recognizes the importance of understanding its competitors as well as its
customers as shown by 97.5% of the respondents while 2.5% were neutral with a mean of
4.55 and a standard deviation of 0.552.
4.4.2 Correlations for Organizational Capabilities and Competitive Advantage
Table 4.7 shows that resource allocation was not a significant factor for competitive
advantage (r=0.138, p>0.05). Capturing target market was not a significant factor for
competitive advantage (r=0.090, p>0.05). Market segmentation was not a significant
factor for competitive advantage (r=0.264, p>0.05). Market orientation was not a
significant factor for competitive advantage (r=0.164, p>0.05).
Table 4.7 Correlations for Organizational Capabilities and Competitive Advantage
Competitive
Advantage
Resource
Allocation
Capturing
Target Market
Market
Segmentation
Market
Orientation
Competitive
Advantage
1
Resource
Allocation
.138
.397
1
Capturing
Target
Market
.090
.580
-.105
.518
1
Market
Segmentation
.264
.099
-.169
296
.169
.296
1
Market
Orientation
.164
.313
.182
.262
.225
.163
.209
.195
1
** Correlation is significant at the 0.01 level (2-tailed)
* Correlation is significant at the 0.05 level (2-tailed)
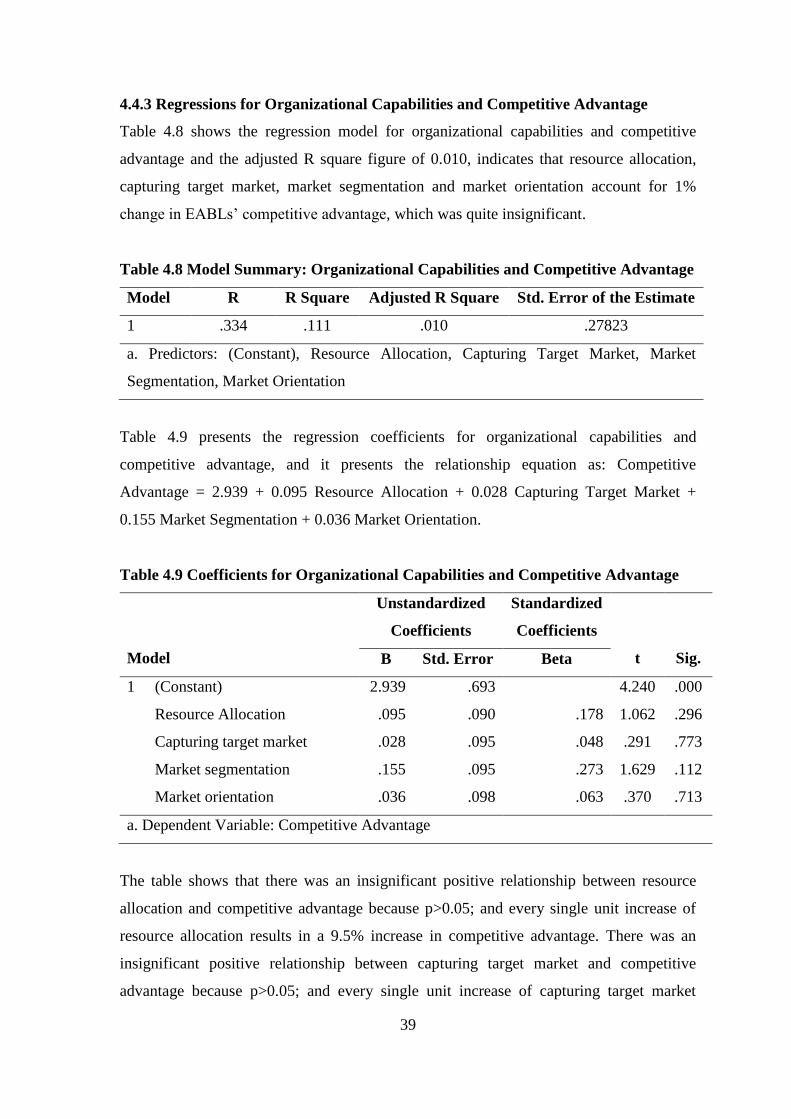
39
4.4.3 Regressions for Organizational Capabilities and Competitive Advantage
Table 4.8 shows the regression model for organizational capabilities and competitive
advantage and the adjusted R square figure of 0.010, indicates that resource allocation,
capturing target market, market segmentation and market orientation account for 1%
change in EABLs’ competitive advantage, which was quite insignificant.
Table 4.8 Model Summary: Organizational Capabilities and Competitive Advantage
Model R R Square Adjusted R Square Std. Error of the Estimate
1 .334 .111 .010 .27823
a. Predictors: (Constant), Resource Allocation, Capturing Target Market, Market
Segmentation, Market Orientation
Table 4.9 presents the regression coefficients for organizational capabilities and
competitive advantage, and it presents the relationship equation as: Competitive
Advantage = 2.939 + 0.095 Resource Allocation + 0.028 Capturing Target Market +
0.155 Market Segmentation + 0.036 Market Orientation.
Table 4.9 Coefficients for Organizational Capabilities and Competitive Advantage
Model
Unstandardized
Coefficients
Standardized
Coefficients
t
Sig. B Std. Error Beta
1 (Constant)
Resource Allocation
Capturing target market
Market segmentation
Market orientation
2.939
.095
.028
.155
.036
.693
.090
.095
.095
.098
.178
.048
.273
.063
4.240
1.062
.291
1.629
.370
.000
.296
.773
.112
.713
a. Dependent Variable: Competitive Advantage
The table shows that there was an insignificant positive relationship between resource
allocation and competitive advantage because p>0.05; and every single unit increase of
resource allocation results in a 9.5% increase in competitive advantage. There was an
insignificant positive relationship between capturing target market and competitive
advantage because p>0.05; and every single unit increase of capturing target market
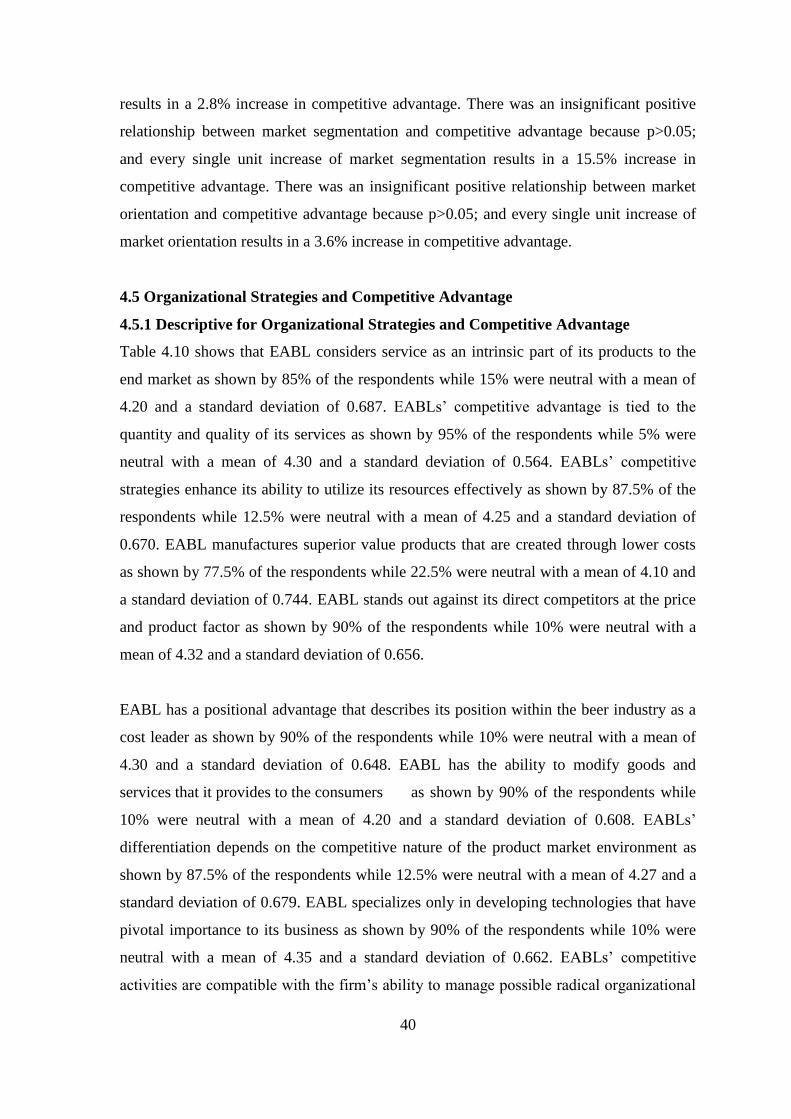
40
results in a 2.8% increase in competitive advantage. There was an insignificant positive
relationship between market segmentation and competitive advantage because p>0.05;
and every single unit increase of market segmentation results in a 15.5% increase in
competitive advantage. There was an insignificant positive relationship between market
orientation and competitive advantage because p>0.05; and every single unit increase of
market orientation results in a 3.6% increase in competitive advantage.
4.5 Organizational Strategies and Competitive Advantage
4.5.1 Descriptive for Organizational Strategies and Competitive Advantage
Table 4.10 shows that EABL considers service as an intrinsic part of its products to the
end market as shown by 85% of the respondents while 15% were neutral with a mean of
4.20 and a standard deviation of 0.687. EABLs’ competitive advantage is tied to the
quantity and quality of its services as shown by 95% of the respondents while 5% were
neutral with a mean of 4.30 and a standard deviation of 0.564. EABLs’ competitive
strategies enhance its ability to utilize its resources effectively as shown by 87.5% of the
respondents while 12.5% were neutral with a mean of 4.25 and a standard deviation of
0.670. EABL manufactures superior value products that are created through lower costs
as shown by 77.5% of the respondents while 22.5% were neutral with a mean of 4.10 and
a standard deviation of 0.744. EABL stands out against its direct competitors at the price
and product factor as shown by 90% of the respondents while 10% were neutral with a
mean of 4.32 and a standard deviation of 0.656.
EABL has a positional advantage that describes its position within the beer industry as a
cost leader as shown by 90% of the respondents while 10% were neutral with a mean of
4.30 and a standard deviation of 0.648. EABL has the ability to modify goods and
services that it provides to the consumers as shown by 90% of the respondents while
10% were neutral with a mean of 4.20 and a standard deviation of 0.608. EABLs’
differentiation depends on the competitive nature of the product market environment as
shown by 87.5% of the respondents while 12.5% were neutral with a mean of 4.27 and a
standard deviation of 0.679. EABL specializes only in developing technologies that have
pivotal importance to its business as shown by 90% of the respondents while 10% were
neutral with a mean of 4.35 and a standard deviation of 0.662. EABLs’ competitive
activities are compatible with the firm’s ability to manage possible radical organizational
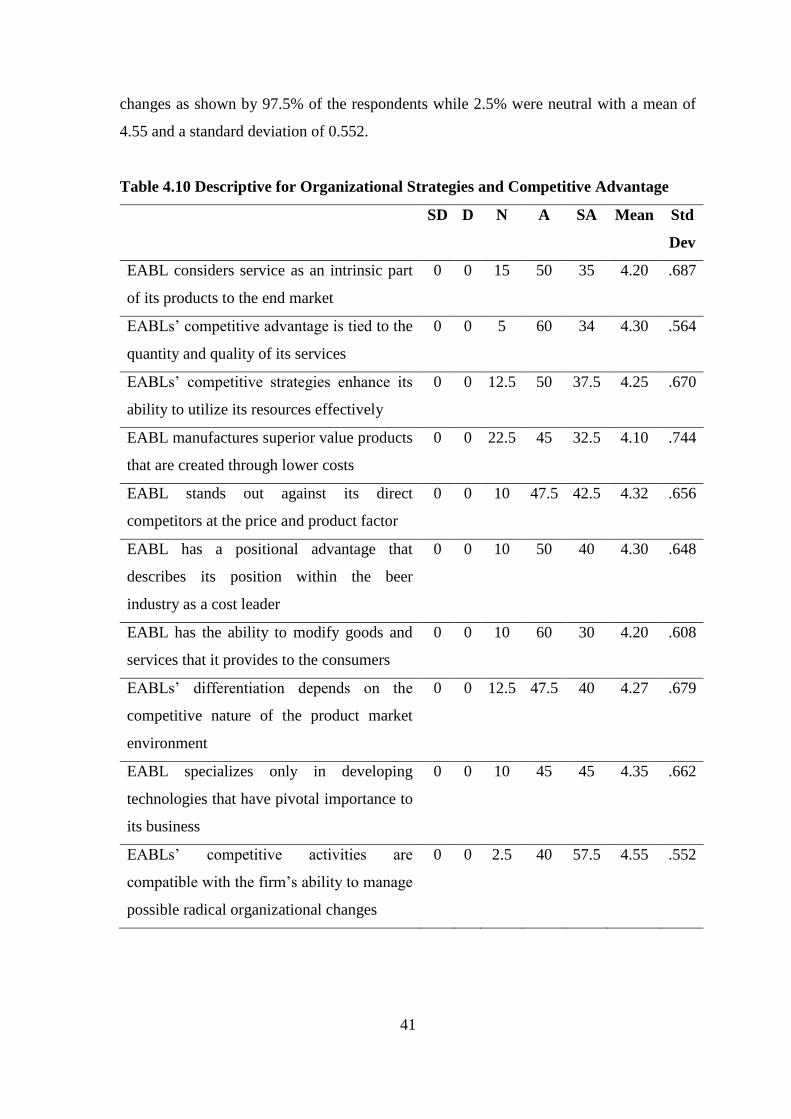
41
changes as shown by 97.5% of the respondents while 2.5% were neutral with a mean of
4.55 and a standard deviation of 0.552.
Table 4.10 Descriptive for Organizational Strategies and Competitive Advantage
SD D N A SA Mean Std
Dev
EABL considers service as an intrinsic part
of its products to the end market
0 0 15 50 35 4.20 .687
EABLs’ competitive advantage is tied to the
quantity and quality of its services
0 0 5 60 34 4.30 .564
EABLs’ competitive strategies enhance its
ability to utilize its resources effectively
0 0 12.5 50 37.5 4.25 .670
EABL manufactures superior value products
that are created through lower costs
0 0 22.5 45 32.5 4.10 .744
EABL stands out against its direct
competitors at the price and product factor
0 0 10 47.5 42.5 4.32 .656
EABL has a positional advantage that
describes its position within the beer
industry as a cost leader
0 0 10 50 40 4.30 .648
EABL has the ability to modify goods and
services that it provides to the consumers
0 0 10 60 30 4.20 .608
EABLs’ differentiation depends on the
competitive nature of the product market
environment
0 0 12.5 47.5 40 4.27 .679
EABL specializes only in developing
technologies that have pivotal importance to
its business
0 0 10 45 45 4.35 .662
EABLs’ competitive activities are
compatible with the firm’s ability to manage
possible radical organizational changes
0 0 2.5 40 57.5 4.55 .552
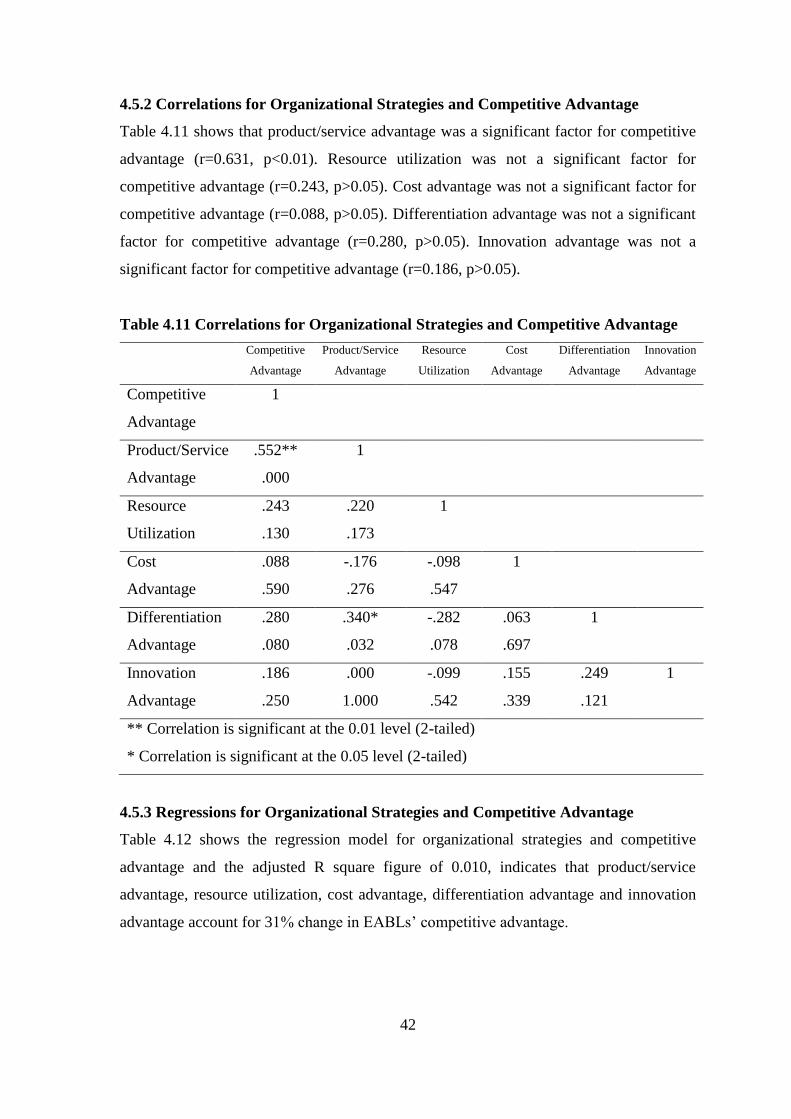
42
4.5.2 Correlations for Organizational Strategies and Competitive Advantage
Table 4.11 shows that product/service advantage was a significant factor for competitive
advantage (r=0.631, p<0.01). Resource utilization was not a significant factor for
competitive advantage (r=0.243, p>0.05). Cost advantage was not a significant factor for
competitive advantage (r=0.088, p>0.05). Differentiation advantage was not a significant
factor for competitive advantage (r=0.280, p>0.05). Innovation advantage was not a
significant factor for competitive advantage (r=0.186, p>0.05).
Table 4.11 Correlations for Organizational Strategies and Competitive Advantage
Competitive
Advantage
Product/Service
Advantage
Resource
Utilization
Cost
Advantage
Differentiation
Advantage
Innovation
Advantage
Competitive
Advantage
1
Product/Service
Advantage
.552**
.000
1
Resource
Utilization
.243
.130
.220
.173
1
Cost
Advantage
.088
.590
-.176
.276
-.098
.547
1
Differentiation
Advantage
.280
.080
.340*
.032
-.282
.078
.063
.697
1
Innovation
Advantage
.186
.250
.000
1.000
-.099
.542
.155
.339
.249
.121
1
** Correlation is significant at the 0.01 level (2-tailed)
* Correlation is significant at the 0.05 level (2-tailed)
4.5.3 Regressions for Organizational Strategies and Competitive Advantage
Table 4.12 shows the regression model for organizational strategies and competitive
advantage and the adjusted R square figure of 0.010, indicates that product/service
advantage, resource utilization, cost advantage, differentiation advantage and innovation
advantage account for 31% change in EABLs’ competitive advantage.
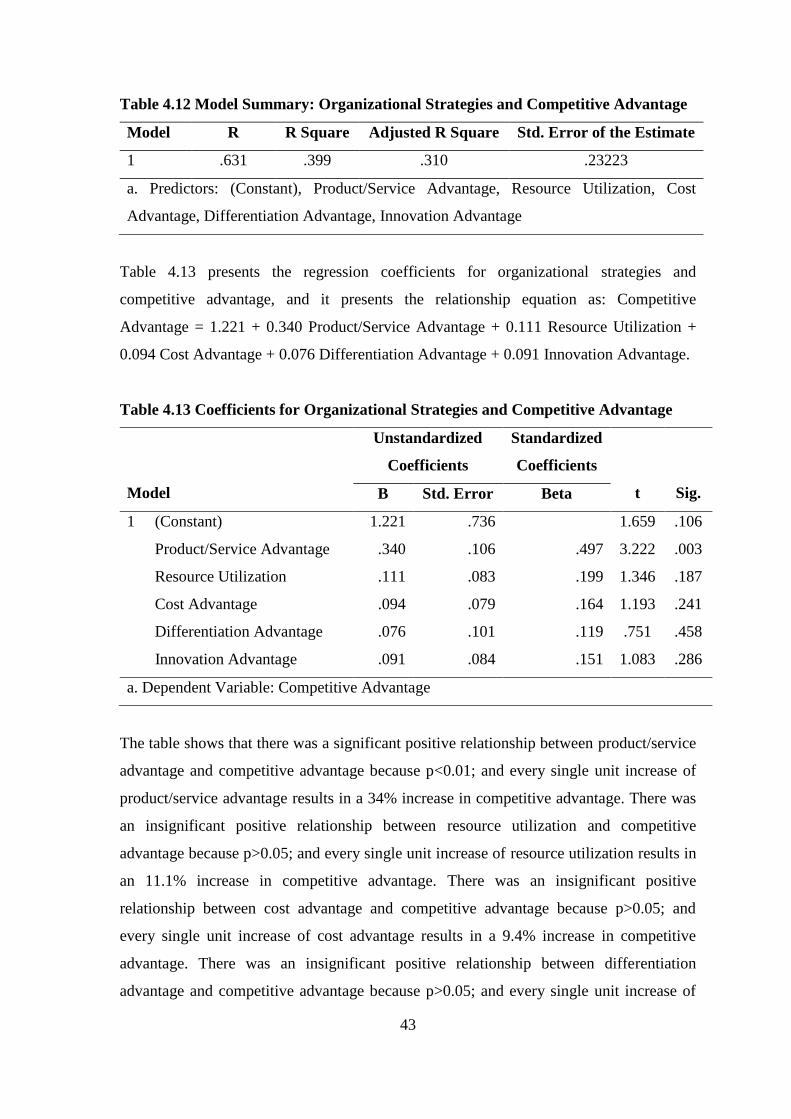
43
Table 4.12 Model Summary: Organizational Strategies and Competitive Advantage
Model R R Square Adjusted R Square Std. Error of the Estimate
1 .631 .399 .310 .23223
a. Predictors: (Constant), Product/Service Advantage, Resource Utilization, Cost
Advantage, Differentiation Advantage, Innovation Advantage
Table 4.13 presents the regression coefficients for organizational strategies and
competitive advantage, and it presents the relationship equation as: Competitive
Advantage = 1.221 + 0.340 Product/Service Advantage + 0.111 Resource Utilization +
0.094 Cost Advantage + 0.076 Differentiation Advantage + 0.091 Innovation Advantage.
Table 4.13 Coefficients for Organizational Strategies and Competitive Advantage
Model
Unstandardized
Coefficients
Standardized
Coefficients
t
Sig. B Std. Error Beta
1 (Constant)
Product/Service Advantage
Resource Utilization
Cost Advantage
Differentiation Advantage
Innovation Advantage
1.221
.340
.111
.094
.076
.091
.736
.106
.083
.079
.101
.084
.497
.199
.164
.119
.151
1.659
3.222
1.346
1.193
.751
1.083
.106
.003
.187
.241
.458
.286
a. Dependent Variable: Competitive Advantage
The table shows that there was a significant positive relationship between product/service
advantage and competitive advantage because p<0.01; and every single unit increase of
product/service advantage results in a 34% increase in competitive advantage. There was
an insignificant positive relationship between resource utilization and competitive
advantage because p>0.05; and every single unit increase of resource utilization results in
an 11.1% increase in competitive advantage. There was an insignificant positive
relationship between cost advantage and competitive advantage because p>0.05; and
every single unit increase of cost advantage results in a 9.4% increase in competitive
advantage. There was an insignificant positive relationship between differentiation
advantage and competitive advantage because p>0.05; and every single unit increase of
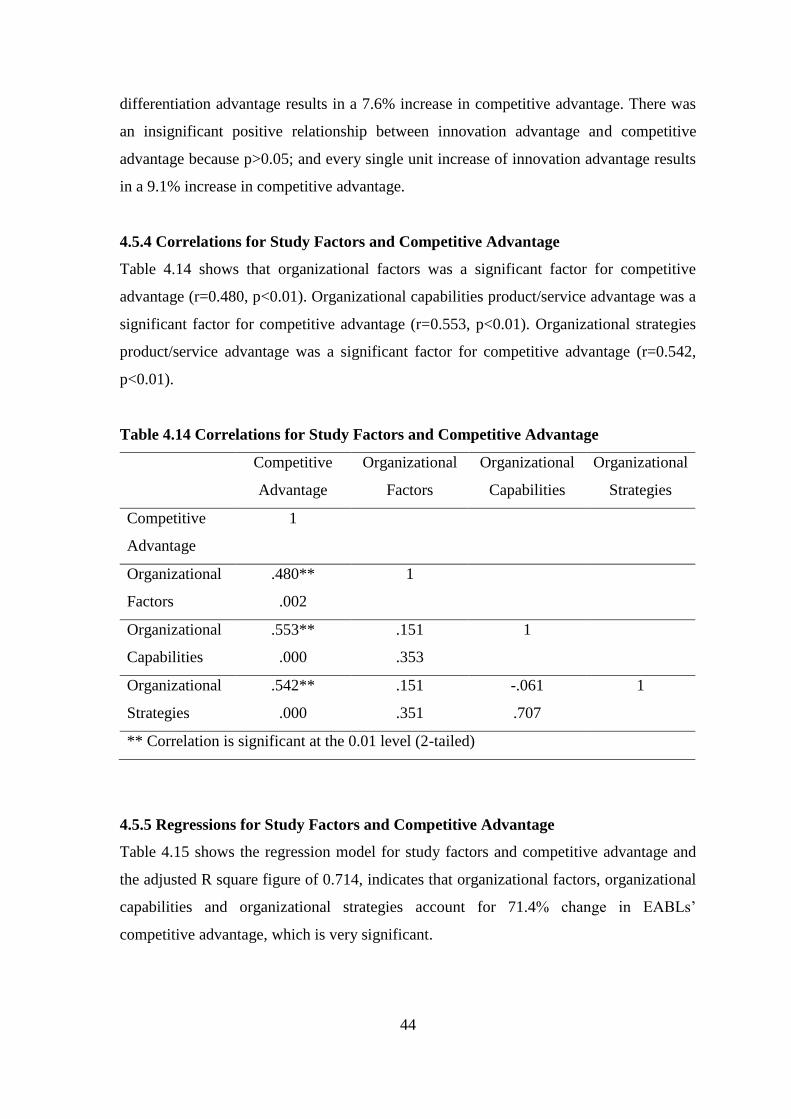
44
differentiation advantage results in a 7.6% increase in competitive advantage. There was
an insignificant positive relationship between innovation advantage and competitive
advantage because p>0.05; and every single unit increase of innovation advantage results
in a 9.1% increase in competitive advantage.
4.5.4 Correlations for Study Factors and Competitive Advantage
Table 4.14 shows that organizational factors was a significant factor for competitive
advantage (r=0.480, p<0.01). Organizational capabilities product/service advantage was a
significant factor for competitive advantage (r=0.553, p<0.01). Organizational strategies
product/service advantage was a significant factor for competitive advantage (r=0.542,
p<0.01).
Table 4.14 Correlations for Study Factors and Competitive Advantage
Competitive
Advantage
Organizational
Factors
Organizational
Capabilities
Organizational
Strategies
Competitive
Advantage
1
Organizational
Factors
.480**
.002
1
Organizational
Capabilities
.553**
.000
.151
.353
1
Organizational
Strategies
.542**
.000
.151
.351
-.061
.707
1
** Correlation is significant at the 0.01 level (2-tailed)
4.5.5 Regressions for Study Factors and Competitive Advantage
Table 4.15 shows the regression model for study factors and competitive advantage and
the adjusted R square figure of 0.714, indicates that organizational factors, organizational
capabilities and organizational strategies account for 71.4% change in EABLs’
competitive advantage, which is very significant.
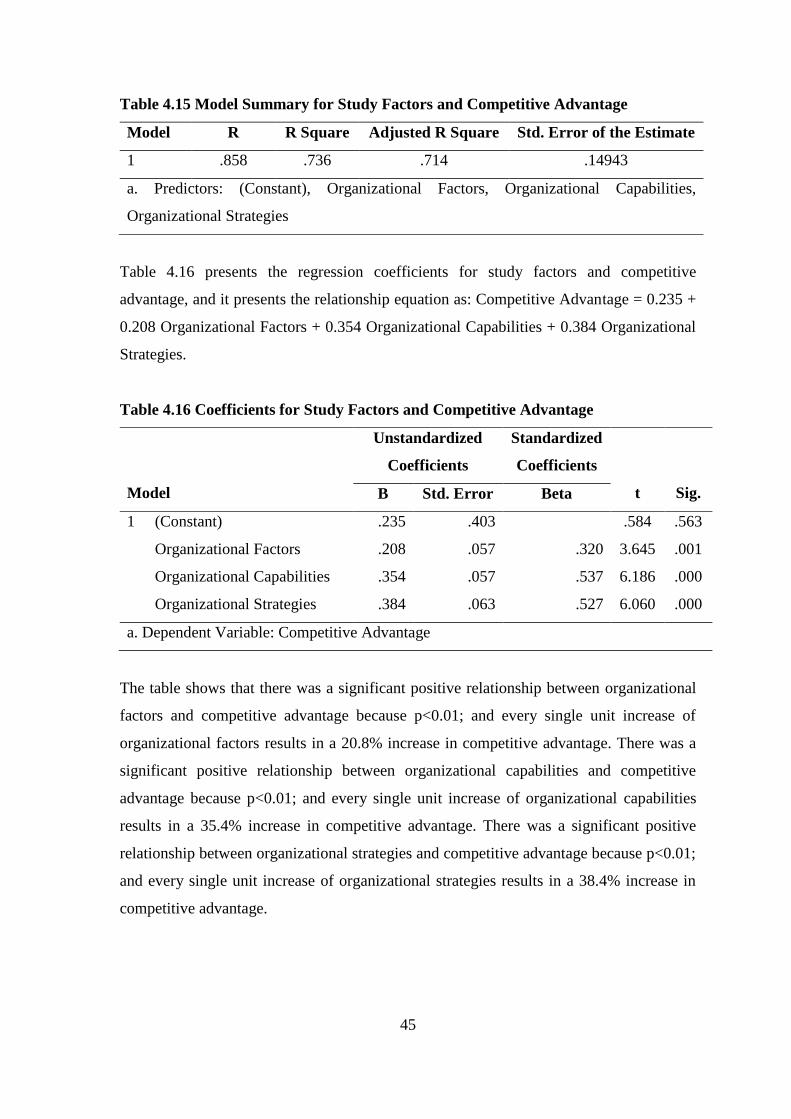
45
Table 4.15 Model Summary for Study Factors and Competitive Advantage
Model R R Square Adjusted R Square Std. Error of the Estimate
1 .858 .736 .714 .14943
a. Predictors: (Constant), Organizational Factors, Organizational Capabilities,
Organizational Strategies
Table 4.16 presents the regression coefficients for study factors and competitive
advantage, and it presents the relationship equation as: Competitive Advantage = 0.235 +
0.208 Organizational Factors + 0.354 Organizational Capabilities + 0.384 Organizational
Strategies.
Table 4.16 Coefficients for Study Factors and Competitive Advantage
Model
Unstandardized
Coefficients
Standardized
Coefficients
t
Sig. B Std. Error Beta
1 (Constant)
Organizational Factors
Organizational Capabilities
Organizational Strategies
.235
.208
.354
.384
.403
.057
.057
.063
.320
.537
.527
.584
3.645
6.186
6.060
.563
.001
.000
.000
a. Dependent Variable: Competitive Advantage
The table shows that there was a significant positive relationship between organizational
factors and competitive advantage because p<0.01; and every single unit increase of
organizational factors results in a 20.8% increase in competitive advantage. There was a
significant positive relationship between organizational capabilities and competitive
advantage because p<0.01; and every single unit increase of organizational capabilities
results in a 35.4% increase in competitive advantage. There was a significant positive
relationship between organizational strategies and competitive advantage because p<0.01;
and every single unit increase of organizational strategies results in a 38.4% increase in
competitive advantage.
46
4.6 Chapter Summary
This chapter has provided the results and findings for factors that influence competitive
advantage within the beer manufacturing sector in Kenya. The chapter has provided
findings for organizational factors and how they influence a firm’s competitive
advantage, organizational capabilities and how they provide a firm with competitive
advantage, and organizational strategies and how they influence a firm’s competitive
advantage. The next chapter focuses on the study’s discussions, conclusions and
recommendations.
47
CHAPTER FIVE
5.0 DISCUSSIONS, CONCLUSIONS AND RECOMMENDATIONS
5.1 Introduction
This chapter provides the discussions, conclusions and recommendations for factors that
influence competitive advantage within the beer manufacturing sector in Kenya. The
chapter provides discussions based on the analyzed data and findings for organizational
factors, organizational capabilities and organizational strategies and how they influence a
firm’s competitive advantage.
5.2 Summary of the Study
This study examined the factors that influence competitive advantage within the beer
manufacturing sector in Kenya with a focus on EABL. The study was guided by the
following research questions: what is the influence of organizational factors on the firm’s
competitive advantage? how do organizational capabilities provide the firm with
competitive advantage? and what is the influence of organizational strategies on the
firm’s competitive advantage?
The study was modelled on a descriptive design. The population of the study was all staff
that worked in all the departments at EABL who were 50 in total. The sample frame
involved employees in EABL and was obtained from the human resource office in
Ruaraka. Census method was used in the study, thus the sample size for the study was all
the 50 employees. Primary data was collected using self-administered questionnaire
which was piloted for reliability and consistency. Data was analyzed using descriptive
statistics. Percentages were used to analyze the study and gave presentations of how many
respondents agreed to a particular item within the questionnaire. Means were used to
weigh the strength/ significance of the rated items in the questionnaire. Standard
deviations were also employed to examine the difference among the responses that were
obtained from the population. Inferential analysis of correlations and regressions were
used in the study. Analyzed data was presented using tables and figures.
The study revealed that EABL has a management training structure in place that
facilitates the development of competence skills, as well as evaluation systems that ensure
its standards are maintained. The firm’s current assets and liabilities are well managed in
48
order to determine short-term financial performance, and its competition in the market is
not large enough to affect its market, because the firm has leveraged on technology to
adapt quickly to its changing conditions and environment. Legal legislation changes have
increased the cost of working practice for the firm, meaning that the legal regulatory
framework impact the firm’s growth immensely. However, the firm has policy makers
who examine the entire business environment to identify regulations and policies that
affect the company. The firm uses sales and employment as its growth indicators, and it
has grown considerably in output and assets without a growth in employment.
The study indicated that EABL has ensured that all its employees are doing the right
things by ensuring that its management puts in place strategies that govern the use of its
resources. The firm has acquired and developed attributes, like developing strategic
partnerships with suppliers in order to deliver the right products at the right time, which
allow it to outperform its competitors. The company is fast changing in order to cope with
the needs of its dynamic environment, and as such, it has a well-thought-out strategic plan
that details how it intends to capture its target market, maintain leadership in the market
place by designing and implementing sound marketing plans, and developing unique and
effective marketing programs that are most effective for each of its specific market
segments. The firm determines the values that its customers want in order to satisfy their
needs, and because it has recognized the importance of understanding its competitors as
well as its customers.
The study showed that EABL considers service as an intrinsic part of its products to the
end market. Thus, its competitive advantage is tied to the quantity and quality of its
services, as well as its competitive strategies that enhance its ability to utilize its resources
effectively. The company manufactures superior value products that are created through
lower costs, and this helps the firm to stand out against its direct competitors at the price
and product factor, thus, providing the firm with a positional advantage in the industry as
a cost leader. The company has the ability to modify goods and services that it provides to
the consumers, and its differentiation depends on the competitive nature of the product
market environment. The firm specializes only in developing technologies that have
pivotal importance to its business, and it ensure that these competitive activities are
compatible with its ability to manage possible radical organizational changes.
49
5.3 Discussions
5.3.1 Organizational Factors and Competitive Advantage
The study showed that EABL has a management training structure that facilitates the
development of competence skills. This is evidenced by Ross et al. (2016) who state that,
for firms to achieve competence in staff, not only must recruiting be exercised carefully,
but there must also be a management training structure in place to facilitate the
development of competence skills.
The study revealed that EABL has structured itself to facilitate development of evaluation
systems that ensure its standards are maintained. According to Hamel (2016), a firm also
needs to structure itself to facilitate competent management and develop evaluation
systems to ensure that standards are being maintained.
The study indicated that EABLs’ current assets and liabilities are well managed in order
to determine the company’s short-term financial performance. Weston (2016) echoes that,
working capital management implicates the administration of current assets as well as
current liabilities, and Ross et al. (2016) opines that, working capital management reflects
a firm’s short-term financial performance.
The study showed that EABLs’ competition in the market is not large enough to affect its
market. Enhardt and Brigham (2009) back this up by stating that, in its perfect form, there
is competition among many small buyers and sellers, none of whom is too large to affect
the market as a whole.
The study indicated that technology has helped EABL to adapt quickly to its changing
conditions and environment. This is backed-up by Tuan and Yoshi (2014) who state that,
ICTs could help bigger enterprises to increase their flexibility through a restructuring of
the organization which may enable them to adapt quicker to changing conditions. The
study revealed that legal legislation changes have increased the cost of working practice
at EABL. This is in agreement with Pandey (2012) who observed that, legal legislation
changes may increase the cost of working practice to changes.
50
The study showed that legal and regulatory frameworks have a huge impact on the growth
of EABL. Empirical studies by Harper (2015) and McCormick (2012) on legal regulatory
framework indicate that an appropriate legal and regulatory framework can impact on the
growth of a business. The study indicated that EABL policy makers examine the entire
business environment to identify regulations and policies that affect the company. This
gains affirmation from McCormick (2012) who concludes that policy makers should
examine the entire business environment and identify regulations and policies that affect
entry and growth of small enterprises.
The study showed that EABL uses sales and employment as its growth indicators. This is
confirmed by Delmar (2015) who notes that, firms consider sales and employment as
growth indicators for various reasons. The study revealed that EABL has grown
considerably in output and assets without a growth in employment. This confers with
Barkham (2016) who states that, a firm can grow considerably in output and assets
without a growth in employment especially technology-based firms.
5.3.2 Organizational Capabilities and Competitive Advantage
The study showed that EABL has ensured that it got every employee in the company
doing the right things. Delmar (2015) states that, strategic management is getting
everybody in the company to do the right things. It entails deciding what things are right
for company under some given set of consumer expectations and competitive
circumstances.
The study revealed that EABL’s management has major strategies in place that govern
the use of the firm’s resources. Davidson et al. (2014) affirms this by defining strategic
management as the process of deciding on major strategies that will govern the use of
firm’s resources to achieve its objectives. The study showed that EABL has acquired and
developed attributes that allow it to outperform its competitors. This is affirmed by
Clulow et al. (2013) who state that, competitive advantage occurs when an organization
acquires or develops an attribute or combination of attributes that allows it to outperform
its competitors.
51
The study indicated that EABL has developed strategic partnerships with suppliers in
order to deliver the right products at the right time. This is affirmed by Clulow et al.
(2013) who observe that, large and small alcoholic beverage companies are now
developing strategic partnerships with suppliers in order to deliver the right product to the
alcoholic beverages at the right time.
The study exposed that EABL is fast changing in order to cope with the needs of its
dynamic environment. Davidson et al. (2014) affirms this by observing that, today, many
organizations are fast changing to cope with the needs of the dynamic environment.
However, the focus of their effort is often day to day management and dealing with the
current issues or crisis.
The study revealed that EABL has a well thought out strategic plan that details how the
firm intends to capture its target market. This overwhelmingly supported by Davidson et
al. (2014) who state that, the rapid change in consumer markets and the intensifying
competitive environment make it imperative that the retail firms have a thoroughly well
thought out strategic plan detailing how it intends to capture the target market.
The study showed that EABL maintains leadership in the market place by designing and
implementing sound marketing plans. This is affirmed by Renart (2014) who argues that
the conventional wisdom was that leadership in the market place could be attained by
means of designing and implementing a sound marketing plan, and such a plan entails
first defining the four P’s later evolved to six elements of the marketing mix. The study
indicated that EABL develops unique and effective marketing programs that are most
effective for each of its specific market segments. This is in agreement with David and
Albert (2012) who state that the goal of any firm is to facilitate the development of unique
and effective marketing programs that will be most effective for these specific segments.
The study showed that EABL determines the values that its buyers want in order to
satisfy their needs. Empirical evidence by Becherer et al. (2013) and Blankson et al.
(2012) indicates that, for a firm to become customer oriented, it requires the firm to find
out what values buyers’ want to help satisfy their needs. The study revealed that EABL
recognizes the importance of understanding its competitors as well as its customers.
52
Empirical evidence by Becherer et al. (2013) shows that, a marketing-oriented
organization recognizes the importance of understanding its competitors as well as the
customers.
5.3.3 Organizational Strategies and Competitive Advantage
The study indicated that EABL considers service as an intrinsic part of its products to the
end market. Passemard (2015) confirm that, innovative manufacturers consider
competitive advantage as an intrinsic part of the product offered to the end market. The
study showed that EABLs’ competitive advantage is tied to the quantity and quality of its
services. A study by Ferrero (2016) showed that, an advantage of competitive advantage
seems to be particularly tied to the quantity and quality of services that cannot be imitated
by competitors.
The study revealed that EABLs’ competitive strategies enhance its ability to utilize its
resources effectively. This is in agreement with Barney (2015) who states that,
competitive strategies enhance firm's ability to utilize its resources effectively. An
example of a capability is the ability to bring a product to market faster than competitors.
The study showed that EABL manufactures superior value products that are created
through lower costs. Christensen (2014) supports this by indicating that, firms through
competitive advantage improve manufacturing of superior value created through lower
costs or superior benefits to the consumer.
The study revealed that EABL stands out against its direct competitors at the price and
product factor. This is affirmed by Lau (2012) who states that, differentiation policies rest
upon the entrepreneur’s ability to stand out against its direct competitors not only at the
price factor, but also as regards the upgrading of products, the technical assistance given
to customers and the selection of efficient distribution channels, that is the non-price
factors of competition. The study indicated that EABL has a positional advantage that
describes its position within the beer industry as a cost leader. This is affirmed by Lau
(2012) who states that, cost advantages are known as positional advantages since they
describe the firm's position in the industry as a leader in cost.
53
The study showed that EABL has the ability to modify goods and services that it provides
to the consumers. This is confirmed by Parker (2012) who notes that, product
differentiation, is obtained by suitably mixing marketing elements other than price, i.e.
the ability to modify the tangible and intangible characteristics of the goods or services
provided to the consumer (this policy enhances the non-price competitiveness of the
firm).
The study revealed that EABLs’ differentiation depends on the competitive nature of the
product market environment. Knox (2012) confirms this by stating that, the impact that
differentiation has on demand depends on three major contingencies; the ability of the
firm to differentiate its product, the competitive nature of the product market
environment, and the commitment of consumers to the products of rival firms.
The study showed that EABL specializes only in developing technologies that have
pivotal importance to its business. This is affirmed by Parker (2012) who recommended
that, firms could only specialize in developing technologies that have pivotal importance
to their business in order to protect limitability of key competitive elements. The study
revealed that EABLs’ competitive activities are compatible with the firm’s ability to
manage possible radical organizational changes. This is in agreement with Gaynor (2012)
who observed that, competitive activities must be compatible with a firm's ability to
manage potentially radical organizational change.
5.4 Conclusions
5.4.1 Organizational Factors and Competitive Advantage
The study concludes that EABL has a management training structure in place that
facilitates the development of competence skills, as well as evaluation systems that ensure
its standards are maintained. The firm’s current assets and liabilities are well managed in
order to determine short-term financial performance, and its competition in the market is
not large enough to affect its market, because the firm has leveraged on technology to
adapt quickly to its changing conditions and environment. Legal legislation changes have
increased the cost of working practice for the firm, meaning that the legal regulatory
framework impact the firm’s growth immensely. However, the firm has policy makers
who examine the entire business environment to identify regulations and policies that
54
affect the company. The firm uses sales and employment as its growth indicators, and it
has grown considerably in output and assets without a growth in employment.
5.4.2 Organizational Capabilities and Competitive Advantage
The study concludes that EABL has ensured that all its employees are doing the right
things by ensuring that its management puts in place strategies that govern the use of its
resources. The firm has acquired and developed attributes, like developing strategic
partnerships with suppliers in order to deliver the right products at the right time, which
allow it to outperform its competitors. The company is fast changing in order to cope with
the needs of its dynamic environment, and as such, it has a well-thought-out strategic plan
that details how it intends to capture its target market, maintain leadership in the market
place by designing and implementing sound marketing plans, and developing unique and
effective marketing programs that are most effective for each of its specific market
segments. The firm determines the values that its customers want in order to satisfy their
needs, and because it has recognized the importance of understanding its competitors as
well as its customers.
5.4.3 Organizational Strategies and Competitive Advantage
The study concludes that EABL considers service as an intrinsic part of its products to the
end market. Thus, its competitive advantage is tied to the quantity and quality of its
services, as well as its competitive strategies that enhance its ability to utilize its resources
effectively. The company manufactures superior value products that are created through
lower costs, and this helps the firm to stand out against its direct competitors at the price
and product factor, thus, providing the firm with a positional advantage in the industry as
a cost leader. The company has the ability to modify goods and services that it provides to
the consumers, and its differentiation depends on the competitive nature of the product
market environment. The firm specializes only in developing technologies that have
pivotal importance to its business, and it ensure that these competitive activities are
compatible with its ability to manage possible radical organizational changes.
55
5.5 Recommendations
5.5.1 Recommendations for Improvement
5.5.1.1 Organizational Factors and Competitive Advantage
The study recommends that EABL managers to ensure that their organizational
capabilities are matching with their competitive advantage. The focus on capabilities
should ensure that the firm is not driven by performance, which may force managers to
overlook their capability as a company.
5.5.1.2 Organizational Capabilities and Competitive Advantage
The study recommends the managers of EABL to ensure that their strategies focus on the
company’s interaction process in terms of marketing, the communication process that
may support the existing strategy, and the value process that will be produced as the
overall output. This will ensure that their capabilities meet their targeted expectations.
5.5.1.3 Organizational Strategies and Competitive Advantage
The study recommends EABL managers to ensure that their strategy focus be on
consumers. This may ensure that they maintain their competitive advantage way beyond
their competitors. The firm should strive to consistently provide products and services
that satisfy their market segments.
5.5.2 Recommendations for Further Studies
This study focused on determining factors that influence competitive advantage within
the beer manufacturing sector in Kenya. The study focused on EABL which currently is
the largest beer manufacturing company in EAC. The results were limited to EABL, and
thus in order to capture the whole beer industry in Kenya, similar studies need to be
conducted on all beer companies big and small within the country.
56
REFERENCES
Aaker, D. A. (1998). Strategic Marketing Management. (5th Ed.). New York, NY: John
Willey and sons.
Andrews, K. (1971). The Concept of Corporate Strategy. Homewood, IL: Jones Irwin
Publishers.
Ansoff, H. I. & McDonnell, E. J. (1990). Implanting Strategic Management. (2nd Ed.).
London, UK: Prentice Hall.
Ascher, B. (2018). Global Beer: The Road to Monopoly. Washington, DC: The American
Antitrust Institution.
Barkham L. (2016). Ethics and policies for cyber operations. Cham, Switzerland :
Springer
Barney, J. (2009). Firm resources and sustained competitive advantage. Journal of
Management, 17(1), 99-120.
Barone, Michael J. & DeCarlo, Thomas E., (2013). Emerging Forms of Competitive
Advantage: Implications for Agricultural Producers. MATRIC Research Papers. 8.
Becherer, J.-P. (2013). Market-Driving Behavior in Emerging Firms: A Study on Market-
Driving Behavior, its Moderators and Performance Implications in German
Emerging Technology Ventures.
Bingham, C. B., Heimeriks, K. H., Schijven, M. & Gates, S. (2015). Concurrent
Learning: How Firms Develop Multiple Dynamic Capabilities in Parallel.
Strategic Management Journal, 36(12), 1802-1825.
Blankson J. Guzma ́n W., & Bayraktar S., (2012). International marketing in the fast
changing world. British Journal of marketing, (11), 151–162.
Bratton, J. (2015). Introduction to work and organizational behaviour. New York:
Macmillan Education Palgrave.
Cahill M., (2014). Global status report on alcohol and health 2014. Geneva, Switzerland:
World Health Organization.
Chappell, J. R., (2012). Internal Personality Trait: A practical guide. Ames, Iowa :
Wiley-Blackwell, 2012
Christensen C. M. (2014). Developing strategic business models and competitive
advantage in the digital sector. Hershey, PA: Business Science Reference
Clark. N. (2014). Revolutionize learning & development: Performance and innovation
strategy for the information age. San Francisco, CA: Wiley
57
Clulow, V., Gerstman, J. & Barry, C. (2003). The resource-based view and sustainable
competitive advantage: the case of a financial services firm. Journal of European
Industrial Training, 27(5), 220-232.
Cross, L. (1999). Strategy drives marketing success. Graphic Arts Monthly, 71(2), 96-
114.
David M., & Albert E., (2012). Marketing strategy: The thinking involved. Los Angeles:
SAGE
Davidson, R. W., Sweeney J. D. & Stampel, W. R. (1984). Retailing Management. (5th
Ed.). New York, NY: John Willey & Sons.
Delmar J. A. (2015). Entrepreneurial growth: Individual, firm, and region. Bingley, UK :
Emerald Group Publishing Limited
Drucker, F. (1954). The Practice of Management. New York, NY: Harper & Row.
EABL. (2014). EABL Corporate Citizenship Report 2014. Retrieved from
https://www.eablafrica.co.ke/corporate-report-2012.html (Accessed 26/09/2018).
EABL. (2015). East African Breweries Limited: Investor Briefing. Retrieved from
https://www.eabl.com/sites/default/files/2015.pdf (24/01/2018).
EABL. (2016). EABL Corporate Citizenship Report 2016. Retrieved from
https://www.eablafrica.co.ke/corporate-report-2016.html (Accessed 26/09/2018).
EABL. (2017). Every dealer survey report: Retail Outlet Census Survey in Kenya (2017).
Nairobi, KE: Research International East Africa Limited.
Ehrhardt, M. C., & Brigham, E. F. (2009). Corporate finance: A focused approach.
Mason, OH: South-Western/Cengage Learning.
Euro Monitor International. (2018). Beer in Developed Countries: A Global Report.
Retrieved from http://www.euromonitor.com/beer-in-developed-countries/report
(Accessed 26/09/2018).
Gathuiya F. (2011). Achieving Sustainable competitive Advantage through innovation
strategies in commercial Banks. Unpublished MBA project, School of Business,
University of Nairobi.
Gaynor, G. H. (2012). Innovation by design: What it takes to keep your company on the
cutting edge. New York: AMACOM
Goodstein R. J. Cooney, K. A., & Connally, B. A (2016). Proceedings of the 7th
International Conference on e-Learning: The Chinese University of Hong Kong,
21-22 June 2012.
58
Grant, R. M. (2010). Contemporary Strategy Analysis. New York, NY: John Wiley &
Sons Ltd.
Gronroos. C. (1998). Marketing services: A case study of a missing product. Journal of
Business and Industrial Marketing, 13(4/5), 332-338.
Hamel, G. (1991). Competition for competence and inter-partner learning within
international strategic alliances. Strategic Management Journal, 4(3), 46-57.
Hasty K. A., & Reardon H. A. (2014). Product advertising, institutional and cooperative
advertising. Western/Cengage Learning.
Hill. S. (2016). Managerial Economics. Macmillan Education UK
Huang, K. F., Dyerson, R., Wu, L. Y. & Harindranath, G. (2015). From Temporary
Competitive Advantage to Sustainable Competitive Advantage. British Journal of
Management, 2(6), 617-636.
Kibera, F. N. & Waruingi, B. C. (2014). Fundamentals of Marketing: An African
perspective. Nairobi, KE: Kenya Literature Bureau Publishers.
Kotler, P. (1999). Marketing Management. (1st Ed.). New Delhi, IN: Prentice Hall of
India.
Kotler, P. (2003). Marketing Management. (11th Ed.). New Delhi, IN: Pearson education.
Lau, R. S. (2002). Competitive factors and their relative importance in the US electronics
and computer industries. International Journal of Operations & Production
Management, 22(1), 125-135.
Lewinson S.J. & Delozier, J. W. (2012). The inter-grated effects of market oriented
culture and marketing strategy on firm performance, Journal of Strategic
Marketing, (14), 245–261.
McAuley, E.M. (2016). Exploring Resources, Life-Balance and Well-Being of Women
Who Work in a Global Context. Cham: Springer International Publishing
McCormick, R. (2012). Legal risk in the financial markets. Oxford [England: Oxford
University Press.
Miller. A., (2015). Strategic Management. Boston, MA: Cengage Learning.
Mintzberg H., (1994). Rise and Fall of Strategic Planning. Simon and Schuster,
Morgan, J., & John Wiley & Sons. (2014). The future of work: Attract new talent, build
better leaders, and create a competitive organization. Hoboken, New Jersey:
Wiley.
59
Muigai, S. (2017). East African Breweries Limited History. Retrieved from
http://www.academia.edu/22425467/Eabl_history (Accessed 26/09/2018).
Muller-Falcke, H. A. (2015). Enabling manufacturing competitiveness and economic
sustainability: Proceedings of the 4th International Conference on Changeable,
Agile, Reconfigurable and Virtual production (CARV2011), Montreal, Canada, 2-
5 October 2011. Heidelberg: Springer-Verlag Berlin Heidelberg.
Oliver, G. (1995). Marketing Today. (4th Ed.). Oxford, OX: Prentice Hall Publishers.
Pandey, S. C. (2012). Organizational culture and behavior : concepts, methodologies,
tools, and applications. Hershey, PA, USA Business Science
Parker R. (2012). Business environment and concepts. Hoboken, N.J: Wiley.
Passemard, C. (2000). Competitive Advantage: Creating and Sustaining Superior
Performance. Managerial and Decision Economics, 2(4), 18-26.
Pitt, R.; Troke, B. A & Atkinson J., (2016). Partnership approach to learning about
accountability. Mason, OH: South-Western/Cengage Learning.
Porter, M. & Kramer, M. (2006). Strategy and Society: The Link Between Competitive
Advantage and Corporate Social Responsibility. Harvard Business Review,
84(12), 78-92.
Porter, M. E. (1985). Competitive Advantage: Creating and Sustaining Superior
Performance. New York, NY: Free Press.
Porter, M. E. (1996). What is strategy? Harvard Business Review, 17(1), 33-47.
Powell, T. C. (2001). Competitive advantage: logical and philosophical considerations.
Strategic Management Journal, 22(9), 875-888.
Renart, A. (2000). Handbook of relationship marketing. Thousand Oaks: Sage
Publications
Rose, S. & Watkins, B. (1997). Measuring Customer satisfaction based on quality gap at
a local Bank in Vietnam. Journal of international business research, 4(3), 221-
247.
Schuler, M. A., & Jackson, S. E., (2017). The Oxford handbook of strategy
implementation. New York: Oxford University Pess,
Schwenker, B. & Wulf, T. (2013). Scenario-based Strategic Planning: Developing
Strategies in an Uncertain World. Wiesbaden, GER: Springer Gabler.
Smith, W. R. (2006). Product Differentiation and Market Segmentation as Alternative
Marketing Strategies. Journal of Marketing, 2(1), 3-8.
60
Solow, R. (2012). A contribution to the theory of Economic growth. Quarterly Journal of
Economics, 70(1), 65-94.
Stacey, C. S., (2013). Business and competitive analysis: Effective application of new and
classic methods. Upper Saddle River, New Jersey: Pearson Education
Sternquist, B. (1998). International Retailing. New York, NY: Fairchild Publications.
Stringer, R. (2000). How to manage radical innovation. California Management Review,
4(1), 11-42.
Thompson, A. & Strickland, A. (2003). Strategic management: concepts and cases. (7th
Ed.). Boston, MA: Irwin.
Thompson, J., Strickland, A. & Gamble, J. E. (2007). Crafting and executing strategy:
texts and readings. New York, NY: The McGraw-Hill Companies Inc.
Tremblay, J., Tremblay, C. H. & Iwasaki, N. (2017). The Dynamics of Industry
Concentration for Africa’s Micro and Macro Brewers. Review of Industrial
Organizations, 2(6), 307-324.
Tuan, N. P. & Yoshi, T. (2014). Vertical Linkage and Firm’s Performance in Supporting
industries in Vietnam. Asian Journal of Management Research, 1(1), 1-14.
Urbancova, H. (2013). Competitive Advantage Achievement through Innovation and
Knowledge. Journal of Competitiveness, 5(1), 82-93.
Wang, C. L., Senaratne, C. & Rafiq, M. (2015). Success Traps, Dynamic Capabilities and
Firm Performance. British Journal of Management, 26(1), 26-44.
Warf, F. P. & Stutz, B. (2007). The world economy: resources, location, trade and
development. (5th Ed.). Upper Saddle River, NJ: Pearson.
Weston P. (2016). Intermediate Financial Management. Andover, UK: Cengage
Learning.
Wissema, H. (2005). Unit management entrepreneurship and coordination in the
decentralized firm. London, UK: Pitman Publishing.
Wissema, P. L. (2005). Strategy, distinctive competence, and organizational performance.
Administrative Science Quarterly, 2(5), 317-335.
Zeithaml, V. A. & Bitner, M. J. (1996). Service marketing. (2nd Ed.). New York, NY:
McGraw Hill.
61
APPENDICES
APPENDIX I: QUESTIONNAIRE
SECTION A: Demographic Information
1. What is your gender?
Male ( )
Female ( )
2. When did you join EABL?
Less than a year ( )
1-5years ( )
6-10 years ( )
10-15 years ( )
16 years and more ( )
3. What level of education have you attained?
Certificate ( )
Undergraduate ( )
Graduate ( )
Masters ( )
4. What is your department?
Management & Administration ( )
Human Resource Department ( )
Accounts ( )
Marketing ( )
5. What is your position in the organization?
Senior management level ( )
Middle management level ( )
Lower management ( )
Regular staff ( )
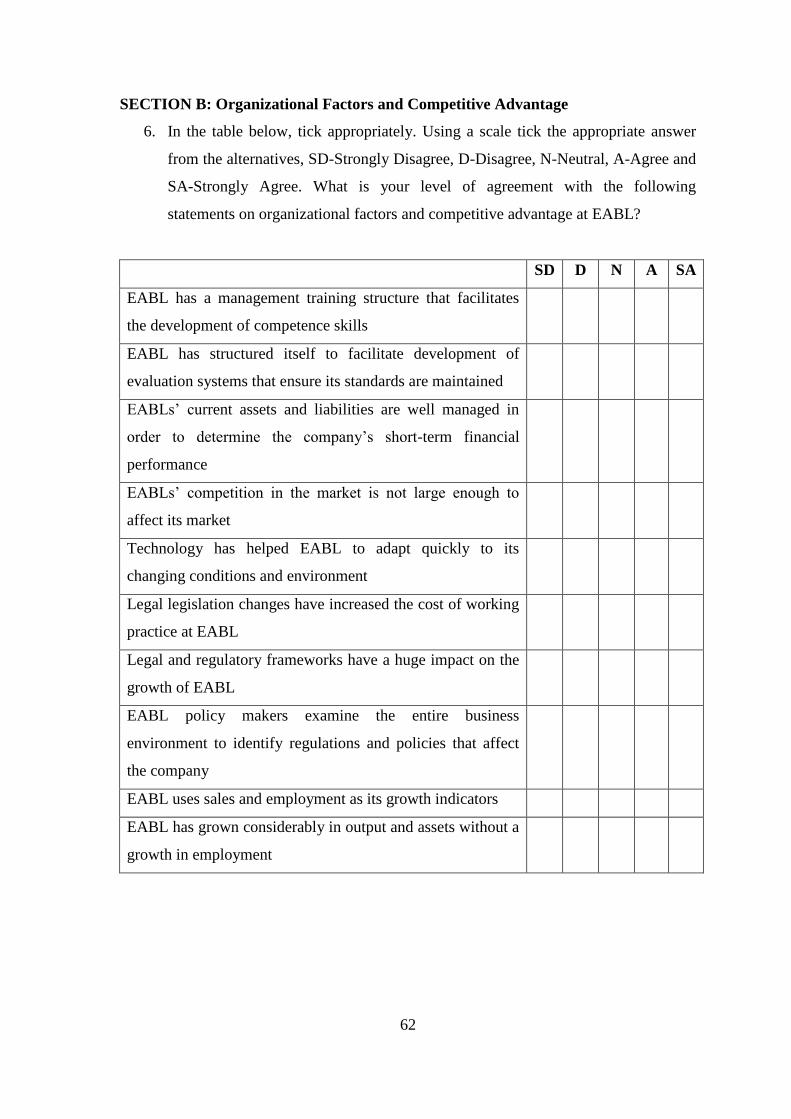
62
SECTION B: Organizational Factors and Competitive Advantage
6. In the table below, tick appropriately. Using a scale tick the appropriate answer
from the alternatives, SD-Strongly Disagree, D-Disagree, N-Neutral, A-Agree and
SA-Strongly Agree. What is your level of agreement with the following
statements on organizational factors and competitive advantage at EABL?
SD D N A SA
EABL has a management training structure that facilitates
the development of competence skills
EABL has structured itself to facilitate development of
evaluation systems that ensure its standards are maintained
EABLs’ current assets and liabilities are well managed in
order to determine the company’s short-term financial
performance
EABLs’ competition in the market is not large enough to
affect its market
Technology has helped EABL to adapt quickly to its
changing conditions and environment
Legal legislation changes have increased the cost of working
practice at EABL
Legal and regulatory frameworks have a huge impact on the
growth of EABL
EABL policy makers examine the entire business
environment to identify regulations and policies that affect
the company
EABL uses sales and employment as its growth indicators
EABL has grown considerably in output and assets without a
growth in employment
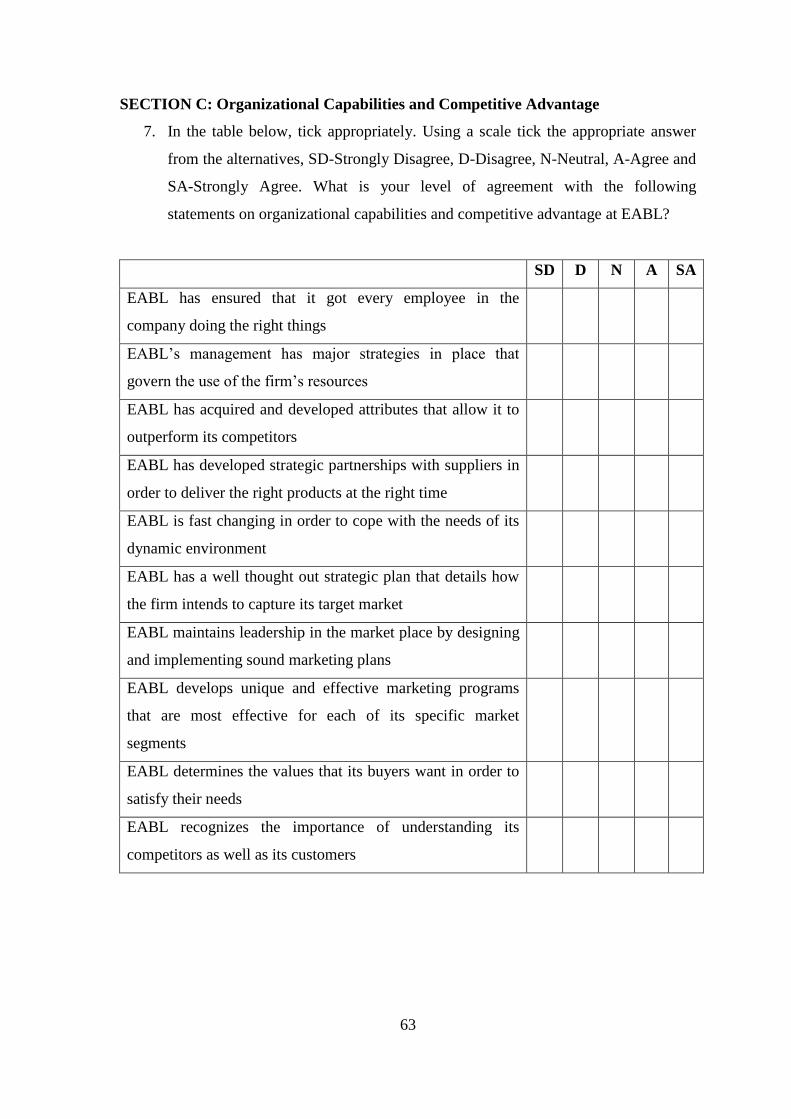
63
SECTION C: Organizational Capabilities and Competitive Advantage
7. In the table below, tick appropriately. Using a scale tick the appropriate answer
from the alternatives, SD-Strongly Disagree, D-Disagree, N-Neutral, A-Agree and
SA-Strongly Agree. What is your level of agreement with the following
statements on organizational capabilities and competitive advantage at EABL?
SD D N A SA
EABL has ensured that it got every employee in the
company doing the right things
EABL’s management has major strategies in place that
govern the use of the firm’s resources
EABL has acquired and developed attributes that allow it to
outperform its competitors
EABL has developed strategic partnerships with suppliers in
order to deliver the right products at the right time
EABL is fast changing in order to cope with the needs of its
dynamic environment
EABL has a well thought out strategic plan that details how
the firm intends to capture its target market
EABL maintains leadership in the market place by designing
and implementing sound marketing plans
EABL develops unique and effective marketing programs
that are most effective for each of its specific market
segments
EABL determines the values that its buyers want in order to
satisfy their needs
EABL recognizes the importance of understanding its
competitors as well as its customers
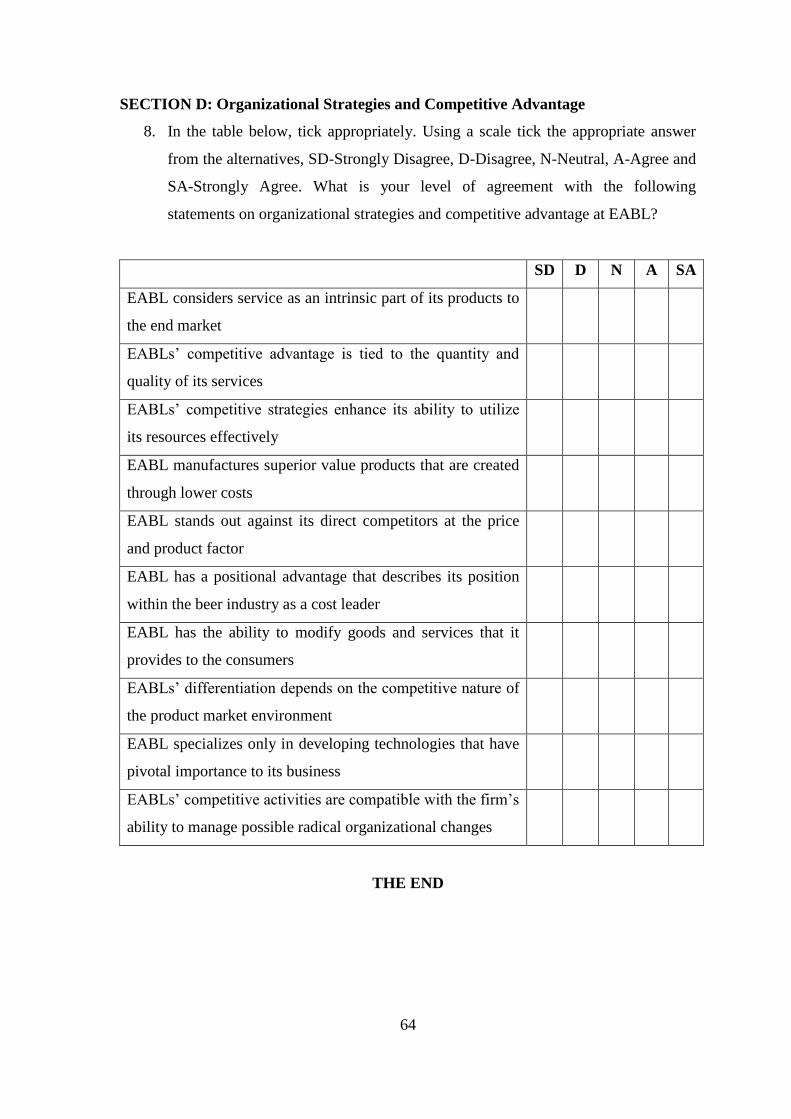
64
SECTION D: Organizational Strategies and Competitive Advantage
8. In the table below, tick appropriately. Using a scale tick the appropriate answer
from the alternatives, SD-Strongly Disagree, D-Disagree, N-Neutral, A-Agree and
SA-Strongly Agree. What is your level of agreement with the following
statements on organizational strategies and competitive advantage at EABL?
SD D N A SA
EABL considers service as an intrinsic part of its products to
the end market
EABLs’ competitive advantage is tied to the quantity and
quality of its services
EABLs’ competitive strategies enhance its ability to utilize
its resources effectively
EABL manufactures superior value products that are created
through lower costs
EABL stands out against its direct competitors at the price
and product factor
EABL has a positional advantage that describes its position
within the beer industry as a cost leader
EABL has the ability to modify goods and services that it
provides to the consumers
EABLs’ differentiation depends on the competitive nature of
the product market environment
EABL specializes only in developing technologies that have
pivotal importance to its business
EABLs’ competitive activities are compatible with the firm’s
ability to manage possible radical organizational changes
THE END