service quality and competitive advantage in ghana's
TRANSCRIPT
39
Service Quality and Competitive Advantage in
Ghana’s Telecommunication Industry
Evidence of MTN Ghana
Iddrisu Abdul- Majeed
MMG Consortium Limited
Abstract
This study is conducted in the telecommunication sector in Ghana using MTN as a case
study. The purpose of the study was to assess the relationship between service quality and
competitive advantage in the telecom industry. The current study used quantitative descriptive
research design to help determine the relationship between variables. This research used a
selfadministered questionnaire to quantify the impact of service quality constructs and
competitive advantage. The study employed convenience sampling techniques with a sample size
of 272 MTN users in Ghana. Data was analyzed using SPSS and Smart PLS. The results showed
that customers have a positive view about network quality and reliability of service of MTN
Ghana. The study also found that there is a statistically significant relationship between the two
service quality dimensions namely: network quality and reliability of service and competitive
advantage with respective to market share and profitability. This study can serve as guidance for
current mobile operators in Ghana and new entrants who intend to enter the industry. This research
aspires to contribute to the body of best practices for mobile service providers in Ghana.
Keywords: Market Share; Network Quality; Profitability; Reliability of Service; Telecom Market
40
1. Introduction A study carried out by Warraich et al. (2013) in Pakistan telecom sector using 320
companies revealed that service quality can be considered as a source of competitive advantage.
Mukherjee, Mukherjee, Rajesh Kumar, Pal, and Saha (2003) noted that superior service delivery
assists organizations in differentiating their offering; attracting new subscribers, and gaining more
business from current customers. It has become increasingly significant for organizations to select
the most suitable measure of service quality because it shows the degree of consumer’s
satisfaction (Young et al., 1994). Customer aspiration to remain loyal and to use the organization’s
service in future is reliant on how satisfied the customer is (Shankar, 2012). It has become
essential for the survival of the organizations that continue to differentiate their service from
competitors (Warraich et al., 2013). Currently, there is intense competition among the six mobile
operators in the telecom sector of Ghana with new services being rolled out; price wars going on,
constant advertisements through various media, social responsibilities and rising sensitivity of
customers. Also, the issue of service quality has gained considerable attention. The objective of
this research was to assess service quality as means of achieving competitive advantage in the
telecom sector of Ghana. The quantitative research examined the impact of network quality on
competitive advantage. Further, the research assessed the impact of reliability of service on
competitive advantage.
2. Literature Review
This section will discussed empirical literature review on the concept of service quality,
competitive advantage, network quality and reliability of service
2.1 Concept of Service Quality
Many studies have revealed that service quality is an important antecedent of customer
satisfaction and consumer loyalty (Voss, Rosenzweigh, Blackmon &Chase, 2004; Zeithaml &
Bitner, 2003). Nitin, Deshmukhand Vrat (2005) asserted that consumer perceived quality has
been differently conceptualized by many authors and has resulted in the increase of many models
of service quality. The literature comes with different definition for service quality. According to
Agbor (2011) service is defined as intangible offer by one party to another at a fee for enjoy.
Quality on the other hand is refers as the level to which a set of inherent features of an objects
fulfils requirement (International Organization for Standardization, 2015).
Also, quality is referred as the thing that meets the consumers’ expectation that is useful
in achieving and retaining customers Ijaz& Ali, 2013). According to Yadav (2013) service quality
is the degree at which services meets up or surpass consumers’ expectation or that exist between
consumers’ perception and anticipation. Service quality reflect particular actions that shows
41
whether consumer remain royal to service or leave the firm (Akhten& Uddin, 2012). Parasuraman
et al. (1988) defined service quality as the difference between the customers’
expectation of service level and their perception of the actual service level. In the study of
Edvardsson (2005), the author noted that “customer perception of service quality is beyond
cognitive assessment as it is formed during the production, delivery and consumption of services
and not just at the consumption stage” (p. 128). This is accomplished as consumers play their
responsibilities as co- producers by executing activities as well as being part of interaction that
influence both process quality and outcome quality. Lai et al. (2009) stated that customer loyalty
can be guarantee through the enhancement of service quality, perceived value and satisfaction. In
a study conducted by Siew-Phaik, Ayankunle, Hanisah & Alan, (2010) in Malaysia on service
quality and customer satisfaction among telecom operators shows a significant positive
relationship between service quality and customer satisfaction except in the area of tangibility or
physical aspects.
The study further revealed that prompt and reliable services are essential to attract, serve
and retain customer. Another study conducted by Mohammed (2013) on factors affecting service
quality in the mobile industry in Somalia and it was focused on factors such as customer’s loyalty
price fairness brand image and quality control were studied. Maryam, Marzieh, and Marzieh
(2014) in their study on the relationship between service quality and business performance found
a positive relationship between the variables. Service quality is an essential tool for a firm effort
to differentiate itself from its rivals. The significant of service quality to organization is stresses
here mainly the fact that it gives competitive advantage to organizations
that endeavor to improve on it and thus bring customer satisfaction (Ladhari, 2008). In a
study carried out by Warraich et al. (2013) in Pakistan telecom sector using 320 companies
revealed that service quality to be considered as a source of competitive advantage.
2.2 Competitive Advantage
Wheenlen and Hunger (2008) aver that a competition is a foundation of capitalism in that
it may arouse innovation, encourage efficiency and lower prices down. Competitors are firms that
provide the same, similar or substitute products or service in the same industry.
Wheenlenand Hunger (2008) assert that competitive advantage is the state which permits a firm
to operate in a more efficient or otherwise high- quality approach than rival firms compete with,
and which outcomes in benefits accruing to that firm. Sigalas and Pekka-Economou (2013)
defined competitive advantage as “the above industry averages manifested exploitation of market
opportunities and neutralization of competitive threats” (p. 335). Additionally, Hill and Jones
(2013) considered that if the high economic profits can be retained for a number of years, it is
42
could suggest that the firm has a sustainable competitive advantage. Besanko et al. (2007) defined
competitive advantage as the state in which a firm achieves a profits rate higher than its
sector average. The capacity to create more economic value then the many rivalry competitors in
the market is refers as competitive advantage (Peteraf &Barney, 2003).
. Sigalas and Pekka-Economou (2013) have attempted to recognize competitive advantage
conceptual demarcation using two schools of thought. The first school describes competitive
advantage in terms of performance, e.g. high relative profitability, benefit cost gap, above average
returns, superior financial performance, economic profits positive differential, profit in access of
opportunity costs and cross- sectional differential in the spread between marginal cost and product
market demand. Also, the second school of thought defines completive advantage in terms of
sources, e.g. particular properties of individual product markets location, differentiation, cost
leadership, technologies, and products characteristics and a set of idiosyncratic organization
resources and capabilities. Li, Ragu,- Nathan and Ragu Nathan (2004) in their study using 196
organizations in US revealed that competitive advantage can have a direct impact on performance.
Lewis (2013) argued that, a sustainable competitive advantage can be achieved through the
dynamic relationship between a firm and its external environment. If an organization adds
competitive advantage is based on its supply association (Nagumey, 2010) then the growth and
management of these associations should be seen as an essential source of organizational
competitive advantage, which in turn offers the basis for overall organizational competitiveness.
(Mracell &Mucha, 2011).
2.3 Network Quality
Kumar et al. (2012) defined network as the interconnection between two consumers.
Customer perceived network quality is a sign of network performance in terms of network
coverage, voice quality, call drop rate and network congestion (Markoulidakis, Dermitzakis,
Lyberopoulos and Theologou, 2000; Sharma & Osha, 2004).The network quality represents
primarily core service as far as the telecom industry is concerned. Consumers want to experience
this quality factor and they expect to get value for money (Nimako et al., 2012). The customers
expect to have access in completion calls, network clarity and speed for call completion and other
services (Nimako et al., 2012). Where this quality is badly delivered to customers it could result
in influencing their loyalty to the service provider (Bansal et al., 2005), encourage intent to
switch and negative word of mouth (Cunningham, 2004).Network quality has appeared as
significant dimension that forms customer perception of service quality by mobile operators.
Least drop calls and voice quality have been recognized as important in evaluation service quality
(Chi et al., 2006).
The network quality has significant influence of consumer satisfaction levels and this help
organization increase their competitive advantage over their rivals (Rahhal, 2015). In a study by
Lai et al. (2007), the authors concluded that network quality, all–time availability, and no drop
43
calls are significant aspects that affect customer perception of mobile phone service quality.
Further, in a study conducted by Rahhal (2015) to study the effects of service quality dimension
on customer satisfaction using Syrian telecom sectors as a case study found network quality as
the first significant place in predicting overall customer satisfaction. In addition, the researchers
recommend the need for telecom operators to pay much attention on proving
adequate network coverage, voice clarity and focus on reducing the congestion level on
their network in order to help them gain competitive advantage.
2.4 Reliability of Service
Reliability is referred to three significant factors which include: accessibility, continuity
and performance (Singh, 2011). Accessibility is referred as the most significant part which means
that service is available whenever it is necessary and desired in the telecom services. The service
must be offered when the customer wants touse it. Accessibility of network provider service
personnel, signal and calling facility are important to complete the reliability factor of the service
(Singh, 2011). The second most significant thing is continuity which means that the service
continues to be available up to the required standard. Zeithaml (2009) believe that upholding of
standard is very important for adhering to the continuity factor. If the service is not continue
reliable, the customer is likely to switch to other operators because the customer will
lose trust in the service (Zeithmal, 2009).The third factor is referred to as performance which
involves high quality service delivery and exceeding the customer’s satisfaction thus achieving
their fidelity for longer time.
Rizan(2010) pointed out that, reliability also assist to improve customer value by offering suitable
service needs, customer’s participation to fill their requirements and addressing
operational issues when need arise. The mobile service customers anticipate that mobile service
providers offer them exact service as promised. Reliability as a dimension of service quality
involves provision of serve precisely and consistently. Service providers are expected to offer
customers accurate as promised. Ozer and Hydin (2006) stated that, the customer anticipates that
their record of use of services is kept correctly and readily available.
Rahhal (2015) studied the effect of service qualitydimension customer satisfaction in Syrian
telecom and found reliability as among the most important factors in predicting general customer
satisfaction.

44
Figure 1: Theoretical Framework
3. Research Questions/ Hypothesis
The study attempted to address two research questions:
Research Question 1: Is there statistically significant impact of network quality on competitive
advantage at MTN?
(1H1): There is a statically significant impact of network quality on competitive advantage at
MTN.
(1H0): There is no statistically significant impact of network quality on competitive advantage at
MTN.
Research Question 2: Is there statistically significant impact of reliability of service on
competitive advantage at MTN?
(2H1): There is a statically significant impact of reliability of service on competitive advantage at
MTN
(2H0): There is no statistically significant impact of reliability of service on competitive advantage
at MTN
service Quality
reliaability
empathy
Technical Quality
Value
Image
Functional Quality
Assurance
Tangibilty

45
4. Methodology
The researcher was assisted by four others trained to administer all the 272 questionnaires.
The researcher was physically distributing and administering the questionnaire in person using
convenience sampling techniques. Prior to the start of the data collection, the researcher sought
permission from the management of MTN office in Tamale, the Distributor office in Tamale and
Tamale Technical University and approval was obtained from the authorities before the process
began. The researcher visited MTN main office premises, Tamale Technical university campus
and MTN distributor premises where the target population was available for the researcher to
collect the data. The respondents were the current users of MTN mobile network service in Ghana.
This quantitative, correlation, descriptive study employed a Likert type scale survey with
descriptive statistics to discover and describe the precise independent variables of service quality
attributes that significantly relates to the dependent variables of competitive advantage (Network
Quality and reliability).
For this particular study, the questionnaire items for this research was based on current
literature review on the subject matter and experts’ opinion to make sure that its contents and
constructs are valid. For the independent and dependent variables, questions items were
developed by the researcher and it was based on the two dimensions of service quality constructs
selected for this study which include network quality and reliability of service. Questions items
related to the dependent variables and demographic data were also developed by the researcher.
To ensure effective and dependable survey instrument, a pretest was carried out. To achieve this,
a group of five (5) with expert knowledge in the subject matter was formed to pretest the survey
instrument. This pretest was carried out in a form of informal deliberation and each member of
the group was asked to give supportive ideas for the design of the instrument, the length of survey
as well as responding to the draft questionnaire. This pretest further enhanced the validity of the
instrument. The Cronbach’s alpha for the two constructs exceeded the threshold of
0.7suggesting that the items have relatively high internal consistency (see table 1). Data collected
from the respondents were analyzed using SPSS software and PLS-SEM Techniques using
SmartPLS
Table 1: Reliability test showing Cronbach Alpha
Cronbach Alpha
Construct Alpha Coefficient Number of Items
Network Quality 0.886 10

46
Reliability 0.846 10
5. Data Analysis
5.1 Regression Analysis
A stepwise regression analysis was performed to exact attributes of service quality
constructs that impact competitive advantage.
Table 2: Regression Coefficients of Service Quality and Competitive Advantage
Model
Unstandardized
Coefficients
B Std. Error
Standardized
Coefficients
Beta T Sig.
1 (Constant) .936 .064 14.647 .000
Reliability .111 .023 .298 4.814 .000
Network quality .091 .023 .246 3.941 .000
From Table 4 above, the variables as a rule of thumb, we say that a b coefficient is
statistically significant if its p-value is smaller than 0.05. All the B coefficients are statistically
significant. Again, this table gives beta coefficients which are used to construct the
regression equation. It’s clear that the betas change, depending on which predictors are included
in the model. These are the weights we are interested in, for an equation that includes just the four
best predictors. There is positive regression co-efficient of the variables. This indicates that, for
MTN to increase its market share, the company should among other things have the capacity of
improving these independent variables. There is a statically significant impact of
Reliability and network quality on competitive advantage at MTN.
5.2 Determining the relationship between Service Quality Constructs and
Competitive Advantage

47
The PLS path modeling estimation technique was adopted in establishing whether there is s
relationship between service quality constructs (Network Quality and reliability) and competitive
Network Quality
Figure 2:
PLS-SEM
MODEL
and
Results
Examining
the
diagram
carefully,
the
following
initial
observations are made:
(i Explanation of target endogenous variable variance
i. The coefficient of determination, R2, is 0.756 for Market Share latent variable. This
implies that Network Quality and Reliability explain 75.6% of the variation in Market
share.
ii. The coefficient of determination, R2, is 0.821 for Profitability latent variable. This also
implies that, Network Quality and Reliability accounts for about 82.1%of the variance in
profitability.
(ii) Inner model path coefficient sizes and significance
In examining the path co-efficient of the Inner Model (same as the Standardized beta coefficients
in the regression analysis) between the variables, the following observations are made.
i. The inner model suggests that reliability has a stronger effect on Market share (b1=0.221)
whilst Network Quality has the stronger effect on profitability (b2=0.187)
Profitability
advantage Market Share and Profitability). The result is shown in figure 2 below; (
Reliability
0.221
0.112
0.110
0.187
Market Share
0.756
0.821
48
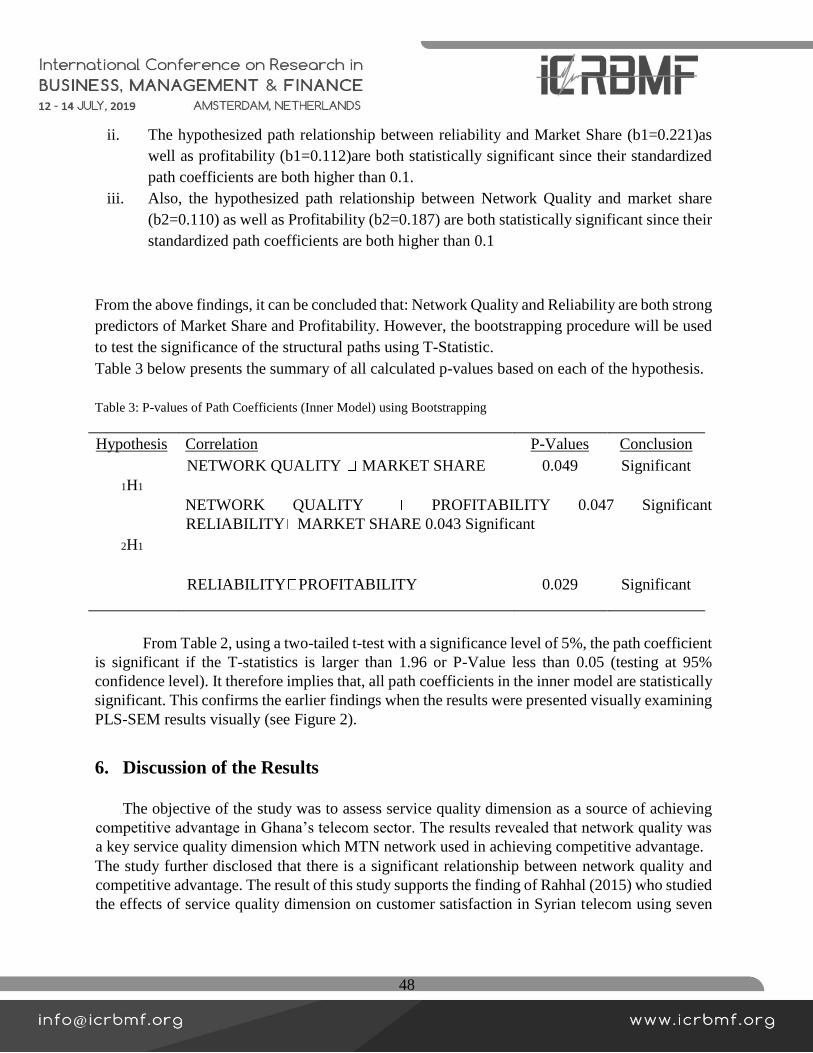
ii. The hypothesized path relationship between reliability and Market Share (b1=0.221)as
well as profitability (b1=0.112)are both statistically significant since their standardized
path coefficients are both higher than 0.1.
iii. Also, the hypothesized path relationship between Network Quality and market share
(b2=0.110) as well as Profitability (b2=0.187) are both statistically significant since their
standardized path coefficients are both higher than 0.1
From the above findings, it can be concluded that: Network Quality and Reliability are both strong
predictors of Market Share and Profitability. However, the bootstrapping procedure will be used
to test the significance of the structural paths using T-Statistic.
Table 3 below presents the summary of all calculated p-values based on each of the hypothesis.
Table 3: P-values of Path Coefficients (Inner Model) using Bootstrapping
Hypothesis Correlation P-Values Conclusion
NETWORK QUALITY MARKET SHARE 0.049 Significant
1H1
NETWORK QUALITY PROFITABILITY 0.047 Significant
RELIABILITY MARKET SHARE 0.043 Significant
2H1
RELIABILITY PROFITABILITY 0.029 Significant
From Table 2, using a two-tailed t-test with a significance level of 5%, the path coefficient
is significant if the T-statistics is larger than 1.96 or P-Value less than 0.05 (testing at 95%
confidence level). It therefore implies that, all path coefficients in the inner model are statistically
significant. This confirms the earlier findings when the results were presented visually examining
PLS-SEM results visually (see Figure 2).
6. Discussion of the Results
The objective of the study was to assess service quality dimension as a source of achieving
competitive advantage in Ghana’s telecom sector. The results revealed that network quality was
a key service quality dimension which MTN network used in achieving competitive advantage.
The study further disclosed that there is a significant relationship between network quality and
competitive advantage. The result of this study supports the finding of Rahhal (2015) who studied
the effects of service quality dimension on customer satisfaction in Syrian telecom using seven
49
quality dimensions including reliability, network quality, responsiveness, assurance, empathy,
tangibility, convenience and complaints handling. The results showed that network quality was
the first significant place in predicting overall customer satisfaction with a positive
correlation with customer satisfaction. Reliability and complaints handling also had a positive
correlation with customer satisfaction.
However, the study results also showed no correlation between empathy, tangibility,
assurance and responsiveness and customer satisfaction. Customers in Syria telecom sector just
like their counterpart in Ghana telecom sectors want their calls to go through at anytime and with
voice clarity in order to reach out to their business partner, .hence their decision to place
importance on network quality. According to Rahhal (2015), network operators need to pay much
attention in providing adequate network coverage, voice clarity and focus on reducing the
congestion level on their network in order to help them gain competitive advantage. Further, the
findings of this study are also in harmony with the study done by Nimako et al.
(2012) who studied confirmatory factor analysis of service quality dimension within
mobile industry in Ghana using eight service quality dimensions. These include reliability,
assurance, tangible, empathy, responsiveness, technical quality, image and economy. The study
found network quality was very relevant to Ghana’s mobile telecom industry.
Some network quality attributes such as network clarity and successful completion of calls
that were identified by Nimako et al. (2012) are similar to the attributes identified by this current
study. These similarities of attributes of the two studies might be the reason for the same results.
In addition, Nimako et al. (2012) in their study collected data from customers from four different
networks with a sample size of 1000 respondents but the current study was limited to subscribers
of only one mobile network with a sample size of 272 and this may have impacted the results.
Further, the findings of this study are also in harmony with the study done by Wang and Lo (2002)
who studied cellular mobile service on service quality and concluded that network quality and
after sales services were the most significant factors in enhancing competitive advantage.
Gerpottet al. (2000) in their study on structural equation modeling approach found that network
quality, assessment of price and personal benefits had positive significant on customer satisfaction
and thus could be a source of achieving competitive advantage. Finally, the results of this study
are consistent with the findings of Ritho and Jagongo (2015) who established that there was a
positive significant relationship between network quality and competitive advantage in the
banking sector.
Further, the results also revealed that reliability was a key service quality dimension that
MTN leverages on in achieving competitive advantage. The study also pointed out that there was
a strong positive significant relationship between reliability and competitive advantage. The
50
results of this study support the finding of Arslan, Iftikha,andZaman (2014) who studied the
effects of service quality dimension on customer satisfaction in Pakistan telecom using reliability
and empathy service quality dimensions. The study found significant relationship between
reliability and customer satisfaction and thus could be a source of achieving completive
advantage. Customers want to use service that will be accessible whenever they want to use it to
transact business as well as want service that will be available at anytime to be used to solve
important issues and this could be the reason why customers consider reliability as one of the
most important aspect of service quality dimension.
According to Singh (2011) reliability refers to three factors and these are accessibility,
continuity and performance. According to this study, the attributes that were identified as most
important in the reliability dimension include: consistent and excellent service, network is
trustworthy, offers exceptional services to customers at the time it pledges to do so, fulfilling its
promises, providing accurate and dependable services, fast data downloads, keep customers
informed ahead of new products, maintains good customers records and making service always
available for use by customers. Some of these attributes such as providing accurate and
dependable services and keep customers informed ahead of new products are similar to the
attributes used by Arslan at al. (2014). Although the current study used ten (10) questions items
with a total sample size 272 respondents. Arslan et al. (2014) employed twelve (12) questions
items with 400 respondents yet both studies had positive correlation. This may further support the
fact that reliability is being considered by customers as a very significant service quality
dimension in the telecom sector.
However, the findings of the current study differ from the findings of Nimako et al., (2012)
who studied confirmatory factor analysis of service quality dimension within mobile industry in
Ghana using eight service quality dimensions. These includes: reliability, assurance, tangible,
empathy, responsiveness, technical quality, image and economy. They found from emerged
dimension with twenty one items being real network quality, customer relations, tangible and
image as critical factors in evaluating service quality in mobile telecom industry. In addition, the
study also found that assurance, responsiveness, empathy and the five underlying dimension of
reliability were eliminated and considered as less important to customers. Although, the two
studies were conducted in Ghana, Nimako et al. (2012) used a sample size of 1000 respondents
from four different network with only five items questions under reliability unlike the current
study, where the sample size was 272 and respondents were from only MTN users with ten (10)
item questions under reliability hence, this could be the reason for the vary opinion by customers.
Nimako et al. (2012) however, stated that the elimination of the five underlying reliability items
does not mean that reliability is not significant to the Ghanaian mobile customers but suggested
for modification of the five items used. The current study however used ten (10) items under
reliability and this could be the reason for the positive correlation.
51
Finally, the findings of this study is similar to the study by Warraich et al. (2013) on
achieving sustainable competitive advantage through service quality in Pakistan’s telecom sector
using five service quality dimension. There are tangibility, reliability, responsiveness, assurance
and empathy. They found that the entire five dimensions proved to be reliable and can be used as
service quality measurement. In addition, the five dimensions were found to be reliable and
Vigorous and can be a source of competitive advantage. Also, some of the reliability attributes
such as service provider promises something by a certain time it does so and service provider
provides service the right time identified by Warraich et al.(2013) are similar to the attributes
identified by the current study under reliability dimension. Even though the study findings give
some new insights to researchers as well as enhances the body of knowledge in this field, these
findings should be viewed in light of some limitations. The sample size used for the study was
272 and this may not be adequate enough to represent precisely the entire population’s view
towards service quality in the telecom sector of Ghana. Further, data was collected in one region
and this again may not represent the entire views of all MTN users across the ten regions of Ghana.
Ideally, a much larger sample of MTN users would give better data.
7. Conclusion
This study has been conducted to ascertain the relationship between service quality
dimension of network quality and reliability and competitive advantage in Ghana’s telecom
sector. Research instrument was developed based on review of current literature and followed by
a sequence of satisfactory validation procedures. The primary data was gathered from 272
respondents and they were users of MTN mobile network in Ghana. The study concludes that
customers have positive view on the variables being accessed for the two dimensions. This was
found from the study results where the average mean of each service quality dimension is less
than 3. In addition, the result concludes that there is a significant relationship between the two
constructs selected for the study and competitive advantage. Findings of this study also provided
a deeper understanding and the important roles each of the dimension played in predicting overall
customer satisfaction and thus competitive advantage.
8. Practical Recommendations
The study found that network quality is an essential quality dimension that can help mobile
service providers to gain competitive advantage. For this reason, the study recommends the need
for operators to continue offering satisfactory network coverage, voice clarity, and focus
on reducing the congestion level in their network. Further, the study results showed that
customers were much satisfied with MTN wider geographical network coverage and the fast
52
downloads of MTN 4G services. For this reason the study recommends the need for current
mobile operators and new entrants to invest in network infrastructure as well as acquire 4G
services. This will lead to better network reception, congestion free network, and fast internet
downloads and thus competitive advantage can be achieved.
Finally, the study also revealed that reliability factor was also very important and was a
source of achieving competitive advantage. The results showed that customers rated the variable
“MTN network promises to execute something, it does so” with a high score. For this reason, the
study recommends the need for current network operators to continue delivering service at the
right time as well as at the promised time. In addition, the results of the study reflect the issue of
provisioning of promised service, dependable and precisely which would require maximum
priority. Previous studies have shown that reliability positively and significantly affects
customers perception of service quality(Lai et al.,2007; Negi , 2009).For this reason, the study
recommends the need for mobile operators to focus on building trustworthiness by keeping
customers’ best interest at heart as well as providing accurate and dependable service. An increase
in how organizations carry out and complete their promised service quality with accuracy and
timeliness will result in an increase in customer satisfaction (Alabar, Egena & Gbande,
2014).Further, results from the study also showed that customers were uncertain on the variable”
MTN internet price is correctly priced and dependable”. In this regard, the study recommends the
need for current mobile operator and new entrants to set prices for their products and services that
will ensure value for money. In addition, service providers should also
continue to improve upon their activities and operations and this will help them win the
trust and confidence of their customers. Finally, reliability factor was considered in this study as
one of the dimension that predicts general customer satisfaction. In this regard, the study further
recommends the need to continue improving quality delivery and timely services.
9. Recommendation for Further Research
The result of this research offers some direction of new research regarding service quality
and competitive advantage. First, the study of MTN mobile users in Ghana offers insights into a
precise population. Further researchers with different population may provide more insight into
the relationship between service quality and competitive advantage. In addition, population such
as MTN users in another country or users of all six operators in Ghana will further enhance the
body of knowledge. Also, the study further recommends that future researchers should replicate
this with similar objectives in another country to see whether it will yield the same result. Finally,
the study used only two dimensions of service quality and recommends the need for future

53
researchers to include other dimensions such as price, sales promotions, and value added with
same population in Ghana's telecom sector.
54
References
Agbor, J. M. (2011). The relationship between customer satisfaction and service quality: A study
of the service sectors in Ugenda, Marketing Review, 2(1): 1-85.
Arslan, M., Iftikhar, M., &Zaman, R. (2014). Effect of service quality dimensions on customer
satisfaction: A competitive analysis of Pakistan telecom sector. Research on Humanities
and Social Sciences,4(19), 79-94.
Bansal, H.S., Taylor, S.F., and James, Y.S. (2005). Migrating’ to New Service Providers:
Toward a Unifying Framework of Consumers' Switching Behaviors.Journal of the
Academy of Marketing Science 33(1), 96-115.
Besanko, D., Dranove,D., and Shanley, M. (2007). Exploiting a Cost Advantage and Coping
with a Cost Disadvantage. Management Science, 47(2), 221-235
Chich, W.H., Tang, T.W., & Chen, I. J. (2006). The Service Quality Perceptional Analysis of
Mobile Phone User in Mainland Chine. The Business Review, Cambridge, Summer,
10(1).
Cunningham L. F, Young, C. E., & Lee, M. (2004). Perceptions of Airline Service Quality: Pre
and Post 9/11. Public Works Management & Policy, 9(1), 10-25.
Edvardsson, B. (2005). GURU’S VIEW, Service quality: Beyond cognitive assessment.Managing
Service Quality, 15(2), 127-131.
Gerpott, T. J., Rams, W.,&Schindler, A. (2000). Customer Retention, Loyalty, andSatisfaction in
German Mobile Cellular Telecommunication Markets.Telecommunications Policy, 25,
249-269.
Ijaz, A. T., & Ali, A. (2013). Assessing service attitude: Service quality measures taken by
Islamic Banks in Pakistan. Journal of Business Management, 8(5), 61-68.
International Organization for Standardization.(2015). ISO 9000:2015 QualityManagement
Systems - Fundamentals and Vocabulary. Geneva, Switzerland: ISO.
Kumar, V. S., Anuradha, B., &Naresh, V. (2012). Improvement of key performanceindicators and
QoS evaluation in operational GSM network. International Journal of Engineering
Research and Applications, 1(3), 411-417.
Ladhari, R. (2008) Alternative Measures of Service Quality: A Review. Managing Service
Quality, 18, 65-86.
Lai, F., Hutchinson, J., Li, D., &Bai, C. (2007). An empirical assessment and application
ofSERVQUAL inmainland China’s mobile communication industry. International Journal
of Quality & Reliability Management,24(3), 244-262.
55
Lewis A. (2013). Reflective practice: what is it and how do I do it? Edith Cowan University,
Research online.
Li, S., Ragu-Nathan, T. S., and Ragu-Nathan, B. (2004). Development and Validation of a
Measurement Instrument for Studying Supply Chain Practices. Journal of Operations
Management. 23(6), 618-641
Markides, M. (2000). Strategic Innovation: The Need for New Concepts (Part I). The Academy
of
Management Executive,14(3), 43-45
Maryam, A., Marzieh, T., &Marzieh,G. (2014). Relationship among market orientation, service
quality and organizational performance from perspective of
GonbadKavoosTelecommunication firm employees .Advances in Applied Science
Research, 5(3), 464-466.
Mohammed, H. (2013). Customer perception on service quality in retail banking in Middle East:
the case of Qatar.International Journal of Islamic and Middle Eastern Finance and
Management2(4), 338-350.
Mraceil N., and Mucha, Z. (2011). Market Share Rewards to Pioneering Brands: An Empirical
Analysis and Strategic Implications. Management Science 32(6), 645-659.
Mukherjee, P.K., Mukherjee, K., Rajesh Kumar, M., Pal, M.,& Saha, B.P. (2003). Evaluation
ofwound healing activity of some herbal formulations. Phytotherapy Research, 17(3), 265-
268.
Negi, R. (2009). User’s perceived service quality of mobile communications: experience
fromEthiopia. International Journal of Quality & Reliability Management, 26(7), 699711.
Nagumey. A. (2010). Spatial Equilibration in Transport Networks. A Handbook of Transport
Geography and spatial systems, D. A Hensher, K. J., Button, K. E Haynes, and P. R.
Stopher, editor
Nitin, S., Deshmukh, S. G.,&Vrat, P. (2005). Service quality Models: A
review.InternationalJournal of Quality and Reliability Management, 22(9), 913-949.
Nimako, S, Azumah, F. K, Donkor, F.,&Adu-Brobbey, V. (2012). Confirmatory FactorAnalysis
of Service Quality Dimensions within Mobile Telephony Industry inGhana.The Electronic
Journal Information Systems Evaluation,15(2)197-215.
Ozer, E. and Hydin,N. (2006). The effects of school gardens on students and schools:
Conceptualizations and considerations for maximizing healthy development. Health
Education and Behavior, 34, 846–863.
Parasuraman, A, Valarie, A, Zeithaml, A, Leonard, L., & Berry, L. (1985). A conceptual modelof
service quality and its implications for future research. Journal of Marketing, 49, 41-50.

56
Peterat, M., and Barnery J. (2003). Unraveling The Resource-Based Tangle.Managerial and
Decision Economics, 24, 309-323.
Peppard, J.L.(2008). Culture wars in South Australia: The sex education debates.
AustralianJournal of Social Issues, 43(3), 499-516.
Porter M. E (2008). The Five Competitive Forces That Shape Strategy. Harvard Business
Review, 86(1), 78-93.
Rahhal, W. (2015). The effects of service quality dimensions on customer satisfaction:
Anempirical investigation in Syrian Mobile Telecommunication Services.
InternationalJournal of Business and Management Invention, 4 (5), 81-89.
Ritho, B. M. &Jagongo, A. O. (2015). Mobile Banking and Financial Performance of
Commercial Banks in Kenya. International Journal of Finance and Current
BusinessStudies, 4(12), 16 – 31.
Rizan, M. (2010). Analysis of Service Quality on Customer Satisfaction and its Influence on
Customer Loyalty: Passengers Survey of Domestic Full Service Airlines Company
“Garuda Indonesia” in Indonesia. Oxford Business and Economic Conference Program, June
28-29.
Shankar, S. M. (2012). Bank Service Quality, Customer Satisfaction and Loyalty in
EthiopianBankingSector. Journal of Business Administration and Management Sciences
Research, 1(1),1-9.
Siew-Phaik L, Ayankunle A. T, Hanisah M. S., and Alan G. D. (2010). Service Quality and
Customer Satisfaction in a TelecommunicationService Provider. International Conference on
Financial Management and Economics 11,
Sigalas, C. &Pekka-Economou, V. (2013). Revisiting the concept of competitiveadvantage:
Problems and fallacies arising from its conceptualization. Journal ofStrategy and
Management, 6(1), 61-80.
Singh, S. (2011).The impact of ATM services on customer satisfaction in Indian
banks.International Journal of Financial Services Management,5(2), 177-196.
Voss, Christopher A., Roth, Aleda V., Rosenzweig, Eve D., Blackmon, Kate and Chase, Richard
(2004).A Tale of Two Countries’ Conservatism, Service Quality, and Feedback on
Customer Satisfaction.Journal of Service Research, 6 (3), 212-230.
Wang, Y., & Lo, H.-P. (2002). Service quality, customer satisfaction and behaviorintentions. Info,
4(6), 50-60.
Warraich, M.K.,Warraich, A. I., &Asif, M. (2013). Achieving sustainable competitive advantage
through service quality: An analysis of Pakistan’s telecom sector. GlobalJournal of
Management and Business Research, 13(2), 39-46.
57
Wheenlen T. L., and Hunger, D. L. (2008). Strategic Management and Business Policy, (11th
Ed). Pearson, Boston Columbus; New York.
Yadav K. M. (2013). Exploring the Relational Impact of Service Quality on Customer
Satisfaction. Ushus Journal of business management, 14(4), 17-31
Yap, B. W., Ramayah, T.,& Shahidan, W. N. (2012). Satisfaction and trust on customerloyalty: a
PLS Approach. Business Strategy Series,13(4), 154-167.
Young, C.J. Liu, S.Schumacher, J.A. Schumacher, T.E.. Kaspar, T.C McCarty, G.W. Napton, D.
Jaynes, D.B. (2004). Evaluation of a model framework to estimate soil and soil organic
carbon redistribution by water and tillage using 137Cs in two U.S. Midwest agricultural
fieldsGeoderma, 232 (2014), 437-448
Yu, Y. T., & Dean, A. (2001). The contribution of emotional satisfaction to consumer
loyalty.InternationalJournal of Service Industry Management, 12(3), 234-250.
Zeithaml, V. A. (2009). Services marketing: Integratingcustomer focus across the Firm (5thEd.).
New York: McGraw-Hill
Zeithaml, V.A. and Bitner, M. J. (2003).Services Marketing: Integrating Customer Focus
across the Firm(3rd Ed). Irwin McGraw-Hill, New York.