stage 1 protocol accepted in principle at rsos
TRANSCRIPT
Stage 1 Protocol Accepted in Principle at RSOS 1
Are affective factors related to individual differences in facial expression
recognition?
Sarah AH Alharbi1,2, Katherine Button3, Amy Bagshaw4, Lingshan Zhang1,
Kieran J O’Shea1, Vanessa Fasolt1, Anthony J Lee5, Lisa M DeBruine1,
Benedict C Jones1
1. Institute of Neuroscience & Psychology, University of Glasgow, Scotland, UK.
2. Department of Psychology, Taibah University, Medina, KSA.
3. Department of Psychology, University of Bath, England, UK.
4. School of Life Sciences, University of Glasgow, Scotland, UK.
5. Division of Psychology, University of Stirling, Scotland, UK.
Corresponding author: Benedict Jones ([email protected])
We thank Jeffrey Girard for helpful feedback on an earlier draft.

Stage 1 Protocol Accepted in Principle at RSOS 2
Are affective factors related to individual differences in facial expression
recognition?
Abstract
Evidence that affective factors (e.g., anxiety, depression, affect) are significantly related to individual differences in emotion recognition is mixed. Palermo et al. (2018 Journal of Experimental Psychology: Human Perception and Performance) recently reported that individuals who scored lower in anxiety performed significantly better on two measures of facial-expression recognition (emotion-matching and emotion-labeling tasks), but not a third measure (the Multimodal Emotion Recognition Test). By contrast, facial-expression recognition was not significantly correlated with measures of depression, positive or negative affect, empathy, or autistic-like traits. Because the range of affective factors considered in this study and its use of multiple expression-recognition tasks mean that it is a relatively
comprehensive investigation of the role of affective factors in facial expression recognition, we propose to carry out a direct replication. Introduction
Facial expression recognition plays an important role in social interaction. Although it is widely acknowledged that substantial individual differences in facial expression recognition exist, the factors that underpin these individual differences are poorly understood (Palermo et al., 2018). Many studies that have investigated this issue have focused on the role of affective factors, such as anxiety, depression, mood, and empathy. Evidence from studies investigating the relationship between affective factors and facial expression recognition has been mixed. For example, while studies of clinical samples have found that anxious or depressed people show impaired facial expression recognition (e.g., Bistricky et al., 2011; Demenescu et al., 2010), some studies of non-clinical samples have not observed
significant correlations between facial expression recognition and anxiety or

Stage 1 Protocol Accepted in Principle at RSOS 3
depression (e.g., Surcinelli et al., 2006). Similarly, while some studies have reported that people who score higher on measures of empathy or lower on measures of autistic-like traits perform better on facial expression recognition tasks (e.g., Lewis et al., 2016; Poljac et al., 2013), other studies have not replicated these results (e.g., Palermo et al., 2018). Interpreting the mixed results for affective factors and facial expression recognition described above is complicated because different studies have investigated different affective factors and/or used different methods to assess facial expression recognition. Direct replications (i.e., studies using the same
measures as the original work) are one way to address this difficulty because they allow for more direct comparison of results across studies (Simons, 2014). In light of the above, we propose to directly replicate one recent study of the possible link between affective factors and facial expression recognition (Palermo et al., 2018). We chose this particular study to replicate because it considered a relatively broad range of affective factors (various measures of anxiety, depression, mood, and empathy) and showed consistent results across two recently developed comprehensive facial expression recognition tasks (the emotion-matching and emotion-labeling tasks developed and described in Palermo et al., 2013). We also chose Palermo et al. (2018) for our direct replication because, despite these methodological strengths, the significant relationships between affective factors and facial expression recognition would not have been significant if corrected for multiple comparisons. This pattern of results suggests that the correlations between anxiety and facial expression recognition may not necessarily be robust.
Palermo et al. (2018) reported that participants’ (N=63) scores on the anxiety
scale of the Depression Anxiety and Stress Scales (DASS) were negatively
correlated with their performance on Palermo et al’s (2013) emotion-matching
(r=-.287, p=.023) and emotion-labeling (r=-.255, p=.044) tasks. By contrast

Stage 1 Protocol Accepted in Principle at RSOS 4
with their results for anxiety, participants’ performance on neither of these
emotion-recognition tasks was significantly correlated with their scores on
questionnaires measuring a range of other affective factors (empathy,
depression, or mood). Performance on a third emotion recognition test
(Bänziger et al’s 2009 Multimodal Emotion Recognition Test) was not
significantly correlated with any of the affective factors. Based on these
results, Palermo et al. (2018) concluded that anxiety is the critical affective
factor for individual differences in facial expression recognition.
Following Palermo et al’s (2018) results, we will test four specific hypotheses:
Hypothesis 1. Scores on the anxiety scale of the Depression Anxiety and
Stress Scales (DASS) will be significantly negatively correlated with
performance on the emotion-matching task.
Hypothesis 2. Scores on the anxiety scale of the Depression Anxiety and
Stress Scales (DASS) will be significantly negatively correlated with
performance on the emotion-labeling task.
Hypothesis 3. Performance on neither the emotion-matching nor emotion-
labeling tasks will be significantly correlated with scores on the depression
scale of the Depression Anxiety and Stress Scales (DASS), the positive affect
scale of the Positive and Negative Affect Schedule (PANAS), the negative
affect scale of the Positive and Negative Affect Schedule (PANAS), scores on
the Autism Quotient (AQ), scores on the Empathy Quotient (EQ), scores on
the affective component of the Basic Empathy Scale (BES), or scores on the
cognitive component of the Basic Empathy Scale (BES).
Hypothesis 4. Performance on Bänziger et al’s (2009) Multimodal Emotion
Recognition Test will not be significantly correlated with scores on any of the
affective factors.
Methods
Ethics

Stage 1 Protocol Accepted in Principle at RSOS 5
All aspects of this project have been approved by the University of Glasgow
College of Science and Engineering Ethics Committee (application number
300180047).
Participants and justification of sample size Palermo et al. (2018) tested 63 university students (55% women, 45% men).
Simonsohn (2015) recommends that sample sizes in replication studies be
approximately two and a half times the sample size of the original study.
Consequently, we will test 160 University of Glasgow students between the
ages of 16 and 45 years with a similar sex ratio to Palermo et al’s (2018)
original study.
Emotion-matching task We will use the same emotion-matching task as Palermo et al. (2018). This is
the 100-item emotional masking task originally developed by Palermo et al.
(2013). Images of three different individuals (matched for sex) are presented
on each trial. Two of the images (the distractor images) are shown with the
same emotional expression (e.g., anger). The other image (the target image)
is shown with a different emotional expression (e.g., disgust), making it the
‘odd one out’. Target and distractor emotions are paired to be maximally
confusable accordingly to previously published data (Young et al., 2002).
Participants use numbered keys to indicate whether face 1, face 2, or face 3
is displaying the ‘odd-one-out’ emotion. Participants can respond either while
the faces are presented onscreen (4500ms) or any time up to 7000ms time
after the faces are no longer presented onscreen. The 100 trials are
presented in the same order for each participant and are preceded by eight
practice trials. The stimuli, target-distractor pairings, and trial order we will use
are identical to those in Palermo et al. (2013) and described in their
supplemental materials. Performance on this task is indicated by the
percentage of trials on which a participant correctly identifies the target face.
An example trial from the emotion-matching task is shown in Figure 1. We
have obtained the code and stimuli for this task from the corresponding author
of Palermo et al. (2018), allowing us to precisely replicate this task. Stimuli are

Stage 1 Protocol Accepted in Principle at RSOS 6
from the Karolinska Directed Emotional Faces image database (Lundqvist et al., 1998), will be shown in color on an iMAC12.1, at 1686 × 762 pixels.
Figure 1. An example trial from the emotion-matching task. Participants are instructed to
indicate which face is showing a different emotional expression to the other two faces (i.e.,
which emotion is the ‘odd-one-out’). The correct answer on the trial shown is face 1.
Emotion-labeling task We will use the same emotion-matching task as Palermo et al. (2018). This is
the 100-item emotion-labeling task originally developed by Palermo et al.
(2013), but with two modifications (presentation time for each face reduced
from 1000ms to 400ms and the number of facial expressions in each emotion
category being the same). Both of these modifications to the task described in
Palermo et al. (2013) were also made in Palermo et al. (2018). Each face is
individually presented on screen. Participants use a computer mouse to select
the appropriate emotion label from a set of six labels presented underneath
the face (anger, disgust, fear, surprise, sadness, happiness). Responses can
be made while the face is presented (400ms) or up to 7000ms after the face is
no longer presented onscreen. The stimuli and trial order we will use are
identical to those used in Palermo et al. (2018) and described in an email
provided by the corresponding author of the Palermo et al. (2018) paper.
Performance on this task is indicated by the percentage of trials on which the
participant correctly labels the facial expression. An example trial from the
emotion-labeling task is shown in Figure 2. We have obtained the code and
stimuli for this task from the corresponding author of Palermo et al. (2018),
allowing us to precisely replicate this task. Stimuli are from the Karolinska

Stage 1 Protocol Accepted in Principle at RSOS 7
Directed Emotional Faces image database (Lundqvist et al., 1998), will be
shown in color on a iMAC12.1 monitor, at 737 × 737 pixels.
Figure 2. An example trial from the emotion-labeling task. Participants are instructed to select
the appropriate emotion label from a set of six labels presented underneath the face (anger,
disgust, fear, surprise, sadness, happiness). The correct answer on the trial shown is
sadness.
Multimodal Emotion Recognition Test This test, described in full in Bänziger et al. (2009), is an online test
administered via the Swiss Centre for Affective Sciences webpage. The task
consists of 30 video clips of actors (three for each of 10 emotions: irritation,
anger, anxiety, fear, happiness, elated joy, disgust, contempt, sadness,
despair) that are presented in four modalities (still picture, video only, audio
only, audio with video), yielding a total of 120 items. After viewing each clip,

Stage 1 Protocol Accepted in Principle at RSOS 8
participants are asked to label the emotion shown in the clip. We will use the
English-language version of the task for our replication.
Affective factors questionnaires Each participant will complete the same affective factor questionnaires used
by Palemro et al. (2018). These are Lovibond and Lovibond’s (1995)
Depression Anxiety and Stress Scales (DASS), Watson et al’s (1988) Positive
and Negative Affect Schedule (PANAS), Baron-Cohen et al’s (2001) Autism
Quotient (AQ), Baron-Cohen and Wheelwright’s (2004) Empathy Quotient
(EQ), and Jolliffe and Farrington’s (2006) Basic Empathy Scale (BES).
Procedure
As in Palermo et al. (2018), the DASS and PANAS will be administered before
the emotion-labeling and emotion-matching tasks. The other affective
questionnaires will be administered after the emotion-labeling and emotion-
matching tasks. Following Palermo et al. (2018), we will run the emotion-
matching task before the emotion-labeling task and run both of these tasks
before the Multimodal Emotion Recognition Test.
All subscale and component scores tested by Palermo et al. (2018) will be
calculated following the instructions for these questionnaires. The scales we
will investigate are the anxiety scale of the DASS, the depression scale of the
DASS, the positive affect scale of the PANAS, the negative affect scale of the
PANAS, the AQ, the EQ scores, scores on the affective component of the
BES, and scores on the cognitive component of the BES. These are the same
scales employed by Palermo et al. (2018). Although Palermo et al. (2018) do
not report the reliability of these measures, we will report Cronbach’s alpha for
each scale.
Data exclusions and data quality checks Outliers (scores on a measure that are more than 3 standard deviations from
the mean score for that measure) will be adjusted to score one point higher
than the closest non-outlier score (following Palermo et al., 2018). As a
positive control, participants scoring lower than chance on either of the

Stage 1 Protocol Accepted in Principle at RSOS 9
expression recognition tasks will be excluded from all analyses. No other
exclusions or data manipulation will be carried out.
Analysis plan
Hypothesis 1. Scores on the anxiety scale of the Depression Anxiety and
Stress Scales (DASS) will be significantly negatively correlated with
performance on the emotion-matching task.
As in Palermo et al. (2018), we will test Hypothesis 1 by calculating Pearson’s
product-moment correlation coefficient for the relationship between scores on
the anxiety scale of the Depression Anxiety and Stress Scales (DASS) and
performance on the emotion-matching task. Our sample size has 80% power
to detect effects as small as |r| = .219 at the 5% significance level. Analysis
code for Hypothesis 1 is publicly available at https://osf.io/kexhr/ and in our
supplemental materials.
Hypothesis 2. Scores on the anxiety scale of the Depression Anxiety and
Stress Scales (DASS) will be significantly negatively correlated with
performance on the emotion-labeling task.
As in Palermo et al. (2018), we will test Hypothesis 2 by calculating Pearson’s
product-moment correlation coefficient for the relationship between scores on
the anxiety scale of the emotion-labeling task. Depression Anxiety and Stress
Scales (DASS) and performance on the. Our sample size has 80% power to
detect effects as small as |r| = .219 at the 5% significance level. Analysis code
for Hypothesis 2 is publicly available at https://osf.io/kexhr/ and in our
supplemental materials.
Hypothesis 3. Performance on neither the emotion-matching nor emotion-
labeling tasks will be significantly correlated with scores on the depression
scale of the DASS, the positive affect scale of the PANAS, the negative affect
scale of the PANAS, AQ scores, EQ scores, scores on the affective
component of the BES, or scores on the cognitive component of the BES.

Stage 1 Protocol Accepted in Principle at RSOS 10
As in Palermo et al. (2018), we will test Hypothesis 3 by calculating the
Pearson’s product-moment correlation coefficients for the relationships
between the emotion-matching and emotion-labeling tasks and scores on the
depression scale of the DASS, the positive affect scale of the PANAS, the
negative affect scale of the PANAS, AQ scores, EQ scores, scores on the
affective component of the BES, and scores on the cognitive component of
the BES. Our sample size has 80% power to detect effects as small as |r| =
.219 at the 5% significance level. Analysis code for Hypothesis 3 is publicly
available at https://osf.io/kexhr/ and in our supplemental materials.
If, by contrast with Palermo et al. (2018), other questionnaires also predict
performance on emotion-recognition tasks, we will use Steiger’s test for
comparing elements of a correlation matrix (Steiger, 1980) to test whether
scores on the anxiety scale of the DASS are a significantly better predictor of
performance on the emotion-recognition tasks than are scores on those other
questionnaires.
Hypothesis 4. Performance on Bänziger et al’s (2009) Multimodal Emotion
Recognition Test will not be significantly correlated with scores on any of the
affective factors.
As in Palermo et al. (2018), we will test Hypothesis 4 by calculating the
Pearson’s product-moment correlation coefficients for the relationships
between the Multimodal Emotion Recognition Test and scores on the
depression scale of the DASS, the positive affect scale of the PANAS, the
negative affect scale of the PANAS, AQ scores, EQ scores, scores on the
affective component of the BES, and scores on the cognitive component of
the BES. Our sample size has 80% power to detect effects as small as |r| =
.219 at the 5% significance level. Analysis code for Hypothesis 4 is publicly
available at https://osf.io/kexhr/ and in our supplemental materials.
Robustness checks As in Palermo et al. (2018), we will repeat each analysis using partial
correlations to control for possible effects of participant sex, participant age,
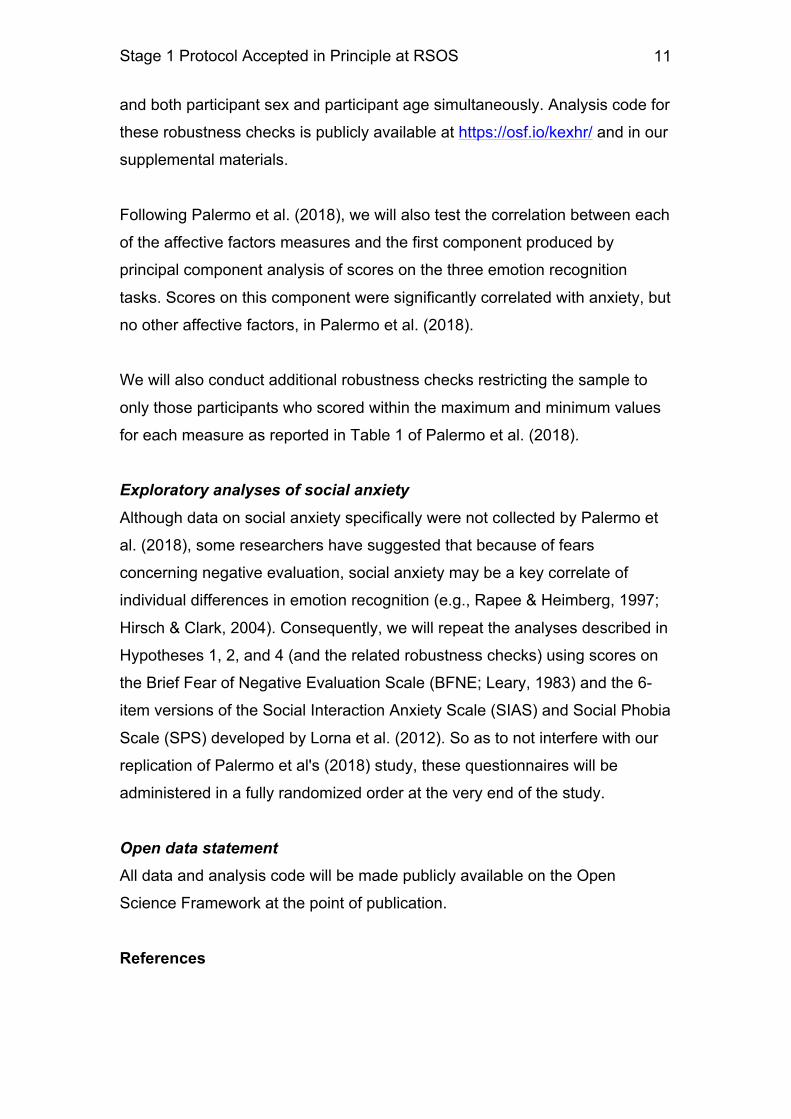
Stage 1 Protocol Accepted in Principle at RSOS 11
and both participant sex and participant age simultaneously. Analysis code for
these robustness checks is publicly available at https://osf.io/kexhr/ and in our
supplemental materials.
Following Palermo et al. (2018), we will also test the correlation between each
of the affective factors measures and the first component produced by
principal component analysis of scores on the three emotion recognition
tasks. Scores on this component were significantly correlated with anxiety, but
no other affective factors, in Palermo et al. (2018).
We will also conduct additional robustness checks restricting the sample to
only those participants who scored within the maximum and minimum values
for each measure as reported in Table 1 of Palermo et al. (2018).
Exploratory analyses of social anxiety
Although data on social anxiety specifically were not collected by Palermo et
al. (2018), some researchers have suggested that because of fears
concerning negative evaluation, social anxiety may be a key correlate of
individual differences in emotion recognition (e.g., Rapee & Heimberg, 1997;
Hirsch & Clark, 2004). Consequently, we will repeat the analyses described in
Hypotheses 1, 2, and 4 (and the related robustness checks) using scores on
the Brief Fear of Negative Evaluation Scale (BFNE; Leary, 1983) and the 6-
item versions of the Social Interaction Anxiety Scale (SIAS) and Social Phobia
Scale (SPS) developed by Lorna et al. (2012). So as to not interfere with our
replication of Palermo et al's (2018) study, these questionnaires will be
administered in a fully randomized order at the very end of the study.
Open data statement All data and analysis code will be made publicly available on the Open
Science Framework at the point of publication.
References

Stage 1 Protocol Accepted in Principle at RSOS 12
Bänziger, T., Grandjean, D., & Scherer, K. R. (2009). Emotion recognition
from expressions in face, voice, and body: the Multimodal Emotion
Recognition Test (MERT). Emotion, 9(5), 691-704.
Baron-Cohen, S., & Wheelwright, S. (2004). The empathy quotient: an
investigation of adults with Asperger syndrome or high functioning
autism, and normal sex differences. Journal of Autism and
Developmental Disorders, 34(2), 163-175.
Baron-Cohen, S., Wheelwright, S., Skinner, R., Martin, J., & Clubley, E.
(2001). The autism-spectrum quotient (AQ): Evidence from Asperger
syndrome/high-functioning autism, males and females, scientists and
mathematicians. Journal of Autism and Developmental Disorders,
31(1), 5-17.
Bistricky, S. L., Ingram, R. E., & Atchley, R. A. (2011). Facial affect processing and depression susceptibility: Cognitive biases and cognitive neuroscience. Psychological Bulletin, 137(6), 998-1028.
Demenescu, L. R., Kortekaas, R., den Boer, J. A., & Aleman, A. (2010). Impaired attribution of emotion to facial expressions in anxiety and major depression. PLoS ONE, 5(12), e15058.
Jolliffe, D., & Farrington, D. P. (2006). Development and validation of the Basic Empathy Scale. Journal of Adolescence, 29(4), 589-611.
Hirsch, C.R., Clark, D.M. (2004). Information-processing bias in social phobia.
Clinical Psychology Review 24,799–825.
Lewis, G. J., Lefevre, C. E., & Young, A. W. (2016). Functional architecture of
visual emotion recognition ability: A Latent Variable Approach. Journal
of Experimental Psychology: General, 145(5), 589-602.
Lovibond, S.H. & Lovibond, P.F. (1995). Manual for the Depression Anxiety
Stress Scales. (2nd. Ed.) Sydney, Australia: Psychology Foundation.
Lundqvist, D., Flykt, A., & Öhman, A. (1998). The Karolinska Directed Emotional Faces – KDEF, CD ROM from Department of Clinical Neuroscience, Psychology section, Karolinska Institutet, ISBN 91-630-7164-9.
Palermo, R., Jeffery, L., Lewandowsky, J., Fiorentini, C., Irons, J. L., Dawel, A., ... & Rhodes, G. (2018). Adaptive face coding contributes to

Stage 1 Protocol Accepted in Principle at RSOS 13
individual differences in facial expression recognition independently of affective factors. Journal of Experimental Psychology: Human Perception and Performance, 44(4), 503-517.
Palermo, R., O'Connor, K. B., Davis, J. M., Irons, J., & McKone, E. (2013). New tests to measure individual differences in matching and labelling facial expressions of emotion, and their association with ability to recognise vocal emotions and facial identity. PLoS ONE, 8(6), e68126.
Poljac, E., Poljac, E., & Wagemans, J. (2013). Reduced accuracy and sensitivity in the perception of emotional facial expressions in individuals with high autism spectrum traits. Autism, 17(6), 668-680.
Rapee, R.M., Heimberg, R.G. (1997). A cognitive-behavioral model of anxiety in social phobia. Behaviour Research and Therapy 35, 741–756.
Simonsohn, U. (2015). Small telescopes: Detectability and the evaluation of replication results. Psychological science, 26(5), 559-569.
Simons, D. J. (2014). The value of direct replication. Perspectives on
Psychological Science, 9(1), 76-80.
Steiger, J. H. (1980). Tests for comparing elements of a correlation matrix.
Psychological Bulletin, 87, 245-251.
Surcinelli, P., Codispoti, M., Montebarocci, O., Rossi, N., & Baldaro, B. (2006). Facial emotion recognition in trait anxiety. Journal of Anxiety Disorders, 20(1), 110-117.
Watson, D., Clark, L. A., & Tellegen, A. (1988). Development and validation of brief measures of positive and negative affect: the PANAS scales. Journal of Personality and Social Psychology, 54(6), 1063-1070.
Young, A.W., Perrett, D.I., Calder, A.J., Sprengelmeyer, R., & Ekman, P.
(2002) Facial expressions of emotion: Stimuli and tests (FEEST). Bury
St. Edmunds: Thames Valley Test Company.

---title: 'Emotion Recognition RR'output: html_document: toc: true code_folding: hide---
```{r setup, include=FALSE}knitr::opts_chunk$set(echo = TRUE)library(tidyverse)library(pwr)library(psych) # for SPSS-style PCAlibrary(faux) # devtools::install_github("debruine/faux")```
```{r functions}# round up from .xxx5 instead of rounding to even numberaparound <- function(n, digits = 0) { round(n + 1e-10, digits)}
# function to format p-valuespval <- function(p, digits = 3) { if (p < .001) return("p < .001") sprintf(paste0("p = %.", digits, "f"), aparound(p, digits))} ```
### Sample Size
```{r power}smallest_effect <- pwr::pwr.r.test(n = 160, sig.level = 0.05, power = 0.8, alternative = "two.sided")$r %>% round(3)```
Sample size is set at $n = 160$, following the small telescopes approach, which sets replication sample size at 2.5 times the original sample size ($n = 63$). With $alpha = .05$, this design has 80% power for two-tailed tests to detect correlations as small as $|r| = `r smallest_effect`$.
## Analysis
### Simulate data

Descriptive data are taken from from Palermo et al (2018) with correlation structure from correlations reported in Palermo et al. (2018) or set to r = 0.5 for all depression/anxiety measures (as unreported in Palermo).
```{r}# descriptive data from Palermo et al 2018orig_desc <- tibble( vars = c("MERT", "emo_match", "emo_label", "DASS_dep", "DASS_anx", "PANAS_p", "PANAS_n", "AQ", "EQ", "BES_aff", "BES_cog", "age"), min = c( 39, 47, 62.19, 0, 0, 10, 10, 4, 18, 18, 28, 18), max = c(68.33, 89, 91.67, 14, 13, 50, 31, 34, 68, 54, 45, 35), mean = c(54.73, 73.28, 77.83, 4.17, 3.05, 29.13, 17.60, 16.20, 44.56, 40.40, 36.90, 21), sd = c( 6.55, 8.19, 6.04, 3.74, 3.18, 6.06, 4.96, 5.78, 10.61, 7.26, 3.37, 5))
n <- 160# correlations from Palermo et al 2018# all .5 are guesses (assuming positive correlations among measures# all 0s are unspecified null effects "(all r < .09)" for age.orig_cors <- c(.53, .50, .070, -.216, -.159, .017, -.010, -.004, .048, .104, 0, # MERT .58, -.041, -.287, -.035, -.147, .035, .039, .064, .157, 0, # emo_match -.020, -.255, -.071, -.038, -.123, .032, .082, .178, 0, # emo_label .5, .5, .5, .5, .5, .5, .5, 0, # DASS_depression .5, .5, .5, .5, .5, .5, 0, # DASS_anxiety .5, .5, .5, .5, .5, .26, # PANAS_p .5, .5, .5, .5, 0, # PANAS_n .5, .5, .5, 0, # AQ .5, .5, 0, # EQ .5, 0, # BES_aff 0) # BES_cog dat <- rnorm_multi(n, vars = nrow(orig_desc),
mu = orig_desc$mean, sd = orig_desc$sd, cors = orig_cors, varnames = orig_desc$vars) %>% mutate(sex = sample(c("m", "f"), n, replace = T, prob = c(.45, .55)), sex_e = recode(sex, "m" = 0.5, "f" = -0.5), age = sample(18:25, nrow(.), replace = T), age_c = age - mean(age))
```
```{r, results='asis'}dat %>% select(-sex) %>% cor() %>% as_tibble(rownames = "var") %>% mutate_if(is.numeric, aparound, 3) %>% knitr::kable()```
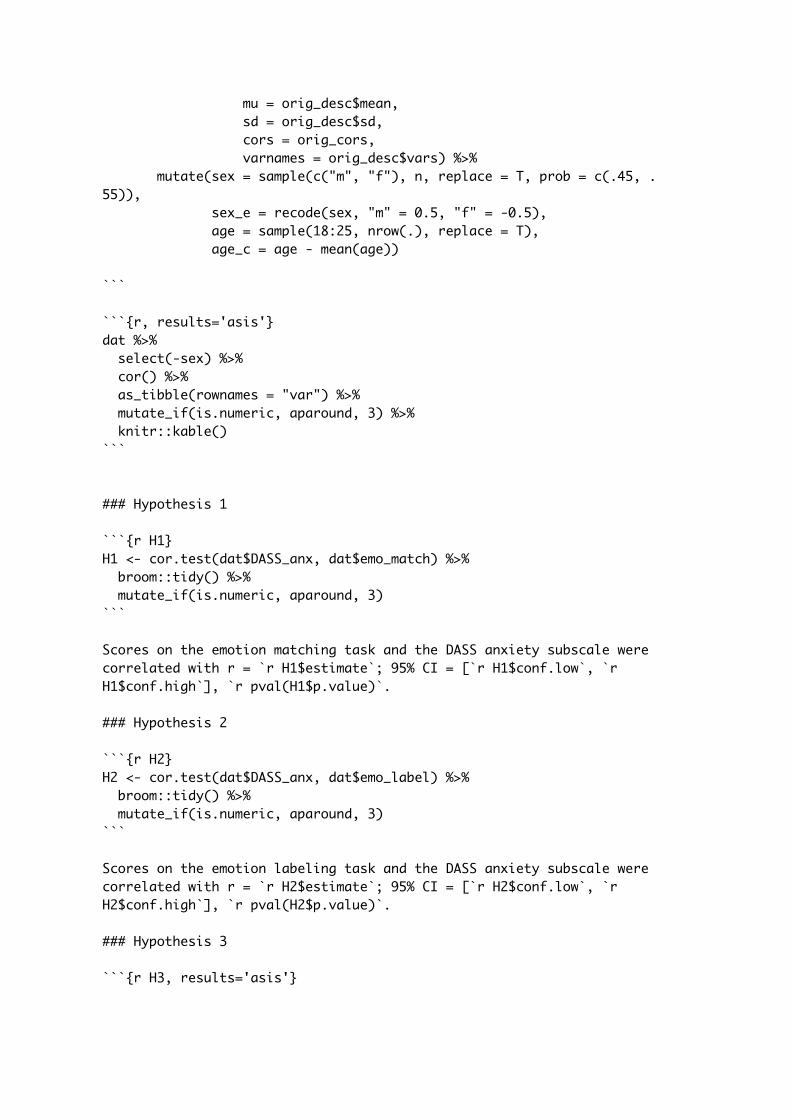
### Hypothesis 1
```{r H1}H1 <- cor.test(dat$DASS_anx, dat$emo_match) %>% broom::tidy() %>% mutate_if(is.numeric, aparound, 3)```
Scores on the emotion matching task and the DASS anxiety subscale were correlated with r = `r H1$estimate`; 95% CI = [`r H1$conf.low`, `r H1$conf.high`], `r pval(H1$p.value)`.
### Hypothesis 2
```{r H2}H2 <- cor.test(dat$DASS_anx, dat$emo_label) %>% broom::tidy() %>% mutate_if(is.numeric, aparound, 3)```
Scores on the emotion labeling task and the DASS anxiety subscale were correlated with r = `r H2$estimate`; 95% CI = [`r H2$conf.low`, `r H2$conf.high`], `r pval(H2$p.value)`.
### Hypothesis 3
```{r H3, results='asis'}

H3 <- dat %>% select(-sex) %>% cor() %>% as_tibble(rownames = "var") %>% select(var, emo_match, emo_label) %>% filter(!(var %in% c("emo_match", "emo_label", "DASS_anx", "age", "age_c", "sex_e", "MERT")))
H3 %>% mutate_if(is.numeric, aparound, 3) %>% knitr::kable()
```
### Hypothesis 4
```{r H4, results='asis'}
H4 <- dat %>% select(-sex) %>% cor() %>% as_tibble(rownames = "var") %>% select(var, MERT) %>% filter(!(var %in% c("emo_match", "emo_label", "MERT", "age", "age_c", "sex_e")))
H4 %>% mutate_if(is.numeric, aparound, 3) %>% knitr::kable()```
## Robustness Checks
### Truncated to Original Range
Truncate data to the original range from Table 1 in Palermo et al (2018).
```{r truncate-dat}
dat_trunc <- dat %>% mutate(id = row_number()) %>% gather(vars, val, .dots = orig_desc$vars) %>% left_join(orig_desc, by = "vars") %>% filter(val >= min, val <= max) %>% select(-min, -max, -mean, -sd) %>% spread(vars, val) %>% # spread to generate NAs in missing values gather(vars, val, .dots = orig_desc$vars) %>% # gather to filter out ids with NAs group_by(id) %>% filter(!is.na(sum(val))) %>%

ungroup() %>% spread(vars, val) %>% select(-id)
```
#### Hypothesis 1
```{r H1-trunc}H1_trunc <- cor.test(dat_trunc$DASS_anx, dat_trunc$emo_match) %>% broom::tidy() %>% mutate_if(is.numeric, aparound, 3)```
For data truncated to the original range from Palermo et al. (2018), scores on the emotion matching task and the DASS anxiety subscale were correlated with r = `r H1_trunc$estimate`; 95% CI = [`r H1_trunc$conf.low`, `r H1_trunc$conf.high`], `r pval(H1_trunc$p.value)`.
#### Hypothesis 2
```{r H2_trunc}H2_trunc <- cor.test(dat_trunc$DASS_anx, dat_trunc$emo_label) %>% broom::tidy() %>% mutate_if(is.numeric, aparound, 3)```
For data truncated to the original range from Palermo et al. (2018), scores on the emotion labeling task and the DASS anxiety subscale were correlated with r = `r H2_trunc$estimate`; 95% CI = [`r H2_trunc$conf.low`, `r H2_trunc$conf.high`], `r pval(H2_trunc$p.value)`.
#### Hypothesis 3
```{r H3_trunc, results='asis'}
H3_trunc <- dat_trunc %>% select(-sex) %>% cor() %>% as_tibble(rownames = "var") %>% select(var, emo_match, emo_label) %>% filter(!(var %in% c("emo_match", "emo_label", "DASS_anx", "age", "age_c", "sex_e", "MERT")))
H3_trunc %>% mutate_if(is.numeric, aparound, 3) %>% knitr::kable()
```
#### Hypothesis 4

```{r H4_trunc, results='asis'}
H4_trunc <- dat %>% select(-sex) %>% cor() %>% as_tibble(rownames = "var") %>% select(var, MERT) %>% filter(!(var %in% c("emo_match", "emo_label", "MERT", "age", "age_c", "sex_e")))
H4_trunc %>% mutate_if(is.numeric, aparound, 3) %>% knitr::kable()```
### Emotion Matching
```{r}rc_ <- lm(emo_match ~ DASS_anx, data = dat)
rc_stats <- rc_ %>% broom::tidy() %>% bind_cols(confint(rc_) %>% as_tibble()) %>% filter(term == "DASS_anx") %>% rename(conf.low = `2.5 %`, conf.high = `97.5 %`) %>% mutate_if(is.numeric, aparound, 3)```
Scores on the DASS anxiety subscale negatively predicted scores on the emotion matching task (estimate = `r rc_stats$estimate`; 95% CI = [`r rc_stats$conf.low`, `r rc_stats$conf.high`]; t = `r (rc_stats$statistic)`; `r pval(rc_stats$p.value)`).
#### Controlling for Sex
```{r}
rc_sex <- lm(emo_match ~ DASS_anx + sex_e, data = dat)
rc_sex_stats <- rc_sex %>% broom::tidy() %>% bind_cols(confint(rc_sex) %>% as_tibble()) %>% filter(term == "DASS_anx") %>% rename(conf.low = `2.5 %`, conf.high = `97.5 %`) %>% mutate_if(is.numeric, aparound, 3)```

Controlling for sex, Scores on the DASS anxiety subscale negatively predicted scores on the emotion matching task (estimate = `r rc_sex_stats$estimate`; 95% CI = [`r rc_sex_stats$conf.low`, `r rc_sex_stats$conf.high`]; t = `r (rc_sex_stats$statistic)`; `r pval(rc_sex_stats$p.value)`).
#### Controlling for Age
```{r}rc_age <- lm(emo_match ~ DASS_anx + age_c, data = dat)
rc_age_stats <- rc_age %>% broom::tidy() %>% bind_cols(confint(rc_age) %>% as_tibble()) %>% filter(term == "DASS_anx") %>% rename(conf.low = `2.5 %`, conf.high = `97.5 %`) %>% mutate_if(is.numeric, aparound, 3)```
Controlling for age, Scores on the DASS anxiety subscale negatively predicted scores on the emotion matching task (estimate = `r rc_age_stats$estimate`; 95% CI = [`r rc_age_stats$conf.low`, `r rc_age_stats$conf.high`]; t = `r (rc_age_stats$statistic)`; `r pval(rc_age_stats$p.value)`).
#### Controlling for Sex and Age
```{r}rc_sex_age <- lm(emo_match ~ DASS_anx + sex_e*age_c, data = dat)
rc_sex_age_stats <- rc_sex_age %>% broom::tidy() %>% bind_cols(confint(rc_sex_age) %>% as_tibble()) %>% filter(term == "DASS_anx") %>% rename(conf.low = `2.5 %`, conf.high = `97.5 %`) %>% mutate_if(is.numeric, aparound, 3)
```
Controlling for sex, age and their interaction, Scores on the DASS anxiety subscale negatively predicted scores on the emotion matching task (estimate = `r rc_sex_age_stats$estimate`; 95% CI = [`r rc_sex_age_stats$conf.low`, `r rc_sex_age_stats$conf.high`];

t = `r (rc_sex_age_stats$statistic)`; `r pval(rc_sex_age_stats$p.value)`).
### Emotion Labeling
```{r}rc_ <- lm(emo_label ~ DASS_anx, data = dat)
rc_stats <- rc_ %>% broom::tidy() %>% bind_cols(confint(rc_) %>% as_tibble()) %>% filter(term == "DASS_anx") %>% rename(conf.low = `2.5 %`, conf.high = `97.5 %`) %>% mutate_if(is.numeric, aparound, 3)```
Scores on the DASS anxiety subscale negatively predicted scores on the emotion labelling task (estimate = `r rc_stats$estimate`; 95% CI = [`r rc_stats$conf.low`, `r rc_stats$conf.high`]; t = `r (rc_stats$statistic)`; `r pval(rc_stats$p.value)`).
#### Controlling for Sex
```{r}
rc_sex <- lm(emo_label ~ DASS_anx + sex_e, data = dat)
rc_sex_stats <- rc_sex %>% broom::tidy() %>% bind_cols(confint(rc_sex) %>% as_tibble()) %>% filter(term == "DASS_anx") %>% rename(conf.low = `2.5 %`, conf.high = `97.5 %`) %>% mutate_if(is.numeric, aparound, 3)```
Controlling for sex, Scores on the DASS anxiety subscale negatively predicted scores on the emotion labelling task (estimate = `r rc_sex_stats$estimate`; 95% CI = [`r rc_sex_stats$conf.low`, `r rc_sex_stats$conf.high`]; t = `r (rc_sex_stats$statistic)`; `r pval(rc_sex_stats$p.value)`).
#### Controlling for Age

```{r}rc_age <- lm(emo_label ~ DASS_anx + age_c, data = dat)
rc_age_stats <- rc_age %>% broom::tidy() %>% bind_cols(confint(rc_age) %>% as_tibble()) %>% filter(term == "DASS_anx") %>% rename(conf.low = `2.5 %`, conf.high = `97.5 %`) %>% mutate_if(is.numeric, aparound, 3)```
Controlling for age, Scores on the DASS anxiety subscale negatively predicted scores on the emotion labelling task (estimate = `r rc_age_stats$estimate`; 95% CI = [`r rc_age_stats$conf.low`, `r rc_age_stats$conf.high`]; t = `r (rc_age_stats$statistic)`; `r pval(rc_age_stats$p.value)`).
#### Controlling for Sex and Age
```{r}rc_sex_age <- lm(emo_label ~ DASS_anx + sex_e*age_c, data = dat)
rc_sex_age_stats <- rc_sex_age %>% broom::tidy() %>% bind_cols(confint(rc_sex_age) %>% as_tibble()) %>% filter(term == "DASS_anx") %>% rename(conf.low = `2.5 %`, conf.high = `97.5 %`) %>% mutate_if(is.numeric, aparound, 3)
```
Controlling for sex, age and their interaction, Scores on the DASS anxiety subscale negatively predicted scores on the emotion labelling task (estimate = `r rc_sex_age_stats$estimate`; 95% CI = [`r rc_sex_age_stats$conf.low`, `r rc_sex_age_stats$conf.high`]; t = `r (rc_sex_age_stats$statistic)`; `r pval(rc_sex_age_stats$p.value)`).
### MERT
```{r}rc_ <- lm(MERT ~ DASS_anx, data = dat)
rc_stats <- rc_ %>% broom::tidy() %>% bind_cols(confint(rc_) %>% as_tibble()) %>%

filter(term == "DASS_anx") %>% rename(conf.low = `2.5 %`, conf.high = `97.5 %`) %>% mutate_if(is.numeric, aparound, 3)```
Scores on the DASS anxiety subscale negatively predicted scores on the MERT (estimate = `r rc_stats$estimate`; 95% CI = [`r rc_stats$conf.low`, `r rc_stats$conf.high`]; t = `r (rc_stats$statistic)`; `r pval(rc_stats$p.value)`).
#### Controlling for Sex
```{r}
rc_sex <- lm(MERT ~ DASS_anx + sex_e, data = dat)
rc_sex_stats <- rc_sex %>% broom::tidy() %>% bind_cols(confint(rc_sex) %>% as_tibble()) %>% filter(term == "DASS_anx") %>% rename(conf.low = `2.5 %`, conf.high = `97.5 %`) %>% mutate_if(is.numeric, aparound, 3)```
Controlling for sex, Scores on the DASS anxiety subscale negatively predicted scores on the MERT (estimate = `r rc_sex_stats$estimate`; 95% CI = [`r rc_sex_stats$conf.low`, `r rc_sex_stats$conf.high`]; t = `r (rc_sex_stats$statistic)`; `r pval(rc_sex_stats$p.value)`).
#### Controlling for Age
```{r}rc_age <- lm(MERT ~ DASS_anx + age_c, data = dat)
rc_age_stats <- rc_age %>% broom::tidy() %>% bind_cols(confint(rc_age) %>% as_tibble()) %>% filter(term == "DASS_anx") %>% rename(conf.low = `2.5 %`, conf.high = `97.5 %`) %>% mutate_if(is.numeric, aparound, 3)```
Controlling for age, Scores on the DASS anxiety subscale negatively predicted scores on the MERT

(estimate = `r rc_age_stats$estimate`; 95% CI = [`r rc_age_stats$conf.low`, `r rc_age_stats$conf.high`]; t = `r (rc_age_stats$statistic)`; `r pval(rc_age_stats$p.value)`).
#### Controlling for Sex and Age
```{r}rc_sex_age <- lm(MERT ~ DASS_anx + sex_e*age_c, data = dat)
rc_sex_age_stats <- rc_sex_age %>% broom::tidy() %>% bind_cols(confint(rc_sex_age) %>% as_tibble()) %>% filter(term == "DASS_anx") %>% rename(conf.low = `2.5 %`, conf.high = `97.5 %`) %>% mutate_if(is.numeric, aparound, 3)
```
Controlling for sex, age and their interaction, Scores on the DASS anxiety subscale negatively predicted scores on the MERT (estimate = `r rc_sex_age_stats$estimate`; 95% CI = [`r rc_sex_age_stats$conf.low`, `r rc_sex_age_stats$conf.high`]; t = `r (rc_sex_age_stats$statistic)`; `r pval(rc_sex_age_stats$p.value)`).
### PCA
Palermo et al. "combined the scores across the three tasks using principal components analysis (PCA) to derive a measure of general ‘emotion recognition’, independent of the task".
```{r, results='asis'}
emo_tests <- select(dat, emo_match, emo_label, MERT) # principal components analysis (SPSS-style)ev <- eigen(cor(emo_tests))$valuesnfactors <- sum(ev > 1) pca <- principal( emo_tests, nfactors=nfactors, rotate="none") pvar <- pca$Vaccounted["Proportion Var", ] %>% round(3) * 100

unclass(pca$loadings) %>% as.data.frame() %>% rownames_to_column() %>% knitr::kable(digits = 2)
```
The proportion of variance explained by this principal component was `r pvar`%.
```{r PC-cors, results='asis'}
PC_cors <- dat %>% mutate(PC = pca$scores) %>% select(-sex) %>% cor() %>% as_tibble(rownames = "var") %>% select(var, PC) %>% filter(!(var %in% c("emo_match", "emo_label", "MERT", "age", "age_c", "sex_e", "PC")))
PC_cors %>% mutate_if(is.numeric, aparound, 3) %>% knitr::kable()```

Emotion Recognition RRSample SizeAnalysis
Simulate dataHypothesis 1Hypothesis 2Hypothesis 3Hypothesis 4
Robustness ChecksTruncated to Original RangeEmotion MatchingEmotion LabelingMERTPCA
Sample Size
Sample size is set at , following the small telescopes approach, which sets replication sample size at 2.5 times the original sample size (). With , this design has 80% power for two-tailed tests to detect correlations as small as .
AnalysisSimulate data
Descriptive data are taken from from Palermo et al (2018) with correlation structure from correlations reported in Palermo et al. (2018) or set to r =0.5 for all depression/anxiety measures (as unreported in Palermo).
var MERT emo_match emo_label DASS_dep DASS_anx PANAS_p PANAS_n AQ EQ BES_aff BES_cog age sex_e age_c
MERT 1.000 0.545 0.550 -0.126 -0.321 -0.330 -0.151 -0.105 -0.029 -0.133 0.047 0.059 0.052 0.059
emo_match 0.545 1.000 0.581 -0.188 -0.315 -0.213 -0.298 -0.098 -0.029 -0.101 0.055 0.039 0.006 0.039
emo_label 0.550 0.581 1.000 -0.167 -0.305 -0.188 -0.137 -0.170 -0.057 -0.037 0.040 -0.028 0.046 -0.028
DASS_dep -0.126 -0.188 -0.167 1.000 0.578 0.489 0.542 0.502 0.560 0.459 0.484 0.048 0.008 0.048
DASS_anx -0.321 -0.315 -0.305 0.578 1.000 0.617 0.493 0.514 0.553 0.573 0.523 0.025 0.129 0.025
PANAS_p -0.330 -0.213 -0.188 0.489 0.617 1.000 0.505 0.548 0.544 0.483 0.522 0.058 0.021 0.058
PANAS_n -0.151 -0.298 -0.137 0.542 0.493 0.505 1.000 0.540 0.571 0.562 0.536 0.087 0.072 0.087
AQ -0.105 -0.098 -0.170 0.502 0.514 0.548 0.540 1.000 0.599 0.560 0.627 0.134 0.137 0.134
EQ -0.029 -0.029 -0.057 0.560 0.553 0.544 0.571 0.599 1.000 0.550 0.611 0.128 0.133 0.128
BES_aff -0.133 -0.101 -0.037 0.459 0.573 0.483 0.562 0.560 0.550 1.000 0.572 0.060 0.150 0.060
BES_cog 0.047 0.055 0.040 0.484 0.523 0.522 0.536 0.627 0.611 0.572 1.000 0.124 0.193 0.124
age 0.059 0.039 -0.028 0.048 0.025 0.058 0.087 0.134 0.128 0.060 0.124 1.000 -0.075 1.000
sex_e 0.052 0.006 0.046 0.008 0.129 0.021 0.072 0.137 0.133 0.150 0.193 -0.075 1.000 -0.075
age_c 0.059 0.039 -0.028 0.048 0.025 0.058 0.087 0.134 0.128 0.060 0.124 1.000 -0.075 1.000
Hypothesis 1
Scores on the emotion matching task and the DASS anxiety subscale were correlated with r = -0.315; 95% CI = [-0.448, -0.168], p < .001.
Hypothesis 2
Scores on the emotion labeling task and the DASS anxiety subscale were correlated with r = -0.305; 95% CI = [-0.44, -0.158], p < .001.
Hypothesis 3
var emo_match emo_label
Code
Code
Code
Code
Code
Code
Code
Code
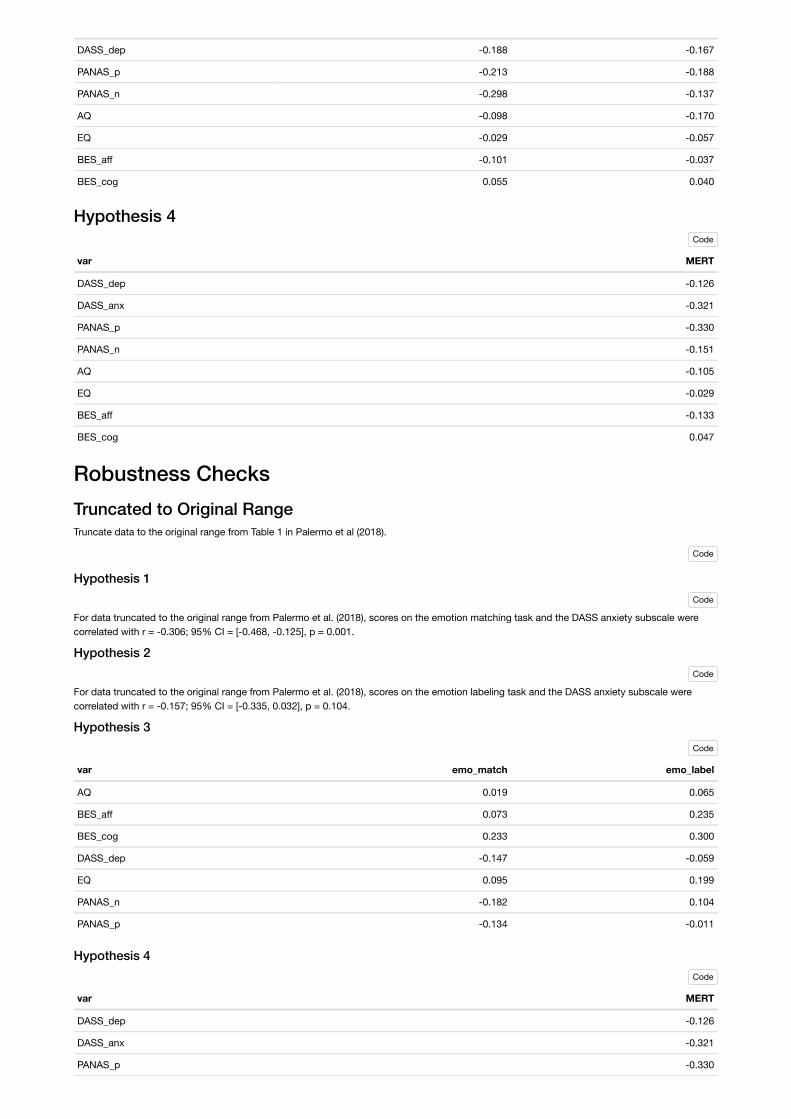
DASS_dep -0.188 -0.167
PANAS_p -0.213 -0.188
PANAS_n -0.298 -0.137
AQ -0.098 -0.170
EQ -0.029 -0.057
BES_aff -0.101 -0.037
BES_cog 0.055 0.040
Hypothesis 4
var MERT
DASS_dep -0.126
DASS_anx -0.321
PANAS_p -0.330
PANAS_n -0.151
AQ -0.105
EQ -0.029
BES_aff -0.133
BES_cog 0.047
Robustness ChecksTruncated to Original RangeTruncate data to the original range from Table 1 in Palermo et al (2018).
Hypothesis 1
For data truncated to the original range from Palermo et al. (2018), scores on the emotion matching task and the DASS anxiety subscale werecorrelated with r = -0.306; 95% CI = [-0.468, -0.125], p = 0.001.
Hypothesis 2
For data truncated to the original range from Palermo et al. (2018), scores on the emotion labeling task and the DASS anxiety subscale werecorrelated with r = -0.157; 95% CI = [-0.335, 0.032], p = 0.104.
Hypothesis 3
var emo_match emo_label
AQ 0.019 0.065
BES_aff 0.073 0.235
BES_cog 0.233 0.300
DASS_dep -0.147 -0.059
EQ 0.095 0.199
PANAS_n -0.182 0.104
PANAS_p -0.134 -0.011
Hypothesis 4
var MERT
DASS_dep -0.126
DASS_anx -0.321
PANAS_p -0.330
Code
Code
Code
Code
Code
Code

PANAS_n -0.151
AQ -0.105
EQ -0.029
BES_aff -0.133
BES_cog 0.047
Emotion Matching
Scores on the DASS anxiety subscale negatively predicted scores on the emotion matching task (estimate = -0.862; 95% CI = [-1.27, -0.453]; t =-4.167; p < .001).
Controlling for Sex
Controlling for sex, Scores on the DASS anxiety subscale negatively predicted scores on the emotion matching task (estimate = -0.879; 95% CI =[-1.291, -0.466]; t = -4.205; p < .001).
Controlling for Age
Controlling for age, Scores on the DASS anxiety subscale negatively predicted scores on the emotion matching task (estimate = -0.865; 95% CI =[-1.275, -0.456]; t = -4.173; p < .001).
Controlling for Sex and Age
Controlling for sex, age and their interaction, Scores on the DASS anxiety subscale negatively predicted scores on the emotion matching task(estimate = -0.893; 95% CI = [-1.307, -0.478]; t = -4.257; p < .001).
Emotion Labeling
Scores on the DASS anxiety subscale negatively predicted scores on the emotion labelling task (estimate = -0.611; 95% CI = [-0.91, -0.311]; t =-4.03; p < .001).
Controlling for Sex
Controlling for sex, Scores on the DASS anxiety subscale negatively predicted scores on the emotion labelling task (estimate = -0.633; 95% CI =[-0.935, -0.331]; t = -4.146; p < .001).
Controlling for Age
Controlling for age, Scores on the DASS anxiety subscale negatively predicted scores on the emotion labelling task (estimate = -0.61; 95% CI =[-0.91, -0.309]; t = -4.01; p < .001).
Controlling for Sex and Age
Controlling for sex, age and their interaction, Scores on the DASS anxiety subscale negatively predicted scores on the emotion labelling task(estimate = -0.634; 95% CI = [-0.938, -0.33]; t = -4.119; p < .001).
MERT
Scores on the DASS anxiety subscale negatively predicted scores on the MERT (estimate = -0.683; 95% CI = [-0.999, -0.366]; t = -4.265; p <.001).
Controlling for Sex
Controlling for sex, Scores on the DASS anxiety subscale negatively predicted scores on the MERT (estimate = -0.708; 95% CI = [-1.027, -0.39]; t= -4.398; p < .001).
Controlling for Age
Controlling for age, Scores on the DASS anxiety subscale negatively predicted scores on the MERT (estimate = -0.686; 95% CI = [-1.003, -0.37]; t= -4.283; p < .001).
Controlling for Sex and Age
Controlling for sex, age and their interaction, Scores on the DASS anxiety subscale negatively predicted scores on the MERT (estimate = -0.713;95% CI = [-1.032, -0.393]; t = -4.403; p < .001).
PCA
Code
Code
Code
Code
Code
Code
Code
Code
Code
Code
Code
Code

PCAPalermo et al. “combined the scores across the three tasks using principal components analysis (PCA) to derive a measure of general ‘emotionrecognition’, independent of the task”.
rowname PC1
emo_match 0.84
emo_label 0.85
MERT 0.83
The proportion of variance explained by this principal component was 70.6%.
var PC
DASS_dep -0.191
DASS_anx -0.373
PANAS_p -0.289
PANAS_n -0.233
AQ -0.148
EQ -0.046
BES_aff -0.107
BES_cog 0.057
Code
Code