chapter 12: central and south america - accepted
TRANSCRIPT
FINAL DRAFT Chapter 12 IPCC WGII Sixth Assessment Report
Do Not Cite, Quote or Distribute 12-1 Total pages: 181
1
Chapter 12: Central and South America 2 3 Coordinating Lead Authors: Edwin J. Castellanos (Guatemala), Maria Fernanda Lemos (Brazil) 4 5 Lead Authors: Laura Astigarraga (Uruguay), Noemí Chacón (Venezuela), Nicolás Cuvi (Ecuador), 6 Christian Huggel (Switzerland), Liliana Miranda (Peru), Mariana Moncassim Vale (Brazil), Jean Pierre 7 Ometto (Brazil), Pablo L. Peri, (Argentina), Julio C. Postigo (USA/Peru), Laura Ramajo (Chile/Spain), 8 Lisandro Roco (Chile), Matilde Rusticucci (Argentina). 9 10 Contributing Authors: Júlia Alves Menezes (Brazil), Pedro Borges (Venezuela), Jhonattan Bueno 11 (Venezuela), Francisco Cuesta (Ecuador), Fabian Drenkhan (Peru), Alex Guerra (Guatemala), Valeria 12 Guinder (Argentina), Isabel Hagen (Switzerland), Jorgelina Hardoy (Argentina), Stella Hartinger (Peru), 13 Gioconda Herrera (Ecuador), Cecilia Herzog (Brazil), Bárbara Jacob (Chile), Thais Kasecker (Brazil), 14 Andrea Lampis (Colombia/Brazil), Izabella Lentino (Brazil), Luis C. S. Madeira Domingues (Brazil), José 15 Marengo (Brazil), David Montenegro Lapola (Brazil), Ana Rosa Moreno (Mexico), Julia de Niemeyer 16 Caldas (Brazil), Eduardo Pacay (Costa Rica/Guatemala), Roberto Pasten (Chile), Matias Piaggio (Uruguay), 17 Osvaldo Rezende (Brazil), Alfonso J. Rodriguez-Morales (Colombia), Marina Romanello (Argentina/United 18 Kingdom), Sadie J. Ryan (USA/ United Kingdom), Anna Stewart-Ibarra (USA/Ecuador), María Valladares 19 (Chile/Spain) 20 21 Review Editors: Carlos Méndez (Venezuela), Avelino Suarez (Cuba) 22 23 Chapter Scientist: María Valladares (Chile/Spain) 24 25 Date of Draft: 1 October 2021 26 27 Notes: TSU Compiled Version 28 29
30 Table of Contents 31 32 Executive Summary .......................................................................................................................................... 3 33 12.1 Introduction .............................................................................................................................................. 8 34
12.1.1 The Central and South America Region ......................................................................................... 8 35 12.1.2 Approach and Storyline for the Chapter ....................................................................................... 10 36
12.2 Summary of the Fifth Assessment Report and Recent IPCC Special Reports ................................. 11 37 12.3 Hazards, Exposure, Vulnerabilities and Impacts ................................................................................ 12 38
12.3.1 Central America (CA) Sub-region ................................................................................................ 12 39 12.3.2 Northwest South America (NWS) Sub-region ............................................................................... 16 40 12.3.3 Northern South America (NSA) Sub-region .................................................................................. 20 41 12.3.4 South America Monsoon (SAM) Sub-region ................................................................................. 23 42 12.3.5 Northeast South America (NES) Sub-region ................................................................................. 28 43 12.3.6 Southeast South America (SES) Sub-region .................................................................................. 30 44 12.3.7 Southwest South America (SWS) Sub-region ................................................................................ 34 45 12.3.8 Southern South America (SSA) Sub-region ................................................................................... 39 46
12.4 Key Impacts and Risks ........................................................................................................................... 44 47 12.5 Adaptation ............................................................................................................................................... 50 48
12.5.1 Terrestrial and Freshwater Ecosystems and their Services .......................................................... 50 49 12.5.2 Ocean and Coastal Ecosystems and their Services ..................................................................... 53 50 12.5.3 Water ............................................................................................................................................. 58 51 12.5.4 Food, Fibre and other Ecosystem Products .................................................................................. 63 52 12.5.5 Cities, Settlements and Infrastructure ........................................................................................... 69 53 12.5.6 Health and Wellbeing .................................................................................................................... 73 54 12.5.7 Poverty, Livelihood and Sustainable Development ...................................................................... 78 55 12.5.8 Cross-cutting Issues in the Human Dimension ............................................................................. 82 56 12.5.9 Adaptation Options to Address Key Risks in CSA ........................................................................ 88 57
ACCEPTED VERSIO
N
SUBJECT TO FIN
AL EDITS
FINAL DRAFT Chapter 12 IPCC WGII Sixth Assessment Report
Do Not Cite, Quote or Distribute 12-2 Total pages: 181
12.5.10 Feasibility Assessment of Adaptation Options ..................................................................... 91 1 12.6 Case Studies ............................................................................................................................................ 93 2
12.6.1 Nature-based Solutions in Quito, Ecuador ................................................................................... 93 3 12.6.2 Anthropogenic Soils, an Option for Mitigation and Adaptation to Climate Change in Central 4
and South America. Learning from the “Terras Pretas de Índio” in the Amazon ............... 95 5 12.6.3 Towards a Metropolitan Water-related Climate Proof Governance (re)configuration? The case 6
of Lima, Perú ........................................................................................................................ 96 7 12.6.4 Strengthening Water Governance for Adaptation to Climate Change: Managing Scarcity and 8
Excess of Water in the Pacific Coastal area of Guatemala .................................................. 97 9 12.7 Knowledge Gaps ..................................................................................................................................... 98 10
12.7.1 Knowledge Gaps in the Subregions .............................................................................................. 99 11 12.7.2 Knowledge Gaps by Sector ........................................................................................................... 99 12
12.8 Conclusion ............................................................................................................................................. 103 13 FAQ 12.1: How are inequality and poverty limiting options to adapt to climate change in Central and 14
South America? .................................................................................................................................... 106 15 FAQ 12.2: How have urban areas in Central and South America adapted to climate change so far, 16
which further actions should be considered within the next decades and what are the limits of 17 adaptation and sustainability? ............................................................................................................ 107 18
FAQ 12.3: How do climatic events and conditions affect migration and displacement in Central and 19 South America, will this change due to climate change, and how can communities adapt? ......... 108 20
FAQ 12.4: How is climate change impacting and expected to impact food production in Central and 21 South America in the next 30 years and what effective adaptation strategies are and can be 22 adopted in the region? .......................................................................................................................... 109 23
FAQ 12.5: How can Indigenous knowledge and practices contribute to adaptation initiatives in 24 Central and South America? ............................................................................................................... 111 25
References ...................................................................................................................................................... 113 26 27 28
ACCEPTED VERSIO
N
SUBJECT TO FIN
AL EDITS
FINAL DRAFT Chapter 12 IPCC WGII Sixth Assessment Report
Do Not Cite, Quote or Distribute 12-3 Total pages: 181
Executive Summary 1 2 Vulnerability and observed impacts: 3 4 Central and South America are highly exposed, vulnerable and strongly impacted by climate change, 5 a situation amplified by inequality, poverty, population growth and high population density, land use 6 change particularly deforestation with the consequent biodiversity loss, soil degradation, and high 7 dependence of national and local economies on natural resources for production of commodities (high 8 confidence1). Profound economic, ethnic and social inequalities are exacerbated by climate change. High 9 levels of widespread poverty, weak water governance, unequal access to safe water and sanitation services 10 and lack of infrastructure and financing reduce adaptation capacity, increasing and creating new population 11 vulnerabilities (high confidence). {12.1.1, 12.2, 12.3, 12.5.5, 12.5.7, Figure 12.2} 12 13 The Amazon forest, one of the world’s largest biodiversity and carbon repositories, is highly 14 vulnerable to drought (high confidence). The Amazon forest was highly impacted by the unprecedented 15 droughts and higher temperatures observed in 1998, 2005, 2010 and 2015/2016 attributed partly to climate 16 change. This resulted in high tree mortality rates and basin-wide reductions in forest productivity, 17 momentarily turning pristine forest areas from a carbon sink into a net source of carbon to the atmosphere 18 (high confidence). Other terrestrial ecosystems in Central and South America have been impacted by climate 19
change, through persistent drought or extreme climatic events. The combined effect of anthropogenic land 20 use change and climate change increases the vulnerabilities of terrestrial ecosystems to extreme climate 21 events and fires (medium confidence). {12.3, 12.4, Figure 12.7, Figure 12.9, Figure 12.10} 22 23 The distribution of terrestrial species has changed in the Andes due to increasing temperature (very 24 high confidence). Species have shifted upslope leading to range contractions for highland species, and range 25 contractions and expansions for lowland species, including crops and vectors of diseases (very high 26 confidence). {12.3.2.4} 27 28 Ocean and coastal ecosystems in the region such as coral reefs, estuaries, salt marshes, mangroves and 29 sandy beaches are highly sensitive and negatively impacted by climate change and derived-hazards 30 (high confidence). Observed impacts include the reduction in coral abundance, density and cover in Central 31 America, Northwest South America and Northeast South America and increasing number of coral bleaching 32 events in Central America and Northeast South America; changes in the plankton community and in ocean 33 and coastal food web structures, loss of vegetated wetlands and changes in macrobenthic communities in 34 Central America, Northwest, Northern, and Southeast South America. {12.3, 12.5.2, Figure 12.8, Figure 35 12.9, Table SM12.3} 36 37 Global warming has caused glacier loss in the Andes from 30% to more than 50% of their area since 38 the 1980s. Glacier retreat, temperature increase and precipitation variability, together with land-use 39 change, have affected ecosystems, water resources, and livelihoods through landslides and flood 40 disasters (very high confidence). In several areas of the Andes, flood and landslide disasters have increased, 41 and water availability and quality and soil erosion have been affected by both climatic and non-climatic 42 factors (high confidence). {12.3.2, 12.3.7, Figure 12.9, Figure 12.13, Table SM12.6} 43 44 The scientific evidence since the IPCC AR5 increased the confidence on the synergy among fire, land 45 use change, particularly deforestation, and climate change, directly impacting human health, 46 ecosystem functioning, forest structure, food security and the livelihoods of resource-dependent 47 communities (medium confidence). Regional increase in temperature, aridity and drought increased the 48 frequency and intensity of fire. On average, people in the region were more exposed to high fire danger 49 between 1 and 26 additional days depending on the subregion for the years 2017-2020 compared to 2001-50 2004 (high confidence). {12.2, 12.3, Figure 12.9, Figure 12.10, Table 12.5} 51
1 In this Report, the following summary terms are used to describe the available evidence: limited, medium, or robust; and for the degree of agreement: low, medium, or high. A level of confidence is expressed using five qualifiers: very low, low, medium, high, and very high, and typeset in italics, e.g., medium confidence. For a given evidence and agreement statement, different confidence levels can be assigned, but increasing levels of evidence and degrees of agreement are correlated with increasing confidence.
ACCEPTED VERSIO
N
SUBJECT TO FIN
AL EDITS
FINAL DRAFT Chapter 12 IPCC WGII Sixth Assessment Report
Do Not Cite, Quote or Distribute 12-4 Total pages: 181
1 Changes in timing and magnitude of precipitation and extreme temperatures are impacting 2 agricultural production (high confidence). Since the mid-20th century, increasing mean precipitation has 3 positively impacted agricultural production in Southeast South America, although extremely long dry spells 4 have become more frequent affecting the economies of large cities in southeast Brazil. Inversely, reduced 5 precipitation and altered rainfall at the start and end of the rainy season and during the mid-summer drought 6 is impacting rainfed subsistence farming particularly in the Dry Corridor in Central America and in the 7 tropical Andes compromising food security (high confidence). The crop growth duration for maize for those 8 regions was reduced by at least 5% between 1981-2010 and 2015-2019. {12.3.1, 12.3.2, 12.3.6, Table 12.4} 9 10 Climate change affects the epidemiology of climate-sensitive infectious diseases in the region (high 11 confidence). Examples are the effects of warming temperatures on increasing the suitability of transmission 12 of vector-borne diseases, including endemic and emerging arboviral diseases such as dengue fever, 13 chikungunya, and Zika (medium confidence). The reproduction potential for the transmission of dengue 14 increased between 17% and 80% for the period 1950-54 to 2016-2021 depending on the subregion as a result 15 of changes in temperature and precipitation (high confidence). {12.3.1, 12.3.2, 12.3.3, 12.3.5, 12.3.6, Table 16 12.1} 17 18 The Andes, northeast Brazil and the northern countries in Central America are among the more 19 sensitive regions to climatic-related migrations and displacements, a phenomenon that has increased 20 since AR5 (high confidence). Climatic drivers interact with social, political, geopolitical and economical 21 drivers; the most common climatic drivers for migration and displacements are droughts, tropical storms and 22 hurricanes, heavy rains and floods (high confidence). {12.3.1.4, 12.3.2.4, 12.3.3.4, 12.3.5.4, 12.5.8.4} 23 24 The impacts of climate change are not of equal scope for men and women (high confidence). Women, 25 particularly the poorest, are more vulnerable and are impacted in greater proportion. Often they have less 26 capacity to adapt, further widening structural gender gaps (high confidence). {12.3.7.3, 12.5.2.4, 12.5.2.5, 27 12.5.7.3, 12.5.8.1, 12.5.8.3, 12.5.8.4} 28 29 Current adaptation responses: 30 31 Ecosystem-based adaptation is the most common adaptation strategy for terrestrial and freshwater 32 ecosystems (high confidence). There is a focus on the protection of native terrestrial vegetation through 33 implementation of protected areas and payment for ecosystem services, especially those related to water 34 provision. The adaptation measures in place, however, are insufficient to safeguard terrestrial and freshwater 35 ecosystems in the CSA from negative impacts of climate change (high confidence). {12.5.1, 12.5.3, 12.6} 36 37 Adaptation initiatives in ocean and coastal ecosystems mainly focus on conservation, protection and 38 restoration) (high confidence). The main adaptation measures are ocean zoning, the prohibition of 39 productive activities (e.g., fisheries, aquaculture, mining, tourism) on marine ecosystems, the improvement 40 of research and education programs, and the creation of specific national policies (high confidence). {12.5.2} 41 42 Adaptive water management has mainly centred on enhancing quantity and quality of water supply, 43 including large infrastructure projects, which, however, are often contested and can exacerbate water 44 related conflicts (high confidence). Inclusive water regimes that overcome social inequalities and 45 approaches including nature-based solutions, such as wetland restoration and water storage and infiltration 46 infrastructure, with synergies for ecosystem conservation and disaster risk reduction, have been found to be 47 more successful for adaptation and sustainable development (high confidence). {12.5.3, 12.6.1, 12.6.3} 48 49 Adaptation strategies for agricultural production are increasing in the region as a response to current 50 and projected changes in climate (high confidence). The main observed adaptation strategies in agriculture 51 and forestry are soil and water management conservation, crop diversification, climate-smart agriculture, 52 early warning systems, upward shifting for plantations to avoid warming habitat and pests and improved 53 management of pastures and livestock. Adaptation requires governance improvements and new strategies to 54 address changing climate; nevertheless, barriers limiting adaptive capacity persist such as lack of educational 55 programs for farmers, adequate knowledge of site-specific adaptation and institutional and financial 56 constraints (high confidence). {12.5.4} 57
ACCEPTED VERSIO
N
SUBJECT TO FIN
AL EDITS
FINAL DRAFT Chapter 12 IPCC WGII Sixth Assessment Report
Do Not Cite, Quote or Distribute 12-5 Total pages: 181
1 Urban adaptation in the region includes solutions on regulation, planning, urban waters management 2 and housing (high confidence). Regulation, planning and control systems are central tools on reducing risk 3 associated with the security of the buildings, their location, and the proper supply of basic urban services and 4 transport (high confidence). The adoption of nature-based solutions (e.g., urban agriculture and rivers 5 restoration) and hybrid (grey-green) infrastructure are still incipient with weak connections to poverty and 6 inequality reduction strategies (medium confidence). Focusing on risk reduction encompasses upgrading 7 informal and precarious settlements, built-environments, and improving housing conditions, which offer an 8 important but still limited contribution to urban adaptation (high confidence). {12.5.5, 12.5.7, 12.6.1} 9 10 Adaptation initiatives for the health sector are mainly focused on the development of climate services 11 such as integrated climate-health surveillance and observatories, forecasting climate-related disasters 12 and vulnerability maps (high confidence). Climate services for the health sector are largely focused on 13 epidemic forecast tools and associated early warning systems for vector-borne diseases and heat and cold 14 waves. Political, institutional and financial barriers reduce the feasibility of implementing these tools (high 15 confidence). {12.5.6, Table 12.9, Table 12.11} 16 17 Indigenous knowledge and local knowledge are crucial for the adaptation and resilience of social-18 ecological systems (high confidence). Indigenous knowledge and local knowledge can contribute to 19 reducing the vulnerability of local communities to climate change (medium confidence). {12.5.1, 12.5.8, 20 12.6.2} 21 22 What are the projected impacts and key risks? 23 24 Climate change is projected to convert existing risks in the region into severe key risks (medium 25 confidence). Key risks are assessed as follows: 1. Risk of food insecurity due to droughts; 2. Risk to people 26 and infrastructure due to floods and landslides; 3. Risk of water insecurity due to declining snow cover, 27 shrinking glaciers and rainfall variability; 4. Risk of increasing epidemics particularly of vector-borne 28 diseases; 5. Cascading risks surpassing public service systems; 6. Risk of large-scale changes and biome 29 shifts in the Amazon; 7. Risks to coral reef ecosystems; and 8. Risks to coastal socio-ecological systems due 30 to sea level rise, storm surges and coastal erosion. {12.3, 12.4, Figure 12.9, Figure 12.11, Table 12.6, Table 31 SM12.5} 32 33 Impacts on rural livelihoods and food security, particularly for small and medium-sized farmers and 34 Indigenous Peoples in the mountains, are projected to worsen, including the overall reduction of 35 agricultural production, suitable farming area and water availability (high confidence). Projected yield 36 reductions by 2050 under A2 scenario are: bean 19%, maize 4–21%, rice 23% in Central America with 37 seasonal droughts projected to lengthen, intensify and increase in frequency. Small fisheries and farming of 38 seafood will be negatively affected as ENSO events become more frequent and intense and ocean warming 39 and acidification continues (medium confidence). {12.2, 12.3, 12.4, Figure 12.9, Figure 12.11, Table 12.4} 40 41 Extreme precipitation events, which result in floods, landslides and droughts, are projected to 42 intensify in magnitude and frequency due to climate change (medium confidence). Floods and landslides 43 pose a risk to life and infrastructure; a 1.5ºC increase would result in an increase of 100–200% in the 44 population affected by floods in Colombia, Brazil and Argentina, 300% in Ecuador and 400% in Peru 45 (medium confidence). {12.3, Figure 12.7, Figure 12.9, Table SM12.5} 46 47 Increasing water scarcity and competition over water are projected (high confidence). Disruption in 48 water flows will significantly degrade ecosystems such as high-elevation wetlands and affect farming 49 communities, public health and energy production (high confidence). {12.3, Figure 12.3, Figure 12.9, Figure 50 12.11} 51 52 In the next decades, endemic and emerging climate-sensitive infectious diseases are projected to 53 increase (medium confidence). This can happen through expanded distribution of vectors, especially viral 54 infectious diseases from zoonotic origin in transition areas between urban and suburban, or rural settings, 55 and upslope in the mountains (medium confidence). {12.3.2, 12.3.5, 12.3.7, Figure 12.5, Figure 12.9, Figure 56 12.11, Table 12.6, Table SM12.5} 57
ACCEPTED VERSIO
N
SUBJECT TO FIN
AL EDITS
FINAL DRAFT Chapter 12 IPCC WGII Sixth Assessment Report
Do Not Cite, Quote or Distribute 12-6 Total pages: 181
1 The positive feedback between climate change and land use change, particularly deforestation, is 2 projected to increase the threat to the Amazon forest, resulting in the increase of fire occurrence, 3 forest degradation (high confidence) and long-term loss of forest structure (medium confidence). The 4 combined effect of both impacts will lead to a long-term decrease in carbon stocks in forest biomass, 5 compromising Amazonia´s role as a carbon sink, largely conditional on the forest's responses to elevated 6 atmospheric CO2 (medium confidence). The southern portion of the Amazon has become a net carbon source 7 to the atmosphere in the past decade (high confidence). {12.3.3, 12.3.4, Figure 12.9, Figure 12.11, Table 8 12.6, Table SM12.5} 9 10 Up to 85% of natural systems (plant and animal species, habitats and communities) evaluated in the 11 literature for biodiversity-rich spots in the region are projected to be negatively impacted by climate 12 change (medium confidence). Available studies focus mainly on vertebrates and plants of the Atlantic 13 Forest and Cerrado in Brazil and in Central America, with a large knowledge gap on freshwater ecosystems 14 {12.3, 12.5.1, CCP1} 15 16 Ocean and coastal ecosystems in the region will continue to be highly impacted by climate change 17 (high confidence). Coral reefs are projected to lose their habitat, change their distribution range and suffer 18 more bleaching events driven by ocean warming. In the RCP4.5 and RCP8.5 scenarios by 2050, virtually 19 every coral reef will experience at least one severe bleaching event per year (high confidence). Under all 20 RCP scenarios of climate change, there will be changes in the geographical distribution of marine species 21 and ocean and coastal ecosystems such as mangroves, estuaries, rocky shores, as well as those species 22 subjected to fisheries (medium confidence). {Figure 12.9, Table SM12.3, Table SM12.4} 23 24 Contribution of adaptation to solutions and barriers to adaptation 25 26 Policies and actions at multiple scales and the participation of actors from all social groups, including 27 the most exposed and vulnerable populations, are critical elements for effective adaptation (high 28 confidence). Engaging social movements and local actors in policy-making and planning for adaptation 29 generates positive synergies and better results. Adaptation policies and programs that consider age, 30 socioeconomic status, race, and ethnicity are more efficient, as these factors determine vulnerability and 31 potential benefits of adaptation. Socio-economic and political factors that provide some level of safety and 32 continuity of policies and actions are critical enablers of adaptation (high confidence). {12.5.1, 12.5.2, 33 12.5.7, 12.5.8, 12.6.4} 34 35 The knowledge and awareness of climate change as a threat has been increasing since AR5 due to the 36 increasing frequency and magnitude of extreme weather events in the region, information available 37 and climate justice activism (high confidence). Conflicts in which direct biophysical impacts of climate 38 change play a major role can unleash protests and strengthen social movements (medium confidence). 39 {12.5.8, 12.6.4} 40 41 Research approaches that integrate Indigenous knowledge and local knowledge systems, with natural 42 and social sciences, have increased since AR5 (high confidence), and are helping to improve decision-43 making processes in the region, reduce maladaptation, and foster transformational adaptation through the 44 integration with ecosystem-based adaptation and community-based adaptation (high confidence). {12.5.1, 45 12.5.8, 12.6.2} 46 47 The most reported obstacle for adaptation in terrestrial, freshwater, ocean and coastal ecosystems is 48 financing (high confidence). There is also a significant gap in identifying limits to adaptation and weak 49 institutional capacity for implementation. This hinders the development of comprehensive adaptation 50 programs, even under adequate funding. {12.5.1, 12.5.2} 51 52 Climate Smart Agriculture technologies strengthening synergies among productivity and mitigation is 53 growing as an important adaptation strategy in the region (high confidence). Pertinent information for 54 farmers provided by Climate Information Services are helping them to understand the role of climate vs. 55 other drivers in perceived productivity changes. Index insurance builds resilience and contributes to 56
ACCEPTED VERSIO
N
SUBJECT TO FIN
AL EDITS
FINAL DRAFT Chapter 12 IPCC WGII Sixth Assessment Report
Do Not Cite, Quote or Distribute 12-7 Total pages: 181
adaptation both by protecting farmers’ assets in the face of major climate shocks, by promoting access to 1 credit, and by the adoption of improved farm technologies and practices. {12.5.4} 2 3 Institutional instability, fragmented services and poor water management, inadequate governance 4 structures, insufficient data and analysis of adaptation experience are barriers to address the water 5 challenges in the region (high confidence). {12.5.3} 6 7 Inequality, poverty and informality shaping cities in the region increase vulnerability to climate 8 change while policies, plans or interventions addressing these social challenges with inclusive 9 approaches are opportunities for adaptation (high confidence). Initiatives to improve informal and 10 precarious settlement, guaranteeing access to land and decent housing, are aligned with comprehensive 11 adaptation policies that include development and reduction of poverty, inequality and disaster risk (medium 12 confidence). {12.5.5, 12.5.7} 13 14 Adaptation policies often address climate impact drivers, but seldom include the social and economic 15 underpinnings of vulnerability. This narrow scope limits adaptation results and compromises their 16 continuity in the region (high confidence). In a context of unaddressed underdevelopment, adaptation 17 policies tackling poverty and inequality are marginal, underfunded, and not clearly included at national, 18 regional or urban levels. Dialogue and agreement including multiple actors are mechanisms to acknowledge 19 trade-offs and promote dynamic, site-specific adaptation options (medium confidence). {12.5.7} 20 21 22
ACCEPTED VERSIO
N
SUBJECT TO FIN
AL EDITS
FINAL DRAFT Chapter 12 IPCC WGII Sixth Assessment Report
Do Not Cite, Quote or Distribute 12-8 Total pages: 181
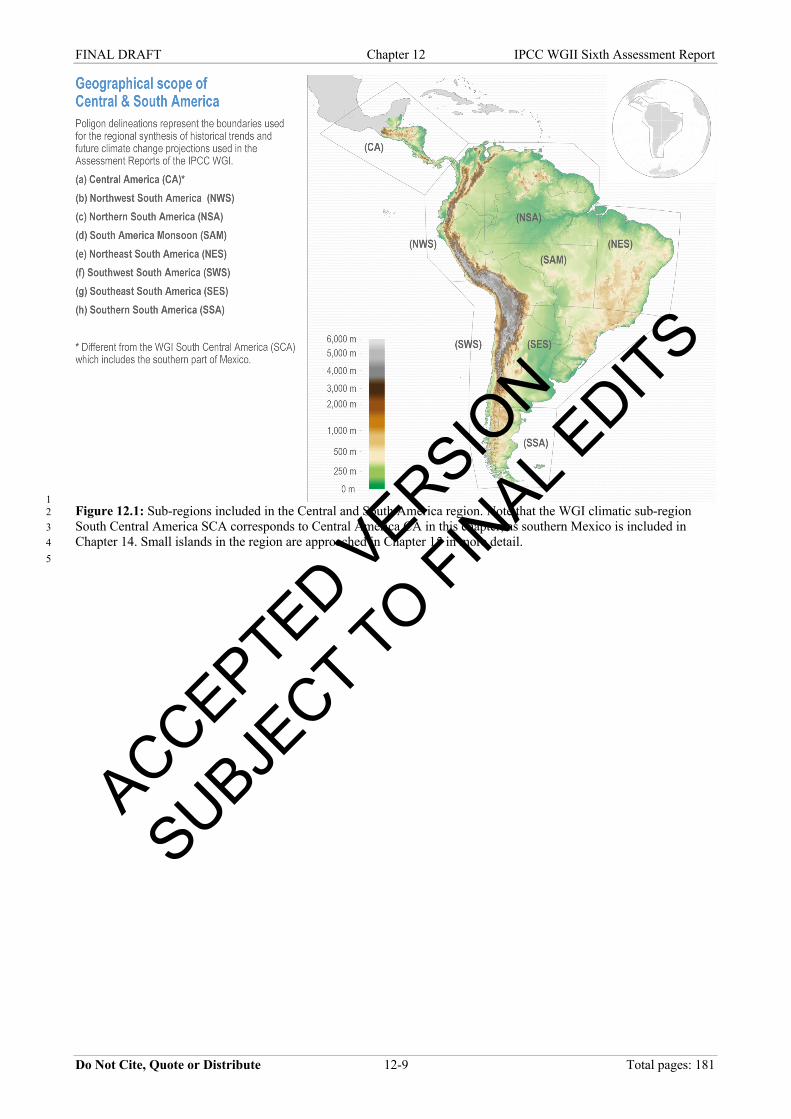
12.1 Introduction 1 2 12.1.1 The Central and South America Region 3 4 Central and South America (CSA) is a highly diverse region, both culturally and biologically. It harbours one 5 of the highest biodiversity on the planet (Hoorn et al., 2010; Zador et al., 2015; IPBES, 2018a) (Cross-6 Chapter Paper 1: Biodiversity Hotspots) and a wealth of cultural diversity resulting from more than 800 7 Indigenous Peoples who share the territory with European and African descendants and more recent Asian 8 migrants (CEPAL, 2014). Moreover, it is one of the most urbanized regions in the world, with some of the 9 most populated metropolitan areas (UNDESA, 2019). Several countries in the region have experienced 10 sustained economic growth in the last decades, making important advances in reducing poverty in the area. 11 Yet, it is a region of substantial social inequality including the highest inequality in land tenure, where there 12 still remains a large percentage of the population below the poverty line, unequally distributed between rural 13 and urban areas and along aspects like gender and race; these groups are highly vulnerable to climate change 14 and natural extreme events that frequently affect the region (high confidence) (ECLAC, 2019b; Busso and 15 Messina, 2020; Poveda et al., 2020). 16 17 Land use changes in the region, particularly deforestation, are large, mostly due to agricultural production for 18 export purposes, one of the main sources of income for the area (Salazar et al., 2016) (Figure 12.2c). 19 Additional pressure on the land comes from illegal activities, pollution and induced fires. These changes 20 exacerbate the impacts of climate change and make the region play a key role in the future of the world 21 economy and food production (IPBES, 2018a). The region boasts the largest tropical forest on the planet and 22 other important biomes of high biodiversity on mountains, lowlands and coastal areas. It can potentially 23 continue its agricultural expansion and development at the expense of substantially reducing the areas of 24 natural biomes. Indigenous Peoples and smallholder families are lacking adequate climate policies combined 25 with institutions to protect their property rights; this could result in a more sustainable process of agricultural 26 expansion, without substantially increasing greenhouse gas emissions and the vulnerability of those 27 populations (high confidence) (Sá et al., 2017). 28 29 Central and South America (CSA) is divided into eight climatic sub-regions by WGI (Figure 12.1). Though 30 the southern part of Mexico is included in the climatic sub-region SCA for WGI, Mexico is assessed in 31 Chapter 14 (North America). In this chapter, we refer to this sub-region as Central America (CA) as it 32 excludes southern Mexico. The climate change literature for the region occasionally includes Mexico and in 33 those cases, our assessment makes reference to Latin America but when only southern Mexico is included, 34 the term Mesoamerica is used. Figure 12.2 and Table SM12.1 summarize relevant characteristics of the sub-35 regions included in this chapter. 36 37 38
ACCEPTED VERSIO
N
SUBJECT TO FIN
AL EDITS
FINAL DRAFT Chapter 12 IPCC WGII Sixth Assessment Report
Do Not Cite, Quote or Distribute 12-9 Total pages: 181
1 Figure 12.1: Sub-regions included in the Central and South America region. Note that the WGI climatic sub-region 2 South Central America SCA corresponds to Central America CA in this chapter, as southern Mexico is included in 3 Chapter 14. Small islands in the region are approached in Chapter 15 in more detail. 4 5
ACCEPTED VERSIO
N
SUBJECT TO FIN
AL EDITS
FINAL DRAFT Chapter 12 IPCC WGII Sixth Assessment Report
Do Not Cite, Quote or Distribute 12-10 Total pages: 181
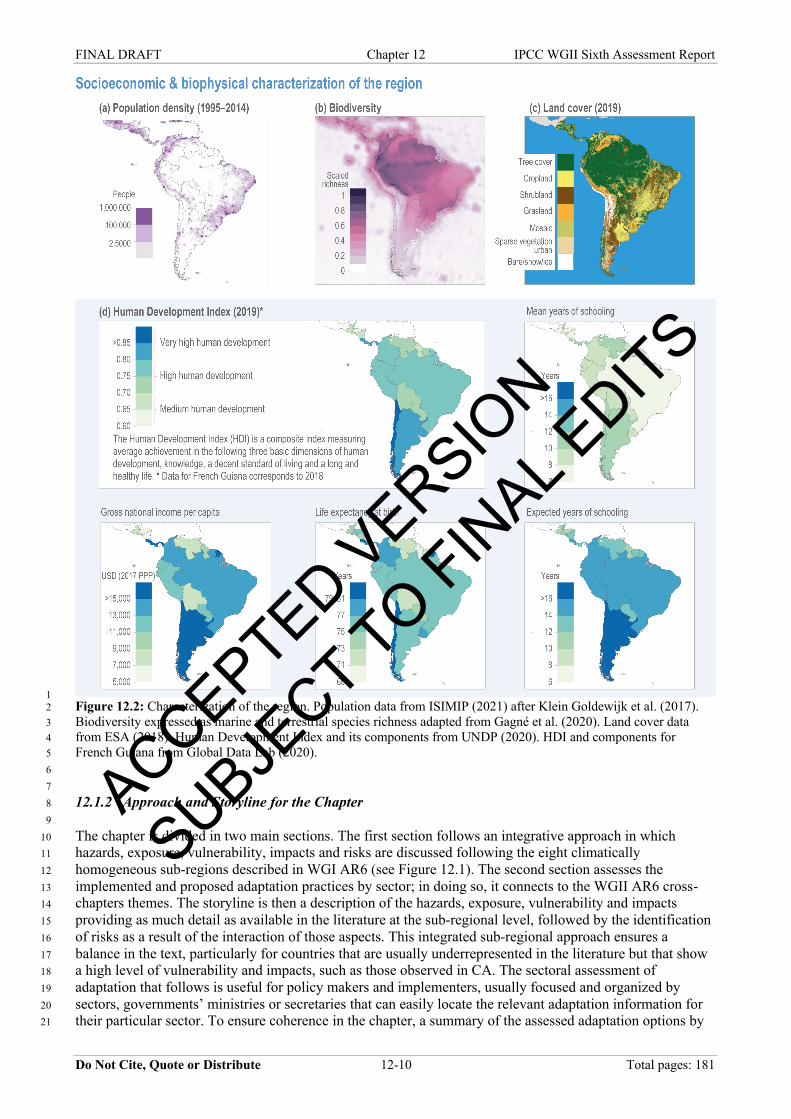
1 Figure 12.2: Characterization of the region. Population data from ISIMIP (2021) after Klein Goldewijk et al. (2017). 2 Biodiversity expressed as marine and terrestrial species richness adapted from Gagné et al. (2020). Land cover data 3 from ESA (2018). Human Development Index and its components from UNDP (2020). HDI and components for 4 French Guiana from Global Data Lab (2020). 5 6 7 12.1.2 Approach and Storyline for the Chapter 8 9 The chapter is divided in two main sections. The first section follows an integrative approach in which 10 hazards, exposure, vulnerability, impacts and risks are discussed following the eight climatically 11 homogeneous sub-regions described in WGI AR6 (see Figure 12.1). The second section assesses the 12 implemented and proposed adaptation practices by sector; in doing so, it connects to the WGII AR6 cross-13 chapters themes. The storyline is then a description of the hazards, exposure, vulnerability and impacts 14 providing as much detail as available in the literature at the sub-regional level, followed by the identification 15 of risks as a result of the interaction of those aspects. This integrated sub-regional approach ensures a 16 balance in the text, particularly for countries that are usually underrepresented in the literature but that show 17 a high level of vulnerability and impacts, such as those observed in CA. The sectoral assessment of 18 adaptation that follows is useful for policy makers and implementers, usually focused and organized by 19 sectors, governments’ ministries or secretaries that can easily locate the relevant adaptation information for 20 their particular sector. To ensure coherence in the chapter, a summary of the assessed adaptation options by 21
ACCEPTED VERSIO
N
SUBJECT TO FIN
AL EDITS
FINAL DRAFT Chapter 12 IPCC WGII Sixth Assessment Report
Do Not Cite, Quote or Distribute 12-11 Total pages: 181
key risks is presented, followed by a feasibility assessment for some relevant adaptation options. The chapter 1 closes with case studies and a discussion of the knowledge gaps evidenced in the process of the assessment. 2 3 4 12.2 Summary of the Fifth Assessment Report and Recent IPCC Special Reports 5 6 Central and South America shows increasing trends of climatic change and variability and extreme events 7 severely impacting the region, exacerbating problems of rampant and persistent poverty, precarious health 8 systems and water and sanitation services, malnutrition and pollution. Inadequate governance and lack of 9 participation escalates the vulnerability and risk to climate variability and change in the region (high 10 confidence) (WGII AR5 Chapter 27) (Magrin et al., 2014). 11 12 Increasing trends in precipitation had been observed in Southeast South America (SES in Figure 12.1) in 13 contrast with decreasing trends in CA and central-southern Chile (high confidence) (WGII AR5 Chapter 27) 14 (Magrin et al., 2014). Frequency and intensity of droughts have increased in many parts of SA (IPCC, 15 2019c). Warming has been detected throughout CSA except for a cooling trend reported for the ocean off the 16 Chilean coast. 17 18 Climate projections indicate increases in temperature for the entire region by 2100 for RCP4.5 and RCP8.5, 19 but rainfall changes will vary geographically, with a notable reduction of –22% in Northeast Brazil and an 20 increase of +25% in SES. Significant dependency on rainfed agriculture (>30% in Guatemala, Honduras, and 21 Nicaragua) indicates high sensitivity to climatic variability and change, and challenge food security (high 22 confidence) (SRCCL Chapter 5, Mbow et al., 2019). Undernutrition has worsened since 2014 in CSA 23 (SRCCL Chapter 5, Mbow et al., 2019). Evidence of climate change impacts on food security is emerging 24 from Indigenous knowledge and local knowledge studies in SA. Municipalities in CA with high proportion 25 of subsistence crops tend to have less resources for adaptation and more vulnerable to climate change 26 (SRCCL Chapter 5, Mbow et al., 2019). Rising temperature and decreased rainfall could reduce agricultural 27 productivity by 2030, threatening food security of the poorest populations (WGII AR5 Chapter 27, Magrin 28 et al., 2014). Though reduced suitability and yield for beans, coffee, maize, plantain, and rice is expected in 29 CA (SRCCL Chapter 5, Mbow et al., 2019), limiting the warming to 1.5ºC, compared with 2ºC, is projected 30 to result in smaller net reductions in yields of maize, rice, wheat and other cereal crops for CSA (high 31 confidence) (SR15 Chapter 3, Hoegh-Guldberg et al., 2018). The heat stress is expected to reduce the 32 suitability of Arabica coffee in Mesoamerica but it can improve in high latitude areas in SA (SRCCL 33 Chapter 4, Olsson et al., 2019). There is limited evidence that these declines in crop yields may result in 34 significant population displacement from the tropics to the subtropics (SR15 Chapter 3, Hoegh-Guldberg et 35 al., 2018). 36 37 There is a high confidence that heat waves will increase in frequency, intensity and duration, becoming, 38 under high emission scenarios, extremely long, over 60 days in duration in SA; the risk of wildfires will also 39 increase significantly in SA (SRCCL Chapter 2, Jia et al., 2019). These processes are and will lead to 40 increased desertification that cost between 8 and 14% of gross agricultural product in many CSA countries 41 (SRCCL Chapter 3, Mirzabaev et al., 2019). Distinguishing climate induced changes from land use changes 42 is challenging, but 5–6% of biomes in SA are expected to change by 2100 due to climate change (SRCCL 43 Chapter 4, Olsson et al., 2019). 44 45 Changes in weather and climatic patterns are negatively affecting human health in CSA, in part through the 46 emergence of diseases in previously non-endemic areas (WGII AR5 Chapter 27, Magrin et al., 2014). 47 Projections of potential impacts of climate change on malaria confirm that weather and climate are among 48 the drivers of geographic range, intensity of transmission, and seasonality; the changes of risk become more 49 complex with additional warming (very high confidence) (SR15 Chapter 3, Hoegh-Guldberg et al., 2018). 50 There is high confidence that constraining the warming to 1.5°C would reduce risks for unique and 51 threatened ecosystems safeguarding the services they provide for livelihoods and sustainable development 52 (food, water) in CA and Amazon (SR15 Chapter 5, Roy et al., 2018). 53 54 Observed changes in streamflow and water availability affect vulnerable regions (WGII AR5 Chapter 27, 55 Magrin et al., 2014). Glacier mass changes in the Andes over the past decades are among the most negative 56 ones worldwide (SROCC Chapter 2, Hock et al., 2019). This reduction has modified the frequency, 57
ACCEPTED VERSIO
N
SUBJECT TO FIN
AL EDITS
FINAL DRAFT Chapter 12 IPCC WGII Sixth Assessment Report
Do Not Cite, Quote or Distribute 12-12 Total pages: 181
magnitude and location of related natural hazards, while the exposure of people and infrastructure has 1 increased because in relation with growing population, tourism and economic development (high confidence) 2 (SROCC Chapter 2, Hock et al., 2019). 3 4 Negative impacts of climate change in the region are exacerbated by deforestation and land degradation 5 attributed mainly to expansion and intensification of agriculture and cattle ranching, usually under insecure-6 tenure land. This conversion of natural ecosystems is the main cause of biodiversity and ecosystem loss and 7 is an important source of greenhouse gas (GHG) emissions (high confidence) (WGII AR5 Chapter 27, 8 Magrin et al., 2014). 9 10 The combination of continued anthropogenic disturbance, particularly deforestation, with global warming 11 may result in dieback of forest in the region (medium confidence) (SR15 Chapter 3, Hoegh-Guldberg et al., 12 2018). Loses as high as 40% of biomass are projected in CA with a warming of 3°C–4°C and the Amazon 13 may experience a significant dieback at similar warming levels (SR15 Chapter 3, Hoegh-Guldberg et al., 14 2018). Advances in second-generation bioethanol from sugarcane and other feedstock will be important for 15 mitigation. However, agricultural expansion results in large conversions in tropical dry woodlands and 16 savannas in SA (Brazilian Cerrado, Caatinga and Chaco) (high confidence) (SRCCL Chapter 1, Arneth et al., 17 2019). The expansion of soybean plantations in the Amazonian state of Mato Grosso in Brazil reached 18 16.8% yr-1 from 2000 to 2005; and oil palm, a significant biofuel crop, is also linked to recent deforestation 19 in tropical CA (Costa Rica and Honduras) and SA (Colombia and Ecuador), although lower in magnitude 20 compared to deforestation from soybean and cattle ranching (WGII AR5 Chapter 27, Magrin et al., 2014). 21 22 Ocean and coastal ecosystems in the region already show important changes due to climate change and 23 global warming (SROCC Chapter 5, Bindoff et al., 2019). 24 25 Adaptation to future climate changes starts by reducing the vulnerability to present climate considering the 26 deficient welfare of people in the region. Generalizing to the region cases of synergies among development, 27 adaptation and mitigation planning requires a governance model where development needs, vulnerability 28 reduction, and adaptation strategies are intertwined (WGII AR5 Chapter 27, Magrin et al., 2014). 29 30 31 12.3 Hazards, Exposure, Vulnerabilities and Impacts 32 33 12.3.1 Central America (CA) Sub-region 34 35 12.3.1.1 Hazards 36 37 Since the mid-20th century, extreme warm temperatures have increased and extreme cold temperatures have 38 decreased in the region (medium confidence). The magnitude and frequency of extreme precipitation events 39 have increased, but droughts have mixed signals (low confidence) (WGI AR6 Table 11.13, Table 11.14, 40 Table 11.15, Seneviratne et al., 2021). There are spatially variable trends detected for the mid-summer 41 drought (MSD) timing, the amount of rainy season precipitation, the number of consecutive and total dry 42 days, and extreme wet events at the local scale since the 1980s. At the regional scale, a positive trend in the 43 duration, but not the magnitude of the MSD was found (Anderson et al., 2019). 44 45 Significant increases in tropical cyclone (TC) intensification rates in the Atlantic basin, highly unusual 46 compared to model-based estimates of internal climate variations has been observed (Bhatia et al., 2019). TC 47 contributed approximately 10% of the annual precipitation (Khouakhi et al., 2017). During the TC season 48 more TC-driven events of extreme sea level exceed a 10-year return period (Muis et al., 2019). 49 50 Massive heat wave events and increase in the frequency of warm extremes are projected at the end of the 51 21st century (high confidence). When comparing 2.0 with 1.5 degrees of warming, the longest annual warm 52 wave is projected to increase more than 60 days (Taylor et al., 2018). 53 54 General decrease in the magnitude of heavy precipitation extremes (Chou et al., 2014; Giorgi et al., 2014) (in 55 1.5ºC projection) but increase in the frequency of extreme precipitation (R50mm) (Imbach et al., 2018) are 56 projected for both 2ºC and 4ºC GWL. Strong declines in mean daily rainfall are projected for July in Belize 57
ACCEPTED VERSIO
N
SUBJECT TO FIN
AL EDITS
FINAL DRAFT Chapter 12 IPCC WGII Sixth Assessment Report
Do Not Cite, Quote or Distribute 12-13 Total pages: 181
(Stennett-Brown et al., 2017; WGI AR6 Table 11.14, Seneviratne et al., 2021) and decreased rainfall through 1 the year for all capital cities except Panama City (medium confidence: limited evidence, high agreement) 2 (Pinzón et al., 2017). 3 4 The main climate impact drivers like extreme heat, drought, relative sea level rise, coastal flooding, erosion, 5 marine heatwaves, ocean aridity, (high confidence) and aridity, drought and wildfires will increase by mid-6 century (medium confidence) (Figure 12.6, WGI AR6 Table 12.6, Ranasinghe et al., 2021). 7 8 The rainy season in CA will likely experience more pronounced MSD by the end of this century, with a 9 signal for reduced minimum precipitation by the mid-century for the JJA and SON quarters, and a broader 10 second peak is projected consistent with the future south displacement of the ITCZ (high confidence) 11 (Fuentes-Franco et al., 2015; Hidalgo et al., 2017; Maurer et al., 2017; Imbach et al., 2018; Naumann et al., 12 2018; Ribalaygua et al., 2018; Corrales-Suastegui et al., 2020). 13 14 Climate projections indicate a decrease in frequency of tropical cyclones in CA accompanied with an 15 increased frequency of intense cyclones (WGI AR6 Section 12.4.4.3, Ranasinghe et al., 2021). 16 17 12.3.1.2 Exposure 18 19 Of the 47 million Central Americans in 2015, 40% lived in rural areas with Belize being the least urbanized 20 (54% rural) and Costa Rica the most (21% rural) (CELADE, 2019); 10.5 million lived in the Dry Corridor 21 region, an area recently exposed to severe droughts that have resulted in 3.5 million people in need of 22 humanitarian assistance (FAO, 2016a). Except in Belize and Panama, the majority of the countries’ 23 population —ranging from 56% in Honduras to 95% in El Salvador— is exposed to 2 or more risks derived 24 from natural extreme events, affecting between 57% to 96% of the GDP of the countries (UNISDR and 25 CEPREDENAC, 2014). Central America is one of the regions most exposed to climatic phenomena; with 26 long coastlines and lowland areas, the region is repeatedly affected by drought, intense rains, cyclones and 27 ENSO events (high confidence) (ECLAC et al., 2015). 28 29 Large urban centres are located on mountains or away from the shore, with the notable exceptions of Panama 30 City, Belmopan and Managua, capital cities housing around 3 million people. Urban development in the 31 capital cities and suburbs has almost tripled in the last forty years reaching population densities as high as 32 11,000 inhabitants per km2 in Guatemala City and Tegucigalpa, with the spread of poor neighbourhoods in 33 steep ravines and other marginal high risk areas (Programa Estado de la Nación - Estado de la Región, 2016). 34 35 12.3.1.3 Vulnerability 36 37 Climate change is exacerbating socioeconomic vulnerability in CA, a region with high levels of 38 socioeconomic, ethnic and gender inequality, high rates of child and maternal mortality and morbidity, high 39 levels of malnutrition and inadequate access to food and drinking water (ECLAC et al., 2015). Disasters 40 from adverse natural events exacerbate CA’s economic vulnerability, accounting for substantial human and 41 economic losses (UNISDR and CEPREDENAC, 2014). Vulnerability in most sectors is considered high or 42 very high (high confidence) (Figure 12.7). 43 44 Approximately 40% of the CA population are living in poverty. Guatemala (62%), Honduras (60%), 45 Nicaragua (46%) and Belize (42%, 2009) had the highest poverty rates in CSA in 2018 (ECLAC, 2019b; 46 BCIE, 2020). Rural poverty rates are higher, 82% in Honduras and 77% in Guatemala in 2014, and so is 47 poverty among Indigenous Peoples, up to 79% in Guatemala. Rural poor are the most sensitive to climate 48 extremes as their main economic activity is based on agriculture in vulnerable terrains (NU CEPAL, 2018). 49 In 2014, all CA countries, except for El Salvador (excluding Belize), had higher GINI coefficients (more 50 inequality) than the average for Latin America (0.473), which in itself is the most unequal region in the 51 world (ECLAC, 2019b); in 2018 the situation remained similar with El Salvador showing the lowest GINI 52 coefficient (40) and the rest of the countries showing values higher than the Latin-American average (BCIE, 53 2020). 54 55 12.3.1.4 Impacts 56 57
ACCEPTED VERSIO
N
SUBJECT TO FIN
AL EDITS
FINAL DRAFT Chapter 12 IPCC WGII Sixth Assessment Report
Do Not Cite, Quote or Distribute 12-14 Total pages: 181
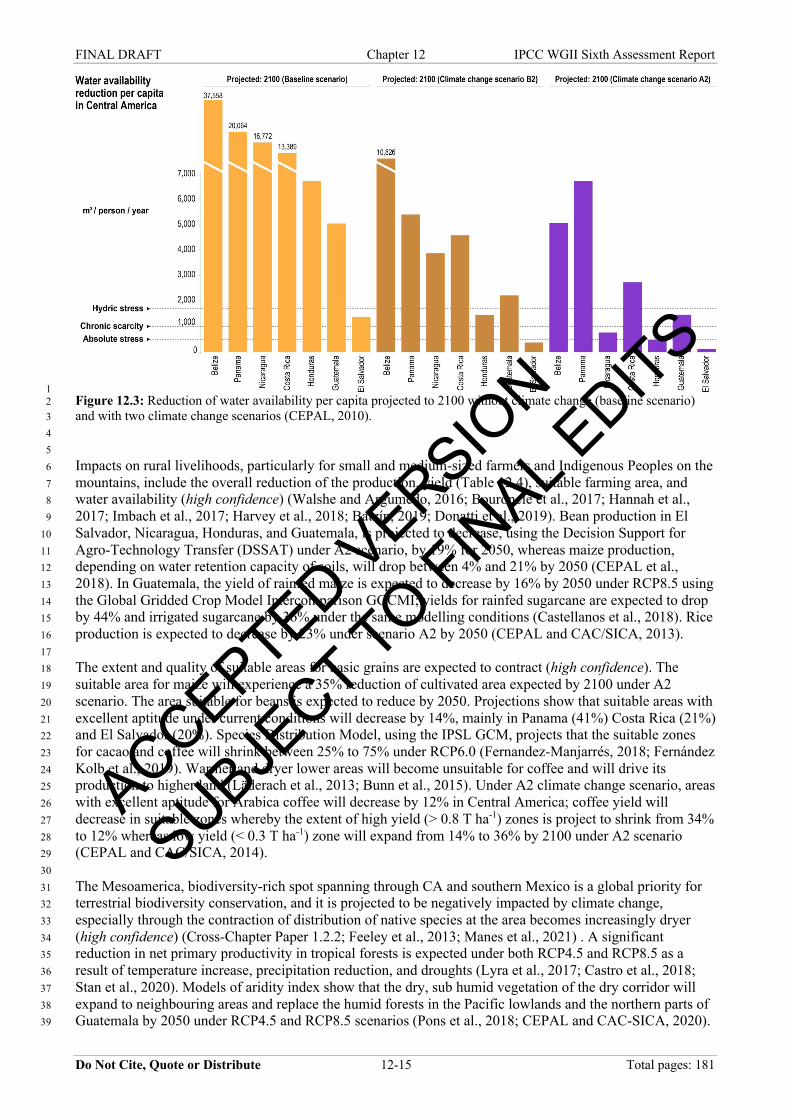
The countries in the region are consistently ranked with the highest risk in the world of being impacted by 1 extreme events (high confidence). Economic cost of climate change impacts in 2010 was estimated from 2 2.9% of GDP for Guatemala to 7.7% for Belize (ECLAC et al., 2015). For the period 1992–2011, Honduras, 3 Nicaragua and Guatemala were among the 10 most impacted countries in the world by extreme weather 4 events (UNISDR and CEPREDENAC, 2014). The number of these events has increased 3% annually in the 5 last 30 years (Bárcena et al., 2020a). 6 7 Human and economic losses, changing water availability and increasing food insecurity are the most studied 8 impacts of climate change in CA (Figure 12.9; Harvey et al., 2018; Hoegh-Guldberg et al., 2019). Hydro‐9 meteorological events, such as storm surges and tropical cyclones, are the most frequent extreme events and 10 have the highest impact (high confidence) (Reyer et al., 2017). From 2005 to 2014, the cumulative impacts 11 were over 3410 people dead, hundreds of thousands displaced, and damages estimated around USD 5.8 12 billion (Ishizawa and Miranda, 2016). One standard deviation in the intensity of a hurricane windstorm leads 13 to a decrease in both the growth of total GDP per capita (0.9% to 1.6%) and total income and labour income 14 by 3%, whereas it increases moderate and extreme poverty by 1.5% in CA (Ishizawa and Miranda, 2016). 15 16 Food insecurity is a serious impact of climate change in a region where 10% of the GDP depends on 17 agriculture, livestock and fisheries (very high confidence) (ECLAC et al., 2015; CEPAL et al., 2018; Harvey 18 et al., 2018; BCIE, 2020). Crop losses largely result from highly variable rainfall and seasonal droughts 19 which have increased significantly in the last decades (Table 12.3; CEPAL and CAC-SICA, 2020), 20 particularly the observed changes in the MSD that reduces rainfall at the onset of the rainy season (May-21 June) (Anderson et al., 2019). Small and subsistence farmers receive the highest impact as they practice 22 rainfed agriculture (Imbach et al., 2017), and poor neighbourhoods, which face socioeconomic and physical 23 barriers for adapting to climate change (Kongsager, 2017). In 2015, precipitation diminished between 50% to 24 70% of its historic average causing the loss of up to 80% of beans and 60% of maize, leaving 2.5 million 25 people food insecure, 1.6 million of which were in the Dry Corridor of CA (ECLAC et al., 2015; FAO, 26 2016a). In 2019, the region entered its fifth consecutive drought year with 1.4 million people in need of food 27 aid. Seasonal-scale droughts are projected to lengthen by 12–30%, intensify by 17–42% and increase in 28 frequency by 21–42% in RCP4.5 and RCP8.5 scenarios by the end of the century (Depsky and Pons, 2021). 29 30 Studies have shown that the incidence of some vector-borne and zoonotic diseases in CA is correlated to 31 climatic variables, particularly temperature and rainfall (high confidence) (Figure 12.4; Table 12.1). In 32 Honduras, rainfall and relative humidity were positively correlated with the occurrence of hemorrhagic 33 dengue cases (Zambrano et al., 2012). In Costa Rica, temperature and rainfall was correlated to cattle rabies 34 outbreaks and mortality during 1985–2016 (Hutter et al., 2018); Incidence of leishmaniasis showed cycles of 35 three years related to temperature changes (Chaves and Pascual, 2006); and snakebites were more likely to 36 occur at high temperatures and was significantly reduced after the rainy season for the period 2005–2013 37 (Chaves et al., 2015). In Panama, rainfall was associated with the increased number of malaria cases among 38 the Gunas, an Indigenous People with high vulnerability living in poverty conditions on small islands 39 affected by sea-level rise (Hurtado et al., 2018). These correlations point to a possible change in disease 40 incidence with climate change; evidence of that change is yet to be reported in the literature as longitudinal 41 studies are lacking in the region. 42 43 Heat stress is another health concern in this already warm and humid part of the world (high confidence) 44 (Table 12.2); it is an increasing occupational health hazard with potential impacts on kidney disease 45 (Sheffield et al., 2013; Dally et al., 2018; Johnson et al., 2019). Sea-level rise exacerbating wave-driven 46 flooding is expected to impact infrastructure and freshwater availability in small islands and atolls off the 47 coast of Belize (Storlazzi et al., 2018). Observed and expected impacts in the coastal and ocean ecosystems 48 of the sub-region are described in Figure 12.9. 49 50 Decreasing water availability is another impact of climate change (high confidence). Under a climate change 51 scenario of 3.5°C warming and a 30% reduction of rainfall, a reduction in production and export of crops and 52 livestock is projected affecting the wages and decreasing the GDP of Guatemala by 1.2%, thereby increasing 53 food insecurity (Vargas et al., 2018b). By 2100, water availability per capita is projected to decrease 82% 54 and 90% on average for the region under B2 (low emissions) and A2 (high emissions) scenarios respectively 55 (CEPAL, 2010) (Figure 12.3). 56 57
ACCEPTED VERSIO
N
SUBJECT TO FIN
AL EDITS
FINAL DRAFT Chapter 12 IPCC WGII Sixth Assessment Report
Do Not Cite, Quote or Distribute 12-15 Total pages: 181
1 Figure 12.3: Reduction of water availability per capita projected to 2100 without climate change (baseline scenario) 2 and with two climate change scenarios (CEPAL, 2010). 3 4 5 Impacts on rural livelihoods, particularly for small and medium-sized farmers and Indigenous Peoples on the 6 mountains, include the overall reduction of the production, yield (Table 12.4), suitable farming area, and 7 water availability (high confidence) (Walshe and Argumedo, 2016; Bouroncle et al., 2017; Hannah et al., 8 2017; Imbach et al., 2017; Harvey et al., 2018; Batzín, 2019; Donatti et al., 2019). Bean production in El 9 Salvador, Nicaragua, Honduras, and Guatemala, is projected to decrease, using the Decision Support for 10 Agro-Technology Transfer (DSSAT) under A2 scenario, by 19% for 2050, whereas maize production, 11 depending on water retention capacity of soils, will drop between 4% and 21% by 2050 (CEPAL et al., 12 2018). In Guatemala, the yield of rainfed maize is expected to decrease by 16% by 2050 under RCP8.5 using 13 the Global Gridded Crop Model Intercomparison GGCMI; yields for rainfed sugarcane are expected to drop 14 by 44% and irrigated sugarcane by 36% under the same modelling conditions (Castellanos et al., 2018). Rice 15 production is expected to decrease by 23% under scenario A2 by 2050 (CEPAL and CAC/SICA, 2013). 16 17 The extent and quality of suitable areas for basic grains are expected to contract (high confidence). The 18 suitable area for maize will experience a 35% reduction of cultivated area expected by 2100 under A2 19 scenario. The area suitable for beans is expected to reduce by 2050. Projections show that suitable areas with 20 excellent aptitude under current conditions will decrease by 14%, mainly in Panama (41%) Costa Rica (21%) 21 and El Salvador (20%). Species Distribution Model, using the IPSL GCM, projects that the suitable zones 22 for cacao and coffee will shrink between 25% to 75% under RCP6.0 (Fernandez-Manjarrés, 2018; Fernández 23 Kolb et al., 2019). Warmer and dryer lower areas will become unsuitable for coffee and will drive its 24 production to higher land (Läderach et al., 2013; Bunn et al., 2015). Under A2 climate change scenario, areas 25 with excellent aptitude for Arabica coffee will decrease by 12% in Central America; coffee yield will 26 decrease in suitable zones whereby the extent of high yield (> 0.8 T ha-1) zones is project to shrink from 34% 27 to 12% whereas low yield (< 0.3 T ha-1) zone will expand from 14% to 36% by 2100 under A2 scenario 28 (CEPAL and CAC/SICA, 2014). 29 30 The Mesoamerica, biodiversity-rich spot spanning through CA and southern Mexico is a global priority for 31 terrestrial biodiversity conservation, and it is projected to be negatively impacted by climate change, 32 especially through the contraction of distribution of native species at the area becomes increasingly dryer 33 (high confidence) (Cross-Chapter Paper 1.2.2; Feeley et al., 2013; Manes et al., 2021) . A significant 34 reduction in net primary productivity in tropical forests is expected under both RCP4.5 and RCP8.5 as a 35 result of temperature increase, precipitation reduction, and droughts (Lyra et al., 2017; Castro et al., 2018; 36 Stan et al., 2020). Models of aridity index show that the dry, sub humid vegetation of the dry corridor will 37 expand to neighbouring areas and replace the humid forests in the Pacific lowlands and the northern parts of 38 Guatemala by 2050 under RCP4.5 and RCP8.5 scenarios (Pons et al., 2018; CEPAL and CAC-SICA, 2020). 39
ACCEPTED VERSIO
N
SUBJECT TO FIN
AL EDITS
FINAL DRAFT Chapter 12 IPCC WGII Sixth Assessment Report
Do Not Cite, Quote or Distribute 12-16 Total pages: 181
3°C warming would shrink the tropical rainforest and replace it with savannah grassland. Wetlands are also 1 expected to be highly affected by climate change in the region (Hoegh-Guldberg et al., 2019). 2 3 12.3.2 Northwest South America (NWS) Sub-region 4 5 12.3.2.1 Hazards 6 7 Significant increases in the intensity and frequency of hot extremes and significant decreases in the intensity 8 and frequency of cold extremes (Dereczynski et al., 2020; Dunn et al., 2020) was likely2 observed (Figure 9 12.6; WGI AR6 Table 11.13, Seneviratne et al., 2021). 10 11 Insufficient data coverage and trends in available data are generally not significant for heavy precipitation 12 (low confidence) (Dereczynski et al., 2020; Dunn et al., 2020; Sun et al., 2021) (Figure 12.6; WGI AR6 13 Table 11.14) (Seneviratne et al., 2021). 14 15 ENSO is the dominant phenomenon affecting weather conditions in all CSA, and along the Pacific Coast of 16 NWS with effects of heavy rains, storms, floods, landslides, heat and cold waves and extreme sea level rise 17 (Ashok et al., 2007; Reguero et al., 2015; Wang et al., 2017b; Muis et al., 2018; Rodríguez-Morata et al., 18 2018; Rodríguez-Morata et al., 2019; Cai et al., 2020). There is a medium confidence that extreme ENSO 19 will increase long after 1.5°C warming stabilization according to CMIP5 (Cai et al., 2015; Wang et al., 20 2017b; Cai et al., 2018). It is very likely that ENSO rainfall variability, used for defining extreme El Niño 21 and La Niña, will increase significantly, regardless of amplitude changes in ENSO SST variability, by the 22 second half of the 21st century in scenarios SSP2-4.5, SSP3-7.0, and SSP5-8.5 (WGI AR6 Chapter 4; Lee et 23 al., 2021). 24
25 Warming and drier conditions are projected through the reduction of total annual precipitation, extreme 26 precipitation and consecutive wet days, and increase in consecutive dry days (Chou et al., 2014). Heat waves 27 will increase in frequency and severity in places close to the equator as Colombia (Guo et al., 2018; Feron et 28 al., 2019), with decrease but strong wetting in coastal areas, pluvial and river flood, and mean wind increase 29 (Mora et al., 2014). Models project for a 2ºC GWL very likely increase in the intensity and frequency of hot 30 extremes and decrease in the intensity and frequency of cold extremes. Nevertheless, models project 31 inconsistent changes in the region for extreme precipitation (low confidence) (Figure 12.6; WGI AR6 Table 32 12.14; Ranasinghe et al., 2021). The main climate impact drivers in the region, like extreme heat, mean 33 precipitation and coastal and oceanic will increase and snow, ice and permafrost will decrease with high 34
confidence (WGI AR6 Table 12.6, Ranasinghe et al., 2021). 35 36 12.3.2.2 Exposure 37 38 There is high confidence that coastal lowlands are exposed to sea level rise in the form of coastal flooding 39 and erosion, subsidence and saltwater intrusion (Hoyos et al., 2013). Those hazards can affect settlements, 40 ports, industries and other infrastructures. Mangrove and aquaculture areas are among the most exposed 41 systems (Gorman, 2018). The Eastern Tropical Pacific, particularly Sector Niño 3.4, will see the worst 42 increase in sea surface temperature, affecting industrial and small-scale fisheries (very high confidence) 43 (Castrejón and Defeo, 2015; Reguero et al., 2015; Eddy et al., 2019; Bertrand et al., 2020; Castrejón and 44 Charles, 2020; Escobar-Camacho et al., 2021). 45 46 Settlements and agriculture of different scales, and hydroelectric infrastructures, especially near big rivers or 47 in plains, are exposed to floods. Exposure and vulnerabilities to precipitation, overflows and related 48 landslides, are increasing (Briones-Estébanez and Ebecken, 2017). 49 50
2 In this Report, the following terms have been used to indicate the assessed likelihood of an outcome or a result: Virtually certain 99–100% probability, Very likely 90–100%, Likely 66–100%, About as likely as not 33–66%, Unlikely 0–33%, Very unlikely 0–10%, and Exceptionally unlikely 0–1%. Additional terms (Extremely likely: 95–100%, More likely than not >50–100%, and Extremely unlikely 0–5%) may also be used when appropriate. Assessed likelihood is typeset in italics, e.g., very likely). This Report also uses the term ‘likely range’ to indicate that the assessed likelihood of an outcome lies within the 17-83% probability range.
ACCEPTED VERSIO
N
SUBJECT TO FIN
AL EDITS
FINAL DRAFT Chapter 12 IPCC WGII Sixth Assessment Report
Do Not Cite, Quote or Distribute 12-17 Total pages: 181
The Andean piedmont (500–1200 m.a.s.l.) ecosystems and crops and elevation ranges above the treeline are 1 more exposed to thermal anomalies (very high confidence) (Urrutia and Vuille, 2009; Vuille et al., 2015; 2 Aguilar-Lome et al., 2019; Pabón-Caicedo et al., 2020). Temperature rise, combined with precipitation and 3 floods, leave people more exposed to epidemics (very high confidence) (Stewart-Ibarra and Lowe, 2013; 4 Sippy et al., 2019; Petrova et al., 2020). A bigger exposure is related to lower socioeconomic conditions, 5 poor health and marginalisation (Oliver-Smith, 2014). 6 7 12.3.2.3 Vulnerability 8 9 Local economies reliant on limited and specialized resources, highly dependent on ecosystem services such 10 as water and soil fertility, as the alpaca and llama herders or small-scale fishers, are amongst the more 11 vulnerable (very high confidence) (Hollowed et al., 2013; Postigo, 2013; Glynn et al., 2017; Duchicela et al., 12 2019). Also the agricultural sector in the face of extreme events (Coayla and Culqui, 2020). Their 13 vulnerabilities increase as a result of unequal chains of value, incomplete transfers of technology and other 14 socioeconomic and environmental drivers (high confidence) (Ariza-Montobbio and Cuvi, 2020; Gutierrez et 15 al., 2020). 16 17 Informal housing and settlements, usually located in the highest risk land, exacerbates vulnerability (very 18 high confidence) (Miranda Sara and Baud, 2014; Cuvi, 2015; Miranda Sara et al., 2016). The absence of 19 proper drainage systems in urban areas increases the vulnerability, especially to floods. Most of the cities and 20 infrastructure are considered highly vulnerable to climate change (high confidence) (Figure 12.7). 21 22 Regions dependent on glacier runoff are particularly vulnerable (Jiménez Cisneros et al., 2014; Mark et al., 23 2017; Polk et al., 2017). Also biodiversity and water dependent activities where seasonality and rainfall 24 patterns are changing, and where other non-climatic sources of change, such as land use, affect the capacity 25 of ecosystems to provide hydrological services (very high confidence) (Cerrón et al., 2019; Molina et al., 26 2020). The three countries are amongst the most vulnerable in terms of wellbeing and health Figure 12.7; 27 Nagy et al., 2018). 28 29 12.3.2.4 Impacts 30 31 An increase in the frequency of climate related disasters has been reported (high confidence) (Huggel et al., 32 2015a; Stäubli et al., 2018) (WGI AR6 Chapter 12) (Ranasinghe et al., 2021). Scale studies indicate an 33 increase of flood risk during the 21st century, consistent with more frequent floods, being worse in higher 34 emission scenarios (high confidence) (Arnell and Gosling, 2013; Hirabayashi et al., 2013; Alfieri et al., 2017; 35 WGI AR6 Chapter 12, Ranasinghe et al., 2021). Those living on riverbanks and slums built on steep slopes 36 are among the most affected by floods of all kinds (high confidence) (Emmer et al., 2016; Emmer, 2017). 37 There is still uncertainty in relation to future drought intensity and frequency (Pabón-Caicedo et al., 2020). 38 39 Increased sea surface temperature, coupled with stronger ENSO events, will affect marine life and fisheries 40 by loss of productive habitat, disruption of nutrient structure, productivity, and altering the migration of 41 species, leading to changes in fishing rates, impacting coastal livelihoods (high confidence) (Bayer et al., 42 2014; Cai et al., 2015; Ding et al., 2017; Mariano Gutiérrez et al., 2017; Bertrand et al., 2020). Figure 12.8 43 shows other observed sensitivities in several ecosystems and in places as the Galapagos and Malpelo islands, 44 and the coastal Economic Exclusion Zone (EEZ). 45 46 ENSO events coupled with climate change, lead to warmer ocean temperatures, heavy rains, floods and 47 heavy river discharges that have and will impact several activities, including small-scale fisheries 48 infrastructure (very high confidence). In Peru alone, wet extremes are estimated to be at least 1.5 times more 49 likely to happen compared to preindustrial times. The extremely wet ENSO event of 2017 left 6–9 billion 50 USD in monetary losses in that country, 1.7 million inhabitants affected, and crops, roads, bridges, homes, 51 schools, and health posts damaged or destroyed. Distinct types of ENSO events can have differentiated 52 impacts (French and Mechler, 2017; Christidis et al., 2019; Takahashi and Martínez, 2019; Bertrand et al., 53 2020; Coayla and Culqui, 2020). 54 55 Irrigation, potable water, health and education infrastructures, as well as roads, bridges, cities, and housing 56 buildings are frequently damaged or destroyed by extreme precipitations, having also impacts on sediment 57
ACCEPTED VERSIO
N
SUBJECT TO FIN
AL EDITS
FINAL DRAFT Chapter 12 IPCC WGII Sixth Assessment Report
Do Not Cite, Quote or Distribute 12-18 Total pages: 181
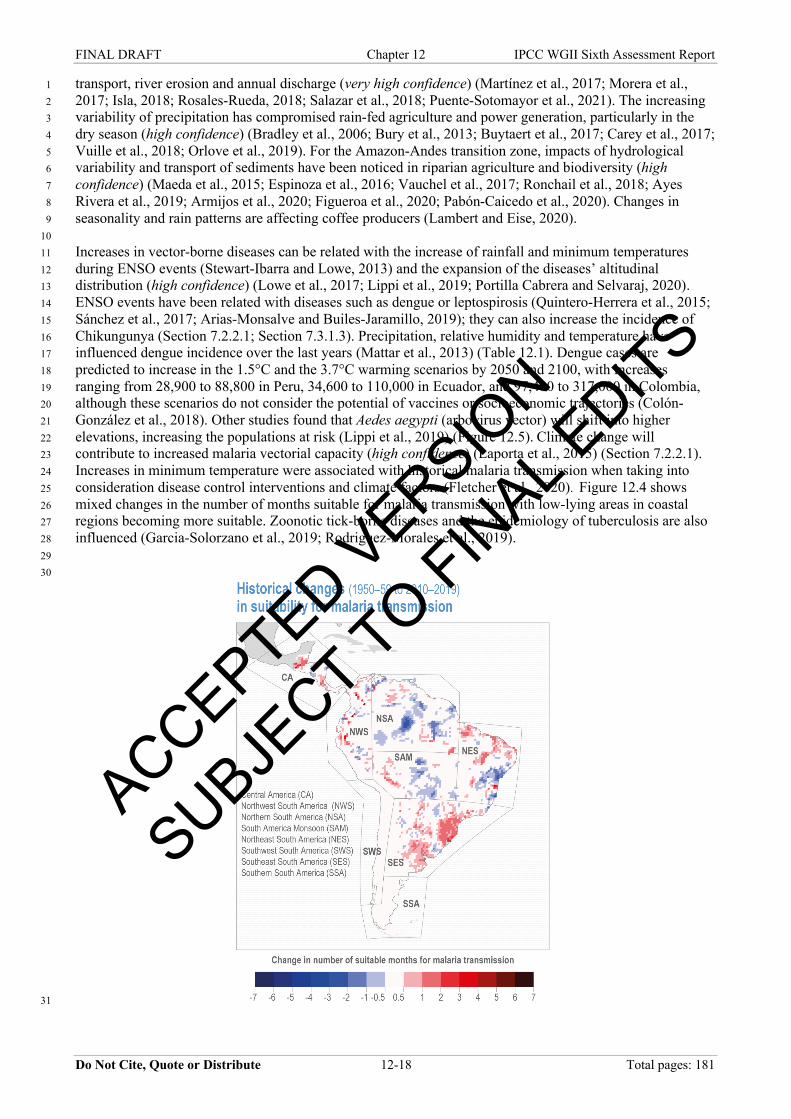
transport, river erosion and annual discharge (very high confidence) (Martínez et al., 2017; Morera et al., 1 2017; Isla, 2018; Rosales-Rueda, 2018; Salazar et al., 2018; Puente-Sotomayor et al., 2021). The increasing 2 variability of precipitation has compromised rain-fed agriculture and power generation, particularly in the 3 dry season (high confidence) (Bradley et al., 2006; Bury et al., 2013; Buytaert et al., 2017; Carey et al., 2017; 4 Vuille et al., 2018; Orlove et al., 2019). For the Amazon-Andes transition zone, impacts of hydrological 5 variability and transport of sediments have been noticed in riparian agriculture and biodiversity (high 6 confidence) (Maeda et al., 2015; Espinoza et al., 2016; Vauchel et al., 2017; Ronchail et al., 2018; Ayes 7 Rivera et al., 2019; Armijos et al., 2020; Figueroa et al., 2020; Pabón-Caicedo et al., 2020). Changes in 8 seasonality and rain patterns are affecting coffee producers (Lambert and Eise, 2020). 9 10 Increases in vector-borne diseases can be related with the increase of rainfall and minimum temperatures 11 during ENSO events (Stewart-Ibarra and Lowe, 2013) and the expansion of the diseases’ altitudinal 12 distribution (high confidence) (Lowe et al., 2017; Lippi et al., 2019; Portilla Cabrera and Selvaraj, 2020). 13 ENSO events have been related with diseases such as dengue or leptospirosis (Quintero-Herrera et al., 2015; 14 Sánchez et al., 2017; Arias-Monsalve and Builes-Jaramillo, 2019); they can also increase the incidence of 15 Chikungunya (Section 7.2.2.1; Section 7.3.1.3). Precipitation, relative humidity and temperature have 16 influenced dengue incidence over the last years (Mattar et al., 2013) (Table 12.1). Dengue cases are 17 predicted to increase in the 1.5°C and the 3.7°C warming scenarios by 2050 and 2100, with increases 18 ranging from 28,900 to 88,800 in Peru, 34,600 to 110,000 in Ecuador, and 97,400 to 317,000 in Colombia, 19 although these scenarios do not consider the potential of vaccines or socioeconomic trajectories (Colón-20 González et al., 2018). Other studies found that Aedes aegypti (arbovirus vector) will shift into higher 21 elevations, increasing the populations at risk (Lippi et al., 2019) (Figure 12.5). Climate change will 22 contribute to increased malaria vectorial capacity (high confidence) (Laporta et al., 2015) (Section 7.2.2.1). 23 Increases in minimum temperature were associated with historical malaria transmission when taking into 24 consideration disease control interventions and climate factors (Fletcher et al., 2020). Figure 12.4 shows 25 mixed changes in the number of months suitable for malaria transmission with low-lying areas in coastal 26 regions becoming more suitable. Zoonotic tick-borne diseases and the epidemiology of tuberculosis are also 27 influenced (Garcia-Solorzano et al., 2019; Rodriguez-Morales et al., 2019). 28 29 30
31
ACCEPTED VERSIO
N
SUBJECT TO FIN
AL EDITS
FINAL DRAFT Chapter 12 IPCC WGII Sixth Assessment Report
Do Not Cite, Quote or Distribute 12-19 Total pages: 181
Figure 12.4: Change in the average number of months in a given year suitable for malaria transmission by Plasmodium 1 falciparum, from 1950-1959 to 2010-2019. The threshold-based model used incorporates precipitation accumulation, 2 average temperature, and relative humidity (Grover-Kopec et al., 2006; Romanello et al., 2021). 3 4 5 Accelerated warming is reducing tropical glaciers. Glacier volume loss and permafrost thawing will continue 6 in all scenarios (high confidence) (Ranasinghe et al., 2021). On average, the tropical Andes have lost about 7 30% and more of their area since the 1980s (Basantes-Serrano et al., 2016; Mark et al., 2017; Thompson et 8 al., 2017; Rabatel et al., 2018; Vuille et al., 2018; Reinthaler et al., 2019a; Seehaus et al., 2019; Masiokas et 9 al., 2020). In a low emissions scenario, by the end of the 21st century, Peru will lose about 50% of the 10 present glacier surface, while in a high-emission scenario there will remain very small areas of only about 3–11 5% on the highest peaks (Schauwecker et al., 2017). 12 13 Changing glaciers, snow and permafrost (Figure 12.13), in synergy with land use change, have implications 14 for the occurrence, frequency and magnitude of derived floods and landslides (high confidence) (Huggel et 15 al., 2007; Iribarren Anacona et al., 2015; Emmer, 2017; Mark et al., 2017). Also to landscape transformation 16 through lakes’ formation or drying, and to alteration of hydrological dynamics, with impacts on water for 17 human consumption, agriculture, industry, hydroelectric generation, carbon sequestration and biodiversity 18 (high confidence) (Michelutti et al., 2015; Carrivick and Tweed, 2016; Kronenberg et al., 2016; Emmer, 19 2017; Mark et al., 2017; Milner et al., 2017; Polk et al., 2017; Reyer et al., 2017; Young et al., 2017; Vuille 20 et al., 2018; Cuesta et al., 2019; Drenkhan et al., 2019; Hock et al., 2019; Motschmann et al., 2020a). 21 22 Water flow has decreased in several basins as the Shullcas River in the Cordillera Huaytapallana in Peru and 23 is expected to decrease in the near future in in places such as the Cordillera Blanca in Peru (very high 24 confidence) (Baraer et al., 2012; Vuille et al., 2018; Somers et al., 2019; Molina et al., 2020). Disruptions in 25 water flows will significantly degrade or disappear high-elevation wetlands (high confidence) (Bury et al., 26 2013; Dangles et al., 2017; Mark et al., 2017; Polk et al., 2017; Cuesta et al., 2019). Impacts on wetlands are 27 affecting the wild vicuña and the domesticated alpaca (Duchicela et al., 2019). New lakes represent a source 28 of future hazards and water scarcity, as well as an opportunity as water reservoirs (Colonia et al., 2017; 29 Drenkhan et al., 2019). The timing and extent of peak water due to glacier shrinkage is spatially highly 30 variable, and has passed for a large number of tropical Andes glaciers (Hock et al., 2019). Cities dependent 31 on glacier melt have experienced high variability in domestic water supply (Chevallier et al., 2011; Soruco et 32 al., 2015; Mark et al., 2017) as shown in Case Study 2.7.3, but the increase of the demand may also be 33 determinant (Buytaert and De Bièvre, 2012). Water provision is related to socio economic issues (Drenkhan 34 et al., 2015). Glacier retreat impacts Andean pastoralists (high confidence), as shown in Case Study 2.6.5.4. 35 36 NWS houses several global priority areas for biodiversity conservation, including the Tropical Andes and 37 Tumbes-Chocó-Magdalena terrestrial biodiversity-rich spots (Cross-Chapter Paper 1.2.2; Manes et al., 2021) 38 . Biodiversity in Tropical Andes and Tumbes-Chocó-Magdalena is projected to suffer negative impacts 39 (medium confidence: medium evidence, high agreement) (Figure 12.9). Invasive plant species might benefit 40 from climate change in these hotspots (Wang et al., 2017a). Species distribution is changing upslope due to 41 increasing air temperature, leading to range contraction and local extinctions for highland species. Whereas, 42 lowland species are experiencing range contractions at the rear end and expansions in the frontend, including 43 vectors of diseases (high confidence) (Crespo-Pérez et al., 2015; Duque et al., 2015; Morueta-Holme et al., 44 2015; Moret et al., 2016; Aguirre et al., 2017; Cuesta et al., 2017a; Seimon et al., 2017; Fadrique et al., 2018; 45 Tito et al., 2018; Zimmer et al., 2018; Cauvy-Fraunié and Dangles, 2019; Cuesta et al., 2019; Moret et al., 46 2020; Rosero et al., 2021). Vegetation in summits of the northern Andes is particularly vulnerable because of 47 a high abundance of endemic species with narrow thermal niches, and lowland dispersal capacity in 48 comparison to the Central Andes (Cuesta et al., 2020). 49 50 The upper limit of alpine vegetation (paramo) shifted upslope 500 m in the Chimborazo (Morueta-Holme et 51 al., 2015). Yet, the upper forest limit (the ecotone between forest and alpine vegetation), is migrating at 52 slower rates, or not migrating at all (Harsch et al., 2009; Rehm and Feeley, 2015b), so it is expected to be a 53 major barrier to migration to several montane species, leading to population reductions and biodiversity 54 losses (Lutz et al., 2013; Rehm and Feeley, 2015a). Shifts in tree species distribution may result in decreased 55 above ground carbon stocks and productivity in tropical mountain forests (high confidence) (Feeley et al., 56 2011; Duque et al., 2015; Fadrique et al., 2018; Duque et al., 2021), a biomass loss that will only be partially 57
ACCEPTED VERSIO
N
SUBJECT TO FIN
AL EDITS
FINAL DRAFT Chapter 12 IPCC WGII Sixth Assessment Report
Do Not Cite, Quote or Distribute 12-20 Total pages: 181
offset through increased recruitment and growth of lowland species migrating upslope. Water scarcity can 1 enhance tree mortality and decrease above ground carbon stocks (Álvarez-Dávila et al., 2017; McDowell et 2 al., 2020). Agricultural frontier of crops, as potatoes or maize, is going upwards (high confidence), following 3 the freezing level height upward displacement (Morueta-Holme et al., 2015; Skarbø and VanderMolen, 4 2016; Schauwecker et al., 2017; Vuille et al., 2018). Modelling exercises agree with the observed impacts in 5 species, ecosystem processes, crop impacts and related pests and diseases (high confidence) (Cernusak et al., 6 2013; Tovar et al., 2013; Ramirez-Villegas et al., 2014; Ovalle-Rivera et al., 2015; van der Sleen et al., 2015; 7 Lowe et al., 2017). Agricultural options are changing as a result of intra seasonal temperature variation 8 (Ponce, 2020). Changes in timing and amount of precipitation are also impacting agriculture (Table 12.4; 9 Heikkinen, 2017; Altea, 2020) . 10 11 Species distribution is changing in dry lowland forests, where deforestation is the more intense driver and 12 climate change is intensely acting (Aguirre et al., 2017; Manchego et al., 2017). Extinctions in amphibians 13 have been related with temperature raises acting in synergy with diseases (Catenazzi et al., 2014). The 14 fungus Batrachochytrium dendrobatidis successfully accompanied and caused disease in high-elevation 15 Andean frogs as they expanded their ranges to reach 5200–5400 m (Seimon et al., 2017). Several groups of 16 freshwater species of the tropical Andes represent 35% of threatened freshwater species in the world 17 (Gardner and Finlayson, 2018). Potential impacts of species turnover in key areas for biodiversity 18 conservation have been identified (Cuesta et al., 2017b). 19 20 Climate change related hazards could foster rural poverty, and its impacts have led to the modification of 21 agriculture calendars and irrigation adjustments (Postigo, 2014). Livestock is reducing due to rising 22 temperatures, changing water flows and diminishing of pastures, particularly cattle and pig production 23 (Bayer et al., 2014; Tapasco et al., 2015; Bergmann et al., 2021). In some cases farmers respond to extreme 24 temperatures by increasing use of land and crop intensity (Aragón et al., 2021). Climate change has and will 25 prompt internal and international migrations (Løken, 2019; Bergmann et al., 2021). A change in fire regimes 26 and fire risk is expected in highland ecosystems, although it is difficult to determine the influence of human 27 activities and climate change influence on fire patterns (Oliveras et al., 2014; Oliveras et al., 2018; 28 Armenteras et al., 2020). 29 30 12.3.3 Northern South America (NSA) Sub-region 31 32 12.3.3.1 Hazards 33 34 A significant increase in the intensity and frequency of warm extremes and length of heat waves, and 35 decrease in the frequency of cold extremes (Skansi et al., 2013) was likely observed (Figure 12.6; Donat et 36 al., 2013; Almeida et al., 2017; WGI AR6 Table 11.13, Seneviratne et al., 2021). Precipitation showed 37 increasing trends in annual and wet season totals over the eastern part and decreasing trends of the dry 38 season (Almeida et al., 2017). Increase in the frequency of anomalous severe floods (Gloor et al., 2015) was 39 observed but insufficient data coverage for extreme precipitation and trends in available data result in low 40 confidence (Avila-Diaz et al., 2020; Dereczynski et al., 2020; Dunn et al., 2020; Sun et al., 2021) (WGI AR6 41 Table 11.14) (Seneviratne et al., 2021). Droughts presented mixed trends between subregions, but evidences 42 indicate increasing length of dry periods (low confidence) (Skansi et al., 2013; Marengo and Espinoza, 2016; 43 Spinoni et al., 2019; Avila-Diaz et al., 2020; Dereczynski et al., 2020; Dunn et al., 2020) (WGI AR6 Table 44 11.15) (Seneviratne et al., 2021) (WGI AR6 Table 12.3) (Ranasinghe et al., 2021). 45 46 An overall increase in temperature by the end of century is projected for all the seasons, from 2 to 6°C 47 depending on the scenario (Chou et al., 2014). Projections also suggest increases in the intensity and 48 frequency of hot extremes and decreases in the intensity and frequency of cold extremes (very likely for a 49 2ºC GWL) (López-Franca et al., 2016) (WGI AR6 Table 11.13) (Seneviratne et al., 2021). In all the region, 50 extreme maximum temperature estimates under the RCP4.5 scenario are projected to increase. Tropical 51 major cities are expected to be strongly affected by heat waves and daily record temperatures (Feron et al., 52 2019). 53 54 A decrease in precipitation over the tropical region but regional changes, such as increases in rainfall 55 amounts in western NSA of up to 40 mm, are expected by mid-century under RCP8.5 (Teichmann et al., 56 2013; Sánchez et al., 2015). Changes in the dry season in the central part of South America due to the late 57
ACCEPTED VERSIO
N
SUBJECT TO FIN
AL EDITS
FINAL DRAFT Chapter 12 IPCC WGII Sixth Assessment Report
Do Not Cite, Quote or Distribute 12-21 Total pages: 181
onset and late retreat of monsoon, decreases in precipitation over the Amazon and central Brazil are expected 1 (Coppola et al., 2014; Giorgi et al., 2014; Llopart et al., 2014). And with medium confidence: increase in the 2 frequency and geographic extent of meteorological drought in the eastern Amazon, and the opposite in the 3 west (Duffy et al., 2015). A decreasing of total annual precipitation, but increase in heavy precipitation 4 (Seiler et al., 2013; Chou et al., 2014) are projected for a 2ºC GWL (Figure 12.6; WGI AR6 Table 11.15; 5 Seneviratne et al., 2021). 6 7 Mean precipitation will decrease and heavy precipitation, aridity and drought will increase with medium 8 confidence, mean temperature, extreme heat, fire weather, coastal and oceanic climate impact drivers all of 9 them will increase with high confidence (Sun et al., 2019) (WGI AR6 Table 12.6; WGI AR6 Figure 12.8) 10 (Ranasinghe et al., 2021). 11 12 12.3.3.2 Exposure 13 14 In NSA the percentage of the national population living in Low Elevation Coastal Zones (LECZ) and 15 exposed to Sea Level Rise (SLR) is 68% for Suriname, 56% for Guyana and 6% Venezuela (Nagy et al., 16 2019). In these countries, exposure of populations, land areas and built capital to coastal floods is projected 17 to continue and increase (Neumann et al., 2015; Reguero et al., 2015). 18 19 In the Amazon basin, approximately 80% of the population is concentrated in cities due to migrations in 20 search of improvements in education, job opportunities, health and goods and services (Eloy et al., 2015; 21 Pinho et al., 2015). These populations settle in areas prone to flooding combined with various levels of 22 sanitation due to limited economic access to areas of lower risk (Pinho et al., 2015; Mansur et al., 2016; 23 Andrade and Szlafsztein, 2018; Parry et al., 2018). In these areas, poor urban planning and high population 24 densities increase exposure levels (Mansur et al., 2016). In this context, 41% of the total population of urban 25 centres, of the Amazon Delta and Estuaries (ADE) are exposed to flooding (Mansur et al., 2016), while in 26 Santarem, population and infrastructure are highly exposed to floods and flash floods (Andrade and 27 Szlafsztein, 2018). 28 29 Exposure of the Brazilian Amazon to severe to extreme drought has increased from 8% in 2004/2005, to 30 16% in 2009/2010 and 16% in 2015/2016 (Anderson et al., 2018b); a similar trend is reported in other 31 regions (Table 12.3). During the extreme drought of 2015/2016 in the Amazonian forests 10% or more of the 32 area showed negative anomalies of the Minimum Cumulative Water Deficit (Anderson et al., 2018b). This 33 extreme drought also caused an increase in the occurrence and spread of fires in the basin (medium 34 confidence: medium evidence, high agreement) (Aragão et al., 2018; Lima et al., 2018; Silva Junior et al., 35 2019; Bilbao et al., 2020).The exposure to anomalous fires in ecosystems such as savannas, more fire-prone, 36 increases the exposure and vulnerability of adjacent forest ecosystems not adapted to fire, such as seasonally 37 flooded forests (Bilbao et al., 2020; Flores and Holmgren, 2021). 38 39 12.3.3.3 Vulnerability 40 41 NSA is one of the most vulnerable subregions in the region, after CA, as evidenced by its very high 42 vulnerability in four of the six sectors assessed (Figure 12.7). LECZ of Venezuela, Guyana and Suriname are 43 highly vulnerable to climate change due to SLR (high confidence) (CAF, 2014; Mycoo, 2014; Reguero et al., 44 2015; Villamizar et al., 2017; Nagy et al., 2019). In Guyana, the combined effect of increased rainfall 45 intensity and SLR has caused flooding over the past two decades, increasing the vulnerability of the 46 agriculture sector (Tomby and Zhang, 2019). 47 48 The unprecedented extreme events of floods (2009, 2012 and 2014) and drought (2010) in the Amazon basin 49 led to increased societies vulnerability (medium confidence: medium evidence, high agreement) (Mansur et 50 al., 2016; Debortoli et al., 2017; Marengo et al., 2018; Menezes et al., 2018). The disruption of the region 51 natural hydrology dynamics, as a consequence of extreme events increases the sensitivity of the food and 52 transport systems of the Indigenous Peoples and rural resource-dependent communities (Pinho et al., 2015). 53 54 Migration by Indigenous Peoples and rural resource-dependent communities to cities have increased due to 55 urbanization, development of extractive activities, agroindustry and infrastructure. Upon migrating, they are 56 forced to abandon their livelihoods in order to acquire temporary jobs and to live in poverty and exclusion 57
ACCEPTED VERSIO
N
SUBJECT TO FIN
AL EDITS
FINAL DRAFT Chapter 12 IPCC WGII Sixth Assessment Report
Do Not Cite, Quote or Distribute 12-22 Total pages: 181
conditions on the periphery of the city (Cardoso et al., 2018). Between 60–90% of the population in the 1 urban centres of ADE live in conditions of moderate to high degree of vulnerability (Mansur et al., 2016) 2 (Figure 12.7). Amazon populations located in remote urban centres with limited or non-existing roads are 3 more vulnerable to extreme events in relation to more connected urban centres (Parry et al., 2018). These 4 highly vulnerable circumstances reduce the adaptive capacity of these populations (Cardoso et al., 2018). 5 Nevertheless, the dynamics of the adaptive capacity of the Indigenous Peoples and rural resource-dependent 6 communities is a complex issue. There is robust and growing literature showing that resource-dependent 7 communities located in remote areas, address climate anomalies by reducing the vulnerability of socio-8 ecological systems through Indigenous knowledge and local knowledge (high confidence) (Mistry et al., 9 2016; Vogt et al., 2016; Bilbao et al., 2019; Bilbao et al., 2020; Camico et al., 2021). 10 11 Amazonian forests constitute one of the major carbon (C) sinks on Earth (Pan et al., 2011), playing a pivotal 12 role in the climate system and regional balance of C and water (Marengo et al., 2018; Molina et al., 2019). 13 Deforestation, temperature increase and any factor affecting the forests ecosystem dynamics will have an 14 impact on the atmospheric CO2 concentration and hence on the global climate (Ruiz-Vásquez et al., 2020; 15 Sullivan et al., 2020).There is robust scientific evidence of the high vulnerability of the Amazonian forests 16 to increasing temperature and repeated extreme drought events (high confidence) (Figure 12.7; Brienen et al., 17 2015; Olivares et al., 2015; Feldpausch et al., 2016; Zhao et al., 2017; Anderson et al., 2018b; Anjos and De 18 Toledo, 2018; Yang et al., 2018; Barkhordarian et al., 2019; Sampaio et al., 2019; Rammig, 2020; Sullivan et 19 al., 2020) . 20 21 12.3.3.4 Impacts 22 23 Suriname has experienced coastal erosion and flooding, causing damage to infrastructure, agriculture and 24 ecosystems while Georgetown has suffered a significant number of floods (CAF, 2014). In Guyana, coastal 25 flooding has negatively impacted agricultural activity (Tomby and Zhang, 2018) (Figure 12.9). Sugarcane 26 production has been one of the most impacted cash-crops. The impact on sugar production has affected 27 Guyana's sugar industry (Tomby and Zhang, 2019). Among the main impacts observed in the sugar industry 28 are an increase in production costs, greater use of pesticides and fertilizers, and a reduction in workers' 29 income (Tomby and Zhang, 2018). 30 31 Indigenous Peoples and resource-dependent rural communities in the Amazon have been impacted over the 32 last decade by extreme drought and flood events in various dimensions of their livelihoods (Pinho et al., 33 2015). Food security has been strongly impacted since it is based on fishing and small-scale agriculture, two 34 sectors highly vulnerable to climate change. During extreme events, fishing decreases due to limited access 35 to fishing grounds (medium confidence: low evidence, high agreement) (Figure 12.9; Pinho et al., 2015; 36 Camacho Guerreiro et al., 2016. Overfishing, deforestation and dam construction are a threat to fishing in the 37 subregion (Lopes et al., 2019) and therefore contribute to exacerbating the impacts of climate change. Small 38 scale agriculture practices (e.g., floodplain agriculture and slash and burn), are highly coupled with natural 39 hydrological cycles and therefore severely affected by extreme events (Figure 12.9; Cochran et al., 2016. 40 Livelihoods are also impacted by disruptions in land and river transport, restrictions in drinking water access, 41 increased incidence of forest fires and disease outbreaks (medium confidence: medium evidence, high 42 agreement) (Figure 12.9; Marengo et al., 2013; Pinho et al., 2015; Marengo and Espinoza, 2016; Marengo et 43 al., 2018). In addition, flood events have caused losses of homes and disruption of public and commercial 44 services (Figure 12.9; Parry et al., 2018). 45 46 Several vector-driven diseases such as malaria and leishmaniasis are endemic of Amazon region, however 47 socio-environmental changes are altering their natural dynamics (Confalonieri et al., 2014b). An important 48 relationship between the outbreak of infectious diseases and changes in climatic events (e.g., droughts, 49 floods, heat waves, ENSO) or environmental events (e.g., deforestation, dam construction and habitat 50 fragmentation) have been found for the Brazilian Amazon (medium confidence: medium evidence, high 51 agreement) (Pan et al., 2014; Filho et al., 2016; Nava et al., 2017; Ellwanger et al., 2020). These impacts are 52 more severe in poor populations with limited access to health services (Pan et al., 2014; WHO and 53 UNFCCC, 2020). In the case of Venezuela, the impact of climate change on the epidemiology of malaria has 54 been studied, showing significant influence on transmission in the Amazonia area of the country (Figure 55 12.4; Laguna et al., 2017) . Other studies from Venezuela have documented the role of ENSO in dengue 56 outbreaks (Vincenti-Gonzalez et al., 2018). Table 12.1 shows the changes observed in reproduction potential 57
ACCEPTED VERSIO
N
SUBJECT TO FIN
AL EDITS
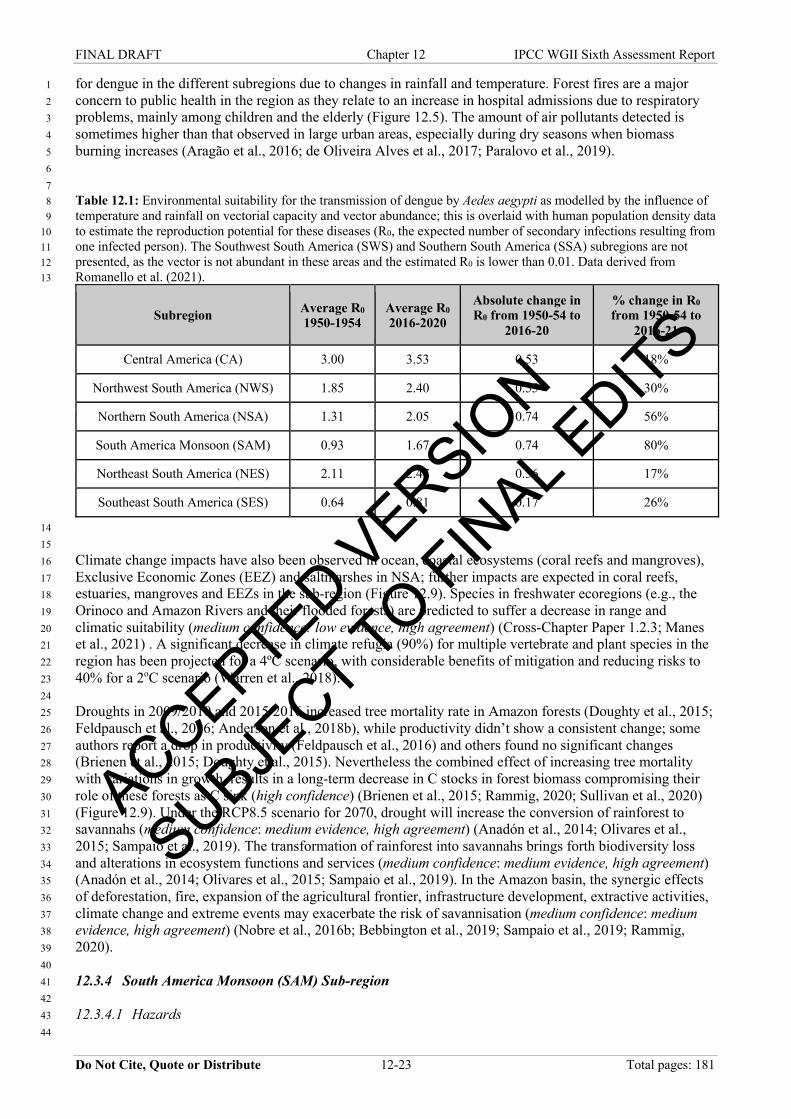
FINAL DRAFT Chapter 12 IPCC WGII Sixth Assessment Report
Do Not Cite, Quote or Distribute 12-23 Total pages: 181
for dengue in the different subregions due to changes in rainfall and temperature. Forest fires are a major 1 concern to public health in the region as they relate to an increase in hospital admissions due to respiratory 2 problems, mainly among children and the elderly (Figure 12.5). The amount of air pollutants detected is 3 sometimes higher than that observed in large urban areas, especially during dry seasons when biomass 4 burning increases (Aragão et al., 2016; de Oliveira Alves et al., 2017; Paralovo et al., 2019). 5 6 7 Table 12.1: Environmental suitability for the transmission of dengue by Aedes aegypti as modelled by the influence of 8 temperature and rainfall on vectorial capacity and vector abundance; this is overlaid with human population density data 9 to estimate the reproduction potential for these diseases (R0, the expected number of secondary infections resulting from 10 one infected person). The Southwest South America (SWS) and Southern South America (SSA) subregions are not 11 presented, as the vector is not abundant in these areas and the estimated R0 is lower than 0.01. Data derived from 12 Romanello et al. (2021). 13
Subregion Average R0 1950-1954
Average R0 2016-2020
Absolute change in R0 from 1950-54 to
2016-20
% change in R0 from 1950-54 to
2016-21
Central America (CA) 3.00 3.53 0.53 18%
Northwest South America (NWS) 1.85 2.40 0.55 30%
Northern South America (NSA) 1.31 2.05 0.74 56%
South America Monsoon (SAM) 0.93 1.67 0.74 80%
Northeast South America (NES) 2.11 2.47 0.36 17%
Southeast South America (SES) 0.64 0.81 0.17 26%
14 15 Climate change impacts have also been observed in ocean, coastal ecosystems (coral reefs and mangroves), 16 Exclusive Economic Zones (EEZ) and saltmarshes in NSA; further impacts are expected in coral reefs, 17 estuaries, mangroves and EEZs in the sub-region (Figure 12.9). Species in freshwater ecoregions (e.g., the 18 Orinoco and Amazon Rivers and their flooded forests) are predicted to suffer a decrease in range and 19 climatic suitability (medium confidence: low evidence, high agreement) (Cross-Chapter Paper 1.2.3; Manes 20 et al., 2021) . A significant decrease in climate refugia (90%) for multiple vertebrate and plant species in the 21 region has been projected for a 4ºC scenario, with considerable benefits of mitigation and reducing risks to 22 40% for a 2oC scenario (Warren et al., 2018). 23 24 Droughts in 2009/2010 and 2015/2016 increased tree mortality rate in Amazon forests (Doughty et al., 2015; 25 Feldpausch et al., 2016; Anderson et al., 2018b), while productivity didn’t show a consistent change; some 26 authors report a drop in productivity (Feldpausch et al., 2016) and others found no significant changes 27 (Brienen et al., 2015; Doughty et al., 2015). Nevertheless the combined effect of increasing tree mortality 28 with variations in growth, results in a long-term decrease in C stocks in forest biomass compromising their 29 role of these forests as C sink (high confidence) (Brienen et al., 2015; Rammig, 2020; Sullivan et al., 2020) 30 (Figure 12.9). Under the RCP8.5 scenario for 2070, drought will increase the conversion of rainforest to 31 savannahs (medium confidence: medium evidence, high agreement) (Anadón et al., 2014; Olivares et al., 32 2015; Sampaio et al., 2019). The transformation of rainforest into savannahs brings forth biodiversity loss 33 and alterations in ecosystem functions and services (medium confidence: medium evidence, high agreement) 34 (Anadón et al., 2014; Olivares et al., 2015; Sampaio et al., 2019). In the Amazon basin, the synergic effects 35 of deforestation, fire, expansion of the agricultural frontier, infrastructure development, extractive activities, 36 climate change and extreme events may exacerbate the risk of savannisation (medium confidence: medium 37 evidence, high agreement) (Nobre et al., 2016b; Bebbington et al., 2019; Sampaio et al., 2019; Rammig, 38 2020). 39 40 12.3.4 South America Monsoon (SAM) Sub-region 41 42 12.3.4.1 Hazards 43 44
ACCEPTED VERSIO
N
SUBJECT TO FIN
AL EDITS
FINAL DRAFT Chapter 12 IPCC WGII Sixth Assessment Report
Do Not Cite, Quote or Distribute 12-24 Total pages: 181
Temperature extremes have likely increased in the intensity and frequency of hot extremes and decrease in 1 the intensity and frequency of cold extremes (Donat et al., 2013; Bitencourt et al., 2016) (WGI AR6 Table 2 11.13) (Seneviratne et al., 2021). In a vast transition zone between the Amazon and the Cerrado Biomes 3 within the region, analysis of seasonal precipitation trends suggested that almost 90% of the observational 4 sites showed reduced in the length of the rainy season in the region (Debortoli et al., 2015), on a period from 5 1971 to 2014 (Marengo et al., 2018), confirming the growth in length of the dry season. Changes in the 6 hydrological and precipitation regimes, characterized by reduction in rainfall in Southern Amazonia, 7 contrasting to an increase in the northwest Amazonia, and overall increases in extreme precipitation and in 8 the frequency of Consecutive Dry Days, is being reported by several authors (Fu et al., 2013; Almeida et al., 9 2017; Marengo et al., 2018; Espinoza et al., 2019a) with low confidence (WGI AR6 Table 11.14; 10 Seneviratne et al., 2021) due to insufficient data coverage and trends in available data generally not 11 significant. 12 13 The Amazon has been identified as one of the areas of persistent and emergent regional climate change 14 hotspots in response to various representative concentration pathways (Diffenbaugh and Giorgi, 2012). In 15 Bolivia, CMIP3/5 models projected an increase in temperature (2.5ºC–5.9ºC), with seasonal and regional 16 differences. In the lowlands, both ensembles agreed on less rainfall (–19%) during drier months (June–17 August and September–November), with significant changes in inter-annual rainfall variability, but 18 disagreed on changes during wetter months (January–March) (Seiler et al., 2013). As a consequence of 19 higher temperatures and reduced rainfall, an increased water deficit would be expected in the Brazilian 20 Pantanal (Marengo et al., 2016; Bergier et al., 2018; Llopart et al., 2020) with high confidence. The largest 21 increases in warmer days and nights, and aridity, drought and significant increases in fire occurrence are 22 calculated over the Amazon area (Huang et al., 2016). Over all the region, by mid-century (RCP4.5) there is 23 medium confidence of increase of river and pluvial floods, aridity and mean wind speed, and extreme heat, 24 fire weather and drought are projected to increase with high confidence (WGI AR6 Table 12.6; Ranasinghe 25 et al., 2021). 26
27 12.3.4.2 Exposure 28 29 A large expansion in cropland area (soybean, corn and sugarcane) was observed in the past two decades in 30 SAM, in response to an increased local and global demand for biofuels and agricultural commodities (high 31 confidence) (Lapola et al., 2014; Cohn et al., 2016). Feedbacks to the climate system resulting from such 32 land-use changes are intricate. The clear-cutting of Amazon forest and Cerrado savannah in the region lead 33 to a local warming due to an increase in the energy balance and evapotranspiration (Malhado et al., 2010), 34 contrastingly the replacement of pasture by agriculture leads to local cooling effect, due to changes in the 35 surface albedo (medium confidence: medium evidence, medium agreement). Deforestation of the Amazon for 36 pastures and soybean have decreased evapotranspiration during drought months and caused a localized 37 lengthening of the dry season in Northwest SAM by 6.5 (± 2.5) days since 1979 (medium confidence: 38 medium evidence, medium agreement) (Fu et al., 2013). 39 40 It is not surprising therefore that while SAM is the region in CSA that experienced the highest temperature 41 increase in the last century, it is where most of the fire spots in the sub-continent are located, owing also to 42 the prevalent use of fires in pasture lands (medium confidence: medium evidence, high agreement) (Bowman 43 et al., 2009). Recently, da Silva Junior et al. (2020) reported 6,708,350 and 6,188,606 fire foci in Cerrado 44 and Amazonia, between 1999 and 2018, corresponding to 80% of the total observed in Brazil. The 45 occurrence of extreme droughts has affected the carbon and water cycles in large areas of the Amazon Forest 46 (high confidence) (Lapola et al., 2014; Agudelo et al., 2019), in particular in its southern and eastern 47 portions, where deforestation rates are higher. The loss of carbon in the Amazon region considering the 48 combined effect of land use change in the southern portion of the region, bordering Cerrado and Pantanal, 49 and global carbon emission scenarios, can be up to 38% at 4ºC of warming, but limited to 8% if the Paris 50 agreed limit of 1.5°C is achieved (medium confidence, medium evidence, high agreement) (Burton et al., 51 2021), driving the region to be a net carbon source to the atmosphere (Gatti et al., 2021). A recent extreme 52 drought was estimated to affect the photosynthetic capacity of 400,000 km2 of the forest (Anderson et al., 53 2018b), nevertheless there are considerable uncertainties regarding the effects of CO2 fertilization in tropical 54 forests and ecosystems (medium confidence: medium evidence, high agreement) (Sampaio et al., 2021). 55 Extreme drought events increase forest vulnerability to fire, directly affecting the biodiversity, the forest 56 structure and its plant species distribution (high agreement) (Brando et al., 2014). Production sectors are also 57
ACCEPTED VERSIO
N
SUBJECT TO FIN
AL EDITS
FINAL DRAFT Chapter 12 IPCC WGII Sixth Assessment Report
Do Not Cite, Quote or Distribute 12-25 Total pages: 181
exposed. SAM is pointed out as a region where agricultural production will be especially impacted by 1 climate change, affecting production of annual crops, fruits and livestock (medium confidence: medium 2 evidence, high agreement) (Lapola et al., 2014; Zilli et al., 2020). 3 4 12.3.4.3 Vulnerability 5 6 The largest expanses of remaining vegetation in the Cerrado biome are located in SAM, but the region shows 7 low number of protected areas (only 7.5% inside protected areas), which will leave fauna and flora with little 8 room for moving across the landscape in the face of climate change. Protected areas —Indigenous lands 9 included— have markedly detained forest clear-cutting in the Amazon deforestation arc (most of which is 10 inside SAM) (high confidence) (Nolte et al., 2013). However nearly one hundred protected areas in the 11 Amazon, Cerrado and Pantanal biomes inside SAM have been identified as highly or moderately vulnerable 12 to future climate change and demand deep adaptation interventions (medium confidence: medium evidence, 13 high agreement) (Feeley and Silman, 2016; Lapola et al., 2019b). Yet, the maintenance of these protected 14 areas or even the halting of deforestation may do little to impede a large-scale ecosystem shift, persistently, 15 to an alternative state (crossing a tipping point) of the Amazon forest or even more subtle changes caused by 16 climate change in the region (medium confidence: medium evidence, high agreement) (Aguiar et al., 2016a; 17 Boers et al., 2017; Lapola et al., 2018; Lovejoy and Nobre, 2018). 18 19 The agriculture in the region is highly dependent on the climate (high confidence), responsible for ¾ of the 20 variability in agricultural yields in the region (Table 12.4). Irrigation is an important strategy for agriculture 21 production in part of the region, nevertheless not accounting to more than 8% of the total agricultural area in 22 South America and 7% in Central America (OECD and FAO, 2019). This practice faces potential impacts 23 from reduction in surface water availability in future climate scenarios (Ribeiro Neto et al., 2016; Zilli et al., 24
2020), enhanced by non-climate drivers such as land use changes (medium confidence: medium evidence, 25 high agreement) (Spera et al., 2020). The remaining fluctuation on yields relates to issues of infrastructure, 26 market, economy, policy and social aspects. Good infrastructure, transport logistics, quality of roads and 27 storage, strongly influences the vulnerability of the agriculture sector (Figure 12.7). 28 29 The combined effect of extreme climate events and ecosystem fragmentation, e.g., by deforestation or fire, 30 lead to changes in forest structure, with the death of taller trees and reduction in diversity of plant species, 31 loss of productivity and carbon storage (high agreement) (Brando et al., 2014; Reis et al., 2018). The rise of 32 the large-scale soybean agroindustry in the early 2000’s led to a faster increase in human development 33 indicators in some regions, tightly linked to the agricultural production chain (high confidence) (Richards et 34 al., 2015). Such a development also came at a considerable cost for the environment (e.g., Neill et al. (2013)) 35 and the regional climate, even though a moratorium implemented in 2006 to refrain new soy plantations on 36 deforested areas reduced deforestation by a factor of five (high confidence) (Macedo et al., 2012; Kastens et 37 al., 2017). The same sort of supply chain interventions along with incentive-based public policies applied to 38 the beef supply chain could minimize the need for agricultural expansion in the SAM deforestation frontier 39 (medium confidence: medium evidence, high agreement) (Nepstad et al., 2014; Pompeu et al., 2021). 40 41 SAM has a low population density, and the majority of population is located in cities. The population of 42 some of these cities are indicated as highly vulnerable considering the enormous social inequalities 43 embedded in these cities (high confidence) (Filho et al., 2016). Inequalities and uneven access to 44 infrastructure, housing and health support, increase population vulnerability to atmospheric pollution and 45 drier conditions (high confidence) (Rodrigues et al., 2019; IPAM, 2020; Machado-Silva et al., 2020). 46
47
12.3.4.4 Impacts 48 49 The Amazon and the Cerrado are amongst the largest and unique phytogeographical domains in South 50 America. The Brazilian Cerrado is amongst the richest biodiversity in the world, with more than 12,600 plant 51 species, being 35% endemic (high confidence) (Forzza et al., 2012). Historic land cover change and 52 concurrent climate change in the region strongly impacted the biodiversity and led to the extinction of 657 53 plant species for the Cerrado, which is more than four-fold the global recorded plant extinctions (high 54 confidence) (Strassburg et al., 2017; Green et al., 2019). Effects of climate change, expressed by drought and 55 heat waves, lead to plant stress, compromising growth and increasing mortality (Yu et al., 2019). The fauna 56 dependent on dew water was strongly impacted due to a temperature rise of 1.6ºC from 1961 to 2019 57
ACCEPTED VERSIO
N
SUBJECT TO FIN
AL EDITS
FINAL DRAFT Chapter 12 IPCC WGII Sixth Assessment Report
Do Not Cite, Quote or Distribute 12-26 Total pages: 181
(medium confidence: medium evidence, medium agreement) (Hofmann et al., 2021). Modelling outcomes 1 project impacts in forest ecosystems in the region, with persistent warming and significant moisture 2 reduction (Anjos et al., 2021), leading to a potential change in the ecosystem structure and distribution in the 3 region (medium confidence: medium evidence, medium agreement) (Government of Brazil, 2020). 4 5 The observed impact on plant species in SAM is projected to worsen in a warmer world (Warszawski et al., 6 2013). An increasing dominance of drought-affiliated genera of tree species has been reported in the 7 southern part of the Amazon forest in the last 30 years (medium confidence: medium evidence, medium 8 agreement) (Esquivel-Muelbert et al., 2019). Due to the tight relation of drought and fire occurrence, an 9 increase of 39 to 95% of burned area is modelled to impact the Cerrado region under RCP4.5 and RCP8.5, 10 while under RCP2.6, a 22% overshoot in temperature is estimated to impact the area in 2050 decreasing to 11 11% overshoot by 2100 (Silva et al., 2019d), leading to high impact on agriculture production (high 12 confidence). 13 14 SAM hosts the headwaters of important SA rivers such as the Paraguay, Madeira, Tocantins-Araguaia and 15 Xingu. The impact from climate change is expressed differently among several sub-regions. Extreme floods 16 in Southern Amazon and Bolivian Amazon floodplains were described and related to exceptionally warm 17 subtropical South Atlantic ocean (high confidence) (Espinoza et al., 2014), causing high economic impact 18 (losses in crop and livestock production and infrastructure) and number of fatalities (very high confidence) 19 (Ovando et al., 2016). Contrastingly, decline in stream flow, particularly in the dry season, expressed by the 20 ratio between runoff and rainfall, is observed for the southern part of the Amazon basin (high evidence) 21 (Molina-Carpio et al., 2017; Espinoza et al., 2019b; Heerspink et al., 2020). Observed precipitation reduction 22 in the Cerrado region impacted main water supply reservoir for important cities in the Brazilian central 23 region, leading to a water crisis in 2016/2017 (Government of Brazil, 2020) and affecting energy 24 hydropower generation (Ribeiro Neto et al., 2016). Modelling studies project decreases in river discharge 25 rate in the order of 27% for the Tapajós basin and 53% for the Tocantins-Araguaia basin for the end of the 26 century, which may affect freshwater biodiversity, navigation and generation of hydroelectric power 27 (medium confidence: medium evidence, high agreement) (Marcovitch et al., 2010; Mohor et al., 2015). This 28 region also holds one of the largest floodplains in the globe, the Pantanal. The climatic connection of 29 Pantanal regions to the Amazon, and the influence of deforestation in local precipitation (Marengo et al., 30 2018) has implications for conservation of ecosystem services and water security in Pantanal (high 31 confidence) (Bergier et al., 2018). Impacts of extreme drought, with increasing numbers of dry days, and 32 peak of fire foci was recently reported (robust evidence) (Lázaro et al., 2020; Garcia et al., 2021). Projected 33 impacts of climate change shall lead to profound changes in the annual flood dynamics for the Pantanal 34 wetland, altering ecosystem functioning and severely affecting biodiversity (high confidence) (Thielen et al., 35 2020; Marengo et al., 2021) 36 37 Soybean and corn yields, in the Cerrado region, will suffer one of the strongest negative impacts under 38 RCP4.5 and RCP8.5 scenarios estimate and will demand high investments for adaptation should it continue 39 to be cultivated in the same localities as today (high confidence) (Oliveira et al., 2013; Camilo et al., 2018). 40 Changes in precipitation patterns were related to reduction of agriculture productivity and revenues in the 41 southern portion of the Amazon region (medium confidence: medium evidence, high agreement) (Costa et 42 al., 2019; Leite-Filho et al., 2021). As such, the future socio-economic vigour of the region will be, to a large 43 extent, connected to an unlikely stability of the regional climate and eventual fluctuations of global markets 44 potentially affecting the agricultural supply chain (high confidence) (Nepstad et al., 2014). 45 46 Observations from recent past droughts in SAM indicates how the incidence of respiratory diseases may 47 worsen under a drier and warmer climate. Northwest SAM had a ~54% increase in the incidence of 48 respiratory diseases associated with forest fires during the 2005 drought compared to a no-drought 10-year 49 mean (high confidence) (Ignotti et al., 2010; Pereira et al., 2011; Smith et al., 2014). It is estimated that more 50 than 10 million people are exposed to forest fires in the deforestation arc, a region comprising several 51 Brazilian states in the southern and western parts of the Amazon forest, with several impacts on human 52 health including potential exacerbation the COVID-19 crisis in Amazonia (medium confidence: medium 53 evidence, high agreement) (de Oliveira et al., 2020) (Table 12.5). Increases in hospital admissions, asthma, 54 DNA damage and lung cell death due to inhalation of fine particulate matter, represents an increase in public 55 health system costs (high confidence) (Ignotti et al., 2010; Silva et al., 2013; de Oliveira Alves et al., 2017; 56 Machin et al., 2019).The patchy landscape created by forest clearing contribute to a rising risk of zoonotic 57
ACCEPTED VERSIO
N
SUBJECT TO FIN
AL EDITS
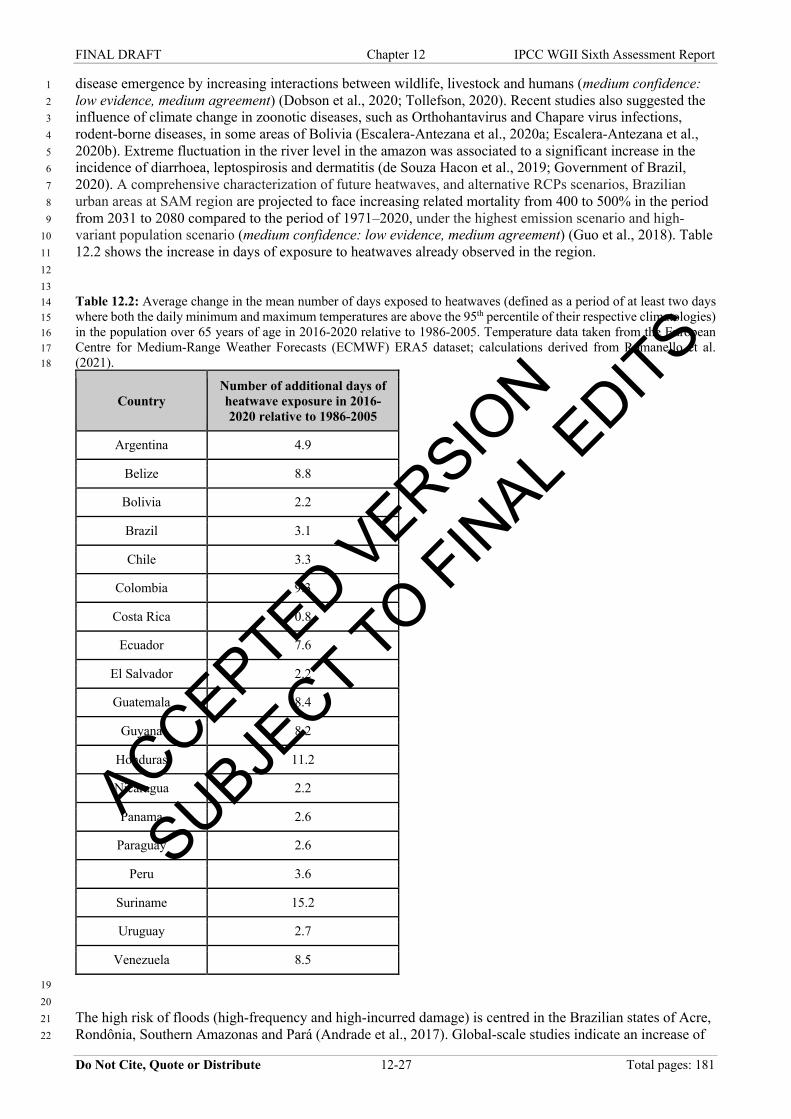
FINAL DRAFT Chapter 12 IPCC WGII Sixth Assessment Report
Do Not Cite, Quote or Distribute 12-27 Total pages: 181
disease emergence by increasing interactions between wildlife, livestock and humans (medium confidence: 1 low evidence, medium agreement) (Dobson et al., 2020; Tollefson, 2020). Recent studies also suggested the 2 influence of climate change in zoonotic diseases, such as Orthohantavirus and Chapare virus infections, 3 rodent-borne diseases, in some areas of Bolivia (Escalera-Antezana et al., 2020a; Escalera-Antezana et al., 4 2020b). Extreme fluctuation in the river level in the amazon was associated to a significant increase in the 5 incidence of diarrhoea, leptospirosis and dermatitis (de Souza Hacon et al., 2019; Government of Brazil, 6 2020). A comprehensive characterization of future heatwaves, and alternative RCPs scenarios, Brazilian 7 urban areas at SAM region are projected to face increasing related mortality from 400 to 500% in the period 8 from 2031 to 2080 compared to the period of 1971–2020, under the highest emission scenario and high-9 variant population scenario (medium confidence: low evidence, medium agreement) (Guo et al., 2018). Table 10 12.2 shows the increase in days of exposure to heatwaves already observed in the region. 11 12 13 Table 12.2: Average change in the mean number of days exposed to heatwaves (defined as a period of at least two days 14 where both the daily minimum and maximum temperatures are above the 95th percentile of their respective climatologies) 15 in the population over 65 years of age in 2016-2020 relative to 1986-2005. Temperature data taken from the European 16 Centre for Medium-Range Weather Forecasts (ECMWF) ERA5 dataset; calculations derived from Romanello et al. 17 (2021). 18
Country Number of additional days of heatwave exposure in 2016-2020 relative to 1986-2005
Argentina 4.9
Belize 8.8
Bolivia 2.2
Brazil 3.1
Chile 3.3
Colombia 9.3
Costa Rica 0.8
Ecuador 7.6
El Salvador 2.2
Guatemala 8.4
Guyana 8.2
Honduras 11.2
Nicaragua 2.2
Panama 2.6
Paraguay 2.6
Peru 3.6
Suriname 15.2
Uruguay 2.7
Venezuela 8.5
19 20 The high risk of floods (high-frequency and high-incurred damage) is centred in the Brazilian states of Acre, 21 Rondônia, Southern Amazonas and Pará (Andrade et al., 2017). Global-scale studies indicate an increase of 22
ACCEPTED VERSIO
N
SUBJECT TO FIN
AL EDITS
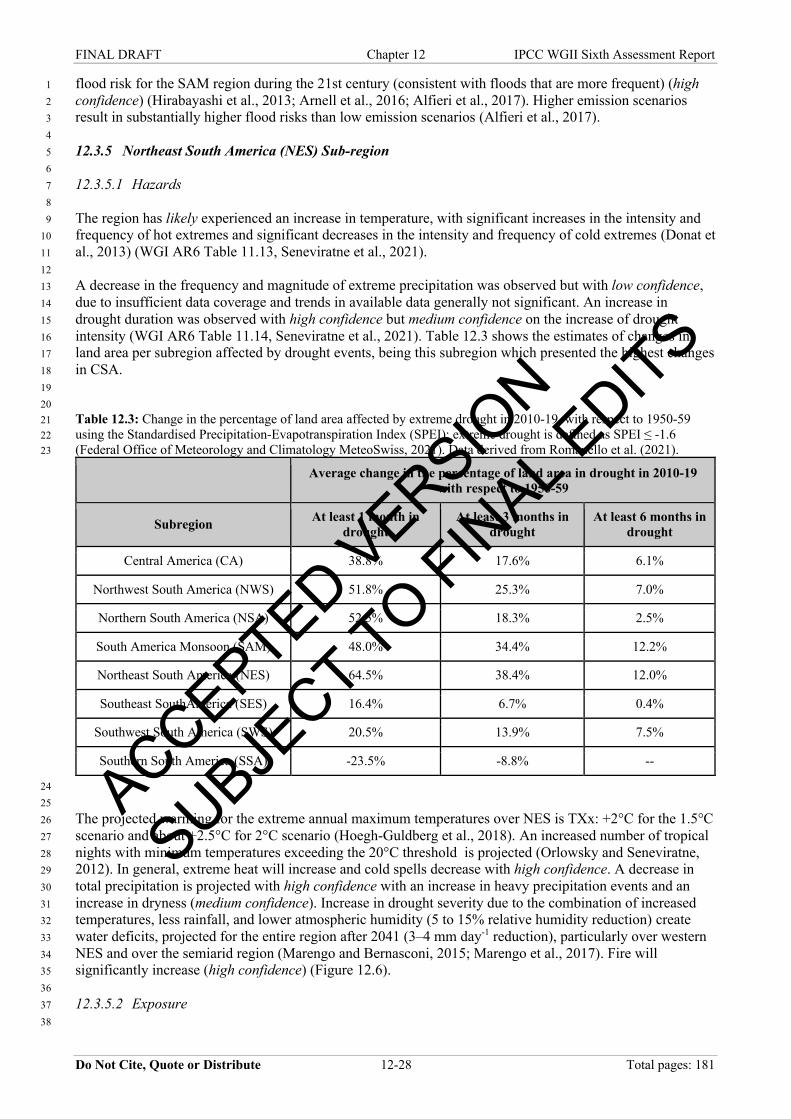
FINAL DRAFT Chapter 12 IPCC WGII Sixth Assessment Report
Do Not Cite, Quote or Distribute 12-28 Total pages: 181
flood risk for the SAM region during the 21st century (consistent with floods that are more frequent) (high 1 confidence) (Hirabayashi et al., 2013; Arnell et al., 2016; Alfieri et al., 2017). Higher emission scenarios 2 result in substantially higher flood risks than low emission scenarios (Alfieri et al., 2017). 3 4 12.3.5 Northeast South America (NES) Sub-region 5 6 12.3.5.1 Hazards 7 8 The region has likely experienced an increase in temperature, with significant increases in the intensity and 9 frequency of hot extremes and significant decreases in the intensity and frequency of cold extremes (Donat et 10 al., 2013) (WGI AR6 Table 11.13, Seneviratne et al., 2021). 11 12 A decrease in the frequency and magnitude of extreme precipitation was observed but with low confidence, 13 due to insufficient data coverage and trends in available data generally not significant. An increase in 14 drought duration was observed with high confidence but medium confidence on the increase of drought 15 intensity (WGI AR6 Table 11.14, Seneviratne et al., 2021). Table 12.3 shows the estimates of changes in 16 land area per subregion affected by drought events, being this subregion which presented the highest changes 17 in CSA. 18 19 20 Table 12.3: Change in the percentage of land area affected by extreme drought in 2010-19, with respect to 1950-59 21 using the Standardised Precipitation-Evapotranspiration Index (SPEI); extreme drought is defined as SPEI ≤ -1.6 22 (Federal Office of Meteorology and Climatology MeteoSwiss, 2021). Data derived from Romanello et al. (2021). 23
Average change in the percentage of land area in drought in 2010-19 with respect to 1950-59
Subregion At least 1 month in drought
At least 3 months in drought
At least 6 months in drought
Central America (CA) 38.8% 17.6% 6.1%
Northwest South America (NWS) 51.8% 25.3% 7.0%
Northern South America (NSA) 52.5% 18.3% 2.5%
South America Monsoon (SAM) 48.0% 34.4% 12.2%
Northeast South America (NES) 64.5% 38.4% 12.0%
Southeast SouthAmerica (SES) 16.4% 6.7% 0.4%
Southwest South America (SWS) 20.5% 13.9% 7.5%
Southern South America (SSA) -23.5% -8.8% --
24 25 The projected warming for the extreme annual maximum temperatures over NES is TXx: +2°C for the 1.5°C 26 scenario and about +2.5°C for 2°C scenario (Hoegh-Guldberg et al., 2018). An increased number of tropical 27 nights with minimum temperatures exceeding the 20°C threshold is projected (Orlowsky and Seneviratne, 28 2012). In general, extreme heat will increase and cold spells decrease with high confidence. A decrease in 29 total precipitation is projected with high confidence with an increase in heavy precipitation events and an 30 increase in dryness (medium confidence). Increase in drought severity due to the combination of increased 31 temperatures, less rainfall, and lower atmospheric humidity (5 to 15% relative humidity reduction) create 32 water deficits, projected for the entire region after 2041 (3–4 mm day-1 reduction), particularly over western 33 NES and over the semiarid region (Marengo and Bernasconi, 2015; Marengo et al., 2017). Fire will 34 significantly increase (high confidence) (Figure 12.6). 35 36 12.3.5.2 Exposure 37 38
ACCEPTED VERSIO
N
SUBJECT TO FIN
AL EDITS
FINAL DRAFT Chapter 12 IPCC WGII Sixth Assessment Report
Do Not Cite, Quote or Distribute 12-29 Total pages: 181
NES is home to about 60 million people (estimate from IBGE (2019)), with >70% living in urban areas (data 1 from IBGE (2010); Silva et al. (2017)), and high poverty levels (> 50%, data from IBGE (2003)). People are 2 exposed to intense drought and famine (high confidence), and about 94% of the region has moderate to high 3 susceptibility to desertification (Marengo and Bernasconi, 2015; Spinoni et al., 2015; Vieira et al., 2015; 4 Mariano et al., 2018; Tomasella et al., 2018; Marengo et al., 2020c). The most severe dry spell of 2012–5 2013 affected about 9 million people, which were exposed to water, food and energy scarcity (Marengo and 6 Bernasconi, 2015). 7 8 People, infrastructure and economic activities are exposed to sea level rise in the 3800 km of coastline 9 (medium confidence). The high concentration of cities on the coast is a concern (Martins et al., 2017), with 10 all state capital cities but one on the coast, totalling almost 12 million exposed people (estimate from IBGE 11 (2019)). The ports of São Luís, Recife and Salvador are important exporters of Brazilian commodities, and 12 the beaches in the subregion are an international touristic destination, producing considerable revenues 13 (Pegas et al., 2015; Ribeiro et al., 2017). 14 15 Natural systems in NES are also exposed to climate change. In terrestrial ecosystems, 913,000 km2 of NES’ 16 dry forest Caatinga vegetation (Silva et al., 2017) is exposed to predicted increase in dryness. Despite what 17 has been previously suggested, the Caatinga has high biodiversity and endemism (Silva et al., 2017), which 18 is exposed to habitat reduction due to climate change and agriculture expansion (Silva et al., 2019b). Fifty-19 two percent of the freshwater fish (203 species) are endemic (Lima et al., 2017) and are exposed to predicted 20 reduction in river flow due to climate change (Marengo et al., 2017; de Jong et al., 2018). The coastal waters 21 contain a separate marine ecoregion due to its uniqueness (Spalding et al., 2007). The region is responsible 22 for 99% of the Brazilian shrimp production, exposed to sea level rise and increases in ocean temperature and 23 acidification (Gasalla et al., 2017). Most coral reefs in the Southern Atlantic Ocean are along NES’s coast 24 (Leão et al., 2016), increasing its conservation and touristic value. The 685 km2 of coral reefs along NES’s 25 coast (likely underestimated - Moura et al. (2013); UNEP-WCMC et al. (2018)) are exposed to increased 26 sea temperatures. 27 28 12.3.5.3 Vulnerability 29 30 NES is the world’s most densely populated semi-arid land and its population is highly vulnerable to droughts 31 (high confidence), which have well-documented impacts on water and food security, human health and well-32 being in the region (e.g., Confalonieri et al. (2014a); Marengo et al. (2017); Bedran-Martins et al. (2018)) 33 (Figure 12.7). The region’s relative low economic development and poor social and health indicators 34 increase vulnerability, especially of poor farmers and traditional communities (Confalonieri et al., 2014a; 35 Bech Gaivizzo et al., 2019). In state capital cities, about 45% of the population live in poverty (data from 36 IBGE (2003)), often in slums with already deficient water supply and sewage systems and poor access to 37 health and education. Climate change will increase pressures on water availability, threatening water, energy 38 and food security (Marengo et al., 2017). 39 40 Natural systems in NES are also vulnerable (Figure 12.7). The Caatinga vegetation is particularly sensitive to 41 variations in water availability and climate change (Seddon et al., 2016; Rito et al., 2017; Dantas et al., 42 2020). It has already lost about 50% of its original vegetation cover (Souza et al., 2020), with only about 2% 43 of the remaining vegetation within fully protected areas (CNUC and MMA, 2020). Caatinga’s high 44 vulnerability to climate change is further increased by the extensive conversion of native vegetation (high 45 confidence) (Rito et al., 2017; Silva et al., 2019b; Silva et al., 2019c). 46 47 Studies with terrestrial animals show that habitat loss increases the vulnerability of species to climate change 48 (high confidence) (de Oliveira et al., 2012; Arnan et al., 2018; da Silva et al., 2018b). NES’ coral reefs have 49 shown some resilience to bleaching, but vulnerability is intensified by the synergism between chronic heat 50 stress caused by increased sea surface temperature (Teixeira et al., 2019) and other well-documented 51 stressors, such as coastal runoff, urban development, marine tourism, overexploitation of reef organisms and 52 oil extraction (high confidence) (Figure 12.8; Leão et al., 2016). 53 54 12.3.5.4 Impacts 55 56
ACCEPTED VERSIO
N
SUBJECT TO FIN
AL EDITS
FINAL DRAFT Chapter 12 IPCC WGII Sixth Assessment Report
Do Not Cite, Quote or Distribute 12-30 Total pages: 181
Impacts of intense drought have been reported in NES since 1780, with severe losses in agricultural 1 production, livestock death, increase in agricultural prices, and human death (Figure 12.9; Marengo et al., 2 2017; Martins et al., 2019; Government of Brazil, 2020; Marengo et al., 2020c; Silva et al., 2020) (). The 3 rural population already suffers from natural water scarcity in the countryside. In 2012, the drought was 4 responsible for reducing up to 99% of the corn production in Pernambuco state (Government of Brazil, 5 2020). A predicted increase in drought, coupled with inadequate soil management practices by small farmers 6 and agribusiness, increases the region’s susceptibility to desertification (Spinoni et al., 2015; Vieira et al., 7 2015; Mariano et al., 2018; Tomasella et al., 2018; Marengo et al., 2020c). In NES, 70,000 km2 have reached 8 a point at which agriculture is no longer possible (Government of Brazil, 2020). Intense droughts has 9 triggered migration to urban centres in and outside NES (Confalonieri et al., 2014a; Government of Brazil, 10 2020). More than 10 million people have been impacted by the drought of 2012/14 in the region, which was 11 responsible for water shortage and contamination, increasing death by diarrhoea (Marengo and Bernasconi, 12 2015; Government of Brazil, 2020). 13 14 There is growing evidence on the impacts of climate change on human health in NES, mostly linked to food 15 and water insecurity caused by recurrent long droughts (e.g., gastroenteritis and hepatitis) (high confidence) 16 (Figure 12.9; Sena et al., 2014; de Souza Hacon et al., 2019; Marengo et al., 2019; Government of Brazil, 17 2020; Salvador et al., 2020) . From 2071 to 2099, thermal conditions in NES might improve for vectors of 18 dengue, chikungunya and Zika (de Souza Hacon et al., 2019). Additionally, a high risk of mortality 19 associated with climatic stress in the period 2071–2099 is expected in São Francisco river basin (de Oliveira 20 et al., 2019; de Souza Hacon et al., 2019). 21 22 Recent studies predict strong negative impact of climate change on NES’ agriculture (high confidence) 23 (Ferreira Filho and Moraes, 2015; Nabout et al., 2016; Gateau-Rey et al., 2018) (Figure 12.9; Table 12.4). 24 NES concentrates the bulk of the predicted loss of regional gross domestic product associated with 25 agriculture in Brazil (Ferreira Filho and Moraes, 2015; Forcella et al., 2015). Although agriculture gives a 26 modest contribution to the regions’ economy, its drop could have a severe impact on the poorest rural 27 household, by shrinking the agricultural labour market and increasing food prices (Ferreira Filho and 28 Moraes, 2015; Government of Brazil, 2020). Expected increase in dryness is also predicted to impact the 29 region’s hydroelectric power generation (Marengo et al., 2017; de Jong et al., 2018). Sea level rise has also 30 been reported to impact coastal cities such as Salvador, destroying urban constructions (Government of 31 Brazil, 2020). Sea level rise, increased ocean temperature and acidification may also negatively impact 32 NES’s shrimp aquaculture production (Figure 12.8; Gasalla et al., 2017) . Along with climate change, 33 overfishing has driven exploited marine fish species to collapse (Verba et al., 2020). 34 35 Biodiversity in NES is highly threatened by climate change in terrestrial (medium confidence: medium 36 evidence, high agreement) and freshwater (low confidence: low evidence, high agreement) ecosystems 37 (Figure 12.9). There are few studies projecting the likely impact of climate change on NES’ biodiversity, 38 especially on its endemic freshwater fish. Recent studies have already reported the reduction in several 39 endemic plant species affecting pollination and seed dispersal (Bech Gaivizzo et al., 2019; Cavalcante and 40 Duarte, 2019; Silva et al., 2019b). Studies with terrestrial animals predict that most groups would be 41 negatively impacted by climate change (de Oliveira et al., 2012; Arnan et al., 2018; da Silva et al., 2018b; 42 Montero et al., 2018). Changes in the abundance of coral reef community and extreme reduction in coral 43 cover have been observed in NES (de Moraes et al., 2019; Duarte et al., 2020). A number of observed coral 44 bleaching events associated with abnormal increase in sea temperatures have occurred in NES (Krug et al., 45 2013; Leão et al., 2016; de Oliveira Soares et al., 2019) (Figure 12.8), but thus far mortality remained low 46 and corals have been able return to normal values or remain stable after sea water temperature rise (medium 47 confidence: medium evidence, high agreement) (Leão et al., 2016). Mangroves in the region have shown 48 increased mortality, but have also expanded their range inland (Figure 12.6; Godoy and Lacerda, 2015; 49 Cohen et al., 2018) . Future projections include mangrove landward expansion and lower migration rates by 50 2100 (Cohen et al., 2018). 51 52 12.3.6 Southeast South America (SES) Sub-region 53 54 12.3.6.1 Hazards 55 56
ACCEPTED VERSIO
N
SUBJECT TO FIN
AL EDITS
FINAL DRAFT Chapter 12 IPCC WGII Sixth Assessment Report
Do Not Cite, Quote or Distribute 12-31 Total pages: 181
The increase in the intensity and frequency of hot extremes and decrease in the intensity and frequency of 1 cold extremes was observed with high confidence (Rusticucci et al., 2017; Wu and Polvani, 2017) (WGI 2 AR6 Table 11.13) (Seneviratne et al., 2021). There is low confidence that the decrease in hot extremes over 3 SES is related with an increase of extreme precipitation (Wu and Polvani, 2017). 4 5 Over SES most of the stations have registered an increase in annual rainfall, largely attributable to changes in 6 the warm season; this is one of few sub-regions where a robust positive trend in precipitation and significant 7 intensification of heavy precipitation has been detected since the beginning of the 20th century (high 8 confidence) but with medium confidence in a reduction of hydrological droughts (Vera and Díaz, 2015; 9 Saurral et al., 2017; Lovino et al., 2018; Avila-Diaz et al., 2020; Carvalho, 2020; Dereczynski et al., 2020; 10 Dunn et al., 2020; Marengo et al., 2020a; Olmo et al., 2020) (WGI AR6 Table 11.14) (Seneviratne et al., 11 2021). A higher observed frequency of extratropical cyclones in the region has been detected (Parise et al., 12 2009; Reboita et al., 2018) with three cyclogenetic foci: South-southeast Brazil, extreme south of Brazil and 13 Uruguay, and southeast of Argentina. 14 15 In Montevideo, mean sea-levels increased over the past 20 years, reaching 11 cm from 1902 to 2016, and a 16 recent accelerating trend has been observed (Gutiérrez et al., 2016b). A value of water-level rise and its 17 acceleration for Buenos Aires was calculated from a record of annual mean water levels obtained from 18 hourly levels (1905–2003). Annual mean water level showed a trend of +1.7 ± 0.05 mm yr-1, and an 19 acceleration of +0.019 ± 0.005 mm yr-2 (D'Onofrio et al., 2008). 20 21 Increasing trends in mean air temperature and extreme heat, and decreasing cold spells are projected (high 22 confidence) (WGI AR6 Table 12.6Ranasinghe et al., 2021). The increase in the frequency of warm nights is 23 larger than that projected for warm days consistent with observed past changes that have been related with 24 changes in cloud cover that affect differently daytime temperatures as compared to night time temperatures 25 (López-Franca et al., 2016; Menéndez et al., 2016; Feron et al., 2019). 26 27
Increases in mean precipitation (high confidence), pluvial floods and river floods are projected (medium 28 confidence) (Nunes et al., 2018) (WGI AR6 Table 12.6) (Ranasinghe et al., 2021). Droughts in the La Plata 29 Basin will be more frequent in the medium-term (2011-2040) and the distant future (2071-2100) (with 30 respect to the 1979-2008 period), but also shorter and more severe, for the more extreme emission scenario 31 (RCP8.5) (low confidence) (Carril et al., 2016). 32 33 Negative trend in the annual number of cyclone events in the long-term future of 3.6 to 6.5% (2070-2098) 34 are projected, that showed an increase of 3 to 11% (2080-2100 for the A1B scenario) (Grieger et al., 2014; 35 Reboita et al., 2018). All coastal and oceanic climate impact drivers (relative sea level, coastal flood and 36 erosion, marine heatwaves and ocean aridity) are expected to increase by mid-century in the RCP8.5 37 scenario (high confidence) (WGI AR6 Table 12.6, Ranasinghe et al., 2021). 38 39 12.3.6.2 Exposure 40 41 Higher temperatures and rising sea levels, changes in rainfall patterns, increased frequency and intensity of 42 extreme weather events, could generate risks to the energy and the infrastructure sectors, and to the mining 43 and metals network. In the Plata basin, urban floods have become more frequent, causing infrastructure 44 damage and sometimes substantial mortality (high confidence) (Barros et al., 2015; Zambrano et al., 2017; 45 Nagy et al., 2019; Mettler-Grove, 2020; Morales-Yokobori, 2021; Oyedotun and Ally, 2021). A large 46 increase in landslides and flash floods is also predicted for the Brazilian portion of SES, where they are 47 responsible for the majority of the deaths related to natural disasters in the country (high confidence) 48 (Debortoli et al., 2017; Haque et al., 2019; Saito et al., 2019; Marengo et al., 2020d; da Fonseca Aguiar and 49 Cataldi, 2021). Due to uncontrolled urban growth, 21.5 million people living in the large Brazilian cities of 50 São Paulo, Rio de Janeiro and Belo Horizonte (estimate from IBGE (2019)) are expected to be exposed to 51 water scarcity, despite great water availability in the region (medium evidence, medium agreement) 52 (Marengo et al., 2017; Lima and Magaña Rueda, 2018; Marengo et al., 2020b). 53 54 The expected increase in temperature also exposes the population in large cities to extreme heat. Urban heat 55 islands are already a reality in large cities in the region, such as Buenos Aires (high confidence) (Wong et al., 56 2013; Sarricolea and Meseguer-Ruiz, 2019; Wu et al., 2019; Mettler-Grove, 2020), Rio de Janeiro (high 57
ACCEPTED VERSIO
N
SUBJECT TO FIN
AL EDITS
FINAL DRAFT Chapter 12 IPCC WGII Sixth Assessment Report
Do Not Cite, Quote or Distribute 12-32 Total pages: 181
confidence) (Ceccherini et al., 2016; Neiva et al., 2017; Geirinhas et al., 2018; Peres et al., 2018; Sarricolea 1 and Meseguer-Ruiz, 2019; Wu et al., 2019; de Farias et al., 2021) and São Paulo (high confidence) (Mishra 2 et al., 2015; Barros and Lombardo, 2016; Ceccherini et al., 2016; Vemado and Pereira Filho, 2016; de 3 Azevedo et al., 2018; Lima and Magaña Rueda, 2018; Ferreira and Duarte, 2019; Lapola et al., 2019a; 4 Sarricolea and Meseguer-Ruiz, 2019; Wu et al., 2019), with reported impact on human health in the latter 5 (medium confidence: medium evidence, medium agreement) (e.g., Araujo et al. (2015); Son et al. (2016); 6 Diniz et al. (2020)). These cities alone represent 22 million people exposed to increased heat (estimate from 7 IBGE (2019) and from INDEC (2010)). 8 9 The sub-region presents a high frequency of occurrence of intense severe convection events (Section 10 12.3.6.1). Because of this situation, strong winds from the south or southeast and high water levels affect the 11 whole Argentine coast, as well as the Rio de la Plata shores, Uruguay, and southern Brazil (Isla and Schnack, 12 2009). The coast of the Plata River is subject to flooding when there are strong winds from the southeast 13 (sudestadas). As sea level rises as a result of global climate change, storm surge floods will become more 14 frequent in this densely populated area, particularly in low-lying areas (high confidence) (Figure 12.8; 15 D'Onofrio et al., 2008; Nagy et al., 2014a; Santamaria-Aguilar et al., 2017; Nagy et al., 2019 impacts and 16 adaptation in Central and South America coastal areas; Cerón et al., 2021) . 17 18 The region’s natural systems are also exposed to climate change. SES region houses two important 19 biodiversity hotspots, with high levels of species endemism: the Cerrado and the Atlantic Forest, where 20 about 72% of Brazil’s threatened species can be found (PBMC, 2014). 21 22 12.3.6.3 Vulnerability 23 24 The Rio de la Plata basing and the city of Buenos Aires are highly vulnerable to recurring floods, and the 25 increasing number of newcomers to the area reduce the collective cultural adaptation developed by older 26 neighbours (high confidence) (Barros, 2006; Nagy et al., 2019; Mettler-Grove, 2020; Morales-Yokobori, 27 2021; Oyedotun and Ally, 2021). Extreme events, including storm surges and coastal inundation/flooding 28 caused injuries and economic/environmental losses on the urbanized coastline of Southern Brazil (States of 29 Sao Paulo and Santa Catarina) (high confidence) (Muehe, 2010; Khalid et al., 2020; Ohz et al., 2020; de 30 Souza and Ramos da Silva, 2021; Quadrado et al., 2021; Silva de Souza et al., 2021). 31 32 Cities like Rio de Janeiro and São Paulo are overpopulated, where most people live in poor conditions of 33 inadequate housing and sanitation, such as slums, with little and no trees and high temperatures. These 34 people have low access to sanitation, public health and residential cooling and are vulnerable to the effects of 35 heat islands on human comfort and health (Figure 12.7). These include cardiopulmonary and vector-borne 36 diseases, and even death (medium confidence: medium evidence, medium agreement) (Araujo et al., 2015; 37 Mishra et al., 2015; Geirinhas et al., 2018; Peres et al., 2018). Heat stress is known to worsen cardiovascular, 38 diabetic and respiratory conditions (Lapola et al., 2019a). As an effect of Heat islands, these people are also 39 vulnerable to injuries and casualties due to increased thunderstorms, causing economic losses and other 40 social problems (Vemado and Pereira Filho, 2016). 41 42 12.3.6.4 Impacts 43 44 Despite the observed increase in rainfall amount in the region, between 2014 and 2016 Brazil endured a 45 water crisis that affected the population and economy of major capital cities in the SES region Brazil 46 (Blunden and Arndt, 2014; Nobre et al., 2016a). Extremely long dry spells have become more frequent in 47 southeast of Brazil, affecting 40 million people and the economies in cities such as Rio de Janeiro, São Paulo 48 and Belo Horizonte, which are the industrial pole of the country (medium confidence: medium evidence, 49 medium agreement) (PBMC, 2014; Nobre et al., 2016a; Cunningham et al., 2017; Marengo et al., 2017; 50 Lima and Magaña Rueda, 2018; Marengo et al., 2020b). It also impacted agriculture, affecting food supply 51 and rural livelihoods, especially in Minas Gerais (Nehren et al., 2019). Agricultural prices increased by 30% 52 in some cases and harvest yields of sugar cane, coffee and fruits suffered a reduction of 15–40% in the 53 region. The number of fires increased by 150%, and energy prices increased by 20–25%, as most electricity 54 from hydroelectric power (Nobre et al., 2016a). In Argentina, projected changes in hydrology of Andean 55 rivers associated to glacier retreat are predicted to have negative impacts on the region’s fruit production 56 (low evidence, medium agreement) (Barros et al., 2015). 57
ACCEPTED VERSIO
N
SUBJECT TO FIN
AL EDITS
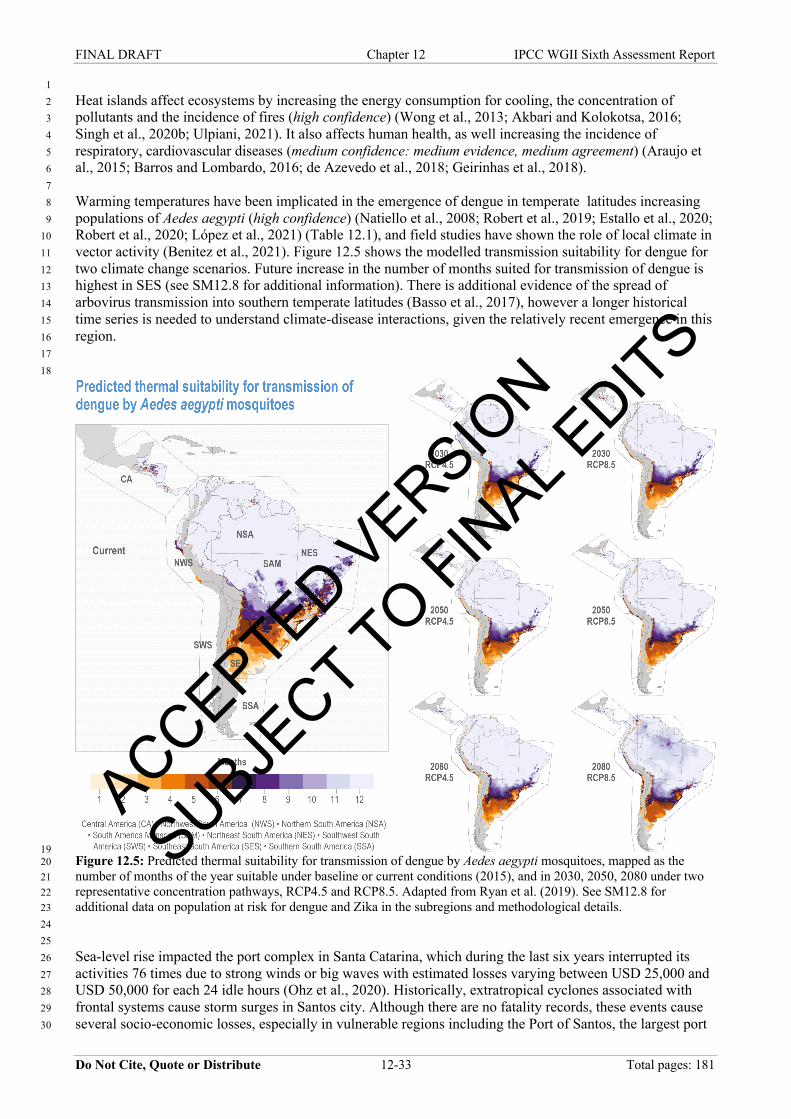
FINAL DRAFT Chapter 12 IPCC WGII Sixth Assessment Report
Do Not Cite, Quote or Distribute 12-33 Total pages: 181
1 Heat islands affect ecosystems by increasing the energy consumption for cooling, the concentration of 2 pollutants and the incidence of fires (high confidence) (Wong et al., 2013; Akbari and Kolokotsa, 2016; 3 Singh et al., 2020b; Ulpiani, 2021). It also affects human health, as well increasing the incidence of 4 respiratory, cardiovascular diseases (medium confidence: medium evidence, medium agreement) (Araujo et 5 al., 2015; Barros and Lombardo, 2016; de Azevedo et al., 2018; Geirinhas et al., 2018). 6 7 Warming temperatures have been implicated in the emergence of dengue in temperate latitudes increasing 8 populations of Aedes aegypti (high confidence) (Natiello et al., 2008; Robert et al., 2019; Estallo et al., 2020; 9 Robert et al., 2020; López et al., 2021) (Table 12.1), and field studies have shown the role of local climate in 10 vector activity (Benitez et al., 2021). Figure 12.5 shows the modelled transmission suitability for dengue for 11 two climate change scenarios. Future increase in the number of months suited for transmission of dengue is 12 highest in SES (see SM12.8 for additional information). There is additional evidence of the spread of 13 arbovirus transmission into southern temperate latitudes (Basso et al., 2017), however a longer historical 14 time series is needed to understand climate-disease interactions, given the relatively recent emergence in this 15 region. 16 17 18
19 Figure 12.5: Predicted thermal suitability for transmission of dengue by Aedes aegypti mosquitoes, mapped as the 20 number of months of the year suitable under baseline or current conditions (2015), and in 2030, 2050, 2080 under two 21 representative concentration pathways, RCP4.5 and RCP8.5. Adapted from Ryan et al. (2019). See SM12.8 for 22 additional data on population at risk for dengue and Zika in the subregions and methodological details. 23 24 25 Sea-level rise impacted the port complex in Santa Catarina, which during the last six years interrupted its 26 activities 76 times due to strong winds or big waves with estimated losses varying between USD 25,000 and 27 USD 50,000 for each 24 idle hours (Ohz et al., 2020). Historically, extratropical cyclones associated with 28 frontal systems cause storm surges in Santos city. Although there are no fatality records, these events cause 29 several socio-economic losses, especially in vulnerable regions including the Port of Santos, the largest port 30
ACCEPTED VERSIO
N
SUBJECT TO FIN
AL EDITS
FINAL DRAFT Chapter 12 IPCC WGII Sixth Assessment Report
Do Not Cite, Quote or Distribute 12-34 Total pages: 181
in Latin America (São Paulo). According to 88-year time span (1928-2016), the frequency of storm surge 1 events were three times more frequent in the last 17 years (2000-2016), than in the previous period of 71 2 years (1928-1999) (Souza et al., 2019). 3 4 There are many projected impacts of climate change on natural systems. The impacts of sea-level rise are 5 habitat destruction and the invasion of exotic species, affecting biodiversity and the provision of ecosystem 6 services (Figure 12.8; Nagy et al., 2019) (). 7 8 SES is a global priority for terrestrial biodiversity conservation, housing two important biodiversity 9 hotspots—the Atlantic Forest and Cerrado—which are among the World’s most studied biodiversity-rich 10 spots in terms of climate change impact on biodiversity, especially for terrestrial vertebrates (Cross-Chapter 11 Paper 1.2.2; Manes et al., 2021) . An increasing number of studies show that the Atlantic Forest and Cerrado 12 are at risk of biodiversity loss, largely due to projected reduction of species’ geographic distributions in 13 many different taxa (e.g., Loyola et al. (2012); Ferro et al. (2014); Loyola et al. (2014); Hoffmann et al. 14 (2015); Martins et al. (2015); Aguiar et al. (2016b); Vale et al. (2018); Borges et al. (2019); Braz et al. 15 (2019); Vale et al. (2021)). Cerrado savannas are projected to be the hotspot most negatively impacted by 16 climate change within South America, mostly though range contraction of plant species (very high 17 confidence), while the Atlantic Forest is projected to be highly impacted especially though the contraction of 18 the distribution of endemic species (very likely) (Cross-Chapter Paper 1.2.2; Figure 12.10; Manes et al., 19 2021) . Reductions in species’ distribution are also projected in the La Plata Basin for subtropical 20 amphibians (Schivo et al., 2019) and the river tiger (Salminus brasiliensis), a keystone fish of economic 21 value (Ruaro et al., 2019). Farming of mussels and oysters in the region is predicted to be negatively 22 impacted by climate change, particularly sea-level rise, and ocean warming and acidification (Gasalla et al., 23 2017). Some more localized habitats are also at risk of losing area due to climate change, such as the 24 meadows of northwest Patagonia (Crego et al., 2014) and mangroves of southern Brazil (Godoy and 25 Lacerda, 2015). Predicted changes in global climate along with agricultural expansion will strongly affect 26 South American wetlands, which comprise around 20% of the continent and bring many benefits, such as 27 biodiversity conservation and water availability (Junk, 2013). 28 29 12.3.7 Southwest South America (SWS) Sub-region 30 31 12.3.7.1 Hazards 32 33 Significant increases in the intensity and frequency of hot extremes and significant decreases in the intensity 34 and frequency of cold extremes have likely been observed for the region (Skansi et al., 2013; Ceccherini et 35 al., 2016; Meseguer-Ruiz et al., 2018; Vicente-Serrano et al., 2018; Dereczynski et al., 2020; Dunn et al., 36 2020; Olmo et al., 2020) (WGI AR6 Table 11.13) (Seneviratne et al., 2021). In particular, a significant 37 increment in the duration and frequency of heatwaves mainly in central Chile from 1961 to 2016 has been 38 observed (Piticar, 2018). 39 40 A robust drying trend for Chile (30ºS–48°S) has been recorded (medium confidence) (Saurral et al., 2017; 41 Boisier et al., 2018). However, inconsistent trends over the region in the magnitude of precipitation extremes 42 with both decreases and increases (Chou et al., 2014; Giorgi et al., 2014; Heidinger et al., 2018; Meseguer-43 Ruiz et al., 2018) (WGI AR6 Table 11.14) (Seneviratne et al., 2021) have been observed (low confidence). 44 The glacier equilibrium line altitude has presented an overall increase over central Chilean Andes (Barria et 45 al., 2019). 46 47 For central Chile, a significant increase (5% to 20% in the last 60 years) in wave heights in the sea has been 48 observed (Martínez et al., 2018). From 1982 to 2016, sea level at central Chile have increased 5 mm yr-1, 49 where El Niño events of 1982-1983 and 1997-1998 caused an extreme increase of 15 to 20 cm in the mean 50 sea level (Campos-Caba, 2016; Martínez et al., 2018). 51 52 From 1946 to 2017, the number of fires and areas burned have increased significantly in Chile (high 53 confidence) (González et al., 2011; Jolly et al., 2015; Úbeda and Sarricolea, 2016; de la Barrera et al., 2018; 54 Urrutia-Jalabert et al., 2018). Fires are attributed to changes in the temperatures regimes (González et al., 55 2011; de la Barrera et al., 2018; Gómez-González et al., 2018) and precipitation regimes (medium 56 confidence) (Gómez-González et al., 2018; Urrutia-Jalabert et al., 2018). 57
ACCEPTED VERSIO
N
SUBJECT TO FIN
AL EDITS
FINAL DRAFT Chapter 12 IPCC WGII Sixth Assessment Report
Do Not Cite, Quote or Distribute 12-35 Total pages: 181
1 The glaciers of the Southern Andes (including the SWS and SSA regions) show the highest glacier mass loss 2 rates worldwide (high confidence) contributing to sea level rise (Jacob et al., 2012; Gardner et al., 2013; 3 Dussaillant et al., 2018; Braun et al., 2019; Zemp et al., 2019). Since 1985, the glacier area loss in the sub-4 region is in a range of 20 up to 60% (Braun et al., 2019; Reinthaler et al., 2019b). 5 6 Four sets of downscaling simulations based on the Eta Regional Climate Model forced by two global climate 7 models (Chou et al., 2014) projected warmer conditions (more than 1°C) for all the sub-region by 2050 8 under the RCP4.5 scenario (medium confidence). Extremely warm December-January-February days as well 9 as the number of heatwaves per season are expected to increase by 5–10 times in the northern Chile (Feron et 10 al., 2019), likely increasing in the intensity and frequency of hot extremes over all the region (WGI AR6 11 Table 11.13) (Seneviratne et al., 2021). Drier conditions (medium confidence), by mean of the decrease of 12 total annual and extreme precipitations, are expected to increase for Southern Chile but inconsistent changes 13 in the sub-region (low confidence) (Chou et al., 2014) (WGI AR6 Table 11.14) (Seneviratne et al., 2021) 14 with high confidence on increase of fire weather and decrease of permafrost and snow extent (WGI AR6 15 Table 12.6, Ranasinghe et al., 2021). 16 17 Regional sea-level change for the region predicted by 2100 show that total mean SLR along the coast will lie 18 between 34 cm and 52 cm for the RCP4.5 scenario, and between 46 cm and 74 cm for the RCP8.5 scenario 19 with high confidence (Albrecht and Shaffer, 2016; WGI AR6 Table 12.6, Ranasinghe et al., 2021). 20 21 12.3.7.2 Exposure 22 23 There is high confidence that age and socio-economic status are key factors determining health exposure and 24 quality of life in SWS where low-income areas show an insufficient number of public spaces to provide 25 acceptable environmental quality in comparison with the high-income areas (Romero-Lankao et al., 2013; 26 Fernández and Wu, 2016; Paz et al., 2016; Hystad et al., 2019; Smith and Henríquez, 2019; Jaime et al., 27 2020; Pino-Cortés et al., 2020). 28 29 Profound social inequalities, urban expansion and the inadequate city planning (e.g., drainage network) 30 increase exposure to flooding events and landslides (high confidence) (Müller and Höfer, 2014; Rojas et al., 31 2017; Lara et al., 2018), heat hazards such as heatwaves (high confidence) (Welz et al., 2014; Qin et al., 32 2015; Inostroza et al., 2016; Welz and Krellenberg, 2016; Krellenberg and Welz, 2017), and the loss and 33 fragmentation of green infrastructure (Hernández-Moreno and Reyes-Paecke, 2018). SWS cities show the 34 highest levels of air pollution of CSA (medium confidence: medium evidence, high agreement) (Pino et al., 35 2015; Huneeus et al., 2020; González-Rojas et al., 2021), where the state air quality alerts have limited effect 36 on protective health behaviours, being the public perception about air pollution highly dissimilar among the 37 population (Boso et al., 2019). In particular, human communities living in coastal cities show a negative 38 safety perception about the performance of the infrastructure and coastal defences to flood events (low 39 confidence) (González and Holtmann-Ahumada, 2017; Igualt et al., 2019). 40 41 Although climate change is critically important for the current and future status of mining activity in SWS 42 (Odell et al., 2018), and SWS areas subjected to mining activities are highly exposed to water risk (Northey 43 et al., 2017), to date, there is low evidence of climate change impacting mining activities (Corzo and 44 Gamboa, 2018; Odell et al., 2018). 45 46 12.3.7.3 Vulnerability 47 48 Rapid changes in temperature and precipitation regimes make terrestrial ecosystems highly vulnerable to 49 climate change (high confidence) (Salas et al., 2016; Fuentes-Castillo et al., 2020) (Figure 12.7). Terrestrial 50 ecosystems dominated by exotic species (e.g., pine) with lower landscape heterogeneity, degraded soils and 51 close to settlements and roads are highly vulnerable to wildfires in comparison to forests dominated by 52 native trees (high confidence) (Altamirano et al., 2013; Castillo-Soto et al., 2013; Cóbar-Carranza et al., 53 2014; Salas et al., 2016; Bañales-Seguel et al., 2018; Gómez-González et al., 2018; Sarricolea et al., 2020). 54 Changes in the land use, artificial forestation, deforestation, agricultural abandonment and urbanization have 55 provoked a permanent degradation of old-growth forest putting at risk the biodiversity, recreation and 56 ecotourism (medium confidence: medium evidence, high agreement) (Rojas et al., 2013; Nahuelhual et al., 57
ACCEPTED VERSIO
N
SUBJECT TO FIN
AL EDITS
FINAL DRAFT Chapter 12 IPCC WGII Sixth Assessment Report
Do Not Cite, Quote or Distribute 12-36 Total pages: 181
2014). Marine coastal ecosystems such as dunes, sandy beaches and wetlands show a high deterioration 1 decreasing the ability to mitigate extreme events (medium confidence: low evidence, high agreement) 2 (González and Holtmann-Ahumada, 2017; Ministerio de Medio Ambiente de Chile, 2019). 3 4 Water sector shows a very high vulnerability (high confidence) (Figure 12.7) mainly due the weak water 5 governance focused on market aspects (e.g., inter-sectoral water transactions, setting rates, granting 6 concessions, waiving the water right) (high confidence) (Hurlbert and Diaz, 2013; Valdés-Pineda et al., 7 2014; Barría et al., 2019; Hurlbert and Gupta, 2019; Muñoz et al., 2020a; Urquiza and Billi, 2020b). Potable 8 water and adequate sanitization is available in SWS; however, water availability along Chile is unevenly 9 distributed in rural communities (high confidence) (Valdés-Pineda et al., 2014; Nelson-Nuñez et al., 2019). 10 Spatial differences on water availability are enhanced by the strong population growth, economic 11 development, mining activities, and the high dependence of agriculture to irrigation (high confidence) 12 (Stathatou et al., 2016; Northey et al., 2017; Fercovic et al., 2019). Droughts in SWS are a major threat to 13 water security (high confidence) (Aitken et al., 2016; Núñez et al., 2017) as river streamflow are highly 14 dependent on the inter-annual to decadal climate conditions, snow melting processes, rainfall events (Boisier 15 et al., 2016), and impacted by land uses and changes in irrigated agriculture (medium confidence: medium 16 evidence, high agreement) (Vicuña et al., 2013; Fuentes et al., 2021). 17 18 Energy and water needs of large-scale mining activities make this socio economic sector particularly 19 vulnerable to climate change; additionally, the relative lack of power of resource-poor communities living in 20 areas where such mining is making claims on water and energy resources renders these communities even 21 more vulnerable (Odell et al., 2018). Given new conditions generated by changes in a growing demand and 22 climate change, mining industries will need to increase resilience to extreme events; additionally, the 23 declining concentrations of mineral of interest in the raw material require greater energy input for extraction 24 and processing and new methods to avoid associated emissions are required (Hodgkinson and Smith, 2018). 25 26 Urban and agriculture sectors are vulnerable to climate change (medium confidence: medium evidence, high 27 agreement) (Figure 12.7) increasing problems and demand for water (high confidence) (Monsalves-Gavilán 28 et al., 2013; Meza et al., 2014; Fercovic et al., 2019). Important health problems (e.g., pathogenic infections, 29 changes in vector-borne diseases, mortality by heat, lower neurobehavioral performance, among others) have 30 been associated with agriculture, mining and thermal power production activities along SWS (high 31 confidence) (Muñoz-Zanzi et al., 2014; Valdés-Pineda et al., 2014; Pino et al., 2015; Cortés, 2016; 32 Berasaluce et al., 2019; Muñoz et al., 2019a; Ramírez-Santana et al., 2020). 33 34 The large-scale agricultural growth has increased the vulnerability to climate change by favouring the 35 detriment of traditional agriculture, the homogenization of the biophysical landscape and the replacement of 36 traditional crops and native forests with exotic species like pines and eucalyptus (high confidence) (Torres et 37 al., 2015) where farmers' climate change perception is highly dependent on the education level and the 38 access to meteorological information (low confidence) (Roco et al., 2015). Agricultural systems owned by 39 Indigenous Peoples (i.e., Mapuche, Quechua and Aymara farmers) seem to present lower vulnerability to 40 drought and higher response capacity than non-indigenous farmers thanks to the use of the traditional 41 knowledge of specific management techniques and the tendency to conserve species or varieties of crops 42 tolerant to water scarcity (low confidence) (Montalba et al., 2015; Saylor et al., 2017; Meldrum et al., 2018). 43 Fishery and aquaculture-related livelihoods are vulnerable to climate and non-climate drivers (medium 44 confidence: medium evidence, high agreement) such as sea surface warming and precipitation reduction 45 (Handisyde et al., 2017; Soto et al., 2019; González et al., 2021), changes in upwelling intensity (low 46 confidence) (Oyarzún and Brierley, 2019; Ramajo et al., 2020), eutrophication and harmful algal bloom 47 (HAB) events (Almanza et al., 2019), the lack of observational elements and data management (Garçon et 48 al., 2019), and events such as earthquakes and tsunamis (Marín, 2019). 49 50 Chile has experienced an accelerated economic growth which has reduced poverty, however important 51 geographical, economic and educational inequalities are still present (Repetto, 2016). Chilean healthcare 52 system has become more equitable and responsive to the population necessities (e.g., Health reform AUGE 53 program); however, the high relative inequalities in terms of income (OECD, 2018), education level, and the 54 rural–urban factor are determinants of the quality of care, the health system barriers, and the health 55 differential access (high confidence) (Frenz et al., 2014). Exposure and vulnerability to psychosocial risks in 56 SWS shows significant inequalities to natural disasters such as earthquakes according to socio-economic, 57
ACCEPTED VERSIO
N
SUBJECT TO FIN
AL EDITS
FINAL DRAFT Chapter 12 IPCC WGII Sixth Assessment Report
Do Not Cite, Quote or Distribute 12-37 Total pages: 181
geographic and gender factors (high confidence) (Labra, 2002; Vitriol et al., 2014; Quijada et al., 2018) 1 which are increased by the absence of local planning and drills and the lack of coordination (Vitriol et al., 2 2014). Indigenous Peoples have the highest levels of vulnerability in Chile in terms of income, basic needs, 3 and access to services to climate change (low confidence) (Parraguez-Vergara et al., 2016). 4 5 12.3.7.4 Impacts 6 7 Increasing temperatures in SWS have impacted temperate forests (high confidence) (Peña et al., 2014; 8 Urrutia-Jalabert et al., 2015; Camarero and Fajardo, 2017; Fontúrbel et al., 2018; Venegas-González et al., 9 2018b; Peña-Guerrero et al., 2020). Increasing temperatures and decreasing precipitations have increased the 10 impacts of wildfires on terrestrial ecosystems (high confidence) (Boisier et al., 2016; Díaz-Hormazábal and 11 González, 2016; Martinez-Harms et al., 2017; de la Barrera et al., 2018; Gómez-González et al., 2018; 12 Urrutia et al., 2018; Bowman et al., 2019), creating conditions for future landslides and floods (de la Barrera 13 et al., 2018). 14 15 Future projections show important changes in the productivity, structure and biogeochemical cycles in SWS 16 temperate and rainforests (medium confidence: medium evidence, high agreement) (Gutiérrez et al., 2014; 17 Correa-Araneda et al., 2020), and their fauna (low confidence) (Glade et al., 2016; Bourke et al., 2018). The 18 “Chilean Winter Rainfall-Valdivian Forests'' is a biodiversity-rich spot (Manes et al., 2021) (Cross-Chapter 19 Paper 1.2.2) projected to suffer habitat change, with loss of vegetation cover in the future due to climate 20 change (medium confidence: medium evidence, high agreement) (Jantz et al., 2015; Mantyka-Pringle et al., 21 2015). Species are projected to suffer changes in their distribution, including decrease in climatic refugia for 22 vertebrates (low confidence) (Cuyckens et al., 2015; Warren et al., 2018). 23 24 Increasing temperatures have enlarged the number and area extent of glacier lakes in Central Andes, 25 Northern Patagonia and Southern Patagonia (high confidence) (Wilson et al., 2018), while decreased rainfall 26 and rapid glacier melting have provoked changes in the environmental, biogeochemical and biological 27 properties of the central-southern and Andes Chilean lakes (low confidence) (Pizarro et al., 2016). 28 29 Increasing glacier lake outburst floods (GLOF), ice and rock avalanches, debris flows, and lahars from ice-30 capped volcanoes have been observed in SWS (Iribarren Anacona et al., 2015; Jacquet et al., 2017; 31 Reinthaler et al., 2019b). There is low evidence about the effects of warming and degrading permafrost on 32 slope instability and landslides in these regions (Iribarren Anacona et al., 2015). 33 34 Increasing temperatures, decreasing precipitation regimes, and an unprecedented long-term drought have 35 decreased the annual average rivers streamflow that supply SWS megacities such as Santiago (high 36 confidence) (Meza et al., 2014; Muñoz et al., 2020a), with important and negative effects over the water 37 quality (Bocchiola et al., 2018; Yevenes et al., 2018) threatening irrigated agriculture activities (medium 38 confidence: medium evidence, high agreement) (Yevenes et al., 2018; Oertel et al., 2020; Peña-Guerrero et 39 al., 2020). Large reductions in the groundwater availability of the SWS region (Meza et al., 2014) and a 40 sustained decreasing of the mean annual flows (Ragettli et al., 2016; Bocchiola et al., 2018), especially 41 during the snowmelt season (Vargas et al., 2013) have been observed in SWS. Drought has affected wetlands 42 (low confidence) (Zhao et al., 2016; Domic et al., 2018), and desert ecosystems (medium confidence: medium 43 evidence, high agreement) (Acosta-Jamett et al., 2016; Neilson et al., 2017; Díaz et al., 2019). 44 45 There is low evidence about shoreline retreat attributed to climate change (Martínez et al., 2018; Ministerio 46 de Medio Ambiente de Chile, 2019) although increasing wind intensity along the central Chilean coast has 47 caused important damages in the coastal infrastructure and buildings (Winckler et al., 2017) and changes of 48 seawater properties and processes (low confidence) (Schneider et al., 2017; Aguirre et al., 2018). Ocean and 49 coastal ecosystems in SWS are sensitive to upwelling intensity which affect the abundance, diversity, 50 physiology and survivorship of coastal species (high confidence) (Anabalón et al., 2016; Jacob et al., 2018; 51 Ramajo et al., 2020) (Figure 12.8). Increasing radiation and temperatures, and reduced precipitations in 52 conjunction with increased nutrient load have increased HAB events producing massive fauna mortalities 53 (high confidence) (León-Muñoz et al., 2018; IPCC, 2019b, SPM A8.2 and B8.3; Quiñones et al., 2019; Soto 54 et al., 2019; Armijo et al., 2020). Multiple resources subjected to fisheries and aquaculture are highly 55 vulnerable to storms, alluvial disasters, ocean warming, ocean acidification, increasing ENSO extreme 56 events, and lower oxygen availability (high confidence) (Figure 12.8; García-Reyes et al., 2015; Silva et al., 57
ACCEPTED VERSIO
N
SUBJECT TO FIN
AL EDITS
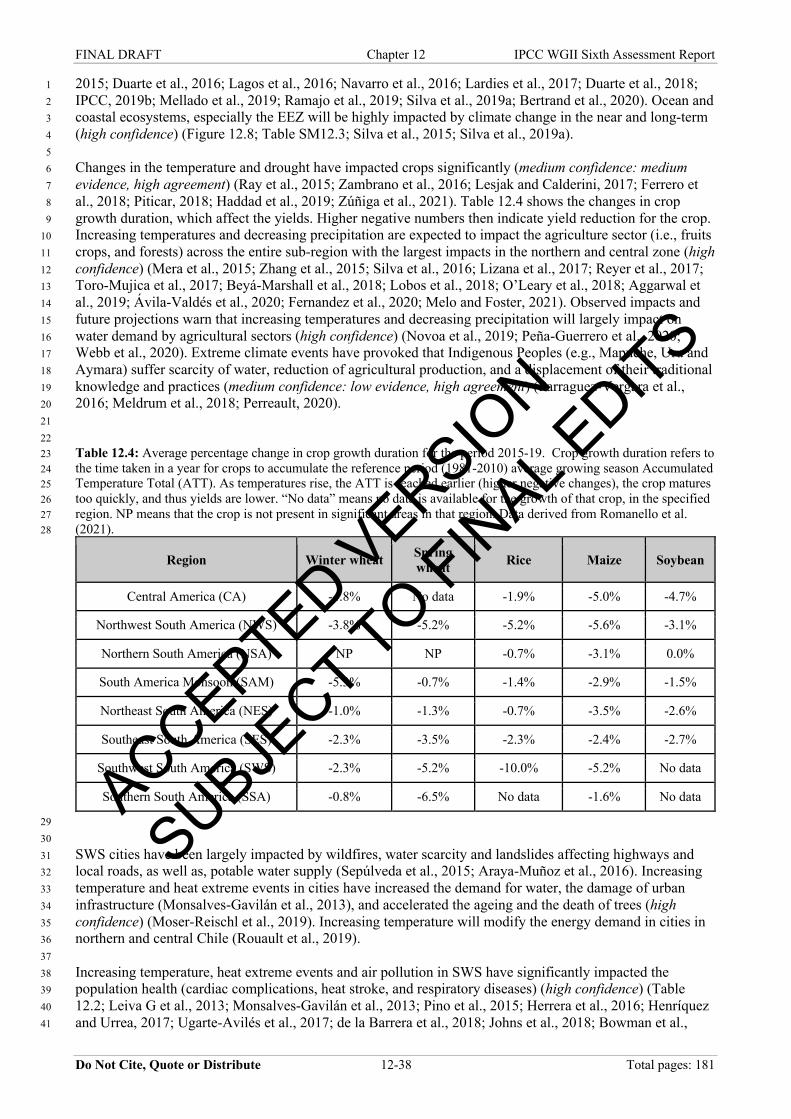
FINAL DRAFT Chapter 12 IPCC WGII Sixth Assessment Report
Do Not Cite, Quote or Distribute 12-38 Total pages: 181
2015; Duarte et al., 2016; Lagos et al., 2016; Navarro et al., 2016; Lardies et al., 2017; Duarte et al., 2018; 1 IPCC, 2019b; Mellado et al., 2019; Ramajo et al., 2019; Silva et al., 2019a; Bertrand et al., 2020). Ocean and 2 coastal ecosystems, especially the EEZ will be highly impacted by climate change in the near and long-term 3 (high confidence) (Figure 12.8; Table SM12.3; Silva et al., 2015; Silva et al., 2019a). 4 5 Changes in the temperature and drought have impacted crops significantly (medium confidence: medium 6 evidence, high agreement) (Ray et al., 2015; Zambrano et al., 2016; Lesjak and Calderini, 2017; Ferrero et 7 al., 2018; Piticar, 2018; Haddad et al., 2019; Zúñiga et al., 2021). Table 12.4 shows the changes in crop 8 growth duration, which affect the yields. Higher negative numbers then indicate yield reduction for the crop. 9 Increasing temperatures and decreasing precipitation are expected to impact the agriculture sector (i.e., fruits 10 crops, and forests) across the entire sub-region with the largest impacts in the northern and central zone (high 11 confidence) (Mera et al., 2015; Zhang et al., 2015; Silva et al., 2016; Lizana et al., 2017; Reyer et al., 2017; 12 Toro-Mujica et al., 2017; Beyá-Marshall et al., 2018; Lobos et al., 2018; O’Leary et al., 2018; Aggarwal et 13 al., 2019; Ávila-Valdés et al., 2020; Fernandez et al., 2020; Melo and Foster, 2021). Observed impacts and 14 future projections warn that increasing temperatures and decreasing precipitation will largely impact on 15 water demand by agricultural sectors (high confidence) (Novoa et al., 2019; Peña-Guerrero et al., 2020; 16 Webb et al., 2020). Extreme climate events have provoked that Indigenous Peoples (e.g., Mapuche, Uru and 17 Aymara) suffer scarcity of water, reduction of agricultural production, and a displacement of their traditional 18 knowledge and practices (medium confidence: low evidence, high agreement) (Parraguez-Vergara et al., 19 2016; Meldrum et al., 2018; Perreault, 2020). 20 21 22 Table 12.4: Average percentage change in crop growth duration for the period 2015-19. Crop growth duration refers to 23 the time taken in a year for crops to accumulate the reference period (1981-2010) average growing season Accumulated 24 Temperature Total (ATT). As temperatures rise, the ATT is reached earlier (higher negative changes), the crop matures 25 too quickly, and thus yields are lower. “No data” means no data is available for the growth of that crop, in the specified 26 region. NP means that the crop is not present in significant areas in that region. Data derived from Romanello et al. 27 (2021). 28
Region Winter wheat Spring wheat Rice Maize Soybean
Central America (CA) -4.8% No data -1.9% -5.0% -4.7%
Northwest South America (NWS) -3.8% -5.2% -5.2% -5.6% -3.1%
Northern South America (NSA) NP NP -0.7% -3.1% 0.0%
South America Monsoon (SAM) -5.3% -0.7% -1.4% -2.9% -1.5%
Northeast South America (NES) -1.0% -1.3% -0.7% -3.5% -2.6%
Southeast South America (SES) -2.3% -3.5% -2.3% -2.4% -2.7%
Southwest South America (SWS) -2.3% -5.2% -10.0% -5.2% No data
Southern South America (SSA) -0.8% -6.5% No data -1.6% No data
29 30 SWS cities have been largely impacted by wildfires, water scarcity and landslides affecting highways and 31 local roads, as well as, potable water supply (Sepúlveda et al., 2015; Araya-Muñoz et al., 2016). Increasing 32 temperature and heat extreme events in cities have increased the demand for water, the damage of urban 33 infrastructure (Monsalves-Gavilán et al., 2013), and accelerated the ageing and the death of trees (high 34 confidence) (Moser-Reischl et al., 2019). Increasing temperature will modify the energy demand in cities in 35 northern and central Chile (Rouault et al., 2019). 36 37 Increasing temperature, heat extreme events and air pollution in SWS have significantly impacted the 38 population health (cardiac complications, heat stroke, and respiratory diseases) (high confidence) (Table 39 12.2; Leiva G et al., 2013; Monsalves-Gavilán et al., 2013; Pino et al., 2015; Herrera et al., 2016; Henríquez 40 and Urrea, 2017; Ugarte-Avilés et al., 2017; de la Barrera et al., 2018; Johns et al., 2018; Bowman et al., 41
ACCEPTED VERSIO
N
SUBJECT TO FIN
AL EDITS
FINAL DRAFT Chapter 12 IPCC WGII Sixth Assessment Report
Do Not Cite, Quote or Distribute 12-39 Total pages: 181
2019; González et al., 2019; Matus C and Oyarzún G, 2019; Sánchez et al., 2019; Terrazas et al., 2019; 1 Cakmak et al., 2021; Zenteno et al., 2021).There is low confidence about area changes of Chagas disease 2 (Tapia-Garay et al., 2018; Garrido et al., 2019), and transmission rates in the future (Ayala et al., 2019). 3 4 12.3.8 Southern South America (SSA) Sub-region 5 6 12.3.8.1 Hazards 7 8 There were inconsistent trends and insufficient data coverage about extreme temperatures and precipitation 9 (low confidence) but with medium confidence an increase in the frequency of meteorological droughts was 10 observed (Dereczynski et al., 2020; Dunn et al., 2020; WGI AR6 Tables 11.13, 11.14, 11.15, Seneviratne et 11 al., 2021; WGI AR6 Table 12.3, Ranasinghe et al., 2021). An increase in precipitation in Trelew, no change 12 for Comodoro Rivadavia, both stations located at Eastern Patagonia, and negative trends in austral summer 13 rainfall in southern Andes were observed (Vera and Díaz, 2015; Saurral et al., 2017). Chile’s wildfires in 14 Patagonia (fire frequency and intensity) have grown at an alarming rate (Úbeda and Sarricolea, 2016). 15 Decreasing rainfall pattern in Punta Arenas is closely associated with the variability at inter-annual to inter-16 decadal time scales of the main forcing system for climate in Patagonia. Snow Cover Extension (SCE) and 17 Snow Cover Duration decreased by an average of ~13 ± 2% and 43 ± 20 days respectively from 2000 to 18 2016, due to warming rather than drying (Rasmussen et al., 2007). In particular, the analysis of spatial 19 pattern of SCE indicates a slightly greater reduction on the eastern side (~14 ± 2%) of the Andes Cordillera 20 compared to the western side (~12 ± 3%). The longest time series of glacier mass balance data in the 21 Southern Hemisphere, the Echaurren Norte Glacier, lost 65% of its original area in the period 1955–2015 22 and disaggregated into two ice bodies in the late 1990s (Malmros et al., 2018; Pérez et al., 2018). 23 24 Mean temperatures in the SSA sub-region are projected to continue to rise up to +2.5°C in 2080 with respect 25 to the present climatology (Kreps et al., 2012). A rise in temperature means that the isotherm of 0°C will 26 move up the mountains leaving less surface for accumulation of snow (Barros et al., 2015). 27 28 An increase in the intensity and frequency of hot extremes and a decrease in the intensity and frequency of 29 cold extremes is likely projected (WGI AR6 Table 11.13, Seneviratne et al., 2021); CMIP6 models project an 30 increase in the intensity and frequency of heavy precipitation (medium confidence). 31 32 It is expected that an increase in the intensity of heavy precipitation, droughts and fire weather will intensify 33 through the 21st century in SSA but mean wind will decrease (medium confidence) (Kitoh et al., 2011; WGI 34 AR6 Tables 11.14 and Table 11.15, Seneviratne et al., 2021). The probability of having extended droughts, 35 such as the recently experienced mega-drought (2010-2015), increases to up to 5 events/100 yr (Bozkurt et 36 al., 2017). Snow, glaciers, permafrost and ice sheets will decrease with high confidence (WGI AR6 Table 37 12.6, Ranasinghe et al., 2021). The observed area and the elevation changes indicate that the Echaurren 38 Norte Glacier may disappear in the coming years if negative mass balance rates prevail (medium confidence) 39 (Farías-Barahona et al., 2019). 40 41 12.3.8.2 Exposure 42 43 Grasslands make a significant contribution to food security in Patagonia through providing part of the feed 44 requirements of ruminants used for meat, wool and milk production. There is a lack of information regarding 45 the combined effect of climate change and overgrazing and the consequences for pastoral livelihoods that 46 depend on rangelands. Temperature and the amount and seasonal distribution of precipitation were important 47 controls of vegetation structure in Patagonian rangelands (Gaitán et al., 2014). They found that over two‐48 thirds of the total effect of precipitation on above-ground net primary production (ANPP) was direct, and the 49 other third was indirect (via the effects of precipitation on vegetation structure). Thus, if evapotranspiration 50 and drought stress increase as temperature increases and rainfall decrease in water-limited ecosystems, it 51 would be expected a greater exposure of ranchers due to a reduction of stocking rate and therefore families’ 52 income (medium confidence). The number of farmers (mainly family enterprises) exposed to climatic 53 hazards (drought) is approximately 70–80 thousand that have 14–15 million sheep in Argentina (Peri et al., 54 2021). 55 56
ACCEPTED VERSIO
N
SUBJECT TO FIN
AL EDITS
FINAL DRAFT Chapter 12 IPCC WGII Sixth Assessment Report
Do Not Cite, Quote or Distribute 12-40 Total pages: 181
Argentinian Patagonia main cities have developed as the result of oil and gas extraction, which demand 1 massive quantities of water due to fracking and drilling techniques. Vaca Muerta is the major region in South 2 America where those techniques are used to extract oil and gas, and this will lead to an exacerbation of 3 current water scarcity and to competition with irrigated agriculture (Rosa and D'Odorico, 2019) which in the 4 context of drought may exacerbate socio-environmental conflicts (medium confidence). 5 6 12.3.8.3 Vulnerability 7 8 There are reports related to a decrease in survival, growth and higher vulnerability to drought and fire-9 severity for species of native forest due to climate change and wildfire (high confidence) (Mundo et al., 10 2010; Landesmann et al., 2015; Whitlock et al., 2015; Jump et al., 2017; Camarero et al., 2018; Venegas-11 González et al., 2018a). There is a reported coincidence between major changes in regional decline in the 12 growth of forests with severe droughts due to climatic variations over northern Patagonia (Rodríguez-Catón 13 et al., 2016). Once the forest decline begins, other contributing factors such as insects (e.g., defoliator 14 outbreaks) increase the forest vulnerability or accelerate the loss of forest health of previously stressed trees 15 (Piper et al., 2015). This region hosts unique temperate rainforests and it is particularly rich in endemic and 16 long-lived conifer species (e.g., Fitzroya cupressoides), which may be vulnerable to declines in soil moisture 17 availability (Camarero and Fajardo, 2017). Patagonia will probably be vulnerable by a decrease in 18 precipitation regimes due to climate change, and consequently many species that rely on meadows in an arid 19 environment will also be impacted (Crego et al., 2014). The floods triggered by strong ENSOs caused 20 significant changes in the crop production (Isla et al., 2018). 21 22 The development of various human activities and water infrastructure are decreasing water sources, changing 23 river basins from exoreic to endoreic and the disappearance of one lake in 2016 (Scordo et al., 2017). 24 Numerous dams for irrigation, some also used for hydropower, have been and are planned to be built despite 25 wind power generation potential (Silva, 2016). Oil and gas have played an important role in the rise of 26 Neuquén-Cipolletti as Patagonia's most populous urban area, and in the growth of Comodoro Rivadavia, 27 Punta Arenas, and Rio Grande, as well. 28 29 12.3.8.4 Impacts 30 31 The potential impact of climate change is of special concern in arid and semi-arid Patagonia, a >700,000 km2 32 region of steppe-like plains in Argentina. Thus, melting snow and ice in the glaciers of Patagonia and the 33 Andes will alter surface runoff into interior wetlands; sea level rise of between 20 and 60 cm will destroy 34 coastal marshes; and an increase in extreme events, such as storms, floods, and droughts, will affect 35 biodiversity in wet grasslands (medium confidence: low evidence, high agreement) (after Junk et al. 2013; 36 Joyce et al. 2016). Three species of lizard from Patagonia are at risk of extinction as a result of global 37 warming (Kubisch et al., 2016). 38 39 Patagonian ice fields in South America are the largest bodies of ice outside of Antarctica in the southern 40 hemisphere. They are losing volume due partly to rapid changes in their outlet glaciers which end up in lakes 41 or the oceans, becoming the largest contributors to eustatic sea level rise (SLR) in the world, per unit area 42 (Foresta et al., 2018; Moragues et al., 2019; Zemp et al., 2019). Most calving glaciers in the Southern 43 Patagonia ice field retreated during the last century (high confidence). Upsala Glacier retreat generated slope 44 instability and a landslide movement destroyed the western edge in 2013. The Upsala Argentina Lake has 45 become potentially unstable and may generate new landslides (Moragues et al., 2019). The climate effect on 46 the summer stratification of piedmont lakes is another issue in relation to glacier dynamics (Isla et al., 2010). 47 48 Between 41º and 56° South latitude, the absolute glacier area loss was 5450 km2 (19%) in the last ∼150 49 years, with an annual area reduction increase of 0.25% a-1 for the period 2005–2016 (Meier et al., 2018). The 50 small glaciers in the north of the Northern Patagonian Ice field had over all periods the highest rates of 51 0.92% a-1. In this sub-region, increased melting of ice is leading to changes in the structure and functioning 52 of river ecosystems and in freshwater inputs to coastal marine ecosystems (medium confidence: low 53 evidence, high agreement) (Aguayo et al., 2019). In addition, in the case of coastal areas, the importance of 54 tides and rising sea levels in the behaviour of river floods has been demonstrated (Jalón-Rojas et al., 2018). 55 56
ACCEPTED VERSIO
N
SUBJECT TO FIN
AL EDITS
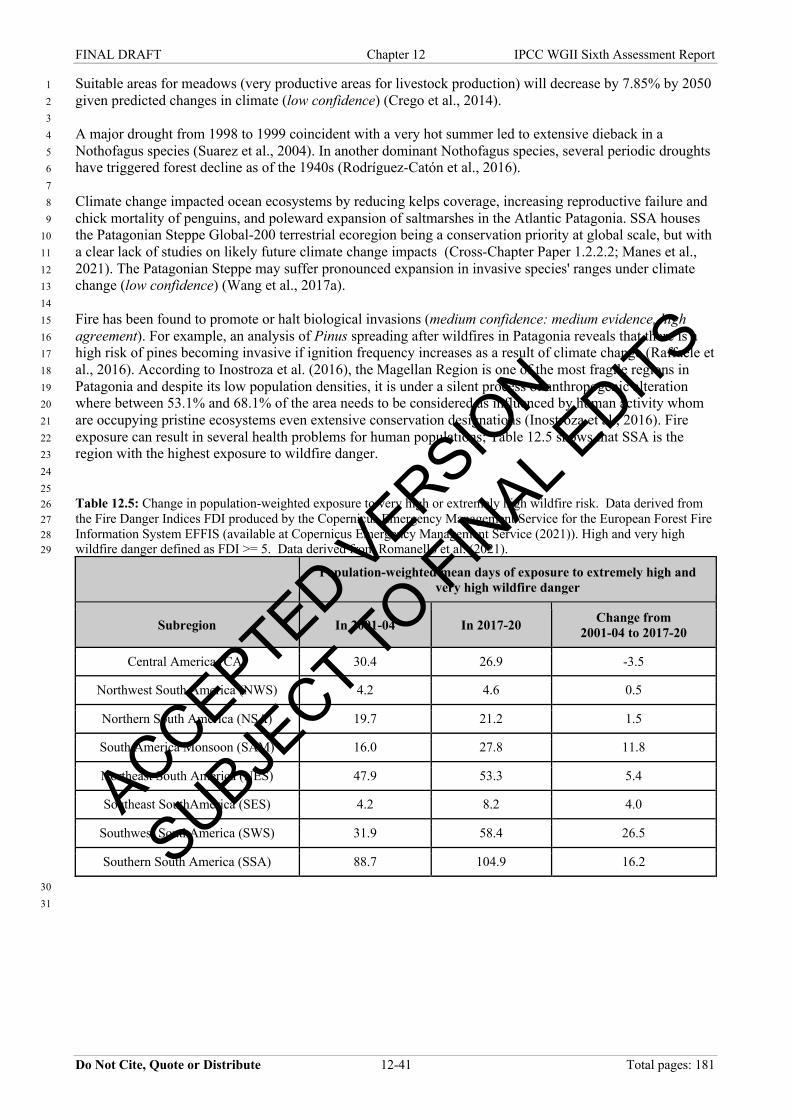
FINAL DRAFT Chapter 12 IPCC WGII Sixth Assessment Report
Do Not Cite, Quote or Distribute 12-41 Total pages: 181
Suitable areas for meadows (very productive areas for livestock production) will decrease by 7.85% by 2050 1 given predicted changes in climate (low confidence) (Crego et al., 2014). 2 3 A major drought from 1998 to 1999 coincident with a very hot summer led to extensive dieback in a 4 Nothofagus species (Suarez et al., 2004). In another dominant Nothofagus species, several periodic droughts 5 have triggered forest decline as of the 1940s (Rodríguez-Catón et al., 2016). 6 7 Climate change impacted ocean ecosystems by reducing kelps coverage, increasing reproductive failure and 8 chick mortality of penguins, and poleward expansion of saltmarshes in the Atlantic Patagonia. SSA houses 9 the Patagonian Steppe Global-200 terrestrial ecoregion being a conservation priority at global scale, but with 10 a clear lack of studies on likely future climate change impacts (Cross-Chapter Paper 1.2.2.2; Manes et al., 11 2021). The Patagonian Steppe may suffer pronounced expansion in invasive species' ranges under climate 12 change (low confidence) (Wang et al., 2017a). 13 14 Fire has been found to promote or halt biological invasions (medium confidence: medium evidence, high 15 agreement). For example, an analysis of Pinus spreading after wildfires in Patagonia reveals that there is a 16 high risk of pines becoming invasive if ignition frequency increases as a result of climate change (Raffaele et 17 al., 2016). According to Inostroza et al. (2016), the Magellan Region is one of the most fragile regions in 18 Patagonia and despite its low population densities, it is under a silent process of anthropogenic alteration 19 where between 53.1% and 68.1% of the area needs to be considered as influenced by human activity whom 20 are occupying pristine ecosystems even extensive conservation designations (Inostroza et al., 2016). Fire 21 exposure can result in several health problems for human populations; Table 12.5 shows that SSA is the 22 region with the highest exposure to wildfire danger. 23 24 25 Table 12.5: Change in population-weighted exposure to very high or extremely high wildfire risk. Data derived from 26 the Fire Danger Indices FDI produced by the Copernicus Emergency Management Service for the European Forest Fire 27 Information System EFFIS (available at Copernicus Emergency Management Service (2021)). High and very high 28 wildfire danger defined as FDI >= 5. Data derived from Romanello et al. (2021). 29
Population-weighted mean days of exposure to extremely high and very high wildfire danger
Subregion In 2001-04 In 2017-20 Change from 2001-04 to 2017-20
Central America (CA) 30.4 26.9 -3.5
Northwest South America (NWS) 4.2 4.6 0.5
Northern South America (NSA) 19.7 21.2 1.5
South America Monsoon (SAM) 16.0 27.8 11.8
Northeast South America (NES) 47.9 53.3 5.4
Southeast SouthAmerica (SES) 4.2 8.2 4.0
Southwest SouthAmerica (SWS) 31.9 58.4 26.5
Southern South America (SSA) 88.7 104.9 16.2
30 31
ACCEPTED VERSIO
N
SUBJECT TO FIN
AL EDITS
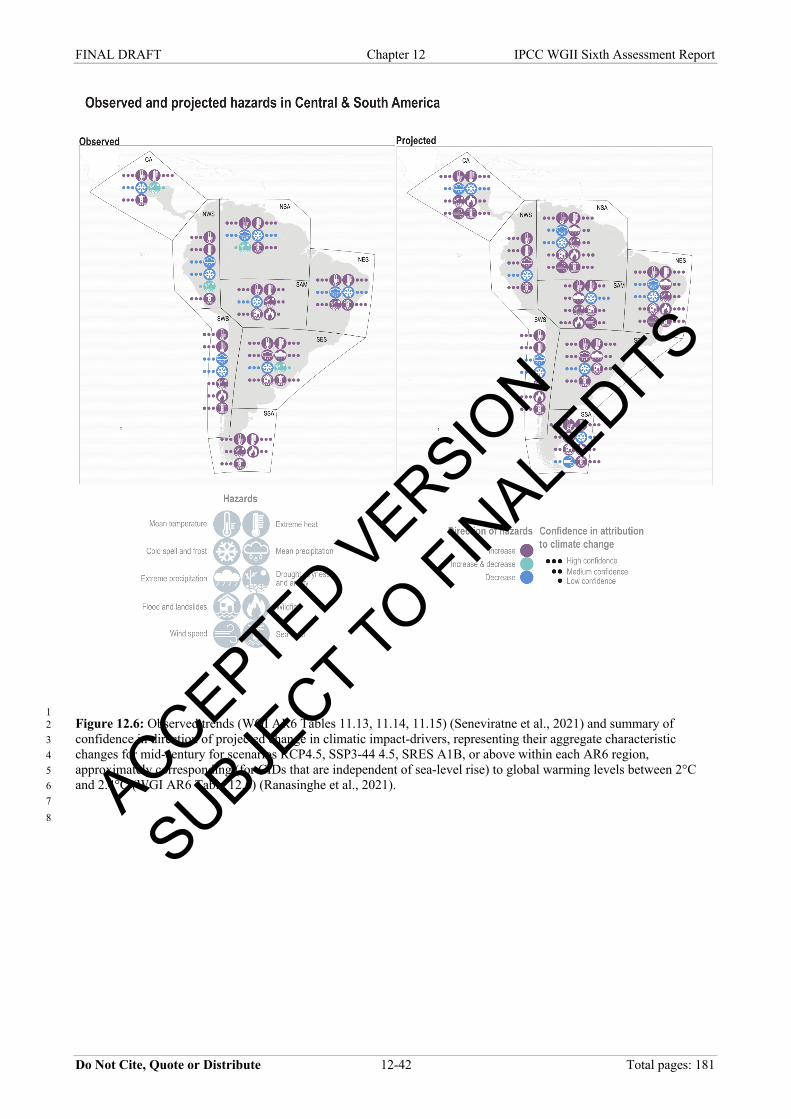
FINAL DRAFT Chapter 12 IPCC WGII Sixth Assessment Report
Do Not Cite, Quote or Distribute 12-42 Total pages: 181
1 Figure 12.6: Observed trends (WGI AR6 Tables 11.13, 11.14, 11.15) (Seneviratne et al., 2021) and summary of 2 confidence in direction of projected change in climatic impact-drivers, representing their aggregate characteristic 3 changes for mid-century for scenarios RCP4.5, SSP3-44 4.5, SRES A1B, or above within each AR6 region, 4 approximately corresponding (for CIDs that are independent of sea-level rise) to global warming levels between 2°C 5 and 2.4°C (WGI AR6 Table 12.6) (Ranasinghe et al., 2021). 6 7 8 ACCEPTED V
ERSION
SUBJECT TO FIN
AL EDITS
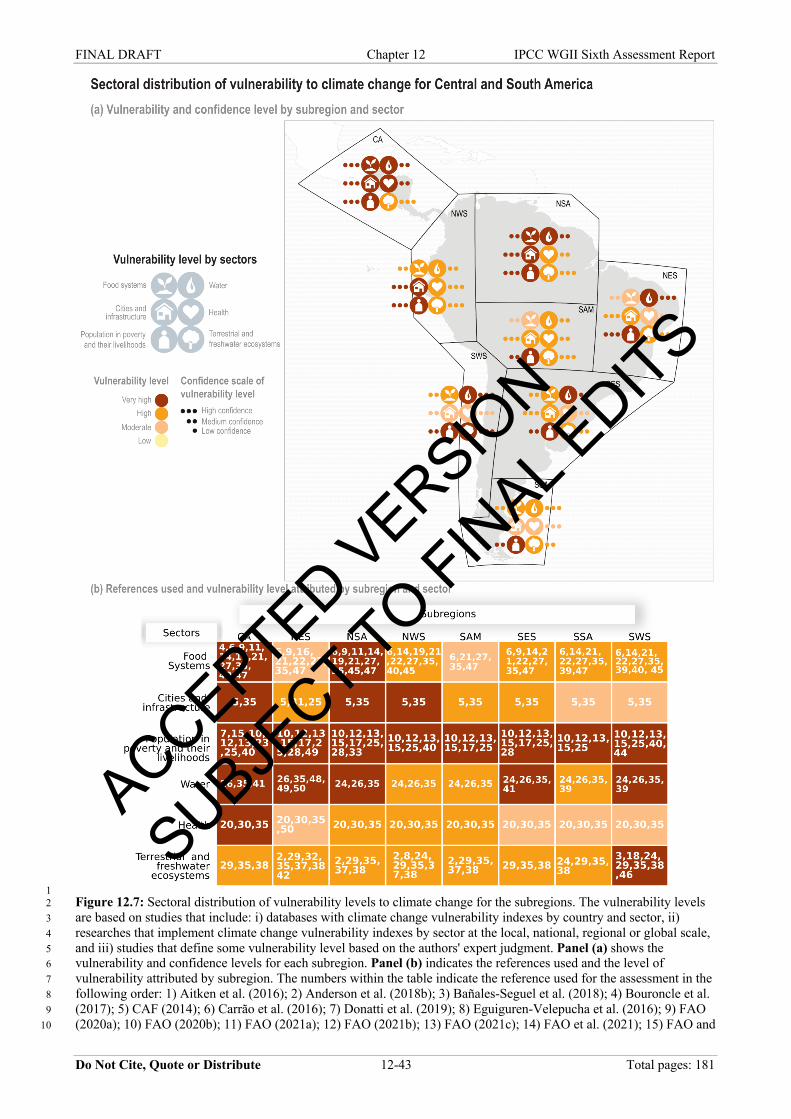
FINAL DRAFT Chapter 12 IPCC WGII Sixth Assessment Report
Do Not Cite, Quote or Distribute 12-43 Total pages: 181
1 Figure 12.7: Sectoral distribution of vulnerability levels to climate change for the subregions. The vulnerability levels 2 are based on studies that include: i) databases with climate change vulnerability indexes by country and sector, ii) 3 researches that implement climate change vulnerability indexes by sector at the local, national, regional or global scale, 4 and iii) studies that define some vulnerability level based on the authors' expert judgment. Panel (a) shows the 5 vulnerability and confidence levels for each subregion. Panel (b) indicates the references used and the level of 6 vulnerability attributed by subregion. The numbers within the table indicate the reference used for the assessment in the 7 following order: 1) Aitken et al. (2016); 2) Anderson et al. (2018b); 3) Bañales-Seguel et al. (2018); 4) Bouroncle et al. 8 (2017); 5) CAF (2014); 6) Carrão et al. (2016); 7) Donatti et al. (2019); 8) Eguiguren-Velepucha et al. (2016); 9) FAO 9 (2020a); 10) FAO (2020b); 11) FAO (2021a); 12) FAO (2021b); 13) FAO (2021c); 14) FAO et al. (2021); 15) FAO and 10
ACCEPTED VERSIO
N
SUBJECT TO FIN
AL EDITS
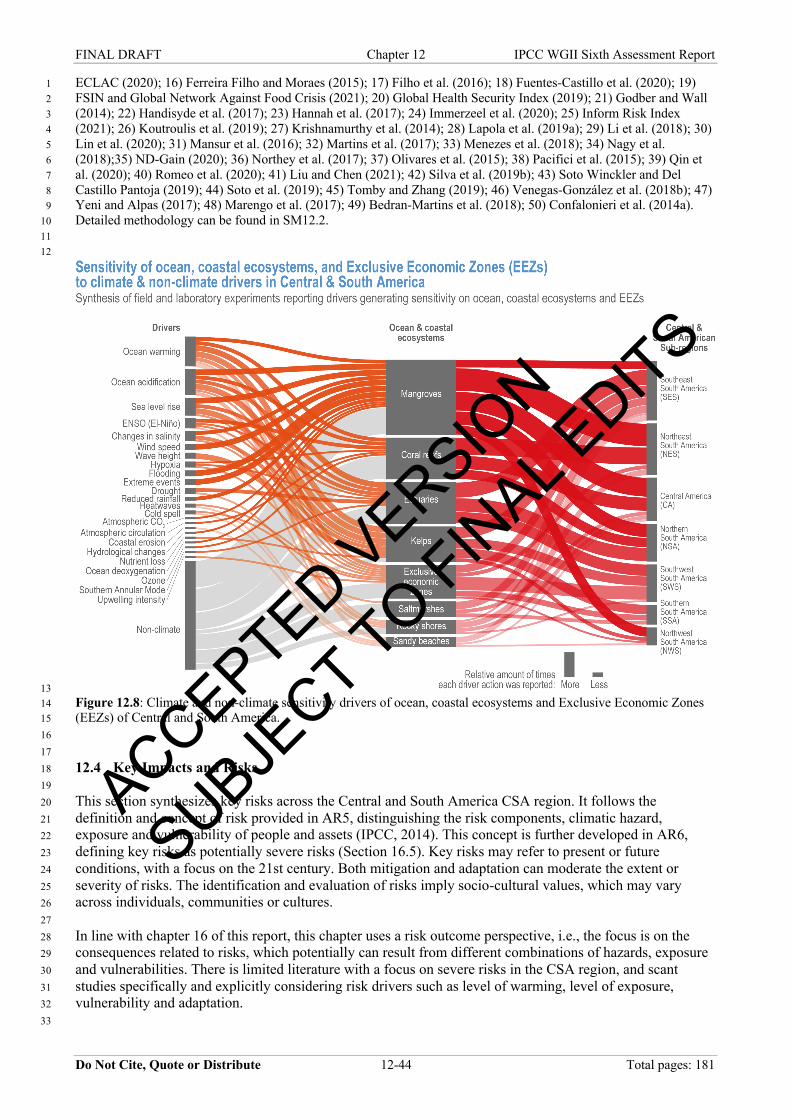
FINAL DRAFT Chapter 12 IPCC WGII Sixth Assessment Report
Do Not Cite, Quote or Distribute 12-44 Total pages: 181
ECLAC (2020); 16) Ferreira Filho and Moraes (2015); 17) Filho et al. (2016); 18) Fuentes-Castillo et al. (2020); 19) 1 FSIN and Global Network Against Food Crisis (2021); 20) Global Health Security Index (2019); 21) Godber and Wall 2 (2014); 22) Handisyde et al. (2017); 23) Hannah et al. (2017); 24) Immerzeel et al. (2020); 25) Inform Risk Index 3 (2021); 26) Koutroulis et al. (2019); 27) Krishnamurthy et al. (2014); 28) Lapola et al. (2019a); 29) Li et al. (2018); 30) 4 Lin et al. (2020); 31) Mansur et al. (2016); 32) Martins et al. (2017); 33) Menezes et al. (2018); 34) Nagy et al. 5 (2018);35) ND-Gain (2020); 36) Northey et al. (2017); 37) Olivares et al. (2015); 38) Pacifici et al. (2015); 39) Qin et 6 al. (2020); 40) Romeo et al. (2020); 41) Liu and Chen (2021); 42) Silva et al. (2019b); 43) Soto Winckler and Del 7 Castillo Pantoja (2019); 44) Soto et al. (2019); 45) Tomby and Zhang (2019); 46) Venegas-González et al. (2018b); 47) 8 Yeni and Alpas (2017); 48) Marengo et al. (2017); 49) Bedran-Martins et al. (2018); 50) Confalonieri et al. (2014a). 9 Detailed methodology can be found in SM12.2. 10 11 12
13 Figure 12.8: Climate and non-climate sensitivity drivers of ocean, coastal ecosystems and Exclusive Economic Zones 14 (EEZs) of Central and South America. 15 16 17 12.4 Key Impacts and Risks 18 19 This section synthesizes key risks across the Central and South America CSA region. It follows the 20 definition and concept of risk provided in AR5, distinguishing the risk components, climatic hazard, 21 exposure and vulnerability of people and assets (IPCC, 2014). This concept is further developed in AR6, 22 defining key risks as potentially severe risks (Section 16.5). Key risks may refer to present or future 23 conditions, with a focus on the 21st century. Both mitigation and adaptation can moderate the extent or 24 severity of risks. The identification and evaluation of risks imply socio-cultural values, which may vary 25 across individuals, communities or cultures. 26 27 In line with chapter 16 of this report, this chapter uses a risk outcome perspective, i.e., the focus is on the 28 consequences related to risks, which potentially can result from different combinations of hazards, exposure 29 and vulnerabilities. There is limited literature with a focus on severe risks in the CSA region, and scant 30 studies specifically and explicitly considering risk drivers such as level of warming, level of exposure, 31 vulnerability and adaptation. 32 33
ACCEPTED VERSIO
N
SUBJECT TO FIN
AL EDITS
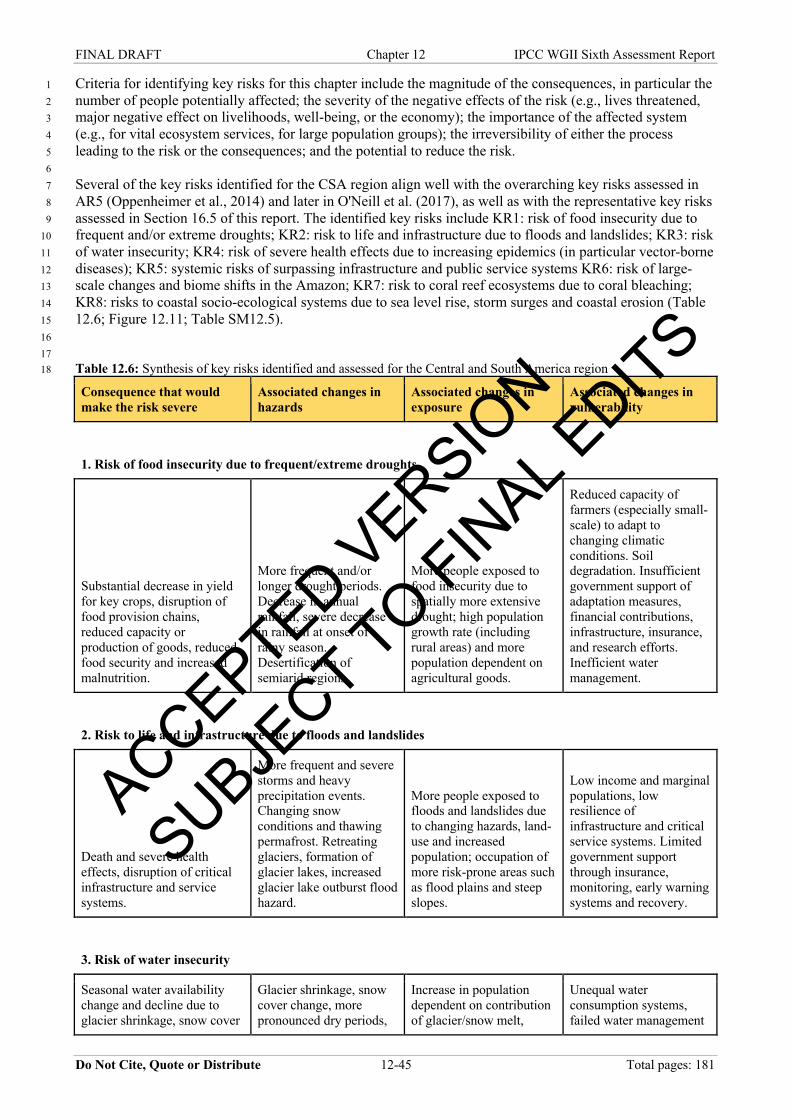
FINAL DRAFT Chapter 12 IPCC WGII Sixth Assessment Report
Do Not Cite, Quote or Distribute 12-45 Total pages: 181
Criteria for identifying key risks for this chapter include the magnitude of the consequences, in particular the 1 number of people potentially affected; the severity of the negative effects of the risk (e.g., lives threatened, 2 major negative effect on livelihoods, well-being, or the economy); the importance of the affected system 3 (e.g., for vital ecosystem services, for large population groups); the irreversibility of either the process 4 leading to the risk or the consequences; and the potential to reduce the risk. 5 6 Several of the key risks identified for the CSA region align well with the overarching key risks assessed in 7 AR5 (Oppenheimer et al., 2014) and later in O'Neill et al. (2017), as well as with the representative key risks 8 assessed in Section 16.5 of this report. The identified key risks include KR1: risk of food insecurity due to 9 frequent and/or extreme droughts; KR2: risk to life and infrastructure due to floods and landslides; KR3: risk 10 of water insecurity; KR4: risk of severe health effects due to increasing epidemics (in particular vector-borne 11 diseases); KR5: systemic risks of surpassing infrastructure and public service systems KR6: risk of large-12 scale changes and biome shifts in the Amazon; KR7: risk to coral reef ecosystems due to coral bleaching; 13 KR8: risks to coastal socio-ecological systems due to sea level rise, storm surges and coastal erosion (Table 14 12.6; Figure 12.11; Table SM12.5). 15 16 17 Table 12.6: Synthesis of key risks identified and assessed for the Central and South America region 18
Consequence that would make the risk severe
Associated changes in hazards
Associated changes in exposure
Associated changes in vulnerability
1. Risk of food insecurity due to frequent/extreme droughts
Substantial decrease in yield for key crops, disruption of food provision chains, reduced capacity or production of goods, reduced food security and increased malnutrition.
More frequent and/or longer drought periods. Decrease in annual rainfall, severe decrease in rainfall at onset of rainy season. Desertification of semiarid regions.
More people exposed to food insecurity due to spatially more extensive drought; high population growth rate (including rural areas) and more population dependent on agricultural goods.
Reduced capacity of farmers (especially small-scale) to adapt to changing climatic conditions. Soil degradation. Insufficient government support of adaptation measures, financial contributions, infrastructure, insurance, and research efforts. Inefficient water management.
2. Risk to life and infrastructure due to floods and landslides
Death and severe health effects, disruption of critical infrastructure and service systems.
More frequent and severe storms and heavy precipitation events. Changing snow conditions and thawing permafrost. Retreating glaciers, formation of glacier lakes, increased glacier lake outburst flood hazard.
More people exposed to floods and landslides due to changing hazards, land-use and increased population; occupation of more risk-prone areas such as flood plains and steep slopes.
Low income and marginal populations, low resilience of infrastructure and critical service systems. Limited government support through insurance, monitoring, early warning systems and recovery.
3. Risk of water insecurity
Seasonal water availability change and decline due to glacier shrinkage, snow cover
Glacier shrinkage, snow cover change, more pronounced dry periods,
Increase in population dependent on contribution of glacier/snow melt,
Unequal water consumption systems, failed water management
ACCEPTED VERSIO
N
SUBJECT TO FIN
AL EDITS
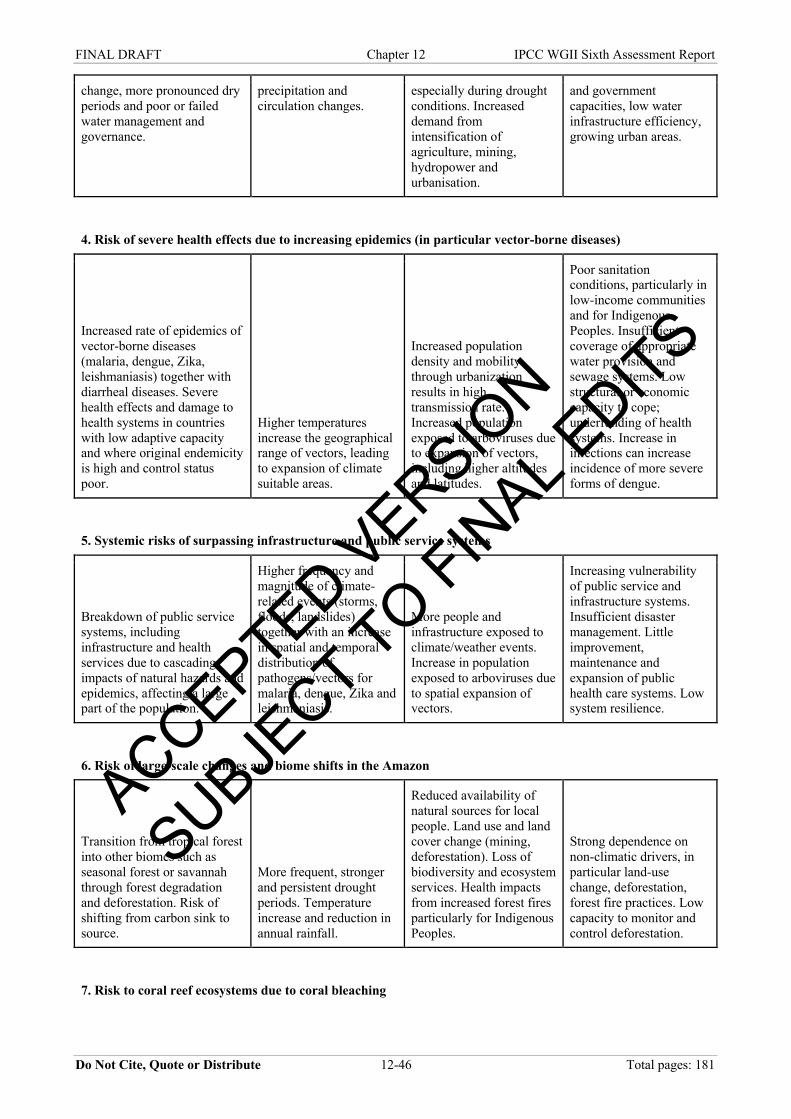
FINAL DRAFT Chapter 12 IPCC WGII Sixth Assessment Report
Do Not Cite, Quote or Distribute 12-46 Total pages: 181
change, more pronounced dry periods and poor or failed water management and governance.
precipitation and circulation changes.
especially during drought conditions. Increased demand from intensification of agriculture, mining, hydropower and urbanisation.
and government capacities, low water infrastructure efficiency, growing urban areas.
4. Risk of severe health effects due to increasing epidemics (in particular vector-borne diseases)
Increased rate of epidemics of vector-borne diseases (malaria, dengue, Zika, leishmaniasis) together with diarrheal diseases. Severe health effects and damage to health systems in countries with low adaptive capacity and where original endemicity is high and control status poor.
Higher temperatures increase the geographical range of vectors, leading to expansion of climate suitable areas.
Increased population density and mobility through urbanization results in high transmission rate. Increased population exposed to arboviruses due to expansion of vectors, including higher altitudes and latitudes.
Poor sanitation conditions, particularly in low-income communities and for Indigenous Peoples. Insufficient coverage of appropriate water provision and sewage systems. Low structural or economic capacity to cope; underfunding of health systems. Increase in infections can increase incidence of more severe forms of dengue.
5. Systemic risks of surpassing infrastructure and public service systems
Breakdown of public service systems, including infrastructure and health services due to cascading impacts of natural hazards and epidemics, affecting a large part of the population.
Higher frequency and magnitude of climate-related events (storms, floods, landslides) together with an increase in spatial and temporal distribution of pathogens/vectors for malaria, dengue, Zika and leishmaniasis.
More people and infrastructure exposed to climate/weather events. Increase in population exposed to arboviruses due to spatial expansion of vectors.
Increasing vulnerability of public service and infrastructure systems. Insufficient disaster management. Little improvement, maintenance and expansion of public health care systems. Low system resilience.
6. Risk of large-scale changes and biome shifts in the Amazon
Transition from tropical forest into other biomes such as seasonal forest or savannah through forest degradation and deforestation. Risk of shifting from carbon sink to source.
More frequent, stronger and persistent drought periods. Temperature increase and reduction in annual rainfall.
Reduced availability of natural sources for local people. Land use and land cover change (mining, deforestation). Loss of biodiversity and ecosystem services. Health impacts from increased forest fires particularly for Indigenous Peoples.
Strong dependence on non-climatic drivers, in particular land-use change, deforestation, forest fire practices. Low capacity to monitor and control deforestation.
7. Risk to coral reef ecosystems due to coral bleaching
ACCEPTED VERSIO
N
SUBJECT TO FIN
AL EDITS
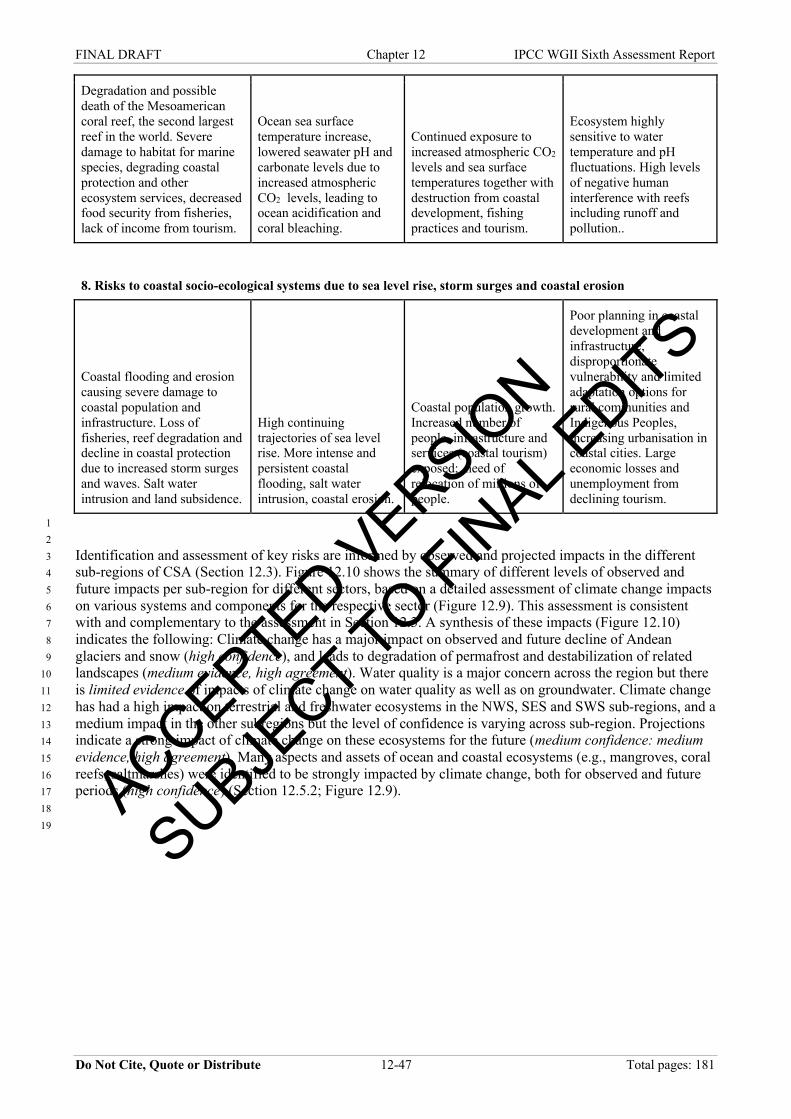
FINAL DRAFT Chapter 12 IPCC WGII Sixth Assessment Report
Do Not Cite, Quote or Distribute 12-47 Total pages: 181
Degradation and possible death of the Mesoamerican coral reef, the second largest reef in the world. Severe damage to habitat for marine species, degrading coastal protection and other ecosystem services, decreased food security from fisheries, lack of income from tourism.
Ocean sea surface temperature increase, lowered seawater pH and carbonate levels due to increased atmospheric CO2 levels, leading to ocean acidification and coral bleaching.
Continued exposure to increased atmospheric CO2 levels and sea surface temperatures together with destruction from coastal development, fishing practices and tourism.
Ecosystem highly sensitive to water temperature and pH fluctuations. High levels of negative human interference with reefs including runoff and pollution..
8. Risks to coastal socio-ecological systems due to sea level rise, storm surges and coastal erosion
Coastal flooding and erosion causing severe damage to coastal population and infrastructure. Loss of fisheries, reef degradation and decline in coastal protection due to increased storm surges and waves. Salt water intrusion and land subsidence.
High continuing trajectories of sea level rise. More intense and persistent coastal flooding, salt water intrusion, coastal erosion.
Coastal population growth. Increased number of people, infrastructure and services (coastal tourism) exposed; need of relocation of millions of people.
Poor planning in coastal development and infrastructure, disproportionate vulnerability and limited adaptation options for rural communities and Indigenous Peoples, increasing urbanisation in coastal cities. Large economic losses and unemployment from declining tourism.
1 2 Identification and assessment of key risks are informed by observed and projected impacts in the different 3 sub-regions of CSA (Section 12.3). Figure 12.10 shows the summary of different levels of observed and 4 future impacts per sub-region for different sectors, based on a detailed assessment of climate change impacts 5 on various systems and components for the respective sector (Figure 12.9). This assessment is consistent 6 with and complementary to the assessment in Section 12.3. A synthesis of these impacts (Figure 12.10) 7 indicates the following: Climate change has a major impact on observed and future decline of Andean 8 glaciers and snow (high confidence), and leads to degradation of permafrost and destabilization of related 9 landscapes (medium evidence, high agreement). Water quality is a major concern across the region but there 10 is limited evidence of impacts of climate change on water quality as well as on groundwater. Climate change 11 has had a high impact on terrestrial and freshwater ecosystems in the NWS, SES and SWS sub-regions, and a 12 medium impact in the other subregions but the level of confidence is varying across sub-region. Projections 13 indicate a strong impact of climate change on these ecosystems for the future (medium confidence: medium 14 evidence, high agreement). Many aspects and assets of ocean and coastal ecosystems (e.g., mangroves, coral 15 reefs, saltmarshes) were identified to be strongly impacted by climate change, both for observed and future 16 periods (high confidence) (Section 12.5.2; Figure 12.9). 17 18 19
ACCEPTED VERSIO
N
SUBJECT TO FIN
AL EDITS
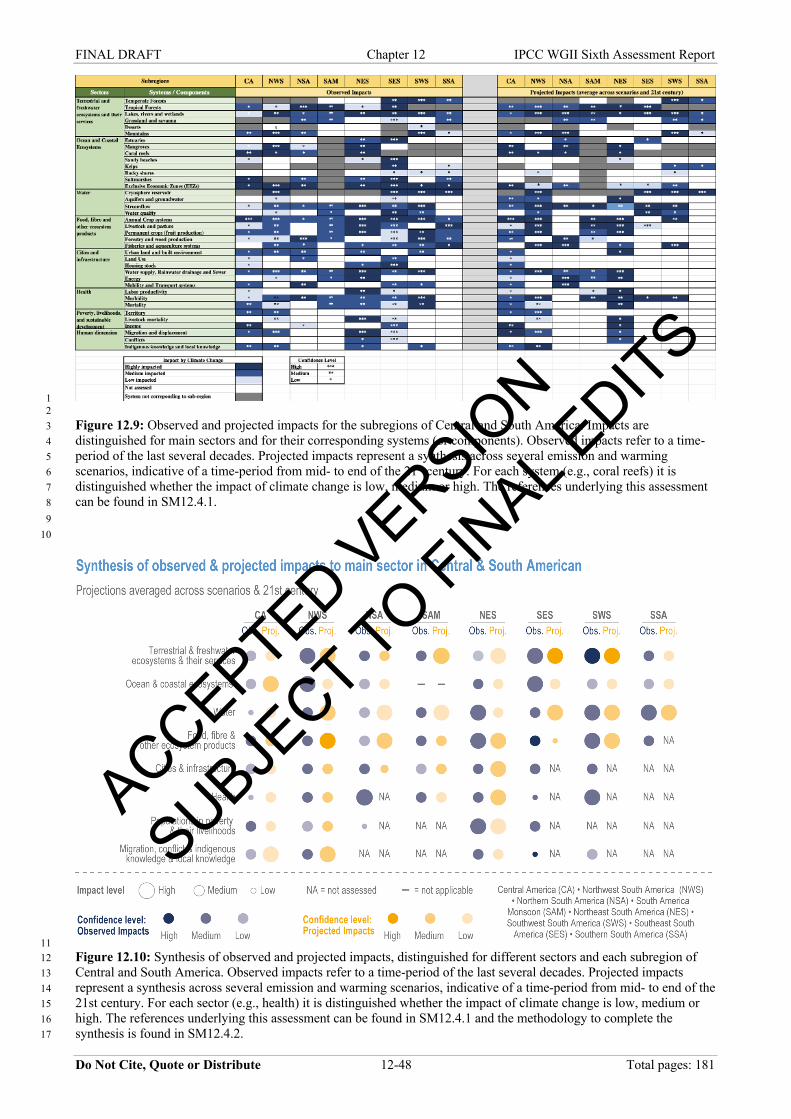
FINAL DRAFT Chapter 12 IPCC WGII Sixth Assessment Report
Do Not Cite, Quote or Distribute 12-48 Total pages: 181
1 2 Figure 12.9: Observed and projected impacts for the subregions of Central and South America. Impacts are 3 distinguished for main sectors and for their corresponding systems (or components). Observed impacts refer to a time-4 period of the last several decades. Projected impacts represent a synthesis across several emission and warming 5 scenarios, indicative of a time-period from mid- to end of the 21st century. For each system (e.g., coral reefs) it is 6 distinguished whether the impact of climate change is low, medium or high. The references underlying this assessment 7 can be found in SM12.4.1. 8 9 10
11 Figure 12.10: Synthesis of observed and projected impacts, distinguished for different sectors and each subregion of 12 Central and South America. Observed impacts refer to a time-period of the last several decades. Projected impacts 13 represent a synthesis across several emission and warming scenarios, indicative of a time-period from mid- to end of the 14 21st century. For each sector (e.g., health) it is distinguished whether the impact of climate change is low, medium or 15 high. The references underlying this assessment can be found in SM12.4.1 and the methodology to complete the 16 synthesis is found in SM12.4.2. 17
ACCEPTED VERSIO
N
SUBJECT TO FIN
AL EDITS
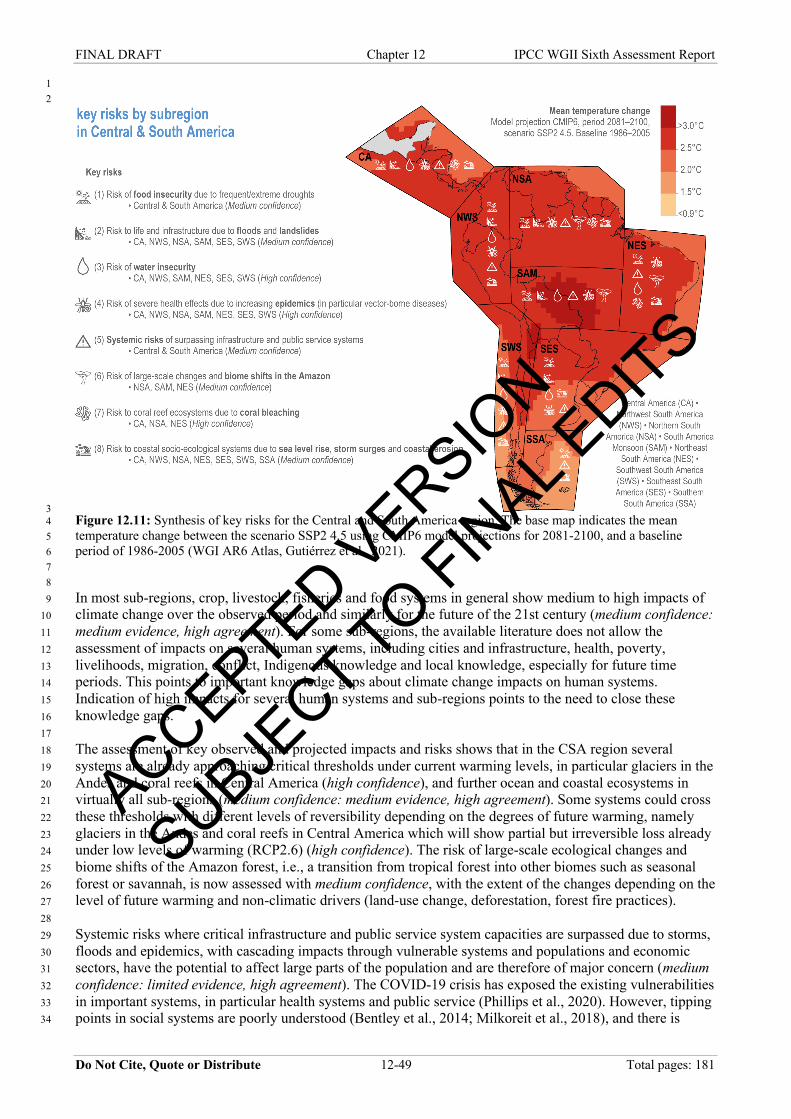
FINAL DRAFT Chapter 12 IPCC WGII Sixth Assessment Report
Do Not Cite, Quote or Distribute 12-49 Total pages: 181
1 2
3 Figure 12.11: Synthesis of key risks for the Central and South America region. The base map indicates the mean 4 temperature change between the scenario SSP2 4.5 using CMIP6 model projections for 2081-2100, and a baseline 5 period of 1986-2005 (WGI AR6 Atlas, Gutiérrez et al., 2021). 6 7 8 In most sub-regions, crop, livestock, fisheries and food systems in general show medium to high impacts of 9 climate change over the observed period and similarly for the future of the 21st century (medium confidence: 10 medium evidence, high agreement). For some sub-regions, the available literature does not allow the 11 assessment of impacts on several human systems, including cities and infrastructure, health, poverty, 12 livelihoods, migration, conflict, Indigenous knowledge and local knowledge, especially for future time 13 periods. This points to important knowledge gaps about climate change impacts on human systems. 14 Indication of high impacts for several human systems and sub-regions points to the need to close these 15 knowledge gaps. 16 17 The assessment of key observed and projected impacts and risks shows that in the CSA region several 18 systems are already approaching critical thresholds under current warming levels, in particular glaciers in the 19 Andes and coral reefs in Central America (high confidence), and further ocean and coastal ecosystems in 20 virtually all sub-regions (medium confidence: medium evidence, high agreement). Some systems could cross 21 these thresholds with different levels of reversibility depending on the degrees of future warming, namely 22 glaciers in the Andes and coral reefs in Central America which will show partial but irreversible loss already 23 under low levels of warming (RCP2.6) (high confidence). The risk of large-scale ecological changes and 24 biome shifts of the Amazon forest, i.e., a transition from tropical forest into other biomes such as seasonal 25 forest or savannah, is now assessed with medium confidence, with the extent of the changes depending on the 26 level of future warming and non-climatic drivers (land-use change, deforestation, forest fire practices). 27 28 Systemic risks where critical infrastructure and public service system capacities are surpassed due to storms, 29 floods and epidemics, with cascading impacts through vulnerable systems and populations and economic 30 sectors, have the potential to affect large parts of the population and are therefore of major concern (medium 31 confidence: limited evidence, high agreement). The COVID-19 crisis has exposed the existing vulnerabilities 32 in important systems, in particular health systems and public service (Phillips et al., 2020). However, tipping 33 points in social systems are poorly understood (Bentley et al., 2014; Milkoreit et al., 2018), and there is 34
ACCEPTED VERSIO
N
SUBJECT TO FIN
AL EDITS
FINAL DRAFT Chapter 12 IPCC WGII Sixth Assessment Report
Do Not Cite, Quote or Distribute 12-50 Total pages: 181
limited evidence to inform understanding about which level of compound climatic, environmental and socio-1 economic stressors social systems withstand in CSA. 2 3 Overall, most key risks and their severity and extent are strongly driven and determined by the system’s 4 exposure, vulnerability and adaptive capacity. In particular, the high vulnerability of large populations, 5 infrastructure and service systems such as health, food and energy production and supply are important 6 factors, along with high inequalities and poor governance, for creating and increasing key risks (high 7 confidence). Prevailing low levels of available information and understanding exacerbate the uncertainties 8 surrounding key risks, and hence pose limitations to adaptation. An example is Central America with high 9 levels of vulnerability and exposure but there is limited evidence and understanding on impacts and risks, 10 making this region susceptible to inappropriate adaptation to expected future climate change impacts. 11 12 13 12.5 Adaptation 14 15 Adaptation initiatives across the region have increased since AR5. National Communications (NC), 16 Nationally Determined Contributions (NDC) and National Adaptation Plans (NAP) (https://unfccc.int) 17 recently published are providing guidance for adaptation in CSA. There is also a diversity of non-18 governmental adaptation initiatives, both at the national and sub-national levels. In this context, this section 19 assesses, through a sectoral approach, the main challenges, opportunities, trends and initiatives to adapt to 20 climate change in the region. 21 22 12.5.1 Terrestrial and Freshwater Ecosystems and their Services 23 24 CSA is one of the most biodiverse regions in the World, hosting unique socio ecosystems that will be 25 strongly impacted by climate change (high confidence) (Section 12.3; Cross-Chapter Paper 1; CAF, 2014; 26 Camacho Guerreiro et al., 2016; IPBES, 2018a; Li et al., 2018; Retsa et al., 2020) . Warming has generated 27 extreme heat events in many parts of CSA (IPCC, 2019a) that, together with droughts and floods, will 28 seriously affect the integrity of terrestrial and freshwater ecosystems in the entire region (Section 12.3; CAF, 29 2014) . A reduction in net primary productivity in tropical forests and glacier retreat in the Andes, for 30 example, are expected to cause significant negative socioecological impacts (Feldpausch et al., 2016; Lyra et 31 al., 2017; Cuesta et al., 2019) (see Case Study, 12.7.1). Biodiversity-rich spots in the region are well assessed 32 in the literature as compared to other regions of the World, especially for the Atlantic Forest, Mesoamerica 33 and Cerrado (Cross-Chapter Paper 1.2.2; Manes et al., 2021) . Up to 85% of of evaluated natural systems 34 (species, habitats and communities) in the literature for biodiversity-rich spots since AR5 were projected to 35 be negative impacted by climate change (high confidence), with 26% of projections predicting species 36 extinctions (Cross-Chapter Paper 1.2.2; Manes et al., 2021) . Indigenous knowledge and local knowledge 37 play an important role in adaptation and are vital components of many socioecological systems, while also 38 being threatened by climate change (high confidence) (Box 7.1; Valdivia et al., 2010; Tengö et al., 2014; 39 Mistry et al., 2016; Harvey et al., 2017; Diamond and Ansharyani, 2018; Camico et al., 2021) . 40 41 12.5.1.1 Challenges and opportunities 42 43 The conversion of natural ecosystems to agriculture, pasture and other land uses in CSA has been identified 44 as a major challenge to climate change adaptation in the region (high confidence) (Scarano et al., 2018; 45 IPCC, 2019a). In the last three decades, South America has been a significant contributor of the growth of 46 agricultural production worldwide (OECD/Food and Agriculture Organization of the United Nations, 2015), 47 driven partly by increased international demand for commodities, especially soybeans and meat (IPCC, 48 2019a). Between 2001 and 2015 about 65% of all forest disturbance in the region was associated with 49 commodity-driven deforestation (Curtis et al., 2018). High rates of native vegetation conversion in 50 Argentina, Bolivia, Brazil, Colombia, Ecuador, Paraguay and Peru threaten important ecosystems (Amazon, 51 Cerrado, Chacos and Llanos savannas, Atlantic rainforest, Caatinga and Yungas) (Graesser et al., 2015; 52 FAO, 2016c). Almost 2/3 of soy consumed in EU+ comes from Brazil, Argentina and Paraguay (IDH, 2020), 53 increasing conversion risk in the Amazon, Cerrado, and Gran Chaco. Despite growing commodities 54 production traceability, in 2018 only 19% of the soybean meal consumed in EU+ was certified deforestation-55 free, and 38% compliant with the FEFAC Soy Sourcing Guidelines (IDH, 2020), which is a great challenge 56 at the international level (Negra et al., 2014; Curtis et al., 2018; Lambin et al., 2018; IDH, 2020). 57
ACCEPTED VERSIO
N
SUBJECT TO FIN
AL EDITS
FINAL DRAFT Chapter 12 IPCC WGII Sixth Assessment Report
Do Not Cite, Quote or Distribute 12-51 Total pages: 181
1 Investing in actions aimed at protection, restoration and sustainable use of biodiversity and ecosystems is a 2 good approach for maintaining critical ecosystem services, and is part of a common strategy for adaptation, 3 mitigation and disaster risk reduction in the region (high confidence) (Kabisch et al., 2016; Scarano et al., 4 2018). These strategies also meet the forest and water conservation international agendas, optimizing 5 resources and solutions (Strassburg et al., 2019). Global conservation and sustainable development 6 commitments, such as the Aichi Targets (CDB), Sustainable Development Goals (UN), the Nationally 7 Determined Contribution (NDC) under the Paris Agreement, and the New York Declaration on Forests 8 strongly rely on nature-based solutions (NbS) to achieve their objectives (Brancalion et al., 2019) (Figure 9 12.12). The COVID–19 outbreak also brought attention to the need for preserving tropical forests as a mean 10 to prevent spill over of viruses from wildlife to humans, with concerns over that risk in the Amazon (Allen et 11 al., 2017b; Dobson et al., 2020; IPBES, 2020; Ferreira et al., 2021). These represent an important 12 opportunity for Ecosystem Based Adaptation (EbA) to be at the core of NbS for climate change, access 13 finance and promote climate resilient development pathways in CSA. 14 15 The Declaration on Protected Areas and Climate Change, presented by 18 CSA countries during the 16 UNFCCC COP21, highlights the fundamental role of protected areas in providing the “green infrastructure” 17 needed for implementing climate change mitigation and adaptation, and safeguard the provision of essential 18 ecosystem services and the livelihoods of Indigenous Peoples and local communities (Gross et al., 2016). 19 Protected Areas systems in CSA are underfunded (very high confidence). Latin American (including 20 Mexico) governments allocate just about 1% of national environmental budgets on protected areas (about 21 USD 1.18 ha-1 on average). This figure only covers 54% of their basic needs, resulting in insufficient 22 management. The financing gap to achieve optimal needs for protected areas in CSA is approximately USD 23 700 million yr-1 (Bovarnick et al., 2010). This seriously compromises the management and delivery capacity 24 of protected areas for climate change adaptation, and preparedness for ongoing ecological transformation 25 (van Kerkhoff et al., 2019). Furthermore, in order to become a relevant mechanism for resilience, protected 26 areas need to be managed for this purpose (Mansourian et al., 2009). About 40% of protected areas in Latin 27 America and Caribbean (including Mexico), have management effectiveness evaluations being undertaken 28 (UNEP-WCMC and IUCN, 2020a). This is hardly representative of Aichi’s Goal 11, although far better than 29 the 11% global average. Collaborations with the Indigenous Peoples and local communities are also an 30 important issue to consolidate protected areas (Gross et al., 2016). In addition to protected areas as solutions 31 for climate change adaptation and mitigation, there is also a need to protect or restore ecosystems outside the 32 protected areas, as illustrated by the Mesoamerican Biological Corridor (Imbach et al., 2013). 33 34 Despite some local and specific assessments (e.g., Warner (2016)), there is a significant gap on identifying 35 barriers to adaptation or maladaptation in the region (Dow et al., 2013). In their National Communications 36 (NC), Nationally Determined Contributions (NDC) and/or National Adaptation Plans (NAP) 37 (https://unfccc.int), most countries identified inadequate financing and access to technology as barriers for 38 adaptation relevant to terrestrial and freshwater socio-ecosystems (high confidence). Insufficient institutional 39 coordination is also frequently mentioned (Rangecroft et al., 2013; Cameron et al., 2015). These limitations 40 could be partially addressed through multilateral cooperation, incorporation of synergies from the local to the 41 national scales, local empowerment, and poverty alleviation (Rangecroft et al., 2013; Harvey et al., 2017; 42 Murcia et al., 2017; Calispa, 2018; Chain-Guadarrama et al., 2018). 43 44 12.5.1.2 Governance and financing 45 46 All CSA countries have formulated policies that include measures relevant for socio-ecosystem adaptation in 47 their NCs, NDCs and NAPs (https://unfccc.int), with an emphasis on protection and restoration of water and 48 forests (high confidence). Existing proposed measures, instruments and programs, however, do not yet 49 reflect the vision needed to integrate the ecosystem and human dimensions of vulnerability. The 50 administration coordination and the progress in adaptive ecosystem management are incipient, due in part to 51 the lack of stable financial resources and scientific, Indigenous knowledge and local knowledge (IK and LK) 52 about adapting ecosystems to climate change (Bustamante et al., 2020). Brazil was an exception, showing 53 dramatic policy-driven reduction in deforestation in the Amazon between 2004–2012, with a concomitant 54 70% increase in soy production, the most profitable Amazon crop (Hansen et al., 2013; Nepstad et al., 2014). 55 Policies included territorial planning (protected areas, Indigenous territories and land tenure), satellite 56 monitoring, market and credit restrictions on high-deforesting municipalities, plus some incentives to small 57
ACCEPTED VERSIO
N
SUBJECT TO FIN
AL EDITS
FINAL DRAFT Chapter 12 IPCC WGII Sixth Assessment Report
Do Not Cite, Quote or Distribute 12-52 Total pages: 181
farmers (Boucher et al., 2013; Hansen et al., 2013; Nepstad et al., 2014; Castelo, 2015; Cunha et al., 2016a). 1 It is important to highlight the important role of Indigenous territories, in addition to protected areas, in 2 forest conservation in the Amazon (high evidence, medium agreement) (Schwartzman et al., 2013; Barber et 3 al., 2014; Nepstad et al., 2014; Walker et al., 2014b). These policies were partially funded by results-based 4 compensation through the Amazon Fund. Since 2012, however, policies and institutions have weakened, and 5 Amazon deforestation rates started to rise (Carvalho et al., 2019), sharpening in recent years (Silva Junior et 6 al., 2021). Conservation incentives, a new complementary and allegedly cost-effective approach, is 7 increasingly being implemented in the region (Magrin et al., 2014). They include payment for ecosystem 8 services, REDD+, environmental certification and conservation easements, but remain controversial, and 9 more research is needed on their effectiveness, possible negative side effects, participatory management 10 systems and collective decision-making processes (Larson and Petkova, 2011; Locatelli et al., 2011; Pinho et 11 al., 2014; Strassburg et al., 2014; Mistry et al., 2016; Gebara and Agrawal, 2017; Scarano et al., 2018; 12 Ruggiero et al., 2019; To and Dressler, 2019; Vallet et al., 2019). 13 14 12.5.1.3 Adaptation options to avert and reduce key risks on terrestrial and freshwater ecosystems 15 16 Research, monitoring systems and other initiatives for knowledge management are promoted in the region on 17 terrestrial and freshwater socio-ecosystem adaptation (high confidence) (NCs, NDCs and NAPs, 18 https://unfccc.int). In Chile, for example, the Eco-social Observatory of Climate Change Effects for High 19 Altitude Wetlands of Tarapacá has been collecting information on physical, biological and social variables 20 since 2013 (Uribe Rivera et al., 2017). Other examples in the Andes are the GLORIA-Andes network 21 (Cuesta et al., 2017a), the Andean Forest Network (Malizia et al., 2020) and the Initiative of Hydrological 22 Monitoring in the Andes (IMHEA), with measures to optimize watershed management and protection, and 23 reduce the risk of water insecurity (Correa et al., 2020). 24 25 Poverty is a driver of climate change risk, while sustainable use of ecosystems fosters adaptation (Kasecker 26 et al., 2018) (high confidence). Most of 398 “Ecosystem-based Adaptation hotspots” identified in Brazil on 27 this premise are located in some of the most vulnerable ecosystems to climate change (Kasecker et al., 2018). 28 Although conservation and restoration is reported as effective to reduce risk (medium confidence: medium 29 evidence, high agreement) (Anderson et al., 2010; Borsdorf et al., 2013; Keenan, 2015; Pires et al., 2017; 30 Ramalho et al., 2021), their effectiveness depends on the integration of conservation actions with 31 enhancement of local socioeconomic conditions (medium confidence: medium evidence, high agreement) 32 (Scarano and Ceotto, 2015; Pires et al., 2017; Kasecker et al., 2018; de Siqueira et al., 2021; Vale et al., 33 2021). 34 35 Since AR5, there has been an increase in the number of adaptation measures through natural resources and 36 ecosystem services management. The main approaches are EbA and Community-based Adaptation (CbA) 37 (high confidence) (NCs, NDCs and NAPs, https://unfccc.int). IK/LK can be very detailed and usually relates 38 to people’s priorities identified by collective decision-making (Box 7.1; (Hurlbert et al., 2019, SRCCL 39 Section 7.6.4); SRCCL Cross-Chapter Box ILK in Chapter 13; (de Coninck et al., 2018, SR1.5 Section 40 4.3.5.5). In Manaus, central Amazon, fishermen perceive reductions on fish size, diversity and capture levels 41 caused by droughts; while recognizing that floods hinders access to fishing grounds (Keenan, 2015; 42 Camacho Guerreiro et al., 2016). In the Amazon floodplains, small-scale fisher and farmer’s communities 43 incorporate their knowledge on natural hydrologic and ecological processes into management systems that 44 reduce climate change risk and impacts (Oviedo et al., 2016). Smallholder grain farmers in Guatemala and 45 Honduras implement EbA practices based on local knowledge (e.g., live fences, home gardens, shade trees in 46 coffee plantations, dispersed trees in corn fields and other food insecurity risk reduction practices) (Harvey et 47 al., 2017; Chain-Guadarrama et al., 2018). There is, therefore, a great potential for terrestrial and freshwater 48 ecosystem adaptation to climate change in CSA, provided that the right incentives and sociocultural 49 protective measures are in place (high confidence) (Section 12.5.10.4; Table SM12.7). 50 51 Disarticulation between policy and implementation is a common problem. Ecuadorian climate public policy 52 points towards a CbA approach, but it is often downsized in the implementation (Calispa, 2018). Important 53 adaptation actions have been undertaken in Argentina, Bolivia, Brazil, Chile, Colombia, Ecuador, El 54 Salvador, Paraguay, Peru and Uruguay; both in policymaking and institutional arrangements, but they tend to 55 be poorly coordinated with policies on development, land planning and other sectoral policies (Ryan, 2012). 56 Some type of community participation mechanisms is present in most country strategies, but their levels of 57
ACCEPTED VERSIO
N
SUBJECT TO FIN
AL EDITS
FINAL DRAFT Chapter 12 IPCC WGII Sixth Assessment Report
Do Not Cite, Quote or Distribute 12-53 Total pages: 181
implementation vary considerably (medium confidence: medium evidence, high agreement) (Ryan, 2012; 1 Pires et al., 2017; Calispa, 2018). 2 3 There is an ecosystem bias in adaptation priorities for research and implementation, hindering the 4 development of comprehensive adaptation programs. Most scientific research on adaptation in Peru focuses 5 on the highlands and coastal regions while mitigation research focuses on forests (Chazarin et al., 2014). 6 Combined adaptation and mitigation strategies can produce positive results, but they are often disconnected 7 (Locatelli et al., 2015). Most reviewed cases in agriculture and forestry in Latin America (84% of 274 cases) 8 reported positive synergies between adaptation and mitigation. Nevertheless, research on Latin American 9 forests tend to focus on mitigation, while studies on agriculture are usually oriented towards adaptation (high 10 confidence) (Locatelli et al., 2015; Locatelli et al., 2017). 11 12 Rural communities in the Cusco Region, Peru, ground their ability to adapt to climate change on four 13 cultural values, known in Quechua as ayni (reciprocity), ayllu (collectiveness), yanantin (equilibrium) and 14 chanincha (solidarity), but policies oriented towards “modernization” undermine these traditional 15 mechanisms. Adaptation strategies could benefit from integrating these and other insights from traditional 16 cultures, fostering risk reduction and transformational adaptation towards intrinsically sustainable systems 17 (medium confidence: medium evidence, high agreement) (Walshe and Argumedo, 2016). 18 19 Protected areas have become an important component as enablers of national climate change adaptation 20 strategies. They increase ecosystem’s adaptive potential, reducing climate risk and delivering numerous 21 ecosystem services, sustainable development benefits while playing an important role in climate change 22 mitigation (high confidence) (Mackey et al., 2008; Dudley et al., 2010; Gross et al., 2016; Bebber and Butt, 23 2017; Dinerstein et al., 2019; IPCC, 2019a). CSA already has a greater percentage of land (24.1%) under 24 protected status than the world average (14.7%) (UNEP-WCMC and IUCN, 2020b). Some countries, 25 including Belize, Bolivia, Brazil, Guatemala, Nicaragua and Venezuela already met or surpassed the 30% 26 CDB and IUCN goal (Dinerstein et al., 2019), and others like Costa Rica and Honduras are very close to 27 doing so. In some cases, the establishment of protected areas not accompanied by collective decision-making 28 processes has displaced local people or denied them access to natural resources, increasing their vulnerability 29 to climate change (Brockington and Wilkie, 2015). 30 31 In addition to better managing and expanding protected areas networks, Other Effective Area-based 32 Conservation Measures (OECMs), recently defined by the Parties to the Convention on Biological Diversity 33 (Dudley et al., 2018), could also enhance ecosystem resilience (low confidence). Private Protected Areas in 34 the mountain regions of the Americas (e.g., Andes), play an important role in closing the gaps in fragmented 35 biomes and expanding protection in underrepresented areas (Hora et al., 2018). In Brazil, there is also a huge 36 potential for conservation and sustainable management in private areas, as roughly 53% of the country’s 37 native vegetation is within private land (Lapola et al., 2014; Soares-Filho et al., 2014). 38 39 Large-scale restoration is also seen as pivotal to limiting both climate change (IPCC, 2019a) and species 40 extinction (IPBES, 2018a) (very high confidence). A new multi-criteria approach for optimizing multiple 41 restoration outcomes (for biodiversity, climate change mitigation, and cost), for example, indicate that South 42 America has the greatest extension of converted lands, evenly distributed in the top 50% of global priorities 43 (Strassburg et al., 2020). 44 45 12.5.2 Ocean and Coastal Ecosystems and their Services 46 47 Ocean and coastal ecosystems provide suitable habitats to a high number of species that support important 48 local fisheries, the tourism sector and the economy of the region (high confidence) (Section 3.5; Table 3.9; 49 González and Holtmann-Ahumada, 2017; Venerus and Cedrola, 2017; CEPAL, 2018; Carvache-Franco et 50 al., 2019; SROCC Section 5.4 Bindoff et al., 2019). There is high confidence that CSA ocean and coastal 51 ecosystems are already impacted by climate change (Figure 12.9, 12.10; Table SM12.3; Section 3.4; , 52 Section 5.4 in SROCC, Bindoff et al., 2019), and highly sensitive to non-climate stressors (Figure 12.8; 53 Table SM12.3; Section 3.4). Projections for CSA ocean and coastal ecosystems alert about significant and 54 negative impacts (high confidence) which include major loss of ecosystem structure and functionality, 55 changes in the distributional range of several species and ecosystems, major mortality rates, and increasing 56
ACCEPTED VERSIO
N
SUBJECT TO FIN
AL EDITS
FINAL DRAFT Chapter 12 IPCC WGII Sixth Assessment Report
Do Not Cite, Quote or Distribute 12-54 Total pages: 181
number of coral bleaching events (Figure 12.9; Figure 12.10; Table SM12.3; Section 3.4; SROCC Sections 1 5.3, 5.4, Bindoff et al., 2019). 2 3 CSA subregions are highly dependent on ocean and coastal ecosystems, and thus vulnerable to climate 4 change (FAO, 2018). Fisheries and aquaculture contribute significantly to food security and livelihoods by 5 creating employment (more than two million people), income and economic growth for the region (Section 6 3.5; FAO, 2018) (). More than 45% of the total fisheries in CSA are based on marine products 7 (CEPALSTAT, 2019). Peru, Chile, Argentina and Ecuador are among the 15 countries with the largest 8 marine capture production worldwide (Gutiérrez et al., 2016a; FAO, 2018; Vannuccini et al., 2018), while 9 more than 90% of the hydrological resources produced by aquaculture in CSA have a marine origin 10 (CEPALSTAT, 2019). There is high confidence about important current and future impacts of climate 11 change hazards in marine resources subjected to fisheries, however there is low evidence about the impacts 12 on regional economies (Figure 12.9, 12.10; Table SM12.3). 13 14 12.5.2.1 Adaptation measures and strategies applied on oceans and coasts of CSA 15 16 Similar to those pointed by WGII AR5 Chapter 27 (Magrin et al., 2014) and Chapter 3 (Section 3.5; Section 17 3.6.2; Box SLR in Chapter 3), adaptation strategies in ocean and coastal ecosystems in CSA are still focused 18 on the ecosystem protection and restoration, and the sustainable use of marine resources (high confidence). 19 There is low evidence about how coastal urban areas and touristic settlements of CSA countries are adapting 20 to SLR and extreme events (Calil et al., 2017; Villamizar et al., 2017). Some of this strategies include 21 planned relocation (Dannenberg et al., 2019) and the use of grey infrastructures as seawalls and bulkheads 22 (Silva et al., 2014; Isla et al., 2018) . 23 24 There is medium confidence that Ecosystem-based Adaptation (EbA) is the main strategy used in CSA coral 25 reefs ecosystems. The set of strategies applied include the protection, restoration (e.g., coral gardening, larval 26 propagation), and conservation of coral reefs areas through the application of the spatial ocean zoning 27 schemes such as Marine Protected Areas (MPAs), marine managed areas (MMAs), National Parks, Wildlife 28 Refuges, Special Zones of Marine Protection, Special Management Zones, Responsible Fishing Areas, and 29 the establishment of management plans with some level of participatory processes. These strategies are 30 complemented with actions that promote the development of research and education programs, recreational 31 and cultural activities, the use of community-based approaches, and the creation of national specific laws 32 (Graham, 2017) and the adhesion of international treaties (e.g., Convention on International Trade in 33 Endangered Species of Wild Fauna and Flora (CITIES), AGENDA 21, United Nations Convention on the 34 Law of the Sea (UNCLOS), Ramsar Convention on Wetlands of International Importance Especially as 35 Waterfowl Habitat) (Cruz-Garcia and Peters, 2015; Gopal et al., 2015; Graham, 2017; Bayraktarov et al., 36 2020). 37 38 Adaptation measures in mangroves ecosystems are mainly focused on the application of EbA strategies (high 39 confidence). This measures include the application of restoration programs, the creation of management 40 plans (which also have significant co-benefits with mitigation (Section 3.6.2.1), and the establishment of 41 coastal protected areas, followed by the development of research activities, the creation of specific mangrove 42 policies through new laws and resolutions (e.g., Colombia) (Cvitanovic et al., 2014; Krause, 2014; Blanco-43 Libreros and Estrada-Urrea, 2015; Carter et al., 2015; Estrada et al., 2015; Ferreira and Lacerda, 2016; 44 Oliveira-Filho et al., 2016; Rodríguez-Rodríguez et al., 2016; Alvarado et al., 2017; Álvarez-León and 45 Álvarez Puerto, 2017; Baptiste et al., 2017; Borges et al., 2017; Jaramillo et al., 2018; Salazar et al., 2018; 46 Armenteras et al., 2019; Blanco-Libreros and Álvarez-León, 2019; Maretti et al., 2019; Ellison et al., 2020) 47 48 The use of territorial planning tools, the promotion of sustainable resource exploitation, the adherence to 49 certification schemes, and the implementation of management instruments such as Ecosystem-based 50 Management (EbM) followed by the use of an integrated coastal zone management, coastal marine spatial 51 planning, capacity building, ecological risk assessments have been the mains strategies used to ensure the 52 sustainability of marine resources subjected to fisheries across EEZs of CSA (high confidence) (Hellebrandt 53 et al., 2014; Gelcich et al., 2015; Singh-Renton and McIvor, 2015; Gutiérrez et al., 2016a; Karlsson and 54 Bryceson, 2016; Oyanedel et al., 2016; Debels et al., 2017; Isaac and Ferrari, 2017; Mariano Gutiérrez et al., 55 2017; Barragán and Lazo, 2018; Bertrand et al., 2018; Lluch-Cota et al., 2018; Guerrero-Gatica et al., 2020). 56
ACCEPTED VERSIO
N
SUBJECT TO FIN
AL EDITS
FINAL DRAFT Chapter 12 IPCC WGII Sixth Assessment Report
Do Not Cite, Quote or Distribute 12-55 Total pages: 181
Other strategies include the application of local regulations (e.g., closed seasons) (Fontoura et al., 2016), and 1 the use of participative instances (Hellebrandt et al., 2014; Arroyo Mina et al., 2016; Matera, 2016). 2 3 12.5.2.2 Adaptation success in ocean and coastal ecosystems of CSA 4 5 There is low evidence about how the strategies and actions taken and implemented in ocean and coastal 6 systems of CSA have contributed to advance in the protection and conservation of ocean and coastal 7 ecosystems. However, some important advances are visible in Colombian Pacific areas with coral reefs (new 8 conservation plans, research monitoring and conservation practices) (low confidence) (Cruz-Garcia and 9 Peters, 2015; Alvarado et al., 2017; Bayraktarov et al., 2020). In Panama, actions taken have allowed the 10 protection of a high number of marine areas with coral reefs, as well as the incorporation of management 11 approaches that include several sectors such as fisheries, tourism, coral protection and coral conservation 12 (low confidence) (Alvarado et al., 2017). In the case of Costa Rica, 80% of coral habitats are located inside 13 of MPAs, multiple research coral-related activities have been performed, and several training activities have 14 favoured the engagement of the local community in their protection against climate and non-climate hazards 15 (low confidence) (Alvarado et al., 2017). 16 17 There is low evidence of how the incorporation of mangroves as Ramsar sites, the reforms of legislations 18 (e.g., fines and stronger regulations), and the creation of reserves and private protection initiatives (e.g., 19 Belize Association of Private Protected Areas BAPPA), and capacity-building projects or new educational 20 programs have promoted the protection of mangroves in CSA countries such as Honduras, Guatemala and 21 Belize (Cvitanovic et al., 2014; Carter et al., 2015; Ellison et al., 2020). In Brazil, between 75–84% of 22 mangroves are under some level of protection which has improved the forest structures, and multiple 23 research programs (e.g., Mangrove Dynamics and Management, MADAM, and ‘GEF-Mangle’) have been 24 developed (medium confidence) (Krause, 2014; Medeiros et al., 2014; Estrada et al., 2015; Ferreira and 25 Lacerda, 2016; Oliveira-Filho et al., 2016; Borges et al., 2017; Maretti et al., 2019; Strassburg et al., 2019). 26 In Colombia, research projects (e.g., Mangroves of Colombia Projects, MCP), the installation of a 27 geographic information system for mangroves (e.g., SIGMA Sistema de Información para la Gestión de los 28 Manglares en Colombia), surveillance monitoring plans (e.g., EGRETTA Herramientas para el Control y 29 Vigilancia de los Manglares), and the establishment of protected areas have contributed to decrease loss of 30 the mangrove forest (high confidence) (Blanco-Libreros and Estrada-Urrea, 2015; Rodríguez-Rodríguez et 31 al., 2016; Álvarez-León and Álvarez Puerto, 2017; Baptiste et al., 2017; Jaramillo et al., 2018; Salazar et al., 32 2018; Armenteras et al., 2019; Blanco-Libreros and Álvarez-León, 2019). 33 34 There is low evidence whether the establishment of MPAs and the creation of legal instruments have allowed 35 the development of new research activities have increased the environmental awareness, decreased the illegal 36 extraction, and improved the local coordination which have promoted the sustainable use of marine 37 resources, and improved the community-government cooperation in marine ecosystems (Alvarado et al., 38 2017). The experience in countries like Chile demonstrates the importance of implementing robust 39 management plans that guarantee the protection objectives and the sustainability through the implementation 40 of EbA measures such as MPAs (Petit et al., 2018). 41 42 There is low confidence about how measures adopted are ensuring the sustainability of marine resources 43 subjected to fisheries. In Peru, the industrial fishery follows an adaptive management approach (i.e., stock 44 assessments, catch limits), while in Chile, the small-scale fishery of benthic-demersal resources is managed 45 through the granting of exclusive territorial use rights (called TURFS) with established quotas defined by the 46 central authority (Bertrand et al., 2018). In addition, MPAs in Chile are playing a key role in climate change 47 adaptation for fisheries (medium confidence) (Gelcich et al., 2015; Petit et al., 2018), and an increasing 48 amount of funds have been invested in initiatives to reduce the vulnerability of fishery and aquaculture 49 sectors to climate change (OECD, 2017). Since 2016, Argentina has been developing a strategy to implement 50 EbM on fisheries with support from the Global Environment Facility program (GEF). Also, Argentina and 51 Chile, are promoting the local consumption of seafood and the certification of its fishery products (OECD, 52 2017), while Brazil and Chile have advanced in their actions to climate change through the development of 53 new research studies and methodologies incorporating research institutions (Nagy et al., 2015). Uruguay is 54 incorporating stakeholders in their climate change adaptation strategies (low confidence) (Nagy et al., 2015), 55 while Colombia is supporting the capacity building of fishers promoting livelihood diversification to 56 increase the resilience of the sector (medium confidence: medium evidence, high agreement) (Hellebrandt et 57
ACCEPTED VERSIO
N
SUBJECT TO FIN
AL EDITS
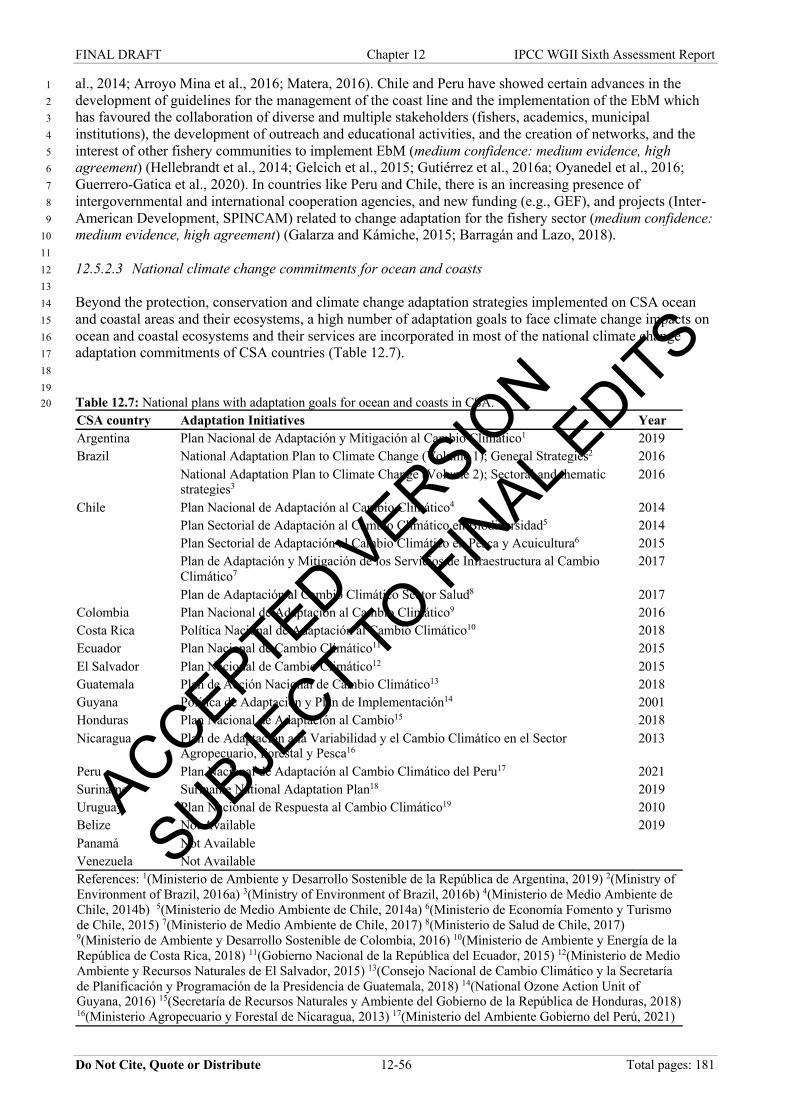
FINAL DRAFT Chapter 12 IPCC WGII Sixth Assessment Report
Do Not Cite, Quote or Distribute 12-56 Total pages: 181
al., 2014; Arroyo Mina et al., 2016; Matera, 2016). Chile and Peru have showed certain advances in the 1 development of guidelines for the management of the coast line and the implementation of the EbM which 2 has favoured the collaboration of diverse and multiple stakeholders (fishers, academics, municipal 3 institutions), the development of outreach and educational activities, and the creation of networks, and the 4 interest of other fishery communities to implement EbM (medium confidence: medium evidence, high 5 agreement) (Hellebrandt et al., 2014; Gelcich et al., 2015; Gutiérrez et al., 2016a; Oyanedel et al., 2016; 6 Guerrero-Gatica et al., 2020). In countries like Peru and Chile, there is an increasing presence of 7 intergovernmental and international cooperation agencies, and new funding (e.g., GEF), and projects (Inter-8 American Development, SPINCAM) related to change adaptation for the fishery sector (medium confidence: 9 medium evidence, high agreement) (Galarza and Kámiche, 2015; Barragán and Lazo, 2018). 10 11 12.5.2.3 National climate change commitments for ocean and coasts 12 13 Beyond the protection, conservation and climate change adaptation strategies implemented on CSA ocean 14 and coastal areas and their ecosystems, a high number of adaptation goals to face climate change impacts on 15 ocean and coastal ecosystems and their services are incorporated in most of the national climate change 16 adaptation commitments of CSA countries (Table 12.7). 17 18 19 Table 12.7: National plans with adaptation goals for ocean and coasts in CSA. 20
CSA country Adaptation Initiatives Year Argentina Plan Nacional de Adaptación y Mitigación al Cambio Climático1 2019 Brazil National Adaptation Plan to Climate Change (Volume 1); General Strategies2 2016 National Adaptation Plan to Climate Change (Volume 2); Sectoral and thematic
strategies3 2016
Chile Plan Nacional de Adaptación al Cambio Climático4 2014 Plan Sectorial de Adaptación al Cambio Climático en Biodiversidad5 2014 Plan Sectorial de Adaptación al Cambio Climático en Pesca y Acuicultura6 2015 Plan de Adaptación y Mitigación de los Servicios de Infraestructura al Cambio
Climático7 2017
Plan de Adaptación al Cambio Climático Sector Salud8 2017 Colombia Plan Nacional de Adaptación al Cambio Climático9 2016 Costa Rica Política Nacional de Adaptación al Cambio Climático10 2018 Ecuador Plan Nacional de Cambio Climático11 2015 El Salvador Plan Nacional de Cambio Climático12 2015 Guatemala Plan de Acción Nacional de Cambio Climático13 2018 Guyana Política de Adaptación y Plan de Implementación14 2001 Honduras Plan Nacional de Adaptación al Cambio15 2018 Nicaragua Plan de Adaptación a la Variabilidad y el Cambio Climático en el Sector
Agropecuario, Forestal y Pesca16 2013
Peru Plan Nacional de Adaptación al Cambio Climático del Peru17 2021 Suriname Suriname National Adaptation Plan18 2019 Uruguay Plan Nacional de Respuesta al Cambio Climático19 2010 Belize Not Available 2019 Panamá Not Available Venezuela Not Available References: 1(Ministerio de Ambiente y Desarrollo Sostenible de la República de Argentina, 2019) 2(Ministry of Environment of Brazil, 2016a) 3(Ministry of Environment of Brazil, 2016b) 4(Ministerio de Medio Ambiente de Chile, 2014b) 5(Ministerio de Medio Ambiente de Chile, 2014a) 6(Ministerio de Economía Fomento y Turismo de Chile, 2015) 7(Ministerio de Medio Ambiente de Chile, 2017) 8(Ministerio de Salud de Chile, 2017) 9(Ministerio de Ambiente y Desarrollo Sostenible de Colombia, 2016) 10(Ministerio de Ambiente y Energía de la República de Costa Rica, 2018) 11(Gobierno Nacional de la República del Ecuador, 2015) 12(Ministerio de Medio Ambiente y Recursos Naturales de El Salvador, 2015) 13(Consejo Nacional de Cambio Climático y la Secretaría de Planificación y Programación de la Presidencia de Guatemala, 2018) 14(National Ozone Action Unit of Guyana, 2016) 15(Secretaría de Recursos Naturales y Ambiente del Gobierno de la República de Honduras, 2018) 16(Ministerio Agropecuario y Forestal de Nicaragua, 2013) 17(Ministerio del Ambiente Gobierno del Perú, 2021)
ACCEPTED VERSIO
N
SUBJECT TO FIN
AL EDITS
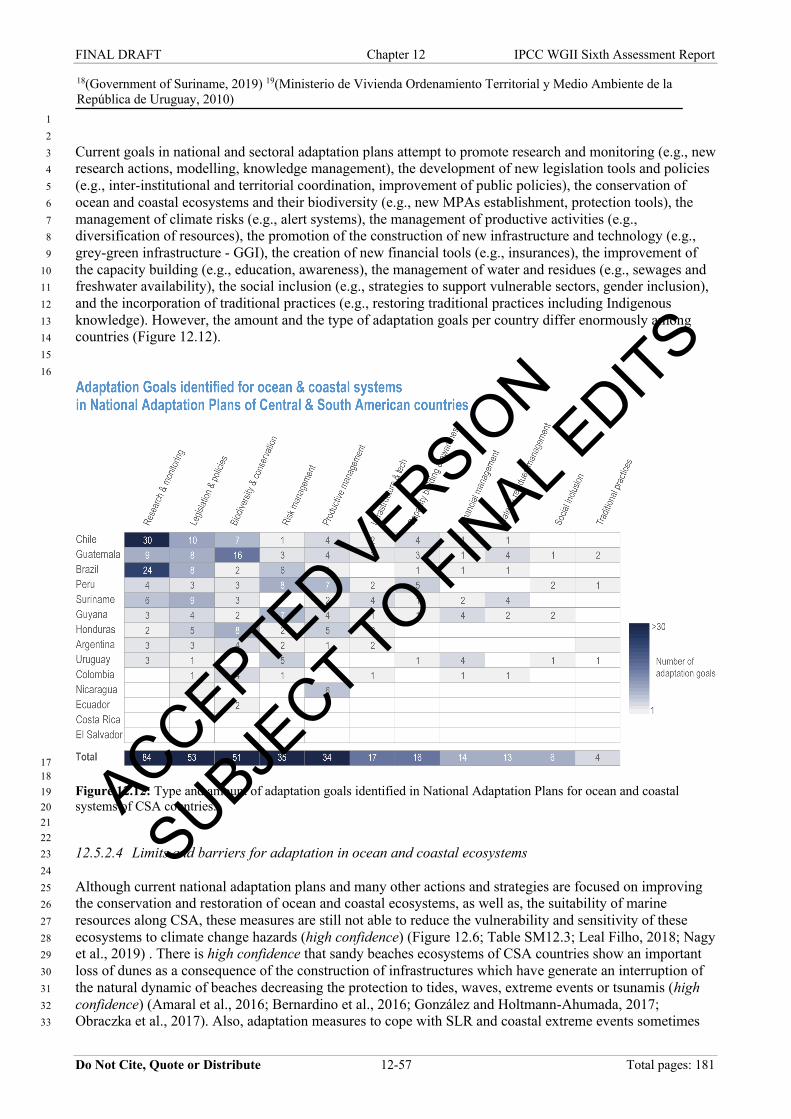
FINAL DRAFT Chapter 12 IPCC WGII Sixth Assessment Report
Do Not Cite, Quote or Distribute 12-57 Total pages: 181
18(Government of Suriname, 2019) 19(Ministerio de Vivienda Ordenamiento Territorial y Medio Ambiente de la República de Uruguay, 2010) 1 2 Current goals in national and sectoral adaptation plans attempt to promote research and monitoring (e.g., new 3 research actions, modelling, knowledge management), the development of new legislation tools and policies 4 (e.g., inter-institutional and territorial coordination, improvement of public policies), the conservation of 5 ocean and coastal ecosystems and their biodiversity (e.g., new MPAs establishment, protection tools), the 6 management of climate risks (e.g., alert systems), the management of productive activities (e.g., 7 diversification of resources), the promotion of the construction of new infrastructure and technology (e.g., 8 grey-green infrastructure - GGI), the creation of new financial tools (e.g., insurances), the improvement of 9 the capacity building (e.g., education, awareness), the management of water and residues (e.g., sewages and 10 freshwater availability), the social inclusion (e.g., strategies to support vulnerable sectors, gender inclusion), 11 and the incorporation of traditional practices (e.g., restoring traditional practices including Indigenous 12 knowledge). However, the amount and the type of adaptation goals per country differ enormously among 13 countries (Figure 12.12). 14 15 16
17 18
Figure 12.12: Type and amount of adaptation goals identified in National Adaptation Plans for ocean and coastal 19 systems of CSA countries. 20 21 22 12.5.2.4 Limits and barriers for adaptation in ocean and coastal ecosystems 23 24 Although current national adaptation plans and many other actions and strategies are focused on improving 25 the conservation and restoration of ocean and coastal ecosystems, as well as, the suitability of marine 26 resources along CSA, these measures are still not able to reduce the vulnerability and sensitivity of these 27 ecosystems to climate change hazards (high confidence) (Figure 12.6; Table SM12.3; Leal Filho, 2018; Nagy 28 et al., 2019) . There is high confidence that sandy beaches ecosystems of CSA countries show an important 29 loss of dunes as a consequence of the construction of infrastructures which have generate an interruption of 30 the natural dynamic of beaches decreasing the protection to tides, waves, extreme events or tsunamis (high 31 confidence) (Amaral et al., 2016; Bernardino et al., 2016; González and Holtmann-Ahumada, 2017; 32 Obraczka et al., 2017). Also, adaptation measures to cope with SLR and coastal extreme events sometimes 33
ACCEPTED VERSIO
N
SUBJECT TO FIN
AL EDITS
FINAL DRAFT Chapter 12 IPCC WGII Sixth Assessment Report
Do Not Cite, Quote or Distribute 12-58 Total pages: 181
fail as they exacerbate coastal erosion and damage (medium confidence: medium evidence, high agreement) 1 (Spalding et al., 2014; Lins-de-Barros and Parente-Ribeiro, 2018). There is medium evidence but high 2 agreement that the most barriers limiting the success of adaptation strategies in ocean and coastal systems in 3 CSA are due to the lack of coordination (e.g., absence of participatory processes, overlapping among fishing 4 and protection activities), the lack of knowledge (e.g., poor monitoring, poor control and surveillance, no 5 long-term studies), lack of adequate metrics for evaluating adaptation actions informing decision-makers 6 hinder the continuity and adjustment of measures, weak governance (e.g., perverse incentives, resource 7 overexploitation, conflicts), lack of financial resources and long-term commitments (e.g., crisis, lack of 8 budgets, market fluctuations), weak policies, cultural constraints, poverty, low flexibility, lack of awareness 9 of climate risks, and lack of engagement by stakeholders (Leal Filho, 2018; Nagy et al., 2019; Moreno et al., 10 2020b; Aburto et al., 2021). 11 12 Some important limits and barriers have been detected for productive systems such as fisheries and tourism 13 in CSA (medium confidence: medium evidence, high agreement). Brazilian major fisheries management do 14 not follow an ecosystem approach, although some small-scale fisheries apply a precautionary approach 15 (Singh-Renton and McIvor, 2015). The management of Peruvian artisanal (medium and small-scale 16 fisheries) are minimal with an important lack of regulations, control, and management actions (Bertrand et 17 al., 2018). In Argentina, marine recreational fisheries have been largely unregulated with a lack of 18 monitoring programs which have contributed to the overexploitation of some key coastal stocks (Venerus 19 and Cedrola, 2017). Moreover, the participation of women fishers in CSA is not equally considered being 20 excluded from the decision-making processes (FAO, 2016b; Bruguere and Williams, 2017). Due to the lack 21 of monitoring programs, it is unknown how this tourism industry will respond to long-term changes driven 22 by climate change (Weatherdon et al., 2016). 23 24 12.5.2.5 Challenge and Opportunities 25 26 There is low evidence and high agreement that empower the local stakeholders (e.g., multilateral fisheries 27 agreements) improve the public awareness and simplify regulations and increase the flexibility and 28 sustainability of marine resources subjected to fisheries under future scenarios (Weatherdon et al., 2016; 29 Kalikoski et al., 2019). Ecosystem-Based Fishery Management (EBFM) arises as a suitable tool to minimize 30 the risk to climate change, avoid the degradation of the ecosystems and its services (Gullestad et al., 2017) 31 and maintain the long-term socioeconomic benefits when include climate complexity and the relationships 32 among species within the ecological systems (Long et al., 2015). There is high confidence that EbA is more 33 successful and feasible than hard coastal defences for the protection, management and restoration of ocean 34 and coastal ecosystems and their resources (Spalding et al., 2014; González and Holtmann-Ahumada, 2017; 35 Scarano, 2017). 36 37 There is high confidence that ecological and social resilience is improved by the presence of adequate 38 metrics evaluating adaptation measures that allow dynamic changes, increasing basic research and climate 39 data (Moreno et al., 2020b), the existence of early warning systems, improved local institutions, the 40 construction of adequate infrastructure, major funding for capacity building, and the enhanced engagement 41 and empowerment of women (FAO, 2016b; Harper et al., 2017; Frangoudes and Gerrard, 2018; Gallardo-42 Fernández and Saunders, 2018; Leal Filho, 2018). 43 44 12.5.3 Water 45 46 CSA is one of the regions most affected by current and future hydrological risks to water security with an 47 increasing number of vulnerable people depending on water from mountain (high confidence) (Sections 4.3, 48 4.4, 4.5; Immerzeel et al., 2020; Viviroli et al., 2020; WWAP, 2020). Adaptation to changing water 49 availability is therefore a priority, but most efforts are documented only in the grey literature (e.g., 50 governmental documents, project reports) with highly variable standards of quality and evidence. Most of the 51 documented adaptation initiatives are in an early planning or implementation stage and evidence on 52 successful outcomes is quite limited (Berrang-Ford et al., 2021). However, the growing number of adaptation 53 initiatives across the CSA region has contributed to improved understanding of complex interlinkages of 54 climate change, human vulnerabilities, local policies, and feasible adaptation approaches (McDowell et al., 55 2019). 56 57
ACCEPTED VERSIO
N
SUBJECT TO FIN
AL EDITS
FINAL DRAFT Chapter 12 IPCC WGII Sixth Assessment Report
Do Not Cite, Quote or Distribute 12-59 Total pages: 181
12.5.3.1 Challenges and opportunities 1 2 In several regions of CSA, water scarcity is a serious challenge to local livelihoods and economic activities. 3 Particularly (seasonally) dry regions, partly with large populations and increasing water demand, exhibit 4 major water stress. These include the dry corridor in CA, coastal areas of Peru (SWS) and Northern Chile 5 (SWS), the Bolivian-Peruvian Altiplano (NWS, SAM), the Dry Andes of Central Chile (SWS),Western 6 Argentina and Chaco in Northwest Paraguay (SES), and Sertão in Northeast Brazil (NES) (high confidence) 7 (Kummu et al., 2016; Mekonnen and Hoekstra, 2016; Schoolmeester et al., 2018). In NWS and SWS, 8 downstream areas are increasingly affected by decreasing and unreliable river runoff due to rapid glacier 9 shrinkage (high confidence) (Table SM12.6; Carey et al., 2014; Drenkhan et al., 2015; Buytaert et al., 2017). 10 Many regions in CSA rely heavily on hydroelectric energy, and as a result of rising energy demand, 11 hydropower capacity is constantly extended (Schoolmeester et al., 2018). Worldwide, SA features the 12 second-fastest growth with about 5.2 GW additional annual capacity installed in 2019 (IHA, 2020). This 13 development requires additional water storage options, which entail the construction of large dams and 14 reservoirs with important social-ecological implications. River fragmentation and corresponding loss of 15 habitat connectivity due to dam constructions have been described for e.g., the NSA, SAM, NES and SES 16 (high confidence) (Grill et al., 2015; Anderson et al., 2018a) with important implications for freshwater 17 biota, such as fish migration (medium confidence) (Pelicice et al., 2015; Herrera-R et al., 2020). Furthermore, 18 examples in e.g., the NWS (Carey et al., 2012; Duarte-Abadía et al., 2015; Hommes and Boelens, 2018) and 19 SWS (Muñoz et al., 2019b) showcase unresolved water-related conflicts between local villagers, peasant 20 communities, hydropower operators and governmental institutions in a context of distrust and lack of water 21 governance (high confidence). 22 23 Increasing water scarcity is also shaped by poor water quality, which has barely been assessed in CSA. 24 Declining water quality can be observed e.g., due to intense agricultural and industrial activities in SWS, 25 SES and SSA (medium confidence) (Mekonnen et al., 2015; Gomez et al., 2021), mining in Andean 26 headwaters (NWS, SWS and Western SAM) and tropical lowlands (Eastern SAM and NSA) (medium 27 confidence) (Bebbington et al., 2015 risk and climate resilience; Vuille et al., 2018), urban domestic use 28 (Desbureaux and Rodella, 2019), decreasing meltwater contribution (Milner et al., 2017) and acid rock 29 drainages from recently exposed glacial sediments (Santofimia et al., 2017; Vuille et al., 2018). The level of 30 water pollution is often exacerbated by missing water treatment infrastructure and low governance levels 31 (medium confidence) (Mekonnen et al., 2015) with considerable negative implications for human health 32 (Lizarralde Oliver and Ribeiro, 2016). 33 34 Water scarcity risks are projected to affect a growing number of people in the near and mid-term future in 35 view of growing water demand in most regions (medium confidence: medium evidence, high agreement) 36 (Veldkamp et al., 2017; Schoolmeester et al., 2018; Viviroli et al., 2020), expected precipitation reductions 37 in Western and Northern SAM and SWS (medium confidence: medium evidence, medium agreement) 38 (Neukom et al., 2015; Schoolmeester et al., 2018), substantial vanishing of glacier extent in NWS, SAM and 39 SWS (Table SM12.6; Rabatel et al., 2018; Vuille et al., 2018; Cuesta et al., 2019; Drenkhan et al., 2019), and 40 increasing evaporation rates in CA (medium confidence) (CEPAL, 2017). Furthermore, flood risk is a serious 41 concern (Arnell et al., 2016) and expected to increase especially in NWS, SAM, SES and SWS in the mid 42 and long-term future (high confidence) (Arnell and Gosling, 2016; Alfieri et al., 2017). 43 Risks of water scarcity and flood are threatening people unevenly across the region. In CSA, about 26% (130 44 million people) of the population have no access to safe drinking water and strong disparities prevail 45 regarding its spatial distribution, e.g., in Chile 99% of the population have access, compared to 50% in Peru, 46 73% in Colombia, 52% in Nicaragua or 56% in Guatemala (high confidence) (UNICEF and WHO, 2019). 47 Inequalities can be further exacerbated by unregulated or privately owned water rights and allocation 48 systems (e.g., in Chile) (Muñoz et al., 2020a). The most vulnerable people belong to low-income groups in 49 rural areas and informal settlements of large urban areas (high confidence) (WWAP, 2020). 50 51 Considerable uncertainties remain concerning future hydrological risks that strongly depend on the 52 respective pathways of human intervention, management, adaptation and socioeconomic development. The 53 combination of (seasonally) reduced water supply, growing water demand, declining water quality, 54 ecosystem deterioration and habitat loss, and low water governance could lead to increasing competition and 55 conflict associated with high economic losses (high confidence) (Vergara et al., 2007; Vuille et al., 2018; 56 Desbureaux and Rodella, 2019). This situation threatens human water security on the long term and poses an 57
ACCEPTED VERSIO
N
SUBJECT TO FIN
AL EDITS
FINAL DRAFT Chapter 12 IPCC WGII Sixth Assessment Report
Do Not Cite, Quote or Distribute 12-60 Total pages: 181
increasing risk to adaptation success in CSA (high confidence) (Drenkhan et al., 2015; Huggel et al., 2015b; 1 Urquiza and Billi, 2020a). 2 3 Important progress has been made on climate change and water management policies in combination with 4 more inclusive stakeholder processes. For instance, the implementation of NDCs in most countries of the 5 region provides an important baseline for improving water efficiency, quality and governance at multi-6 sectoral level, and thus long-term adaptation planning (UNEP, 2015). 7 8 12.5.3.2 Main concepts and approaches 9 10 Adaptation in the water sector includes a broad set of responses to improve and transform, among others, 11 water infrastructure, ecosystem functions, institutions, capacity building and knowledge production, habits 12 and culture, and local-national policies (Section 4.6). 13 14 Most adaptive water management approaches in CSA centre around extending the water supply side 15 including large infrastructure projects. However, 'hard path' interventions are now strongly contested due to 16 negative effects exacerbating local water conflicts (Carey et al., 2012; Boelens et al., 2019; Drenkhan et al., 17 2019), potentially leading to increasing water demand, vulnerabilities and water shortage risks (Di 18 Baldassarre et al., 2018), and, hence, limiting adaptive capacity (high confidence) (Ochoa-Tocachi et al., 19 2019). More integrated approaches focus on multi-use of water storage with shared stakeholder vision, 20 responsibilities, rights and costs, as well as risks and benefits, and often integrating water and risk 21 management (Branche, 2017; Haeberli et al., 2017; Drenkhan et al., 2019). In this chapter, a feasibility 22 assessment was carried out for six major dimensions of multi-use water storage for the entire CSA (see Table 23 12.11). While geophysical and economic aspects allow for the implementation of water storage projects with 24 multi-use approach, the institutional, social and environmental dimensions pose a major barrier (see Section 25 12.5.3). Further demand-oriented approaches focus on incentives for the reduction of water use through 26 changes in people’s habits, efficiency increase and smart water management (Gleick, 2002). These are 27 promoted in some regions, such as in CA and NWS (e.g., Colombia, Ecuador and Peru), to foster a 28 sustainable water culture (Bremer et al., 2016; Paerregaard et al., 2016). 29 30 Major attention has been put on nature-based solutions (NbS), i.e., catchment interventions that are inspired 31 and supported by nature and leverage natural processes and ecosystem services to contribute to the improved 32 management of water. NbS potentially enhances water infiltration, groundwater recharge and surface 33 storage, contributes to disaster risk reduction and can replace or complement grey (i.e., conventionally built) 34 infrastructure that is often socio-environmentally contested (WWAP, 2018). Some examples include the 35 reactivation of ancestral infiltration enhancement systems in the Peruvian Andes (NWS) (Ochoa-Tocachi et 36 al., 2019), the use of erosion control structures in the Bolivian Altiplano (SAM) (Hartman et al., 2016), and 37 the potential improvement of drinking water quality and flood risk reduction in urban areas of CSA (Tellman 38 et al., 2018, Section 12.5.5.3.2). Additionally, NbS in combination with ecosystem and community-based 39 adaptation potentially generate important co-benefits including increasing water security and the attenuation 40 of social conflicts in Chile (SWS) (Reid et al., 2018), water conservation in coastal Peru (NWS), and flood 41 protection in Guyana (NSA) (medium confidence: medium evidence, medium agreement) (Spencer et al., 42 2017). However, evaluation of implementation success of NbS is often hampered by limited evidence on 43 actual benefits (WWAP, 2018). 44 45 In recent years, the inclusion of Indigenous knowledge (IK) and local knowledge (LK) into current 46 adaptation baselines has gained increasing attention, particularly in regions with a high share of Indigenous 47 Peoples (NWS, SAN, SWS, NSA) (high confidence) (Reyes-García et al., 2016; Schoolmeester et al., 2018; 48 McDowell et al., 2019). One example is the adapted use of agrobiodiversity when dealing with more 49 frequent and intense tidal floods in the Amazon delta (NSA) (Vogt et al., 2016). In another context, IK and 50 LK have been considered for the evaluation of water scarcity and glacier lake outburst flood risks in Peru 51 (NWS) (Motschmann et al., 2020b). Additionally, local citizen science based initiatives (Buytaert et al., 52 2014; Tellman et al., 2016; Njue et al., 2019) can support the production of multiple knowledge with flexible 53 and extensive data collection. Important questions centre around how to integrate IK, LK and other types of 54 knowledge from the early planning stages on, to achieve enhanced or transformational adaptation building 55 on co-produced knowledge (Kates et al., 2012; Klenk et al., 2017). NbS combined with community 56
ACCEPTED VERSIO
N
SUBJECT TO FIN
AL EDITS
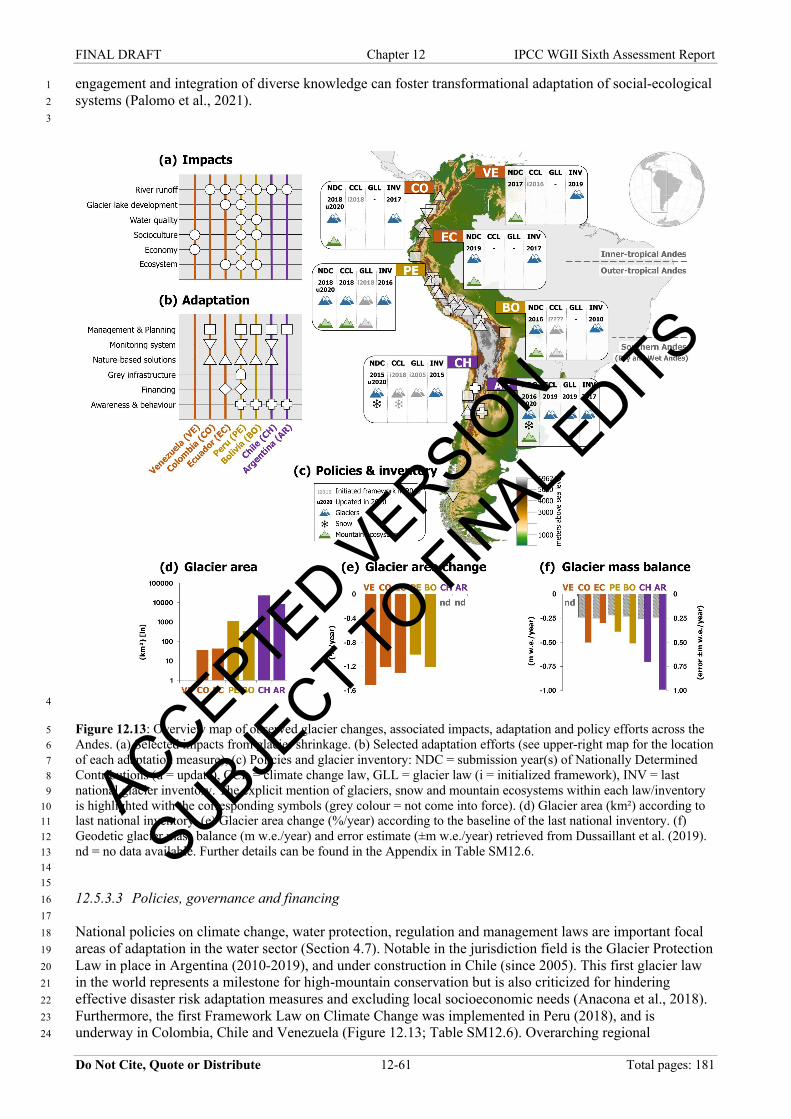
FINAL DRAFT Chapter 12 IPCC WGII Sixth Assessment Report
Do Not Cite, Quote or Distribute 12-61 Total pages: 181
engagement and integration of diverse knowledge can foster transformational adaptation of social-ecological 1 systems (Palomo et al., 2021). 2 3
4
Figure 12.13: Overview map of observed glacier changes, associated impacts, adaptation and policy efforts across the 5 Andes. (a) Selected impacts from glacier shrinkage. (b) Selected adaptation efforts (see upper-right map for the location 6 of each adaptation measure), (c) Policies and glacier inventory: NDC = submission year(s) of Nationally Determined 7 Contributions (u = update), CCL = climate change law, GLL = glacier law (i = initialized framework), INV = last 8 national glacier inventory. The explicit mention of glaciers, snow and mountain ecosystems within each law/inventory 9 is highlighted with the corresponding symbols (grey colour = not come into force). (d) Glacier area (km²) according to 10 last national inventory. (e) Glacier area change (%/year) according to the baseline of the last national inventory. (f) 11 Geodetic glacier mass balance (m w.e./year) and error estimate (±m w.e./year) retrieved from Dussaillant et al. (2019). 12 nd = no data available. Further details can be found in the Appendix in Table SM12.6. 13 14 15 12.5.3.3 Policies, governance and financing 16 17 National policies on climate change, water protection, regulation and management laws are important focal 18 areas of adaptation in the water sector (Section 4.7). Notable in the jurisdiction field is the Glacier Protection 19 Law in place in Argentina (2010-2019), and under construction in Chile (since 2005). This first glacier law 20 in the world represents a milestone for high-mountain conservation but is also criticized for hindering 21 effective disaster risk adaptation measures and excluding local socioeconomic needs (Anacona et al., 2018). 22 Furthermore, the first Framework Law on Climate Change was implemented in Peru (2018), and is 23 underway in Colombia, Chile and Venezuela (Figure 12.13; Table SM12.6). Overarching regional 24
ACCEPTED VERSIO
N
SUBJECT TO FIN
AL EDITS
FINAL DRAFT Chapter 12 IPCC WGII Sixth Assessment Report
Do Not Cite, Quote or Distribute 12-62 Total pages: 181
institutions (e.g., OAS (2016)) and most countries in CSA promote a move towards more integrative and 1 sustainable management of water resources through new legislations and financing mechanisms. For 2 instance, new water laws including principles of Integrated Water Resources Management (IWRM) have 3 entered into force, e.g., in Nicaragua (2007), Peru (2009), Ecuador (2014) and Costa Rica (2014) or are 4 underway, such as in Colombia (since 2009). However, current realities in all regions show major challenges 5 in implementing IWRM mechanisms and policies, related but not limited to political and institutional 6 instabilities, governance structures, fragmented service provision, lack of economies of scale and scope, 7 corruption and social conflicts (high confidence) (WWAP, 2020). 8 9 Many water-related conflicts in CSA are rooted in inequitable water governance that excludes water users 10 from decisions on water allocation (high confidence) (Drenkhan et al., 2015; Vuille et al., 2018). In turn, 11 inclusive water regimes leverage long-term adaptation planning. These have been addressed in some national 12 strategies, such as in Brazil (Ministry of Environment of Brazil, 2016a). At the local level, a decentralized 13 and participatory bottom-up water governance model was induced by civil society and research institutions 14 to foster rainwater harvesting technologies reducing drought risk in semi-arid Brazil (NES) (Lindoso et al., 15 2018). 16 17 Water fund programs can generate important co-benefits for Sustainable Development contributing to 18 improved governance and conservation of watershed systems in CSA. Nevertheless, only a few experiences 19 have been evaluated as successful due to insufficient implementation, low decision-making of some 20 stakeholder groups and poor evidence-based approaches (medium confidence) (Bremer et al., 2016; Leisher 21 et al., 2019). Furthermore, financing mechanisms that produce incentives for sustainable water management 22 have been promoted, tested or implemented. Payments for Ecosystem Services (PES) for water provision 23 represent such an example and have been implemented across CSA since the 1990s (Grima et al., 2016). 24 25 Only about 50–70% of required financial resources are currently allocated per year to meet the national 26 targets in the water, sanitation and hygiene (WASH) sector for the Sustainable Development Agenda (SDG 27 6) in several regions of CSA. This share drops down to less than 50% in NSA (Venezuela) and SES 28 (Argentina, Uruguay, Paraguay), except for Panama in CA allocating more than 75% of required financial 29 resources. For the implementation of NbS, evidence suggests that the overall expenditure remains well below 30 1% of total investment in water resources management infrastructure (WWAP, 2018). These funding deficits 31 pose important limitations for future water provision, adaptation to changing water resources, and the 32 achievement of the SDGs by 2030 (high confidence) (WHO, 2017). 33 34 12.5.3.4 Successful adaptation and limitations 35 36 Although a growing body of adaptation initiatives exists for CSA, evidence on effectiveness is scarce. In 37 many parts of CSA the level of success of respective adaptation measures depends much on the governance 38 of projects and stakeholder-based processes and is closely related to their effectiveness, efficiency, social 39 equity and socio-political legitimacy (high confidence) (Adger et al., 2005; Rasmussen, 2016b; Moulton et 40 al., 2021). Several Payments for Ecosystem Services experiences across CSA have been described as 41 successful measures for watershed conservation and adaptation (high confidence). An example of success 42 represents the Quito water fund in Ecuador which aims at improving the city’s water quality by integrating 43 public and private stakeholder interests with ecosystem conservation and local community development 44 since the 2000’s (Bremer et al., 2016; Grima et al., 2016) (case study 12.6.1). At the same time, in 45 Moyobamba in Peru the development of a watershed protection program was leveraged by a multi-46 stakeholder platform process that enabled deep social learning (Lindsay, 2018). In turn, initiatives that do not 47 consider the entire set of social-ecological dimensions and dynamics of adaptation or unintentionally 48 increase vulnerabilities of human or natural systems, are at risk to lead to reduced outcomes (McDowell et 49 al., 2021) or maladaptation (Reid et al., 2018; McDowell et al., 2019; Eriksen et al., 2021). However, 50 systematic assessments of maladaptation in the water sector have barely been provided for CSA. 51 52 In CSA, only limited information on limits of adaptation in relation to water is available, for instance on 53 possible path dependency of institutions and associated resistance to change (Barnett et al., 2015). Examples 54 of soft adaptation limits (i.e., options to avoid intolerable risks currently not available) include the lack of 55 trust and stakeholder flexibility, associated with unequal power relations that lead to reduced social learning, 56 and poor outcomes for improved water management, as reported in e.g., NWS (Lindsay, 2018). An example 57
ACCEPTED VERSIO
N
SUBJECT TO FIN
AL EDITS
FINAL DRAFT Chapter 12 IPCC WGII Sixth Assessment Report
Do Not Cite, Quote or Distribute 12-63 Total pages: 181
for hard adaptation limits (i.e., intolerable risks cannot be avoided) in the region is the loss of livelihoods and 1 cultural values associated with glacier shrinkage in NWS (Jurt et al., 2015). 2 3 Most barriers to advance adaptation in CSA correspond to soft limits associated with missing links of 4 science-society-policy processes, institutional fragilities, pronounced hierarchies, unequal power relations 5 and top-down water governance regimes (high confidence). One example is the abandonment of hydrological 6 long-term monitoring sites within tropical Andean ecosystems (paramo) in Venezuela (Rodríguez-Morales et 7 al., 2019) due to the lack of governmental support within a political crisis. In that regard, the collection and 8 availability of consistent hydroclimatic and socioeconomic data at adequate scales represent an important 9 challenge in CSA. Major adaptation barriers are furthermore reported from Central Chile in the context of a 10 mega-drought since 2010, related to socioeconomic characteristics and a deficient bottom-up approach to 11 public policy informing and development (Aldunce et al., 2017). These gaps could be bridged by 12 strengthening transdisciplinary approaches at the science-policy interface (Lillo-Ortega et al., 2019) with 13 blended bottom-up and top-down adaptation to include scientific knowledge with impact and scenario 14 assessments into local adaptation agendas (Huggel et al., 2015b). For instance, a new allocation rule for the 15 Laja reservoir in Southern Chile (SWS), based on consistent water balance modelling results, could inform 16 policy and water management and potentially improve local water management and reduce water conflicts 17 on the long term (Muñoz et al., 2019b). 18 19 12.5.4 Food, Fibre and other Ecosystem Products 20 21 The CSA region globally has the greatest agricultural land and water availability per capita. With 15% of the 22 world’s land area, it receives 29% of global precipitation and has 33% of globally available renewable 23 resources (Flachsbarth et al., 2015). Agricultural commodities (coffee, bananas, sugar, soybean, corn, 24 sugarcane, beef livestock) are some of the highest users of ecosystem resources such as land, water, nutrients 25 and technology. These exports have gained importance in the past two decades as international trade and 26 globalization of markets have shaped the global agri-food system. However continuous overuse on the 27 environment might account for resource depletion (deforestation, land degradation, nutrient depletion, 28 pollution), affecting the natural capital base. The effects of climate change on humans, via ecological 29 systems, exacerbate the impact related to depletion of ecosystem services (Scholes, 2016; IPBES, 2018b; 30 Castaneda Sanchez et al., 2019; Clerici et al., 2019; Tellman et al., 2020; Pacheco et al., 2021). 31 32 12.5.4.1 Challenges and opportunities 33 34 Even though there are large improvements in food availability in several regions, there is also a tendency of 35 a decline in food self-sufficiency in many countries (Porkka et al., 2013; Rolando et al., 2017). Drought 36 conditions in Central America and the Caribbean increased in line with climate model predictions (Herrera et 37 al., 2018a). The direct social and economic consequences for the sector are evident in Central America’s so-38 called Dry Corridor with a growing dependence on food imports (Porkka et al., 2013) and these degrees of 39 dependency make the region more vulnerable to price variability, climatic conditions (Bren d’Amour et al., 40 2016; ECLAC, 2018) and therefore, to food insecurity if adaptation actions are not taken (high confidence) 41 (Porkka et al., 2013; Bren d’Amour et al., 2016; López Feldman and Hernández Cortés, 2016; Eitzinger et 42 al., 2017; Imbach et al., 2017; Lachaud et al., 2017; Harvey et al., 2018; Niles and Salerno, 2018; del Pozo et 43 al., 2019; Alpízar et al., 2020; Anaya et al., 2020). 44 45 Given these circumstances, some regions in CSA (Andes region and Central America) will just meet, or fall 46 below, the critical food supply/demand ratio for their population (Bacon et al., 2014; Barbier and Hochard, 47 2018b). Meanwhile, the more temperate part of South America in the south is projected to have agricultural 48 production surplus (low confidence) (Webb et al., 2016; Prager et al., 2020). The challenge for this region 49 will be to retain the ability to feed and adequately nourish its internal population as well as making an 50 important contribution to the food supplies available to the rest of the world. 51 52 The access of agricultural products from the region to other markets might be conditioned on the adoption of 53 low-carbon agriculture measures. Achieving net-zero emissions while improving standards of living is 54 possible but requires developing transition policy frameworks to attain the target (Frank et al., 2019; 55 Mahlknecht et al., 2020; Cárdenas et al., 2021). 56 57
ACCEPTED VERSIO
N
SUBJECT TO FIN
AL EDITS
FINAL DRAFT Chapter 12 IPCC WGII Sixth Assessment Report
Do Not Cite, Quote or Distribute 12-64 Total pages: 181
12.5.4.2 Governance and barriers for adaptation 1 2 The governance of adaptation for CSA implies modifying agricultural, socio-economic and institutional 3 systems in response to and in preparation for actual or expected impacts of climate variability and change, to 4 reduce harmful effects and exploit beneficial opportunities (high confidence). CSA agriculture has a diversity 5 of systems and segments of producers. While small-scale farmers have a big contribution to food production 6 and food security, especially in developing economies, they face global policies oriented towards global 7 commodity markets (Knapp, 2017; Fernández et al., 2019). Climate action initiatives that consider CSA’s 8 high levels of poverty and inequality to reduce these pervasive problems are central for adapting the region 9 (Crumpler et al., 2020; Locatelli et al., 2020). 10 11 Since AR5, important advances at institutional level are observed based on the development and 12 implementation of national adaptation plans for the agriculture and forestry sector among countries. 13 Adapting to climate change entails the interaction of decision-makers, stakeholders, and institutions at 14 different scales of government from the local to the national. The Climate-Adapted Sustainable Agriculture 15 Strategy for the region of the Central American Integration System (EASAC) of the Central American 16 Agricultural Council of Ministers of Agriculture, constitutes a valuable example of how undertake climate 17 action in the agricultural sector, as a block of countries and in an intersectoral manner, to enhance results and 18 make better use of resources (IICA, 2019). 19 20 In Brazil, the Low Carbon Agriculture program (Programa ABC) funds practices for reducing GHG 21 emission in the sector (Government of Brazil, 2012), allocating about 15% of the total agriculture official 22 finance portfolio, although it faces challenges to advance (Souza Piao et al., 2021). Costa Rica offers an 23 example on how reforestation can help achieve Paris Agreement objectives. Reforestation through natural 24 regeneration on abandoned pastures boosted forest cover from 48% in 2005 to 53.4% in 2010 (Reid et al., 25 2019; Cárdenas et al., 2021). Some key success factors included a strong institutional context, fiscal and 26 financial incentives for reforestation, conservation measures such as payment for environmental services, 27 cattle ranch subsidy reform, and a historically strong enforcement and focus on land titles that favoured the 28 restoration of lands. Uruguay offers another example, with the farm sector contribution of 32.8% of all 29 exports and 73.8% of the country’s emissions, so decarbonisation is not just an environmental issue but an 30 economic competitiveness one as well. In the INDCs submitted to the UNFCCC in 2015, Uruguay set a 31 specific target for the agriculture sector to reduce enteric methane emissions intensity per kilogram of beef 32 (live-weight) by 33% to 46% in 2030 through improving efficiency of beef production by controlling the 33 grazing intensity to increase animal intake, reproductive efficiency, and daily weight gain (Picasso et al., 34 2014). 35 36 It is relevant to generate conditions for the development of sustainable agricultural practices in a frame 37 where factors associated with climate have become important for producers, given recent experiences of 38 drought and lack of water (high confidence) (Clarvis and Allan, 2014; Roco et al., 2016; Hurlbert and Gupta, 39 2017; Pérez-Escamilla et al., 2017; Cruz et al., 2018; Zúñiga et al., 2021). Solutions that consider relevant 40 drivers that have demonstrated positive effect in diffusion of adaptation strategies are more efficient (Table 41 12.8). Some conditions such as the promotion of education programs; participation in cooperatives; credit 42 access; land tenure security can help in this task. In the same line, in CSA some elements such as technology 43 and information access, and local knowledge, reinforce climate change adaptation (Khatri-Chhetri et al., 44 2019; Piggott-McKellar et al., 2019). As is stated in Table 12.8 barriers of different origin persist for climate 45 change adaptation in the region increasing vulnerability of farming systems and rural livelihoods. 46 47 Limited information regarding cost-benefit analyses of adaptation is available in the region as well as 48 avoiding maladaptation effects and promoting site-specific and dynamic adaptation options considering 49 available technologies (medium confidence) (Roco et al., 2017; Zavaleta et al., 2018; Ponce, 2020; Shapiro-50 Garza et al., 2020). 51 52 Climate Information Services has an important role in climate change adaptation and there is a recognized 53 gap between climate science and farmers (high confidence) (Vaughan et al., 2017; Loboguerrero et al., 2018; 54 Tall et al., 2018; Thornton et al., 2018; Ewbank et al., 2019). Such services should address the challenges of 55 ensuring that climate information and advisory services are relevant to the decisions of small‐holder and 56 family farmers, providing timely climate services access to remote rural communities with marginal 57
ACCEPTED VERSIO
N
SUBJECT TO FIN
AL EDITS
FINAL DRAFT Chapter 12 IPCC WGII Sixth Assessment Report
Do Not Cite, Quote or Distribute 12-65 Total pages: 181
infrastructure and ensuring that farmers own climate services and shape their design and delivery. An 1 interesting case facing this gap is the implementation of local technical agro-climatic committees in 2 Colombia which allow to share and to validate climatic and weather forecasts; and crop model results to 3 seasonal drought events (Loboguerrero et al., 2018). Another example is the web service, AdaptaBrasil-4 MCTI, forecasting the risk of climate change impact on strategic sectors (e.g., food, energy, water) in Brazil 5 (Government of Brazil and Ministry of Science Technology and Innovation Secretariat of Policies and 6 Programs, 2021). 7 8 Barriers to financial access are present in the region restricting effective adaptation to extreme weather 9 events (high confidence) (Chen et al., 2018; Fisher et al., 2019; Piggott-McKellar et al., 2019; Vidal Merino 10 et al., 2019; de Souza Filho et al., 2021). In 2014, the penetration rate of this type of insurance in the region 11 averaged 0.03% of GDP, and a few countries dominate the market (Brazil, Argentina). Beyond these three 12 countries, some initiatives also exist in Uruguay, Paraguay, Chile and Ecuador. In most Latin American and 13 Caribbean countries, the public sector plays an important role in providing insurance or reinsurance and 14 coexists with private sector companies (Cárdenas et al., 2021). Insurance protections represent a strategy to 15 transfer climate risk to protect the wellbeing of vulnerable small farmers and accelerate uptake (recovery) 16 after a climate-related extreme weather event. Lack of finance and proper infrastructure is compounded by 17 limited knowledge of sustainable farming practices and high rates of financial illiteracy (high confidence) 18 (Hurlbert and Gupta, 2017; Piggott-McKellar et al., 2019). 19 20 Insufficient access to digital services and technologies further widens the gap between the rural poor and 21 more urban populations of Latin America and the Caribbean (medium confidence: insufficient evidence, high 22 agreement). In turn, these factors compromise productivity and competitiveness. Support for this group can 23 be focused on both economic competitiveness and social development. Finally, to align identified adaptation 24 options as a priority for achieving future food security in the NDCs of CSA countries to mitigation 25 commitments, it will be essential to highlight synergies by generating evidence (national research) in relation 26 to progress towards increasing productivity, resilience and reducing GHG; and also demonstrating its added 27 value as a development initiative (Rudel et al., 2015 sustainable; Loboguerrero et al., 2019). 28 29 12.5.4.3 Adaptation options 30 31 In order to contextualize the adaptation options at the regional level, the majority of the NDC of the CSA 32 countries reported the observed and/or projected climate-related hazards: occurrence of droughts and floods 33 (80% of countries each), followed by storms (45%) and landslides (30%), as well as extreme heat, wildfire 34 and invasion by pests and non-native species in agriculture (25% each) (Crumpler et al., 2020). 35 36 Main adaptation options for climate change in the region include preventive measures against soil erosion; 37 climate-smart agriculture which provide a framework for synergies between adaptation, mitigation and 38 improved food security; climate information systems; land use planning; shifting plantations in high altitude 39 to avoid temperature increases and plagues; improved varieties of pastures and cattle (Lee et al., 2014; Jat et 40 al., 2016; Crumpler et al., 2020; Moreno et al., 2020a; Aragón et al., 2021). Agricultural technologies are not 41 necessarily changing, but the economic activity is shifting to accommodate increasing climate variation and 42 adapt to changes in water availability and ideal growing conditions (high confidence) as is observed in 43 Argentina, Colombia and Brazil (McMartin et al., 2018; Rolla et al., 2018; Sloat et al., 2020; Gori Maia et 44 al., 2021). Coffee plantations are moving further up mountain regions with the land at lower elevations 45 converted for other uses. In Brazil, crop modelling suggests the need for the development of new cultivars, 46 with a longer crop cycle and with higher tolerance to high temperatures, a necessary technological advance 47 for maize, an essential staple crop, to be produced in the future. Additionally, irrigation becomes essential for 48 sustaining productivity in adverse climate change scenarios in several regions of CSA (McMartin et al., 49 2018; Lyons, 2019; Reay, 2019). 50 51 Livestock production is for small farmers one of the main sources of protein and contributes to food security 52 (Rodríguez et al., 2016). The importance of this sub-sector in CSA, will continue to increase as the demand 53 for meat products does as well in the coming years, driven by growing incomes in the region (OECD and 54 FAO, 2019). However, the increase in animal production has been associated with land degradation, 55 triggered by the conversion of native vegetation to pastureland and aggravated by overgrazing and 56 abandoning of the degraded pastures (Baumann et al., 2017; ECLAC, 2018; Müller-Hansen et al., 2019). Sá 57
ACCEPTED VERSIO
N
SUBJECT TO FIN
AL EDITS
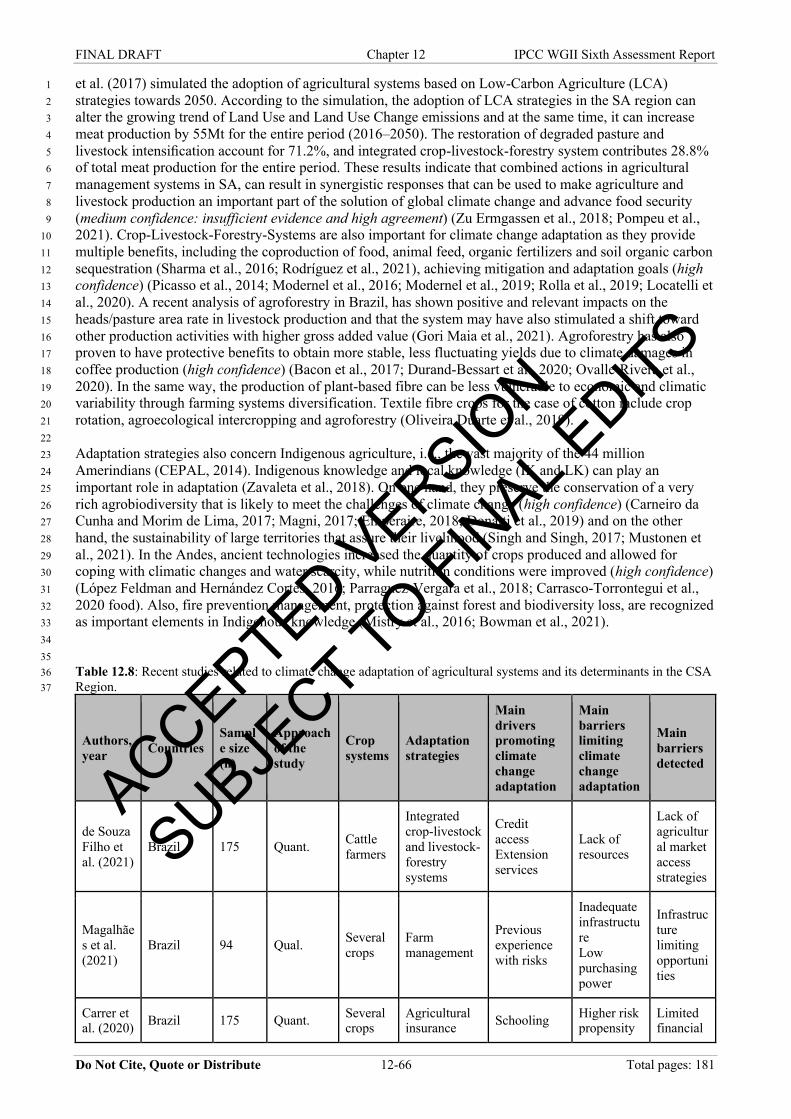
FINAL DRAFT Chapter 12 IPCC WGII Sixth Assessment Report
Do Not Cite, Quote or Distribute 12-66 Total pages: 181
et al. (2017) simulated the adoption of agricultural systems based on Low-Carbon Agriculture (LCA) 1 strategies towards 2050. According to the simulation, the adoption of LCA strategies in the SA region can 2 alter the growing trend of Land Use and Land Use Change emissions and at the same time, it can increase 3 meat production by 55Mt for the entire period (2016–2050). The restoration of degraded pasture and 4 livestock intensification account for 71.2%, and integrated crop-livestock-forestry system contributes 28.8% 5 of total meat production for the entire period. These results indicate that combined actions in agricultural 6 management systems in SA, can result in synergistic responses that can be used to make agriculture and 7 livestock production an important part of the solution of global climate change and advance food security 8 (medium confidence: insufficient evidence and high agreement) (Zu Ermgassen et al., 2018; Pompeu et al., 9 2021). Crop-Livestock-Forestry-Systems are also important for climate change adaptation as they provide 10 multiple benefits, including the coproduction of food, animal feed, organic fertilizers and soil organic carbon 11 sequestration (Sharma et al., 2016; Rodríguez et al., 2021), achieving mitigation and adaptation goals (high 12 confidence) (Picasso et al., 2014; Modernel et al., 2016; Modernel et al., 2019; Rolla et al., 2019; Locatelli et 13 al., 2020). A recent analysis of agroforestry in Brazil, has shown positive and relevant impacts on the 14 heads/pasture area rate in livestock production and that the system may have also stimulated a shift toward 15 other production activities with higher gross added value (Gori Maia et al., 2021). Agroforestry has also 16 proven to have protective benefits to obtain more stable, less fluctuating yields due to climate damages in 17 coffee production (high confidence) (Bacon et al., 2017; Durand-Bessart et al., 2020; Ovalle-Rivera et al., 18 2020). In the same way, the production of plant-based fibre can be less vulnerable to economic and climatic 19 variability through farming systems diversification. Textile fibre crops for the case of cotton include crop 20 rotation, agroecological intercropping and agroforestry (Oliveira Duarte et al., 2019). 21 22 Adaptation strategies also concern Indigenous agriculture, i.e., the vast majority of the 44 million 23 Amerindians (CEPAL, 2014). Indigenous knowledge and local knowledge (IK and LK) can play an 24 important role in adaptation (Zavaleta et al., 2018). On one hand, they preserve the conservation of a very 25 rich agrobiodiversity that is likely to meet the challenges of climate change (high confidence) (Carneiro da 26 Cunha and Morim de Lima, 2017; Magni, 2017; Emperaire, 2018; Donatti et al., 2019) and on the other 27 hand, the sustainability of large territories that assure their livelihood (Singh and Singh, 2017; Mustonen et 28 al., 2021). In the Andes, ancient technologies increased the quantity of crops produced and allowed for 29 coping with climatic changes and water scarcity, while nutrition conditions were improved (high confidence) 30 (López Feldman and Hernández Cortés, 2016; Parraguez-Vergara et al., 2018; Carrasco-Torrontegui et al., 31 2020 food). Also, fire prevention management, protection against forest and biodiversity loss, are recognized 32 as important elements in Indigenous knowledge (Mistry et al., 2016; Bowman et al., 2021). 33 34 35 Table 12.8: Recent studies related to climate change adaptation of agricultural systems and its determinants in the CSA 36 Region. 37
Authors, year Countries
Sample size (n)
Approach of the study
Crop systems
Adaptation strategies
Main drivers promoting climate change adaptation
Main barriers limiting climate change adaptation
Main barriers detected
de Souza Filho et al. (2021)
Brazil 175 Quant. Cattle farmers
Integrated crop-livestock and livestock-forestry systems
Credit access Extension services
Lack of resources
Lack of agricultural market access strategies
Magalhães et al. (2021)
Brazil 94 Qual. Several crops
Farm management
Previous experience with risks
Inadequate infrastructure Low purchasing power
Infrastructure limiting opportunities
Carrer et al. (2020) Brazil 175 Quant. Several
crops Agricultural insurance Schooling Higher risk
propensity Limited financial
ACCEPTED VERSIO
N
SUBJECT TO FIN
AL EDITS
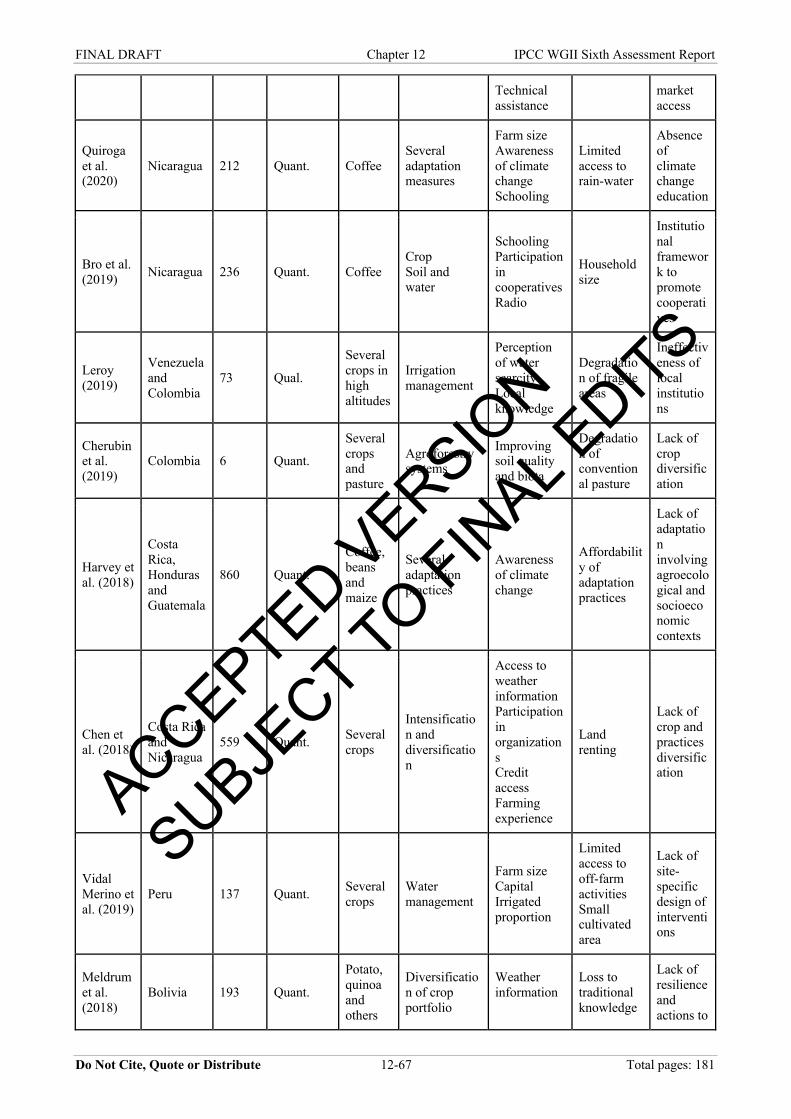
FINAL DRAFT Chapter 12 IPCC WGII Sixth Assessment Report
Do Not Cite, Quote or Distribute 12-67 Total pages: 181
Technical assistance
market access
Quiroga et al. (2020)
Nicaragua 212 Quant. Coffee Several adaptation measures
Farm size Awareness of climate change Schooling
Limited access to rain-water
Absence of climate change education
Bro et al. (2019) Nicaragua 236 Quant. Coffee
Crop Soil and water
Schooling Participation in cooperatives Radio
Household size
Institutional framework to promote cooperatives
Leroy (2019)
Venezuela and Colombia
73 Qual.
Several crops in high altitudes
Irrigation management
Perception of water scarcity Local knowledge
Degradation of fragile areas
Ineffectiveness of local institutions
Cherubin et al. (2019)
Colombia 6 Quant.
Several crops and pasture
Agroforestry systems
Improving soil quality and biota
Degradation of conventional pasture
Lack of crop diversification
Harvey et al. (2018)
Costa Rica, Honduras and Guatemala
860 Quant.
Coffee, beans and maize
Several adaptation practices
Awareness of climate change
Affordability of adaptation practices
Lack of adaptation involving agroecological and socioeconomic contexts
Chen et al. (2018)
Costa Rica and Nicaragua
559 Quant. Several crops
Intensification and diversification
Access to weather information Participation in organizations Credit access Farming experience
Land renting
Lack of crop and practices diversification
Vidal Merino et al. (2019)
Peru 137 Quant. Several crops
Water management
Farm size Capital Irrigated proportion
Limited access to off-farm activities Small cultivated area
Lack of site-specific design of interventions
Meldrum et al. (2018)
Bolivia 193 Quant.
Potato, quinoa and others
Diversification of crop portfolio
Weather information
Loss to traditional knowledge
Lack of resilience and actions to
ACCEPTED VERSIO
N
SUBJECT TO FIN
AL EDITS
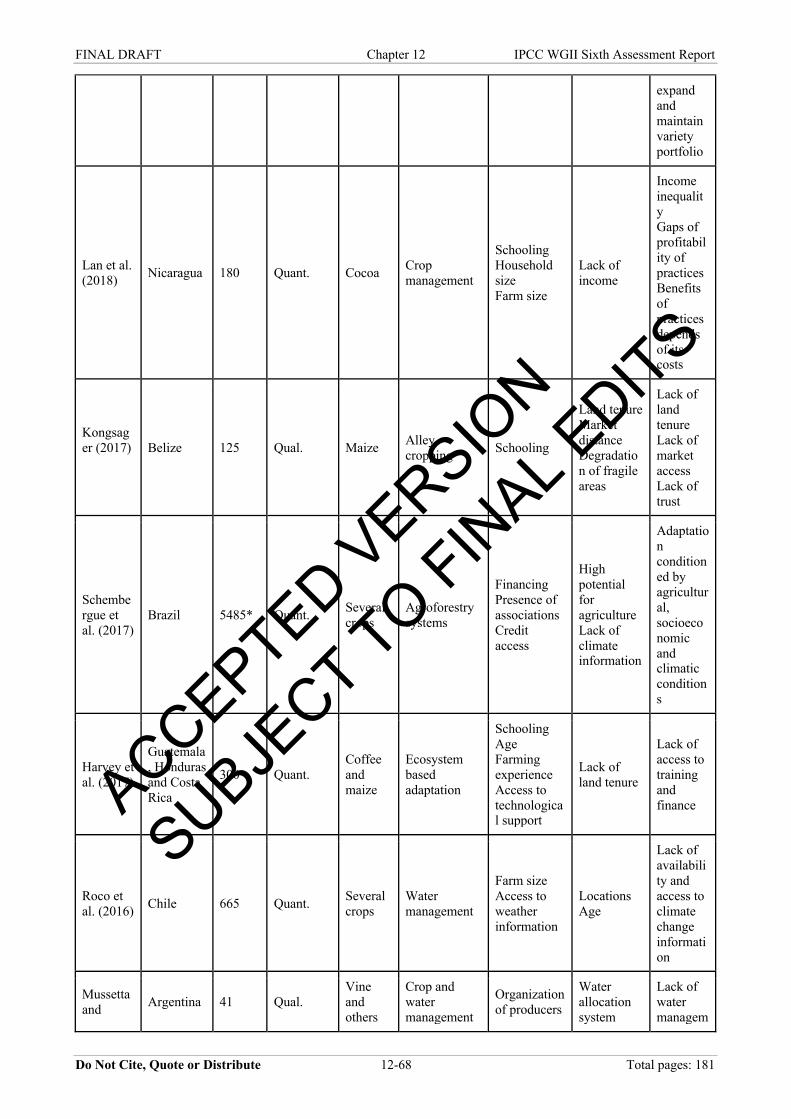
FINAL DRAFT Chapter 12 IPCC WGII Sixth Assessment Report
Do Not Cite, Quote or Distribute 12-68 Total pages: 181
expand and maintain variety portfolio
Lan et al. (2018) Nicaragua 180 Quant. Cocoa Crop
management
Schooling Household size Farm size
Lack of income
Income inequality Gaps of profitability of practices Benefits of practices depends of its costs
Kongsager (2017)
Belize 125 Qual. Maize Alley cropping Schooling
Land tenure Market distance Degradation of fragile areas
Lack of land tenure Lack of market access Lack of trust
Schembergue et al. (2017)
Brazil 5485* Quant. Several crops
Agroforestry systems
Financing Presence of associations Credit access
High potential for agriculture Lack of climate information
Adaptation conditioned by agricultural, socioeconomic and climatic conditions
Harvey et al. (2017)
Guatemala, Honduras and Costa Rica
300 Quant. Coffee and maize
Ecosystem based adaptation
Schooling Age Farming experience Access to technological support
Lack of land tenure
Lack of access to training and finance
Roco et al. (2016) Chile 665 Quant. Several
crops Water management
Farm size Access to weather information
Locations Age
Lack of availability and access to climate change information
Mussetta and Argentina 41 Qual.
Vine and others
Crop and water management
Organization of producers
Water allocation system
Lack of water managem
ACCEPTED VERSIO
N
SUBJECT TO FIN
AL EDITS
FINAL DRAFT Chapter 12 IPCC WGII Sixth Assessment Report
Do Not Cite, Quote or Distribute 12-69 Total pages: 181
Barrientos (2015)
Labour availability Knowledge and information access Technology access
ent and distribution strategies
Table Notes: 1 *: municipalities; Quant.: mainly quantitative; Qual.: mainly qualitative. 2 3 4 12.5.5 Cities, Settlements and Infrastructure 5 6 CSA is the second most urbanized region of the world, with 5 megacities and half of urban population in 129 7 secondary cities (UNDESA, 2019), huge metropolitan areas concentrated on the coast and an increasing 8 number of small cities by the sea (Barragán and de Andrés, 2016). Besides the many climatic events 9 threatening urban areas in the region (extreme heat, droughts, heavy storms, floods, landslides), cities by the 10 coast are also exposed to sea level rise (SLR) (Section 12.3; Figure 12.6; Dawson et al., 2018; Leal Filho et 11 al., 2018; Le, 2020). Main determinants of urban vulnerability assessed in the region are poor and unevenly 12 distributed infrastructure, housing deficits, poverty, informality and the occupation of risk areas, including 13 low elevation coastal zones (Section 12.3). Those features of urban systems increase the risks to health, 14 ecosystems and its services, water, food and energy supply (Section 12.4). Impacts of climate events on 15 urban water supply, drainage and sewer infrastructures are the most reported in the region (Section 12.3; 16 Figure 12.9). 17 18 12.5.5.1 Challenges and opportunities 19 20 Inequality, poverty and informality shaping cities in the region increase vulnerability to climate change (high 21 confidence) (Romero-Lankao et al., 2014; Rasch, 2017; Filho et al., 2019), and can hinder adaptation 22 (Section 12.5.7.1), while interventions addressing these social challenges and the existing development 23 deficits (e.g., build or improve infrastructure and housing applying climate-adapted patterns), can go hand in 24 hand with adaptation and mitigation (medium confidence: high agreement, medium evidence) (Section 25 12.5.7.3; Creutzig et al., 2016; Le, 2020; Satterthwaite et al., 2020). Over 20% of urban population in LAC 26 lives in slums and many in other forms of precarious and segregated neighbourhoods, settled in risk areas 27 and lacking infrastructure (Rasch, 2017; UN-Habitat, 2018; Rojas, 2019). This vulnerable condition is 28 boosted by unstable political and governmental institutions, which recurrently suffer from corruption, weak 29 governance and reduced capacity to finance adaptation (Rasch, 2016). Facing governance challenges by 30 including diverse stakeholders and encouraging and learning from community-based experiences has been 31 also an opportunity to improve adaptation strategies (Archer et al., 2014). The Regional Climate Change 32 Adaptation Plan of Santiago is an example of this (Krellenberg and Katrin, 2014). 33 34 12.5.5.2 Governance and Financing 35 36 Lack of a high multilevel and intersectoral governance capacity with strong multi-players horizontal and 37 vertical coordination and long-term support are limiting adaptation in the region (high confidence) 38 (Anguelovski et al., 2014; Bai et al., 2016; Chu et al., 2016; Schaller et al., 2016; Miranda Sara et al., 2017). 39 The ability to enrol stakeholders and include community based initiatives can be determinant for adaptation 40 success particularly considering its impact in the decision-making arena (high confidence) (Section 12.5.8.1; 41 Section 6.4; Anguelovski et al., 2014; Archer et al., 2014; Chu et al., 2017; Rosenzweig et al., 2018) . 42 43 Lima’s Climate Action Strategy is an example (Metropolitan Municipality of Lima, 2014). It was approved 44 after a participatory and consultative process with the technical group on climate change from the 45 Metropolitan Environmental Commission, focusing on the reduction of water vulnerabilities to drought and 46 heavy rain, on the basis of which 10 (out of 51 with Callao) Lima districts municipalities are developing and 47 starting to implement their adaptation measures (Foro Ciudades Para la Vida, 2021). In 2021 Lima 48 Municipality also approved its Local Climate Change Plan (Metropolitan Municipality of Lima, 2021) under 49 a similar process. The engagement of local players was central to spreading and mobilizing different types of 50
ACCEPTED VERSIO
N
SUBJECT TO FIN
AL EDITS
FINAL DRAFT Chapter 12 IPCC WGII Sixth Assessment Report
Do Not Cite, Quote or Distribute 12-70 Total pages: 181
knowledge and creating networks able to support adaptation (Section 12.6.3; Miranda Sara and Baud, 2014; 1 Miranda Sara et al., 2017) . The inclusive process is also a goal on the example of Chile Municipalities 2 Network Facing Climate Change (RedMuniCC) engaged in developing participatory strategic plans for 3 climate adaptation and mitigation (RedMuniCC, 2021). 4 5 New forms of financing and leadership focused on community-based approaches have been developed to 6 overcome the funding challenge and enable adaptation in the region (medium confidence: medium evidence, 7 medium agreement) (Castán Broto and Bulkeley, 2013; Archer et al., 2014; Paterson and Charles, 2019). 8 Also systems for measuring, reporting and verifying adaptation financing, as in Colombia (Guzmán et al., 9 2018), as much as national legislation geared to adaptation can help access funds. Peruvian Law on the 10 Retribution Mechanism of Eco-Systemic Services and Code (Miranda Sara and Baud, 2014; MINAM Peru, 11 2016) in addition to the Ley Marco de la Gestión y Prestación de los Servicios de Saneamiento and its Code 12 (Ministerio de Vivienda, 2017), allowed the potable water companies to add 1% to the tariff to guarantee 13 ecosystem services, water treatment and reuse with green infrastructure. Another 4% of tariffs go to develop 14 and implement adaptation plans and measures (Government of Peru, 2016). 15 16 12.5.5.3 Adaptation options in urban design and planning 17 18 Both the shape and activities of the city have an impact on carbon emissions, adaptation and mitigation 19 opportunities (high confidence) (Raven et al., 2018; Satterthwaite et al., 2018). Combining urgent measures, 20 strategic action (Chu et al., 2017) to long-term planning is central for a transformative adaptation and to 21 avoid maladaptation (Filho et al., 2019). Urban planning, considering climate risk assessments, and 22 regulation (e.g., land-use and building codes), including climate-adapted parameters, are central to 23 coordinate and foster private and public investments in adaptation, reducing risks related to the built 24 environment conditions (infrastructure and buildings) and the occupation of risk areas (e.g., threatened by 25 floods and landslides) (Rosenzweig et al., 2018). Lack of information at local scale, human resources and 26 clear liability for climate change response planning can limit adaptation (Aylett, 2015). 27 28 Strategic adaptation approaches have been adopted by many cities in dealing with the multilevel and 29 intersectoral complexity of urban systems, with gains in fostering leadership and facing the predominant 30 pattern of uneven urban development in the region (medium confidence: limited evidence, high agreement) 31 (Chu et al., 2017). Medellin’s metropolitan green belt, for example, focuses on problems such as irregular 32 settlements, inequality and poor governance, articulating programs and projects of the Municipality of 33 Medellin and the municipalities of the Vale do Aburra in a strategic long-term planning. Places with 34 informal and precarious settlements were aimed to be transformed with the belt’s integration areas: eco parks 35 and eco-gardens (Alcaldía de Medellín, 2012; Chu et al., 2017). 36 37 12.5.5.3.1 Housing, informality and risk areas 38 Informality and precariousness in housing is one of the most sensitive issues for adaptation in CSA cities 39 (medium confidence: medium evidence, high agreement) (Satterthwaite et al., 2018; UN-Habitat, 2018). 40 Housing deficit in 2009, as a regional baseline, estimated that 37% of households suffered from quantitative 41 or qualitative deficiencies, due to the high cost of housing and the incidence of poverty (Blanco Blanco et al., 42 2014; McTarnaghan et al., 2016; NU CEPAL et al., 2016; Vargas et al., 2018a; Rojas, 2019). 43 44 Policies and programs have been implemented accumulating good practices and reducing the percentage of 45 population in informal and precarious settlements (33.7% in 1990 to 21% in 2014) (NU CEPAL et al., 2016; 46 Satterthwaite et al., 2018; Teferi and Newman, 2018; UN-Habitat, 2018). Slum Upgrading and built-47 environment interventions (housing and infrastructure improvement and provision) in informal settlements 48 can enhance adaptation (high confidence) (Teferi and Newman, 2018; Núñez Collado and Wang, 2020; 49 Satterthwaite et al., 2020) while reducing floods, landslides and cascading impacts of storms, floods and 50 epidemics, as observed on the “incremental housing approach” in Quinta Monroy (Rojas, 2019) and the 51 “social urbanism” in Medellin (Garcia Ferrari et al., 2018). 52 53 The climate adaptation plans of several large CSA cities include efficient land use and occupation planning 54 and urban control systems (comprising regulation, monitoring), fostering interlocution with housing and 55 environmental policy (by means of intersectoral and multilevel governance), inhibiting and reducing the 56 occupation of risk areas (mainly flooding and landslides risks); increasing population density in areas already 57
ACCEPTED VERSIO
N
SUBJECT TO FIN
AL EDITS
FINAL DRAFT Chapter 12 IPCC WGII Sixth Assessment Report
Do Not Cite, Quote or Distribute 12-71 Total pages: 181
served by infrastructure; expanding slums urbanization and technical assistance programs for improvements 1 and expansion of social housing (high confidence) (Municipio del Distrito Metropolitano de Quito, 2020; 2 Prefeitura Municipal do Salvador, 2020; Municipalidad de Lima, 2021; Prefeitura da Cidade do Rio de 3 Janeiro, 2021; Prefeitura do Município de São Paulo, 2021). 4 5 Housing programs and initiatives that consider resilient construction, and site selection strategies, are still in 6 nascent stages (Martin et al., 2013). Initiatives in slum upgrading, social housing improvement and 7 regularizing land tenure, associated with infrastructure provision, do not usually focus on adaptation, 8 although they often focus on risk reduction. Those initiatives, associated with a housing policy that 9 guarantees access to land and decent housing, a comprehensive intervention in vulnerable neighbourhoods 10 for their adaptation to climate change, and CbA (community-based adaptation) strategies, including housing 11 self-management and the participation of cooperatives, shows the need and opportunity to move to an 12 transformative urban agenda that encompasses sustainable development, poverty reduction, disaster-risk 13 reduction, climate-change adaptation, and climate-change mitigation (high confidence) (Muntó, 2018; UN-14 Habitat, 2018; Valadares and Cunha, 2018; Bárcena et al., 2020b; Núñez Collado and Wang, 2020; 15 Satterthwaite et al., 2020). 16 17 Several large cities are implementing municipal risk management plans and management and restoration 18 plans for hydrologically relevant areas, considering threats of drought and heat waves, integrated watershed 19 management and flood control programs (high confidence) (Municipio del Distrito Metropolitano de Quito, 20 2020; Prefeitura Municipal do Salvador, 2020; Municipalidad de Lima, 2021; Prefeitura da Cidade do Rio de 21 Janeiro, 2021; Prefeitura do Município de São Paulo, 2021). Quito and Rio de Janeiro are considered two 22 examples of comprehensive and effective city-level climate action that includes creating environment 23 protected areas, managing appropriate land use, household relocation and EWS in vulnerable to high-24 precipitation areas associate to EbA, such as reforestation projects, to face natural hazards (ELLA, 2013; 25 Anguelovski et al., 2014; Calvello et al., 2015; Alcaldía de Quito, 2017; Sandholz et al., 2018; Prefeitura da 26 Cidade do Rio de Janeiro, 2021) (Section 12.6.1). EWS and the use of mapping tools experienced in La Paz 27 showed to be an effective adaptation measure facing increasing hydro-climatic extreme events (Aparicio-28 Effen et al., 2018). 29 30 12.5.5.3.2 Green and grey infrastructure 31 Hybrid solutions, combining green and grey infrastructure (GGI), have been adopted for better efficiency in 32 flooding control (Ahmed et al., 2019; Drosou et al., 2019; Romero-Duque et al., 2020), sanitation, water 33 scarcity, landslide prevention and coastal protection (high confidence) (Section 12.5.6.4; Mangone, 2016; 34 Depietri and McPhearson, 2017; Leal Filho et al., 2018; McPhearson et al., 2018). The adoption of nature-35 based solutions (NbS), which embraces well-known approaches such as green infrastructure (GI) and 36 ecosystem-based adaptation (EbA) (Pauleit et al., 2017; Le, 2020) has increased (Box 1.3). The Fund for the 37 Protection of Water (FONAG) and the Participative Urban Agriculture (AGRUPAR) are initiatives using 38 NbS in Quito (Section 12.6.1). Example of GGI is a stormwater detention pond, as a water storage solution 39 to flooding prevention, also allowing multiple uses of an urban space, adapting and revitalizing a degraded 40 area in Mesquita, Rio’s metropolitan region (Jacob et al., 2019). These systemic and holistic solutions still 41 need to overcome governance and sectorial barriers to be more widely adopted (Herzog and Rozado, 2019; 42 Wamsler et al., 2020; Valente de Macedo et al., 2021). 43 44 Managing water in cities in an adaptive way has been central to reducing impacts such as floods and 45 contributes to water security (high confidence) (Van Leeuwen et al., 2016; Okumura et al., 2021). Many 46 cities facing frequent heavy storms that impact mostly underprivileged communities, slums and vulnerable 47 areas could benefit from the integrated NbS for disaster risk reduction and adaptation (high confidence) 48 (Sandholz et al., 2018; Ronchi and Arcidiacono, 2019). A study covering 70 Latin American cities estimates 49 that 96 million people would benefit from improving main watersheds with green infrastructure (Tellman et 50 al., 2018). In several municipal climate plans, NbS were introduced mainly to enhance rainwater 51 management, reduce energy consumption and urban heat areas, water quality, prevent landslides and offer 52 green areas (high confidence) (Gobierno de la Ciudad de Buenos Aires, 2020; Municipio del Distrito 53 Metropolitano de Quito, 2020; Prefeitura Municipal de Curitiba, 2020; Alcaldía de Medellín, 2021; 54 Municipalidad de Lima, 2021; Prefeitura da Cidade do Rio de Janeiro, 2021; Prefeitura do Município de São 55 Paulo, 2021). Sao Paulo’s project for Jaguaré river proposes a large-scale landscape transformation applying 56 innovative multifunctional NbS instead of exclusively large, expensive and monofunctional hard engineered 57
ACCEPTED VERSIO
N
SUBJECT TO FIN
AL EDITS
FINAL DRAFT Chapter 12 IPCC WGII Sixth Assessment Report
Do Not Cite, Quote or Distribute 12-72 Total pages: 181
solutions to manage stormwater (Marques et al., 2018; Herzog and Rozado, 2019). In Bogotá, the Humedales 1 foundation has restored wetlands to enhance areas near the reserve Van Der Hammen to improve water 2 quality and quantity, restore habitat for biodiversity, and provide flood protection (Portugal Del Pino et al., 3 2020). In Petrópolis, a medium-sized city in the hills of Rio de Janeiro state, the water service company has 4 implemented 10 NbS multifunctional micro wastewater treatment plants in low-income areas, helping to 5 reduce cascading impacts of storms, floods and epidemics (Herzog and Rozado, 2019). In Costanera Sur, 6 Buenos Aires, a public initiative to protect an auto-regenerated Plata riverbank, which had received 7 demolition material to create land, nowadays offers numerous ecosystem services for residents and attract 8 visitors activating the tourist industry and helping reducing riverine floods (Bertonatti, 2021; OICS, 2021). 9 10 Hybrid solution on water management that can merge traditional interventions on urban areas with 11 sustainable urban drainage systems (SUDS) (Davis and Naumann, 2017), considering small scale low-impact 12 development (LID) measures scattered over the watershed instead of concentrate huge hydraulic grey 13 structures, can help reduce the risk and damage of flooding (high confidence) (Miguez et al., 2014; Miguez 14 et al., 2015a; Depietri and McPhearson, 2017; Da Silva et al., 2018a; de Macedo et al., 2018). Quito’s 15 climate plan explicitly cites the strategy for implementing blue and grey infrastructure to reduce risk due to 16 extreme precipitation and its associated impacts such as flooding and landslides and the possible impact of 17 water scarcity (Municipio del Distrito Metropolitano de Quito, 2020). The Integrated Iguaçu-Sarapuí River 18 Basin Flood Control Master Plan, in Rio’s metropolitan area, combined different solutions for flood 19 protection, focusing on river restoration by retrofitting levee systems combined with adapting land use to 20 provide a multifunctional landscapes as an alternative to bring together green and grey solutions, composing 21 urban parks to prevent further paving and avoid irregular occupation of river banks and provide storage 22 capacity for damping flood peaks (Miguez et al., 2015b). 23 24 Many cities are implementing adaptation measures on integrated water and flood management systems 25 (Sarkodie and Strezov, 2019), improving basic sanitation services (medium confidence: medium evidence, 26 high agreement). Main strategies are established by NAPs recurrently focusing on improving water 27 distribution network and reservoir systems, as Honduras (Government of Honduras, 2018) and Ecuador 28 (Mills-Novoa et al., 2020), sewage and effluent treatment, as Guatemala, Brazil and Paraguay (Government 29 of Brazil, 2007; Government of Guatemala, 2016; Government of Paraguay, 2017), facing water scarcity and 30 environmental degradation. Local authorities follow this guideline as in the effort to maintain and upgrade 31 existing drainage systems in Georgetown (Mycoo, 2014), or in Medellin, focusing on improving drainage 32 systems to prevent landslides or flooding (Núñez Collado and Wang, 2020; Alcaldía de Medellín, 2021). Rio 33 de Janeiro has constructed three large stormwater detention reservoirs to deal with frequent flood, (Prefeitura 34 da Cidade do Rio de Janeiro, 2015), adopting a set of exclusively grey solutions, not combined to NbS that 35 could improve urban flood resilience (Rezende et al., 2019). The main proposed actions still consider the 36 traditional approach in improving the hydraulic capacity of urban drainage systems as an adaptive measure 37 (high confidence) (Gobierno de la Ciudad de Buenos Aires, 2020; Prefeitura Municipal do Salvador, 2020; 38 Municipalidad de Lima, 2021; Prefeitura da Cidade do Rio de Janeiro, 2021). In addition to this strategy, 39 several local plans propose actions for the retention and storage of rainwater, both in the urban drainage 40 network with a smaller intervention scale (Prefeitura Municipal de Curitiba, 2020), as well as along rivers 41 and canals with large-scale works (medium confidence: medium evidence, high agreement) (Gobierno de la 42 Ciudad de Buenos Aires, 2020; Prefeitura Municipal de Curitiba, 2020; Alcaldía de Medellín, 2021; 43 Prefeitura da Cidade do Rio de Janeiro, 2021). 44 45 12.5.5.3.3 Mobility and transport system 46 Mobility and transport systems have a key role in urban resilience (high confidence) (Walker et al., 2014a; 47 Caprì et al., 2016; Espinet et al., 2016; Lee and Lee, 2016; Ford et al., 2018; Mehrotra et al., 2018; Quinn et 48 al., 2018). Examples reported in scientific literature assessed are focusing on mitigation strategies even when 49 labelled as adaptation (da Silva and Buendía, 2016; Di Giulio et al., 2018; Valderrama et al., 2019; Goes et 50 al., 2020). 51 52 The integration of transport and land use planning and the improvement of public transport, also as important 53 mitigation actions, appears as a consensus in countries’ adaptation plans, nevertheless the emphasis on 54 mobility and transport systems on the many NAP published is low (medium confidence: medium evidence, 55 high agreement). Honduras, Costa Rica and El Salvador’s NAP are not approaching adaptation or mitigation 56 in the sector, while Peru, Ecuador, Guatemala and Paraguay ones focus on mitigation only. Chile, Colombia 57
ACCEPTED VERSIO
N
SUBJECT TO FIN
AL EDITS
FINAL DRAFT Chapter 12 IPCC WGII Sixth Assessment Report
Do Not Cite, Quote or Distribute 12-73 Total pages: 181
and Brazil’s NAP focus on both mitigation and adaptation of mobility and transport systems. Chile and 1 Colombia’s plans dedicated specific action lines to adapt mobility and transport systems to climate change, 2 whilst Brazil published a NAP’s complementary volume dedicated exclusively to the sectoral strategies, 3 although presents only general guidelines (Government of Peru, 2010; Government of Chile, 2014; 4 Government of Ecuador, 2015; Government of Brazil, 2016; Government of Colombia, 2016; Government 5 of Guatemala, 2016; Government of Paraguay, 2017; Government of Costa Rica, 2018; Government of 6 Honduras, 2018; Government of El Salvador, 2019). 7 8 In municipal scale, assessing the biggest cities, São Paulo, Rio de Janeiro Lima and Santiago stands out for 9 including mobility and transport as one of the strategic axes of its climatic plans, but yet prioritizing 10 mitigation, while Buenos Aires and Bogotá do not deepen the issue in their plans (Gobierno de la Ciudad de 11 Buenos Aires, 2015; Prefeitura da Cidade do Rio de Janeiro, 2016; Alcaldía Mayor de Bogotá D.C., 2018; 12 Municipalidad de Lima, 2021; Municipalidad de Santiago, 2021; Prefeitura do Município de São Paulo, 13 2021). Most of those same cities have sectoral mobility plans, which are key tools to urban resilience. Those 14 plans, however, do not focus on adaptation actions, although emphasizing mitigation (Government of Peru, 15 2005; Gobierno de la Ciudad de Buenos Aires, 2011; Prefeitura do Município de São Paulo, 2015; Alcaldía 16 Mayor de Bogotá D.C., 2017; Ilustre Municipalidad de Santiago, 2019; Município de Rio de Janeiro, 2019). 17 18 12.5.6 Health and Wellbeing 19 20 The most common adaptation strategies include the development of climate services such as epidemic 21 forecast tools, integrated climate-health surveillance and observatories and forecasting climate-related 22 disasters (floods, heat waves). GIS technologies are being used to identify locations where vulnerable 23 populations are exposed to climate hazards and associated health risks. 24 25 12.5.6.1 Climate services for health 26 27 The measures most directly linked to diminishing risk are those related to climate services for health (high 28 confidence). Climate services provide tailored, sector-specific information from climate forecasts to support 29 decision making (WHO and WMO, 2016); they allow decision makers and practitioners to plan 30 interventions in anticipation of a weather/climate event (Mahon et al., 2019). More recently, climate 31 services, such as early warning systems (EWS) and forecast models, have been promoted for the health 32 sector (WHO and WMO, 2012; WMO, 2014; WHO and WMO, 2016; Thomson and Mason, 2018) and are 33 an important adaptation measure to reduce the impacts of climate on health (high confidence). To guide this 34 process, the Global Framework for Climate Services (GFCS) issued a Health Exemplar (Lowe et al., 2014; 35 WMO, 2014) which aims for stakeholder engagement between health and climate actors at all levels to 36 promote the effective use of climate information within health research, policy and practice. 37 38 There exist at least 24 EWS in SA to avoid deaths and injuries from floods in the countries such as 39 Argentina, Colombia, Ecuador, Bolivia, Brazil, Peru, Uruguay and Venezuela (Bravo et al., 2010; Bidegain, 40 2014; Moreno et al., 2014; Dávila, 2016; del Granado et al., 2016; López-García et al., 2017; Carrizo Sineiro 41 et al., 2018). A total of 149 emergency prevention and response systems are reported in CA (UNESCO, 42 2012). In addition, some countries implement programs for the relocation of families who are in risk 43 condition, like in Bogotá and Medellin, Colombia (World Bank, 2014; Watanabe, 2015). 44 45 Epidemic forecast tools are an example of an adaptation measure being developed and/or implemented in 46 this region (high confidence). Climate-driven forecast models have been developed for dengue in Ecuador, 47 Puerto Rico, Peru, Brazil, Mexico, Dominican Republic, and Colombia (Lowe et al., 2013; Eastin et al., 48 2014; Johansson et al., 2016; Lowe et al., 2017; Johansson et al., 2019); for Zika virus infections across the 49 Americas (Muñoz et al., 2017); for cutaneous leishmaniasis in Costa Rica and Brazil (Chaves and Pascual, 50 2006; Lewnard et al., 2014); for Aedes-borne diseases across the Americas (Muñoz et al., 2020b); and a 51 nowcast model for chikungunya virus infections across the Americas (Johansson et al., 2014). In Ecuador, a 52 prototype system utilized forecasts of seasonal climate and ENSO forecasts of to predict dengue 53 transmission, providing the health sector with warnings of increased transmission several months ahead of 54 time (Stewart-Ibarra and Lowe, 2013; Lowe et al., 2017). Despite these advances, few tools have become 55 operational and mainstreamed in decision making processes. However, Brazil and Panama have been able to 56
ACCEPTED VERSIO
N
SUBJECT TO FIN
AL EDITS
FINAL DRAFT Chapter 12 IPCC WGII Sixth Assessment Report
Do Not Cite, Quote or Distribute 12-74 Total pages: 181
operationalize an early warning system for the surveillance of dengue fever transmission (Codeço et al., 1 2016; McDonald et al., 2016). 2 3 One of the most promising climate services for the health sector are heat and cold early warning and alert 4 systems (medium confidence). These have been developed by the national meteorological institutes in Peru, 5 Argentina, and Uruguay (Bidegain, 2014). A heat alert system was implemented in Argentina in 2017 and 6 daily alerts are issued for 57 localities across the country. A stoplight colour scheme is used to issue alerts, 7 identifying specific groups at risk and actions to be taken to reduce the risk (Herrera et al., 2018b). 8 9 The public dissemination of climate-health warnings via bulletins, websites, and other outlets can be an 10 adaptation measure to climate change and weather variability to diminish health risk (high confidence). The 11 information produced is systematized to be communicated to the authorities and general public. The 12 Caribbean Health-Climatic Bulletin has been issued quarterly since 2018 to health ministries across the 13 region, including CA and NSA. Regional climate and health authorities meet to review 3 month climate 14 forecasts and issue statements about the probable impacts on health (Trotman et al., 2018). In Panamá, 15 information on dengue is distributed in a monthly bulletin that is used by health authorities to inform vector 16 control activities (McDonald et al., 2016). Another example was the climate-driven forecast of dengue risk 17 that was produced prior to Brazil’s 2014 FIFA World Cup to inform disease prevention interventions (Lowe 18 et al., 2014; Lowe et al., 2016). In Colombia, the Intersectoral National Technical Commission for 19 Environmental Health publishes a monthly bulletin with regional weather forecast and potential effects on 20 health (CONASA, 2019). Paraguay improves epidemiological surveillance and trains first level health staff 21 via information campaigns on the prevention of climate sensitive diseases, and promotes health networks 22 with the participation of civil society (Environmental Secretariat of Paraguay, 2011). 23 24 12.5.6.2 Integrated climate-health surveillance and observatories 25 26 Integrated health-climate surveillance systems are another key adaptation strategy (medium confidence). This 27 information can be used by the health sector to inform decision making about when and where to deploy a 28 public health intervention. It can also feed into an EWS, particularly if the data are compatible in format and 29 spatiotemporal scales. An integrated health-climate surveillance system for vector borne disease control was 30 developed in southern coastal Ecuador through a partnership among the climate and health sectors and 31 academia (Borbor-Cordova et al., 2016; Lowe et al., 2017). Additionally, an interdisciplinary multinational 32 team working at the border of Ecuador and Peru created a cooperation network for climate-informed dengue 33 surveillance (Quichi et al., 2016) and successful binational collaboration resulted in the local elimination of 34 malaria (Krisher et al., 2016). Similar is the innovative community-based data collection to understand and 35 find solutions to rainfall-related diarrheal diseases in Ecuador (Palacios et al., 2016). 36 37 Climate and health observatories are a promising strategy being developed at subnational, national (e.g., 38 Brazil, Argentina) and regional levels (high confidence) (Muñoz et al., 2016; Rusticucci et al., 2020). The 39 Brazilian Observatory of Climate and Health brings together climate and health information for the Amazon 40 region of Manaus (Barcellos et al., 2016). At a national level, Brazil has created the climate and health 41 observatory, where information and data visualizations are available for various climate-sensitive health 42 indicators (Ministério da Saúde and FIOCRUZ, 2021). 43 44 12.5.6.3 Vulnerability and risk maps 45 46 Vulnerability and risk maps have been widely used as an adaptation strategy to understand the potential 47 impacts of climate on health outcomes both directly (e.g., maps of disease risk) and indirectly (e.g., maps of 48 populations vulnerable to climate disasters) (high confidence). There are many examples where climate 49 services have been used to construct vulnerability maps for health outcomes, including maps in the 50 aforementioned Climate-Health Observatories. Dengue, malaria, and Zika vulnerability maps using climate, 51 social, and environmental information has been developed in Brazil and Colombia (Cunha et al., 2016b; 52 López-Álvarez, 2016; Pereda, 2016; IDEAM, 2017). Argentina is focused on improving the health system by 53 using Climate Change Risk Map System as a tool that identifies the risks and allows assessing their 54 management (OPS and WHO, 2018). 55 56
ACCEPTED VERSIO
N
SUBJECT TO FIN
AL EDITS
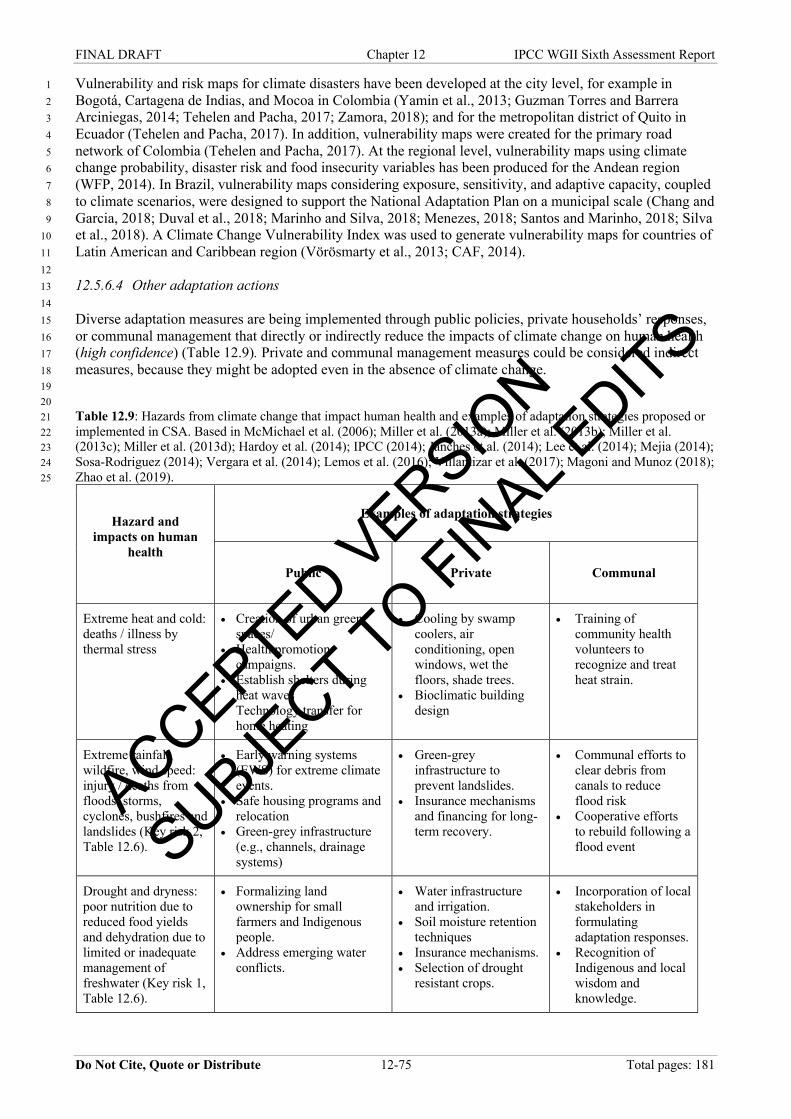
FINAL DRAFT Chapter 12 IPCC WGII Sixth Assessment Report
Do Not Cite, Quote or Distribute 12-75 Total pages: 181
Vulnerability and risk maps for climate disasters have been developed at the city level, for example in 1 Bogotá, Cartagena de Indias, and Mocoa in Colombia (Yamin et al., 2013; Guzman Torres and Barrera 2 Arciniegas, 2014; Tehelen and Pacha, 2017; Zamora, 2018); and for the metropolitan district of Quito in 3 Ecuador (Tehelen and Pacha, 2017). In addition, vulnerability maps were created for the primary road 4 network of Colombia (Tehelen and Pacha, 2017). At the regional level, vulnerability maps using climate 5 change probability, disaster risk and food insecurity variables has been produced for the Andean region 6 (WFP, 2014). In Brazil, vulnerability maps considering exposure, sensitivity, and adaptive capacity, coupled 7 to climate scenarios, were designed to support the National Adaptation Plan on a municipal scale (Chang and 8 Garcia, 2018; Duval et al., 2018; Marinho and Silva, 2018; Menezes, 2018; Santos and Marinho, 2018; Silva 9 et al., 2018). A Climate Change Vulnerability Index was used to generate vulnerability maps for countries of 10 Latin American and Caribbean region (Vörösmarty et al., 2013; CAF, 2014). 11 12 12.5.6.4 Other adaptation actions 13 14 Diverse adaptation measures are being implemented through public policies, private households’ responses, 15 or communal management that directly or indirectly reduce the impacts of climate change on human health 16 (high confidence) (Table 12.9). Private and communal management measures could be considered indirect 17 measures, because they might be adopted even in the absence of climate change. 18 19 20 Table 12.9: Hazards from climate change that impact human health and examples of adaptation strategies proposed or 21 implemented in CSA. Based in McMichael et al. (2006); Miller et al. (2013a); Miller et al. (2013b); Miller et al. 22 (2013c); Miller et al. (2013d); Hardoy et al. (2014); IPCC (2014); Janches et al. (2014); Lee et al. (2014); Mejia (2014); 23 Sosa-Rodriguez (2014); Vergara et al. (2014); Lemos et al. (2016); Villamizar et al. (2017); Magoni and Munoz (2018); 24 Zhao et al. (2019). 25
Hazard and impacts on human
health
Examples of adaptation strategies
Public Private Communal
Extreme heat and cold: deaths / illness by thermal stress
• Creation of urban green spaces/
• Health promotion campaigns.
• Establish shelters during heat waves
• Technology transfer for home heating
• Cooling by swamp coolers, air conditioning, open windows, wet the floors, shade trees.
• Bioclimatic building design
• Training of community health volunteers to recognize and treat heat strain.
Extreme rainfall, wildfire, wind speed: injury / deaths from floods, storms, cyclones, bushfires and landslides (Key risk 2, Table 12.6).
• Early warning systems (EWS) for extreme climate events.
• Safe housing programs and relocation
• Green-grey infrastructure (e.g., channels, drainage systems)
• Green-grey infrastructure to prevent landslides.
• Insurance mechanisms and financing for long-term recovery.
• Communal efforts to clear debris from canals to reduce flood risk
• Cooperative efforts to rebuild following a flood event
Drought and dryness: poor nutrition due to reduced food yields and dehydration due to limited or inadequate management of freshwater (Key risk 1, Table 12.6).
• Formalizing land ownership for small farmers and Indigenous people.
• Address emerging water conflicts.
• Water infrastructure and irrigation.
• Soil moisture retention techniques
• Insurance mechanisms. • Selection of drought
resistant crops.
• Incorporation of local stakeholders in formulating adaptation responses.
• Recognition of Indigenous and local wisdom and knowledge.
ACCEPTED VERSIO
N
SUBJECT TO FIN
AL EDITS
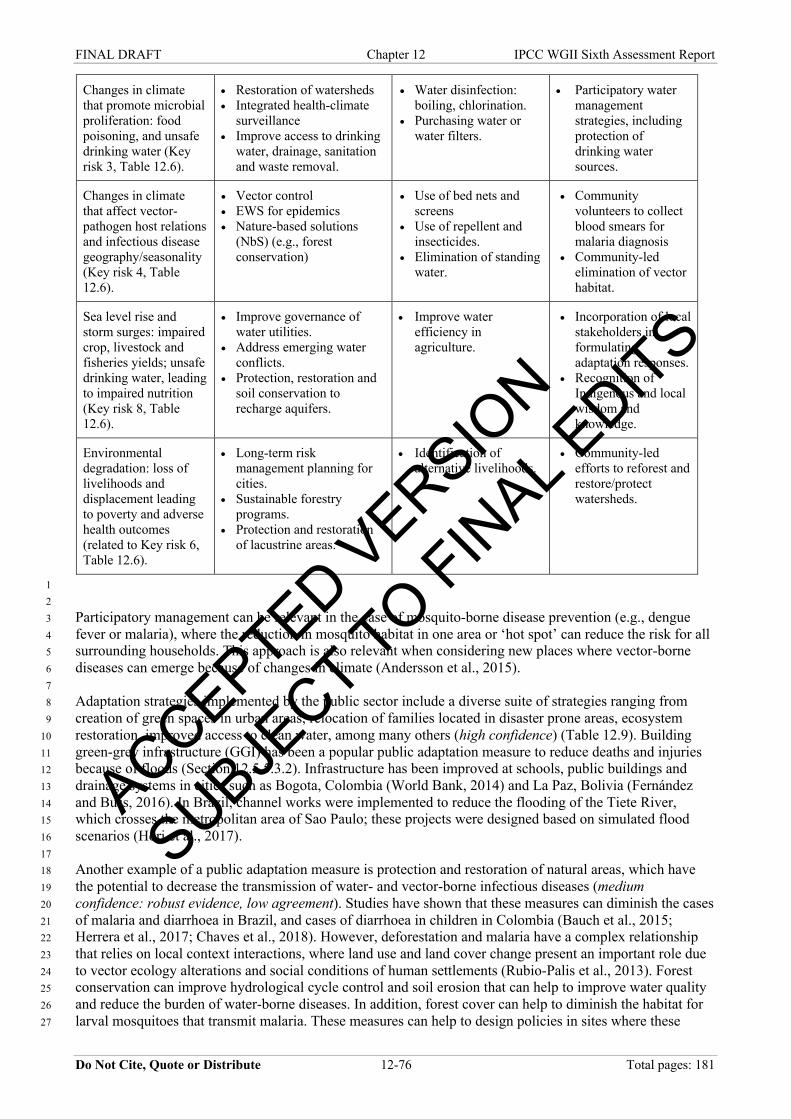
FINAL DRAFT Chapter 12 IPCC WGII Sixth Assessment Report
Do Not Cite, Quote or Distribute 12-76 Total pages: 181
Changes in climate that promote microbial proliferation: food poisoning, and unsafe drinking water (Key risk 3, Table 12.6).
• Restoration of watersheds • Integrated health-climate
surveillance • Improve access to drinking
water, drainage, sanitation and waste removal.
• Water disinfection: boiling, chlorination.
• Purchasing water or water filters.
• Participatory water management strategies, including protection of drinking water sources.
Changes in climate that affect vector-pathogen host relations and infectious disease geography/seasonality (Key risk 4, Table 12.6).
• Vector control • EWS for epidemics • Nature-based solutions
(NbS) (e.g., forest conservation)
• Use of bed nets and screens
• Use of repellent and insecticides.
• Elimination of standing water.
• Community volunteers to collect blood smears for malaria diagnosis
• Community-led elimination of vector habitat.
Sea level rise and storm surges: impaired crop, livestock and fisheries yields; unsafe drinking water, leading to impaired nutrition (Key risk 8, Table 12.6).
• Improve governance of water utilities.
• Address emerging water conflicts.
• Protection, restoration and soil conservation to recharge aquifers.
• Improve water efficiency in agriculture.
• Incorporation of local stakeholders in formulating adaptation responses.
• Recognition of Indigenous and local wisdom and knowledge.
Environmental degradation: loss of livelihoods and displacement leading to poverty and adverse health outcomes (related to Key risk 6, Table 12.6).
• Long-term risk management planning for cities.
• Sustainable forestry programs.
• Protection and restoration of lacustrine areas.
• Identification of alternative livelihoods.
• Community-led efforts to reforest and restore/protect watersheds.
1 2 Participatory management can be relevant in the case of mosquito-borne disease prevention (e.g., dengue 3 fever or malaria), where the reduction in mosquito habitat in one area or ‘hot spot’ can reduce the risk for all 4 surrounding households. This approach is also relevant when considering new places where vector-borne 5 diseases can emerge because of changes in climate (Andersson et al., 2015). 6 7 Adaptation strategies implemented by the public sector include a diverse suite of strategies ranging from 8 creation of green spaces in urban areas, relocation of families located in disaster prone areas, ecosystem 9 restoration, improved access to clean water, among many others (high confidence) (Table 12.9). Building 10 green-grey infrastructure (GGI) has been a popular public adaptation measure to reduce deaths and injuries 11 because of floods (Section 12.5.5.3.2). Infrastructure has been improved at schools, public buildings and 12 drainage systems in cities such as Bogota, Colombia (World Bank, 2014) and La Paz, Bolivia (Fernández 13 and Buss, 2016). In Brazil, channel works were implemented to reduce the flooding of the Tiete River, 14 which crosses the metropolitan area of Sao Paulo; these projects were designed based on simulated flood 15 scenarios (Hori et al., 2017). 16 17 Another example of a public adaptation measure is protection and restoration of natural areas, which have 18 the potential to decrease the transmission of water- and vector-borne infectious diseases (medium 19 confidence: robust evidence, low agreement). Studies have shown that these measures can diminish the cases 20 of malaria and diarrhoea in Brazil, and cases of diarrhoea in children in Colombia (Bauch et al., 2015; 21 Herrera et al., 2017; Chaves et al., 2018). However, deforestation and malaria have a complex relationship 22 that relies on local context interactions, where land use and land cover change present an important role due 23 to vector ecology alterations and social conditions of human settlements (Rubio-Palis et al., 2013). Forest 24 conservation can improve hydrological cycle control and soil erosion that can help to improve water quality 25 and reduce the burden of water-borne diseases. In addition, forest cover can help to diminish the habitat for 26 larval mosquitoes that transmit malaria. These measures can help to design policies in sites where these 27
ACCEPTED VERSIO
N
SUBJECT TO FIN
AL EDITS
FINAL DRAFT Chapter 12 IPCC WGII Sixth Assessment Report
Do Not Cite, Quote or Distribute 12-77 Total pages: 181
problems do not currently exist but can emerge as a consequence of climate change and the increase in the 1 frequency of weather extreme events. 2 3 12.5.6.5 Challenges and opportunities 4 5 Despite the proliferation of disaster EWS in the region, only 37 can be considered operational, because many 6 of these systems are not operating or functioning properly, or do not meet the requirements to be considered 7 EWS (UNESCO, 2012). Sustainable financing and political support are needed to ensure the functioning of 8 disaster EWS (high confidence) (Table 12.11). Several studies identified difficulties in implementing disaster 9 EWS due to a lack of community engagement and response to the alerts that are issued (del Granado et al., 10 2016; López-García et al., 2017). To address these challenges, the document “Developing Early Warning 11 Systems: A Checklist” provides guidance for the implementation of a people centred approach to early 12 warning systems as proposed in the Hyogo Framework for Action 2005–2015 (Wiltshire, 2006). 13 14 With respect to the development of climate-driven epidemic forecasts, efforts are needed to improve the 15 utility of such forecasts for the health sector. Few such forecasts have been operationalized to inform health 16 sector decision making. A review of 73 studies that predicted and forecasted Zika virus infections (42% from 17 the Americas) identified a high degree of variation in access, reproducibility, timeliness, and incorporation of 18 uncertainty (Kobres et al., 2019). A recent systematic review of epidemic forecasting and prediction studies 19 found that no reporting guidelines exist; the development of guidance to improve transparency, quality and 20 implementation of forecast models in the public health sector was recommended (Pollett et al., 2020). An 21 earlier review of dengue early warning models found that few models incorporated both spatial and temporal 22 aspects of disease risk (Racloz et al., 2012), limiting their potential application as an adaptation strategy by 23 the health sector. Advances have been made in the last decade with respect to modelling and computing 24 tools, increasing access to digital climate information and health records, and the use of earth observations to 25 forecast climate sensitive diseases (Fletcher et al., 2021; Wimberly et al., 2021). 26 27 The growing field of implementation science –defined as “a discipline focused on systematically examining 28 the gap between knowledge and action”– is another opportunity to address the challenges and barriers to 29 using climate information for health sector decision making (Boyer et al., 2020). Implementation science in 30 the health sector in CSA is nascent; research in this area could help to address barriers to mainstreaming 31 climate information in the health sector as an adaptation strategy (Table 12.11; Table SM12.7). 32 33 12.5.6.6 Governance and Financing. 34 35 A description of the governance and financing dimensions of the feasibility of implementing EWS is 36 presented in Table 12.11 and Table SM12.7. 37 38 12.5.6.6.1 National Health Plans 39 Some countries have developed national plans on health including the role of climate. Chile has a Climate 40 Change Adaptation Plan of the Health Sector that proposes several actions to enhance monitoring, 41 institutions and citizens information and education (Ministry of Health of Chile and Ministry of Environment 42 of Chile, 2016). Based on the identification of vulnerability to climate change, Colombia has developed 43 eleven regional adaptation plans to strengthen institutional capacities; climate change education for 44 behavioural changes; and cost estimation to promote health resilience (WHO and UNFCCC, 2015). In 45 addition, El Salvador implemented actions to strengthen health infrastructure through high latrines for 46 housing in flood communities, as well as other measures focused on water supply and quality based on an 47 education and awareness program (Ministry of Environment and Natural Resources of El Salvador, 2013). 48 Only Brazil and Peru have implemented actions so far in the region derived from national health adaptation 49 plans, and only Brazil completed a national assessment of impacts, vulnerability and adaptation for health 50 (Watts et al., 2018). Some countries include health as a priority sector in their National Adaptation Plans, as 51 is the case of Ecuador, and Costa Rica, which has a national plan addressing the prevention and care of 52 climate-sensitive diseases coupled to a National Health Plan (2016-2020) (Ministry of Health Costa Rica, 53 2016; Jiménez, n.d.). 54 55
ACCEPTED VERSIO
N
SUBJECT TO FIN
AL EDITS
FINAL DRAFT Chapter 12 IPCC WGII Sixth Assessment Report
Do Not Cite, Quote or Distribute 12-78 Total pages: 181
12.5.6.6.2 National Disaster Management Plans 1 National Risk Management Plans or National Disaster Response Plans are tools for adapting to climate 2 change that can help to diminish death and injuries because of disasters (high confidence). These Plans are 3 generally promoted by governments as national instruments that guide the processes of estimating, 4 preventing and reducing disaster risk. An updated national risk management plans has been found for 5 Guatemala (CONRED, 2014), Honduras (COPECO, 2014), El Salvador (Ministry of Health of El Salvador, 6 2017), Costa Rica (CNE, 2016), Ecuador (SGR, 2018), Peru (SGRD et al., 2014), Argentina (Ministerio de 7 Seguridad de Argentina, 2018), Bolivia (VIDECI, 2017), Chile (ONEMI, 2015) and Colombia (UNGRD, 8 2015). It has been shown in Brazil that information on drought conditions can be used to reduced health 9 impacts of drought using a national disaster risk reduction framework (Sena et al., 2016). 10 11 12.5.7 Poverty, Livelihood and Sustainable Development 12 13 Climate change impacts are increasing and exacerbating poverty and social inequalities, affecting those 14 already vulnerable and disfavoured, generating new and concatenated risk challenging climate resilient 15 development pathways (high confidence) (Section 8.2.1.4; Shi et al., 2016; Otto et al., 2017; Johnson et al., 16 2021) (). Poverty, high levels of inequalities and pre-existing vulnerabilities also can be worsened by climate 17 change policies (Antwi-Agyei et al., 2018; IPCC, 2018; Roy et al., 2018; Eriksen et al., 2021). Those already 18 suffering are losing their livelihoods and reducing their development options; poor populations and countries 19 are more vulnerable and have lower adaptive capacity to climate change (very high confidence) (Section 20 8.5.2.1; Rao et al., 2017). 21 22 Inequality is growing, being a CSA structural characteristic; Gini index average for Latin American 23 countries (including Mexico) was decreasing to 0.466 in 2017, where 1% richest got 22 times more income 24 than 10% poorest (ECLAC, 2019b; Busso and Messina, 2020), but in 2018, 29.6% of Latin America were 25 poor population (increased to 182 million) and extreme poverty 10.2%; in 2018 (increased to 63 million) 26 (ECLAC, 2019b) and in 2020, due to COVID crisis, Gini coefficient projection of increases are ranging from 27 1.1% to 7.8% (ECLAC and PAHO, 2020), poverty increased to 33.7% (209 millions) and extreme poverty to 28 12.5% (78 millions) (ECLAC and PAHO, 2020; ECLAC, 2021). Those poverty and extreme poverty rates 29 are higher among children, young people, women, Indigenous Peoples (Reckien et al., 2017; Busso and 30 Messina, 2020), migrant (Dodman et al., 2019) and rural population. Climate change impacts in 31 differentiated ways, even within a household there may be important differences in relation to age, gender, 32 health and disability; these factors may intersect with one another (high confidence) (Reckien et al., 2017; 33 Busso and Messina, 2020). 34 35 In IPCC’s TAR, AR4 and AR5, WG II recognized higher risks associated with poor living conditions, 36 substandard housing, inadequate services, location in hazardous sites due to no alternatives and the need to 37 work more strongly on strengthening governance structures involving residents, community organizations 38 amongst others (Wilbanks et al., 2007; Revi et al., 2014). The AR5 CSA chapter stated that poverty levels 39 remained high (45% for CA and 30% for SA in 2010) despite years of sustained economic growth. Poor and 40 vulnerable groups are disproportionately affected in negative ways by climate change (Section 8.2.1.4; 41 Section 8.2.2.3; SR15 Section 5.2 and Section 5.2.1, Roy et al., 2018) ) due to physical exposure derived 42 from the place where they live or work, illiteracy, low income and skills, political and institutional 43 marginalization tied to lack of recognition of informal settlements and employments, poor access to good 44 quality services and infrastructure, resources, information, and other factors (very high confidence) (UN-45 Habitat, 2018; SR15 Sections 5.2.1, 5.6.2, 5.6.3, 5.6.4, Roy et al., 2018). 46 47 International agreements aim for climate resilient development pathways where efforts to eradicate poverty, 48 reduce inequalities and promote fair and cross-scalar adaptation and mitigation are strengthened. The 49 Sustainable Development Goals (SDG) first and second objectives aim to reduce poverty leaving no one 50 behind (UN General Assembly, 2015). Although researchers argue that poverty is mischaracterized having 51 multiple dimensions (Castán Broto and Bulkeley, 2013) (Section 8.1.1), that biodiversity loss, climate 52 change and pollution will undermine efforts on 80% of assessed SDG targets, that biodiversity and climate 53 change must be tackle together (Pörtner et al., 2021; United Nations Environment Programme, 2021) and 54 LAC countries due to COVID crisis have uneven SDG progress (high confidence) (ECLAC, 2020). 55 56
ACCEPTED VERSIO
N
SUBJECT TO FIN
AL EDITS
FINAL DRAFT Chapter 12 IPCC WGII Sixth Assessment Report
Do Not Cite, Quote or Distribute 12-79 Total pages: 181
12.5.7.1 Challenges and Opportunities 1 2 Climate change exacerbates pre-existing conditions and moving in the opposite direction in the search for 3 resilience, equity and sustainable development (Tanner et al., 2015b; Bartlett and Satterthwaite, 2016; 4 Kalikoski et al., 2018; Bárcena et al., 2020a). Existing inequalities in the provision and consumption of 5 services are bound to be exacerbated by future risks and uncertainties associated with climate change 6 scenarios (Miranda Sara et al., 2017). Climate change will be a major obstacle in reducing poverty (high 7 confidence) (Bartlett and Satterthwaite, 2016; Allen et al., 2017a; Hallegatte et al., 2018; UN-Habitat, 2018; 8 United Nations Environment Programme, 2021), even affecting wealthier populations that become 9 vulnerable facing climate change scenarios (WGI AR6 Chapter 12, Ranasinghe et al., 2021), dragging them 10 into poverty, erasing decades of work and asset accumulation. 11 12 CSA is highly urbanized, the poor vast majority live in urban areas (except in Central America) while urban 13 extreme poverty is becoming more relevant (Rosenzweig et al., 2018; Dodman et al., 2019; Almansi et al., 14 2020; Sette Whitaker Ferreira et al., 2020), with those living in informal settlements and working within 15 informal economy are critical on each city’s economy (Satterthwaite et al., 2018; Satterthwaite et al., 2020). 16 Many households in the region’s cities live in precarious neighbourhoods with insufficient infrastructure and 17 substandard housing (Adler et al., 2018; Rojas, 2019). On average, between 21% and 25% of the urban 18 population lives in informal settlements (Jaitman, 2015; UN-Habitat, 2015; Rojas, 2019; Sandoval and 19 Sarmiento, 2019). This hides important disparities: Habitat III reports by individual countries the percentage 20 of urban population living in informal settlements ranged from 5% to 60%; in absolute terms 105 million 21 people living in precarious conditions (106 million estimated in 1990) (Section 12.5.5; Sandoval and 22 Sarmiento, 2019). 23 24 High levels of inequality and informality remain the biggest challenges for adaptation measures being 25 effective (Rosenzweig et al., 2018; Dodman et al., 2019). The interaction of projected impacts with existing 26 vulnerabilities in the region (as hunger, malnutrition and health inequalities, arising from its social, economic 27 and demographic profile), affect CSA development and well-being in different ways (Reyer et al., 2017) 28 increasing poverty and inequality risking the paths for sustainable development (Section 18.1.1; Reckien et 29 al., 2017). 30 31 The uneven enforcement of land-use regulations, relocations and evictions on behalf of environmental risk 32 management and climate adaptation is contested (Brockington and Wilkie, 2015; Lavell, 2016; Quimbayo 33 Ruiz and Vásquez Rodríguez, 2016a; Quimbayo Ruiz and Vásquez Rodríguez, 2016b; Anguelovski et al., 34 2018; Anguelovski et al., 2019; Shokry et al., 2020; Chávez Eslava, 2021; Oliver-Smith, 2021). This points 35 to caution in framing climate adaptation and resilience related interventions as equally benefiting everyone 36 (high confidence) (Brown, 2014; Chu et al., 2016; Connolly, 2019; Romero-Lankao and Gnatz, 2019; 37 Johnson et al., 2021) and the need for incorporating equality and justice dimensions (very high confidence) 38 (Section 18.1.2.2; Agyeman et al., 2016; Meerow and Newell, 2016; Romero-Lankao et al., 2016; Shi et al., 39 2016; Reckien et al., 2017; Leal Filho et al., 2021) (). 40 41 Poor rural households in marginal territories with low productive potential and/or far away from markets and 42 infrastructure are highly vulnerable to climate change and easily fall into poverty-environment traps (high 43 confidence) (Barbier and Hochard, 2019; Heikkinen, 2021). Climate change is one of the main threats to 44 rural livelihoods in Central America, being agriculture a pillar for rural economies and food security, 45 especially for the poorest sectors that rely on subsistence crops in areas with low soil fertility and rainfall 46 seasonality (Bouroncle et al., 2017). 47 48 Impacts are likely to occur simultaneously, exacerbating those of the poorer but also creating new groups at-49 risk (Miranda Sara et al., 2016; Rosenzweig et al., 2018; Dodman et al., 2019). The material basis for poor 50 and vulnerable urban and rural populations’ adaptation are in a critical state across the CSA region, 51 magnifying extreme events' impacts, making CSA less resilient. The consequences in terms of social 52 vulnerability and livelihood will be widely felt, insofar the security and protection of critical assets (housing, 53 infrastructure, services - water, land and ecosystem services) continues to lay behind. Small businesses are 54 usually conducted within the same home and if the house is affected so is the business (Stein and Moser, 55 2015) adding another layer of vulnerability for them. 56 57
ACCEPTED VERSIO
N
SUBJECT TO FIN
AL EDITS
FINAL DRAFT Chapter 12 IPCC WGII Sixth Assessment Report
Do Not Cite, Quote or Distribute 12-80 Total pages: 181
As productivity declines, they seek outside income generation opportunities and rely on resource extraction 1 for subsistence and as an income generation activity, further increasing their vulnerability to climate change 2 (Barbier and Hochard, 2018a). Cycles of declining productivity, environmental degradation, wildlife 3 poaching and trafficking, search of outside employment, reduced incomes, livelihood opportunities and 4 poverty have been registered in rural El Salvador, Honduras, Amazonia (López-Feldman, 2014; Graham, 5 2017; Barbier and Hochard, 2018a). The protection of communities that defend and are dependent on 6 wildlife and natural environments requires immediate attention. In Latin America there are 8 million forest-7 dependent people which represents about 82% of the region’s rural extreme poor (FAO and UNEP, 2020). 8 9 Poverty and disaster risk reduction interlinked with climate change adaptation share a focus on identifying 10 and acting on local risks and their root causes, even having different lenses through which to view risk (very 11 high confidence) (IPCC, 2014; Allen et al., 2017a; Satterthwaite et al., 2018; UN-Habitat, 2018; 12 Satterthwaite et al., 2020). Construction of climate knowledge and risk perceptions affect decision-making to 13 define implementation priorities; the poor are less able to cope and to adapt avoiding “adaptation injustices” 14 (high confidence) (Mansur et al., 2016; Miranda Sara et al., 2017; Reckien et al., 2017; Hardoy et al., 2019). 15 16 Adaptation, social policies, poverty reduction and inequality are weakly articulated to daily or chronic risk 17 reduction. Poor residents are often caught in ‘risk traps’, accumulated cycles of everyday risks and small-18 scale disasters (medium confidence: medium evidence, high agreement) (Bartlett and Satterthwaite, 2016 ; 19 Mansur et al., 2016; Allen et al., 2017a; Leal Filho et al., 2021), being exacerbated by climate risks and 20 COVID pandemic with the most vulnerable populations suffering. Chronic and every day risks (poor access 21 to infrastructure, services, incomes, housing, tenure, education, security, location and poor-quality 22 environment, networks and having a voice) are often exacerbated and generate new unknown risks by 23 climate change (medium confidence: medium evidence, high agreement) (Bartlett and Satterthwaite, 2016; 24 Mansur et al., 2016; Satterthwaite et al., 2018; Leal Filho et al., 2021), extreme events and risks related to 25 ENSO oscillation. All these risks need to be considered simultaneously (UN-Habitat, 2018). Risks are 26 seldom distributed equally highlighting socioeconomic inequalities and governance failures (high 27 confidence) (IPCC, 2014; Bartlett and Satterthwaite, 2016; Rasch, 2016; Romero-Lankao et al., 2018). 28 29 Adaptation, disaster risk reduction together with social and poverty reduction policies contribute to 30 sustainable development (Hallegatte et al., 2018; Satterthwaite et al., 2020), and improve prospects of 31 climate resilient pathways (Section 18.1.1). Without pro-poor interventions, adaptation options could 32 reinforce poverty cycles (Kalikoski et al., 2018). Secure locations, good quality infrastructure, services and 33 housing are critical to reduce risks from extreme climate events (Satterthwaite et al., 2018; Dodman et al., 34 2019). 35 36 12.5.7.2 Governance and Finance 37 38 Poor and most vulnerable groups evidence limited political influence, fewer capacities and opportunities to 39 participate in decision and policy making, are less able to leverage government support to invest on 40 adaptation measures linked with poverty, inequality and vulnerability reduction (very high confidence) 41 (Chapter 8; Miranda Sara et al., 2017; Reyer et al., 2017; Kalikoski et al., 2018; Dodman et al., 2019; 42 Satterthwaite et al., 2020). 43 44 Existing unbalances on power relations, corruption, structural historic problems and high levels of risk 45 tolerance (Miranda Sara et al., 2016) constitute climate governance barriers for implementing more effective 46 adaptation and preventive measures. Corruption, particularly in the construction and infrastructure sector, 47 has proven to be a barrier for CSA development even reproducing and reconstructing risks (French and 48 Mechler, 2017; Vergara, 2018; Durand, 2019). Critical infrastructure and valuable assets continue to be 49 placed in vulnerable areas (Calil et al., 2017; Escalante Estrada and Miranda, 2020) evidencing the 50 persistence of maladaptation and adaptation deficit (Villamizar et al., 2017). 51 52 Social organization, participation and governance reconfiguration are essential for building climate resilience 53 (very high confidence) (Stein and Moser, 2015; Kalikoski et al., 2018; Satterthwaite et al., 2018; Stein et al., 54 2018; Hardoy et al., 2019; Stein, 2019; Satterthwaite et al., 2020; Miranda Sara, 2021). Adaptation measures 55 have trade-offs that need to be acknowledged and acted upon, most importantly by developing the capacity 56 to convene discussions that draw in all key actors and commit them to do things differently (Almeida et al., 57
ACCEPTED VERSIO
N
SUBJECT TO FIN
AL EDITS
FINAL DRAFT Chapter 12 IPCC WGII Sixth Assessment Report
Do Not Cite, Quote or Distribute 12-81 Total pages: 181
2018; Hardoy et al., 2019). Collaborative approaches integrating groups and organizations (e.g., saving, 1 women’s groups, clubs, vendor associations, cooperatives) contributing to the exchange of information, to 2 visibilize people's needs, to generate safety networks, and to negotiate for improvements and enhance 3 adaptive capacity. 4 5 12.5.7.3 Adaptation options 6 7 Effective adaptation can be achieved by addressing pre-existing development deficits, particularly the needs 8 and priorities of informal settlements and economies (Revi et al., 2014; UN-Habitat, 2018). There is urgency 9 for social systems to better respond to climate related risks and increase their adaptive capacity (Lemos et al., 10 2016) focus on path dependency, lock ins and poor specific needs (Leal Filho et al., 2021). 11 12 The linkages between climate adaptation and poverty are not clearly addressed at national level (Kalikoski et 13 al., 2018). A revision of some NDCs presented by CSA countries (https://unfccc.int), shows that NDCs are 14 developed with almost no connection to poverty and livelihoods. Exceptions include Bolivia whose NDC 15 developed the “Good life” concept, as an alternative development pathway, supporting sustainable 16 livelihoods as a mean to eradicate poverty; Honduras asserts that climate action should improve living 17 conditions; Peru defined a poverty and vulnerability reduction approach and El Salvador conditioned its 18 NDCs to macroeconomic stability, economic growth and poverty reduction. A sustainable development 19 approach permeates in proposed actions for sectors as energy, agriculture, transport, water, and forestry. 20 21 Adaptive capacity is linked to addressing climate related risks (specific capacity) and structural deficits 22 (generic capacity), synergies and a strategic balance between both is necessary (Eakin et al., 2014; Lemos et 23 al., 2016). Adaptation institutional context can undermine one form of capacity with repercussions on the 24 other compromising overall adaptation and sustainable development (Eakin et al., 2014). 25 26 Literature assessing the effectiveness of pro-poor or community based adaptation practices and livelihood 27 options continues to be weak, even though are increasingly documented, as in AR5 (Magrin et al., 2014). 28 Great variety of measures are being applied, financial instruments to strengthen and protect livelihoods and 29 assets; collective insurance schemes, micro-credits, financial instruments for transferring risks, as 30 agricultural insurance and Payments for Ecosystem Services (PES) (Dávila, 2016; Hardoy and Velásquez, 31 2016; Lemos et al., 2016; Porras et al., 2016; Kalikoski et al., 2018). Small-scale household running 32 businesses in poor neighbourhoods develop adaptation strategies to keep business going, showing how 33 household level adaptation strategies are multipurpose (Stein et al., 2018; Stein, 2019). There are emerging 34 interinstitutional communities of practice with the purpose of sharing practices and lessons learned (ECLAC, 35 2013; ECLAC, 2015; ECLAC, 2019a). 36 37 There is also increasing evidence of human mobility associated with climate change and disaster risk (IOM, 38 2021) and the adoption of sustainable tourism, diversification of livelihoods strategies, climate forecasts, 39 appropriate construction techniques, neighbourhood layout, integral urban upgrading initiatives, territorial 40 and urban planning, regulatory frameworks, water harvesting and nature-based solutions (NbS) (Stein and 41 Moser, 2014; Hardoy and Mastrangelo, 2016; Almeida et al., 2018; Barbier and Hochard, 2018a; Desmaison 42 et al., 2018; Satterthwaite et al., 2018; Villafuerte et al., 2018; Hidalgo, 2020; Satterthwaite et al., 2020). 43 Mostly, socio-economical and socio-political factors which show safety and continuity measures are critical 44 enablers of adaptation. 45 46 At municipal level study in Central America highlighted that adaptive capacity in rural areas is associated 47 with basic needs satisfaction (safe drinking water, school, quality dwelling, gender parity index), access to 48 resources for innovation and action (road density, economically active population with non-agricultural 49 employment, and rural demographic dependency ratio), and access to credit and technical support 50 (Bouroncle et al., 2017). 51 52 CSA adaptation initiatives to reduce poverty, improve livelihoods and achieve sustainable development 53 range in scale and scope, from planned and collective interventions to autonomous and individual actions. 54 Many of them are bottom up, community-led initiatives together with civil society organizations; others are 55 government-led, including local governments, or a combination of them (McNamara and Buggy, 2017; 56 Berrang-Ford et al., 2021). Vulnerable groups are a focus to achieve equity at planning and as a target 57
ACCEPTED VERSIO
N
SUBJECT TO FIN
AL EDITS
FINAL DRAFT Chapter 12 IPCC WGII Sixth Assessment Report
Do Not Cite, Quote or Distribute 12-82 Total pages: 181
including mainly rural low-income, Indigenous Peoples and women and migrants in most references. 1 Responses detected were focused on behavioural and cultural, followed by ecosystem-based responses, 2 institutional, and technological/infrastructural responses. Out of 55 articles analysed from CSA (Berrang-3 Ford et al., 2021) about poverty, equity and adaptation options, half of them covered adaptation planning and 4 early implementation but only 2% could show evidence of risk reduction associated with adaptation efforts. 5 6 Tensions and conflicts may result from differing perceptions and knowledge on vulnerabilities and risk 7 which can hinder the acceptance of adaptation measures and implementing stronger adaptive or preventive 8 actions (Miranda Sara et al., 2016). There is a need to better understand complex interactions and community 9 responses to climate change in the Amazonian and Andean region. Climate change hotspot impacts, showed 10 that poverty reduction measures alone were not enough to improve adaptive capacity, as people will not 11 necessarily invest to enhance them (Pinho et al., 2014; Filho et al., 2016; Nelson et al., 2016; Lapola et al., 12 2018; Zavaleta et al., 2018). Current adaptation strategies and methods may be neglecting cultural values, 13 even eroding them, in Peruvian Andes, pointing that success of adaptation practices is tied to deep cultural 14 values (Walshe and Argumedo, 2016). 15 16 Limits to adaptation include access to land, territory and resources (Mesclier et al., 2015), poor labour 17 opportunities coupled with knowledge gaps, weak multi actor coordination, and lack of effective policies and 18 supportive frameworks (Berrang-Ford et al., 2021). 19 20 Low participation of women in income earning opportunities contrasts with their role in unpaid activities 21 (ECLAC, 2019b). Despite progresses, gender differences in labour markets remain an unjustifiable form of 22 inequality (OIT, 2019) and women easily fall back to the informal labour market during crisis situations such 23 as those generated by climate events (Collodi et al., 2020). 24 25 Participatory processes are leveraging adaptation measures throughout CSA; they contribute to prioritization 26 of specific adaptation measures as well as strengthening local capacities. Showing that climate adaptation 27 needs to be part of larger transformation processes to reduce vulnerability drivers (Stein and Moser, 2015; 28 Stein et al., 2018; Stein, 2019) but stronger national policies interlinking poverty and inequality reduction to 29 adaptation, considering the coupled human-environmental systems to comprehend poor and vulnerable 30 groups’ capacity to adapt are urgent. CSA does not fare very well, and several downward trends might 31 become even more acute. More effective decisive actions need to be undertaken coupled with inclusive long-32 term planning to protect the poor and improve their underlying conditions, to meet the SDG. 33 34 12.5.8 Cross-cutting Issues in the Human Dimension 35 36 12.5.8.1 Public policies, social movements and participation 37 38 Public policies related to adaptation must be seen in the wider context of environmental policies and 39 governance, as they usually address climatic processes in synergy with other environmental and 40 socioeconomic drivers (very high confidence) (Ding et al., 2017; Aldunce Ide et al., 2020; Comisión 41 Europea, 2020; Lampis et al., 2020; Scoville-Simonds et al., 2020). Some people rather point to education, 42 sanitation or social assistance, among other sectors (Bonatti et al., 2019). In Brazil, for example, it would be 43 difficult to clearly separate climate change adaptation and urban policies (high confidence) (PBMC, 2016; 44 Barbi and da Costa Ferreira, 2017; Marques Di Giulio et al., 2017; Empresa de Pesquisa Energética, 2018; 45 Checco and Caldas, 2019; Canil et al., 2020). 46 47 Many public policies related to climate change have become symbolic, in conflict with prevailing economic 48 policies and practices (medium confidence: low evidence, high agreement). Urban adaptation plans can be in 49 conflict with other policies and there may exist insufficient support in multiple areas such as social attitudes 50 and behaviour, knowledge, education and human capital, finance, governance, institutions and policy 51 (Villamizar et al., 2017; Koch, 2018). Some policies around climatic related displacements and migrants 52 have been considered in NDCs (Priotto and Salvador Aruj, 2017; Yamamoto et al., 2018; de Salles Cavedon-53 Capdeville et al., 2020). 54 55 As there are asymmetries among populations regarding the vulnerability and benefits of adaptation, along the 56 lines of gender, age, socioeconomic conditions and ethnicity, it has been noticed that adaptation policies and 57
ACCEPTED VERSIO
N
SUBJECT TO FIN
AL EDITS
FINAL DRAFT Chapter 12 IPCC WGII Sixth Assessment Report
Do Not Cite, Quote or Distribute 12-83 Total pages: 181
programs must be adequate to diverse conditions and actors (very high confidence) (Kaijser and Kronsell, 1 2014; Walshe and Argumedo, 2016; Baucom and Omelsky, 2017; Harvey et al., 2018). 2 3 Effective adaptation and mitigation depend on policies and measures at multiple scales, especially on the 4 involvement of the more exposed and vulnerable people. The participation of experts, communities and 5 citizens has shown to be effective (FAO and Fundación Futuro Latinoamericano, 2019) particularly through 6 partnership of grassroots organizations with impoverished communities providing valued expertise and 7 capacities to support the implementation of government climate resilience strategies (World Bank Group, 8 2015). More inclusive planning processes correspond to higher climate equity and justice outcomes in the 9 short term, but also an emphasis on building dedicated multi-sector governance institutions may enhance 10 long-term programs stability, while ensuring civil society voice in adaptation planning and implementation 11 (Chu et al., 2016). Some local organizations and people have succeeded when they were in charge of their 12 own resiliency efforts, where international projects and protocols proved less effective (Doughty, 2016). At 13 times, decentralized governmental programs have tried to increase public responsiveness to the adaptation 14 needs of people; however, proving to only be mildly successful and provoking the mobilization of 15 communities against existing governance structures (Thompson, 2016). 16 17 Indigenous knowledge and local knowledge (IK and LK) participation is thought to be more considered in 18 adaptation policies, as it has good results (high confidence) (Nagy et al., 2014b; Jurt et al., 2015; Arias et al., 19 2016; Stensrud, 2016). IK has been adaptive for long periods in the Andes (Cuvi, 2018), but there might be 20 limits to adaptation in the face of present climatic and other environmental and socioeconomic drivers 21 (Postigo, 2019). Approaches integrating IK with more formal sciences, to address research and policies, have 22 improved adaptation processes, but they are no exempt of complications (high confidence) (Doswald et al., 23 2014; Metternicht et al., 2014; Tengö et al., 2014; Drenkhan et al., 2015; Keenan, 2015; Lasage et al., 2015; 24 Camacho Guerreiro et al., 2016; Hurlbert and Gupta, 2016; Roco et al., 2016; Santos et al., 2016; Walshe 25 and Argumedo, 2016; Uribe Rivera et al., 2017; Kasecker et al., 2018; Cuesta et al., 2019; Ulloa, 2019; 26 Ariza-Montobbio and Cuvi, 2020). More interdisciplinary and transdisciplinary research helps to better 27 understand and manage the relationship between governance, implementation, management priorities, wealth 28 distribution and trade-offs between adaptation, mitigation and the Sustainable Development Goals (SDG). 29 30 Representations of climate change can also emerge as critiques and resistances, that expose that climate 31 change labelled politics or interventions have posed even bigger risks, or do not address poverty issues 32 (medium confidence: medium evidence, high agreement) (Lampis, 2013; Pokorny et al., 2013; Ojeda, 2014). 33 Indigenous and social movements have joined with climate justice activists, claiming for action against 34 climate change (Hicks and Fabricant, 2016; Ruiz-Mallén et al., 2017; Charles, 2021). The Bolivian Platform 35 against Climate Change, a coalition of civil society and social movement organizations working to address 36 the effects of global warming in Bolivia and to influence the broader global community, reflects an 37 innovative dimension that, albeit at time conflictual, has flagged how increasing climate variability hinders 38 the right of Indigenous Peoples to the conservation of their culture and practices and illustrates how grass-39 root movements are increasingly appropriating climate change policy in the region (Hicks and Fabricant, 40 2016). Social movements have engaged with international networks as Blokadia, which surged after COP 23, 41 whose vindications try to go beyond the protection of the environment, delving into issues of democracy and 42 resource control (Martínez-Alier et al., 2018). 43 44 Many social movements address adaptation to climate change. Some engage and participate in policy and 45 planning, often having good results at the local level. On the contrary, top-down approaches without 46 participation have shown to be less effective (high confidence) (Krellenberg and Katrin, 2014; Nagy et al., 47 2014b; Stein and Moser, 2014; Ruiz-Mallén et al., 2015; Sherman et al., 2015; Waylen et al., 2015; Bizikova 48 et al., 2016; Chelleri et al., 2016; Merlinsky, 2016; Villamizar et al., 2017). 49 50 Some conflicts in which the direct biophysical impacts of climate change play a major role can unleash 51 social protests and strengthen social movements (Section 12.6.4). In Cartagena, since 2010, the increase in 52 precipitation increasingly impacted the barrio Policarpa, causing the residents to claim solutions for the 53 problems caused by the coupled effect of flooding and industrial pollution. Also, in El Cambray II, in 54 Guatemala City, in 2015 the nearby hill collapsed, causing the death of 280 people, 70 disappeared and the 55 destruction of hundreds of homes. The affected community entered into a conflict with the municipality 56 asking for resettlement and a reform of land-use planning (Stein Heinemann, 2018). 57
ACCEPTED VERSIO
N
SUBJECT TO FIN
AL EDITS
FINAL DRAFT Chapter 12 IPCC WGII Sixth Assessment Report
Do Not Cite, Quote or Distribute 12-84 Total pages: 181
1 12.5.8.2 Perceptions 2 3 Perception and understanding of climate change can be seen as an adaptive feature. In CSA, the 4 consciousness of it as a threat is burgeoning, a situation related to a growth in climate justice activism, as 5 well as to the occurrence of extreme weather events of all kinds (high confidence) (Forero et al., 2014; 6 Magrin et al., 2014; Capstick et al., 2015). Perception is positively associated across countries with the 7 Human Development Index and ND-Gain Readiness Index, and negatively associated with the Vulnerability 8 Index, and within countries, with the education level, while they are negatively associated with the degree of 9 political affinity for the market economy (Azócar et al., 2021). Anyhow, some communities do not associate 10 their problems with the scientific concept, so discussions as if it is human induced, the causes, or relations 11 with other problems, can become irrelevant (Sapiains Arrué and Ugarte Caviedes, 2017). Even communities 12 affected by the same changes do not necessarily perceive them in the same way (Bonatti et al., 2016). The 13 interpretations of change, its causes and effects, can widely vary (Paerregaard, 2018; Scoville-Simonds, 14 2018). Rather than adapting to climate change, some peoples adapt climate change to their social worlds 15 (Rasmussen, 2016a). 16 17 Perceptions tend to be different in rural and urban areas (Sherman et al., 2015). In the rural areas, it is highly 18 related with temperature rise and changes in rainfall patterns, changes in agriculture (pests, calendars), 19 biodiversity loss, solar radiation or changes in the oceans, and their impacts sometimes are related or even 20 more attributed to socioeconomic and environmental drivers, and also related with financial negative 21 outcomes (high confidence) (Infante and Infante, 2013; Postigo, 2014; Jacobi et al., 2015; Barrucand et al., 22 2017; Harvey et al., 2018; Martins and Gasalla, 2018; Meldrum et al., 2018; Córdoba Vargas et al., 2019; 23 Leroy, 2019; Viguera et al., 2019; Gutierrez et al., 2020; Iniguez-Gallardo et al., 2020; Lambert and Eise, 24 2020). In places as the Amazonia, there is an increased perception with age (Funatsu et al., 2019). In 25 Mediterranean Chile, younger, more educated producers and those who own their land tend to have a clearer 26 perception than older, less educated, or tenant farmers, but they do not have a clear perception or how it may 27 affect their yields and farming operation (Roco et al., 2015). In some dry and humid Ecuadorian montane 28 forests, peasants perceive in the same way as scientific data, but they are at odds to predict the changes and 29 consider that they may not be prepared and only can be reactive (Herrador-Valencia and Paredes, 2016). In 30 an Andean community, perceptions of climate change are homogeneous and do not vary according to 31 gender, age or ethnicity (Cáceres-Arteaga et al., 2020). Among representatives of five municipalities of 32 Lima, it was found that climate change is not well understood and they have trouble distinguishing it from 33 other environmental issues (Siña et al., 2016). In an Amazonian region, farmers provided a more accurate 34 description than regional institutions of how it affects the local livelihood system (Altea, 2020). In Cuenca 35 Auqui peasants attribute recently experienced challenges in agricultural production mainly to perceived 36 changes in precipitation patterns, but statistical analyses of daily precipitation records at nearby stations do 37 not corroborate those perceived changes (Gurgiser et al., 2016). 38 39 12.5.8.3 Gender and intersectionality 40 41 There is ample empirical evidence that the impacts of climate change are not of equal scope for men and 42 women. Women, particularly the poorest, are more vulnerable and are impacted in greater proportion. Often, 43 for several economic and social reasons, they have less capacity to adapt, further widening structural gender 44 gaps (high confidence) (Box 7.4; Arana Zegarra, 2017; Casas Varez, 2017; Segnestam, 2017; Acosta et al., 45 2019; Aldunce Ide et al., 2020; Olivera et al., 2021; Silva Rodríguez de San Miguel et al., 2021). Gender 46 equity is thought to be central to discussions on climate change adaptation policies. In issues such as 47 drinking water, energy, natural disasters, impacts on health and agriculture, capacity to migrate, women 48 (poor women in particular) are affected in greater proportion, further widening structural gender gaps. In a 49 rural community vulnerable to drought, short-term coping was more common among the women, especially 50 among female heads of household, while adaptive actions were more usual among the men; there are 51 gendered inequalities in access to and control over different forms of capital that lead to a gender-52 differentiated capacity to adapt, where men are better able to adapt and women experience a downward 53 spiral in their capacity to adapt and increasing vulnerability to drought (Segnestam, 2017). 54 55 However, women are not always the more vulnerable group. While in a broad sense climate change impacts 56 more severely on women, there are situations where they have reacted, adapted better to, and been more 57
ACCEPTED VERSIO
N
SUBJECT TO FIN
AL EDITS
FINAL DRAFT Chapter 12 IPCC WGII Sixth Assessment Report
Do Not Cite, Quote or Distribute 12-85 Total pages: 181
resilient. Grassroots women self-help groups can be active agents of change for their communities, designing 1 and delivering gender-responsive adaptation solutions (Huairou Commission, 2019). Some studies suggest 2 that women establish a friendlier relationship with the environment and towards natural resources; studies on 3 masculinities and environment confirm this tendency (Brough et al., 2016). In a multi country study, some 4 female headed households tend to be slightly less vulnerable and more resilient than male headed 5 households, even though some exceptions were found when looking at sub-groups (Andersen et al., 2017). In 6 Chile, women are more likely to modernize irrigation and infrastructure, and gender appears as an important 7 element for drought adaptation (Roco et al., 2016). A change to agro-ecological practices has improved 8 gender equalities and adaptive capacity to climate change (Cáceres-Arteaga et al., 2020). 9 10 Recent studies emphasize that a gender approach to social inequalities ought to move beyond just looking at 11 men and women as experiencing the impacts in a differentiated manner; rather, an intersectional analysis 12 illuminates how different individuals and groups relate differently to climate change, due to their 13 situatedness in power structures based on context-specific and dynamic social categorizations (high 14 confidence) (Kaijser and Kronsell, 2014; Djoudi et al., 2016; Thompson-Hall et al., 2016; Olivera et al., 15 2021). Thus, the relationship between gender and adaptation demands an analytical framework that connects 16 environmental problems with social inequalities in a complex way (Godfrey, 2012). An intersectional 17 approach contributes to better capture the diversity of adaptive strategies that men and women adopt vis-à-18 vis climate change. Particular constellations of race, gender, class, age or nationality reveal more complex 19 realities (high confidence). 20 21 12.5.8.4 Migrations and displacements 22 23 Migration and displacements are multi-causal phenomena, and climate may exacerbate political, social, 24 economic or other environmental drivers (high confidence) (Kaenzig and Piguet, 2014; Brandt et al., 2016; 25 Priotto and Salvador Aruj, 2017; Sudmeier-Rieux et al., 2017; Radel et al., 2018; Heslin et al., 2019; 26 Hoffmann et al., 2020; Silva Rodríguez de San Miguel et al., 2021). In the region there are many case 27 studies, but data to assess and monitor precisely the effects of climate -and weather- related disasters in 28 migration and displacements in a broad perspective is still inaccurate (Priotto and Salvador Aruj, 2017; 29 Abeldaño Zuñiga and Fanta Garrido, 2020). The most common climatic drivers include tropical storms and 30 hurricanes, heavy rains, floods and droughts (Kaenzig and Piguet, 2014). Positive climatic conditions also 31 can facilitate migration (Gray and Bilsborrow, 2013). Peru, Colombia and Guatemala are amongst the 32 countries with the largest average displacements caused by hydro meteorological causes; Brazil had 295,000 33 people displaced because of disasters in 2019 (Global Internal Displacement Database, https://www.internal-34 displacement.org/database/displacement-data). 35 36 These processes can be interpreted as impacts in vulnerable peoples, but also as adaptation strategies to 37 manage the risks and reduce the exposure, when people continue with their lives, temporary or permanently, 38 in a different but stable situation, or when members of the families send remittances to those that remain in 39 the affected areas (Section 7.4.3.2; Cross-Chapter Box MIGRATE in Chapter 7). The remittances create 40 opportunities for adaptive capacity building, as they reduce some vulnerabilities in the form of 41 infrastructures, agricultural supplies, food, education or health, as in northern CA (NU CEPAL, 2018). 42 Anyhow, migration as adaptation is not available to everyone (Kaenzig and Piguet, 2014), and the idea has 43 also been contested as it may not help to overcome structural problems or point to in situ options (Radel et 44 al., 2018; Ruiz-de-Oña et al., 2019). The causal processes are complex. Surveys of migrants usually find that 45 the main reported reason for migration is to find a job or to increase the household income (Wrathall and 46 Suckall, 2016; OIM, 2017; Radel et al., 2018), but the underlying reason for the lack of job or income is 47 rarely examined, and at times may be related with climatic hazards. 48 49 Migration most often originates in rural areas, with people moving to other rural or urban areas within their 50 home countries (Table Cross-Chapter Box MIGRATE 1 in Chapter 7). In the Amazon, approximately 80% 51 of the population is concentrated in cities due to rural-urban migrations in search of better income, 52 livelihoods and services, in cases associated with extreme floods and droughts (Pinho et al., 2015). In 53 Ecuador, environmental variables are most likely to enhance international than internal migration (Gray and 54 Bilsborrow, 2013). Hurricanes have been seen as positive triggers for international migration in CA (Spencer 55 and Urquhart, 2018). In the highlands of Peru, there are different patterns, including daily circular migration 56
ACCEPTED VERSIO
N
SUBJECT TO FIN
AL EDITS
FINAL DRAFT Chapter 12 IPCC WGII Sixth Assessment Report
Do Not Cite, Quote or Distribute 12-86 Total pages: 181
to combine the scarce income from agricultural production with urban income, rather than abandoning the 1 farming land (Milan and Ho, 2014; Zimmerer, 2014; Bergmann et al., 2021). 2 3 Migration to cities can mean opportunities for migrants and for the urban areas, but also can worsen the 4 problems, as urban poor people can become even more exposed and vulnerable, and the pressure on urban 5 capacities may not be well absorbed (high confidence) (Chisari and Miller, 2016; Gemenne et al., 2020). 6 Internal migration to cities is likely to exacerbate pre-existing vulnerabilities related to inequality, poverty, 7 indigence and informality (Warn and Adamo, 2014). Immigration can make cities/residents more vulnerable 8 to climate change risks (Section 12.5.5; Section 12.5.7). Groups as children, Indigenous Peoples or the poor 9 are usually amongst the most vulnerable in the migrations and displacements, which poses challenges to 10 national policies and international aid (Sedeh, 2014; Gamez, 2016; Ulla, 2016; Priotto and Salvador Aruj, 11 2017; Ramos and de Salles Cavedon-Capdeville, 2017; Amar-Amar et al., 2019; Gemenne et al., 2020). In 12 forced migration or displacement by climatic effects, women are prone to lose their leadership, autonomy 13 and voice, especially in new organizational structures imposed by authorities. This is especially the case in 14 temporary accommodation camps created after disasters, exacerbating differentiated vulnerabilities existing 15 (Aldunce Ide et al., 2020). International migration has become more dangerous and difficult as border 16 controls have become stricter, but programs such as the one of temporary agricultural workers from 17 Guatemala to Canada have proven to be successful (Gabriel and Macdonald, 2018). At the same time, 18 emigration may lead to the loss of IK and LK for adaptation (Moreno et al., 2020b). 19 20 Some areas are more sensitive to generate climatic migration: the Andes, the dry areas of the Amazonia, 21 northern Brazil, and the northern countries in CA (high confidence). Northeast Brazil would lose population 22 that will move to the south, deepening the existing inequalities (Oliveira and Pereda, 2020). In a study of 8 23 countries around the world, including Guatemala and Peru, a link was found between rainfall variability and 24 food insecurity which could lead to migration in areas of high prevalence of rainfed agriculture and low 25 diversification (Warner and Afifi, 2014). In CA, younger individuals are more likely to migrate in response 26 to hurricanes and especially to droughts (Baez et al., 2017). 27 28 The perception of gradual changes lowers the likelihood for internal migration, while sudden-onset events 29 increase movement (Koubi et al., 2016). On the other hand, it has been seen that extreme events like floods 30 or droughts can hinder population mobility, immobilizing them in their localities (Thiede et al., 2016). These 31 immobilized populations are supposed to face a double set of risks: they are unable to move away from 32 environmental threats, and their lack of capital makes them especially vulnerable to environmental changes 33 (Black et al., 2011). In CSA, migrating to the U.S. is becoming dangerous and expensive, as that country is 34 restricting the entries; these trends expose local populations to the risk of becoming immobile in the near 35 future in a place where they are extremely vulnerable (Ruano and Milan, 2014; McLeman, 2019). A survey 36 in Guatemala found no correlation between migration to the U.S. and severe food insecurity in households, 37 but the correlation became significant if the level of food insecurity was moderate, suggesting that families 38 in extreme hardship did not have the resources to migrate (Aguilar et al., 2019). At the same time, some 39 populations just have chosen not to move, as in Peru, where immobility in dissatisfied people is more likely 40 to be caused by attachment to place than resource constraints (Adams, 2016; Correia and Ojima, 2017). 41 Some populations have chosen to adapt relying in their IK and LK (Boillat and Berkes, 2013). 42 43 Migration is often the last resort for rural communities facing water stress problems (Magrin et al., 2014; 44 Ruano and Milan, 2014). In Bolivia, glacial retreat has not triggered new migration flows and had a limited 45 impact on the existing migratory patterns (Kaenzig, 2015). In SA, climatic variability increases the 46 likelihood of inter-province migration, rather than trapping populations. In a study of interprovincial 47 migration motivated by temperature, an exception arose in Bolivia, and even if that could suggest an 48 immobilized population (Thiede et al., 2016), it is not clear if they want to stay and adapt. In some cases, 49 people want to move but wait for relocation after the climate related disasters (Priotto and Salvador Aruj, 50 2017). 51 52 12.5.8.5 Financing 53 54 Climate change financing is unequally distributed among CSA countries (high confidence). Financing of 55 climate change adaptation remains very much delegated to multilateral and bilateral cooperation and the 56 governments in the region have heavily relied on it. Still, there are some concerns regarding justice in the 57
ACCEPTED VERSIO
N
SUBJECT TO FIN
AL EDITS
FINAL DRAFT Chapter 12 IPCC WGII Sixth Assessment Report
Do Not Cite, Quote or Distribute 12-87 Total pages: 181
distribution of these funds (Khan et al., 2020). The UNFCCC has created financing mechanisms throughout 1 its functioning years, but there is a wide range of issues that can present challenges for access by the 2 recipients (Hickmann et al., 2019). These include; lack of technical capacity; difficulties in following the 3 procedures established by the various financial entities; and low levels of awareness about the need for 4 action, as well as the different sources of funds available. The fiscal policies of the different countries have 5 contributed to government financing in the fight against climate change (World Bank, 2021). Since the Paris 6 Agreement, countries have pledged NDCs which introduce the need to design and implement carbon budgets 7 with respective consideration of the efficiency and costs and benefits involved in each mitigation or 8 adaptation to climate change projects (Fragkos, 2020). 9 10 According to UNFCCC, Latin America and the Caribbean, for the period 2015–2016 obtained 22% of 11 climate finance from multilateral climate funds. In this section we use data from: 12 https://climatefundsupdate.org/data-dashboard, most of the reported information for Latin-American and the 13 Caribbean includes Mexico, since the scope of this chapter does not includes Mexico we have rely in the raw 14 data included in the data-dashboard mentioned in the link (see also: Guzmán et al. (2016)). 76% went to 15 mitigation projects with the remaining 24% going to adaptation. Of the total finance provided by the 16 multilateral climate funds to the Region, 51% took the form of concessional loans, while 47% was provided 17 as grants. For the region, approvals in the 2015–2016 period were concentrated in Argentina, Chile, Brazil, 18 and Colombia, where large-scale mitigation projects were launched supported by the Green Climate Fund 19 (GCF) and the Clean Technology Fund (CTF). For the period 2003-2019, total contribution to South 20 America and the Caribbean is about USD 3,558 million. The largest contributors to climate finance in the 21 region come from the GCF, which approved USD 824.2 million for 23 projects. Brazil is the top recipient 22 with USD 195 million, followed by Argentina with about USD 162 million. The second provider is the 23 Amazon Fund with USD 717 million assigned to 102 projects in Brazil. In 2018, the CTF has become the 24 third source of financing with USD 483 million dollars approved for 24 projects; the main recipient is Chile 25 with USD 16,207 million followed by Colombia with USD 170 million. The five largest projects approved in 26 the region in 2018 were through the GCF. Brazil (USD 195 million) received support for reducing energy 27 intensity across Brazilian cities, while Argentina (USD 103 million) received support to scale up investments 28 by Small and Medium sized Enterprises (SMEs) in renewable energy and energy efficiency. In both cases 29 finance is predominantly provided as concessional loans. 30 31 Climate financing in CSA is mainly focused on mitigation actions (high confidence). In South America and 32 the Caribbean, 73% (USD 2,579 million) of funding to date has supported mitigation. Only 21% (USD 761 33 million) of the funding supports adaptation projects and the remaining 4% (USD 217 million) supports 34 multi-focus projects. Of the 51 new projects in South America and the Caribbean approved in 2018-2019, the 35 GCF financed USD 508 million in ten projects. Amazon Fund was next with USD 81 million in 10 projects. 36 While 32 the GCF focuses on large and transformative projects and programs and on a broader reform of the 37 policy framework in the Region, the Amazon Fund targets smaller project interventions. 38 39 Climate finance in the region is concentrated in Brazil receiving one third of the region’s funding, and 41 40 mitigation activities receiving more than six times that of adaptation from multilateral climate funds. By the 41 size of its PGB, Brazil is receiving the largest amount of financing; this leaves the poorest countries with 42 little or no financing and therefore reinforces a vicious circle of poverty and vulnerability. If this is due to 43 Brazil being more successful presenting eligible projects, lack of commitment from other developing 44 countries or some other structural factors is an open question. In any case, compensation schemes for the 45 most vulnerable countries appear as required, given the differences in vulnerability to climate damages 46 (Antimiani et al., 2017). This is aggravated by the fact that funds management is in the hands of 47 supranational entities while inequalities remain in regions within a country, particularly in countries highly 48 centralized as is the case for countries in the region. 49 50 COVID-19 recovery plans can present synergistic effects for climate change adaptation (medium confidence: 51 low evidence, high agreement). A key decision point for adaptation will be how the world responds to the 52 pandemic. The global recovery can serve as a catalyst to increased and more equitable climate financing. 53 Globally, recovery packages will likely have the power to change the global trajectory towards meeting the 54 targets of the Paris Agreement and building a more just future (Forster et al., 2020). Several factors are 55 relevant to the design of economic recovery packages: the long run economic multiplier, contributions to the 56 productive asset base and national wealth, speed of implementation, affordability, simplicity, impact on 57
ACCEPTED VERSIO
N
SUBJECT TO FIN
AL EDITS
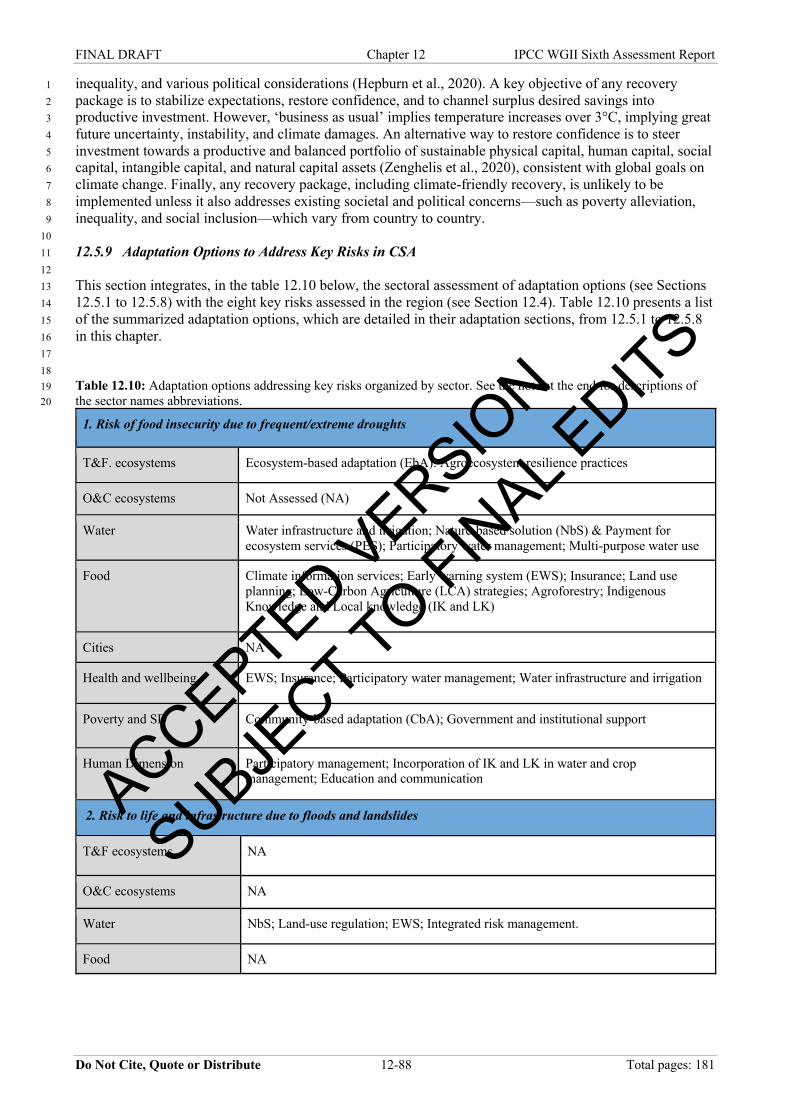
FINAL DRAFT Chapter 12 IPCC WGII Sixth Assessment Report
Do Not Cite, Quote or Distribute 12-88 Total pages: 181
inequality, and various political considerations (Hepburn et al., 2020). A key objective of any recovery 1 package is to stabilize expectations, restore confidence, and to channel surplus desired savings into 2 productive investment. However, ‘business as usual’ implies temperature increases over 3°C, implying great 3 future uncertainty, instability, and climate damages. An alternative way to restore confidence is to steer 4 investment towards a productive and balanced portfolio of sustainable physical capital, human capital, social 5 capital, intangible capital, and natural capital assets (Zenghelis et al., 2020), consistent with global goals on 6 climate change. Finally, any recovery package, including climate-friendly recovery, is unlikely to be 7 implemented unless it also addresses existing societal and political concerns—such as poverty alleviation, 8 inequality, and social inclusion—which vary from country to country. 9 10 12.5.9 Adaptation Options to Address Key Risks in CSA 11 12 This section integrates, in the table 12.10 below, the sectoral assessment of adaptation options (see Sections 13 12.5.1 to 12.5.8) with the eight key risks assessed in the region (see Section 12.4). Table 12.10 presents a list 14 of the summarized adaptation options, which are detailed in their adaptation sections, from 12.5.1 to 12.5.8 15 in this chapter. 16 17 18 Table 12.10: Adaptation options addressing key risks organized by sector. See the note at the end for descriptions of 19 the sector names abbreviations. 20
1. Risk of food insecurity due to frequent/extreme droughts
T&F. ecosystems Ecosystem-based adaptation (EbA): Agroecosystem resilience practices
O&C ecosystems Not Assessed (NA)
Water Water infrastructure and irrigation; Nature-based solution (NbS) & Payment for ecosystem services (PES); Participatory water management; Multi-purpose water use
Food Climate information services; Early warning system (EWS); Insurance; Land use planning; Low-Carbon Agriculture (LCA) strategies; Agroforestry; Indigenous Knowledge and Local knowledge (IK and LK)
Cities NA
Health and wellbeing EWS; Insurance; Participatory water management; Water infrastructure and irrigation
Poverty and SD Community-based adaptation (CbA); Government and institutional support
Human Dimension Participatory management; Incorporation of IK and LK in water and crop management; Education and communication
2. Risk to life and infrastructure due to floods and landslides
T&F ecosystems NA
O&C ecosystems NA
Water NbS; Land-use regulation; EWS; Integrated risk management.
Food NA
ACCEPTED VERSIO
N
SUBJECT TO FIN
AL EDITS
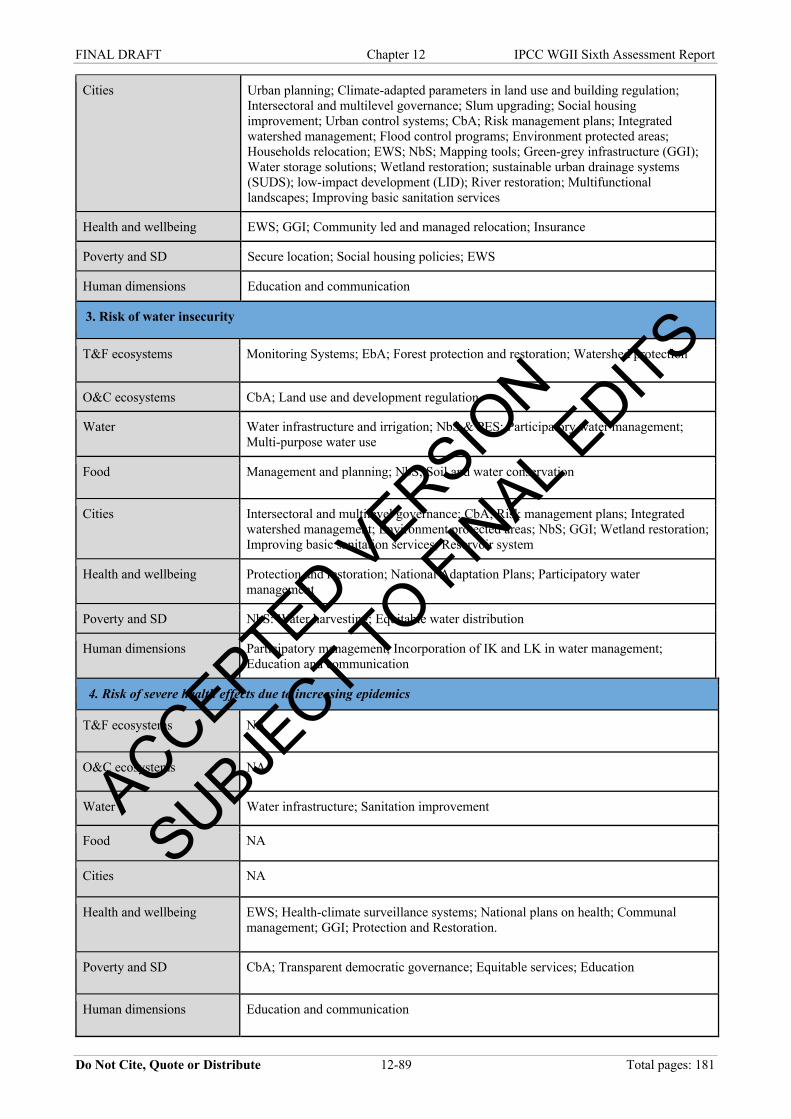
FINAL DRAFT Chapter 12 IPCC WGII Sixth Assessment Report
Do Not Cite, Quote or Distribute 12-89 Total pages: 181
Cities Urban planning; Climate-adapted parameters in land use and building regulation; Intersectoral and multilevel governance; Slum upgrading; Social housing improvement; Urban control systems; CbA; Risk management plans; Integrated watershed management; Flood control programs; Environment protected areas; Households relocation; EWS; NbS; Mapping tools; Green-grey infrastructure (GGI); Water storage solutions; Wetland restoration; sustainable urban drainage systems (SUDS); low-impact development (LID); River restoration; Multifunctional landscapes; Improving basic sanitation services
Health and wellbeing EWS; GGI; Community led and managed relocation; Insurance
Poverty and SD Secure location; Social housing policies; EWS
Human dimensions Education and communication
3. Risk of water insecurity
T&F ecosystems Monitoring Systems; EbA; Forest protection and restoration; Watershed protection
O&C ecosystems CbA; Land use and development regulation
Water Water infrastructure and irrigation; NbS & PES; Participatory water management; Multi-purpose water use
Food Management and planning; NbS; Soil and water conservation
Cities Intersectoral and multilevel governance; CbA; Risk management plans; Integrated watershed management; Environment protected areas; NbS; GGI; Wetland restoration; Improving basic sanitation services; Reservoir system
Health and wellbeing Protection and restoration; National Adaptation Plans; Participatory water management
Poverty and SD NbS: Water harvesting; Equitable water distribution
Human dimensions Participatory management; Incorporation of IK and LK in water management; Education and communication
4. Risk of severe health effects due to increasing epidemics
T&F ecosystems NA
O&C ecosystems NA
Water Water infrastructure; Sanitation improvement
Food NA
Cities NA
Health and wellbeing EWS; Health-climate surveillance systems; National plans on health; Communal management; GGI; Protection and Restoration.
Poverty and SD CbA; Transparent democratic governance; Equitable services; Education
Human dimensions Education and communication
ACCEPTED VERSIO
N
SUBJECT TO FIN
AL EDITS
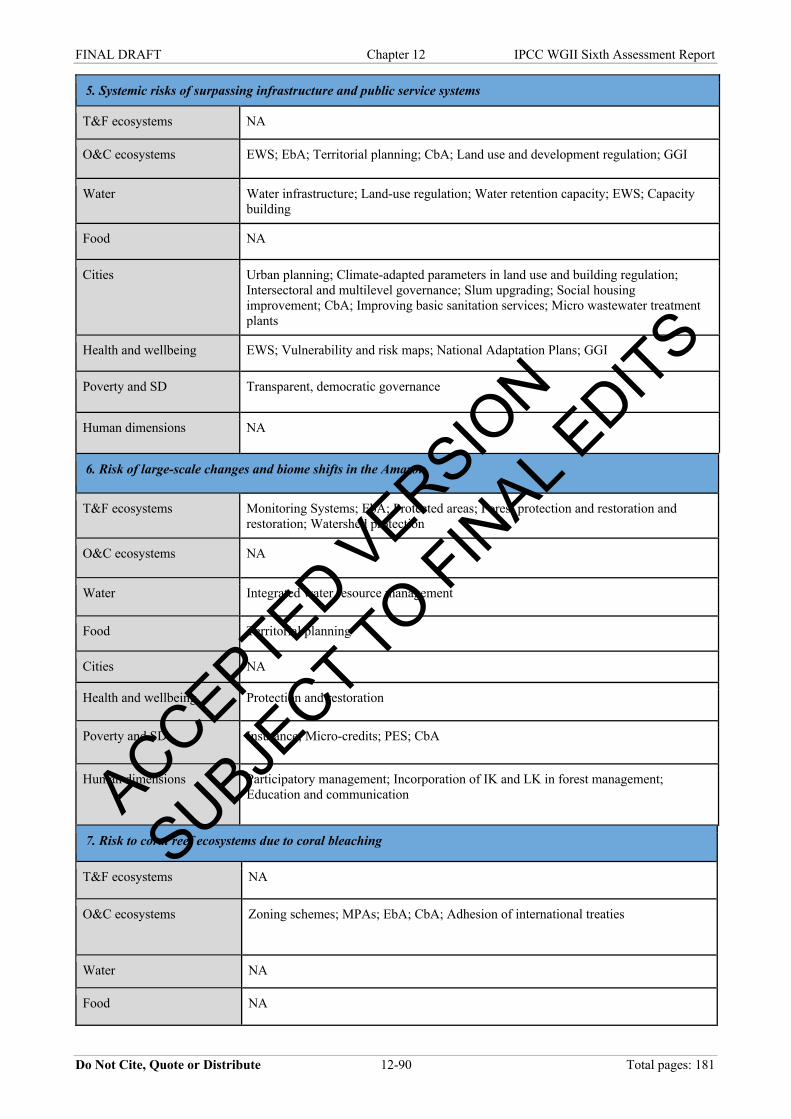
FINAL DRAFT Chapter 12 IPCC WGII Sixth Assessment Report
Do Not Cite, Quote or Distribute 12-90 Total pages: 181
5. Systemic risks of surpassing infrastructure and public service systems
T&F ecosystems NA
O&C ecosystems EWS; EbA; Territorial planning; CbA; Land use and development regulation; GGI
Water Water infrastructure; Land-use regulation; Water retention capacity; EWS; Capacity building
Food NA
Cities Urban planning; Climate-adapted parameters in land use and building regulation; Intersectoral and multilevel governance; Slum upgrading; Social housing improvement; CbA; Improving basic sanitation services; Micro wastewater treatment plants
Health and wellbeing EWS; Vulnerability and risk maps; National Adaptation Plans; GGI
Poverty and SD Transparent, democratic governance
Human dimensions NA
6. Risk of large-scale changes and biome shifts in the Amazon
T&F ecosystems Monitoring Systems; EbA; Protected areas; Forest protection and restoration and restoration; Watershed protection
O&C ecosystems NA
Water Integrated water resource management
Food Territorial planning
Cities NA
Health and wellbeing Protection and restoration
Poverty and SD Insurance; Micro-credits; PES; CbA
Human dimensions Participatory management; Incorporation of IK and LK in forest management; Education and communication
7. Risk to coral reef ecosystems due to coral bleaching
T&F ecosystems NA
O&C ecosystems Zoning schemes; MPAs; EbA; CbA; Adhesion of international treaties
Water NA
Food NA
ACCEPTED VERSIO
N
SUBJECT TO FIN
AL EDITS
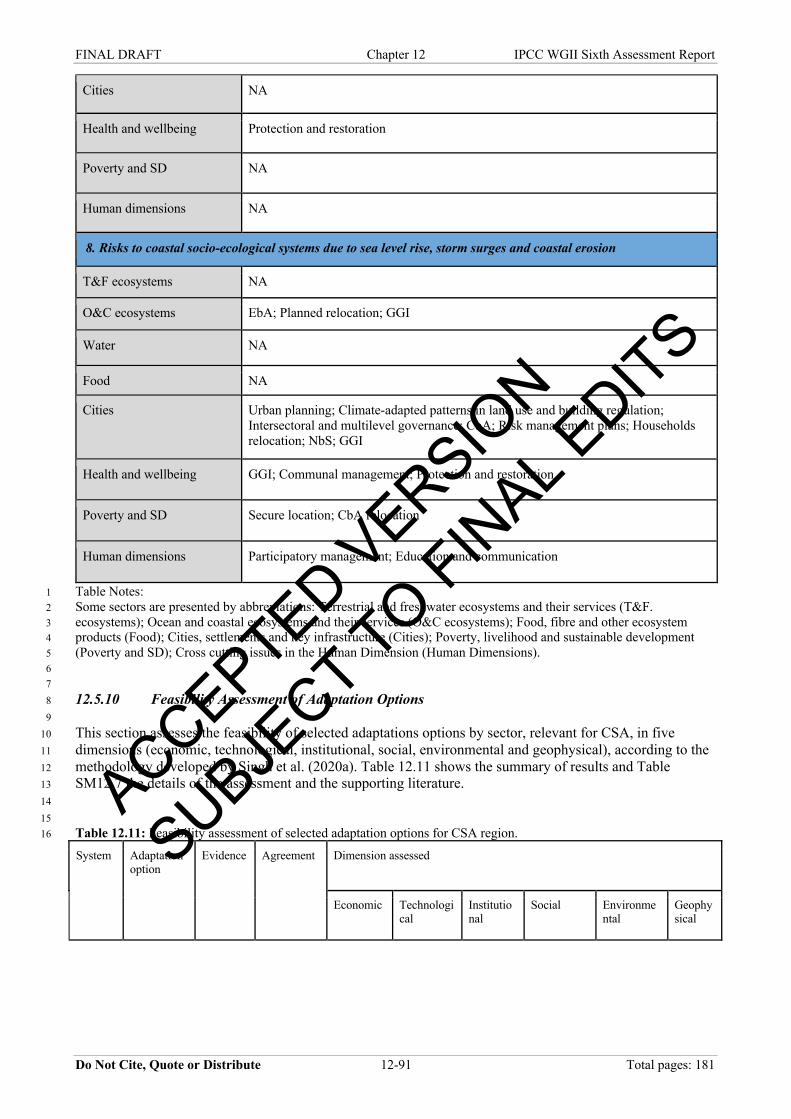
FINAL DRAFT Chapter 12 IPCC WGII Sixth Assessment Report
Do Not Cite, Quote or Distribute 12-91 Total pages: 181
Cities NA
Health and wellbeing Protection and restoration
Poverty and SD NA
Human dimensions NA
8. Risks to coastal socio-ecological systems due to sea level rise, storm surges and coastal erosion
T&F ecosystems NA
O&C ecosystems EbA; Planned relocation; GGI
Water NA
Food NA
Cities Urban planning; Climate-adapted patterns in land use and building regulation; Intersectoral and multilevel governance; CbA; Risk management plans; Households relocation; NbS; GGI
Health and wellbeing GGI; Communal management; Protection and restoration
Poverty and SD Secure location; CbA relocation
Human dimensions Participatory management; Education and communication
Table Notes: 1 Some sectors are presented by abbreviations: Terrestrial and freshwater ecosystems and their services (T&F. 2 ecosystems); Ocean and coastal ecosystems and their services (O&C ecosystems); Food, fibre and other ecosystem 3 products (Food); Cities, settlements and key infrastructure (Cities); Poverty, livelihood and sustainable development 4 (Poverty and SD); Cross cutting issues in the Human Dimension (Human Dimensions). 5 6 7 12.5.10 Feasibility Assessment of Adaptation Options 8 9 This section assesses the feasibility of selected adaptations options by sector, relevant for CSA, in five 10 dimensions (economic, technological, institutional, social, environmental and geophysical), according to the 11 methodology developed by Singh et al. (2020a). Table 12.11 shows the summary of results and Table 12 SM12.7 the details of the assessment and the supporting literature. 13 14 15 Table 12.11: Feasibility assessment of selected adaptation options for CSA region. 16
System Adaptation option
Evidence Agreement Dimension assessed
Economic Technological
Institutional
Social Environmental
Geophysical
ACCEPTED VERSIO
N
SUBJECT TO FIN
AL EDITS
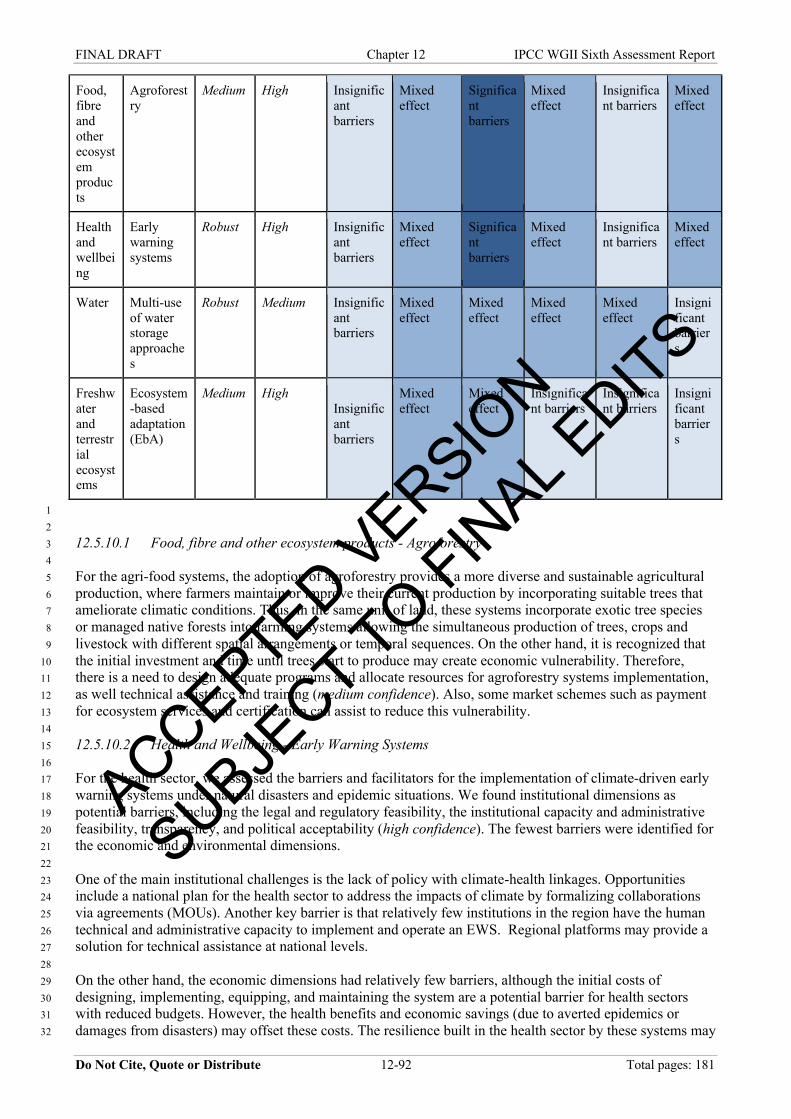
FINAL DRAFT Chapter 12 IPCC WGII Sixth Assessment Report
Do Not Cite, Quote or Distribute 12-92 Total pages: 181
Food, fibre and other ecosystem products
Agroforestry
Medium High Insignificant barriers
Mixed effect
Significant barriers
Mixed effect
Insignificant barriers
Mixed effect
Health and wellbeing
Early warning systems
Robust High Insignificant barriers
Mixed effect
Significant barriers
Mixed effect
Insignificant barriers
Mixed effect
Water Multi-use of water storage approaches
Robust Medium Insignificant barriers
Mixed effect
Mixed effect
Mixed effect
Mixed effect
Insignificant barriers
Freshwater and terrestrial ecosystems
Ecosystem-based adaptation (EbA)
Medium High Insignificant barriers
Mixed effect
Mixed effect
Insignificant barriers
Insignificant barriers
Insignificant barriers
1 2 12.5.10.1 Food, fibre and other ecosystem products - Agroforestry 3 4 For the agri-food systems, the adoption of agroforestry provides a more diverse and sustainable agricultural 5 production, where farmers maintain or improve their current production by incorporating suitable trees that 6 ameliorate climatic conditions. Thus, in the same unit of land, these systems incorporate exotic tree species 7 or managed native forests into farming systems allowing the simultaneous production of trees, crops and 8 livestock with different spatial arrangements or temporal sequences. On the other hand, it is recognized that 9 the initial investment and time until trees start to produce may create economic vulnerability. Therefore, 10 there is a need to design adequate programs and allocate resources for agroforestry systems implementation, 11 as well technical assistance and training (medium confidence). Also, some market schemes such as payment 12 for ecosystem services and certification can assist to reduce this vulnerability. 13 14 12.5.10.2 Health and Wellbeing - Early Warning Systems 15 16 For the health sector, we assessed the barriers and facilitators for the implementation of climate-driven early 17 warning systems under natural disasters and epidemic situations. We found institutional dimensions as 18 potential barriers, including the legal and regulatory feasibility, the institutional capacity and administrative 19 feasibility, transparency, and political acceptability (high confidence). The fewest barriers were identified for 20 the economic and environmental dimensions. 21 22 One of the main institutional challenges is the lack of policy with climate-health linkages. Opportunities 23 include a national plan for the health sector to address the impacts of climate by formalizing collaborations 24 via agreements (MOUs). Another key barrier is that relatively few institutions in the region have the human 25 technical and administrative capacity to implement and operate an EWS. Regional platforms may provide a 26 solution for technical assistance at national levels. 27 28 On the other hand, the economic dimensions had relatively few barriers, although the initial costs of 29 designing, implementing, equipping, and maintaining the system are a potential barrier for health sectors 30 with reduced budgets. However, the health benefits and economic savings (due to averted epidemics or 31 damages from disasters) may offset these costs. The resilience built in the health sector by these systems may 32
ACCEPTED VERSIO
N
SUBJECT TO FIN
AL EDITS
FINAL DRAFT Chapter 12 IPCC WGII Sixth Assessment Report
Do Not Cite, Quote or Distribute 12-93 Total pages: 181
be applicable to other economic sectors that can benefit from an early warning of an oncoming extreme 1 event and associated health impacts. 2 3 12.5.10.3 Water - Multi-use of water storage approaches 4 5 For the water sector, geophysical and economic dimensions do not pose a major barrier due to the potential 6 reduction of flood hazard exposure, physical-technical viability of project implementation, different suitable 7 economic mechanisms for joint public-private financing and more efficient water use. However, limited 8 institutional capacities and the social-environmental impacts of large water infrastructure (Section 12.5.3) 9 reduce the institutional, social, environmental and, to some extent, technological feasibility. This may be a 10 potential barrier to the adaptive approach of multi-use water storage (medium confidence). 11 12 12.5.10.4 Freshwater and terrestrial ecosystems - Ecosystem-based adaptation (EbA) 13 14 In the terrestrial and freshwater ecosystems sector, we assessed the feasibility of implementing EbA options 15 in the CSA region. Given that EbA encompasses a wide range of projects, techniques and political and 16 socioeconomic arrangements, extreme care should be taken to apply these general findings to particular 17 cases. EbA can enhance food sovereignty and carbon stocks and foster SDG by protecting and restoring 18 ecosystems health and productivity. EbA is a strategy that frequently involves bottom-up decision making 19 and local communities’ empowerment and usually contributes to inequality reduction. EbA tends to benefit 20 vulnerable groups, but aspects such as the impact on socioeconomic inequalities when implemented should 21 be taken into account. 22 23 In general, EbA does not require high technologies for local communities. However, limitations in technical 24 assistance and funding for specific key technologies and training may act as a barrier for EbA adoption 25 (medium confidence). EbA practices can reduce risk in several ways by increasing awareness among 26 communities and providing food diversity and production. EbA is recognized as a desirable policy for most 27 stakeholders in CSA, particularly for being a strategy that incorporates environmental and social concerns. 28 Nonetheless, it is important that all stakeholders agree on the goals and methods for EbA to be effective. 29 Lack of institutional coordination, clear goals and strategies were identified as a potential barrier for EbA 30 implementation. EbA is heavily based in local and Indigenous knowledge, as well as ecological academic 31 knowledge. 32 33 For the adaptation options analysed, significant barriers and mixed effects were observed for the institutional 34 dimension, which indicates the relevance of the design and implementation of public policies and 35 institutional arrangements for effective adaptation in the region. Considering the results, there is a need to 36 advance initiatives, programs and projects that facilitate adaptation to climate change. In the same way, 37 barriers were evidenced in the technological dimension, which indicates the importance of increasing access 38 and diffusion of appropriate techniques and technologies in order to face the challenges of climate change in 39 the region. 40 41 42 12.6 Case Studies 43 44 12.6.1 Nature-based Solutions in Quito, Ecuador 45 46 Nature-based Solutions (NbS) are related to the maintenance, enhancement, and restoration of biodiversity 47 and ecosystems as a means to address multiple concerns simultaneously (Kabisch et al., 2016). NbS can 48 trigger sustainability transitions. For example, conservation and restoration of natural ecosystems are prone 49 to promote synergy between mitigation, adaptation and sustainable development. Ecosystem-based 50 Adaptation- EbA can be seen as a type of NbS deployed in response to climate change vulnerability and risk 51 (Greenwalt et al., 2018), combining the objectives of reducing the vulnerability of human and increasing the 52 resilience of natural systems (IPCC, 2014). 53 54 The Municipal Quito District in Ecuador covers 4235 km2 of mountainous territory that ranges from 500 to 55 5000 m.a.s.l. That territory has followed a pattern of urbanization common in Latin America: its population 56 has increased from around 500,000 people in the 1970s, to nearly 3 million inhabitants by 2020, of which 57
ACCEPTED VERSIO
N
SUBJECT TO FIN
AL EDITS
FINAL DRAFT Chapter 12 IPCC WGII Sixth Assessment Report
Do Not Cite, Quote or Distribute 12-94 Total pages: 181
80% live in urban areas (Municipio del Distrito Metropolitano de Quito, 2016). A massive inflow of people 1 immigrated in the early 1970s due to various causes, including the search for the rents created as a result of 2 the oil boom in the Ecuadorian Amazon, better working conditions, health, education and cultural services, 3 in comparison with the rural areas or in mid-sized cities. As a result, the city underwent an exponential 4 growth, claiming valuable agricultural and forestry areas, and natural ecosystems, in the peripheries. Many 5 of the new neighbourhoods were established through land invasions or informal markets, in many cases over 6 steep slopes, in water sources and agricultural or conservation areas (high confidence) (Cuvi, 2015; Gómez 7 Salazar and Cuvi, 2016). That exponential population growth, coupled with urban sprawl, poses many 8 challenges to the city, including those related to climate change. 9 10 Mean air temperature and annual rainfall (measured through instruments since 1891 and inferred through 11 historical records of rogation ceremonies since 1600), are increasing, combined with an increase in 12 seasonality (i.e., longer periods of drought) and extreme weather events, particularly stronger precipitations 13 (Serrano Vincenti et al., 2017; Domínguez-Castro et al., 2018). Two impacts related to warmer air conditions 14 are the displacement of the freezing line currently placed at 5100 m.a.s.l. (Basantes-Serrano et al., 2016), 15 followed by glacier retreat and the upward displacement of mountainous ecosystems (very high confidence) 16 (Vuille et al., 2018; Cuesta et al., 2019). The key ecosystem that regulates water provision for the city is the 17 paramo, and only about 5% of this process is related with glaciers, so the combined effects of climate change 18 on both systems, coupled with land use change and fires, can reduce the availability of water for agriculture, 19 human consumption and hydropower. Other important climatic hazards and impacts are the increase of solar 20 radiation, the heat island effect and fires (high confidence) (Anderson et al., 2011; Armenteras et al., 2020; 21 Ranasinghe et al., 2021). Almost half of the days of each year, Quito’s population is exposed to levels of UV 22 radiation above 11 according to the World Health Organization scale (Municipio del Distrito Metropolitano 23 de Quito, 2016). 24 25 Various policies, programs and projects have been created for the promotion of urban green spaces, 26 protected areas, water sources and watersheds monitoring, conservation and ecosystem restoration, air 27 pollution monitoring and control, and urban agriculture. Among those actions, three recent are commonly 28 highlighted. The first is the Fund for the Protection of Water (FONAG), established in 2000 with funds of 29 national and international organizations, to promote the protection of the water basins that supply most of the 30 drinking water. It is a PES-Scheme (Payment for Ecosystem Services) enabled through a public-private 31 escrow. The projects include conservation, ecological restoration, and environmental education for a new 32 culture of water, in a context opposed to the commodification of natural resources (Kauffman, 2014; Bremer 33 et al., 2016; Coronel T, 2019). FONAG was innovative in the use of trust funds in a voluntary, decentralized 34 mechanism and has inspired more than 21 other water funds in the region; nevertheless, its narrative of 35 success has also been said to over-simplify and misrepresent some complex interactions between 36 stakeholders as well as within communities and their land management practices (Joslin, 2019). 37 38 The second highlighted initiative is the project AGRUPAR (Participative Urban Agriculture), launched as a 39 public initiative in 2002 with international cooperation funds at the beginning. It was aimed to provide 40 assistance to poorer urban and peri-urban populations, to initiate and manage orchards as well as domestic 41 animals such as chickens and guinea pigs, dedicated for self-sustenance and commerce. AGRUPAR provides 42 and finances training, seeds and seedlings, greenhouses, certifications and marketing support, spaces where 43 farmers can sell directly their products to consumers. In 2016, AGRUPAR gave assistance to more than 4000 44 farmers managing orchards of various scales that combined produce, annually, more than 500 tonnes. The 45 program has direct impacts on nutrition, generation of work for women, production of healthy food, 46 reduction of runoff, recycling of organic waste, social cohesion, among others (very high confidence) 47 (Thomas, 2014; Cuvi, 2015; Rodríguez-Dueñas and Rivera, 2016; Clavijo Palacios and Cuvi, 2017). 48 49 A third initiative is the creation of a municipal system of protected areas, locally named Áreas de 50 Conservación y Uso Sustentable (ACUS). This system covers an area of 1320 km², nearly one third of the 51 Municipal Quito District. Half of this landscape (680 km2) is covered by montane forests and paramos 52 (Torres and Peralvo, 2019). These forests provide direct water, food and fibres for about 20,000 people, and 53 indirectly a rural landscape for a growing number of urban citizens and foreign tourists that practice 54 ecotourism and look for fresh and healthy food. During the last three decades, this area has witnessed a high 55 density of public and private conservation and restoration efforts that aim to regain ecological integrity and 56 improve human well-being in deforested and degraded landscapes (Mansourian, 2017; Zalles, 2018; Wiegant 57
ACCEPTED VERSIO
N
SUBJECT TO FIN
AL EDITS
FINAL DRAFT Chapter 12 IPCC WGII Sixth Assessment Report
Do Not Cite, Quote or Distribute 12-95 Total pages: 181
et al., 2020). Quito’s system of protected areas constitutes a primary strategy for fostering links between 1 urban and rural citizens as a means of understanding the ecological dependence of urban metropolises to 2 their surrounding natural landscapes. Along the same lines, these areas constitute a key element to increase 3 the adaptive capacity of rural livelihoods and contribute to mitigating climate change through landscape 4 restoration, sustainable production and forest conservation (high confidence). 5 6 Other NbS’ actions have been the restoration of small basins, locally named quebradas, under different 7 schemes of management and participation (medium evidence, very high agreement) (da Cruz e Sousa and 8 Ríos-Touma, 2018), or the transformation since 2013 of a larger portion of the old Quito airport into an 9 urban park. Nevertheless, Quito city still has to deal with challenges in social, economic, infrastructural and 10 environmental spheres. A major pending environmental issue is air pollution, as there is a high level of 11 pollutants affecting the city in general, and specially the most vulnerable groups (high confidence) 12 (Zalakeviciute et al., 2018; Alvarez-Mendoza et al., 2019; Estrella et al., 2019; Hernandez et al., 2019; 13 Rodríguez-Guerra and Cuvi, 2019). Another major issue is the continuous sprawl of new neighbourhoods, 14 mainly through informal processes, that diminish the urban resilience because of the destruction of 15 conservation and food production areas, sources of water, and the dispersion of settlements without primary 16 services, among other consequences (Gómez Salazar and Cuvi, 2016). 17 18 12.6.2 Anthropogenic Soils, an Option for Mitigation and Adaptation to Climate Change in Central and 19
South America. Learning from the “Terras Pretas de Índio” in the Amazon 20 21 Amazon Dark Earths (ADEs), also known as “Terras Pretas de Índio”, are anthropogenic soils derived from 22 the activities associated to settlements and agricultural practices of pre-Hispanic societies in the Amazon 23 (Woods and McCann, 1999; Lehmann et al., 2003; Sombroek et al., 2003). Most of the ADEs identified so 24 far are 500 to 2500 years old (de Souza et al., 2019). According to Maezumi et al. (2018a) polyculture 25 agroforestry allowed the development of complex societies in the eastern Amazon around 4500 years ago. 26 Agroforestry was combined with the cultivation of multiple crops and the active and progressive increase in 27 the proportion of edible plant species in the forest, along with hunting and fishing. The formation of ADEs, 28 as a result of these activities, provided the basis for a food production system that supported a growing 29 human populations in the area (Maezumi et al., 2018a). 30 31 Amazon Dark Earths are the result of the accumulation and incomplete combustion of waste materials such 32 as ceramic artefacts and organic residues from harvest, weeding, food processing (including cooking) and 33 other activities (Lima et al., 2002; Hecht, 2003; Kämpf et al., 2003). ADEs are characterized by their 34 increased fertility in relation to adjacent soils; with high contents of organic carbon (C) (mainly as charcoal) 35 as well as inorganic nutrients, especially phosphorus (P) and calcium (Ca); and high Carbon/Nitrogen ratios 36 (high confidence) (Moline and Coutinho, 2015; Alho et al., 2019; Barbosa et al., 2020; Pandey et al., 2020; 37 Soares et al., 2021; Zhang et al., 2021). They also exhibit high cation exchange capacity (CEC) and moisture 38 retention among others properties (Hecht, 2003; Kämpf et al., 2003; Falcão et al., 2009). Charcoal content is 39 a key indicator of pre-Hispanic fire activity and sedentary occupation, which is evidence of the anthropic 40 origin of these soils (high confidence) (Hecht, 2017; Maezumi et al., 2018b; Alho et al., 2019; Barbosa et al., 41 2020; Iriarte et al., 2020; Montoya et al., 2020; Shepard et al., 2020). 42 43 Accumulation of organic residues and low intensity fires management are recognized as key elements for 44 ADEs formation. ADEs originating around settlements show a relatively high density of ceramic artefacts 45 and are named Terras pretas. They present a higher content of Ca and P than those originated from 46 agriculture activities which are known as Terras mulatas (Hecht, 2003). 47 48 There is a robust and growing body of research from different disciplines that gives high relevance to ADEs 49 in the region. It has been shown through archaeological and paleoclimatic data that Amazonian societies 50 which based their agricultural management on “Terras Pretas de Índio", were more resilient to the changing 51 climate due to increased soil fertility and water retention capacity (de Souza et al., 2019). Additionally, low 52 organic carbon degradability over long time periods, associated with high contents of charcoal or pyrogenic 53 carbon, makes these soils an important C sink (medium confidence: robust evidence, medium agreement) 54 (Lehmann et al., 2003; Guo, 2016; Trujillo et al., 2020), which is particularly relevant in an area like the 55 Amazon, that could change from a net carbon sinks to a net carbon source as a consequence of 56 anthropogenic climate change (Maezumi et al., 2018b). 57
ACCEPTED VERSIO
N
SUBJECT TO FIN
AL EDITS
FINAL DRAFT Chapter 12 IPCC WGII Sixth Assessment Report
Do Not Cite, Quote or Distribute 12-96 Total pages: 181
1 The Indigenous agricultural practices which originated ADEs are thought to be associated with a more 2 sedentary agricultural model than the current slash and burn and shifting cultivation practices. Although this 3 is a controversial topic, as the precise definition of slash and burn and shifting cultivation is presently under 4 discussion (Hecht, 2003); several present-day local and Indigenous agricultural practices, including in-field 5 burning and nutrient additions from food processing and residue management, have been recognized as 6 promoting high organic carbon and nutrient soil contents similar to the ones found in ADEs (Hecht, 2003; 7 Winklerprins, 2009). 8 9 At present, ADEs are estimated to cover up to 3.2% of the Amazon basin and are highly valued for their 10 persistent fertility, becoming a key resource for sustainable agriculture for Amazon communities in a climate 11 change context (Altieri and Nicholls, 2013; Maezumi et al., 2018a; de Souza et al., 2019). Based on the 12 lessons learned from the Terras Pretas de Índio, some researches have proposed the development of 13 technologies to promote a new generation of anthropogenic soils (e.g., Kern et al. (2009); Lehmann (2009); 14 Schmidt et al. (2014); Bezerra et al. (2016); Kern et al. (2019)). Among the technologies based on ADEs 15 learnings Biochar, obtained by slow pyrolysis of agricultural residues, is the most explored application found 16 in literature (Mohan et al., 2018; Matoso et al., 2019; Amoah-Antwi et al., 2020). The dual purpose of 17 increased soil fertility and carbon sequestration is considered an important goal in order to develop 18 sustainable agriculture in a climate change context (Kern et al., 2019). 19 20 Preservation of the practices and knowledge associated with these soils is vital for sustainable agriculture in 21 a climate change scenario in the Amazon. It will greatly contribute to the preservation of valuable 22 Indigenous knowledge as well as the contribution to the development of new adaptation and mitigation 23 technologies among other unexplored solutions. 24 25 12.6.3 Towards a Metropolitan Water-related Climate Proof Governance (re)configuration? The case of 26
Lima, Perú 27 28 Lima-Callao Metropolitan City, capital of Perú is facing recurrent climate disasters showing lessons on 29 water-related climate-proof governance reconfiguration: 1) when disasters affect the poor and rich 30 population, dominant actors prioritize the integral city’s resilience and development, and coordinate and 31 collaborate within a concertation manner across institutional levels and geographical scales (Hommes and 32 Boelens, 2017; Miranda Sara, 2021), even having different ideas, discourses, and power, recognizing that no 33 one single actor has enough power; 2) water-related climate change scenarios require comprehensive, 34 transverse, multi-sectoral, multi-scalar, multiple types of actor´s knowledge (expert, tacit, codified and 35 contextual embedded (Pfeffer, 2018) and transparent information to manage the tensions and even conflicts 36 when some knowledge is not shared or restricted particularly when lower risk perception and higher risk 37 tolerance are present; 3) a concertative (processes which involve a variety of actors and has become 38 mandatory in Peru) strategy to localize the climate action shows quicker, more effective and transparent 39 results (medium confidence, robust evidence, medium agreement) (Miranda Sara and Baud, 2014; Pepermans 40 and Maeseele, 2016; Siña et al., 2016; Miranda Sara et al., 2017). 41 42 Being the second driest city in the world, Lima is highly vulnerable to drought and heavy rainfall in the 43 nearby Andean highlands (Schütze et al., 2019). Located on the Pacific Coast with more than 10 million 44 inhabitants, suffers from both flooding, mudslides disasters and water stress, being more frequently affected 45 by heavy rain peak events (1970, 1987, 1998, 2012, 2014, 2015 and 2017) (very high confidence) (Mesclier 46 et al., 2015; Miranda Sara et al., 2016; French and Mechler, 2017; Vázquez-Rowe et al., 2017; Escalante 47 Estrada and Miranda, 2020). In addition to water unequal distribution in quantity and pricing, one million 48 inhabitants lack water connections (Ioris, 2016; Miranda Sara et al., 2017; Vázquez-Rowe et al., 2017) as a 49 result of a lack of long-term city planning and lack of integration with water and risk management. Climate 50 change scenarios were ignored or denied, particularly when the budget allocation for preventive actions was 51 necessary (high confidence) (Miranda Sara et al., 2016; Allen et al., 2017a). 52 53 In 2014, the Water Company (SEDAPAL) together with the Lima Metropolitan Municipality (LMM), ANA, 54 and other organizations agreed on a Lima Action Plan for Water (Schütze et al., 2019). The same year, the 55 Lima Metropolitan Municipality (LMM) approved the Climate Change Strategy defining adaptation and 56
ACCEPTED VERSIO
N
SUBJECT TO FIN
AL EDITS
FINAL DRAFT Chapter 12 IPCC WGII Sixth Assessment Report
Do Not Cite, Quote or Distribute 12-97 Total pages: 181
mitigation measures (Miranda Sara and Baud, 2014), based on technical and scientific action research within 1 interactive, and iterative concertation multi-actor processes. 2 3 However, in 2015, municipal elections shifted Lima’s and later Peru’s political power to parties associated 4 with climate deniers at a high cost to the people, city infrastructure, and housing. Beginning of 2017, 5 buildings along rivers, ravines, and slopes suffered from floods, huaycos (mudslides), the whole city suffered 6 potable water cuts (Vázquez-Rowe et al., 2017) and vector-borne diseases affecting particularly the poorer 7 but also richer inhabitants. 8 9 “Coastal Niño”, affected the whole country, as a consequence, in 2018, the Peruvian government passed the 10 Framework Law for Climate Change, Law No. 30754, a unique political decision, to assure the integration of 11 climate change concerns in public policies and investment projects. The law defines local governments 12 mandates on Local Climate Action Plans. The 2019 municipal elections brought new local authorities to 13 Lima and by 2020, 19 district municipalities developed their Adaptation Measures adopting the Metropolitan 14 Climate Change Strategy with support of Cities for Life Foro and GIZ (Foro Ciudades Para la Vida, 2021), 15 in 2021 LMM approved its Local Climate Change Plan (LCCP) and other 10 (out of 51 with Callao) 16 municipalities concluded the elaboration of their LCCP with support of the Global Covenant of Mayors and 17 the European Union. 18 19 The institutionalized culture of participation in Peru did lead to a broader concept of concertation, wherein 20 practices of collaborative planning were developed to allow actors to build up socially supported agreements, 21 decisions and take actions without losing sight of their principles. These processes have been applied to 22 reduce risks, to adapt and to anticipate uncertain and unknown futures; and introducing climate change 23 concerns within a complex political and institutional environment surrounded by corruption scandals 24 (Vergara, 2018; Durand, 2019) and growing political polarization. 25 26 Several processes have been set in motion to engage citizen participation and promote climate action 27 planning: 1) The LMM with the Climate Action Plan processes reopened the Climate Change Technical 28 Group of the Municipal Environmental Commission whose work ended in the approval of the Lima Local 29 Action Plan of Climate Change (MML, 2021), 2) The River Basin Council is developing the River Basin 30 Management Plan led by the National Authority of Water (ANA); 3) The Metropolitan Lima Urban 31 Development Plan is finalizing a citizen consultation, with the support of a high-level Consultation Group. 32 33 Such processes include strong discussions, conflicts, and the recognition of other’s discourses and types of 34 knowledge, to build up scenarios that “visualize” and anticipate what might happen. These processes require 35 democratic, transparent, and decentralized institutions, providing clear mandates and strong political will to 36 support them, so the views of the poor and vulnerable are included, being able to make themselves heard, 37 even if their power remains limited (Chu et al., 2016). Opportunities for the reconfiguration of socio-political 38 and technological water governance are emerging based on socially supported agreements (Miranda Sara and 39 Baud, 2014; Miranda Sara, 2021). Although the water governance configuration faces the paradox that 40 current water demands of all users combined may no longer be feasible within ecological limits and future 41 climate change consequences (Miranda Sara et al., 2016; Schütze et al., 2019). 42 43 12.6.4 Strengthening Water Governance for Adaptation to Climate Change: Managing Scarcity and 44
Excess of Water in the Pacific Coastal area of Guatemala 45 46 Guatemala experiences high climate inter-annual variability now increased from the effect of climate change 47 (INSIVUMEH, 2018; Bardales et al., 2019). Impacts on human settlements, agriculture and ecosystems 48 result from both excess and reduced precipitation (high confidence) (Section 12.3.1.4). Guerra (2016) argues 49 that deficient integrated water resource management in the country is the main reason for those impacts. A 50 case in point is that of rivers Madre Vieja and Achiguate where an intense El Niño event triggered dryer 51 conditions and, in turn, a crisis and conflict that reached national proportions. Progress in local water 52 governance helped to solve that crisis and contributed to tackle challenges posed by reduced precipitation 53 and flood risk in southern Guatemala. 54 55 The ENSO event that started in November 2014 and ended in July 2016 (CIIFEN, 2016) has been the most 56 intense since records commenced in 1950 (NOAA, 2019). Its effects were felt in different parts of the world 57
ACCEPTED VERSIO
N
SUBJECT TO FIN
AL EDITS
FINAL DRAFT Chapter 12 IPCC WGII Sixth Assessment Report
Do Not Cite, Quote or Distribute 12-98 Total pages: 181
and, Guatemala and the rest of Central America experienced an intense water scarcity due to a significant 1 reduction in rainfall (high confidence) (IICA, 2015; Scientific American, 2015). River flow in the dry 2 months is related to precipitation levels in the previous rainy season and thus, ENSO has an effect on river 3 flow rates. Two of the main rivers in the Pacific coast of Guatemala, Madre Vieja and Achiguate, dried out 4 completely at the beginning of 2016, triggering a nearly violent local conflict that caught attention at the 5 national level (Guerra, 2016; Gobernación de Escuintla et al., 2017). In addition to the severe drought, the 6 rivers dried because of over-extraction by multiple users (60 in the case of Madre Vieja). This had happened 7 before to a lesser extent in the last 20 years during the critical months of the dry season. Lack of regulation, 8 coordination mechanisms, information, and other elements of water governance was the root cause of the 9 problem, exacerbated by the drier conditions during the intense El Niño resulting in the intensification of an 10 existing conflict (high confidence) (Guerra, 2016). 11 12 Roundtables were set up to foster dialogue between numerous stakeholders including communities, agri-13 export companies, governmental organisations, municipalities, all led by the local governor (Gobernación de 14 Escuintla et al., 2017). Agreements included: to keep a minimum of the rivers flowing all the way to the sea; 15 to set up a monitoring and verification system for levels of river flow; and to restore riparian forests. A 16 system was set up to monitor river flow in different points along the rivers on a daily basis in the dry season 17 using a simple WhatsApp-based system to communicate the warnings and monitor compliance. Four years 18 on, the rivers had not dried out and conflict was kept to a minimum. Rural communities can use rivers for 19 recreational purposes and for fishing all year round, whilst plantations (large and small) can use water for 20 irrigation (rationally) and keep producing. Similar schemes and interactions started happening in other rivers 21 in the Pacific coast of Guatemala, with positive results, particularly keeping the rivers flowing all through the 22 dry season as can be seen in the report of river flows for years 2017, 2018 and 2019 (ICC, 2019b). 23 24 A key actor in the improvement of water governance has been the Private Institute for Climate Change 25 Research (ICC). This is a unique initiative that was created in 2010 and is funded primarily by the private 26 sector of Guatemala to help the country advance in climate change mitigation and adaptation (Guerra, 2014). 27 The institute works alongside local governments, communities and private companies in several topics apart 28 from integrated water management. Its role is merely technical-scientific, being in charge of the water 29 monitoring system, generating data on weather and hydrology, and providing support to other stakeholders. 30 31 Local governance was also essential for the implementation of flood risk management actions (high 32 confidence). Guerra et al. (2017) explained how impacts were significantly reduced in the Coyolate river 33 watershed, also in the Pacific coast of Guatemala, thanks to flood protection that was designed and 34 implemented in a technical and integrated manner. This was a result of strong and active participation of 35 local communities, companies and the local municipality who demanded the central government to invest 36 effectively. The stakeholders provided some resources (financial and in-kind) and inspected the works. Some 37 flat areas of the lower Coyolate watershed used to flood annually causing economic damage for 38 communities. The areas covered by flood risk measures have not flooded which has avoided losses as well as 39 created conditions for investment to come and create jobs, improving life conditions for locals. Other 40 processes of participation and interaction between the authorities, the private sector and communities have 41 taken place in other watersheds for planning, action and investment for flood risk management. The ICC has 42 played a role by studying flood-prone areas, building capacities in communities, fostering public-private 43 coordination mechanisms, and providing much-needed technical assistance to local governments (ICC, 44 2019a). 45 46 Although some may argue that water governance is in the realm of development, it has made contributions in 47 reducing direct and indirect impacts of climate events and therefore, it can be seen as a key element for 48 climate adaptation (high confidence). 49 50 51 12.7 Knowledge Gaps 52 53 Data deficiencies and heterogeneity in quantity, quality and geographical bias in knowledge limit the 54 understanding of climate change, the evaluation of its impacts, and the implementation of adaptation and 55 mitigation measures (Harvey et al., 2018) in CSA. The number of publications is not representative with 56 respect to the sensitivity to climate change and vulnerability contexts of different subregions and sectors. 57
ACCEPTED VERSIO
N
SUBJECT TO FIN
AL EDITS
FINAL DRAFT Chapter 12 IPCC WGII Sixth Assessment Report
Do Not Cite, Quote or Distribute 12-99 Total pages: 181
This lack of representation in the mainstream literature may lead to a bias and, therefore, an underestimation 1 of the overall climate-related impact for some CSA subregions (Sietsma et al., 2021). The reason for 2 relatively few quantitative studies might be the complexities of socio-demographic and economic factors, 3 and the lack of long-term and reliable data in these areas (Harvey et al., 2018), along with other social, 4 economic and technical constraints. 5 6 Most studies that assess vulnerability to climate change do not yet follow the concept adopted since the Fifth 7 Assessment Report (AR5) which separates exposure as an external variable (WGII AR5 Figure SPM 1) 8 (IPCC, 2014), and many still use the A and B system of climate change scenarios from AR4, as adoption of 9 the RCP models has been slow. There is still limited literature on severe risks and little specific and explicit 10 consideration of risk drivers in the region. Moreover, limits to adaptation and the effectiveness of adaptation 11 measures in CSA remain largely understudied. 12 13 The research of the interactions between climate change and socioeconomic processes is underdeveloped 14 (Barnes et al., 2013; Leichenko and O'Brien, 2019; Thomas et al., 2019). There is limited understanding of 15 the multilevel synergistic effects of climate change and other drivers including economic development from 16 household to country level (Wilbanks and Kates, 2010; Leichenko and Silva, 2014; Tanner et al., 2015a; 17 Carey et al., 2017). In the region, this deficit is deeper for sectors other than agriculture, water and food. 18 19 12.7.1 Knowledge Gaps in the Subregions 20 21 The knowledge gaps in the eight subregions are quite heterogeneous. In CA, climate change research is 22 notably insufficient in all sectors included in this report, considering that climatic change, variability, and 23 extremes are and will severely impact this subregion, and the vulnerability of the social and natural systems 24 is high. Data deficiencies must be overcome as renewed research on climate change updates models, 25 scenarios, and projected impacts across sectors and levels (i.e., household to country). In NWS, there is a 26 lack of studies on the relationships with increased fire events, and the impacts on the infrastructure of all 27 kinds, on certain lowland, marine and coastal ecosystems, and on ecosystem functioning and the provision of 28 environmental services. Experimental studies are rare, most necessary to identify critical ecological 29 thresholds to support the decision-making processes, linking glacier retreat to its consequences on 30 biodiversity and ecosystems, combined with different land-use trajectories. Complex interactions with 31 processes such as peace agreements in Colombia are yet to be studied (Salazar et al., 2018). In NSA, there is 32 still a limited amount of peer-reviewed literature, addressing the implications of climate change on 33 Indigenous cultures and their livelihoods. In SAM, further data are needed on the vulnerability of traditional 34 populations, impacts on water availability and soil degradation, risks to biodiversity and resilience of 35 ecosystems, attributed to climate change. 36 37 There is a knowledge gap about the likely impact of climate change on NES biodiversity, soil degradation, 38 and best adaptation measures. SES is the most urbanized sub-region of CSA, but there is a strong knowledge 39 deficits related to the design, implementation and evaluation of adaptation policy plans to climate change. 40 Forecasts related to risk prevention require new studies that address down-scaled climate change models 41 with concrete solutions to increase the city’s resilience. In SWS, there is a lack of long-term studies 42 addressing climate change impacts in terrestrial, freshwater and marine ecosystems which is mainly due to 43 the lack of integrated observational systems. There is a lack of studies projecting future impacts of climate 44 change on the cryosphere, water resources, hazards, risks and disasters on natural and human systems. This 45 is mainly due to the lack of systematic documentation, analysis and evaluation of adaptation strategies 46 adopted, as well as their limitations and the lessons learned from maladaptation processes. There is low 47 evidence about transformational adaptation to climate change and systems resilience. In SSA, there is a need 48 for information related to vulnerability and impacts of the direct effects of future climate change on cities, 49 energy infrastructure and health. Also, there is a gap of knowledge about financing of climate change 50 adaptation in SSA. 51 52 12.7.2 Knowledge Gaps by Sector 53 54 12.7.2.1 Terrestrial and Freshwater Ecosystems and their Services 55 56
ACCEPTED VERSIO
N
SUBJECT TO FIN
AL EDITS
FINAL DRAFT Chapter 12 IPCC WGII Sixth Assessment Report
Do Not Cite, Quote or Distribute 12-100 Total pages: 181
Advances on scientific knowledge on risks of climate change impact, vulnerability and resilience of 1 ecosystems is needed (Bustamante et al., 2020). Persistent climate change in tropical rainforest needs further 2 understanding, overall on the role of nutrients, deep-water availability and biodiversity. Further research is 3 needed to understand feedback to the climate systems of large-scale changes in the land surface in South 4 America biomes. The region has important freshwater Global-200 Ecoregions, including the Orinoco River 5 and Flooded Forests, Upper Amazon river and streams, and Amazon River and Flooded Forests being, 6 therefore, a priority for freshwater biodiversity conservation at a global scale (Manes et al., 2021) (Cross-7 Chapter Paper 1; Figure 12.8). There is, however, a clear knowledge gap on the impacts of climate change on 8 freshwater biodiversity in the region (Cross-Chapter Paper 1.2.3; Manes et al., 2021) . Lastly, more 9 interdisciplinary research is needed regarding conservation strategies and stable financial resources focusing 10 on adaptation of ecosystems in the region (Mistry et al., 2016; Gebara and Agrawal, 2017; Ruggiero et al., 11 2019; To and Dressler, 2019). 12 13 12.7.2.2 Ocean and Coastal Ecosystems and their Service 14 15 There is an important lack of knowledge about the health state of the ocean and coastal ecosystems along 16
CSA (i.e., social-ecological data integration, poor sampling efforts, lack of information about the value of 17
ecosystem services, lack of information about ecosystems cover and distribution, lack of studies 18
about climate change perception and social concerns), including marine fisheries (i.e., landing statistics 19 not available, lack of reliable information on the scope of resource extraction, among others). Poor or absent 20 monitoring programs (physical, environmental and biological variables) that feed alert and surveillance 21 systems are missing for CSA. There is a general absence of a continuous line of scientific research or an 22 adequate baseline information about the impacts of climate change, as well as a continuous monitoring of the 23 adaptation plans adopted in ocean and coastal ecosystems which limit the formulation of adequate 24 conservation and management programs. When studies are performed, inadequate access to data limits the 25 analyses of the existing information making difficult to detect climate change trends and impacts, as well as 26 the development of effective adaptation strategies. 27 28 12.7.2.3 Water 29 30 As in other sectors and environmental systems, for the water sector there are important limitations in terms 31 of monitoring and data collection. High-quality, long-term hydrological data are unevenly available for 32 different subregions and limit a better understanding of changes in river runoff, lake or groundwater changes. 33 Groundwater data is particularly scarce. There are important gaps related to projections of water resources 34 for the future. Much of the current knowledge on future changes in water resources and water scarcity and 35 flood risks is based on information from global-scale studies because studies specific to this region are 36 scarce. Several elements which are important for integrated water resource management such as water 37 quality, water demand, privatization and other economic dynamics, and nutrient, pollutant and sediment flux, 38 are poorly known currently due to missing data and insufficient efforts to monitor them. 39 40 12.7.2.4 Food, Fibre and other Ecosystem Products 41 42 Integrative evaluation on impacts on food security, including agricultural production, distribution and access, 43 leading to adaptation strategies is limited within the region. Limited information regarding cost-benefit 44 analyses of adaptation in the food production sector is available in the region. It is also important to advance 45 in a better understanding of the adaptation effects to avoid maladaptation and promote site-specific and 46 dynamic adaptation options considering available technologies. Compiling and systematizing existing 47 scientific and local knowledge on the relationship between forest, land cover/use, and hydrological services, 48 is a gap to be filled, in a broader perspective in the region, that can contribute to provide recommendations 49 and inform restoration practices and policies. The literature also highlights widespread gaps between 50 farmers’ information needs and services that are routinely available. There is evidence that when Climate 51 Information Services are constructed with farmer input and are targeted in a timely and inclusive manner, 52 they are a positive determinant of adaptation through the adoption of more resilient farm level practices. 53 However, currently assessments of the economic impact of Climate Information Services are scarce; hence 54 increased frequency of such studies is needed 55 56
ACCEPTED VERSIO
N
SUBJECT TO FIN
AL EDITS
FINAL DRAFT Chapter 12 IPCC WGII Sixth Assessment Report
Do Not Cite, Quote or Distribute 12-101 Total pages: 181
12.7.2.5 Cities, Settlements and Infrastructure 1 2 Despite the high level of urbanization in the region, studies on urban adaptation initiatives are still 3 underreported by municipalities and several practical results have not yet been demonstrated (Araos et al., 4 2016). It is particularly relevant to medium sized cities, as most of the literature and data available on 5 adaptation refers to the major capital cities. The potential of applying new resilient parameters in building 6 and land use regulation for adaptation is virtually underreported. The same can be said about the impact of 7 housing improvement and slum upgrading on climate resilience, even when initiatives are focused on 8 reducing environmental and climate risk. Also relevant in the region is a gap in research about NbS applied 9 to urban areas adaptation, as in the case of the urban forestry potential for adaptation (Barona et al., 2020). 10 Even though the importance of urban ecological infrastructure in providing ecosystem services, as flood 11 control, is reasonably documented, its practical application in urban planning in CSA is still limited 12 (Romero-Duque et al., 2020). Added to this is the lack of monitoring data on adaptation initiatives in 13 general, and in particular, on adaptation initiatives in water systems, that have already been implemented, 14 and its effects on risk reduction. Lack of monitoring data contributes to the lack of information about 15 maladaptation in urban areas and its consequences. Mobility and transport systems adaptation options are 16 virtually non-studied, while mitigation options receive a lot of attention. 17 18 12.7.2.6 Health and Wellbeing 19 20 There is a growing body of evidence that climate variability and climate change (CVC) cause harm to human 21 health in CSA. However, there is a lack of information about the current and future projected impact of CVC 22 events on overall illness and death in this region. It is challenging to attribute specific health outcomes to 23 CVC in models and field experiments due multiple factors including: 24 • lack of long-term high-quality health surveillance data 25 • multiple interacting infectious disease and chronic health issues 26 • mismatch in the spatial and temporal scales of CVC and health measurements 27 • complex climate and human system dynamics including nonlinear time-lags 28 • limited longitudinal data on non-climate factors that influence health outcomes (e.g., public health 29
interventions, migration of human populations, seasonal patterns in livelihoods). 30 31 The uncertainty inherent in predictive models also makes it challenging to expand current localized 32 knowledge on the impacts of infectious diseases associated with CVC to other regions or future climate 33 scenarios (UNEP, 2018). 34 35 Improved risk assessments based on better models and empirical research are needed to bridge the 36 knowledge gap and inform the design of adaptation strategies. A systematic multi-scalar analysis of the 37 impact of CVC on human health is needed across distinct social-ecological contexts. Data collection systems 38 need to be strengthened to accurately estimate the burden of mortality and morbidity from heat and extreme 39 events. The data deficit is a common problem in functioning civil registration and vital statistics systems, 40 including lack of information on causes of death (UNEP, 2018). In addition, there is a lack of consensus on 41 globally accepted and operational definitions for both climate-related extremes and exposures/outcomes. 42 43 For infectious disease (vector-borne and water-borne), the technology available to estimate current and 44 future risk areas is often limited by human or financial resource constraints in developing countries. There is 45 a geographical mismatch between the areas producing the technology and knowledge (in the global north), 46 and the areas most affected by CVC (in the global south). User-friendly tools that bring together climate and 47 health information—without the need for modelling or GIS expertise— are needed for health sector decision 48 makers. 49 50 There is a lack of studies that assess the feasibility of health adaptation measures (see Section 12.5.10), thus 51 limiting the ability of decision makers to compare different health interventions and identify bottlenecks for 52 implementation. The growing field of implementation science could help to address barriers to 53 mainstreaming climate information in the health sector as an adaptation strategy. 54 55 Finally, there is an almost complete void of studies that address relationships of climate change with 56 wellbeing in CSA, broadly understood as including emotions and moods, satisfaction with life, sense of 57
ACCEPTED VERSIO
N
SUBJECT TO FIN
AL EDITS
FINAL DRAFT Chapter 12 IPCC WGII Sixth Assessment Report
Do Not Cite, Quote or Distribute 12-102 Total pages: 181
meaning, and positive functioning, including the capacity for unimpaired cognitive functioning and 1 economic productivity (Section 7.1.4.1). 2 3 12.7.2.7 Poverty, Livelihood and Sustainable Development 4 5 Climate change is becoming a major obstacle in reducing poverty and overcoming poverty traps. There is a 6 need to better understand how poor and vulnerable communities are affected and the more effective ways to 7 prevent it. The large majority of the poor in the region are living in urban areas (UNDESA, 2019); urban 8 extreme poverty is increasingly more relevant, including the needs and priorities of informal settlements and 9 economies, but less studied within the interaction with climate change. There is little reporting of major 10 adaptation options implemented by or for vulnerable and poor urban dwellers (Ryan and Bustos, 2019; 11 Berrang-Ford et al., 2021). 12 13 Adaptation options are progressively being documented for poverty-related impacts in spite of the uncertain 14 context from climate impacts not being uniform across communities and the very local scale of the type of 15 adaptation responses needed (Miranda Sara et al., 2016; Rosenzweig et al., 2018; Dodman et al., 2019). 16 There is a huge gap in understanding how the poor are responding to climate change, what is needed to 17 support them, and the interconnections between development policies, poverty and risk reduction with 18 climate change actions (Ryan and Bustos, 2019; Satterthwaite et al., 2020). 19 20 The literature to assess the effectiveness of pro-poor or low-income adaptation options continues to be weak, 21 a very small proportion show results associated with adaptation efforts (Magrin et al., 2014; Berrang-Ford et 22 al., 2021). Without this kind of approach and in depth understanding there is the risk that top down climate 23 change adaptation options could reinforce poverty cycles and neglect cultural values, even eroding them 24 (Bartlett and Satterthwaite, 2016; Walshe and Argumedo, 2016; Allen et al., 2017a; Hallegatte et al., 2018; 25 Kalikoski et al., 2018; UN-Habitat, 2018). 26 27 The impacts of climate change on vulnerable groups are still understudied. There is little or no climate data 28 on remote mountain regions of CSA as well as research measuring the vulnerability of smallholders living 29 there, making it hard to assess the expected changes or the possible adaptation measures (Pons et al., 2017; 30 Donatti et al., 2019). 31 32 12.7.2.8 Cross Cutting Issues it the Human Dimension 33 34 There is a significant number of studies addressing the impacts of climate change on the Amazon forest 35 (Brienen et al., 2015; Doughty et al., 2015; Feldpausch et al., 2016; Rammig, 2020; Sullivan et al., 2020); 36 however, the assessment of tangible and intangible impacts of climate change on Indigenous Peoples 37 cultures and livelihoods in this forest, need to be further advanced (Brondízio et al., 2016; Hoegh-Guldberg 38 et al., 2018). 39 40 Studies on the perception of climate change in rural and urban populations throughout the region have 41 increased, but there is a lack of more specific research on the perception of specific groups, such as 42 economic or political actors, that influence public institutions and policies at the local, national level and 43 regional. 44 45 While studies on climate change gender differentiated impacts have grown over the past ten years in Central 46 and South America, studies on how gender intersects with other dimensions such as race, ethnicities, age or 47 rural/urban settings are still needed. This will help to further understand how gender inequalities are 48 connected to broader power structures of societies and, thus, to produce evidence on the importance of an 49 intersectional approach to climate change. 50 51 Regarding the relation of social movements and climate change adaptation, institutions and politics, two 52 major issues stem out: youth movements for climate change and the resistances, mainly urban, to climate 53 change adaptation policies. Little connection is found in research concentrating on resistance to climate 54 change adaptation policies and their interaction with the politics of place. Conflictivity related to climate 55 change is another under-studied issue. 56 57
ACCEPTED VERSIO
N
SUBJECT TO FIN
AL EDITS
FINAL DRAFT Chapter 12 IPCC WGII Sixth Assessment Report
Do Not Cite, Quote or Distribute 12-103 Total pages: 181
Although there are several case studies on migrations and displacements caused by strong and immediate 1 climatic threats, such as hurricanes or floods, and on slow-onset impacts, such as droughts or temperature 2 increase, there are gaps in the attribution or relative weight of climate change in these processes. 3 4 Still important to note is that synergies between mitigation, adaptation, risk reduction and sustainable 5 development have not been jointly explored, which would better facilitate adaptation policy approaches. 6 7 There are critical knowledge gaps in the interlinkages between social and environmental dynamics that are 8 important for climate change adaptation, as in Andean forest landscapes. A salient knowledge gap in this 9 thematic area is the need to characterize how multilevel and multi-actor governance systems can enable 10 sustainable land management practices, including ecosystem restoration (Mathez-Stiefel et al., 2017). More 11 capacities are needed to increase the generation of relevant knowledge. Even small grant programs can 12 sustain research projects that target the linkages between knowledge and decision making at multiple scales 13 (Báez et al., 2020). 14 15 16 12.8 Conclusion 17 18 Central and South America (CSA) is a broadly heterogeneous region in its topography, ecosystems, urban 19 and rural territories, demography, economy, cultures and climates. The region relies on a strong agrarian 20 economy in which small producers and large industries participate, but also large industrialized urban 21 centres, oil production and mining. The region is one of the most urbanized of the world and home to many 22 Indigenous Peoples, some still in isolation, and exhibits one of the highest rates of inequality, which is a 23 structural and growing characteristic in CSA. Poverty and extreme poverty rates are higher among children, 24 young people, women, Indigenous Peoples, migrant and rural populations but urban extreme poverty is also 25 growing (very high confidence). Socioeconomic challenges are intensified by COVID crisis. Most countries 26 in CA are already ranked as the highest risk level worldwide due to its exposure combined to high 27 vulnerability and low adaptive capacity; the lack of climate data and proper downscaling are challenging the 28 adaptation process (high confidence). 29 30 Many extreme events are already impacting the region and projected to intensify including warming 31 temperatures and dryness, sea level rise, coastal erosion, ocean and lake acidification resulting in coral 32 bleaching, and increasing frequency and severity of droughts in some regions, with associated decrease in 33 water supply, that impact agricultural production, traditional fishing, food security and human health (high 34 confidence). In Central America (CA), 10.5 million people are living in the so-called Dry Corridor, a region 35 with an extended dry season and now more erratic rainfall patterns. A water crisis in Brazil affected the 36 major cities of the country between 2014 and 2016, becoming more frequent since then. Severe droughts 37 have also been reported in Paraguay and Argentina. In contrast, the urbanised areas of Northern South 38 America (NSA) are highly exposed to extreme floods (41% of urban population in the Amazon Delta and 39 Estuaries). Urban areas in the region are vulnerable for many reasons, notably high rates of poverty and 40 informality, poor and unevenly distributed infrastructure, housing deficits, and the recurrent occupation of 41 risk areas (high confidence). 42 43 Socio-ecological systems in the region are highly vulnerable to climate change, which acts in synergy with 44 other drivers such as land use change and deep socioeconomic inequalities. Most biodiversity-rich spots in 45 the region will be negatively impacted. The Cerrado and the Atlantic Forest (two important biodiversity-rich 46 spots where about 72% of Brazil’s threatened species can be found) are exposed to different hazards 47 (extreme events, mean temperature increase) due to climate change. Many coastal areas and its concentrated 48 urban population and assets are exposed to sea level rise. Climate change is threatening several systems 49 (glaciers in the Andes, coral reefs in Central America, the Amazon forest) that are already approaching 50 critical conditions under risk of irreversible damage. 51 52 Extreme heat, droughts and floods will seriously affect CSA terrestrial and freshwater ecosystems. The high 53 poverty level increases the vulnerability to droughts, both in cities and rural areas, where people already 54 suffer from natural water scarcity (high confidence). The conversion of natural ecosystems to other land uses 55 exacerbate the adaptation challenges. Indigenous knowledge and local knowledge play an important role in 56 adaptation but are also threatened by climate change (high confidence). Ecosystem-based Adaptation (EbA) 57
ACCEPTED VERSIO
N
SUBJECT TO FIN
AL EDITS
FINAL DRAFT Chapter 12 IPCC WGII Sixth Assessment Report
Do Not Cite, Quote or Distribute 12-104 Total pages: 181
and Community-based Adaptation (CbA) have increased since AR5, with emphasis on freshwater 1 ecosystems and forests, including protected areas. Inadequate access to finance and technology are widely 2 identified as adaptation barriers (high confidence). 3 4 Many impacts in the economy are expected from climate change. Subsistence farmers and urban poor are 5 expected to be the most impacted by droughts and variable rainfall in the region (high confidence). The 6 increasing water scarcity is and will continue to impact food security, human health and well-being. The 7 impacts of the many landslides and floods affect mainly the urban poor neighbourhoods and are responsible 8 for the majority of the deaths related to natural disasters. Sea-level rise and intense storm surges are expected 9 to impact the tourism and industry in general. Internal and international migrations and displacements are 10 expected to increase (high confidence). Climatic drivers such as droughts, tropical storms and hurricanes, 11 heavy rains and floods, interact with social, political, geopolitical and economical drivers (high confidence). 12 13 The common patterns and problems, however, highlight also the possibilities for collaboration and learning 14 among the countries and institutions in the region in order to strengthen the interface between knowledge and 15 policy in climate change adaptation. All countries in the region have submitted their first and updated NDC, 16 and many have published their NAP, establishing priorities and formulating their own policies to cope with 17 climate change. 18 19 Various adaptation initiatives have been initiated in different sectors, focused on reducing poverty, 20 improving livelihood and achieving sustainable and resilient development. There is an increase in planned 21 and autonomous initiatives, led by community, government or the combination of both, engineering or 22 Nature-based Solutions (NbS). Climate smart agriculture is an effective option, in several conditions and 23 regions, to mitigate negative impacts of climate change. Disaster reduction solutions are increasingly used, 24 such as Early Warning Systems (EWS). Many and diverse initiatives are still poorly reported and evaluated 25 in the scientific literature, leading to challenges in its assessment and improvements, including the 26 consideration of the tacit Indigenous knowledge and Local Knowledge (IK and LK). The lack of climate data 27 and proper downscaling, weak governance, hindrance on financing, and inequality are constraining the 28 adaptation process (high confidence). 29 30 Adaptation measures have been increased and improved since AR5 in ocean and coastal ecosystems. The 31 majority of these measures are focused on EbA application through the application of protection and 32 recovery of already impacted ecosystems. Another battery of measures is focused on the management and 33 sustainability of marine resources subjected to fisheries, however these measures are not assessing current 34 and future climate change impacts but they are focused on decreasing the impact of other non-climate factors 35 such as overfishing or pollution. To date, along CSA there is an important lack of long-term research 36 addressing ocean and coastal ecosystems health and their species through continuous monitoring which is 37 one of the main barriers to adaptation. The number and type of adaptation measures for ocean and coastal 38 ecosystems and their contributions to humans are highly different among CSA countries which highlight in 39 number those measures related to increase the scientific research and monitoring followed by the 40 conservation of biodiversity, and changes in legislation (high confidence). On the other hand, those measures 41 that include the changes in financing (an important barrier) or the incorporation of traditional knowledge are 42 not always considered in national adaptation plans by CSA countries. 43 44 In the water sector a lack of systematic analysis and evaluation of adaptation measures prevail, although 45 important progress has been made since the AR5 in terms of understanding interlinkages between climate 46 change, human vulnerabilities, governance, policies and adaptation success (high confidence). NbS, Payment 47 for Ecosystems Services (PES), integrated water resource management, and integration of IK and LK have 48 proven potential of success, in particular if adopting approaches with inclusive negotiation formats for water 49 management with clear, just and transparent rights and responsibilities. 50 51 Climate change poses several challenges to the agri-food sector, impacting the agricultural production and 52 productivity, and posing at risk the food and nutritional security and the economy (high confidence). 53 Adapting agriculture while conserving the environment is a challenge for a sustainable and resilient food 54 production (high confidence). Adaptation in the region presents persistent barriers and limitations (Table 55 12.8), associated with investments and knowledge gaps (medium confidence). Climate change urges to 56
ACCEPTED VERSIO
N
SUBJECT TO FIN
AL EDITS
FINAL DRAFT Chapter 12 IPCC WGII Sixth Assessment Report
Do Not Cite, Quote or Distribute 12-105 Total pages: 181
advance in initiatives to improve education, technology and innovation of farming systems in the CSA 1 region. 2 3 Urban adaptation is limited by financing constraints, weak intersectoral and multilevel governance, and 4 deficits in the housing and infrastructure sectors, the overcoming of which is an opportunity for 5 transformative adaptation (high confidence). Short-term interventions are prevailing over long-term planning 6 (high confidence). Adaptation experiences in planning, land use and building regulation, urban control 7 systems and risk management have taken place throughout the region. Initiatives in social housing are 8 reducing risk, overcoming urgent deficits, but also adding to a transformative adaptation pathway (high 9 confidence). Hybrid (green-grey) infrastructure has been adopted for better efficiency in flood control, 10 sanitation, water scarcity and landslide prevention and coastal protection (high confidence). NbS including 11 green infrastructure and EbA are increasing in urban areas (high confidence), although isolated engineering 12 solutions are still widely practiced. The integration of transport and land use plans and the improvement of 13 public transport are key to urban adaptation; mitigation prevails over adaptation in the sector (high 14 confidence). 15 16 There is a growing body of evidence that climate variability and climate change are causing harm to human 17 health in CSA – including the increasing transmission of vector borne and zoonotic diseases, heat stress, 18 respiratory illness associated with fires, food and water insecurity associated with drought, among others 19 (medium confidence). In response, countries in the region are developing innovative adaptation strategies to 20 inform health decision making such as integrated climate-health surveillance systems and observatories, 21 forecasting of climate-related disasters, and epidemic forecast tools. However, institutional barriers (limited 22 resources, administrative feasibility, and political mandates) need to be addressed to ensure the sustained 23 implementation of adaptation strategies (high confidence). 24 25 Poor and vulnerable groups evidence limited political influence, fewer capacities and opportunities to 26 participate in decision and policy making being less able to leverage government support to invest on 27 adaptation measures (very high confidence). Participatory processes are developing adaptation measures 28 strengthening local capacities; literature assessing the success of such initiatives remains limited. Limits to 29 adaptation include access to land, territory and resources, labour and livelihood opportunities, knowledge 30 gaps and poor multi actor coordination. Social organization, participation and governance reconfiguration are 31 essential for building climate resilience (very high confidence). 32 33 Social organization, participation, governance, education and communications to increase perception and 34 knowledge, are essential for building the resilience to adapt and overcome expected and unexpected climate 35 impacts (very high confidence). The focus on inclusion and enrolling of the full range of actors in adaptation 36 processes, including vulnerable populations, has shown good results in the region (high confidence). 37 However, existing poverty and inequality, unbalances on power relations, corruption, weak governance and 38 institutions, structural problems and high levels of risk tolerance may reinforce poverty and inequality cycles 39 (high confidence). In addition, the continued exposure of critical infrastructure and valuable assets are signs 40 of persisting maladaptation. 41 42 The development model prevailing in the region for the last decades has proven to be unsustainable, with the 43 emphasis on financial sources based on natural resource depletion and extraction and the persistence and 44 growing inequality. It is well recognized that climate adaptation measures, if carefully selected considering 45 the coupled human-environment systems, will provide significant contributions to the sustainable 46 development pathways of the region and to achieve the sustainable development goals (SDG) if implemented 47 together with comprehensive strategies to reduce poverty, inequality, and risks (high confidence). Adaptation 48 and the construction of resilience offer not only an opportunity to reduce climate change impacts, but also 49 the opportunity to reduce inequality and development gaps, to achieve dynamic economies, and to regulate 50 the sustainable use and transformation of the territory. 51 52 53 [START FAQ 12.1 HERE] 54 55
ACCEPTED VERSIO
N
SUBJECT TO FIN
AL EDITS
FINAL DRAFT Chapter 12 IPCC WGII Sixth Assessment Report
Do Not Cite, Quote or Distribute 12-106 Total pages: 181
FAQ 12.1: How are inequality and poverty limiting options to adapt to climate change in Central and 1 South America? 2
3 Poverty and inequality decrease human capacity to adapt to climate change. Limited access to resources 4 may reduce the ability of individuals, households and societies to adapt to the impacts of climate change and 5 variability because of the narrow response portfolio. Inequality limits responses available to vulnerable 6 segments as most adaptation options are resource-dependent. 7 8 Though poverty in Central and South America has decreased over the last 12 years, inequality remains as a 9 historic and structural characteristic of the region. In 2018, 29.5% of Latin America’s population (including 10 Mexico) were poor (182 million) and 10.2% were extremely poor (63 million), more than half of them living 11 in urban areas. In 2020, due to COVID crisis Gini coefficient projection of increases is ranging from 1.1% to 12 7.8%, poverty increased to 33.7% (209 millions) and extreme poverty to 12.5% (78 millions). 13 14 Poor populations have little or no access to good quality education, information, health systems and financial 15 services. They have lower chances to access resources such as land and water, good quality housing, risk 16 reducing infrastructure and services such as running water, sanitation and drainage. Their lack of political 17 clout and endowments limit their access to assets for withstanding and recovering from shocks and stresses. 18 Poverty, inequality, and high vulnerability to climate change are inter–related processes. Poor populations 19 are highly vulnerable to impacts from climate change and are usually located in areas of high exposure to 20 extreme events. The constant loss of assets and livelihoods both in urban and rural areas drives communities 21 into chronic poverty traps, exacerbating local poverty cycles and creating new ones. 22 23 For instance, climate–related reduced yields in crops, fisheries, and aquaculture have a substantial impact on 24 the livelihoods and food security of families and affect their options to cope and adapt to climate change and 25 variability. The impact of climate change in agriculture for Central and South America depends on 26 determinants such as availability of natural resources, access to markets, diversity of inputs and production 27 methods, quality and coverage of infrastructure, as well as socioeconomic characteristics of the population. 28 Impacts from climate change on small–scale farmers compromise the livelihoods and food security of rural 29 areas and consequently the food supply for urban areas. 30 31 Governments in the region have implemented several poverty–reduction programs. However, policies of 32 income redistribution and poverty alleviation do not necessarily improve climate risk management, hence 33 complementary policies integrating both social and material conditions are required. A study in Northern 34 Brazil shows risk management strategies for droughts and food insecurity did not change poverty incidences 35 between 1997–1998 and 2011–2012. Major shocks, such as climate and weather extreme events (e.g., floods, 36 heavy rains, droughts, frosts), reduce and destroy public and private property. For instance, the ENSO event 37 of 2017 in Peru caused losses estimated between USD 6 to 9 billion, affected more than a million inhabitants 38 and generated 370,000 new poor. In total, losses by unemployment, deaths, destruction and damage of 39 infrastructure and houses were around 1.3% of the Gross Domestic Product of Peru. 40 41 Low public expenditure on social infrastructure (health, education etc.), ethnic discrimination and social 42 exclusion reduce healthcare access, leaving poor people in entire regions mostly undiagnosed or untreated. In 43 a context of privatization policies of health care systems, research shows marginal people lack identifying 44 documents needed to access public services in Buenos Aires (Argentina), Mexico City (Mexico) and 45 Santiago de Chile (Chile), some of the most developed cities in the region. Consequences of this situation are 46 under reporting, low diagnosis, and low treatment of diseases such as vector–borne diseases such as dengue 47 and risk of diarrheal diseases originated by frequent floods in Amazonian riverine communities. Bias on 48 reporting access to health–care and incidence of diseases in marginal populations are usually region–49 dependent. For example, in Brazil’s Amazonian North in 2018, there were 2.2 medical doctors per 1000 50 inhabitants, while 4.95 medical doctors per 1000 inhabitants in São Paulo and 9.52 doctors in Santa Catarina. 51 Another example: pregnant women in remote Amazonian municipalities receive less prenatal care than 52 women in urban areas. These social inequities underlie systemic biases in health data–quality hindering 53 reliable estimation of disease burdens such as distribution of disease or birth and death registrations. For 54 Example, in Guatemala alternative Indigenous healthcare systems are responding to local needs by Mayan 55 communities. However, this remains unrecognized. The existence of health institutions based on Indigenous 56
ACCEPTED VERSIO
N
SUBJECT TO FIN
AL EDITS
FINAL DRAFT Chapter 12 IPCC WGII Sixth Assessment Report
Do Not Cite, Quote or Distribute 12-107 Total pages: 181
knowledge can reinforce the lack of universal coverage by central government healthcare, addressing the 1 miscalculation of morbidity, mortality, and cause–of–death among disadvantaged groups. 2 3 Inequality, informality and precariousness are particularly relevant barriers for adaptation. A significant part 4 of the construction sector in the region is informal and does not follow regulations for land use and 5 construction safety codes, and there is a lack of public strategies for housing access. Adaptive construction is 6 based upon up–to–date regulation and codes, appropriate design and materials, and access to infrastructure 7 and services. Decreasing inequality and eradicating poverty are crucial for achieving proper adaptation to 8 climate change in the region. Some experiences to fight poverty such as savings groups, microfinance for 9 improving housing or assets and community enterprises may also support specific adaptive measures. These 10 mechanisms should be widely accessible to poor groups and be complemented by comprehensive poverty 11 alleviation programs that include climate change adaptation. 12 13 [END FAQ 12.1 HERE] 14 15 16 [START FAQ 12.2 HERE] 17 18 FAQ 12.2: How have urban areas in Central and South America adapted to climate change so far, 19
which further actions should be considered within the next decades and what are the limits of 20 adaptation and sustainability? 21
22 Cities are becoming focal points for climate change impacts. The rapid urbanization in Central and South 23 America, together with accelerating demand for housing, resource supplies and social and health services, 24 put pressure on the already stretched physical and social infrastructure. In addition, migration is negatively 25 affecting the opportunities of cities to adapt to climate change. 26 27 Central and South America is the second most urbanized region in the world after North America with 81% 28 percent of its population being urban. 129 secondary cities with 500,000 inhabitants concentrate half of the 29 region's urban population (222 million). Another 65 million people live in megacities over 10 million each. 30 The population migrates among cities, resulting in more secondary cities and creating mega regions and 31 urban corridors. 32 33 Rapid growth in cities has increased the urban informal housing sector (e.g., slums, marginal human 34 settlements and others), which increased from 6 to 26 percent of the total residences from 1990 to 2015. 35 Coastal areas in Central and South America increasingly concentrate more urban centres. Researchers 36 indicate that between 3 to 4 million inhabitants will experience coastal flooding and erosion from sea–level 37 rise in all emission scenarios by 2100 considering Southern America alone. 38 39 A study on cities with more than 100,000 inhabitants shows the number of coastal cities significantly 40 increased from 42 to 420 between 1945 and 2014; they are located close to fragile ecosystems such as bays, 41 estuaries and mangrove forests, resulting in higher concentrations of population and economic activities. 42 This process degraded the ability of coastal ecosystems, such as mangroves, to reduce risks and provide 43 essential ecosystem services which help to prevent coastal erosion or maintain fish stocks. Moreover, it 44 reduced ports, tourism, along with income opportunities. 45 46 Climate change impacts on cities in Central and South America are strongly influenced by El Niño Southern 47 Oscillation (ENSO) associated with an increase of more extreme rainfall events. Urban areas are increasingly 48 dealing with floods, landslides, storms, tropical cyclones, water stress, fires, spread of vector–borne and 49 infectious diseases, damaging infrastructure, economic activities, built and natural environments and the 50 population's overall well–being. 51 52 Glacier retreat in the mountains will affect water runoff and water provision to Metropolitan cities such as 53 Lima, La Paz, Quito and Santiago who rely on rivers that originate in the high Andes. Lima, the second 54 driest capital city in the world, is vulnerable to drought and heavy rain peak events associated with climate 55 change. In Bogota lower precipitations and a tendency of increasing extreme events are expected in the 56
ACCEPTED VERSIO
N
SUBJECT TO FIN
AL EDITS
FINAL DRAFT Chapter 12 IPCC WGII Sixth Assessment Report
Do Not Cite, Quote or Distribute 12-108 Total pages: 181
coming decades. Hence, the protection of fragile ecosystems such as ‘paramo’ (fields at 3000 to 4000 1 m.a.s.l.) will be crucial for water supply to the city. 2 3 Sea level rise impacts cities located in low elevation coastal zones, not only because of direct coastal 4 flooding, coastal erosion and subsidence; but also because it aggravates the impact of storm surges, heat 5 wave energy and saltwater intrusion. 68 percent of the population of Surinam and 31 percent of the 6 population in Guyana live below 5 meters above sea level, while many sectors of Georgetown, the capital of 7 Guyana, are below sea level. Floods with increased frequency and severity of storm surges will also impact 8 the Rio de la Plata estuary and lower delta of the Parana River where Metropolitan Buenos Aires is located. 9 10 Over 80 percent of losses associated with climate-related risks concentrate in urban areas, and between 40 11 and 70 percent losses occur in cities with less than 100,000 inhabitants, most probably as a result of limited 12 capacities to manage disaster risks and low level of investments. 13 14 Despite consistent political and economic barriers, many cities in the region have adopted sustainable local 15 development agendas, which work to address a balanced urban development. The shortcomings of poor 16 development patterns are still very present in the cities and present important obstacles to adaptation 17 investment, as public investment in basic needs (mainly housing and sanitation) must be prioritized. 18 19 Cities struggle to address the immediate needs of their population while addressing longer–term needs 20 associated with climate adaptation, emissions reduction and sustainable development. Some cities are 21 moving forward to transformative adaptation, addressing drivers of vulnerability, building robust systems 22 and anticipating impacts. Besides government–led adaptation planning and action, individuals, communities 23 and enterprises have been incrementally adapting to climate changes autonomously over time. Municipalities 24 from Argentina, Peru, Chile, Equator, Brazil and Costa Rica are developing and implementing their Local 25 Climate Action Plans, experimenting and displaying best practices in adaptation. Both anticipatory 26 adaptation measures–choosing safe locations, building structurally–safe houses, choosing elevated places to 27 store valuables, building on stilts–and reactive adaptation measures are used; the latter incorporating 28 measures such as relocation, stabilization of slopes, afforestation, and greening of riverbanks. With 29 variations, these cities have included mechanisms to work across sectors and actors understanding it is 30 collective planning and actions, which will ensure that long term programs continue independently of 31 particular city administrations. 32 33 Cities are interconnected systems operating beyond administrative boundaries. Improved collaboration and 34 coordination is needed for integrated responses. Aside from good planning, cities need access to external 35 adaptation funds. Climate change adaptation requires long–term funding and investments, which are beyond 36 cyclical political terms. It is key to re–think how to make international adaptation funds reach cities and 37 innovate. For example, member cities of Global Covenant of Mayors in the region, together with Cities for 38 Life Forum in Peru, the Red Argentina de Municipios por el Cambio Climático (RAMCC), the Capital Cities 39 of the Americas facing Climate Change (CC35) and others, are pursuing this goal and applying directly for 40 international grants. New funding sources are required to help local governments and civil society. Cities and 41 locally driven adaptation initiatives can be funded by national governments and international organizations. 42 43 [END FAQ 12.2 HERE] 44 45 46 [START FAQ 12.3 HERE] 47 48 FAQ 12.3: How do climatic events and conditions affect migration and displacement in Central and 49
South America, will this change due to climate change, and how can communities adapt? 50 51 Migration and displacements associated with climatic hazards are becoming more frequent in Central and 52 South America, and it is expected they will continue to increase. These complex processes require 53 comprehensive actions in the places of origin and reception, both to improve adaptation in the more affected 54 places, and the conditions of the mobilizations. 55 56
ACCEPTED VERSIO
N
SUBJECT TO FIN
AL EDITS
FINAL DRAFT Chapter 12 IPCC WGII Sixth Assessment Report
Do Not Cite, Quote or Distribute 12-109 Total pages: 181
Migration of individuals, families and groups, voluntary and involuntary, is common in Central and South 1 America. People migrate nationally and internationally, temporarily or permanently, predominantly from 2 rural areas – often immersed in poverty – to urban areas. Common social drivers of migration in the region 3 are the economy, politics, land tenure and land management change, lack of access to markets, lack of 4 infrastructures, and violence; environmental drivers include loss of water, crops and livestock, land 5 degradation and sudden or gradual onset of climate hazards. 6 7 The increasing frequency and magnitude of droughts, tropical storms, hurricanes, and heavy rains producing 8 landslides and floods, have amplified internal movements, overall rural to urban. For instance, rural to urban 9 migration in Northern Brazil, or international migration from Guatemala, Honduras and El Salvador to North 10 America, are partly a consequence of prolonged droughts, which have increased the stress of food 11 availability in these highly impoverished regions. Diminished access to water is also a result of privatization 12 of that resource. In Central America, the majority of migrants are young men, reducing the labour force in 13 the places of origin. However, the migrants send back substantial amounts of money that have become the 14 main source of foreign exchange for their countries, and the main source of income for their families. 15 16 As poor people have less resources to adapt to changing conditions, they are usually the most impacted by 17 climate hazards, as they are already struggling to survive under normal conditions. These populations are the 18 most susceptible to migration, chiefly because of the loss of their livelihoods, their precarious housing and 19 settlements and the lack of money and international aid. Other important factors are the minimal 20 governmental support and assistance through social safety nets and extension services, the scarcity and low 21 quality of education and health services, the isolation and marginality, and the insecurity of land rights. 22 These same conditions, though, may hinder their mobility or even render them immobile. Nevertheless, in 23 some cases, despite worsening conditions, people decide not to move. 24 25 The magnitude and frequency of droughts and hurricanes are projected to keep increasing by 2050, which 26 may force millions of people to leave their homes. Climate models show some dry regions will become even 27 dryer in the coming decades, increasing the stress on small farmers who rely on rainfall to water their fields. 28 Glacier retreat and water scarcity are becoming strong drivers of migration in the Andes. Sea level rise 29 influences activities such as fishing and tourism, which will foster further migration. In Brazil, at least 0.9 30 million more people will migrate inter–regionally under future climate conditions. 31 32 Addressing migration and displacement requires diverse interventions: in dry regions it is recommended to 33 improve the water management in the places of origin of migration, including storage, distribution and 34 irrigation. Wet regions, lowlands, and floodplains will benefit from preventing construction on areas prone to 35 landslides and flooding. Government and international aid are also important for improving people’s options 36 to adapt and enhance their resilience to climate impacts. In northern Brazil, for example, government 37 financial support has significantly reduced the migration caused by droughts. Between Guatemala and 38 Canada there is a temporary migration program to bring in migrant workforce during the harvest season. The 39 United States is also increasing these types of legal temporary migration. 40 41 [END FAQ 12.3 HERE] 42 43 44 [START FAQ 12.4 HERE] 45 46 FAQ 12.4: How is climate change impacting and expected to impact food production in Central and 47
South America in the next 30 years and what effective adaptation strategies are and can be 48 adopted in the region? 49
50 Agriculture is a fundamental sector to the development of societies from the economic and social 51 perspectives, and so it is a major component of the adaptive strategies for Central and South America 52 countries. Implementation of sustainable agriculture practices such as improved management on native 53 grasslands or agroforestry systems for crop and livestock production, can increase productivity while 54 improving adaptability. 55 56
ACCEPTED VERSIO
N
SUBJECT TO FIN
AL EDITS
FINAL DRAFT Chapter 12 IPCC WGII Sixth Assessment Report
Do Not Cite, Quote or Distribute 12-110 Total pages: 181
Over the last two decades, countries throughout Central and South America have been developing rapidly. 1 The agriculture sector is fundamental to this development from economic and social perspectives. Some 2 countries of the region are amongst major food exporters in the world: 3
• Corn: three of the top ten exporters are Brazil, Argentina and Paraguay; 4 • Soybean exports: Brazil and Argentina are among the top five; Paraguay and Bolivia figure within 5
the twelfth; 6 • Coffee exports: five of the top ten export countries are Brazil, Colombia, Honduras, Peru and 7
Guatemala; 8 • Fruits: two of the top 10 fresh fruit export countries are Chile and Ecuador, 9 • Fishmeal exports globally are led by Peru, Chile and Ecuador; 10 • Beef: four of the top exporting countries are from this region – Brazil, Argentina, Uruguay and 11
Paraguay. 12 13 CSA is one of the regions with the highest potential to increase food supplies particularly to more densely 14 populated regions in Asia, Middle East and Europe. Better understanding the impact of the economy on the 15 environment and the contribution of the environment to the economy, is critical to identify opportunities for 16 innovation and promoting activities that could lead to sustainable economic growth without depleting natural 17
resources and increasing sensitivity to climate change and climate variability. The consideration of food as 18
a commodity instead of a common resource, leads to the accumulation of under-priced food 19
resources at the expense of natural capital. Without serious emissions reduction measures, climate 20 models project an average 1 to 4°C increase in maximum temperatures, and a 30 percent decrease in rainfall 21 towards 2050, across Central and South America. Tropical South America is projected to warm at higher 22 rates than the southern part of South America. Given these circumstances, some regions in Central and South 23 America (Andes region and Central America) will just meet, or fall below, the critical food supply/demand 24 ratio for their population. Meanwhile, the more temperate part of South America in the south is projected to 25 have agricultural production surplus. The challenge for this region will be to retain the ability to feed and 26 adequately nourish its internal population as well as making an important contribution to the food supplies 27 available to the rest of the world. 28 29 The Nationally Determined Contributions (NDCs) of most of the countries of Central and South America 30 expressly included agriculture as a major component of their adaptive strategy. From the recommendations 31 presented, five general adaptive themes, or imperatives, emerge: 1) inclusion of climate change projections 32 as a key element for Ministries of Agriculture and research institutes in their decision-making processes; 2) 33 support research and adoption of drought- and heat-tolerant crop varieties; 3) promotion of sustainable 34 irrigation as an effective adaptive strategy; 4) recovery of degraded lands and sustainable intensification of 35 agriculture to prevent further deforestation; and 5) implementation of climate smart practices and 36 technologies to increase productivity while improving adaptability. 37 38 Climate smart-practices provide a framework to operationalize actions aimed at understanding synergies 39 among productivity, adaptation and mitigation. Significant amount of evidence supports the potential for 40 climate smart-practices technologies to produce such triple wins as natural pastoral systems in the southern 41 region of South America. Such systems allow the combination of food production and environmental 42 sustainability. The production of meat based on native grasslands with grazing management that optimizes 43 forage allowance can achieve high production levels, while providing multiple ecosystem benefits. Optimal 44 forage allowance means offering the animals enough forage in order to meet requirements and while 45 avoiding overgrazing. This management practice simultaneously increases productivity, reduces greenhouse 46 gas emissions while improving soil carbon sequestration, and minimizes other environmental impacts such 47 as excess of nutrients, fossil energy use, and biodiversity loss. Pastoral farming systems that manage grazing 48 and feeding efficiently, are an example of integration between food security, environmental conservation and 49 nature-based adaptation to climate change. 50 51 Agroforestry systems are present in the tropical region of Central and Southern America. Trees are present in 52 a large part of the agricultural landscape of this region, either dispersed or in lines; supporting the production 53 of coffee, cocoa, fruits, pastures and livestock in various agroforestry configurations. In Central America, 54 shade-grown coffee reduces weed control and improves quality and taste of the product. Agroforestry uses 55 nitrogen-fixing trees (Leguminosae), such as Leucaena in Colombia, Inga in Brazil, to restore soil nitrogen 56 fertility. Tropical forest soils are generally nutrient-poor and unsuited to long-term agricultural use. Land 57
ACCEPTED VERSIO
N
SUBJECT TO FIN
AL EDITS
FINAL DRAFT Chapter 12 IPCC WGII Sixth Assessment Report
Do Not Cite, Quote or Distribute 12-111 Total pages: 181
converted to agriculture by cutting and burning natural vegetation tends to remain productive for only a few 1 years. Agroforestry and the so called silvopastoral systems, which incorporate trees into crop and livestock 2 systems, have been shown to make a dramatic impact on the maintenance and restoration of long term 3 productivity in agricultural landscapes, including degraded and abandoned land. Agroforestry systems can 4 provide major benefits through enhanced food security, stronger local economies, and increased ecosystem 5 services such as carbon storage, regulation of climate and water cycles, control of pests and diseases, and 6 maintenance of soil fertility. Because of these multiple goods and services, agroforestry practices are 7 considered one of the key strategies for the development of climate smart agriculture. 8 9 [END FAQ 12.4 HERE] 10 11 12 [START FAQ 12.5 HERE] 13 14 FAQ 12.5: How can Indigenous knowledge and practices contribute to adaptation initiatives in 15
Central and South America? 16 17 Indigenous Peoples have knowledge systems and practices that allow them to adapt to many climatic 18 changes. Adaptation initiatives based on Indigenous knowledge and practices are more sustainable and 19 legitimate among local communities. It is important to build effective and respectful partnerships among 20 Indigenous and non–indigenous researchers to co–produce climate relevant knowledge to enhance 21 adaptation planning and action in the region. 22 23 There are 28 million Indigenous Peoples in Central and South America (around 6.6% of the whole 24 population of the region). They belong to more than 800 groups living in territories covering a wide range of 25 ecosystems – from drylands to tropical forests to savannahs, coasts to mountains – and that share the land 26 with many other cultural and ethnic groups. In the region, Indigenous Peoples are often categorized as a 27 group highly vulnerable to climate change as they are frequently affected by socioeconomic inequalities and 28 the dominance by external powers. They often experience internal and external pressures over their 29 communal lands in forms of pollution, oil and mining, industrial agriculture, and urbanization. On the other 30 hand, it is important to recognize that Indigenous Peoples have knowledge systems and practices that allow 31 them to adapt to many climatic changes. Increasing scientific evidence shows that adaptation initiatives 32 based on Indigenous knowledge and practices are more sustainable and legitimate among local communities. 33 34 The wide range of adaptation practices based on Indigenous knowledge in the region include, among others: 35 increasing species and genetic diversity in agricultural systems through community seed exchanges; 36 promotion of highly diverse crop systems; ancient systems to collect and conserve water; fire prevention 37 strategies; observing and monitoring changes in communal ecological–agricultural calendar cycles; 38 recognizing changes in ecological indicators like migration patterns in birds, behaviour of insects and other 39 invertebrates and phenology of fruit and flowering species; and systematization and knowledge exchange 40 among communities. These practices represent a valuable cultural and biological heritage. 41 42 The Kichwa in the Ecuadorian Amazon cultivate Chakras (plots) within the rainforest. These plots combine 43 crops and medicinal herbs for both self–consumption and selling. Similar systems, like the Chakras in the 44 high Andes, the Milpas in Central America, and the Conucos in northern South America have been resilient 45 to social and environmental disturbances due to their outstanding agrobiodiversity (more than 40 species and 46 varieties can be present in one plot), microhabitat management and the associated knowledge and 47 institutions. 48 49 Traditional fire management among Indigenous Peoples of Venezuela, Brazil and Guyana is another 50 adaptation strategy based on a fine–tuned understanding of environmental indicators, associated with their 51 culture and worldviews. In these countries, Indigenous lands have the lowest incidence of wildfires, 52 significantly contributing to maintaining and enhancing biodiversity. These traditional practices have helped 53 to prevent large–scale and destructive wildfires, reducing the risk from rising temperature and dryness due to 54 climate change. 55 56
ACCEPTED VERSIO
N
SUBJECT TO FIN
AL EDITS
FINAL DRAFT Chapter 12 IPCC WGII Sixth Assessment Report
Do Not Cite, Quote or Distribute 12-112 Total pages: 181
Traditional agriculture of Mapuche Indigenous Peoples in Chile includes a series of practices that result in a 1 system more resilient to climate and non–climate stressors. Practices include water management, native seed 2 conservation and exchange with other producers (trafkintu), crop rotation, polyculture, and tree–crop 3 association. Similar practices can be found in Mayan communities in Guatemala at the other end of the 4 subcontinent. 5 6 Despite the increasing recognition and integration of Indigenous knowledge in adaptation practices and 7 policies in the region, important barriers for a more effective and transformative integration remain. Some of 8 the most relevant barriers include limited participation of Indigenous Peoples and local communities in 9 adaptation planning and the lack of sufficient consideration of non–climatic socioeconomic drivers of 10 vulnerability such as poverty and inequality. Also, scientific knowledge is commonly prioritized over 11 traditional, Indigenous knowledge, and local knowledge. However, some transformative efforts are emerging 12 Bolivian Indigenous organizations provide a notable example by contesting normative conceptions of 13 development as economic growth with more comprehensive views like harmony with Mother Earth and 14 “Sumak Kawsay” or “Good Living”. 15 16 Several strategies have been proposed to overcome existing barriers, including building effective and 17 respectful partnerships among Indigenous and non–indigenous researchers to co–produce climate change–18 relevant knowledge, and recognizing Indigenous Peoples as active actors who are continually developing 19 autonomous strategies to preserve their practices, beliefs and knowledge. The implementation of these and 20 other strategies can significantly enhance adaptation planning and action in the region. 21 22 [END FAQ 12.5 HERE] 23 24 25 26
ACCEPTED VERSIO
N
SUBJECT TO FIN
AL EDITS
FINAL DRAFT Chapter 12 IPCC WGII Sixth Assessment Report
Do Not Cite, Quote or Distribute 12-113 Total pages: 181
References 1 2 Abeldaño Zuñiga, R. A. and J. Fanta Garrido, 2020: Internal Displacement Due to Disasters in Latin America and the 3
Caribbean. In: Climate Change, Hazards and Adaptation Options: Handling the Impacts of a Changing Climate 4 [Leal Filho, W., G. J. Nagy, M. Borga, P. D. Chávez Muñoz and A. Magnuszewski (eds.)]. Springer International 5 Publishing, Cham, pp. 389-409. ISBN 978-3-030-37425-9. 6
Aburto, J. A., W. Stotz, G. Cundill and C. Tapia, 2021: Toward understanding the long-term persistence of a local 7 governance system among artisanal fishers in Chile. Ecology and Society, 26(3), doi:10.5751/ES-12479-260305. 8
Acosta-Jamett, G. et al., 2016: El Niño Southern Oscillation drives conflict between wild carnivores and livestock 9 farmers in a semiarid area in Chile. Journal of Arid Environments, 126, 76-80, 10 doi:10.1016/j.jaridenv.2015.08.021. 11
Acosta, M., F. Howland, J. Twyman and J.-F. Le Coq, 2019: Inclusión de género en las políticas de agricultura, 12 cambio climático, seguridad alimentaria y nutrición en Honduras y Guatemala. Hallazgos de un análisis de 13 políticas, leyes y estrategias nacionales. CCAFS Info Note, CGIAR Research Program on Climate Change, 14 Agriculture and Food Security (CCAFS), 5 pp. Available at: https://hdl.handle.net/10568/99696 (accessed 15 03/08/2021). 16
Adams, H., 2016: Why populations persist: mobility, place attachment and climate change. Population and 17 Environment, 37(4), 429-448, doi:10.1007/s11111-015-0246-3. 18
Adger, W. N., N. W. Arnell and E. L. Tompkins, 2005: Successful adaptation to climate change across scales. Global 19 Environmental Change, 15(2), 77-86, doi:10.1016/j.gloenvcha.2004.12.005. 20
Adler, V. et al., 2018: Vivienda ¿Qué viene?: de pensar la unidad a construir la ciudad [Adler, V. and F. Vera (eds.)]. 21 Interamerican Development Bank, 574 pp. Available at: http://dx.doi.org/10.18235/0001594 (accessed 22 25/08/2021). 23
Aggarwal, P. et al., 2019: Importance of considering technology growth in impact assessments of climate change on 24 agriculture. Global Food Security, 23, 41-48, doi:10.1016/j.gfs.2019.04.002. 25
Aguayo, R. et al., 2019: The glass half-empty: climate change drives lower freshwater input in the coastal system of the 26 Chilean Northern Patagonia. Climatic Change, 155(3), 417-435, doi:10.1007/s10584-019-02495-6. 27
Agudelo, J., P. A. Arias, S. C. Vieira and J. A. Martínez, 2019: Influence of longer dry seasons in the Southern Amazon 28 on patterns of water vapor transport over northern South America and the Caribbean. Climate Dynamics, 52(5), 29 2647-2665, doi:10.1007/s00382-018-4285-1. 30
Aguiar, A. P. D. et al., 2016a: Land use change emission scenarios: anticipating a forest transition process in the 31 Brazilian Amazon. Global Change Biology, 22(5), 1821-1840, doi:10.1111/gcb.13134. 32
Aguiar, L. M. S. et al., 2016b: Should I stay or should I go? Climate change effects on the future of Neotropical 33 savannah bats. Global Ecology and Conservation, 5, 22-33, doi:10.1016/j.gecco.2015.11.011. 34
Aguilar-Lome, J. et al., 2019: Elevation-dependent warming of land surface temperatures in the Andes assessed using 35 MODIS LST time series (2000–2017). International Journal of Applied Earth Observation and Geoinformation, 36 77, 119-128, doi:10.1016/j.jag.2018.12.013. 37
Aguilar, I., J. Pernillo and E. Cameros, 2019: "Mojados" por la sequía: hambre y migración en el corredor seco de 38 Guatemala. OXFAM, Guatemala. Available at: 39 https://reliefweb.int/sites/reliefweb.int/files/resources/Mojados%20por%20la%20sequ%C3%ADa%20Documento40 %20OXFAM%2020190423.pdf (accessed 03/06/2021). 41
Aguirre, C. et al., 2018: Insight into anthropogenic forcing on coastal upwelling off south-central Chile. Elementa 42 Science of Anthropocene, 6(1), 59-72, doi:10.1525/elementa.314. 43
Aguirre, N. et al., 2017: Potential impacts to dry forest species distribution under two climate change scenarios in 44 southern Ecuador. Neotropical Biodiversity, 3(1), 18-29, doi:10.1080/23766808.2016.1258867. 45
Agyeman, J., D. Schlosberg, L. Craven and C. Matthews, 2016: Trends and Directions in Environmental Justice: From 46 Inequity to Everyday Life, Community, and Just Sustainabilities. Annual Review of Environment and Resources, 47 41(1), 321-340, doi:10.1146/annurev-environ-110615-090052. 48
Ahmed, S., M. Meenar and A. Alam, 2019: Designing a Blue-Green Infrastructure (BGI) Network: Toward Water-49 Sensitive Urban Growth Planning in Dhaka, Bangladesh. Land, 8(9), doi:10.3390/land8090138. 50
Aitken, D., D. Rivera, A. Godoy-Faúndez and E. Holzapfel, 2016: Water Scarcity and the Impact of the Mining and 51 Agricultural Sectors in Chile. Sustainability, 8(2), 128, doi:10.3390/su8020128. 52
Akbari, H. and D. Kolokotsa, 2016: Three decades of urban heat islands and mitigation technologies research. Energy 53 and Buildings, 133, 834-842, doi:10.1016/j.enbuild.2016.09.067. 54
Albrecht, F. and G. Shaffer, 2016: Regional Sea-Level Change along the Chilean Coast in the 21st Century. Journal of 55 Coastal Research, 32(6), 1322-1332, doi:10.2112/JCOASTRES-D-15-00192.1. 56
Alcaldía de Medellín, 2012: Cinturón verde metropolitano, Alcaldía de Medellín, Medellín, Colombia, 84 pp. Available 57 at: 58 https://www.medellin.gov.co/irj/go/km/docs/wpccontent/Sites/Subportal%20del%20Ciudadano/Medio%20Ambie59 nte/Secciones/Publicaciones/Documentos/2012/ForoCiudadesSostenibles/1.%20Presentaci%C3%B3n%20CVM_60 Cinturones%20Verdes%20para%20ciudades%20sostenibles.pdf (accessed 17/06/2021). 61
ACCEPTED VERSIO
N
SUBJECT TO FIN
AL EDITS
FINAL DRAFT Chapter 12 IPCC WGII Sixth Assessment Report
Do Not Cite, Quote or Distribute 12-114 Total pages: 181
Alcaldía de Medellín, 2021: Plan de Acción Climática Medellín 2020-2050, Medellín, Colombia. Available at: 1 https://www.medellin.gov.co/irj/portal/medellin?NavigationTarget=contenido/8891-Plan-de-Accion-Climatica 2 (accessed 01/09/2021). 3
Alcaldía de Quito, 2017: Quito resiliente. Estrategia de Resiliencia. Distrito Metropolitano de Quito. Primera ed., 4 Quito, A. d., Alcadía de Quito, Quito, Ecuador, 146 pp. Available at: http://gobiernoabierto.quito.gob.ec/wp-5 content/uploads/documentos/resiliente/resilencia.pdf (accessed 03/06/2021). 6
Alcaldía Mayor de Bogotá D.C., 2017: Plan Maestro de Movilidad para Bogotá D.C., Bogotá, Colombia. Available at: 7 https://www.movilidadbogota.gov.co/web/plan-maestro-movilidad (accessed 01/09/2021). 8
Alcaldía Mayor de Bogotá D.C., 2018: Plan Distrital de Gestión de Riesgos de Desastres y del Cambio Climático para 9 Bogotá D.C., 2018-2030, Instituto Distrital de Gestión de Riesgos y Cambio Climático, Alcadía Mayor de Bogotá 10 D.C., , Bogotá, Colombia, 25 pp. Available at: 11 http://www.ambientebogota.gov.co/c/document_library/get_file?uuid=e5ae62a8-5687-46b0-8460-12 ab65723e1a74&groupId=10157 (accessed 17/10/2020). 13
Aldunce Ide, P. et al., 2020: Sociedad, gobernanza, inequidad y adaptación. In: Adaptación frente a los riesgos del 14 cambio climático en los países iberoamericanos. Informe RIOCCADAPT [Moreno, J. M., C. Laguna-Defior, V. 15 Barros, E. Calvo Buendía, J. A. Marengo and Ú. Oswald Spring (eds.)]. McGraw-Hill, Madrid, España, pp. 49-89. 16 ISBN 9788448621643. 17
Aldunce, P. et al., 2017: Local perception of drought impacts in a changing climate: The mega-drought in central Chile. 18 Sustainability 9(11), 2053, doi:10.3390/su9112053. 19
Alfieri, L. et al., 2017: Global projections of river flood risk in a warmer world. Earth's Future, 5(2), 171-182, 20 doi:10.1002/2016EF000485. 21
Alho, C. F. B. V. et al., 2019: Spatial variation of carbon and nutrients stocks in Amazonian Dark Earth. Geoderma, 22 337, 322-332, doi:10.1016/j.geoderma.2018.09.040. 23
Allen, A. et al., 2017a: De la mitigación de desastres a la interrupción de trampas de riesgo: la experiencia de 24 aprendizaje-acción de clima sin riesgo. Reder, 1(1), 6-28. 25
Allen, T. et al., 2017b: Global hotspots and correlates of emerging zoonotic diseases. Nature Communications, 8(1), 26 1124, doi:10.1038/s41467-017-00923-8. 27
Almansi, F., J. M. Motta and J. Hardoy, 2020: Incorporating a resilience lens into the social and urban transformation of 28 informal settlements: the participatory upgrading process in Villa 20, Buenos Aires (2016–2020). Environment 29 and Urbanization, 32(2), 407-428, doi:10.1177/0956247820935717. 30
Almanza, V. et al., 2019: Association between trophic state, watershed use, and blooms of cyanobacteria in south-31 central Chile. Limnologica, 75, 30-41, doi:10.1016/j.limno.2018.11.004. 32
Almeida, C. T. et al., 2017: Spatiotemporal rainfall and temperature trends throughout the Brazilian Legal Amazon, 33 1973–2013. International Journal of Climatology, 37(4), 2013-2026, doi:10.1002/joc.4831. 34
Almeida, O. et al., 2018: Resiliencia urbana y amenazas climáticas: Vulnerabilidad y planificación de adaptación para 35 ciudades pequeñas en el delta y estuario del rio Amazonas. Medio Ambiente y Urbanización, 88(1), 95-122. 36
Alpízar, F. et al., 2020: Determinants of food insecurity among smallholder farmer households in Central America: 37 recurrent versus extreme weather-driven events. Regional Environmental Change, 20(1), 22, doi:10.1007/s10113-38 020-01592-y. 39
Altamirano, A. et al., 2013: Influencia de la heterogeneidad del paisaje en la ocurrencia de incendios forestales en Chile 40 Central. Revista de Geografía Norte Grande, 55, 157-170, doi:10.4067/S0718-34022013000200011 41
Altea, L., 2020: Perceptions of climate change and its impacts: a comparison between farmers and institutions in the 42 Amazonas Region of Peru. Climate and Development, 12(2), 134-146, doi:10.1080/17565529.2019.1605285. 43
Altieri, M. A. and C. I. Nicholls, 2013: The adaptation and mitigation potential of traditional agriculture in a changing 44 climate. Climatic Change, doi:10.1007/s10584-013-0909-y. 45
Alvarado, J. J. et al., 2017: Coral Reef Conservation in the Eastern Tropical Pacific. In: Coral Reefs of the Eastern 46 Tropical Pacific: Persistence and Loss in a Dynamic Environment [Glynn, P. W., D. P. Manzello and I. C. Enochs 47 (eds.)]. Springer Netherlands, Dordrecht, pp. 565-591. ISBN 978-94-017-7499-4. 48
Álvarez-Dávila, E. et al., 2017: Forest biomass density across large climate gradients in northern South America is 49 related to water availability but not with temperature. PloS one, 12(3), e0171072, 50 doi:10.1371/journal.pone.0171072. 51
Álvarez-León, R. and J. R. Álvarez Puerto, 2017: Legislación colombiana relacionada con los ecosistemas de manglar. 52 Arquivos de Ciências do Mar, 49(2), 115, doi:10.32360/acmar.v49i2.6587. 53
Alvarez-Mendoza, C. I., A. Teodoro and L. Ramirez-Cando, 2019: Spatial estimation of surface ozone concentrations in 54 Quito Ecuador with remote sensing data, air pollution measurements and meteorological variables. Environmental 55 Monitoring and Assessment, 191(3), 155, doi:10.1007/s10661-019-7286-6. 56
Amar-Amar, J. J., C. I. D. l. H.-D. Real, M. B. Martínez-González and L. López-Muñoz, 2019: Adaptation strategies 57 and care practices among climate-displaced communities: Colombian case. Psicologia em Estudo, 24. 58
Amaral, A. C. Z. et al., 2016: Brazilian sandy beaches: characteristics, ecosystem services, impacts, knowledge and 59 priorities. Brazilian Journal of Oceanography, 64(2), 5-16, doi:10.1590/S1679-875920160933064sp2 60
Amoah-Antwi, C. et al., 2020: Restoration of soil quality using biochar and brown coal waste: A review. Science of the 61 Total Environment, 722, 137852-137852, doi:10.1016/j.scitotenv.2020.137852. 62
ACCEPTED VERSIO
N
SUBJECT TO FIN
AL EDITS
FINAL DRAFT Chapter 12 IPCC WGII Sixth Assessment Report
Do Not Cite, Quote or Distribute 12-115 Total pages: 181
Anabalón, V. et al., 2016: Micro-phytoplankton community structure in the coastal upwelling zone off Concepción 1 (central Chile): Annual and inter-annual fluctuations in a highly dynamic environment. Progress in 2 Oceanography, 149, 174-188, doi:10.1016/j.pocean.2016.10.011. 3
Anacona, P. I. et al., 2018: Glacier protection laws: Potential conflicts in managing glacial hazards and adapting to 4 climate change. Ambio, 47(8), 835–845, doi:10.1007/s13280-018-1043-x. 5
Anadón, J. D., O. E. Sala and F. T. Maestre, 2014: Climate change will increase savannas at the expense of forests and 6 treeless vegetation in tropical and subtropical Americas. Journal of Ecology, 102(6), 1363-1373, 7 doi:10.1111/1365-2745.12325. 8
Anaya, J. A. et al., 2020: Drivers of Forest Loss in a Megadiverse Hotspot on the Pacific Coast of Colombia. Remote 9 Sensing, 12(8), 1235, doi:10.3390/rs12081235 10
Andersen, L. E., D. Verner and M. Wiebelt, 2017: Gender and Climate Change in Latin America: An Analysis of 11 Vulnerability, Adaptation and Resilience Based on Household Surveys. Journal of International Development, 12 29(7), 857-876, doi:10.1002/jid.3259. 13
Anderson, E. et al., 2011: Consequences of Climate Change for Ecosystems and Ecosystem Services in the Tropical 14 Andes. Climate Change and Biodiversity in the Tropical Andes. 15
Anderson, E. P. et al., 2018a: Fragmentation of Andes-to-Amazon connectivity by hydropower dams. Science 16 Advances, 4(1), eaao1642, doi:10.1126/sciadv.aao1642. 17
Anderson, E. P., Maldonado-Ocampo and J. A, 2010: A Regional Perspective on the Diversity and Conservation of 18 Tropical Andean Fishes. Conservation Biology, 25(1), 30-39, doi:10.1111/j.1523-1739.2010.01568.x. 19
Anderson, L. O. et al., 2018b: Vulnerability of Amazonian forests to repeated droughts. Philosophical Transactions of 20 the Royal Society B: Biological Sciences, 373(1760), 20170411, doi:10.1098/rstb.2017.0411. 21
Anderson, T. G., K. J. Anchukaitis, D. Pons and M. Taylor, 2019: Multiscale trends and precipitation extremes in the 22 Central American Midsummer Drought. Environmental Research Letters, 14(12), 124016, doi:10.1088/1748-23 9326/ab5023. 24
Andersson, N. et al., 2015: Evidence based community mobilization for dengue prevention in Nicaragua and Mexico 25 (Camino Verde, the Green Way): Cluster randomized controlled trial. BMJ (Online), 351, doi:10.1136/bmj.h3267. 26
Andrade, M. M. N. d. et al., 2017: Flood Risk Mapping in the Amazon. In: Flood Risk Management [Hromadka, T. and 27 P. Rao (eds.)]. IntechOpen, pp. 41-54. 28
Andrade, M. M. N. d. and C. F. Szlafsztein, 2018: Vulnerability assessment including tangible and intangible 29 components in the index composition: An Amazon case study of flooding and flash flooding. Science of the Total 30 Environment, 630, 903-912, doi:10.1016/j.scitotenv.2018.02.271. 31
Anguelovski, I., E. Chu and J. Carmin, 2014: Variations in approaches to urban climate adaptation: Experiences and 32 experimentation from the global South. Global Environmental Change, 27, 156-167, 33 doi:10.1016/j.gloenvcha.2014.05.010. 34
Anguelovski, I., J. Connolly and A. L. Brand, 2018: From landscapes of utopia to the margins of the green urban life. 35 City, 22(3), 417-436, doi:10.1080/13604813.2018.1473126. 36
Anguelovski, I., C. Irazábal-Zurita and J. J. T. Connolly, 2019: Grabbed Urban Landscapes: Socio-spatial Tensions in 37 Green Infrastructure Planning in Medellín. International Journal of Urban and Regional Research, 43(1), 133-38 156, doi:10.1111/1468-2427.12725. 39
Anjos, L. J. S. et al., 2021: Future projections for terrestrial biomes indicate widespread warming and moisture 40 reduction in forests up to 2100 in South America. Global Ecology and Conservation, 25, e01441, 41 doi:10.1016/j.gecco.2020.e01441. 42
Anjos, L. J. S. and P. M. De Toledo, 2018: Measuring resilience and assessing vulnerability of terrestrial ecosystems to 43 climate change in South America. PLoS ONE, 13(3), 1-15, doi:10.1371/journal.pone.0194654. 44
Antimiani, A. et al., 2017: The Green Climate Fund as an effective compensatory mechanism in global climate 45 negotiations. Environmental Science & Policy, 77, 49-68, doi:10.1016/j.envsci.2017.07.015. 46
Antwi-Agyei, P., A. J. Dougill, L. C. Stringer and S. N. A. Codjoe, 2018: Adaptation opportunities and maladaptive 47 outcomes in climate vulnerability hotspots of northern Ghana. Clim. Risk Manag., 19, 83-93, 48 doi:10.1016/j.crm.2017.11.003. 49
Aparicio-Effen, M. et al., 2018: A Successful Early Warning System for Hydroclimatic Extreme Events: The Case of 50 La Paz City Mega Landslide. In: Climate Change Adaptation in Latin America: Managing Vulnerability, 51 Fostering Resilience [Leal Filho, W. and L. Esteves de Freitas (eds.)]. Springer International Publishing, Cham, 52 pp. 241-264. ISBN 978-3-319-56946-8. 53
Aragão, L. E. O. C. et al., 2018: 21st Century drought-related fires counteract the decline of Amazon deforestation 54 carbon emissions. Nature Communications, 9(1), 536, doi:10.1038/s41467-017-02771-y. 55
Aragão, L. E. O. C. et al., 2016: Assessing the Influence of Climate Extremes on Ecosystems and Human Health in 56 Southwestern Amazon Supported by the PULSE-Brazil Platform. American Journal of Climate Change, 5(3), 57 399-416, doi:10.4236/ajcc.2016.53030 58
Aragón, F. M., F. Oteiza and J. P. Rud, 2021: Climate Change and Agriculture: Subsistence Farmers' Response to 59 Extreme Heat. American Economic Journal: Economic Policy, 13(1), 1-35, doi:10.1257/pol.20190316. 60
Arana Zegarra, M. T., 2017: Género y Cambio Climático en América Latina [(CDKN), A. C. y. D. (ed.)]. 22 pp. 61 Available at: https://cdkn.org/wp-content/uploads/2017/07/Arana_G%C3%A9nero-y-cambio-clim%C3%A1tico-62 en-Am%C3%A9rica-Latina-ULTIMOS-CAMBIOS_05-de-JULIO-1.pdf (accessed 03/08/2021). 63
ACCEPTED VERSIO
N
SUBJECT TO FIN
AL EDITS
FINAL DRAFT Chapter 12 IPCC WGII Sixth Assessment Report
Do Not Cite, Quote or Distribute 12-116 Total pages: 181
Araos, M. et al., 2016: Climate change adaptation planning in large cities: A systematic global assessment. 1 Environmental Science & Policy, 66, 375-382, doi:10.1016/j.envsci.2016.06.009. 2
Araujo, R. V. et al., 2015: São Paulo urban heat islands have a higher incidence of dengue than other urban areas. 3 Brazilian Journal of Infectious Diseases, 19, 146-155, doi:10.1016/j.bjid.2014.10.004 4
Araya-Muñoz, D. et al., 2016: Assessing urban adaptive capacity to climate change. Journal of Environmental 5 Management, 183, 314-324, doi:10.1016/j.jenvman.2016.08.060. 6
Archer, D. et al., 2014: Moving towards inclusive urban adaptation: approaches to integrating community-based 7 adaptation to climate change at city and national scale. Climate and Development, 6(4), 345-356, 8 doi:10.1080/17565529.2014.918868. 9
Arias-Monsalve, C. and A. Builes-Jaramillo, 2019: Impact of El Niño-Southern oscillation on human leptospirosis in 10 Colombia at different spatial scales. The Journal of Infection in Developing Countries, 13(12), 11 doi:10.3855/jidc.11702. 12
Arias, P. A. et al., 2016: Reducing Social Vulnerability to Environmental Change: Building Trust through Social 13 Collaboration on Environmental Monitoring. Weather, Climate, and Society, 8(1), 57-66, doi:10.1175/WCAS-D-14 15-0049.1. 15
Ariza-Montobbio, P. and N. Cuvi, 2020: Ecosystem-based Adaptation in Ecuador: Good Practices for Adaptive Co-16 Management. Ambiente & Sociedade, 23, doi:10.1590/1809-4422asoc20180315r2vu2020L3AO. 17
Armenteras, D. et al., 2020: Incendios en ecosistemas del norte de Suramérica: avances en la ecología del fuego tropical 18 en Colombia, Ecuador y Perú. Caldasia, 42(1), doi:10.15446/caldasia.v42n1.77353. 19
Armenteras, D., L. Schneider and L. M. Dávalos, 2019: Fires in protected areas reveal unforeseen costs of Colombian 20 peace. Nature Ecology & Evolution, 3(1), 20-23, doi:10.1038/s41559-018-0727-8. 21
Armijo, J. et al., 2020: The 2016 red tide crisis in southern Chile: Possible influence of the mass oceanic dumping of 22 dead salmons. Marine Pollution Bulletin, 150, 110603, doi:10.1016/j.marpolbul.2019.110603. 23
Armijos, E. et al., 2020: Rainfall control on Amazon sediment flux: synthesis from 20 years of monitoring. 24 Environmental Research Communications, 2(5), 051008, doi:10.1088/2515-7620/ab9003. 25
Arnan, X. et al., 2018: Increased anthropogenic disturbance and aridity reduce phylogenetic and functional diversity of 26 ant communities in Caatinga dry forest. Science of The Total Environment, 631-632, 429-438, 27 doi:10.1016/j.scitotenv.2018.03.037. 28
Arnell, N. W. et al., 2016: The impacts of climate change across the globe: A multi-sectoral assessment. Climatic 29 Change, 134(3), 457-474, doi:10.1007/s10584-014-1281-2. 30
Arnell, N. W. and S. N. Gosling, 2013: The impacts of climate change on river flow regimes at the global scale. Journal 31 of Hydrology, 486, 351-364, doi:10.1016/j.jhydrol.2013.02.010. 32
Arnell, N. W. and S. N. Gosling, 2016: The impacts of climate change on river flood risk at the global scale. Climatic 33 Change, 134(3), 387-401, doi:10.1007/s10584-014-1084-5. 34
Arneth, A. et al., 2019: Framing and Context. In: Climate Change and Land. An IPCC Special Report on climate 35 change, desertification, land degradation, sustainable land management, food security, and greenhouse gas fluxes 36 in terrestrial ecosystems. In Press. 37
Arroyo Mina, J. S., D. A. Revollo Fernández, A. Aguilar Ibarra and N. Georgantzis, 2016: Economic behavior of 38 fishers under climate-related uncertainty: Results from field experiments in Mexico and Colombia. Fisheries 39 Research, 183, 304-317, doi:10.1016/j.fishres.2016.05.020. 40
Ashok, K. et al., 2007: El Niño Modoki and its possible teleconnection. Journal of Geophysical Research: Oceans, 41 112(C11), doi:10.1029/2006JC003798. 42
Avila-Diaz, A. et al., 2020: Assessing current and future trends of climate extremes across Brazil based on reanalyses 43 and earth system model projections. Climate Dynamics, 55(5-6), 1403-1426, doi:10.1007/s00382-020-05333-z. 44
Ávila-Valdés, A. et al., 2020: Tuber yield and quality responses of potato to moderate temperature increase during 45 Tuber bulking under two water availability scenarios. Field Crops Research, 251, 107786, 46 doi:10.1016/j.fcr.2020.107786. 47
Ayala, S. et al., 2019: Estimando el efecto del cambio climático sobre el riesgo de la enfermedad de Chagas en Chile 48 por medio del número reproductivo. Revista médica de Chile, 147(6), 683-692, doi:10.4067/S0034-49 98872019000600683 50
Ayes Rivera, I. et al., 2019: Decline of Fine Suspended Sediments in the Madeira River Basin (2003–2017). Water, 51 11(3), 514, doi:10.3390/w11030514. 52
Aylett, A., 2015: Institutionalizing the urban governance of climate change adaptation: Results of an international 53 survey. Urban Climate, 14, 4-16, doi:10.1016/j.uclim.2015.06.005. 54
Azócar, G. et al., 2021: Climate change perception, vulnerability, and readiness: inter-country variability and emerging 55 patterns in Latin America. Journal of Environmental Studies and Sciences, 11(1), 23-36, doi:10.1007/s13412-020-56 00639-0. 57
Bacon, C. M. et al., 2014: Explaining the ‘hungry farmer paradox’: Smallholders and fair trade cooperatives navigate 58 seasonality and change in Nicaragua's corn and coffee markets. Global Environmental Change, 25, 133-149, 59 doi:10.1016/j.gloenvcha.2014.02.005. 60
Bacon, C. M., W. A. Sundstrom, I. T. Stewart and D. Beezer, 2017: Vulnerability to Cumulative Hazards: Coping with 61 the Coffee Leaf Rust Outbreak, Drought, and Food Insecurity in Nicaragua. World Development, 93, 136-152, 62 doi:10.1016/j.worlddev.2016.12.025. 63
ACCEPTED VERSIO
N
SUBJECT TO FIN
AL EDITS
FINAL DRAFT Chapter 12 IPCC WGII Sixth Assessment Report
Do Not Cite, Quote or Distribute 12-117 Total pages: 181
Baez, J., G. Caruso, V. Mueller and C. Niu, 2017: Droughts augment youth migration in Northern Latin America and 1 the Caribbean. Climatic Change, 140(3-4), 423-435, doi:10.1007/s10584-016-1863-2. 2
Báez, S., M. Mazzarino, M. Peralvo and R. Sears, R., 2020: Evaluating the Impacts of a Small-Grants Program on 3 Sustainable Development and Biodiversity Conservation in Andean Forest Landscapes. Mountain Research and 4 Development, 40(2), D1-D7, doi:10.1659/MRD-JOURNAL-D-19-00066.1. 5
Bai, X. et al., 2016: Defining and advancing a systems approach for sustainable cities. Current Opinion in 6 Environmental Sustainability, 23, 69-78, doi:10.1016/j.cosust.2016.11.010. 7
Bañales-Seguel, C., F. De la Barrera and A. Salazar, 2018: An analysis of wildfire risk and historical occurrence for a 8 mediterranean biosphere reserve, Central Chile. Journal of Environmental Engineering and Landscape 9 Management, 26(2), 128-140, doi:10.3846/16486897.2017.1374280. 10
Baptiste, B. et al., 2017: Greening peace in Colombia. Nature Ecology & Evolution, 1(4), 0102, doi:10.1038/s41559-11 017-0102. 12
Baraer, M. et al., 2012: Glacier recession and water resources in Peru’s Cordillera Blanca. Journal of Glaciology, 13 58(207), 134-150, doi:10.3189/2012JoG11J186. 14
Barber, C. P., M. A. Cochrane, C. M. Souza and W. F. Laurance, 2014: Roads, deforestation, and the mitigating effect 15 of protected areas in the Amazon. Biological Conservation, 177, 203-209, doi:10.1016/j.biocon.2014.07.004. 16
Barbi, F. and L. da Costa Ferreira, 2017: Governing Climate Change Risks: Subnational Climate Policies in Brazil. 17 Chinese Political Science Review, 2(2), 237-252, doi:10.1007/s41111-017-0061-3. 18
Barbier, E. B. and J. P. Hochard, 2018a: The Impacts of Climate Change on the Poor in Disadvantaged Regions. Review 19 of Environmental Economics and Policy, 12(1), 26-47, doi:10.1093/reep/rex023. 20
Barbier, E. B. and J. P. Hochard, 2018b: Poverty, rural population distribution and climate change. Environment and 21 Development Economics, 23(3), 234-256, doi:10.1017/S1355770X17000353. 22
Barbier, E. B. and J. P. Hochard, 2019: Poverty-Environment Traps. Environmental and Resource Economics, 74(3), 23 1239-1271, doi:10.1007/s10640-019-00366-3. 24
Barbosa, J. Z. et al., 2020: Elemental signatures of an Amazonian Dark Earth as result of its formation process. 25 Geoderma, 361, 114085, doi:10.1016/j.geoderma.2019.114085. 26
Barcellos, C., D. Xavier and V. Pascoal de Matos, 2016: The Brazilian Observatory of Climate and Health: Experience 27 of organizing and disseminating climate and health information in Manaus, Amazon region. In: Climate Services 28 for health: Improving public health decision-making in a new climate - Case studies [Shumake-Guillemot, J. and 29 L. Fernandez-Montoya (eds.)]. World Meteorological Organization and World Health Organization, Geneva, pp. 30 114-117. 31
Bárcena, A., J. Samaniego, W. Peres and J. Alatorre, 2020a: La emergencia del cambio climático en América Latina y 32 el Caribe. ¿Seguimos esperando la catástrofe o pasamos a la acción? [Cepal (ed.)]. CEPAL, Santiago de Chile, 33 383 pp. Available at: https://www.cepal.org/es/publicaciones/45677-la-emergencia-cambio-climatico-america-34 latina-caribe-seguimos-esperando-la (accessed 16/06/2021). 35
Bárcena, A., J. Samaniego, W. Peres and J. E. Alatorre, 2020b: The climate emergency in Latin America and the 36 Caribbean: the path ahead – resignation or action? ECLAC Books Sustainable Development, 160, United 37 Nations, Caribbean, E. C. f. L. A. a. t., Santiago, Chile, 357 pp. Available at: 38 https://repositorio.cepal.org/bitstream/handle/11362/45678/10/S1900710_en.pdf (accessed 17/10/2020). 39
Bardales, W., C. Castañón and L. Herrera, 2019: Clima de Guatemala. Tendencias observadas e índices de cambio 40 climático. In: Primer Reporte de Evaluación del Conocimiento sobre Cambio Climático en Guatemala 41 [Castellanos, E., A. Paiz-Estévez, J. Escribá, M. Rosales-Alconero and A. Santizo (eds.)]. Editorial Universitaria 42 UVG, Guatemala, pp. 396. 43
Barkhordarian, A. et al., 2019: A Recent Systematic Increase in Vapor Pressure Deficit over Tropical South America. 44 Scientific Reports, 9(1), 15331, doi:10.1038/s41598-019-51857-8. 45
Barnes, J. et al., 2013: Contribution of anthropology to the study of climate change. Nature Clim. Change, 3(6), 541-46 544, doi:10.1038/nclimate1775. 47
Barnett, J. et al., 2015: From barriers to limits to climate change adaptation: path dependency and the speed of change. 48 Ecology and Society, 20(3), 5, doi:10.5751/ES-07698-200305. 49
Barona, C. O. et al., 2020: Trends in Urban Forestry Research in Latin America & The Caribbean: A Systematic 50 Literature Review and Synthesis. Urban Forestry & Urban Greening, 47, 126544, 51 doi:10.1016/j.ufug.2019.126544. 52
Barragán, J. M. and M. de Andrés, 2016: Expansión urbana en las áreas litorales de América Latina y Caribe. Revista de 53 geografía Norte Grande,(64), 129, doi:10.4067/S0718-34022016000200009. 54
Barragán, J. M. and Ó. Lazo, 2018: Policy progress on ICZM in Peru. Ocean & Coastal Management, 157, 203-216, 55 doi:10.1016/j.ocecoaman.2018.03.003. 56
Barria, I., J. Carrasco, G. Casassa and P. Barria, 2019: Simulation of Long-Term Changes of the Equilibrium Line 57 Altitude in the Central Chilean Andes Mountains Derived From Atmospheric Variables During the 1958–2018 58 Period. Front. Environ. Sci., 7(October), doi:10.3389/fenvs.2019.00161. 59
Barría, P. et al., 2019: Anthropocene and streamflow: Long-term perspective of streamflow variability and water rights. 60 Elementa 7(1), doi:10.1525/elementa.340. 61
Barros, H. R. and M. A. Lombardo, 2016: A ilha de calor urbana e o uso e cobertura do solo no município de São 62 Paulo-SP. GEOUSP Espaço e Tempo (Online), 20(1), 160-177, doi:10.11606/issn.2179-0892.geousp.2016.97783. 63
ACCEPTED VERSIO
N
SUBJECT TO FIN
AL EDITS
FINAL DRAFT Chapter 12 IPCC WGII Sixth Assessment Report
Do Not Cite, Quote or Distribute 12-118 Total pages: 181
Barros, V., 2006: Adaptation to climate trends: Lessons from the Argentine experience [(AIACC), A. o. I. a. A. t. C. C. 1 (ed.)]. AIACC Working Paper, 42 pp. Available at: https://research.fit.edu/media/site-2 specific/researchfitedu/coast-climate-adaptation-library/latin-america-and-caribbean/uruguay-argentina/Barros.--3 2006.--Argentina-CC-Adaptation-Lessons..pdf (accessed 31/10/2020). 4
Barros, V. R. et al., 2015: Climate change in Argentina: Trends, projections, impacts and adaptation. Wiley 5 Interdisciplinary Reviews: Climate Change, 6(2), 151-169, doi:10.1002/wcc.316. 6
Barrucand, M. G., C. Giraldo Vieira and P. O. Canziani, 2017: Climate change and its impacts: perception and 7 adaptation in rural areas of Manizales, Colombia. Climate and Development, 9(5), 415-427, 8 doi:10.1080/17565529.2016.1167661. 9
Bartlett, S. and D. Satterthwaite, 2016: Cities on a Finite Planet: Towards transformative responses to climate change. 10 Routledge, 306 pp. ISBN 9781138184107. 11
Basantes-Serrano, R. et al., 2016: Slight mass loss revealed by reanalyzing glacier mass-balance observations on 12 Glaciar Antisana 15α (inner tropics) during the 1995–2012 period. Journal of Glaciology, 62(231), 124-136, 13 doi:10.1017/jog.2016.17. 14
Basso, C. et al., 2017: Scaling Up of an Innovative Intervention to Reduce Risk of Dengue, Chikungunya, and Zika 15 Transmission in Uruguay in the Framework of an Intersectoral Approach with and without Community 16 Participation. The American Journal of Tropical Medicine and Hygiene, 97(5), 1428-1436, doi:10.4269/ajtmh.17-17 0061. 18
Batzín, R., 2019: Conocimiento indígena y cambio climático. In: Primer reporte de evaluación del conocimiento sobre 19 cambio climático en Guatemala [Castellanos, E., A. Paiz-Estévez, J. Escribá, M. Rosales-Alconero and A. Santizo 20 (eds.)]. Editorial Universitaria UVG, Guatemala, pp. 329. 21
Bauch, S. C., A. M. Birkenbach, S. K. Pattanayak and E. O. Sills, 2015: Public health impacts of ecosystem change in 22 the Brazilian Amazon. Proceedings of the National Academy of Sciences, 112(24), 7414-7419, 23 doi:10.1073/pnas.1406495111. 24
Baucom, I. and M. Omelsky, 2017: Knowledge in the Age of Climate Change. South Atlantic Quarterly, 116(1), 1-18, 25 doi:10.1215/00382876-3749271. 26
Baumann, M. et al., 2017: Deforestation and cattle expansion in the Paraguayan Chaco 1987–2012. Regional 27 Environmental Change, 17(4), 1179-1191, doi:10.1007/s10113-017-1109-5. 28
Bayer, A. M. et al., 2014: An unforgettable event: a qualitative study of the 1997–98 El Niño in northern Peru. 29 Disasters, 38(2), 351-374, doi:10.1111/disa.12046. 30
Bayraktarov, E. et al., 2020: Coral reef restoration efforts in Latin American countries and territories. PLOS ONE, 31 15(8), e0228477, doi:10.1371/journal.pone.0228477. 32
BCIE, 2020: Centroamérica en Cifras. Banco Centroamericano de Integración Económica, Tegucigalpa, Honduras, 89 33 pp. Available at: https://www.bcie.org/novedades/publicaciones/publicacion/centroamerica-en-cifras (accessed 34 03/08/2021). 35
Bebber, D. P. and N. Butt, 2017: Tropical protected areas reduced deforestation carbon emissions by one third from 36 2000–2012. Scientific Reports, 7(1), 14005, doi:10.1038/s41598-017-14467-w. 37
Bebbington, A. J., D. H. Bebbington and L. A. Sauls, 2019: Assessment and Scoping of Extractive Industry and 38 Infrastructure in Relation to Deforestation: Global and Synthesis Report. Climate and Land Use Alliance, 68 pp. 39 Available at: http://www.climateandlandusealliance.org/wp-content/uploads/2018/12/Global-Synthesis-Impacts-40 of-EII-on-Forests-1.pdf (accessed 25/06/2021). 41
Bebbington, A. J., J. Bury, N. Cuba and J. Rogan, 2015: Mining, risk and climate resilience in the ‘other’ Pacific: Latin 42 American lessons for the South Pacific. Asia Pacific Viewpoint, 56(2), 189-207, doi:10.1111/apv.12098. 43
Bech Gaivizzo, L. H. et al., 2019: Resilience to climate change in Fundo de Pasto Communities in the semiarid region 44 of Bahia State. Sociedade & Natureza, 31, 1-22, doi:10.14393/SN-v31-2019-46331. 45
Bedran-Martins, A. M., M. C. Lemos and A. Philippi, 2018: Relationship between subjective well-being and material 46 quality of life in face of climate vulnerability in NE Brazil. Climatic Change, 147(1), 283-297, 47 doi:10.1007/s10584-017-2105-y. 48
Benitez, E. M. et al., 2021: Understanding the role of temporal variation of environmental variables in predicting Aedes 49 aegypti oviposition activity in a temperate region of Argentina. Acta Tropica, 216, 105744, 50 doi:10.1016/j.actatropica.2020.105744. 51
Bentley, R. A. et al., 2014: Social tipping points and Earth systems dynamics. Front. Environ. Sci., 2, 52 doi:10.3389/fenvs.2014.00035. 53
Berasaluce, M. et al., 2019: Soil and indoor dust as environmental media of human exposure to As, Cd, Cu, and Pb near 54 a copper smelter in central Chile. Journal of Trace Elements in Medicine and Biology, 54, 156-162, 55 doi:10.1016/j.jtemb.2019.04.006. 56
Bergier, I. et al., 2018: Amazon rainforest modulation of water security in the Pantanal wetland. Science of The Total 57 Environment, 619-620, 1116-1125, doi:10.1016/j.scitotenv.2017.11.163. 58
Bergmann, J. et al., 2021: Assessing the Evidence: Climate Change and Migration in Peru. Potsdam Institute for 59 Climate Impact Research (PIK) and International Organization for Migration (IOM), Geneva, Switzerland, 238 60 pp. Available at: https://publications.iom.int/system/files/pdf/assessing-the-evidence-peru.pdf. 61
ACCEPTED VERSIO
N
SUBJECT TO FIN
AL EDITS
FINAL DRAFT Chapter 12 IPCC WGII Sixth Assessment Report
Do Not Cite, Quote or Distribute 12-119 Total pages: 181
Bernardino, A. F. et al., 2016: Benthic estuarine communities in Brazil: moving forward to long term studies to assess 1 climate change impacts. Brazilian Journal of Oceanography, 64(2), 81-96, doi:10.1590/S1679-2 875920160849064sp2. 3
Berrang-Ford, L. et al., 2021: A global systematic stocktake of evidence on human adaptation to climate change. Nature 4 Climate Change. 5
Bertonatti, C., 2021: Una reserva natural para cada ciudad. Fundación de História Natural Felix de Azara, Buenos 6 Aires, Argentina. Available at: https://www.fundacionazara.org.ar/img/libros/Una-reserva-natural-para-cada-7 ciudad-2021.pdf (accessed 01/09/2021). 8
Bertrand, A. et al., 2020: El Niño Southern Oscillation (ENSO) effects on fisheries and aquaculture. FAO Fisheries and 9 Aquaculture Technical Paper, FAO, FAO, Rome, Italy, 264 pp. Available at: https://doi.org/10.4060/ca8348en 10 (accessed 22/10/2020). 11
Bertrand, A., R. Vögler and O. Defeo, 2018: Chapter 15: Climate change impacts, vulnerabilities and adaptations: 12 Southwest Atlantic and Southeast Pacific marine fisheries. In: Impacts of climate change on fisheries and 13 aquaculture Synthesis of current knowledge, adaptation and mitigation options [Barange, M., T. Barhi, M. C. M. 14 Beveridge, K. Cochrane, S. Funge-Smith and F. Poulain (eds.)]. Food and Agriculture Organization of the United 15 Nations, Rome, pp. 325-346. 16
Beyá-Marshall, V. et al., 2018: The effect of water status on productive and flowering variables in young ‘Arbequina’ 17 olive trees under limited irrigation water availability in a semiarid region of Chile. Horticulture, Environment, and 18 Biotechnology, 59(6), 815-826, doi:10.1007/s13580-018-0088-x. 19
Bezerra, J. et al., 2016: The promises of the Amazonian soil: shifts in discourses of Terra Preta and biochar. 20 Bhatia, K. T. et al., 2019: Recent increases in tropical cyclone intensification rates. Nature Communications, 10(1), 1-9, 21
doi:10.1038/s41467-019-08471-z. 22 Bidegain, M., 2014: Servicios climaticos en Uruguay y la región. Instituto Uruguayo de Meteorología. Available at: 23
https://www.inumet.gub.uy/reportes/escuela/ciclosmb.pdf (accessed 01/10/2019). 24 Bilbao, B., J. Mistry, A. Millán and A. Berardi, 2019: Sharing multiple perspectives on burning: Towards a 25
participatory and intercultural fire management policy in Venezuela, Brazil, and Guyana. Fire, 2(3), 39, 26 doi:10.3390/fire2030039. 27
Bilbao, B. et al., 2020: Wildfires. In: Adaptation to Climate Change Risks in Ibero-American Countries - 28 RIOCCADAPT Report [Moreno, J. M., C. Laguna-Defior, V. Barros, E. Calvo Buendía, J. A. Marengo and U. 29 Oswald Spring (eds.)]. McGraw Hill, Madrid, Spain, pp. 435-496. ISBN 9788448621667. 30
Bindoff, N. L. et al., 2019: Changing Ocean, Marine Ecosystems, and Dependent Communities. In: An IPCC Special 31 Report on the Ocean and Cryosphere in a Changing Climate. [Pörtner, H.-O., D. Roberts, M. Masson-Delmotte, 32 P. Zhai, M. Tignor, E. Poloczanska, K. Mintenbeck, M. Nicolai, A. Okem, J. Petzold, B. Rama and N. Weyer 33 (eds.)]. In press. 34
Bitencourt, D. P., M. V. Fuentes, P. A. Maia and F. T. Amorim, 2016: Frequência, Duração, Abrangência Espacial e 35 Intensidadedas Ondas de Calor no Brasil. Revista Brasileira de Meteorologia, 31(4), 506-517, doi:10.1590/0102-36 778631231420150077. 37
Bizikova, L. et al., 2016: Climate resilience and food security in Central America: a practical framework. Climate and 38 Development, 8(5), 397-412, doi:10.1080/17565529.2015.1064806. 39
Black, R., S. R. G. Bennett, S. M. Thomas and J. R. Beddington, 2011: Migration as adaptation. Nature, 478(7370), 40 447-449, doi:10.1038/478477a. 41
Blanco-Libreros, J. F. and R. Álvarez-León, 2019: Regreso a los manglares de Colombia en una era de datos abiertos, 42 cambios globales y transiciones sociopolíticas: homenaje a Heliodoro Sánchez-Páez. Revista de la Academia 43 Colombiana de Ciencias Exactas, Físicas y Naturales, 43(166), 84-97, doi:10.18257/raccefyn.780. 44
Blanco-Libreros, J. F. and E. A. Estrada-Urrea, 2015: Mangroves on the Edge: Anthrome-Dependent Fragmentation 45 Influences Ecological Condition (Turbo, Colombia, Southern Caribbean). Diversity, 7(3), 206-228, 46 doi:10.3390/d7030206. 47
Blanco Blanco, A., V. Fretes Cibils and A. Muñoz Miranda, 2014: Rental Housing Wanted: Policy Options for Latin 48 America and the Caribbean. Inter-American Development Bank, Washington D.C., United States, 55 pp. 49 Available at: https://publications.iadb.org/en/publication/17426/rental-housing-wanted-policy-options-latin-50 america-and-caribbean (accessed 17/10/2020). 51
Blunden, J. and D. S. Arndt, 2014: State of the Climate in 2013. Bulletin of the American Meteorological Society, 95, 52 American Meteorological Society, S1-S257 pp. Available at: http://www.jstor.org/stable/26219389 (accessed 53 16/06/2021). 54
Bocchiola, D., A. Soncini, A. Senese and G. Diolaiuti, 2018: Modelling Hydrological Components of the Rio Maipo of 55 Chile, and Their Prospective Evolution under Climate Change. Climate, 6(3), doi:10.3390/cli6030057. 56
Boelens, R., E. Shah and B. Bruins, 2019: Contested knowledges: Large dams and mega-hydraulic development. Water, 57 11(3), 416, doi:10.3390/w11030416. 58
Boers, N., N. Marwan, H. M. J. Barbosa and J. Kurths, 2017: A deforestation-induced tipping point for the South 59 American monsoon system. Scientific Reports, 7(1), 41489, doi:10.1038/srep41489. 60
Boillat, S. and F. Berkes, 2013: Perception and Interpretation of Climate Change among Quechua Farmers of Bolivia: 61 Indigenous Knowledge as a Resource for Adaptive Capacity. Ecology and Society, 18(4), 21, doi:10.5751/ES-62 05894-180421. 63
ACCEPTED VERSIO
N
SUBJECT TO FIN
AL EDITS
FINAL DRAFT Chapter 12 IPCC WGII Sixth Assessment Report
Do Not Cite, Quote or Distribute 12-120 Total pages: 181
Boisier, J. P. et al., 2018: Anthropogenic drying in central-southern Chile evidenced by long-term observations and 1 climate model simulations. Elementa Science of Anthropocene, 6(1), 74, doi:10.1525/elementa.328. 2
Boisier, J. P., R. Rondanelli, R. D. Garreaud and F. Muñoz, 2016: Anthropogenic and natural contributions to the 3 Southeast Pacific precipitation decline and recent megadrought in central Chile. Geophysical Research Letters, 4 43(1), 413-421, doi:10.1002/2015GL067265. 5
Bonatti, M. et al., 2019: Social representations of climate change and climate adaptation plans in southern Brazil: 6 Challenges of genuine participation. Urban Climate, 29, 100496, doi:10.1016/j.uclim.2019.100496. 7
Bonatti, M. et al., 2016: Climate vulnerability and contrasting climate perceptions as an element for the development of 8 community adaptation strategies: Case studies in Southern Brazil. Land Use Policy, 58, 114-122, 9 doi:10.1016/j.landusepol.2016.06.033. 10
Borbor-Cordova, M. et al., 2016: Case study 5B: Vector-virus microclimate surveillance system for dengue control in 11 Machala, Ecuador. In: Climate Services for Health: Improving public health decision-making in a new climate. 12 World Meteorological Association and World Health Organization, Geneva, Switzerland, pp. 104-107. 13
Borges, F. J. A., B. R. Ribeiro, L. E. Lopes and R. Loyola, 2019: Bird vulnerability to climate and land use changes in 14 the Brazilian Cerrado. Biological Conservation, 236, 347-355, doi:10.1016/j.biocon.2019.05.055. 15
Borges, R., A. C. Ferreira and L. D. Lacerda, 2017: Systematic Planning and Ecosystem-Based Management as 16 Strategies to Reconcile Mangrove Conservation with Resource Use. Frontiers in Marine Science, 4, 353. 17
Borsdorf, A., M. Mergili and L. A. Ortega, 2013: La Reserva de la Biósfera Cinturón Andino, Colombia. ¿Una región 18 modelo de estrategias de adaptación al cambio climático y el desarrollo regional sustentable? Revista de 19 Geografia Norte Grande. 20
Boso, À. et al., 2019: Examining Patterns of Air Quality Perception: A Cluster Analysis for Southern Chilean Cities. 21 SAGE Open, 9(3), doi:10.1177/2158244019863563. 22
Boucher, D., S. Roquemore and E. Fitzhugh, 2013: Brazil's Success in Reducing Deforestation. Tropical Conservation 23 Science, 6(3), 426-445, doi:10.1177/194008291300600308. 24
Bourke, J., K. Busse and W. Böhme, 2018: Potential effects of climate change on the distribution of the endangered 25 Darwin's frog. North-Western Journal of Zoology, 14(2), 165-170. 26
Bouroncle, C. et al., 2017: Mapping climate change adaptive capacity and vulnerability of smallholder agricultural 27 livelihoods in Central America: ranking and descriptive approaches to support adaptation strategies. Climatic 28 Change, 141(1), 123-137, doi:10.1007/s10584-016-1792-0. 29
Bovarnick, A., J. Fernandez-Baca, J. Galindo and H. Negret, 2010: Financial Sustainability of Protected Areas in Latin 30 America and the Caribbean: Investment Policy Guidance. United Nations Development Programme (UNDP) and 31 The Nature Conservancy (TNC), 162 pp. Available at: https://www.cbd.int/financial/finplanning/g-planscorelatin-32 undp.pdf (accessed 16/06/2021). 33
Bowman, D. M. J. S. et al., 2009: Fire in the Earth System. Science, 324(5926), 481-484, doi:10.1126/science.1163886 34 %J Science. 35
Bowman, D. M. J. S. et al., 2019: Human–environmental drivers and impacts of the globally extreme 2017 Chilean 36 fires. Ambio, 48(4), 350-362, doi:10.1007/s13280-018-1084-1. 37
Bowman, K. W. et al., 2021: Environmental degradation of indigenous protected areas of the Amazon as a slow onset 38 event. Current Opinion in Environmental Sustainability, 50, 260-271, doi:10.1016/j.cosust.2021.04.012. 39
Boyer, C. J. et al., 2020: Using Implementation Science For Health Adaptation: Opportunities For Pacific Island 40 Countries. Health Affairs, 39(12), 2160-2167, doi:10.1377/hlthaff.2020.01101. 41
Bozkurt, D., M. Rojas, J. P. Boisier and J. Valdivieso, 2017: Climate change impacts on hydroclimatic regimes and 42 extremes over Andean basins in central Chile. Hydrol. Earth Syst. Sci. Discuss., 2017, 1-29, doi:10.5194/hess-43 2016-690. 44
Bradley, R. S., M. Vuille, H. F. Diaz and W. Vergara, 2006: Threats to Water Supplies in the Tropical Andes. Science, 45 312(5781), 1755, doi:10.1126/science.1128087. 46
Brancalion, P. H. S. et al., 2019: Global restoration opportunities in tropical rainforest landscapes. Science Advances, 47 5(7), eaav3223, doi:10.1126/sciadv.aav3223. 48
Branche, E., 2017: The multipurpose water uses of hydropower reservoir: The SHARE concept. Comptes Rendus 49 Physique, 18(7), 469-478, doi:10.1016/j.crhy.2017.06.001. 50
Brando, P. M. et al., 2014: Abrupt increases in Amazonian tree mortality due to drought–fire interactions. Proceedings 51 of the National Academy of Sciences, 111(17), 6347-6352, doi:10.1073/pnas.1305499111. 52
Brandt, R., R. Kaenzig and S. Lachmuth, 2016: Migration as a Risk Management Strategy in the Context of Climate 53 Change: Evidence from the Bolivian Andes. In: Migration, Risk Management and Climate Change: Evidence and 54 Policy Responses [Milan, A., B. Schraven, K. Warner and N. Cascone (eds.)]. Springer International Publishing, 55 Cham, pp. 43-61. ISBN 978-3-319-42922-9. 56
Braun, M. H. et al., 2019: Constraining glacier elevation and mass changes in South America. Nature Climate Change, 57 9(2), 130-136, doi:10.1038/s41558-018-0375-7. 58
Bravo, L., R. Hernández, I. Llatas and A. Salcedo, 2010: Desarrollo de un sistema de alerta temprano comunitario en el 59 estado Vargas, Venezuela. Temas de Coyuntura, 61, 169–178. 60
Braz, A. G., M. L. Lorini and M. M. Vale, 2019: Climate change is likely to affect the distribution but not parapatry of 61 the Brazilian marmoset monkeys (Callithrix spp.). Diversity and Distributions, 25(4), 536-550, 62 doi:10.1111/ddi.12872. 63
ACCEPTED VERSIO
N
SUBJECT TO FIN
AL EDITS
FINAL DRAFT Chapter 12 IPCC WGII Sixth Assessment Report
Do Not Cite, Quote or Distribute 12-121 Total pages: 181
Bremer, L. L. et al., 2016: One size does not fit all: Natural infrastructure investments within the Latin American Water 1 Funds Partnership. Ecosystem Services, 17, 217-236, doi:10.1016/j.ecoser.2015.12.006. 2
Bren d’Amour, C. et al., 2016: Teleconnected food supply shocks. Environmental Research Letters, 11(3), 035007, 3 doi:10.1088/1748-9326/11/3/035007. 4
Brienen, R. J. W. et al., 2015: Long-term decline of the Amazon carbon sink. Nature, 519(7543), 344-348, 5 doi:10.1038/nature14283. 6
Briones-Estébanez, K. M. and N. F. F. Ebecken, 2017: Occurrence of emergencies and disaster analysis according to 7 precipitation amount. Natural Hazards, 85(3), 1437-1459, doi:10.1007/s11069-016-2635-z. 8
Bro, A. S., D. C. Clay, D. L. Ortega and M. C. Lopez, 2019: Determinants of adoption of sustainable production 9 practices among smallholder coffee producers in Nicaragua. Environment, Development and Sustainability, 21(2), 10 895-915, doi:10.1007/s10668-017-0066-y. 11
Brockington, D. and D. Wilkie, 2015: Protected areas and poverty. Philosophical Transactions of the Royal Society B: 12 Biological Sciences, 370, doi:10.1098/rstb.2014.0271. 13
Brondízio, E. S., A. C. B. de Lima, S. Schramski and C. Adams, 2016: Social and health dimensions of climate change 14 in the Amazon. Annals of Human Biology, 43(4), 405-414, doi:10.1080/03014460.2016.1193222. 15
Brough, A. R. et al., 2016: Is Eco-Friendly Unmanly? The Green-Feminine Stereotype and Its Effect on Sustainable 16 Consumption. Journal of Consumer Research, 43(4), 567-582, doi:10.1093/jcr/ucw044. 17
Brown, K., 2014: Global environmental change I: A social turn for resilience? Progress in Human Geography, 38(1), 18 107-117, doi:10.1177/0309132513498837. 19
Bruguere, C. and M. Williams, 2017: Women in aquaculture profile. Genderaquafish, 9 pp. Available at: 20 https://genderaquafish.org/portfolio/women-in-aquaculture/ (accessed 16/06/2021). 21
Bunn, C., P. Läderach, O. Ovalle Rivera and D. Kirschke, 2015: A bitter cup: climate change profile of global 22 production of Arabica and Robusta coffee. Climatic Change, 129(1-2), 89-101, doi:10.1007/s10584-014-1306-x. 23
Burton, C. et al., 2021: South American fires and their impacts on ecosystems increase with continued emissions. 24 Climate Resilience and Sustainability, n/a(n/a), e8, doi:10.1002/cli2.8. 25
Bury, J. et al., 2013: New Geographies of Water and Climate Change in Peru: Coupled Natural and Social 26 Transformations in the Santa River Watershed. Annals of the Association of American Geographers, 103(2), 363-27 374, doi:10.1080/00045608.2013.754665. 28
Busso, M. and J. Messina, 2020: La crisis de la desigualdad. América Latina y el Caribe en la encrucijada. Inter-29 American Development Bank, 401 pp. Available at: https://publications.iadb.org/es/la-crisis-de-la-desigualdad-30 america-latina-y-el-caribe-en-la-encrucijada (accessed 16/06/2021). 31
Bustamante, M. et al., 2020: Ecosistemas terrestres y acuáticos continentales. In: Adaptación frente a los riesgos del 32 cambio climático en los países iberoamericanos - Informe RIOCCADAPT [Moreno, J. M., C. Laguna-Defior, V. 33 Barros, E. Calvo Buendía, J. A. Marengo and U. Oswald Spring (eds.)]. McGraw-Hill, Madrid, España, pp. 91-34 129. ISBN 9788448621643. 35
Buytaert, W. and B. De Bièvre, 2012: Water for cities: The impact of climate change and demographic growth in the 36 tropical Andes. Water Resources Research, 48(8), 1-13, doi:10.1029/2011WR011755. 37
Buytaert, W. et al., 2017: Glacial melt content of water use in the tropical Andes. Environmental Research Letters, 38 12(11), 114014, doi:10.1088/1748-9326/aa926c. 39
Buytaert, W. et al., 2014: Citizen science in hydrology and water resources: opportunities for knowledge generation, 40 ecosystem service management, and sustainable development. Frontiers in Earth Science, 2(October), 1-21, 41 doi:10.3389/feart.2014.00026. 42
Cáceres-Arteaga, N., K. Maria and D. Lane, 2020: Agroecological Practices as a Climate Change Adaptation 43 Mechanism in Four Highland Communities in Ecuador. Journal of Latin American Geography, 19(3), 47-73, 44 doi:10.1353/lag.2020.0071. 45
CAF, 2014: Vulnerability Index to climate change in the Latin American and Caribbean Region. CAF Development 46 Bank of Latin America, Caracas, Venezuela, 206 pp. Available at: http://scioteca.caf.com/handle/123456789/509 47 (accessed 17/09/2019). 48
Cai, W. et al., 2020: Climate impacts of the El Niño–Southern Oscillation on South America. Nature Reviews Earth & 49 Environment, 1(4), 215-231, doi:10.1038/s43017-020-0040-3. 50
Cai, W. et al., 2015: ENSO and greenhouse warming. Nature Climate Change, 5(9), 849-859, 51 doi:10.1038/nclimate2743. 52
Cai, W. et al., 2018: Increased variability of eastern Pacific El Niño under greenhouse warming. Nature, 564(7735), 53 201-206, doi:10.1038/s41586-018-0776-9. 54
Cakmak, S., C. Blanco-Vidal, A. O. Lukina and R. Dales, 2021: The association between air pollution and 55 hospitalization for patients with systemic lupus erythematosus in Chile: A daily time series analysis. 56 Environmental Research, 192, 110469, doi:10.1016/j.envres.2020.110469. 57
Calil, J. et al., 2017: Comparative Coastal Risk Index (CCRI): A multidisciplinary risk index for Latin America and the 58 Caribbean. PLOS ONE, 12(11), e0187011, doi:10.1371/journal.pone.0187011. 59
Calispa, E., 2018: Políticas Públicas De Cambio Climático En Ecuador: Un Análisis Crítico De Ideas, Políticas Y 60 Discurso. Revista Desarrollo Local Sostenible, 11(32), 1-22. 61
ACCEPTED VERSIO
N
SUBJECT TO FIN
AL EDITS
FINAL DRAFT Chapter 12 IPCC WGII Sixth Assessment Report
Do Not Cite, Quote or Distribute 12-122 Total pages: 181
Calvello, M. et al. (eds.), The Community-Based Alert and Alarm System for Rainfall Induced Landslides in Rio de 1 Janeiro, Brazil. Engineering Geology for Society and Territory - Volume 2, 2015//, Cham, Springer International 2 Publishing, 653-657 pp. ISBN 978-3-319-09057-3. 3
Camacho Guerreiro, A. I., R. J. Ladle and V. da Silva Batista, 2016: Riverine fishers' knowledge of extreme climatic 4 events in the Brazilian Amazonia. Journal of Ethnobiology and Ethnomedicine, 12(50), 1-10, doi:10.1186/s13002-5 016-0123-x. 6
Camarero, J. J. and A. Fajardo, 2017: Poor acclimation to current drier climate of the long-lived tree species Fitzroya 7 cupressoides in the temperate rainforest of southern Chile. Agricultural and Forest Meteorology, 239, 141-150, 8 doi:10.1016/j.agrformet.2017.03.003. 9
Camarero, J. J., A. Gazol, G. Sangüesa-Barreda and A. Fajardo, 2018: Coupled climate–forest growth shifts in the 10 Chilean Patagonia are decoupled from trends in water–use efficiency. Agricultural and Forest Meteorology, 259, 11 222-231, doi:10.1016/j.agrformet.2018.04.024. 12
Cameron, L. et al., 2015: Trends and opportunities in multilateral climate funds. ECN, 68 pp. Available at: 13 https://publicaties.ecn.nl/PdfFetch.aspx?nr=ECN-E--15-014 (accessed 16/06/2021). 14
Camico, Z., M. Díaz, A. Felicien and N. Chacón, 2021: Agricultural knowledge of the Uwǫttüją people in the 15 ecological restoration of the Amazon rainforest. In: Compendium of Indigenous Knowledge and Local 16 Knowledge: Towards Inclusion of Indigenous Knowledge and Local Knowledge in Global Reports on Climate 17 Change [Mustonen, T., S. L. Harper, M. Rivera Ferre, J. Postigo, A. Ayanlade, T. Benjaminsen, R. Morgan and 18 A. Okem (eds.)]. Snowchange Cooperative, Kontiolahti, Finland, pp. 20-25. 19
Camilo, J. A. et al., 2018: Impact of Climate Change on Maize Grown in the Brazilian Cerrado. In: 2018 ASABE 20 Annual International Meeting, St. Joseph, MI, ASABE, pp. 1, doi:10.13031/aim.201800967. 21
Campos-Caba, R. V., 2016: Análisis de marejadas históricas y recientes en las costas de Chile. Universidad de 22 Valparaiso, 210 pp. 23
Canil, K., A. Lampis and K. L. d. Santos, 2020: Vulnerabilidade e a construção social do risco: uma contribuição para o 24 planejamento na macrometrópole paulista. Cadernos Metrópole, 22(48), 397-416, doi:10.1590/2236-9996.2020-25 4803 26
Caprì, S., M. Ignaccolo, G. Inturri and M. Le Pira, 2016: Green walking networks for climate change adaptation. 27 Transportation Research Part D: Transport and Environment, 45, 84-95, doi:10.1016/j.trd.2015.08.005. 28
Capstick, S. et al., 2015: International trends in public perceptions of climate change over the past quarter century. 29 Wiley Interdisciplinary Reviews: Climate Change, 6(1), 35-61, doi:10.1002/wcc.321. 30
Cárdenas, M., J. P. Bonilla and F. Brusa, 2021: Climate Policies in Latin America and the Caribbean: Success Stories 31 and Challenges in the Fight against Climate Change [Bank, I.-A. D. (ed.)]. IDB Monograph 929, Inter-American 32 Development Bank, 179 pp. Available at: http://dx.doi.org/10.18235/0003239 (accessed 30/06/2021). 33
Cardoso, A. C., H. Silva, A. C. Melo and D. Araújo, 2018: Urban Tropical Forest: Where Nature and Human 34 Settlements Are Assets for Overcoming Dependency, but How Can Urbanisation Theories Identify These 35 Potentials? In: Emerging Urban Spaces: A Planetary Perspective [Horn, P., P. Alfaro d'Alencon and A. C. Duarte 36 Cardoso (eds.)]. Springer International Publishing, Cham, pp. 177-199. ISBN 978-3-319-57816-3. 37
Carey, M. et al., 2014: Toward hydro-social modeling: Merging human variables and the social sciences with climate-38 glacier runoff models (Santa River, Peru). Journal of Hydrology, 518(A), 60-70, 39 doi:10.1016/j.jhydrol.2013.11.006. 40
Carey, M., A. French and E. O’Brien, 2012: Unintended effects of technology on climate change adaptation: an 41 historical analysis of water conflicts below Andean Glaciers. Journal of Historical Geography, 38(2), 181-191, 42 doi:10.1016/j.jhg.2011.12.002. 43
Carey, M. et al., 2017: Impacts of Glacier Recession and Declining Meltwater on Mountain Societies. Annals of the 44 American Association of Geographers, 107(2), 350-359, doi:10.1080/24694452.2016.1243039. 45
Carneiro da Cunha, M. and A. G. Morim de Lima, 2017: How Amazonian Indigenous Peoples contribute to 46 Biodiversity. In: Knowing our Lands and Resources: Indigenous and Local Knowledge of Biodiversity and 47 Ecosystem Services in the Americas. Knowledges of Nature 11 [Baptiste, B., D. Pacheco, M. Carneiro da Cunha 48 and S. Diaz (eds.)]. UNESCO, Paris, France, pp. 65-81. 49
Carrão, H., G. Naumann and P. Barbosa, 2016: Mapping global patterns of drought risk: An empirical framework based 50 on sub-national estimates of hazard, exposure and vulnerability. Global Environmental Change, 39, 108-124, 51 doi:10.1016/j.gloenvcha.2016.04.012. 52
Carrasco-Torrontegui, A., C. A. Gallegos-Riofrío, F. Delgado-Espinoza and M. Swanson, 2020: Climate Change, Food 53 Sovereignty and Ancestral Farming Technologies in the Andes. Current Developments in Nutrition, nzaa073, 54 doi:10.1093/cdn/nzaa073. 55
Carrer, M. J., R. L. F. d. Silveira, M. d. M. B. Vinholis and H. M. De Souza Filho, 2020: Determinants of agricultural 56 insurance adoption: evidence from farmers in the state of São Paulo, Brazil. RAUSP Management Journal, 55(4), 57 547-566, doi:10.1108/RAUSP-09-2019-0201. 58
Carril, A. F. et al., 2016: Extreme events in the la Plata basin: A retrospective analysis of what we have learned during 59 CLARIS-LPB project. Climate Research, 68(2-3), 95-116, doi:10.3354/cr01374. 60
Carrivick, J. L. and F. S. Tweed, 2016: A global assessment of the societal impacts of glacier outburst floods. Global 61 and Planetary Change, 144, 1-16, doi:10.1016/j.gloplacha.2016.07.001. 62
ACCEPTED VERSIO
N
SUBJECT TO FIN
AL EDITS
FINAL DRAFT Chapter 12 IPCC WGII Sixth Assessment Report
Do Not Cite, Quote or Distribute 12-123 Total pages: 181
Carrizo Sineiro, C., Y. M. Ferreyra, D. Astudillo and S. Soldá, 2018: Sustentabilidad y gestión de riesgo. Respuesta, 1 reparación y prevención frente a inundaciones desde un análisis de caso/Sustainability and risk management. 2 Response, repair and prevention against floods from a case analysis. Letras Verdes. Revista Latinoamericana de 3 Estudios Socioambientales,(24), 105-123, doi:10.17141/letrasverdes.24.2018.3328. 4
Carter, H. N., S. W. Schmidt and A. C. Hirons, 2015: An International Assessment of Mangrove Management: 5 Incorporation in Integrated Coastal Zone Management. Diversity, 7(2), 74-104, doi:10.3390/d7020074. 6
Carvache-Franco, W., M. Carvache-Franco, O. Carvache-Franco and A. B. Hernández-Lara, 2019: Segmentation of 7 foreign tourist demand in a coastal marine destination: The case of Montañita, Ecuador. Ocean and Coastal 8 Management, 167(November 2018), 236-244, doi:10.1016/j.ocecoaman.2018.10.035. 9
Carvalho, L. M. V., 2020: Assessing precipitation trends in the Americas with historical data: A review. WIREs Climate 10 Change, 11(2), e627, doi:10.1002/wcc.627. 11
Carvalho, W. D. et al., 2019: Deforestation control in the Brazilian Amazon: A conservation struggle being lost as 12 agreements and regulations are subverted and bypassed. Perspectives in Ecology and Conservation, 17(3), 122-13 130, doi:10.1016/j.pecon.2019.06.002. 14
Casas Varez, M., 2017: La transversalización del enfoque de género en las políticas públicas frente al cambio 15 climático en América Latina. CEPAL, Santiago. 16
Castán Broto, V. and H. Bulkeley, 2013: A survey of urban climate change experiments in 100 cities. Global 17 Environmental Change, 23(1), 92-102, doi:10.1016/j.gloenvcha.2012.07.005. 18
Castaneda Sanchez, J. P., J. Carrera and D. Rexhepi, 2019: Towards Natural Capital Accounting in Guatemala: 19 Synthesis Report. The World Bank, Washington DC, USA, 32 pp. Available at: https://seea.un.org/es/node/2785 20 (accessed 29/06/2021). 21
Castellanos, E., T. Thomas and S. Dunston, 2018: Climate Change, Agriculture, and Adaptation Options for 22 Guatemala. International Food Policy Research Institute, 1789 ed., Ifpri, Washington D.C., USA, 66 pp. 23 Available at: https://www.ifpri.org/publication/climate-change-agriculture-and-adaptation-options-guatemala 24 (accessed 31/08/2021). 25
Castelo, T. B., 2015: Legislação florestal brasileira e políticas do governo de combate ao desmatamento na Amazônia 26 legal. Ambiente & Sociedade, 18(4), 221-242, doi:10.1590/1809-4422ASOC1216V1842015. 27
Castillo-Soto, M. E., J. R. Molina-Martínez, F. Rodríguez y Silva and G. H. J. Alvear, 2013: A territorial fire 28 vulnerability model for Mediterranean ecosystems in South America. Ecological Informatics, 13, 106-113, 29 doi:10.1016/j.ecoinf.2012.06.004. 30
Castrejón, M. and A. Charles, 2020: Human and climatic drivers affect spatial fishing patterns in a multiple-use marine 31 protected area: The Galapagos Marine Reserve. PLOS ONE, 15(1), e0228094, doi:10.1371/journal.pone.0228094. 32
Castrejón, M. and O. Defeo, 2015: Co-governance of Small-Scale Shellfisheries in Latin America: Institutional 33 Adaptability to External Drivers of Change. In: Interactive Governance for Small-Scale Fisheries: Global 34 Reflections [Jentoft, S. and R. Chuenpagdee (eds.)]. Springer International Publishing, Cham, pp. 605-625. ISBN 35 978-3-319-17034-3. 36
Castro, S. M., G. A. Sanchez-Azofeifa and H. Sato, 2018: Effect of drought on productivity in a Costa Rican tropical 37 dry forest. Environmental Research Letters, 13(4), 045001, doi:10.1088/1748-9326/aaacbc. 38
Catenazzi, A., E. Lehr and V. T. Vredenburg, 2014: Thermal Physiology, Disease, and Amphibian Declines on the 39 Eastern Slopes of the Andes. Conservation Biology, 28(2), 509-517, doi:10.1111/cobi.12194. 40
Cauvy-Fraunié, S. and O. Dangles, 2019: A global synthesis of biodiversity responses to glacier retreat. Nature Ecology 41 & Evolution, 3(12), 1675-1685, doi:10.1038/s41559-019-1042-8. 42
Cavalcante, A. d. M. B. and A. d. S. Duarte, 2019: Modeling the Distribution of Three Cactus Species of the Caatinga 43 Biome in Future Climate Scenarios. International Journal of Ecology and Environmental Sciences, 45. 44
Ceccherini, G. et al., 2016: Magnitude and frequency of heat and cold waves in recent decades: the case of South 45 America. Natural Hazards and Earth System Sciences, 16(3), 821-831, doi:10.5194/nhess-16-821-2016. 46
CELADE, 2019: Latin America and the Caribbean: Population estimates and projections, ECLAC. Available at: 47 https://www.cepal.org/en/topics/demographic-projections/latin-america-and-caribbean-population-estimates-and-48 projections. 49
CEPAL, 2010: The economics of climate change in Central America: Summary 2010. The economics of climate change 50 in Central America: summary 2010, México, C., Ciudad de Mexico, 143 pp. Available at: 51 https://repositorio.cepal.org/handle/11362/35229 (accessed 04/08/2021). 52
CEPAL, 2014: Guaranteeing indigenous people's rights in Latin America, Summary. Progress in the past decade and 53 remaining challenges. CEPAL, Santiago, Chile, 115 pp. Available at: 54 https://repositorio.cepal.org/bitstream/handle/11362/37051/S1420782_en.pdf?sequence=4&isAllowed=y 55 (accessed 30/10/2020). 56
CEPAL, 2017: Impactos potenciales del cambio climático en el ámbito hidroeléctrico en Panamá y la República 57 Dominicana. Comisión Económica para América Latina y el Caribe (CEPAL), Ciudad de México, 136 pp. 58 Available at: https://www.cepal.org/es/publicaciones/42426-impactos-potenciales-cambio-climatico-ambito-59 hidroelectrico-panama-la-republica (accessed 28/09/2019). 60
CEPAL, 2018: The effects of climate change in the coastal areas of Latin America and the Caribbean. Evaluation of 61 systems for protecting corals and mangroves in Cuba. Santiago de Chile, 32 pp. Available at: 62
ACCEPTED VERSIO
N
SUBJECT TO FIN
AL EDITS
FINAL DRAFT Chapter 12 IPCC WGII Sixth Assessment Report
Do Not Cite, Quote or Distribute 12-124 Total pages: 181
https://www.cepal.org/en/publications/44265-effects-climate-change-coastal-areas-latin-america-and-caribbean-1 evaluation (accessed 16/06/2021). 2
CEPAL and CAC-SICA, 2020: Análisis espacial de datos históricos y escenarios de cambio climático en México, 3 Centroamérica, Cuba, Haití y la República Dominicana. Comisión Económica para América Latina y el Caribe 4 and Consejo Agropecuario Centroamericano del Sistema de la Integración Centroamericana, Ciudad de México, 5 282 pp. Available at: https://repositorio.cepal.org/handle/11362/46499 (accessed 03/08/2021). 6
CEPAL and CAC/SICA, 2013: Impactos potenciales del cambio climático sobre los granos básicos en Centroamérica. 7 ECLAC, 137 pp. Available at: https://www.cepal.org/es/publicaciones/27171-impactos-potenciales-cambio-8 climatico-granos-basicos-centroamerica (accessed 16/06/2021). 9
CEPAL and CAC/SICA, 2014: Impactos potenciales del cambio climático sobre el café en Centroamérica. ECLAC, 10 México D.F., México, 131 pp. 11
CEPAL et al., 2018: Cambio climático y seguridad alimentaria y nutricional en Centroamérica y la República 12 Dominicana: Propuestas metodológicas. vol. LC/MEX/TS.2018/19, CEPAL, Ciudad de México, México, 153 pp. 13 Available at: https://repositorio.cepal.org/bitstream/handle/11362/44056/1/S1800858_es.pdf (accessed 14 13/08/2020). 15
CEPALSTAT, 2019: Databases and Statistical Publications, Economic Comission for Latin America and the Caribbean 16 (ECLAC). Available at: 17 https://estadisticas.cepal.org/cepalstat/WEB_CEPALSTAT/estadisticasIndicadores.asp?idioma=i (accessed 18 21/10/2020). 19
Cernusak, L. A. et al., 2013: Tropical forest responses to increasing atmospheric CO2: current knowledge and 20 opportunities for future research. Functional plant biology, 40(6), 531-551, doi:10.1071/fp12309. 21
Cerón, W. L. et al., 2021: Recent intensification of extreme precipitation events in the La Plata Basin in Southern South 22 America (1981–2018). Atmospheric Research, 249, 105299, doi:10.1016/j.atmosres.2020.105299. 23
Cerrón, J. et al., 2019: Relación entre árboles, cobertura y uso de la tierra y servicios hidrológicos en los Andes 24 Tropicales: Una síntesis del conocimiento. Occasional Paper No. 27, 27, Centro Internacional de Investigación 25 Agroforestal (ICRAF), Consorcio para el Desarrollo Sostenible de la Ecorregión Andina (CONDESAN), Lima, 26 Perú. Available at: http://dx.doi.org/10.5716/OP19056.PDF (accessed 26/08/2021). 27
Chain-Guadarrama, A. et al., 2018: Adaptación basada en Ecosistemas en pequeñas fincas de granos básicos en 28 Guatemala y Honduras. Agronomía Mesoamericana, 29(3), 571-583, doi:10.15517/ma.v29i3.32678. 29
Chang, M. and P. d. S. P. Garcia, 2018: Relatório do Projeto Construção de Indicadores de Vulnerabilidade da 30 População como Insumo para a Elaboração das Ações de Adaptação à Mudança do Clima no Brasil: Volume: 31 Paraná. Fundação Oswaldo Cruz, Ministério do Meio Ambiente e Fundo Nacional sobre Mudança do Clima 32 FIOCRUZ, Rio de Janeiro, RJ, 130 pp. Available at: 33 https://antigo.mma.gov.br/images/arquivo/80182/Vulnerabilidade%20%C3%A0%20Mudan%C3%A7a%20do%234 0Clima/Relat%C3%B3rio_Final_Paran%C3%A1_Novo.pdf (accessed 03/09/2021). 35
Charles, A., 2021: Communities, conservation and livelihoods. IUCN and CCRN, Gland, Switzerland and Halifax, 36 Canada, 132 pp. Available at: https://doi.org/10.2305/IUCN.CH.2021.01.en (accessed 25/08/2021). 37
Chaves, L. F., T.-W. Chuang, M. Sasa and J. M. Gutiérrez, 2015: Snakebites are associated with poverty, weather 38 fluctuations, and El Niño. Science Advances, 1(8), e1500249, doi:10.1126/sciadv.1500249. 39
Chaves, L. F. and M. Pascual, 2006: Climate Cycles and Forecasts of Cutaneous Leishmaniasis, a Nonstationary 40 Vector-Borne Disease. PLOS Medicine, 3(8), e295, doi:10.1371/journal.pmed.0030295. 41
Chaves, L. S. M., J. E. Conn, R. V. M. López and M. A. M. Sallum, 2018: Abundance of impacted forest patches less 42 than 5 km2 is a key driver of the incidence of malaria in Amazonian Brazil. Scientific Reports, 8(1), 7077, 43 doi:10.1038/s41598-018-25344-5. 44
Chávez Eslava, A. W., 2021: Resistance and resilience of the community of Belén, Iquitos, Peru, to resettlement. In: 45 Rethinking Urban Risk and Resettlement in the Global South [Johnson, C., G. Jain and A. Lavell (eds.)]. UCL 46 Press, pp. 154-168. ISBN 9781787358294. 47
Chazarin, F., B. Locatelli and M. Garay-Rodríguez, 2014: Mitigación en la selva, adaptación en la sierra y la costa: 48 ¿Oportunidades perdidas de sinergias frente al cambio climático en Perú? Ambiente y Desarrollo, 18(35), 95-106, 49 doi:10.11144/javeriana.ayd18-35.msas. 50
Checco, G. B. and E. d. L. Caldas, 2019: Governos subnacionais e a Política de Mudanças Climáticas de São Paulo: 51 uma análise a partir da multiposição dos atores na cidade de São Paulo. Confins. Revue franco-brésilienne de 52 géographie,(39), doi:10.4000/confins.18818. 53
Chelleri, L., G. Minucci and E. Skrimizea, 2016: Does community resilience decrease social–ecological vulnerability? 54 Adaptation pathways trade-off in the Bolivian Altiplano. Regional Environmental Change, 16(8), 2229-2241, 55 doi:10.1007/s10113-016-1046-8. 56
Chen, M. et al., 2018: Diversification and intensification of agricultural adaptation from global to local scales. PLOS 57 ONE, 13(5), e0196392, doi:10.1371/journal.pone.0196392. 58
Cherubin, M. R., J. P. Chavarro-Bermeo and A. M. Silva-Olaya, 2019: Agroforestry systems improve soil physical 59 quality in northwestern Colombian Amazon. Agroforestry Systems, 93(5), 1741-1753, doi:10.1007/s10457-018-60 0282-y. 61
ACCEPTED VERSIO
N
SUBJECT TO FIN
AL EDITS
FINAL DRAFT Chapter 12 IPCC WGII Sixth Assessment Report
Do Not Cite, Quote or Distribute 12-125 Total pages: 181
Chevallier, P., B. Pouyaud, W. Suarez and T. Condom, 2011: Climate change threats to environment in the tropical 1 Andes: glaciers and water resources. Regional Environmental Change, 11(1), 179-187, doi:10.1007/s10113-010-2 0177-6. 3
Chisari, O. O. and S. J. Miller, 2016: Climate Change and Migration: A CGE Analysis for Two Large Urban Regions of 4 Latin America. Inter-American Development Bank, 52 pp. Available at: https://publications.iadb.org/en/climate-5 change-and-migration-cge-analysis-two-large-urban-regions-latin-america (accessed 16/06/2021). 6
Chou, S. C. et al., 2014: Assessment of Climate Change over South America under RCP 4.5 and 8.5 Downscaling 7 Scenarios. American Journal of Climate Change, 3(5), 512-527, doi:10.4236/ajcc.2014.35043. 8
Christidis, N., R. A. Betts and P. A. Stott, 2019: The Extremely Wet March of 2017 in Peru. Bulletin of the American 9 Meteorological Society, 100(1), S31-S35, doi:10.1175/BAMS-D-18-0110.1. 10
Chu, E., I. Anguelovski and J. Carmin, 2016: Inclusive approaches to urban climate adaptation planning and 11 implementation in the Global South. Climate Policy, 16(3), 372-392, doi:10.1080/14693062.2015.1019822. 12
Chu, E., I. Anguelovski and D. Roberts, 2017: Climate adaptation as strategic urbanism: assessing opportunities and 13 uncertainties for equity and inclusive development in cities. Cities, 60, 378-387, doi:10.1016/j.cities.2016.10.016. 14
CIIFEN, 2016: Condiciones Oceánicas-Atmosféricas. Evolución y perspectivas. Agosto 2016. 5. Available at: 15 https://ciifen.org/wp-content/uploads/2020/09/8-EL-NINO-AGOSTO-2016.pdf (accessed 19/08/2021). 16
Clarvis, M. H. and A. Allan, 2014: Adaptive capacity in a Chilean context: A questionable model for Latin America. 17 Environmental Science & Policy, 43, 78-90, doi:10.1016/j.envsci.2013.10.014. 18
Clavijo Palacios, C. E. and N. Cuvi, 2017: La Sustentabilidad de huertas urbanas y periurbanas con base agroecológica 19 en Quito. Letras Verdes. Revista Latinoamericana de Estudios Socioambientales, 68 pp., 20 doi:10.17141/letrasverdes.21.2017.2608. 21
Clerici, N. et al., 2019: Spatio-temporal and cumulative effects of land use-land cover and climate change on two 22 ecosystem services in the Colombian Andes. Science of The Total Environment, 685, 1181-1192, 23 doi:10.1016/j.scitotenv.2019.06.275. 24
CNE, 2016: Plan Nacional de Gestión del Riesgo 2016-2020 Costa Rica. San José, 1-64 pp. Available at: 25 http://politica.cne.go.cr/index.php/plan/plan (accessed 16/06/2021). 26
CNUC and MMA, 2020: Cadastro Nacional de Unidades de Conservação por Bioma, Ministério do Meio Ambiente do 27 Brasil. Available at: https://www.mma.gov.br/areas-protegidas/cadastro-nacional-de-ucs.html (accessed 28 28/09/2020). 29
Coayla, E. and E. Culqui, 2020: Vulnerability Assessment and Adaptation Costs of Agriculture to Climate Change in 30 the Lima Region, Peru. International Journal of Environmental Science and Development, 11(1), 31 doi:10.18178/ijesd.2020.11.1.1221 32
Cóbar-Carranza, A. J., R. A. García, A. Pauchard and E. Peña, 2014: Effect of Pinus contorta invasion on forest fuel 33 properties and its potential implications on the fire regime of Araucaria araucana and Nothofagus antarctica 34 forests. Biological Invasions, 16(11), 2273-2291, doi:10.1007/s10530-014-0663-8. 35
Cochran, F. V. et al., 2016: Indigenous ecological calendars define scales for climate change and sustainability 36 assessments. Sustainability Science, 11(1), 69-89, doi:10.1007/s11625-015-0303-y. 37
Codeço, C. T. et al., 2016: InfoDengue: a nowcasting system for the surveillance of dengue fever transmission. bioRxiv, 38 046193-046193, doi:10.1101/046193. 39
Cohen, M. C. L. et al., 2018: Decadal-scale dynamics of an Amazonian mangrove caused by climate and sea level 40 changes: Inferences from spatial–temporal analysis and digital elevation models. Earth Surf. Process. Landforms, 41 43(14), 2876-2888, doi:10.1002/esp.4440. 42
Cohn, A. S. et al., 2016: Patterns and processes of pasture to crop conversion in Brazil: Evidence from Mato Grosso 43 State. Land Use Policy, 55, 108-120, doi:10.1016/j.landusepol.2016.03.005. 44
Collodi, J. et al., 2020: How do you build back better so no one is left behind? Lessons from Sint Maarten, Dutch 45 Caribbean, following Hurricane Irma. Disasters, n/a(n/a), doi:10.1111/disa.12423. 46
Colón-González, F. J. et al., 2018: Limiting global-mean temperature increase to 1.5-2 °C could reduce the incidence 47 and spatial spread of dengue fever in Latin America. Proceedings of the National Academy of Sciences of the 48 United States of America, 115(24), 6243-6248, doi:10.1073/pnas.1718945115. 49
Colonia, D. et al., 2017: Compiling an Inventory of Glacier-Bed Overdeepenings and Potential New Lakes in De-50 Glaciating Areas of the Peruvian Andes: Approach, First Results, and Perspectives for Adaptation to Climate 51 Change. Water, 9(5), 336, doi:10.3390/w9050336. 52
Comisión Europea, 2020: La acción para el empoderamiento climático y su potencial transformador en América 53 Latina. Dirección General de Desarrollo y Cooperación - EuropeAid, Bruselas. 54
CONASA, 2019: Clima y Salud. Gobierno de Colombia, Bogotá, 19 pp. Available at: 55 http://www.ideam.gov.co/documents/21021/79866851/03_Boletin_Clima_y_Salud_2019_marzo.pdf/7a69d840-56 e628-4cfc-84e0-f9f53c39019c?version=1.0 (accessed 16/06/2021). 57
Confalonieri, U. E. C., A. C. L. Lima, I. Brito and A. F. Quintão, 2014a: Social, environmental and health vulnerability 58 to climate change in the Brazilian Northeastern Region. Climatic Change, 127(1), 123-137, doi:10.1007/s10584-59 013-0811-7. 60
Confalonieri, U. E. C., C. Margonari and A. F. Quintão, 2014b: Environmental change and the dynamics of parasitic 61 diseases in the Amazon. Acta Tropica, 129(1), 33-41, doi:10.1016/j.actatropica.2013.09.013. 62
ACCEPTED VERSIO
N
SUBJECT TO FIN
AL EDITS
FINAL DRAFT Chapter 12 IPCC WGII Sixth Assessment Report
Do Not Cite, Quote or Distribute 12-126 Total pages: 181
Connolly, J. J. T., 2019: From Jacobs to the Just City: A foundation for challenging the green planning orthodoxy. 1 Cities, 91, 64-70, doi:10.1016/j.cities.2018.05.011. 2
CONRED, 2014: Plan Nacional de Gestión Integral para la Reducción de Riesgo a los Desastres en la Temporada de 3 Lluvias y Huracanes para la República de Guatemala, 2014. Coordinadora Nacional para la Reducción de 4 Desastres -CONRED- Secretaría Ejecutiva, Guatemala, 51 pp. Available at: 5 https://reliefweb.int/report/guatemala/plan-nacional-de-gesti-n-integral-para-la-reducci-n-de-riesgo-los-desastres-6 en-la-1 (accessed 16/06/2021). 7
Consejo Nacional de Cambio Climático y la Secretaría de Planificación y Programación de la Presidencia de 8 Guatemala, 2018: Plan de Acción Nacional de Cambio Climático, Gobierno de la República de Guatemala, 9 Segunda Edición. Consejo Nacional de Cambio Climático y la Secretaría de Planificación y Programación de la 10 Presidencia, S., Guatemala, 213 pp. (accessed 29/08/2021). 11
COPECO, 2014: Plan Nacional de Gestión Integral de Riesgos de Honduras -PNGIRH- Periodo 2014-2019. 12 Tegucigalpa, Honduras, 185 pp. Available at: https://reliefweb.int/sites/reliefweb.int/files/resources/HN-13 PNGIRH_2014-19_Version_Final-COPECO-20170608.pdf (accessed 16/06/2021). 14
Copernicus Emergency Management Service, 2021: Fire danger indices historical data from the Copernicus Emergency 15 Management Service. Available at: https://doi.org/10.24381/cds.0e89c522. 16
Coppola, E. et al., 2014: Present and future climatologies in the phase I CREMA experiment. Climatic Change, 125(1), 17 23-38, doi:10.1007/s10584-014-1137-9. 18
Córdoba Vargas, C. A., S. Hortúa Romero and T. León-Sicard, 2019: Resilience to climate variability: the role of 19 perceptions and traditional knowledge in the Colombian Andes. Agroecology and Sustainable Food Systems, 1-20 27. 21
Coronel T, L., 2019: Los caminos del agua. FONAG: trabajos y aprendizajes. Fondo para la Protección del Agua 22 (FONAG), Quito, 63 pp. 23
Corrales-Suastegui, A., R. Fuentes-Franco and E. G. Pavia, 2020: The mid-summer drought over Mexico and Central 24 America in the 21st century. International Journal of Climatology, 40(3), 1703-1715, doi:10.1002/joc.6296. 25
Correa-Araneda, F. et al., 2020: Extreme climate events can slow down litter breakdown in streams. Aquatic Sciences, 26 82(2), 25, doi:10.1007/s00027-020-0701-9. 27
Correa, A. et al., 2020: A concerted research effort to advance the hydrological understanding of tropical páramos. 28 Hydrological Processes, 34(24), 4609-4627, doi:10.1002/hyp.13904. 29
Correia, I. A. and R. Ojima, 2017: Emigração e imobilidade no nordeste brasileiro: adaptação ou resistência? RDE - 30 Revista de Desenvolvimento Econômico, 3, 175-192, doi:10.21452/rde.v3i38.5080. 31
Cortés, M. E., 2016: Drought, environmental degradation, work and education: A brief comment on the current reality 32 of agricultural communities in the Limarí Province, Chile. Idesia, 34(4), 73-76, doi:10.4067/S0718-33 34292016005000013. 34
Corzo, A. and N. Gamboa, 2018: Environmental impact of mining liabilities in water resources of Parac micro-35 watershed, San Mateo Huanchor district, Peru. Environment, Development and Sustainability, 20(2), 939-961, 36 doi:10.1007/s10668-016-9899-z. 37
Costa, M. H. et al., 2019: Climate risks to Amazon agriculture suggest a rationale to conserve local ecosystems. 38 Frontiers in Ecology and the Environment, 17(10), 584-590, doi:10.1002/fee.2124. 39
Crego, R. D., C. K. Nielsen and K. A. Didier, 2014: Climate change and conservation implications for wet meadows in 40 dry Patagonia. Environmental Conservation, 41(2), 122-131, doi:10.1017/S037689291300026X. 41
Crespo-Pérez, V. et al., 2015: Changes in the distribution of multispecies pest assemblages affect levels of crop damage 42 in warming tropical Andes. Global Change Biology, 21(1), 82-96, doi:10.1111/gcb.12656. 43
Creutzig, F. et al., 2016: Urban infrastructure choices structure climate solutions. Nature Climate Change, 6(12), 1054-44 1056, doi:10.1038/nclimate3169. 45
Crumpler, K. et al., 2020: Regional analysis of the nationally determined contributions in Latin America: Gaps and 46 opportunities in the agriculture and land use sectors [Nations, F. a. A. O. o. T. U. (ed.)]. Environment and Natural 47 Resources Management Working Papers, FAO, FAO, Rome, Italy, 130 pp. Available at: 48 https://doi.org/10.4060/ca8249en (accessed 30/06/2021). 49
Cruz-Garcia, G. S. and P. J. E. Peters, 2015: Conservation of Corals in the Colombian Caribbean. In: Ethnobiology of 50 Corals and Coral Reefs [Narchi, N. and L. L. Price (eds.)]. Springer International Publishing, Cham, pp. 209-234. 51 ISBN 978-3-319-23763-3. 52
Cruz, G. et al., 2018: Thirty Years of Multilevel Processes for Adaptation of Livestock Production to Droughts in 53 Uruguay. Weather, Climate, and Society, 10(1), 59-74. 54
Cuesta, F. et al., 2019: New land in the Neotropics: a review of biotic community, ecosystem, and landscape 55 transformations in the face of climate and glacier change. Regional Environmental Change, 19(6), 1623-1642, 56 doi:10.1007/s10113-019-01499-3. 57
Cuesta, F. et al., 2017a: Latitudinal and altitudinal patterns of plant community diversity on mountain summits across 58 the tropical Andes. Ecography, 40(12), 1381-1394, doi:10.1111/ecog.02567. 59
Cuesta, F. et al., 2017b: Priority areas for biodiversity conservation in mainland Ecuador. Neotropical Biodiversity, 60 3(1), 93-106, doi:10.1080/23766808.2017.1295705. 61
Cuesta, F. et al., 2020: Thermal niche traits of high alpine plant species and communities across the tropical Andes and 62 their vulnerability to global warming. Journal of Biogeography, 47(2), 408-420, doi:10.1111/jbi.13759. 63
ACCEPTED VERSIO
N
SUBJECT TO FIN
AL EDITS
FINAL DRAFT Chapter 12 IPCC WGII Sixth Assessment Report
Do Not Cite, Quote or Distribute 12-127 Total pages: 181
Cunha, F. A. F. d. S. et al., 2016a: The implementation costs of forest conservation policies in Brazil. Ecological 1 Economics, 130, 209-220, doi:10.1016/j.ecolecon.2016.07.007. 2
Cunha, M. d. C. M., J. M. Pessanha and W. T. Caiaffa, 2016b: Understanding the sensitivity of dengue to climate and 3 urban risk factors in Minas Gerais State, Brazil. In: Climate Services for health: Improving public health decision-4 making in a new climate - Case studies [Shumake-Guillemot, J. and L. Fernandez-Montoya (eds.)]. World 5 Meteorological Organization and World Health Organization, Geneva, pp. 72-75. 6
Cunningham, C. et al., 2017: Climate change and drought in Brazil. In: Reduction o vulnerability to disasters: from 7 knowledge to action [Marchezini, V., B. Wisner, S. Saito and L. Londe (eds.)], pp. 361-375. ISBN 978-85-7656-8 050-0. 9
Curtis, P. G. et al., 2018: Classifying drivers of global forest loss. Science, 361(6407), 1108-1111, 10 doi:10.1126/science.aau3445. 11
Cuvi, N., 2015: Un análisis de la resiliencia en Quito, 1980-2015. Bitácora Urbano Territorial, 25(2), 35-42, 12 doi:10.15446/bitacora.v2n25.52036. 13
Cuvi, N., 2018: Chapter 3: Indigenous Imprints and Remnants in the Tropical Andes. In: A Living Past. Environmental 14 Histories of Modern Latin America [Soluri, J., C. Leal and J. A. Pádua (eds.)]. Berghahn Books, New York, USA, 15 pp. 310. ISBN 9781785333903. 16
Cuyckens, G. A. E., M. M. Morales and M. F. Tognelli, 2015: Assessing the distribution of a Vulnerable felid species: 17 threats from human land use and climate change to the kodkod Leopardus guigna. Oryx, 49(4), 611-618, 18 doi:10.1017/S003060531300135X. 19
Cvitanovic, C. et al., 2014: Utility of primary scientific literature to environmental managers: An international case 20 study on coral-dominated marine protected areas. Ocean & Coastal Management, 102, 72-78, 21 doi:10.1016/j.ocecoaman.2014.09.003. 22
D'Onofrio, E. E., M. M. E. Fiore and J. L. Pousa, 2008: Changes in the regime of storm surges at Buenos Aires, 23 Argentina. Journal of Coastal Research, 24(1A), 260-265, doi:10.2112/05-0588.1. 24
da Cruz e Sousa, R. and B. Ríos-Touma, 2018: Stream restoration in Andean cities: learning from contrasting 25 restoration approaches. Urban Ecosystems, 21(2), 281-290, doi:10.1007/s11252-017-0714-x. 26
da Fonseca Aguiar, L. and M. Cataldi, 2021: Social and environmental vulnerability in Southeast Brazil associated with 27 the South Atlantic Convergence Zone. Natural Hazards, doi:10.1007/s11069-021-04926-z. 28
da Silva, A. T. and M. P. Buendía, 2016: Megacities in climate governance: the case of Rio de Janeiro. Meridiano 47 - 29 Journal of Global Studies, 17, e17013, doi:10.20889/M47e17013. 30
Da Silva, C., A. Schardong, J. Garcia and C. Oliveira, 2018a: Climate Change Impacts and Flood Control Measures for 31 Highly Developed Urban Watersheds. Water, 10(7), 829, doi:10.3390/w10070829. 32
da Silva Junior, C. A. et al., 2020: Persistent fire foci in all biomes undermine the Paris Agreement in Brazil. Scientific 33 Reports, 10(1), 16246, doi:10.1038/s41598-020-72571-w. 34
da Silva, U. B. T., M. Delgado-Jaramillo, L. M. de Souza Aguiar and E. Bernard, 2018b: Species richness, geographic 35 distribution, pressures, and threats to bats in the Caatinga drylands of Brazil. Biological Conservation, 221, 312-36 322, doi:10.1016/j.biocon.2018.03.028. 37
Dally, M. et al., 2018: The impact of heat and impaired kidney function on productivity of Guatemalan sugarcane 38 workers. PLOS ONE, 13(10), e0205181, doi:10.1371/journal.pone.0205181. 39
Dangles, O. et al., 2017: Ecosystem sentinels for climate change? Evidence of wetland cover changes over the last 30 40 years in the tropical Andes. PLOS ONE, 12(5), e0175814, doi:10.1371/journal.pone.0175814. 41
Dannenberg, A. L., H. Frumkin, J. J. Hess and K. L. Ebi, 2019: Managed retreat as a strategy for climate change 42 adaptation in small communities: public health implications. Climatic Change, 153(1), 1-14, doi:10.1007/s10584-43 019-02382-0. 44
Dantas, B. F. et al., 2020: Rainfall, not soil temperature, will limit the seed germination of dry forest species with 45 climate change. Oecologia, 192(2), 529-541, doi:10.1007/s00442-019-04575-x. 46
Dávila, D., 2016: Sistemas de Alerta Temprana ante Inundaciones en América Latina. Soluciones Prácticas, Lima, 47 Perú, 64 pp. Available at: https://solucionespracticas.org.pe/Sistemas-de-alerta-temprana-ante-inundaciones-en-48 America-Latina (accessed 16/06/2021). 49
Davis, M. and S. Naumann, 2017: Making the Case for Sustainable Urban Drainage Systems as a Nature-Based 50 Solution to Urban Flooding. In: Nature-Based Solutions to Climate Change Adaptation in Urban Areas: Linkages 51 between Science, Policy and Practice [Kabisch, N., H. Korn, J. Stadler and A. Bonn (eds.)]. Springer International 52 Publishing, Cham, pp. 123-137. ISBN 978-3-319-56091-5. 53
Dawson, R. J. et al., 2018: Urban Areas in Coastal Zones. In: Climate Change and Cities: Second Assessment Report of 54 the Urban Climate Change Research Network [Rosenzweig, C., W. D. Solecki, P. Romero-Lankao, S. Mehrotra, 55 S. Dhakal and S. Ali Ibrahim (eds.)]. Cambridge University Press, New York, United States of America, pp. 319–56 362. ISBN 9781316603338. 57
de Azevedo, T. S., B. P. Bourke, R. Piovezan and M. A. M. Sallum, 2018: The influence of urban heat Islands and 58 socioeconomic factors on the spatial distribution of Aedes aegypti larval habitats. Geospatial Health, 13(1), 179-59 187, doi:10.4081/gh.2018.623. 60
de Coninck, H. et al., 2018: Strengthening and implementing the global response. In: Global Warming of 1.5°C. An 61 IPCC Special Report on the impacts of global warming of 1.5°C above pre-industrial levels and related global 62 greenhouse gas emission pathways, in the context of strengthening the global response to the threat of climate 63
ACCEPTED VERSIO
N
SUBJECT TO FIN
AL EDITS
FINAL DRAFT Chapter 12 IPCC WGII Sixth Assessment Report
Do Not Cite, Quote or Distribute 12-128 Total pages: 181
change, sustainable development, and efforts to eradicate poverty [Masson-Delmotte, V., P. Zhai, H. O. Pörtner, 1 D. Roberts, J. Skea, P. R. Shukla, A. Pirani, W. Moufouma-Okia, C. Péan, R. Pidcock, S. Connors, J. B. R. 2 Matthews, Y. Chen, X. Zhou, M. I. Gomis, E. Lonnoy, T. Maycock, M. Tignor and T. Waterfield (eds.)]. In Press. 3
de Farias, H. S., A. J. de Lucena and V. F. V. V. de Miranda, 2021: Urban Environmental Changes in South America: A 4 Study on Air Pollution and Urban Heat Island over Rio de Janeiro. In: Practices in Regional Science and 5 Sustainable Regional Development: Experiences from the Global South [Singh, R. B., S. Chatterjee, M. Mishra 6 and A. J. de Lucena (eds.)]. Springer Singapore, Singapore, pp. 171-197. ISBN 978-981-16-2221-2. 7
de Jong, P. et al., 2018: Hydroelectric production from Brazil's São Francisco River could cease due to climate change 8 and inter-annual variability. Science of The Total Environment, 634, 1540-1553, 9 doi:10.1016/j.scitotenv.2018.03.256. 10
de la Barrera, F. et al., 2018: Megafires in Chile 2017: Monitoring multiscale environmental impacts of burned 11 ecosystems. Science of the Total Environment, 637-638, 1526-1536, doi:10.1016/j.scitotenv.2018.05.119. 12
de Macedo, M. B., C. A. Ferreira do Lago, E. M. Mendiondo and M. H. Giacomoni, 2018: Decentralized Low Impact 13 Development (LID) Practices Addressing the Security of the Water-Energy-Food Nexus. In: International Low 14 Impact Development Conference 2018. American Society of Civil Engineers, pp. 30-39. 15
de Moraes, F. C. et al., 2019: Long-term temporal and spatial patterns in bioeroding sponge distribution at the Abrolhos 16 Bank, Brazil, Southwestern Atlantic. Marine Ecology, 40(3), e12531, doi:10.1111/maec.12531. 17
de Oliveira Alves, N. et al., 2017: Biomass burning in the Amazon region causes DNA damage and cell death in human 18 lung cells. Scientific Reports, 7(1), 10937, doi:10.1038/s41598-017-11024-3. 19
de Oliveira, B. F. A. et al., 2019: Human heat stress risk prediction in the Brazilian semiarid region based on the wet-20 bulb globe temperature. Anais da Academia Brasileira de Ciencias, 91, e20180748, doi:10.1590/0001-21 3765201920180748. 22
de Oliveira, G. et al., 2012: Conserving the Brazilian semiarid (Caatinga) biome under climate change. Biodiversity and 23 Conservation, 21(11), 2913-2926, doi:10.1007/s10531-012-0346-7. 24
de Oliveira, G. et al., 2020: Smoke pollution's impacts in Amazonia. Science, 369(6504), 634, 25 doi:10.1126/science.abd5942. 26
de Oliveira Soares, M. et al., 2019: Thermal stress and tropical reefs: mass coral bleaching in a stable temperature 27 environment? Marine Biodiversity, 49(6), 2921-2929, doi:10.1007/s12526-019-00994-4. 28
de Salles Cavedon-Capdeville, F. et al., 2020: Climate Change, Extreme Events and Human Mobility in Latin America: 29 Exploring the Links Through National Laws and Policies. In: Climate Change, Hazards and Adaptation Options: 30 Handling the Impacts of a Changing Climate [Leal Filho, W., G. J. Nagy, M. Borga, P. D. Chávez Muñoz and A. 31 Magnuszewski (eds.)]. Springer International Publishing, Cham, pp. 679-700. ISBN 978-3-030-37425-9. 32
de Siqueira, L. P. et al., 2021: Gender inclusion in ecological restoration. Restoration Ecology, e13497, 33 doi:10.1111/rec.13497. 34
de Souza, D. C. and R. Ramos da Silva, 2021: Ocean-Land Atmosphere Model (OLAM) performance for major 35 extreme meteorological events near the coastal region of southern Brazil. Climate Research, 84, 1-21, 36 doi:10.3354/cr01651. 37
de Souza Filho, H. M., M. M. B. Vinholis, M. J. Carrer and R. Bernardo, 2021: Determinants of adoption of integrated 38 systems by cattle farmers in the State of Sao Paulo, Brazil. Agroforestry Systems, 95(1), 103-117, 39 doi:10.1007/s10457-020-00565-8. 40
de Souza Hacon, S., B. F. A. de Oliveira and I. Silveira, 2019: A Review of the Health Sector Impacts of 4 °C or more 41 Temperature Rise. In: Climate Change Risks in Brazil [Nobre, C. A., J. A. Marengo and W. R. Soares (eds.)]. 42 Springer International Publishing, Cham, pp. 67-129. ISBN 978-3-319-92881-4. 43
de Souza, J. G. et al., 2019: Climate change and cultural resilience in late pre-Columbian Amazonia. 44 Debels, P. et al., 2017: The CLME+ Strategic Action Programme: An ecosystems approach for assessing and managing 45
the Caribbean Sea and North Brazil Shelf Large Marine Ecosystems. Environmental Development, 22, 191-205, 46 doi:10.1016/j.envdev.2016.10.004. 47
Debortoli, N. S., P. I. M. Camarinha, J. A. Marengo and R. R. Rodrigues, 2017: An index of Brazil’s vulnerability to 48 expected increases in natural flash flooding and landslide disasters in the context of climate change. Natural 49 Hazards, 86(2), 557-582, doi:10.1007/s11069-016-2705-2. 50
Debortoli, N. S. et al., 2015: Rainfall patterns in the Southern Amazon: a chronological perspective (1971–2010). 51 Climatic Change, 132(2), 251-264, doi:10.1007/s10584-015-1415-1. 52
del Granado, S. et al., 2016: Sistemas de Alerta Temprana para Inundaciones: Análisis Comparativo de Tres Países 53 Latinoamericanos [03/2016, D. R. W. P. S. (ed.)]. Institute for Advanced Development Studies, 24 pp. Available 54 at: http://www.inesad.edu.bo/pdf/wp2016/wp03_2016.pdf (accessed 10/08/2021). 55
del Pozo, A. et al., 2019: Climate Change Impacts and Adaptation Strategies of Agriculture in Mediterranean-Climate 56 Regions (MCRs). Sustainability, 11(10), doi:10.3390/su11102769. 57
Depietri, Y. and T. McPhearson, 2017: Integrating the Grey, Green, and Blue in Cities: Nature-Based Solutions for 58 Climate Change Adaptation and Risk Reduction. In: Nature-Based Solutions to Climate Change Adaptation in 59 Urban Areas: Linkages between Science, Policy and Practice [Kabisch, N., H. Korn, J. Stadler and A. Bonn 60 (eds.)]. Springer International Publishing, Cham, pp. 91-109. ISBN 978-3-319-56091-5. 61
Depsky, N. and D. Pons, 2021: Meteorological Droughts Are Projected to Worsen in Central America's Dry Corridor 62 Throughout the 21st Century. Environmental Research Letters, 16(1), 14001, doi:10.1088/1748-9326/abc5e2. 63
ACCEPTED VERSIO
N
SUBJECT TO FIN
AL EDITS
FINAL DRAFT Chapter 12 IPCC WGII Sixth Assessment Report
Do Not Cite, Quote or Distribute 12-129 Total pages: 181
Dereczynski, C. et al., 2020: Downscaling of climate extremes over South America – Part I: Model evaluation in the 1 reference climate. Weather and Climate Extremes, 29, 100273, doi:10.1016/j.wace.2020.100273. 2
Desbureaux, S. and A.-S. Rodella, 2019: Drought in the city: The economic impact of water scarcity in Latin American 3 metropolitan areas. World Development, 114, 13-27, doi:10.1016/j.worlddev.2018.09.026. 4
Desmaison, B., C. Boano and G. Astolfo, 2018: CASA [Ciudades Auto-Sostenibles Amazónicas]: desafíos y 5 oportunidades para la sostenibilidad de los proyectos de reasentamiento poblacional preventivo en la Amazonía 6 Peruana. Medio Ambiente y Urbanización, 88, 145-176. 7
Di Baldassarre, G. et al., 2018: Water shortages worsened by reservoir effects. Nature Sustainability, 1(11), 617-622, 8 doi:10.1038/s41893-018-0159-0. 9
Di Giulio, G. M. et al., 2018: Mainstreaming climate adaptation in the megacity of São Paulo, Brazil. Cities, 72, 237-10 244, doi:10.1016/j.cities.2017.09.001. 11
Diamond, S. K. and I. Ansharyani, 2018: Mismatched priorities, smallholders, and climate adaptation strategies: 12 landuse scientists, it’s time to step up. Journal of Land Use Science, 13(4), 447-453, 13 doi:10.1080/1747423X.2018.1537313. 14
Díaz-Hormazábal, I. and M. E. González, 2016: Spatio-temporal analyses of wildfires in the region of Maule, Chile. 15 Bosque (Valdivia), 37(1), 147-158, doi:10.4067/S0717-92002016000100014. 16
Díaz, F. P. et al., 2019: Multiscale climate change impacts on plant diversity in the Atacama Desert. Global Change 17 Biology, 25(5), 1733-1745, doi:10.1111/gcb.14583. 18
Diffenbaugh, N. S. and F. Giorgi, 2012: Climate change hotspots in the CMIP5 global climate model ensemble. 19 Climatic Change, 114(3-4), 813-822, doi:10.1007/s10584-012-0570-x. 20
Dinerstein, E. et al., 2019: A Global Deal For Nature: Guiding principles, milestones, and targets. Science Advances, 21 5(4), eaaw2869, doi:10.1126/sciadv.aaw2869. 22
Ding, Q., X. Chen, R. Hilborn and Y. Chen, 2017: Vulnerability to impacts of climate change on marine fisheries and 23 food security. Marine Policy, 83, 55-61, doi:10.1016/j.marpol.2017.05.011. 24
Diniz, F., F. Gonçalves and S. Sheridan, 2020: Heat Wave and Elderly Mortality: Historical Analysis and Future 25 Projection for Metropolitan Region of São Paulo, Brazil. Atmosphere, 11, 933, doi:10.3390/atmos11090933. 26
Djoudi, H. et al., 2016: Beyond dichotomies: Gender and intersecting inequalities in climate change studies. Ambio, 27 45(3), 248-262, doi:10.1007/s13280-016-0825-2. 28
Dobson, A. P. et al., 2020: Ecology and economics for pandemic prevention. Science, 369(6502), 379-381, 29 doi:10.1126/science.abc3189. 30
Dodman, D., D. Archer and D. Satterthwaite, 2019: Editorial: Responding to climate change in contexts of urban 31 poverty and informality. Environment and Urbanization, 31(1), 3-12, doi:10.1177/0956247819830004. 32
Domic, A. I. et al., 2018: Two Thousand Years of Land-Use and Vegetation Evolution in the Andean Highlands of 33 Northern Chile Inferred from Pollen and Charcoal Analyses. Quaternary, 1(3), doi:10.3390/quat1030032. 34
Domínguez-Castro, F., R. García-Herrera and S. M. Vicente-Serrano, 2018: Wet and dry extremes in Quito (Ecuador) 35 since the 17th century. International Journal of Climatology, 38(4), 2006-2014, doi:10.1002/joc.5312. 36
Donat, M. G. et al., 2013: Updated analyses of temperature and precipitation extreme indices since the beginning of the 37 twentieth century: The HadEX2 dataset. Journal of Geophysical Research: Atmospheres, 118(5), 2098-2118, 38 doi:10.1002/jgrd.50150. 39
Donatti, C. I. et al., 2019: Vulnerability of smallholder farmers to climate change in Central America and Mexico: 40 current knowledge and research gaps. Climate and Development, 11(3), 264-286, 41 doi:10.1080/17565529.2018.1442796. 42
Doswald, N. et al., 2014: Effectiveness of ecosystem-based approaches for adaptation: review of the evidence-base. 43 Climate and Development, 6(2), 185-201, doi:10.1080/17565529.2013.867247. 44
Doughty, C. A., 2016: Building climate change resilience through local cooperation: a Peruvian Andes case study. 45 Regional Environmental Change, 16(8), 2187-2197, doi:10.1007/s10113-015-0882-2. 46
Doughty, C. E. et al., 2015: Drought impact on forest carbon dynamics and fluxes in Amazonia. Nature, 519(7541), 78-47 82, doi:10.1038/nature14213. 48
Dow, K. et al., 2013: Limits to adaptation. Nature Climate Change, 3(4), 305-307, doi:10.1038/nclimate1847. 49 Drenkhan, F. et al., 2015: The changing water cycle: climatic and socioeconomic drivers of water-related changes in the 50
Andes of Peru. Wiley Interdisciplinary Reviews: Water, 2(6), 715-733, doi:10.1002/wat2.1105. 51 Drenkhan, F., C. Huggel, L. Guardamino and W. Haeberli, 2019: Managing risks and future options from new lakes in 52
the deglaciating Andes of Peru: The example of the Vilcanota-Urubamba basin. Science of the Total Environment, 53 665, 465-483, doi:10.1016/j.scitotenv.2019.02.070. 54
Drosou, N. et al., 2019: Key Factors Influencing Wider Adoption of Blue–Green Infrastructure in Developing Cities. 55 Water, 11(6), doi:10.3390/w11061234. 56
Duarte-Abadía, B., R. Boelens and T. Roa-Avendaño, 2015: Hydropower, Encroachment and the Re-patterning of 57 Hydrosocial Territory: The Case of Hidrosogamoso in Colombia. Human Organization, 74(3), 243-254, 58 doi:10.17730/0018-7259-74.3.243. 59
Duarte, C. et al., 2016: Ocean acidification induces changes in algal palatability and herbivore feeding behavior and 60 performance. Oecologia, 180(2), 453-462, doi:10.1007/s00442-015-3459-3. 61
ACCEPTED VERSIO
N
SUBJECT TO FIN
AL EDITS
FINAL DRAFT Chapter 12 IPCC WGII Sixth Assessment Report
Do Not Cite, Quote or Distribute 12-130 Total pages: 181
Duarte, C. et al., 2018: The energetic physiology of juvenile mussels, Mytilus chilensis (Hupe): The prevalent role of 1 salinity under current and predicted pCO2 scenarios. Environmental Pollution, 242, 156-163, 2 doi:10.1016/j.envpol.2018.06.053. 3
Duarte, G. A. S. et al., 2020: Heat Waves Are a Major Threat to Turbid Coral Reefs in Brazil. Frontiers in Marine 4 Science, 7, 179, doi:10.3389/fmars.2020.00179. 5
Duchicela, S. A. et al., 2019: Indicators for assessing tropical alpine rehabilitation practices. Ecosphere, 10(2), e02595, 6 doi:10.1002/ecs2.2595. 7
Dudley, N. et al., 2018: The essential role of other effective area-based conservation measures in achieving big bold 8 conservation targets. Global Ecology and Conservation, 15, e00424, doi:10.1016/j.gecco.2018.e00424. 9
Dudley, N. et al., 2010: Natural Solutions: Protected areas helping people cope with climate change. IUCN-WCPA, 10 TNC, UNDP, WCS, The World Bank and WWF, Gland, Switzerland, Washington DC and New York, USA. 11 ISBN 978-2-88085-308-2. 12
Duffy, P. B., P. Brando, G. P. Asner and C. B. Field, 2015: Projections of future meteorological drought and wet 13 periods in the Amazon. Proceedings of the National Academy of Sciences, 112(43), 13172-13177, 14 doi:10.1073/pnas.1421010112. 15
Dunn, R. J. H. et al., 2020: Development of an Updated Global Land In Situ-Based Data Set of Temperature and 16 Precipitation Extremes: HadEX3. Journal of Geophysical Research: Atmospheres, 125(16), e2019JD032263, 17 doi:10.1029/2019JD032263. 18
Duque, A. et al., 2021: Mature Andean forests as globally important carbon sinks and future carbon refuges. Nature 19 Communications, 12(1), 2138, doi:10.1038/s41467-021-22459-8. 20
Duque, A., P. R. Stevenson and K. J. Feeley, 2015: Thermophilization of adult and juvenile tree communities in the 21 northern tropical Andes. Proceedings of the National Academy of Sciences, 112(34), 10744-10749, 22 doi:10.1073/pnas.1506570112. 23
Durand-Bessart, C. et al., 2020: Analysis of interactions amongst shade trees, coffee foliar diseases and coffee yield in 24 multistrata agroforestry systems. Crop Protection, 133, 105137, doi:10.1016/j.cropro.2020.105137. 25
Durand, F., 2019: The Odebrecht Tsunami. NACLA Report on the Americas, 51(2), 146-152, 26 doi:10.1080/10714839.2019.1617475. 27
Dussaillant, I., E. Berthier and F. Brun, 2018: Geodetic Mass Balance of the Northern Patagonian Icefield from 2000 to 28 2012 Using Two Independent Methods. Frontiers in Earth Science, 6, 8, doi:10.3389/feart.2018.00008. 29
Dussaillant, I. et al., 2019: Two decades of glacier mass loss along the Andes. Nat. Geosci., 12(10), 802-808, 30 doi:10.1038/s41561-019-0432-5. 31
Duval, I. d. B., P. d. S. P. Garcia and R. B. d. Santos, 2018: Relatório do Projeto Construção de Indicadores de 32 Vulnerabilidade da População como Insumo para a Elaboração das Ações de Adaptação à Mudança do Clima no 33 Brasil: Volume: Mato Grosso do Sul. Fundação Oswaldo Cruz, Ministério do Meio Ambiente e Fundo Nacional 34 sobre Mudança do Clima FIOCRUZ, Rio de Janeiro, RJ, 112 pp. Available at: 35 https://www.mma.gov.br/images/arquivo/80182/Vulnerabilidade%20%C3%A0%20Mudan%C3%A7a%20do%2036 Clima/Relat%C3%B3rio_Final_MatoGrossodoSul_Novo.pdf (accessed 11/10/2020). 37
Eakin, H. C., M. C. Lemos and D. R. Nelson, 2014: Differentiating capacities as a means to sustainable climate change 38 adaptation. Global Environmental Change, 27, 1-8, doi:10.1016/j.gloenvcha.2014.04.013. 39
Eastin, M. D. et al., 2014: Intra- and interseasonal autoregressive prediction of dengue outbreaks using local weather 40 and regional climate for a tropical environment in Colombia. American Journal of Tropical Medicine and 41 Hygiene, 91(3), 598-610, doi:10.4269/ajtmh.13-0303. 42
ECLAC, 2013: Gestión integral de riesgos y seguros agropecuarios en Centroamérica y la República Dominicana: 43 Situación actual y líneas de acción potenciales ECLAC, 119 pp. Available at: 44 https://repositorio.cepal.org/bitstream/handle/11362/27170/M20130038_es.pdf?sequence=1 (accessed 45 31/08/2021). 46
ECLAC, 2015: Microseguros agropecuarios y gestión integral de riesgos en Centroamérica y la República 47 Dominicana: lineamientos estratégicos para su desarrollo y fortalecimiento. ECLAC, Ciudad de Mexico, 48 Mexico, 221 pp. Available at: http://hdl.handle.net/11362/39115 (accessed 31/08/2021). 49
ECLAC, 2018: Economics of climate change in Latin America and the Caribbean: A graphic view. Economic 50 Commission for Latin America and the Caribbean, ECLAC, Santiago, Chile, 59 pp. Available at: 51 https://www.cepal.org/en/publications/43889-economics-climate-change-latin-america-and-caribbean-graphic-52 view (accessed 09/08/2021). 53
ECLAC, 2019a: Índices climáticos, políticas de aseguramiento agropecuario y gestión integral de riesgos en 54 Centroamérica y la República Dominicana: Experiencias internacionales y avances regionales. ECLAC, Ciudad 55 de México, Mexico, 265 pp. Available at: http://hdl.handle.net/11362/45023 (accessed 31/08/2021). 56
ECLAC, 2019b: Social Panorama of Latin America, 2018. Economic Comission for Latin America and the Caribbean 57 (ECLAC), Santiago, Chile, 220 pp. Available at: https://www.cepal.org/en/publications/44396-social-panorama-58 latin-america-2018 (accessed 21/09/2019). 59
ECLAC, 2020: The 2030 Agenda for Sustainable Development in the new global and regional context: Scenarios and 60 projections in the current crisis. ECLAC, Santiago, Chile, 59 pp. Available at: 61 https://sustainabledevelopment.un.org/content/documents/26088ECLAC_contribution_2020.pdf (accessed 62 25/08/2021). 63
ACCEPTED VERSIO
N
SUBJECT TO FIN
AL EDITS
FINAL DRAFT Chapter 12 IPCC WGII Sixth Assessment Report
Do Not Cite, Quote or Distribute 12-131 Total pages: 181
ECLAC, 2021: Social Panorama of Latin America 2020. ECLAC, 252 pp. Available at: 1 https://www.cepal.org/en/publications/46688-social-panorama-latin-america-2020 (accessed 01/09/2021). 2
ECLAC et al., 2015: Climate Change in Central America: Potential Impacts and Public Policy Options. CEPAL, 3 México city, México, 173 pp. Available at: 4 https://repositorio.cepal.org/bitstream/handle/11362/39150/S1800827_en.pdf?sequence=7&isAllowed=y 5 (accessed 12/08/2020). 6
ECLAC and PAHO, 2020: COVID-19 Report. ECLAC. Available at: 7 https://repositorio.cepal.org/bitstream/handle/11362/45841/4/S2000461_en.pdf (accessed 31/08/2021). 8
Eddy, T. D., A. M. Friedlander and P. Salinas de León, 2019: Ecosystem effects of fishing & El Niño at the Galápagos 9 Marine Reserve. PeerJ, 7, e6878, doi:10.7717/peerj.6878. 10
Eguiguren-Velepucha, P. A. et al., 2016: Tropical ecosystems vulnerability to climate change in southern Ecuador. 11 Tropical Conservation Science, 9(4), doi:10.1177/1940082916668007. 12
Eitzinger, A. et al., 2017: Assessing high-impact spots of climate change: spatial yield simulations with Decision 13 Support System for Agrotechnology Transfer (DSSAT) model. Mitigation and Adaptation Strategies for Global 14 Change, 22(5), 743-760, doi:10.1007/s11027-015-9696-2. 15
ELLA, 2013: Evidences and lessons from Latin America: City-level climate change adaptation and mitigation. ELLA 16 area: Environmental Management, ELLA Network - south south research, exchange and learning, ELLA, Lima, 17 Peru, 16 pp. Available at: http://ella.practicalaction.org/wp-18 content/uploads/files/131204_ENV_CitAdaMit_GUIDE.pdf (accessed 17/10/2020). 19
Ellison, A. M., A. J. Felson and D. A. Friess, 2020: Mangrove Rehabilitation and Restoration as Experimental Adaptive 20 Management. Frontiers in Marine Science, 7, 327, doi:10.3389/fmars.2020.00327. 21
Ellwanger, J. H. et al., 2020: Beyond diversity loss and climate change: Impacts of Amazon deforestation on infectious 22 diseases and public health. Anais da Academia Brasileira de Ciências, 92(1), 1-33, doi:10.1590/0001-23 3765202020191375. 24
Eloy, L., E. S. Brondizio and R. Do Pateo, 2015: New Perspectives on Mobility, Urbanisation and Resource 25 Management in Riverine Amazônia. Bulletin of Latin American Research, 34(1), 3-18, doi:10.1111/blar.12267. 26
Emmer, A., 2017: Geomorphologically effective floods from moraine-dammed lakes in the Cordillera Blanca, Peru. 27 Quaternary Science Reviews, 177, 220-234, doi:10.1016/j.quascirev.2017.10.028. 28
Emmer, A. et al., 2016: 882 lakes of the Cordillera Blanca: An inventory, classification, evolution and assessment of 29 susceptibility to outburst floods. CATENA, 147, 269-279, doi:10.1016/j.catena.2016.07.032. 30
Emperaire, L., 2018: Quais inovações para os sistemas agrícolas tradicionais? ARU : Revista de Pesquisa Intercultural 31 da Bacia do Rio Negro, 2, 21-27 pp. Available at: https://www.documentation.ird.fr/hor/fdi:010073891 (accessed 32 09/08/2021). 33
Empresa de Pesquisa Energética, 2018: Plano Decenal de Expansão de Energia 2027. EPE, Energia, M. d. M. e., 34 Brasilia, Brazil, 345 pp. Available at: https://www.epe.gov.br/sites-pt/publicacoes-dados-35 abertos/publicacoes/Documents/PDE%202027_aprovado_OFICIAL.pdf (accessed 24/10/2020). 36
Environmental Secretariat of Paraguay, 2011: Segunda Comunicación Nacional Cambio Climático Paraguay. 37 Asunción, Uruguay, 181 pp. Available at: 38 http://euroclimaplus.org/intranet/_documentos/repositorio/02%20Comunicacion%20Convencion%20ONU%20Ca39 mbio%20Climatico%20Paraguay%20(2011).pdf (accessed 16/06/2021). 40
Eriksen, S. et al., 2021: Adaptation interventions and their effect on vulnerability in developing countries: Help, 41 hindrance or irrelevance? World Development, 141, 105383, doi:10.1016/j.worlddev.2020.105383. 42
ESA, 2018: Land Cover CCI Climate Research Data Package (CRDP), European Space Agency. Available at: 43 http://www.esa-landcover-cci.org/?q=node/164 (accessed 07/06/2021). 44
Escalante Estrada, C. and L. Miranda, 2020: The hillside poor at risk? Land trafficking in Jose Carlos Maritegui at the 45 outskirts of Lima, Peru. In: Communities, Land and Social Innovation [Van den Broeck, P., A. Sadiq, I. Hiergens, 46 M. Quintana Molina, H. Verschure and F. Moulaert (eds.)]. Edward Elgar Publishing, Cheltenham, UK, pp. 109-47 124. ISBN 9781788973762. 48
Escalera-Antezana, J. P. et al., 2020a: Clinical features of fatal cases of Chapare virus hemorrhagic fever originating 49 from rural La Paz, Bolivia, 2019: A cluster analysis. Travel Medicine and Infectious Disease, 36, 101589, 50 doi:10.1016/j.tmaid.2020.101589. 51
Escalera-Antezana, J. P. et al., 2020b: Orthohantavirus pulmonary syndrome in Santa Cruz and Tarija, Bolivia, 2018. 52 International Journal of Infectious Diseases, 90, 145-150, doi:10.1016/j.ijid.2019.10.021. 53
Escobar-Camacho, D. et al., 2021: Oceanic islands and climate: using a multi-criteria model of drivers of change to 54 select key conservation areas in Galapagos. Regional Environmental Change, 21(2), 47, doi:10.1007/s10113-021-55 01768-0. 56
Espinet, X., A. Schweikert, N. van den Heever and P. Chinowsky, 2016: Planning resilient roads for the future 57 environment and climate change: Quantifying the vulnerability of the primary transport infrastructure system in 58 Mexico. Transp. Policy, 50, 78-86, doi:10.1016/j.tranpol.2016.06.003. 59
Espinoza, J. C. et al., 2014: The extreme 2014 flood in south-western Amazon basin: the role of tropical-subtropical 60 South Atlantic SST gradient. Environmental Research Letters, 9(12), 124007, doi:10.1088/1748-61 9326/9/12/124007. 62
ACCEPTED VERSIO
N
SUBJECT TO FIN
AL EDITS
FINAL DRAFT Chapter 12 IPCC WGII Sixth Assessment Report
Do Not Cite, Quote or Distribute 12-132 Total pages: 181
Espinoza, J. C., J. Ronchail, J. A. Marengo and H. Segura, 2019a: Contrasting North–South changes in Amazon wet-1 day and dry-day frequency and related atmospheric features (1981–2017). Climate Dynamics, 52(9), 5413-5430, 2 doi:10.1007/s00382-018-4462-2. 3
Espinoza, J. C. et al., 2016: Evolution of wet-day and dry-day frequency in the western Amazon basin: Relationship 4 with atmospheric circulation and impacts on vegetation. Water Resources Research, 52(11), 8546-8560, 5 doi:10.1002/2016WR019305. 6
Espinoza, J. C. et al., 2019b: Regional hydro-climatic changes in the Southern Amazon Basin (Upper Madeira Basin) 7 during the 1982–2017 period. Journal of Hydrology: Regional Studies, 26, 100637, 8 doi:10.1016/j.ejrh.2019.100637. 9
Esquivel-Muelbert, A. et al., 2019: Compositional response of Amazon forests to climate change. Global Change 10 Biology, 25(1), 39-56, doi:10.1111/gcb.14413. 11
Estallo, E. L. et al., 2020: A decade of arbovirus emergence in the temperate southern cone of South America: dengue, 12 Aedes aegypti and climate dynamics in Córdoba, Argentina. Heliyon, 6(9), e04858, 13 doi:10.1016/j.heliyon.2020.e04858. 14
Estrada, G. C. D., M. L. G. Soares, V. Fernadez and P. M. M. de Almeida, 2015: The economic evaluation of carbon 15 storage and sequestration as ecosystem services of mangroves: a case study from southeastern Brazil. 16 International Journal of Biodiversity Science, Ecosystem Services & Management, 11(1), 29-35, 17 doi:10.1080/21513732.2014.963676. 18
Estrella, B. et al., 2019: Air pollution control and the occurrence of acute respiratory illness in school children of Quito, 19 Ecuador. Journal of Public Health Policy, 40(1), 17-34, doi:10.1057/s41271-018-0148-6. 20
Ewbank, R. et al., 2019: Building resilience to El Niño-related drought: experiences in early warning and early action 21 from Nicaragua and Ethiopia. Disasters, 43(S3), S345-S367, doi:10.1111/disa.12340. 22
Fadrique, B. et al., 2018: Widespread but heterogeneous responses of Andean forests to climate change. Nature, 23 564(7735), 207-212, doi:10.1038/s41586-018-0715-9. 24
Falcão, N. P. S., C. R. Clement, S. M. Tsai and N. B. Comerford, 2009: Pedology, fertility, and biology of central 25 amazonian dark earths. In: Amazonian Dark Earths: Wim Sombroek's Vision [Springer (ed.)], Dordrecht, pp. 213-26 228. ISBN 9781402090301. 27
FAO, 2016a: Corredor Seco América Central. Informe de Situación-Junio 2016. 3 Available at: http://www.fao.org/3/a-28 br092s.pdf (accessed 16/06/2021). 29
FAO, 2016b: El Rol de la Mujer en la Pesca y La Acuicultura en Chile, Colombia, Paraguay y Peru. Food and 30 Agriculture Organization of the United Nations, Santiago de Chile, 38 pp. Available at: 31 http://www.fao.org/3/i5774s/i5774s.pdf (accessed 16/06/2021). 32
FAO, 2016c: State of the World’s Forests 2016. Forests and agriculture: land-use challenges and opportunities, FAO, 33 Rome, Italy, 126 pp. Available at: http://www.fao.org/3/a-i5588e.pdf (accessed 14/09/2020). 34
FAO, 2018: The state of world fisheries and aquaculture. Meeting the sustainable development goals. 3, Food and 35 Agriculture Organization of the United Nations, Rome, 227 pp. Available at: 36 http://www.fao.org/3/i9540en/i9540en.pdf (accessed 25/09/2019). 37
FAO, 2020a: The dual threat of extreme weather and the COVID-19 crisis: Anticipating the impacts on food 38 availability. FAO, Roma, Italy. Available at: https://doi.org/10.4060/cb0206en (accessed 29/06/2021). 39
FAO, 2020b: Impact of COVID-19 on informal workers. Rome, Italy. Available at: https://doi.org/10.4060/ca8560en 40 (accessed 29/06/2021). 41
FAO, 2021a: Crop Prospects and Food Situation - Quarterly Global Report No. 1, March 2021. FAO, Rome, Italy, 46 42 pp. Available at: https://doi.org/10.4060/cb3672en (accessed 29/06/2021). 43
FAO, 2021b: FAO's work on climate change - Fisheries and aquaculture 2020. FAO, Rome, Italy, 79 pp. Available at: 44 https://doi.org/10.4060/cb3414en (accessed 29/06/2021). 45
FAO, 2021c: The impact of COVID-19 on fisheries and aquaculture food systems. Possible responses: Information 46 paper, November 2020. FAO, Rome, Italy. ISBN 9789251337684. 47
FAO and ECLAC, 2020: Food systems and COVID-19 in Latin America and the Caribbean: Impact and risks in the 48 labour market. Bulletin 5. Rome, Italy, 18 pp. Available at: https://doi.org/10.4060/ca9237en (accessed 49 29/06/2021). 50
FAO and Fundación Futuro Latinoamericano, 2019: Resiliencia climática rural en América Latina, Una reseña de 51 experiencias, lecciones aprendidas y escalamiento. FAO and Fundación Futuro Latinoamericano, Quito, 20 pp. 52 Available at: http://www.fao.org/3/ca4632es/ca4632es.pdf (accessed 25/09/2019). 53
FAO et al., 2021: Regional Overview of Food Security and Nutrition in Latin America and the Caribbean 2020 – Food 54 security and nutrition for lagging territories. . FAO, I., PAHO, WFP, UNICEF, Santiago, Chile, 150 pp. 55 Available at: https://doi.org/10.4060/cb2242en (accessed 30/06/2021). 56
FAO and UNEP, 2020: The State of the World’s Forests 2020. Forests, biodiversity and people. Rome, Italy, 214 pp. 57 Available at: https://doi.org/10.4060/ca8642en (accessed 25/08/2021). 58
Farías-Barahona, D. et al., 2019: Geodetic mass balances and area changes of Echaurren Norte Glacier (Central Andes, 59 Chile) between 1955 and 2015. Remote Sensing, 11(3), 260, doi:10.3390/rs11030260. 60
Federal Office of Meteorology and Climatology MeteoSwiss, 2021: SPI and SPEI. Available at: 61 https://www.meteoswiss.admin.ch/home/climate/swiss-climate-in-detail/climate-indicators/drought-indices/spi-62 and-spei.html. 63
ACCEPTED VERSIO
N
SUBJECT TO FIN
AL EDITS
FINAL DRAFT Chapter 12 IPCC WGII Sixth Assessment Report
Do Not Cite, Quote or Distribute 12-133 Total pages: 181
Feeley, K. J. et al., 2013: Compositional shifts in Costa Rican forests due to climate-driven species migrations. Global 1 Change Biology, 19(11), 3472-3480, doi:10.1111/gcb.12300. 2
Feeley, K. J. and M. R. Silman, 2016: Disappearing climates will limit the efficacy of Amazonian protected areas. 3 Diversity and Distributions, 22(11), 1081-1084, doi:10.1111/ddi.12475. 4
Feeley, K. J. et al., 2011: Upslope migration of Andean trees. Journal of Biogeography, 38(4), 783-791, 5 doi:10.1111/j.1365-2699.2010.02444.x. 6
Feldpausch, T. R. et al., 2016: Amazon forest response to repeated droughts. Global Biogeochemical Cycles, 30(7), 7 964-982, doi:10.1002/2015GB005133. 8
Fercovic, J., W. Foster and O. Melo, 2019: Economic development and residential water consumption in Chile. 9 Environment and Development Economics, 24(1), 23-46, doi:10.1017/S1355770X18000463. 10
Fernandez-Manjarrés, J., 2018: Using Ecological Modelling Tools to Inform Policy Makers of Potential Changes in 11 Crop Distribution: An Example with Cacao Crops in Latin America. In: Economic Tools and Methods for the 12 Analysis of Global Change Impacts on Agriculture and Food Security [Quiroga, S. (ed.)]. Springer, Cham, 13 Switzerland, pp. 11-23. ISBN 331999462X. 14
Fernández, C. and S. Buss, 2016: Ocurrencia y Gestión de inundaciones en América Latina y el Caribe – Factores 15 claves y experiencia adquirida. Banco Interamericano de Desarrollo (BID), 27 pp. Available at: 16 https://publications.iadb.org/es/publicacion/15599/ocurrencia-y-gestion-de-inundaciones-en-america-latina-y-el-17 caribe-factores (accessed 16/06/2021). 18
Fernandez, E., C. Whitney, I. F. Cuneo and E. Luedeling, 2020: Prospects of decreasing winter chill for deciduous fruit 19 production in Chile throughout the 21st century. Climatic Change, 159(3), 423-439, doi:10.1007/s10584-019-20 02608-1. 21
Fernández, F. J. et al., 2019: Implications of climate change for semi-arid dualistic agriculture: a case study in Central 22 Chile. Regional Environmental Change, 19(1), 89-100, doi:10.1007/s10113-018-1380-0. 23
Fernández, I. C. and J. Wu, 2016: Assessing environmental inequalities in the city of Santiago (Chile) with a 24 hierarchical multiscale approach. Applied Geography, 74, 160-169, doi:10.1016/j.apgeog.2016.07.012. 25
Fernández Kolb, P. et al., 2019: Climate Smart Coffee in El Salvador. International Center for Tropical Agriculture 26 (CIAT), Cali, Colombia, 22 pp. Available at: https://hdl.handle.net/10568/103773. 27
Feron, S. et al., 2019: Observations and Projections of Heat Waves in South America. Scientific Reports, 9(1), 8173-28 8173, doi:10.1038/s41598-019-44614-4. 29
Ferreira, A. C. and L. D. Lacerda, 2016: Degradation and conservation of Brazilian mangroves, status and perspectives. 30 Ocean & Coastal Management, 125, 38-46, doi:10.1016/j.ocecoaman.2016.03.011. 31
Ferreira Filho, J. B. d. S. and G. I. d. Moraes, 2015: Climate change, agriculture and economic effects on different 32 regions of Brazil. Environment and Development Economics, 20(1), 37-56, doi:10.1017/S1355770X14000126. 33
Ferreira, L. S. and D. H. S. Duarte, 2019: Exploring the relationship between urban form, land surface temperature and 34 vegetation indices in a subtropical megacity. Urban Climate, 27, 105-123, doi:10.1016/j.uclim.2018.11.002. 35
Ferreira, M. N. et al., 2021: Drivers and causes of zoonotic diseases: an overview. PARKS, 27, 36 doi:10.2305/IUCN.CH.2021.PARKS-27-SIMNF.en. 37
Ferrero, R., M. Lima and J. L. Gonzalez-Andujar, 2018: Crop production structure and stability under climate change in 38 South America. Ann. Appl. Biol., 172(1), 65-73, doi:10.1111/aab.12402. 39
Ferro, V. G., P. Lemes, A. S. Melo and R. Loyola, 2014: The reduced effectiveness of protected areas under climate 40 change threatens Atlantic forest tiger moths. PLoS ONE, 9(9), e107792, doi:10.1371/journal.pone.0107792. 41
Figueroa, M. et al., 2020: On the relationship between reversal of the river stage (repiquetes), rainfall and low-level 42 wind regimes over the western Amazon basin. Journal of Hydrology: Regional Studies, 32, 100752, 43 doi:10.1016/j.ejrh.2020.100752. 44
Filho, J. P. D., D. M. Lapola, R. R. Torres and M. C. Lemos, 2016: Socio-climatic hotspots in Brazil: how do changes 45 driven by the new set of IPCC climatic projections affect their relevance for policy? Climatic Change, 136(3), 46 413-425, doi:10.1007/s10584-016-1635-z. 47
Filho, W. L. et al., 2019: Assessing the impacts of climate change in cities and their adaptive capacity: Towards 48 transformative approaches to climate change adaptation and poverty reduction in urban areas in a set of 49 developing countries. Science of The Total Environment, 692, 1175-1190, doi:10.1016/j.scitotenv.2019.07.227. 50
Fisher, E., J. Hellin, H. Greatrex and N. Jensen, 2019: Index insurance and climate risk management: Addressing social 51 equity. Development Policy Review, 37(5), 581-602, doi:10.1111/dpr.12387. 52
Flachsbarth, I. et al., 2015: The Role of Latin America’s Land and Water Resources for Global Food Security: 53 Environmental Trade-Offs of Future Food Production Pathways. PLOS ONE, 10(1), e0116733, 54 doi:10.1371/journal.pone.0116733. 55
Fletcher, I. K. et al., 2021: Climate services for health: From global observations to local interventions. Med, 2(4), 355-56 361, doi:10.1016/j.medj.2021.03.010. 57
Fletcher, I. K. et al., 2020: The Relative Role of Climate Variation and Control Interventions on Malaria Elimination 58 Efforts in El Oro, Ecuador: A Modeling Study. Front. Environ. Sci., 8, 135, doi:10.3389/fenvs.2020.00135. 59
Flores, B. M. and M. Holmgren, 2021: White-Sand Savannas Expand at the Core of the Amazon After Forest Wildfires. 60 Ecosystems, doi:10.1007/s10021-021-00607-x. 61
Fontoura, N. F. et al., 2016: Aspects of fish conservation in the upper Patos Lagoon basin. Journal of Fish Biology, 62 89(1), 315-336, doi:10.1111/jfb.13005. 63
ACCEPTED VERSIO
N
SUBJECT TO FIN
AL EDITS
FINAL DRAFT Chapter 12 IPCC WGII Sixth Assessment Report
Do Not Cite, Quote or Distribute 12-134 Total pages: 181
Fontúrbel, F. E., A. Lara, D. Lobos and C. Little, 2018: The cascade impacts of climate change could threaten key 1 ecological interactions. Ecosphere, 9(12), e02485, doi:10.1002/ecs2.2485. 2
Forcella, D., R. Moser and L. Gonzalez, 2015: Rural Microfinance and Climate Change: Geographical Credits 3 Allocation and Vulnerability. An Analysis of Agroamigo in Brazil's Northeastern States. SSRN, 4 doi:10.2139/ssrn.2599056. 5
Ford, A., R. Dawson, P. Blythe and S. Barr, 2018: Land-use transport models for climate change mitigation and 6 adaptation planning. J. Transp. Land Use, 11(1), 83-101, doi:10.5198/jtlu.2018.1209. 7
Forero, E., Y. Hernández and C. Zafra, 2014: Percepción Latinoamericana de cambio climático: metodologías, 8 herramientas y estrategias de adaptación en comunidades locales. Una revisión. Revista U.D.C.A Actualidad & 9 Divulgación Científica, 17(1), 73-85. 10
Foresta, L. et al., 2018: Heterogeneous and rapid ice loss over the Patagonian Ice Fields revealed by CryoSat-2 swath 11 radar altimetry. Remote Sensing of Environment, 211, 441-455, doi:10.1016/j.rse.2018.03.041. 12
Foro Ciudades Para la Vida, 2021: Observatorio Climático Local - Perú, Peru. 13 Forster, P. M. et al., 2020: Current and future global climate impacts resulting from COVID-19. Nature Climate 14
Change, 10(10), 913-919, doi:10.1038/s41558-020-0883-0. 15 Forzza, R. C. et al., 2012: New Brazilian Floristic List Highlights Conservation Challenges. BioScience, 62(1), 39-45, 16
doi:10.1525/bio.2012.62.1.8. 17 Fragkos, P., 2020: Global Energy System Transformations to 1.5 °C: The Impact of Revised Intergovernmental Panel 18
on Climate Change Carbon Budgets. Energy Technology, 8(9), 2000395, doi:10.1002/ente.202000395. 19 Frangoudes, K. and S. Gerrard, 2018: (En)Gendering Change in Small-Scale Fisheries and Fishing Communities in a 20
Globalized World. Maritime Studies, 17(2), 117-124, doi:10.1007/s40152-018-0113-9. 21 Frank, S. et al., 2019: Agricultural non-CO2 emission reduction potential in the context of the 1.5 °C target. Nature 22
Climate Change, 9(1), 66-72, doi:10.1038/s41558-018-0358-8. 23 French, A. and R. Mechler, 2017: Managing El Niño Risks Under Uncertainty in Peru: Learning from the past for a 24
more disaster-resilient future. International Institute for Applied Systems Analysis, Laxenburg, Austria, 39 pp. 25 Available at: 26 http://pure.iiasa.ac.at/id/eprint/14849/1/French_Mechler_2017_El%20Ni%C3%B1o_Risk_Peru_Report.pdf 27 (accessed 21/09/2019). 28
Frenz, P., I. Delgado, J. S. Kaufman and S. Harper, 2014: Achieving effective universal health coverage with equity: 29 evidence from Chile. Health Policy and Planning, 29(6), 717-731, doi:10.1093/heapol/czt054. 30
FSIN and Global Network Against Food Crisis, 2021: Global Report on Food Crises 2021. Rome, Italy. Available at: 31 https://www.wfp.org/publications/global-report-food-crises-2021 (accessed 29/06/2021). 32
Fu, R. et al., 2013: Increased dry-season length over southern Amazonia in recent decades and its implication for future 33 climate projection. Proceedings of the National Academy of Sciences, 110(45), 18110-18115, 34 doi:10.1073/pnas.1302584110. 35
Fuentes-Castillo, T., H. J. Hernández and P. Pliscoff, 2020: Hotspots and ecoregion vulnerability driven by climate 36 change velocity in Southern South America. Regional Environmental Change, 20(1), 27, doi:10.1007/s10113-37 020-01595-9. 38
Fuentes-Franco, R. et al., 2015: Inter-annual variability of precipitation over Southern Mexico and Central America and 39 its relationship to sea surface temperature from a set of future projections from CMIP5 GCMs and RegCM4 40 CORDEX simulations. Climate Dynamics, 45(1-2), 425-440, doi:10.1007/s00382-014-2258-6. 41
Fuentes, I., R. Fuster, D. Avilés and W. Vervoort, 2021: Water scarcity in central Chile: the effect of climate and land 42 cover changes on hydrologic resources. Hydrological Sciences Journal, 66(6), 1028-1044, 43 doi:10.1080/02626667.2021.1903475. 44
Funatsu, B. M. et al., 2019: Perceptions of climate and climate change by Amazonian communities. Global 45 Environmental Change, 57, 101923, doi:10.1016/j.gloenvcha.2019.05.007. 46
Gabriel, C. and L. Macdonald, 2018: After the International Organization for Migration: recruitment of Guatemalan 47 temporary agricultural workers to Canada. Journal of Ethnic and Migration Studies, 44(10), 1706-1724, 48 doi:10.1080/1369183X.2017.1354062. 49
Gagné, T. O. et al., 2020: Towards a global understanding of the drivers of marine and terrestrial biodiversity. PLOS 50 ONE, 15(2), e0228065, doi:10.1371/journal.pone.0228065. 51
Gaitán, J. J. et al., 2014: Vegetation structure is as important as climate for explaining ecosystem function across 52 patagonian rangelands. Journal of Ecology, 102(6), 1419-1428, doi:10.1111/1365-2745.12273. 53
Galarza, E. and J. Kámiche, 2015: Pesca Artesanal: Oportunidades para del desarrollo regional. Universidad del 54 Pacífico, Lima, Peru, 120 pp. ISBN 978-9972-57-342-2. 55
Gallardo-Fernández, G. L. and F. Saunders, 2018: “Before we asked for permission, now we only give notice”: 56 Women’s entrance into artisanal fisheries in Chile. Maritime Studies, 17(2), 177-188, doi:10.1007/s40152-018-57 0110-z. 58
Gamez, L., 2016: Lost in the definition: Environmental displacement in Salgar, Colombia. In: The State of 59 Environmental Migration 2016: A review of 2015 [Gemenne, F., C. Zickgraf and D. Ionesco (eds.)]. Presses 60 Universitaires de Liège, Lieja, pp. 106-122. 61
García-Reyes, M. et al., 2015: Under Pressure: Climate Change, Upwelling, and Eastern Boundary Upwelling 62 Ecosystems. Frontiers in Marine Science, 2, 109. 63
ACCEPTED VERSIO
N
SUBJECT TO FIN
AL EDITS
FINAL DRAFT Chapter 12 IPCC WGII Sixth Assessment Report
Do Not Cite, Quote or Distribute 12-135 Total pages: 181
Garcia-Solorzano, F. O. et al., 2019: El Niño Southern Oscillation and tuberculosis: Is there an association? Journal of 1 Infection and Public Health, 12(2), 292-293, doi:10.1016/j.jiph.2018.11.007. 2
Garcia Ferrari, S., H. Smith, F. Coupe and H. Rivera, 2018: City profile: Medellin. Cities, 74, 354-364, 3 doi:10.1016/j.cities.2017.12.011. 4
Garcia, L. C. et al., 2021: Record-breaking wildfires in the world's largest continuous tropical wetland: Integrative fire 5 management is urgently needed for both biodiversity and humans. Journal of Environmental Management, 293, 6 112870, doi:10.1016/j.jenvman.2021.112870. 7
Garçon, V. et al., 2019: Multidisciplinary Observing in the World Ocean’s Oxygen Minimum Zone Regions: From 8 Climate to Fish — The VOICE Initiative. Frontiers in Marine Science, 6, 722. 9
Gardner, A. S. et al., 2013: A Reconciled Estimate of Glacier Contributions to Sea Level Rise: 2003 to 2009. Science, 10 340(6134), 852-857, doi:10.1126/science.1234532. 11
Gardner, R. C. and C. Finlayson, 2018: Global Wetland Outlook: State of the World’s Wetlands and Their Services to 12 People. Ramsar Convention Secretariat, 89 pp. Available at: https://ssrn.com/abstract=3261606 (accessed 13 24/10/2020). 14
Garrido, R. et al., 2019: Potential impact of climate change on the geographical distribution of two wild vectors of 15 Chagas disease in Chile: Mepraia spinolai and Mepraia gajardoi. Parasites & Vectors, 12(1), 478, 16 doi:10.1186/s13071-019-3744-9. 17
Gasalla, M. A., P. R. Abdallah and D. Lemos, 2017: Potential Impacts of Climate Change in Brazilian Marine Fisheries 18 and Aquaculture. In: Climate Change Impacts on Fisheries and Aquaculture [Phillips, B. F. and M. Pérez‐19 Ramírez (eds.)]. Wiley, pp. 454-477. ISBN 9781119154044. 20
Gateau-Rey, L. et al., 2018: Climate change could threaten cocoa production: Effects of 2015-16 El Niño-related 21 drought on cocoa agroforests in Bahia, Brazil. PLoS ONE, 13(7), e0200454, doi:10.1371/journal.pone.0200454. 22
Gatti, L. V. et al., 2021: Amazonia as a carbon source linked to deforestation and climate change. Nature, 595(7867), 23 388-393, doi:10.1038/s41586-021-03629-6. 24
Gebara, M. F. and A. Agrawal, 2017: Beyond rewards and punishments in the Brazilian Amazon: Practical implications 25 of the REDD+ discourse. Forests, 8(3), 1-27, doi:10.3390/f8030066. 26
Geirinhas, J. L. et al., 2018: Climatic and synoptic characterization of heat waves in Brazil. International Journal of 27 Climatology, 38(4), 1760-1776, doi:10.1002/joc.5294. 28
Gelcich, S. et al., 2015: Alternative strategies for scaling up marine coastal biodiversity conservation in Chile. Maritime 29 Studies, 14(1), 5, doi:10.1186/s40152-015-0022-0. 30
Gemenne, F. et al., 2020: Transformative climate action in cities. Forced Migration Review,(63), 32-35. 31 Giorgi, F. et al., 2014: Changes in extremes and hydroclimatic regimes in the CREMA ensemble projections. Climatic 32
Change, 125(1), 39-51, doi:10.1007/s10584-014-1117-0. 33 Glade, F. E., M. D. Miranda, F. J. Meza and W. J. D. van Leeuwen, 2016: Productivity and phenological responses of 34
natural vegetation to present and future inter-annual climate variability across semi-arid river basins in Chile. 35 Environmental Monitoring and Assessment, 188(12), 676, doi:10.1007/s10661-016-5675-7. 36
Gleick, P. H., 2002: Water management: Soft water paths. Nature, 418(6896), 373, doi:10.1038/418373a. 37 Global Data Lab, 2020: Human Development Indices, Global Data Lab. Available at: 38
https://globaldatalab.org/shdi/shdi/ (accessed 20/05/2021). 39 Global Health Security Index, 2019: Global Health Security Index: Building Collective Action and Accountability. 324 40
pp. Available at: https://www.ghsindex.org/wp-content/uploads/2020/04/2019-Global-Health-Security-Index.pdf 41 (accessed 29/06/2021). 42
Gloor, M. et al., 2015: Recent Amazon climate as background for possible ongoing and future changes of Amazon 43 humid forests. Global Biogeochemical Cycles, 29(9), 1384-1399, doi:10.1002/2014GB005080. 44
Glynn, P. W. et al., 2017: El Niño-Southern Oscillation: Effects on Eastern Pacific Coral Reefs and Associated Biota. 45 In: Coral Reefs of the Eastern Tropical Pacific: Persistence and Loss in a Dynamic Environment [Glynn, P. W., 46 D. P. Manzello and I. C. Enochs (eds.)]. Springer Netherlands, Dordrecht, pp. 251-290. ISBN 978-94-017-7499-4. 47
Gobernación de Escuintla, Acción Contra el Hambre and Instituto Privado de Cambio Climático, 2017: Sistematización 48 de la experiencia de las mesas técnicas de los ríos Madre Vieja y Achiguate en el Departamento de Escuintla. 49 Instituto Privado de Cambio Climático ICC, Guatemala, 47 pp. 50
Gobierno de la Ciudad de Buenos Aires, 2011: El Plan de Movilidad Sustentable de la Ciudad de Buenos Aires, 51 Secretaría de Transporte, Buenos Aires, Argentina, 37 pp. Available at: 52 https://pt.slideshare.net/dianamondino/transporte-buenos-aires-2020-plan-de-movilidad-20-g-krantzer (accessed 53 17/10/2020). 54
Gobierno de la Ciudad de Buenos Aires, 2015: Plan de Acción frente al Cambio Climático 2020, Buenos Aires, 55 Argentina. Available at: http://cdn2.buenosaires.gob.ar/espaciopublico/apra/pacc_2020.pdf (accessed 01/09/2021). 56
Gobierno de la Ciudad de Buenos Aires, 2020: Plan de Acción frente al Cambio Climático 2020, Buenos Aires, 57 Argentina. Available at: http://cdn2.buenosaires.gob.ar/espaciopublico/apra/pacc_2020.pdf (accessed 01/11/2020). 58
Gobierno Nacional de la República del Ecuador, 2015: Plan Nacional de Cambio Climático, Ecuador, 55 pp. Available 59 at: 60 https://info.undp.org/docs/pdc/Documents/ECU/PLAN%20NACIONAL%20DE%20CAMBIO%20CLIM%C3%861 1TICO.pdf (accessed 16/06/2021). 62
ACCEPTED VERSIO
N
SUBJECT TO FIN
AL EDITS
FINAL DRAFT Chapter 12 IPCC WGII Sixth Assessment Report
Do Not Cite, Quote or Distribute 12-136 Total pages: 181
Godber, O. F. and R. Wall, 2014: Livestock and food security: Vulnerability to population growth and climate change. 1 Global Change Biology, 20(10), 3092-3102, doi:10.1111/gcb.12589. 2
Godfrey, P. C., 2012: Introduction: Race, Gender & Class and Climate Change. Race, Gender & Class, 19(1/2), 3-11. 3 Godoy, M. D. P. and L. D. d. Lacerda, 2015: Mangroves Response to Climate Change: A Review of Recent Findings 4
on Mangrove Extension and Distribution. Anais da Academia Brasileira de Ciências, 87, 651-667, 5 doi:10.1590/0001-3765201520150055. 6
Goes, G. V. et al., 2020: MRV framework and prospective scenarios to monitor and ratchet up Brazilian transport 7 mitigation targets. Climatic Change, 162(4), 2197-2217, doi:10.1007/s10584-020-02767-6. 8
Gómez-González, S., F. Ojeda and P. M. Fernandes, 2018: Portugal and Chile: Longing for sustainable forestry while 9 rising from the ashes. Environmental Science & Policy, 81, 104-107, doi:10.1016/j.envsci.2017.11.006. 10
Gomez, L. et al., 2021: Use of isotopes techniques to reveal the origin of water salinity in an arid region of Central-11 Western Argentina. Science of The Total Environment, 763, 142935, doi:10.1016/j.scitotenv.2020.142935. 12
Gómez Salazar, A. and N. Cuvi, 2016: Asentamientos informales y medio ambiente en Quito. Areas. Revista 13 Internacional de Ciencias Sociales,(35), 101-119. 14
González-Rojas, C. H. et al., 2021: Short-term air pollution events in the Atacama desert, Chile. Journal of South 15 American Earth Sciences, 105, 103010, doi:10.1016/j.jsames.2020.103010. 16
González, J. E., B. Yannicelli and W. Stotz, 2021: The interplay of natural variability, productivity and management of 17 the benthic ecosystem in the Humboldt Current System: Twenty years of assessment of Concholepas concholepas 18 fishery under a TURF management system. Ocean & Coastal Management, 208, 105628, 19 doi:10.1016/j.ocecoaman.2021.105628. 20
González, M. E., A. Lara, R. Urrutia and J. Bosnich, 2011: Cambio climático y su impacto potencial en la ocurrencia de 21 incendios forestales en la zona centro-sur de Chile (33º - 42º S). Bosque (Valdivia), 32(3), 215-219, 22 doi:10.4067/s0717-92002011000300002. 23
González, P., A. Dominguez and A. M. Moraga, 2019: The effect of outdoor PM2.5 on labor absenteeism due to 24 chronic obstructive pulmonary disease. International Journal of Environmental Science and Technology, 16(8), 25 4775-4782, doi:10.1007/s13762-018-2111-2. 26
González, S. A. and G. Holtmann-Ahumada, 2017: Quality of tourist beaches of northern Chile: A first approach for 27 ecosystem-based management. Ocean & Coastal Management, 137, 154-164, 28 doi:10.1016/j.ocecoaman.2016.12.022. 29
Gopal, S. et al., 2015: Modeling Coastal and Marine Environmental Risks in Belize: the Marine Integrated Decision 30 Analysis System (MIDAS). Coastal Management, 43(3), 217-237, doi:10.1080/08920753.2015.1030292. 31
Gori Maia, A. et al., 2021: The economic impacts of the diffusion of agroforestry in Brazil. Land Use Policy, 108, 32 105489, doi:10.1016/j.landusepol.2021.105489. 33
Gorman, D., 2018: Historical Losses of Mangrove Systems in South America from Human-Induced and Natural 34 Impacts. In: Threats to Mangrove Forests: Hazards, Vulnerability, and Management [Makowski, C. and C. W. 35 Finkl (eds.)]. Springer International Publishing, Cham, pp. 155-171. ISBN 978-3-319-73016-5. 36
Government of Brazil, 2007: National Adaptation Plan to Climate Change, 46 pp. Available at: 37 https://www.mma.gov.br/clima/politica-nacional-sobre-mudanca-do-clima/plano-nacional-sobre-mudanca-do-38 clima (accessed 16/06/2021). 39
Government of Brazil, 2012: Plano Setorial de Mitigação e de Adaptação às Mudanças Climáticas para a 40 Consolidação de uma Economia de Baixa Emissão de Carbono na Agricultura. Ministério da Agricultura, 41 Pecuária e Abastecimento, 173 pp. Available at: https://www.gov.br/agricultura/pt-42 br/assuntos/sustentabilidade/plano-abc/arquivo-publicacoes-plano-abc/download.pdf (accessed 03/09/2021). 43
Government of Brazil, 2016: Plano Nacional de Adaptação à Mudança do Clima. Volume 2: estratégias setoriais e 44 temáticas Portaria MMA no150 de 10 de maio de 2016, 2, Ambiente, M. d. M., Republica Federativa do Brasil, 45 Brasilia, Brazil. Available at: http://adaptaclima.mma.gov.br/conteudos/18 (accessed 01/09/2021). 46
Government of Brazil, 2020: Fourth National Communication of Brazil, UNFCCC, 537 pp. Available at: 47 https://unfccc.int/documents/267657 (accessed 29/06/2021). 48
Government of Brazil and Ministry of Science Technology and Innovation Secretariat of Policies and Programs, 2021: 49 AdaptaBrasil MCTI. Available at: https://adaptabrasil.mcti.gov.br/. 50
Government of Chile, 2014: Plan de Adaptacion al Cambio Climatico. 80 pp. Available at: https://mma.gob.cl/wp-51 content/uploads/2016/02/Plan-Nacional-Adaptacion-Cambio-Climatico-version-final.pdf (accessed 16/06/2021). 52
Government of Colombia, 2016: Plan Nacional De Adaptación Al Cambio Climático, 100 pp. Available at: 53 https://www.minambiente.gov.co/index.php/component/content/article/476-plantilla-cambio-climatico-%2032 54 (accessed 16/06/2021). 55
Government of Costa Rica, 2018: Política Nacional de Adaptación al Cambio Climático de Costa Rica 2018-2030, 84 56 pp. Available at: http://www.pgrweb.go.cr/DocsDescargar/Normas/No%20DE-57 41091/Version1/Politica_ADAPTACION_24_abril.pdf (accessed 17/10/2020). 58
Government of Ecuador, 2015: Plan Nacional del Cambio Climático 2015-2018, 55 pp. Available at: 59 https://info.undp.org/docs/pdc/Documents/ECU/PLAN%20NACIONAL%20DE%20CAMBIO%20CLIM%C3%860 1TICO.pdf (accessed 16/06/2021). 61
Government of El Salvador, 2019: Plan Nacional de Adaptación al Cambio Climático: Construyendo resiliencia 62 climática en El Salvador, Naturales, M. d. M. A. y. R., 58 pp. Available at: 63
ACCEPTED VERSIO
N
SUBJECT TO FIN
AL EDITS
FINAL DRAFT Chapter 12 IPCC WGII Sixth Assessment Report
Do Not Cite, Quote or Distribute 12-137 Total pages: 181
http://rcc.marn.gob.sv/bitstream/handle/123456789/371/PlanNacionalAdaptacionCC.pdf?sequence=1&isAllowed1 =y (accessed 17/10/2020). 2
Government of Guatemala, 2016: Plan de Accion Nacional de Cambio Climatico. Available at: 3 http://www.segeplan.gob.gt/nportal/index.php/biblioteca-documental/file/480-plan-de-accion-de-cambio-4 climatico (accessed 16/06/2021). 5
Government of Honduras, 2018: Plan Nacional de Adaptación al Cambio Climatico Honduras, Ambiente, S. d. R. N. 6 y., Gobierno de la República de Honduras, 64 pp. Available at: 7 http://www.miambiente.gob.hn/media/adjuntos/pdf/DNCC/2018-05-8 10/16%3A35%3A53.282976%2B00%3A00/PNA.pdf (accessed 01/09/2021). 9
Government of Paraguay, 2017: Plan Nacional de Adaptación al Cambio Climatico, Government de Paraguay, 10 Asunción, Paraguay, 160 pp. Available at: 11 https://www4.unfccc.int/sites/NAPC/Documents/Parties/Plan%20Nacional%20de%20Adaptaci%C3%B3n%20al12 %20Cambio%20Clim%C3%A1tico_Paraguay_final.pdf (accessed 16/06/2021). 13
Government of Peru, 2005: Plan Maestro de Transporte Urbano para el Área Metropolitana de Lima y Callao en la 14 República del Perú (Fase 1): Informe Final (Volumen - I), I, Ministerio de Transportes y Comunicaciones de la 15 Republica del Perú, Lima, Perú, 86 pp. Available at: https://openjicareport.jica.go.jp/pdf/11798261_01.pdf 16 (accessed 17/10/2020). 17
Government of Peru, 2010: Plan de Acción de Adaptación y Mitigación Frente al Cambio climático. Government of 18 Peru, Lima, 152 pp. 19
Government of Peru, 2016: Legislative Decree 1280, art. 27 and article 141 of the Decree´s Code, Peru. Available at: 20 https://www.minam.gob.pe/wp-content/uploads/2017/04/Decreto-Legislativo-N%C2%B0-1280.pdf (accessed 21 01/09/2021). 22
Government of Suriname, 2019: Suriname National Adaptation Plan (NAP), 2019- 2029, Suriname, 176 pp. Available 23 at: https://www4.unfccc.int/sites/NAPC/Documents/Parties/Suriname%20Final%20NAP_apr%202020.pdf 24 (accessed 23/10/2020). 25
Graesser, J., T. M. Aide, H. R. Grau and N. Ramankutty, 2015: Cropland/pastureland dynamics and the slowdown of 26 deforestation in Latin America. Environmental Research Letters, 10(3), 034017, doi:10.1088/1748-27 9326/10/3/034017. 28
Graham, K., 2017: International Intent and Domestic Application of the Convention on International Trade in 29 Endangered Species of Wild Fauna and Flora (CITES): The Case of the Ocelot (Leopardus pardalis). Journal of 30 International Wildlife Law & Policy, 20(3-4), 253-294, doi:10.1080/13880292.2017.1403797. 31
Gray, C. and R. Bilsborrow, 2013: Environmental Influences on Human Migration in Rural Ecuador. Demography, 32 50(4), 1217-1241, doi:10.1007/s13524-012-0192-y. 33
Green, J. M. H. et al., 2019: Linking global drivers of agricultural trade to on-the-ground impacts on biodiversity. 34 Proceedings of the National Academy of Sciences, 116(46), 23202, doi:10.1073/pnas.1905618116. 35
Greenwalt, J., N. Raasakka and K. Alverson, 2018: Chapter 12 - Building Urban Resilience to Address Urbanization 36 and Climate Change. In: Resilience [Zommers, Z. and K. Alverson (eds.)]. Elsevier, pp. 151-164. ISBN 978-0-12-37 811891-7. 38
Grieger, J. et al., 2014: Southern Hemisphere winter cyclone activity under recent and future climate conditions in 39 multi-model AOGCM simulations. International Journal of Climatology, 34(12), 3400-3416, 40 doi:10.1002/joc.3917. 41
Grill, G. et al., 2015: An index-based framework for assessing patterns and trends in river fragmentation and flow 42 regulation by global dams at multiple scales. Environmental Research Letters, 10(1), 015001, doi:10.1088/1748-43 9326/10/1/015001. 44
Grima, N., S. J. Singh, B. Smetschka and L. Ringhofer, 2016: Payment for Ecosystem Services (PES) in Latin America: 45 Analysing the performance of 40 case studies. Ecosystem Services, 17, 24-32, doi:10.1016/j.ecoser.2015.11.010. 46
Gross, J. E., S. Woodley, L. A. Welling and J. E. M. Watson, 2016: Adapting to Climate Change: Guidance for 47 protected area managers and planners. IUCN, Gland, Switzerland, 129 pp. 48
Grover-Kopec, E. K. et al., 2006: Web-based climate information resources for malaria control in Africa. Malaria 49 Journal, 5(1), 38, doi:10.1186/1475-2875-5-38. 50
Guerra, A., 2014: Participación del sector privado en manejo del cambio climático: el Instituto Privado de Investigación 51 sobre Cambio Climático. In: El cambio climático: enfoques latinoamericanos e internacionales ante sus 52 amenazas. [Leal (ed.)]. Instituto de Desarrollo Sostenible, Universidad Galileo, Guatemala. 53
Guerra, A., 2016: La crisis como oportunidad: analisis de la sequía en la costa sur de Guatemala en 2016. Revista de la 54 Red Nacional de Formación e Invstigación Ambiental,(17), 21-27. 55
Guerra, A. et al., 2017: Gestión de riesgo de inundaciones en el río Coyolate: ejemplo de adaptación al cambio 56 climático en Guatemala. Revista Mesoamericana de Biodiversidad y Cambio Climático, 2(3), 27-37. 57
Guerrero-Gatica, M. et al., 2020: Traditional and Local Knowledge in Chile: Review of Experiences and Insights for 58 Management and Sustainability. Sustainability, 12(5), 1767, doi:10.3390/su12051767. 59
Gullestad, P. et al., 2017: Towards ecosystem-based fisheries management in Norway – Practical tools for keeping track 60 of relevant issues and prioritising management efforts. Marine Policy, 77(November 2016), 104-110, 61 doi:10.1016/j.marpol.2016.11.032. 62
ACCEPTED VERSIO
N
SUBJECT TO FIN
AL EDITS
FINAL DRAFT Chapter 12 IPCC WGII Sixth Assessment Report
Do Not Cite, Quote or Distribute 12-138 Total pages: 181
Guo, M., 2016: Pyrogenic Carbon in Terra Preta Soils. Agricultural and Environmental Applications of Biochar: 1 Advances and Barriers, 15-27, doi:10.2136/sssaspecpub63.2014.0035.5. 2
Guo, Y. et al., 2018: Quantifying excess deaths related to heatwaves under climate change scenarios: A multicountry 3 time series modelling study. PLOS Medicine, 15(7), e1002629-e1002629, doi:10.1371/journal.pmed.1002629. 4
Gurgiser, W. et al., 2016: Comparing peasants' perceptions of precipitation change with precipitation records in the 5 tropical Callejón de Huaylas, Peru. Earth Syst. Dynam., 7(2), 499-515, doi:10.5194/esd-7-499-2016. 6
Gutiérrez, A. G., J. J. Armesto, M. F. Díaz and A. Huth, 2014: Increased Drought Impacts on Temperate Rainforests 7 from Southern South America: Results of a Process-Based, Dynamic Forest Model. PLOS ONE, 9(7), e103226, 8 doi:10.1371/journal.pone.0103226. 9
Gutiérrez, D., M. Akester and L. Naranjo, 2016a: Productivity and sustainable management of the Humboldt current 10 large marine ecosystem under climate change. Environmental Development, 17, 126-144, 11 doi:10.1016/j.envdev.2015.11.004. 12
Gutierrez, H. et al., 2020: Perceptions of Local Vulnerability and the Relative Importance of Climate Change in Rural 13 Ecuador. Human Ecology, 48(4), 383-395, doi:10.1007/s10745-020-00165-1. 14
Gutiérrez, J. M. et al., 2021: Atlas. In: Climate Change 2021: The Physical Science Basis. Contribution of Working 15 Group I to the Sixth Assessment Report of the Intergovernmental Panel on Climate Change [Masson-Delmotte, 16 V., P. Zhai, A. Pirani, S. L. Connors, C. Péan, S. Berger, N. Caud, Y. Chen, L. Goldfarb, M. I. Gomis, M. Huang, 17 K. Leitzell, E. Lonnoy, J. B. R. Matthews, T. K. Maycock, T. Waterfield, O. Yelekçi, R. Yu and B. Zhou (eds.)]. 18 Cambridge University Press. 19
Gutiérrez, O. et al., 2016b: Climate teleconnections and indicators of coastal systems response. Ocean & Coastal 20 Management, 122, 64-76, doi:10.1016/j.ocecoaman.2016.01.009. 21
Guzmán, S., M. Castillo and A. Moncada, 2016: Afinancing efforts against climate change in Latin America. Política, 22 Globalidad y Ciudadanía, 3(5), 65, doi:10.29105/pgc3.5-5. 23
Guzmán, S., T. Guillén and J. Manda, 2018: A review of domestic data sources for climate finance flows in recipient 24 countries. UNDP. 25
Guzman Torres, C. M. and J. A. Barrera Arciniegas, 2014: Metodologia para la microzonificación de riesgos frente a 26 amenazas naturales: caso de estudio deslizamiento e inundaciones municipio de Mocoa Departamento de 27 Putumayo. Universidad Católica de Colombia, Bogotá, 118 pp. pp. 28
Haddad, E. A. et al., 2019: A Bad Year? Climate Variability and the Wine Industry in Chile. Working Papers 29 Department of Economics 37. Available at: https://ideas.repec.org/p/spa/wpaper/2019wpecon37.html (accessed 30 28/08/2021). 31
Haeberli, W., Y. Schaub and C. Huggel, 2017: Increasing risks related to landslides from degrading permafrost into 32 new lakes in de-glaciating mountain ranges. Geomorphology, 293(Part B), 405-417, 33 doi:10.1016/j.geomorph.2016.02.009. 34
Hallegatte, S. et al., 2018: Shock Waves: Managing the Impacts of Climate Change on Poverty. Climate Change and 35 Development., World Bank Washington, DC. Available at: 36 https://openknowledge.worldbank.org/handle/10986/22787 (accessed 31/10/2020). 37
Handisyde, N., T. C. Telfer and L. G. Ross, 2017: Vulnerability of aquaculture-related livelihoods to changing climate 38 at the global scale. Fish and Fisheries, 18(3), 466-488, doi:10.1111/faf.12186. 39
Hannah, L. et al., 2017: Regional modeling of climate change impacts on smallholder agriculture and ecosystems in 40 Central America. Climatic Change, 141(1), 29-45, doi:10.1007/s10584-016-1867-y. 41
Hansen, M. C. et al., 2013: High-Resolution Global Maps of 21st-Century Forest Cover Change. Science, 342(6160), 42 850-853, doi:10.1126/science.1244693. 43
Haque, U. et al., 2019: The human cost of global warming: Deadly landslides and their triggers (1995–2014). Science of 44 The Total Environment, 682, 673-684, doi:10.1016/j.scitotenv.2019.03.415. 45
Hardoy, J., E. Gencer and M. Winograd, 2019: Participatory planning for climate resilient and inclusive urban 46 development in Dosquebradas, Santa Ana and Santa Tomé. Environment and Urbanization, 31(1), 33-52, 47 doi:10.1177/0956247819825539. 48
Hardoy, J., I. Hernández, J. A. Pacheco and G. Sierra, 2014: Institutionalizing climate change adaptation at municipal 49 and state level in Chetumal and Quintana Roo, Mexico. Environment and Urbanization, 26(1), 69-85, 50 doi:10.1177/0956247813519053. 51
Hardoy, J. and L. S. Velásquez, 2016: Chapter 8 in Cities on a Finite Planet. doi:10.4324/9781315645421. 52 Hardoy, J. H. V. and D. Mastrangelo, 2016: Chapter 11, in Cities on a Finite Planet: Towards transformative responses 53
to climate change, Bartlett Sheridan and David Satterthwaite (eds). doi:10.4324/9781315645421. 54 Harper, S., C. Grubb, M. Stiles and U. R. Sumaila, 2017: Contributions by Women to Fisheries Economies: Insights 55
from Five Maritime Countries. Coastal Management, 45(2), 91-106, doi:10.1080/08920753.2017.1278143. 56 Harsch, M. A., P. E. Hulme, M. S. McGlone and R. P. Duncan, 2009: Are treelines advancing? A global meta-analysis 57
of treeline response to climate warming. Ecology Letters, 12(10), 1040-1049, doi:10.1111/j.1461-58 0248.2009.01355.x. 59
Hartman, B. D., B. Bookhagen and O. A. Chadwick, 2016: The effects of check dams and other erosion control 60 structures on the restoration of Andean bofedal ecosystems. Restoration Ecology, 24(6), 761–772, 61 doi:10.1111/rec.12402. 62
ACCEPTED VERSIO
N
SUBJECT TO FIN
AL EDITS
FINAL DRAFT Chapter 12 IPCC WGII Sixth Assessment Report
Do Not Cite, Quote or Distribute 12-139 Total pages: 181
Harvey, C. A. et al., 2017: The use of Ecosystem-based Adaptation practices by smallholder farmers in Central 1 America. Agriculture, Ecosystems & Environment, 246, 279-290, doi:10.1016/j.agee.2017.04.018. 2
Harvey, C. A. et al., 2018: Climate change impacts and adaptation among smallholder farmers in Central America. 3 Agriculture & Food Security, 7(1), 57, doi:10.1186/s40066-018-0209-x. 4
Hecht, S. B., 2003: Indigenous Soil Management and the Creation of Amazonian Dark Earths: Implications of Kayapó 5 Practice. In: Amazonian Dark Earths. Springer, Dordrecht, pp. 355-372. 6
Hecht, S. B., 2017: Domestication, domesticated landscapes, and tropical natures. In: The Routledge Companion to the 7 Environmental Humanities, 1st edition ed. [Heise, U. K. C. J. and M. Niemann (eds.)]. Taylor & Francis, pp. 37-8 50. 9
Heerspink, B. P., A. D. Kendall, M. T. Coe and D. W. Hyndman, 2020: Trends in streamflow, evapotranspiration, and 10 groundwater storage across the Amazon Basin linked to changing precipitation and land cover. Journal of 11 Hydrology: Regional Studies, 32, 100755, doi:10.1016/j.ejrh.2020.100755. 12
Heidinger, H. et al., 2018: A new assessment in total and extreme rainfall trends over central and southern Peruvian 13 Andes during 1965–2010. International Journal of Climatology, 38(S1), e998-e1015, doi:10.1002/joc.5427. 14
Heikkinen, A., 2017: Climate Change in the Peruvian Andes: A Case Study on Small-Scale Farmers’ Vulnerability in 15 the Quillcay River Basin. Iberoamericana – Nordic Journal of Latin American and Caribbean Studies, 46(1), 77-16 88, doi:10.16993/iberoamericana.211. 17
Heikkinen, A. M., 2021: Climate change, power, and vulnerabilities in the Peruvian Highlands. Regional 18 Environmental Change, 21(3), 82, doi:10.1007/s10113-021-01825-8. 19
Hellebrandt, D., E. H. Allison and A. Delaporte, 2014: Food Security and Artisanal Fisheries: Critical Analysis of 20 Initiatives in Latin America. Desenvolvimento e Meio Ambiente, 32, 7-27, doi:10.5380/dma.v32i0.35548. 21
Henríquez, G. and C. Urrea, 2017: Material particulado y gases contaminantes en la comuna de El Bosque ¿cuánto 22 influyen en la cantidad de consultas por enfermedades respiratorias? Revista médica de Chile, 145(11), 1371-23 1377, doi:10.4067/s0034-98872017001101371 24
Hepburn, C. et al., 2020: Will COVID-19 fiscal recovery packages accelerate or retard progress on climate change? 25 Oxford Review of Economic Policy, 36(Supplement_1), S359-S381, doi:10.1093/oxrep/graa015. 26
Hernández-Moreno, Á. and S. Reyes-Paecke, 2018: The effects of urban expansion on green infrastructure along an 27 extended latitudinal gradient (23°S–45°S) in Chile over the last thirty years. Land Use Policy, 79, 725-733, 28 doi:10.1016/j.landusepol.2018.09.008. 29
Hernandez, W., A. Mendez, A. M. Diaz-Marquez and R. Zalakevic, 2019: Robust Analysis of PM2. 5 Concentration 30 Measurements in the Ecuadorian Park La Carolina. Sensors, 19(21), 4648, doi:10.3390/s19214648. 31
Herrador-Valencia, D. and M. Paredes, 2016: Cambio climático y agricultura de pequeña escala en los Andes 32 ecuatorianos: un estudio sobre percepciones locales y estrategias de adaptación. Journal of Latin American 33 Geography, 15(2), 101-121, doi:10.1353/lag.2016.0021. 34
Herrera-R, G. A. et al., 2020: The combined effects of climate change and river fragmentation on the distribution of 35 Andean Amazon fishes. Global Change Biology, 26(10), 5509-5523, doi:10.1111/gcb.15285. 36
Herrera, D. et al., 2017: Upstream watershed condition predicts rural children’s health across 35 developing countries. 37 Nature Communications, 8(1), 811, doi:10.1038/s41467-017-00775-2. 38
Herrera, D. A. et al., 2018a: Exacerbation of the 2013–2016 Pan-Caribbean Drought by Anthropogenic Warming. 39 Geophysical Research Letters, 45(19), 10,619-610,626, doi:10.1029/2018GL079408. 40
Herrera, N. et al., 2018b: Sistema de Alerta Temprana por Olas de Calor y Salud (SAT-OCS). Nota Técnica SMN 2018-41 50, Servicio Meteorológico Nacional, Buenos Aires, Argentina, 16 pp. Available at: 42 http://repositorio.smn.gob.ar/handle/20.500.12160/772 (accessed 10/08/2021). 43
Herrera, R. et al., 2016: Proximity to mining industry and respiratory diseases in children in a community in Northern 44 Chile: A cross-sectional study. Environmental Health, 15(1), 66, doi:10.1186/s12940-016-0149-5. 45
Herzog, C. and C. A. Rozado, 2019: The EU – Brazil Sector Dialogue on nature-based solutions: Contribution to a 46 Brazilian roadmap on nature-based solutions for resilient cities. European Commission, Brussels, 136 pp. pp. 47
Heslin, A., N. D. Deckard, R. Oakes and A. Montero-Colbert, 2019: Displacement and Resettlement: Understanding the 48 Role of Climate Change in Contemporary Migration. In: Loss and Damage from Climate Change: Concepts, 49 Methods and Policy Options [Mechler, R., L. M. Bouwer, T. Schinko, S. Surminski and J. Linnerooth-Bayer 50 (eds.)]. Springer International Publishing, Cham, pp. 237-258. ISBN 978-3-319-72026-5. 51
Hickmann, T., O. Widerberg, M. Lederer and P. Pattberg, 2019: The United Nations Framework Convention on 52 Climate Change Secretariat as an orchestrator in global climate policymaking. International Review of 53 Administrative Sciences, 87(1), 21-38, doi:10.1177/0020852319840425. 54
Hicks, K. and N. Fabricant, 2016: The Bolivian Climate Justice Movement: Mobilizing Indigeneity in Climate Change 55 Negotiations. Latin American Perspectives, 43(4), 87-104, doi:10.1177/0094582x16630308. 56
Hidalgo, C., 2020: Procesos colaborativos en acción: la provisión de servicios climáticos y la elaboración de 57 pronósticos por impacto en el sur de Sudamérica. Medio Ambiente y Urbanización, 92(1), 63-92. 58
Hidalgo, H. G., E. J. Alfaro and B. Quesada-Montano, 2017: Observed (1970–1999) climate variability in Central 59 America using a high-resolution meteorological dataset with implication to climate change studies. Climatic 60 Change, 141(1), 13-28, doi:10.1007/s10584-016-1786-y. 61
Hirabayashi, Y. et al., 2013: Global flood risk under climate change. Nature Climate Change, 3, 816-821, 62 doi:10.1038/nclimate1911. 63
ACCEPTED VERSIO
N
SUBJECT TO FIN
AL EDITS
FINAL DRAFT Chapter 12 IPCC WGII Sixth Assessment Report
Do Not Cite, Quote or Distribute 12-140 Total pages: 181
Hock, R. et al., 2019: High Mountain Areas. In: An IPCC Special Report on the Ocean and Cryosphere in a Changing 1 Climate [Pörtner, H.-O., D. Roberts, M. Masson-Delmotte, P. Zhai, M. Tignor, E. Poloczanska, K. Mintenbeck, 2 M. Nicolai, A. Okem, J. Petzold, B. Rama and N. Weyer (eds.)]. In press. 3
Hodgkinson, J. H. and M. H. Smith, 2018: Climate change and sustainability as drivers for the next mining and metals 4 boom: The need for climate-smart mining and recycling. Resources Policy, doi:10.1016/j.resourpol.2018.05.016. 5
Hoegh-Guldberg, O. et al., 2018: Impacts of 1.5ºC of Global Warming on Natural and Human Systems. In: Global 6 Warming of 1.5°C. An IPCC Special Report on the impacts of global warming of 1.5°C above pre-industrial levels 7 and related global greenhouse gas emission pathways, in the context of strengthening the global response to the 8 threat of climate change, sustainable development, and efforts to eradicate poverty [Masson-Delmotte, V., P. 9 Zhai, H. O. Pörtner, D. Roberts, J. Skea, P. R. Shukla, A. Pirani, W. Moufouma-Okia, C. Péan, R. Pidcock, S. 10 Connors, J. B. R. Matthews, Y. Chen, X. Zhou, M. I. Gomis, E. Lonnoy, T. Maycock, M. Tignor and T. 11 Waterfield (eds.)]. In Press, pp. 175-311. ISBN 9781107671812. 12
Hoegh-Guldberg, O. et al., 2019: The human imperative of stabilizing global climate change at 1.5°C. Science, 13 365(6459), eaaw6974, doi:10.1126/science.aaw6974. 14
Hoffmann, D., M. F. d. Vasconcelos and R. P. Martins, 2015: How climate change can affect the distribution range and 15 conservation status of an endemic bird from the highlands of eastern Brazil: the case of the Gray-backed Tachuri, 16 Polystictus superciliaris (Aves, Tyrannidae). Biota Neotropica, 15(2), 1-12, doi:10.1590/1676-060320150075. 17
Hoffmann, R. et al., 2020: A meta-analysis of country-level studies on environmental change and migration. Nature 18 Climate Change, 10(10), 904-912, doi:10.1038/s41558-020-0898-6. 19
Hofmann, G. S. et al., 2021: The Brazilian Cerrado is becoming hotter and drier. Global Change Biology, 27(17), 4060-20 4073, doi:10.1111/gcb.15712. 21
Hollowed, A. B. et al., 2013: Projected impacts of climate change on marine fish and fisheries. ICES Journal of Marine 22 Science, 70(5), 1023-1037, doi:10.1093/icesjms/fst081. 23
Hommes, L. and R. Boelens, 2017: Urbanizing rural waters: Rural-urban water transfers and the reconfiguration of 24 hydrosocial territories in Lima. Political Geography, 57, 71-80, doi:10.1016/j.polgeo.2016.12.002. 25
Hommes, L. and R. Boelens, 2018: From natural flow to ‘working river’: hydropower development, modernity and 26 socio-territorial transformations in Lima's Rímac watershed. Journal of Historical Geography, 62, 85-95, 27 doi:10.1016/j.jhg.2018.04.001. 28
Hoorn, C. et al., 2010: Amazonia Through Time: Andean Uplift, Climate Change, Landscape Evolution, and 29 Biodiversity. Science, 330(6006), 927-931, doi:10.1126/science.1194585. 30
Hora, B., C. Marchant and A. Borsdorf, 2018: Private Protected Areas in Latin America: Between conservation, 31 sustainability goals and economic interests. A review. eco.mont, 10(1), 87-94, doi:10.1553/eco.mont-10-1s87. 32
Hori, T. et al., 2017: Lessons Learnt from Japan and Latin America and Caribbean Countries in Management of 33 Hazard Resilient Infrastructure: A JICA-IDB Joint Research. 55 pp. Available at: 34 https://publications.iadb.org/en/lessons-learnt-japan-and-latin-america-and-caribbean-countries-management-35 hazard-resilient (accessed 17/06/2021). 36
Hoyos, N. et al., 2013: Impact of the 2010–2011 La Niña phenomenon in Colombia, South America: The human toll of 37 an extreme weather event. Applied Geography, 39, 16-25, doi:10.1016/j.apgeog.2012.11.018. 38
Huairou Commission, 2019: Grassroots Women-led Resilient Community Development. Annual Report, New York, 39 United States of America, 42 pp. Available at: https://huairou.org/wp-40 content/uploads/2020/12/Huairou_Commission_Annual_Report_web.pdf (accessed 01/09/2021). 41
Huang, J. et al., 2016: Accelerated dryland expansion under climate change. Nature Climate Change, 6(2), 166-171, 42 doi:10.1038/nclimate2837. 43
Huggel, C. et al., 2007: Review and reassessment of hazards owing to volcano–glacier interactions in Colombia. Annals 44 of Glaciology, 45, 128-136, doi:10.3189/172756407782282408. 45
Huggel, C. et al., 2015a: How useful and reliable are disaster databases in the context of climate and global change? A 46 comparative case study analysis in Peru. Nat. Hazards Earth Syst. Sci., 15(3), 475-485, doi:10.5194/nhess-15-475-47 2015. 48
Huggel, C. et al., 2015b: A framework for the science contribution in climate adaptation: Experiences from science-49 policy processes in the Andes. Environmental Science & Policy, 47, 80-94, doi:10.1016/j.envsci.2014.11.007. 50
Huneeus, N. et al., 2020: Evaluation of anthropogenic air pollutant emission inventories for South America at national 51 and city scale. Atmospheric Environment, 235, 117606, doi:10.1016/j.atmosenv.2020.117606. 52
Hurlbert, M. and J. Gupta, 2016: Adaptive Governance, Uncertainty, and Risk: Policy Framing and Responses to 53 Climate Change, Drought, and Flood. Risk Analysis, 36(2), 339-356, doi:10.1111/risa.12510. 54
Hurlbert, M. and J. Gupta, 2017: The adaptive capacity of institutions in Canada, Argentina, and Chile to droughts and 55 floods. Regional Environmental Change, 17(3), 865-877, doi:10.1007/s10113-016-1078-0. 56
Hurlbert, M. et al., 2019: Risk Management and Decision making in Relation to Sustainable Development. In: Climate 57 Change and Land: an IPCC special report on climate change, desertification, land degradation, sustainable land 58 management, food security, and greenhouse gas fluxes in terrestrial ecosystems [Shukla, P. R., J. Skea, E. Calvo 59 Buendia, V. Masson-Delmotte, H.-O. Pörtner, D. C. Roberts, P. Zhai, R. Slade, S. Connors, R. van Diemen, M. 60 Ferrat, E. Haughey, S. Luz, S. Neogi, M. Pathak, J. Petzold, J. Portugal Pereira, P. Vyas, E. Huntley, K. Kissick, 61 M. Belkacemi and J. Malley (eds.)]. In Press, pp. 1-128. 62
ACCEPTED VERSIO
N
SUBJECT TO FIN
AL EDITS
FINAL DRAFT Chapter 12 IPCC WGII Sixth Assessment Report
Do Not Cite, Quote or Distribute 12-141 Total pages: 181
Hurlbert, M. A. and H. Diaz, 2013: Water Governance in Chile and Canada: a Comparison of Adaptive Characteristics. 1 Ecology and Society, 18(4), doi:10.5751/ES-06148-180461. 2
Hurlbert, M. A. and J. Gupta, 2019: An institutional analysis method for identifying policy instruments facilitating the 3 adaptive governance of drought. Environmental Science & Policy, 93, 221-231, doi:10.1016/j.envsci.2018.09.017. 4
Hurtado, L. A. et al., 2018: Climatic fluctuations and malaria transmission dynamics, prior to elimination, in Guna 5 Yala, República de Panamá. Malaria Journal, 17(1), 85, doi:10.1186/s12936-018-2235-3. 6
Hutter, S. E. et al., 2018: Assessing changing weather and the El Niño Southern Oscillation impacts on cattle rabies 7 outbreaks and mortality in Costa Rica (1985–2016). BMC Veterinary Research, 14(1), 285, doi:10.1186/s12917-8 018-1588-8. 9
Hystad, P. et al., 2019: Health Effects of Household Solid Fuel Use: Findings from 11 Countries within the Prospective 10 Urban and Rural Epidemiology Study. Environmental Health Perspectives, 127(5), 057003, 11 doi:10.1289/EHP3915. 12
IBGE, 2003: Cidades e Estados, Brazilian Institute of Geography and Statistics. Available at: 13 https://cidades.ibge.gov.br/. 14
IBGE, 2010: Cidades e Estados, Brazilian Institute of Geography and Statistics. Available at: 15 https://cidades.ibge.gov.br/. 16
IBGE, 2019: Cidades e Estados, Brazilian Institute of Geography and Statistics. Available at: 17 https://cidades.ibge.gov.br/. 18
ICC, 2019a: Informe de Labores 2018. Instituto Privado de Investigación sobre Cambio Climático ICC, Guatemala, 19 96 pp. Available at: https://icc.org.gt/wp-content/uploads/2019/05/Informe-de-labores-ICC-2018-BR.pdf 20 (accessed 16/06/2021). 21
ICC, 2019b: Síntesis del sistema de información de los ríos de la costa sur de Guatemala: promedios de caudales 22 comparativos en la temporada seca de los años 2017, 2018 y 2019. Instituto Privado de Investigación sobre 23 Cambio Climático ICC, Guatemala, 52 pp. Available at: https://icc.org.gt/wp-24 content/uploads/2019/08/S%C3%ADntesis-del-Sistema-de-Informaci%C3%B3n-r%C3%ADos-Costa-Sur-2017-25 a-2019.pdf (accessed 17/06/2021). 26
IDEAM, 2017: Perspectivas de los servicios climáticos en Colombia. Ministerio de Ambiente, Presidencia de la 27 República de Colombia,Instituto de Hidrología, Meteorología y Estudios Ambientales,Centro Internacional de 28 Agricultura Tropical, Bogotá, 32 pp. Available at: 29 http://www.ideam.gov.co/documents/21021/71699963/Perspectivas+de+los+servicios+clim%C3%A1tico+.pdf/7b30 f734cb-e16d-4b2c-b8d5-d2d75f6103b4 (accessed 17/06/2021). 31
IDH, 2020: European Soy Monitor: Insights on European responsible and deforestation-free soy consumption in 32 2018 IDH, The sustainable Trade Initiative, 62 pp. 33
Ignotti, E. et al., 2010: Air pollution and hospital admissions for respiratory diseases in the subequatorial Amazon: a 34 time series approach. Cadernos de Saúde Pública, 26, 747-761, doi:10.1590/S0102-311X2010000400017. 35
Igualt, F., W. A. Breuer, M. Contreras-López and C. Martínez, 2019: Effects of climate change on the urban tourist and 36 coastal area of Viña del Mar: Survey of damage for flooding by storm surge and perception of security. Revista 37 180, 44, 120-133, doi:10.32995/rev180.Num-44.(2019).art-626. 38
IHA, 2020: 2020 - Hydropower Status Report - Sector trends and insights. International Hydropower Association, 83 39 pp. Available at: https://www.hydropower.org/publications/2020-hydropower-status-report (accessed 01/11/2020). 40
IICA, 2015: Fenómeno de "El Niño" intensifica su paso por Centroamérica. Available at: 41 http://www.iica.int/es/prensa/noticias/fen%C3%B3meno-de-%E2%80%9Cel-ni%C3%B1o%E2%80%9D-42 intensifica-su-paso-por-centroam%C3%A9rica (accessed 17/06/2021). 43
IICA, 2019: Política agropecuaria de la región SICA 2019-2030. Instituto Interamericano de Cooperación para la 44 Agricultura, Instituto Interamericano de Cooperación para la Agricultura, San José, Costa Rica, 46 pp. Available 45 at: https://repositorio.iica.int/handle/11324/7946 (accessed 30/06/2021). 46
Ilustre Municipalidad de Santiago, 2019: Plan Integral de Movilidad 2019-2029, Secretaria Comunal de Planificación, 47 Santiago, Chile, 176 pp. Available at: https://issuu.com/munistgo/docs/pim_2019-2029_final (accessed 48 17/10/2020). 49
Imbach, P. et al., 2017: Climate change, ecosystems and smallholder agriculture in Central America: an introduction to 50 the special issue. Climatic Change, 141(1), 1-12, doi:10.1007/s10584-017-1920-5. 51
Imbach, P. et al., 2018: Future climate change scenarios in Central America at high spatial resolution. PLoS ONE, 52 13(4), 1-21, doi:10.1371/journal.pone.0193570. 53
Imbach, P. A. et al., 2013: Climate change and plant dispersal along corridors in fragmented landscapes of 54 Mesoamerica. Ecology and Evolution, 3(9), 2917-2932, doi:10.1002/ece3.672. 55
Immerzeel, W. W. et al., 2020: Importance and vulnerability of the world’s water towers. Nature, 577(7790), 364-369, 56 doi:10.1038/s41586-019-1822-y. 57
INDEC, 2010: Proyecciones elaboradas en base a resultados del Censo Nacional de Población, Hogares y Viviendas 58 2010. Available at: https://www.indec.gob.ar/. 59
Infante, A. L. and F. C. Infante, 2013: Percepciones y estrategias de los campesinos del secano para mitigar el deterioro 60 ambiental y los efectos del cambio climático en Chile. Agroecología, 8(1), 71-78. 61
Inform Risk Index, 2021: Inform Risk Index 2021. Available at: https://drmkc.jrc.ec.europa.eu/inform-index/ (accessed 62 29/06/2021). 63
ACCEPTED VERSIO
N
SUBJECT TO FIN
AL EDITS
FINAL DRAFT Chapter 12 IPCC WGII Sixth Assessment Report
Do Not Cite, Quote or Distribute 12-142 Total pages: 181
Iniguez-Gallardo, V., I. Bride and J. Tzanopoulos, 2020: Between concepts and experiences: people’s understandings of 1 climate change in southern Ecuador. Public Understanding of Science. 2
Inostroza, L., M. Palme and F. de la Barrera, 2016: A Heat Vulnerability Index: Spatial Patterns of Exposure, 3 Sensitivity and Adaptive Capacity for Santiago de Chile. PLOS ONE, 11(9), e0162464, 4 doi:10.1371/journal.pone.0162464. 5
INSIVUMEH, 2018: Variabilidad y cambio climático en Guatemala. Instituto Nacional de Sismología, Vulcanología, 6 Meteorología e Hidrología INSIVUMEH, Guatemala, 135 pp. 7
IOM, 2021: La movilidad humana derivada de desastres y el cambio climático en Centroamérica. International 8 Organization for Migration, Geneva, Switzerland. Available at: https://publications.iom.int/books/la-movilidad-9 humana-derivada-de-desastres-y-el-cambio-climatico-en-centroamerica (accessed 31/08/2021). 10
Ioris, A. A. R., 2016: Water scarcity and the exclusionary city: the struggle for water justice in Lima, Peru. Water 11 International, 41(1), 125-139, doi:10.1080/02508060.2016.1124515. 12
IPAM, 2020: The Air is Unbearable. Health Impacts of Deforestation-Related Fires in the Brazilian Amazon. Amazon 13 Environmental Research Institute (IPAM). Available at: https://ipam.org.br/wp-14 content/uploads/2020/08/brazil0820_web.pdf (accessed 01/11/2020). 15
IPBES, 2018a: The IPBES regional assessment report on biodiversity and ecosystem services for the Americas [Rice, J. 16 (ed.)]. Secretariat of the Intergovernmental Science-Policy Platform on Biodiversity and Ecosystem Services, 17 Bonn, Germany. 18
IPBES, 2018b: Summary for policymakers of the regional assessment report on biodiversity and ecosystem services for 19 the Americas of the Intergovernmental Science-Policy Platform on Biodiversity and Ecosystem Services [Rice, J., 20 C. S. Seixas, M. E. Zaccagnini, M. Bedoya-Gaitán, N. Valderrama, C. B. Anderson, M. T. K. Arroyo, M. 21 Bustamante, J. Cavender-Bares, A. Diaz-de-Leon, S. Fennessy, J. R. García Márquez, K. Garcia, E. H. Helmer, B. 22 Herrera, B. Klatt, J. P. Ometo, V. Rodríguez Osuna, F. R. Scarano, S. Schill and J. S. Farinaci (eds.)]. 23 Intergovernmental Science-Policy Platform on Biodiversity and Ecosystem Services, Bonn, Germany, 41 pp. 24 Available at: https://doi.org/10.5281/zenodo.3236252 (accessed 17/09/2019). 25
IPBES, 2020: Workshop Report: IPBES Workshop on Biodiversity and Pandemics IPBES, 7 pp. Available at: 26 http://bit.ly/PandemicEmbargoed (accessed 29/10/2020). 27
IPCC, 2014: Summary for Policymakers. In: Climate Change 2014: Impacts, Adaptation, and Vulnerability. Part A: 28 Global and Sectoral Aspects. Contribution of Working Group II to the Fifth Assessment Report of the 29 Intergovernmental Panel on Climate Change [Field, C. B., V. R. Barros, D. J. Dokken, K. J. Mach, M. D. 30 Mastrandrea, T. E. Bilir, M. Chatterjee, K. L. Ebi, Y. O. Estrada, R. C. Genova, B. Girma, E. S. Kissel, A. N. 31 Levy, S. MacCracken, P. R. Mastrandrea and L. L. White (eds.)]. Cambridge University Press, Cambridge, United 32 Kingdom, and New York, NY, USA, pp. 1-32. 33
IPCC, 2018: Global Warming of 1.5°C. An IPCC Special Report on the impacts of global warming of 1.5°C above pre-34 industrial levels and related global greenhouse gas emission pathways, in the context of strengthening the global 35 response to the threat of climate change, sustainable development, and efforts to eradicate poverty. In Press. 36
IPCC, 2019a: Climate Change and Land. An IPCC Special Report on climate change, desertification, land degradation, 37 sustainable land management, food security, and greenhouse gas fluxes in terrestrial ecosystems. Press, I. 38
IPCC, 2019b: Summary for Policymakers. In: IPCC Special Report on the Ocean and Cryosphere in a Changing 39 Climate [Pörtner, H.-O., D. C. Roberts, V. Masson-Delmotte, P. Zhai, M. Tignor, E. Poloczanska, K. Mintenbeck, 40 A. Alegría, M. Nicolai, A. Okem, J. Petzold, B. Rama and N. M. Weyer (eds.)], pp. In Press. 41
IPCC, 2019c: Summary for Policymakers. In: Climate Change and Land. An IPCC Special Report on climate change, 42 desertification, land degradation, sustainable land management, food security, and greenhouse gas fluxes in 43 terrestrial ecosystems. In Press. 44
Iriarte, J. et al., 2020: The origins of Amazonian landscapes: Plant cultivation, domestication and the spread of food 45 production in tropical South America. Quaternary Science Reviews, 248, 106582, 46 doi:10.1016/j.quascirev.2020.106582. 47
Iribarren Anacona, P., A. Mackintosh and K. P. Norton, 2015: Hazardous processes and events from glacier and 48 permafrost areas: lessons from the Chilean and Argentinean Andes. Earth Surf. Process. Landforms, 40(1), 2-21, 49 doi:10.1002/esp.3524. 50
Isaac, V. J. and S. F. Ferrari, 2017: Assessment and management of the North Brazil Shelf Large Marine Ecosystem. 51 Environmental Development, 22, 97-110, doi:10.1016/j.envdev.2016.11.004. 52
Ishizawa, O. A. and J. J. Miranda, 2016: Weathering Storms: Understanding the Impact of Natural Disasters on the 53 Poor in Central America. World Bank, Washington, DC, 25 pp. Available at: 54 https://openknowledge.worldbank.org/handle/10986/24528 (accessed 31/08/2021). 55
ISIMIP, 2021: Input data set: Historical, gridded population, Inter-Sectoral Impact Model Intercomparison Project. 56 Available at: https://www.isimip.org/gettingstarted/details/31/. 57
Isla, F. I., 2018: ENSO-triggered floods in South America: correlation between maximum monthly discharges during 58 strong events. Hydrol. Earth Syst. Sci. Discuss., 2018, 1-13, doi:10.5194/hess-2018-107. 59
Isla, F. I. et al., 2018: Erosion in Buenos Aires province: Coastal-management policy revisited. Ocean & Coastal 60 Management, 156, 107-116, doi:10.1016/j.ocecoaman.2017.09.008. 61
Isla, F. I., M. Espinosa and G. Bujalesky, 2010: Summer stratification of Andean lakes of Patagonia and Tierra del 62 Fuego: Global warming or ENSO effects? Revista Geográfica del Sur, 2, 55-71. 63
ACCEPTED VERSIO
N
SUBJECT TO FIN
AL EDITS
FINAL DRAFT Chapter 12 IPCC WGII Sixth Assessment Report
Do Not Cite, Quote or Distribute 12-143 Total pages: 181
Isla, F. I. and E. J. Schnack, 2009: The Changing Coastlines of South America. In: Developments in Earth Surface 1 Processes [Latrubesse, E. M. (ed.)]. Elsevier, pp. 49-73. ISBN 0928-2025. 2
Jacob, A. C. P. et al., 2019: Use of detention basin for flood mitigation and urban requalification in Mesquita, Brazil. 3 Water Science and Technology, 79(11), 2135-2144, doi:10.2166/wst.2019.212. 4
Jacob, B. G. et al., 2018: Major changes in diatom abundance, productivity, and net community metabolism in a 5 windier and dryer coastal climate in the southern Humboldt Current. Progress in Oceanography, 168, 196-209, 6 doi:10.1016/j.pocean.2018.10.001. 7
Jacob, T., J. Wahr, W. T. Pfeffer and S. Swenson, 2012: Recent contributions of glaciers and ice caps to sea level rise. 8 Nature, 482(7386), 514-518, doi:10.1038/nature10847. 9
Jacobi, J. et al., 2015: Agroecosystem resilience and farmers’ perceptions of climate change impacts on cocoa farms in 10 Alto Beni, Bolivia. Renewable Agriculture and Food Systems, 30(2), 170-183, doi:10.1017/S174217051300029X. 11
Jacquet, J. et al., 2017: Hydrologic and geomorphic changes resulting from episodic glacial lake outburst floods: Rio 12 Colonia, Patagonia, Chile. Geophysical Research Letters, 44(2), 854-864, doi:10.1002/2016GL071374. 13
Jaime, M. M., C. Chávez and W. Gómez, 2020: Fuel choices and fuelwood use for residential heating and cooking in 14 urban areas of central-southern Chile: The role of prices, income, and the availability of energy sources and 15 technology. Resource and Energy Economics, 60, 101125, doi:10.1016/j.reseneeco.2019.101125. 16
Jaitman, L., 2015: Urban infrastructure in Latin America and the Caribbean: public policy priorities. Latin American 17 Economic Review, 24(1), 13, doi:10.1007/s40503-015-0027-5. 18
Jalón-Rojas, I. et al., 2018: To What Extent Multidecadal Changes in Morphology and Fluvial Discharge Impact Tide in 19 a Convergent (Turbid) Tidal River. Journal of Geophysical Research: Oceans, 123(5), 3241-3258, 20 doi:10.1002/2017JC013466. 21
Janches, F., H. Henderson and L. Maccolman, 2014: Urban Risk and Climate Change Adaptation in the Reconquista 22 River Basin of Argentina. Lincoln Institute of Land Policy, 91 pp. Available at: 23 https://www.lincolninst.edu/sites/default/files/pubfiles/2486_1832_Janches%20WP14FJ1.pdf (accessed 24 30/10/2020). 25
Jantz, S. M. et al., 2015: Future habitat loss and extinctions driven by land-use change in biodiversity hotspots under 26 four scenarios of climate-change mitigation. Conservation Biology, 29(4), 1122-1131, doi:10.1111/cobi.12549. 27
Jaramillo, F. et al., 2018: Effects of Hydroclimatic Change and Rehabilitation Activities on Salinity and Mangroves in 28 the Ciénaga Grande de Santa Marta, Colombia. Wetlands, 38(4), 755-767, doi:10.1007/s13157-018-1024-7. 29
Jat, M. L. et al., 2016: Climate Change and Agriculture: Adaptation Strategies and Mitigation Opportunities for Food 30 Security in South Asia and Latin America. In: Advances in Agronomy [Sparks, D. L. (ed.)]. Academic Press, pp. 31 127-235. ISBN 0065-2113. 32
Jia, G. et al., 2019: Land-Climate Interactions. In: Climate Change and Land. An IPCC Special Report on climate 33 change, desertification, land degradation, sustainable land management, food security, and greenhouse gas fluxes 34 in terrestrial ecosystems. In Press. 35
Jiménez, A., n.d.: Latin America in Focus: Regional brief on National Adaptation Plans. 15 pp. Available at: 36 https://www.globalsupportprogramme.org/resources/knowledge-products/regional-brief-naps-latin-america-focus 37 (accessed 31/10/2020). 38
Jiménez Cisneros, B. E. et al., 2014: Freshwater resources. In: Climate Change 2014: Impacts, Adaptation, and 39 Vulnerability. Part A: Global and Sectoral Aspects. Contribution of Working Group II to the Fifth Assessment 40 Report of the Intergovernmental Panel of Climate Change [Field, C. B., V. R. Barros, D. J. Dokken, K. J. Mach, 41 M. D. Mastrandrea, T. E. Bilir, M. Chatterjee, K. L. Ebi, Y. O. Estrada, R. C. Genova, B. Girma, E. S. Kissel, A. 42 N. Levy, S. MacCracken, P. R. Mastrandrea and L. L. White (eds.)]. Cambridge University Press, Cambridge, 43 United Kingdom and New York, NY, USA, pp. 229-269. 44
Johansson, M. A. et al., 2019: An open challenge to advance probabilistic forecasting for dengue epidemics. 45 Proceedings of the National Academy of Sciences, 116(48), 24268, doi:10.1073/pnas.1909865116. 46
Johansson, M. A. et al., 2014: Nowcasting the Spread of Chikungunya Virus in the Americas. PLOS ONE, 9(8), 47 e104915, doi:10.1371/journal.pone.0104915. 48
Johansson, M. A. et al., 2016: Evaluating the performance of infectious disease forecasts: A comparison of climate-49 driven and seasonal dengue forecasts for Mexico. Scientific Reports, 6(1), 33707, doi:10.1038/srep33707. 50
Johns, R. et al., 2018: Meta-analysis of NOS3 G894T polymorphisms with air pollution on the risk of ischemic heart 51 disease worldwide. Toxics, 6(3), 1-16, doi:10.3390/toxics6030044. 52
Johnson, C., G. Jain and A. Lavell, 2021: Rethinking Urban Risk and Resettlement in the Global South. UCL Press. 53 Available at: https://www.uclpress.co.uk/products/155742 (accessed 31/08/2021). 54
Johnson, R. J., C. Wesseling and L. S. Newman, 2019: Chronic Kidney Disease of Unknown Cause in Agricultural 55 Communities. New England Journal of Medicine, 380(19), 1843-1852, doi:10.1056/NEJMra1813869. 56
Jolly, W. M. et al., 2015: Climate-induced variations in global wildfire danger from 1979 to 2013. Nature 57 Communications, 6, 7537, doi:10.1038/ncomms8537. 58
Joslin, A. J., 2019: Unpacking ‘Success’: Applying Local Perceptions to Interpret Influences of Water Fund Payments 59 for Ecosystem Services in the Ecuadorian Andes. Society & Natural Resources, 32(6), 617-637, 60 doi:10.1080/08941920.2018.1559379. 61
Joyce, C. B., M. Simpson and M. Casanova, 2016: Future wet grasslands: ecological implications of climate change. 62 Ecosystem Health and Sustainability, 2(9), e01240, doi:10.1002/ehs2.1240. 63
ACCEPTED VERSIO
N
SUBJECT TO FIN
AL EDITS
FINAL DRAFT Chapter 12 IPCC WGII Sixth Assessment Report
Do Not Cite, Quote or Distribute 12-144 Total pages: 181
Jump, A. S. et al., 2017: Structural overshoot of tree growth with climate variability and the global spectrum of 1 drought-induced forest dieback. Global Change Biology, 23(9), 3742-3757, doi:10.1111/gcb.13636. 2
Junk, W. J., 2013: Current state of knowledge regarding South America wetlands and their future under global climate 3 change. Aquatic Sciences, 75(1), 113-131, doi:10.1007/s00027-012-0253-8. 4
Junk, W. J. et al., 2013: Current state of knowledge regarding the world’s wetlands and their future under global climate 5 change: a synthesis. Aquatic Sciences, 75(1), 151-167, doi:10.1007/s00027-012-0278-z. 6
Jurt, C. et al., 2015: Local perceptions in climate change debates: insights from case studies in the Alps and the Andes. 7 Climatic Change, 133(3), 511-523, doi:10.1007/s10584-015-1529-5. 8
Kabisch, N. et al., 2016: Nature-based solutions to climate change mitigation and adaptation in urban areas: 9 perspectives on indicators, knowledge gaps, barriers, and opportunities for action. Ecology and Society, 21(2), 10 doi:10.5751/ES-08373-210239. 11
Kaenzig, R., 2015: Can glacial retreat lead to migration? A critical discussion of the impact of glacier shrinkage upon 12 population mobility in the Bolivian Andes. Population and Environment, 36(4), 480-496, doi:10.1007/s11111-13 014-0226-z. 14
Kaenzig, R. and E. Piguet, 2014: Migration and Climate Change in Latin America and the Caribbean. In: People on the 15 Move in a Changing Climate: The Regional Impact of Environmental Change on Migration [Piguet, E. and F. 16 Laczko (eds.)]. Springer, Dordrecht, pp. 155-176. ISBN 978-94-007-6985-4. 17
Kaijser, A. and A. Kronsell, 2014: Climate change through the lens of intersectionality. Environmental Politics, 23(3), 18 417-433, doi:10.1080/09644016.2013.835203. 19
Kalikoski, D. C. et al., 2018: Chapter 2: Understanding the impacts of climate change for fisheries and aquaculture: 20 applying a poverty lens. In: Impacts of climate change on fisheries and aquaculture: synthesis of current 21 knowledge, adaptation and mitigation options [Barange, M., T. Bahri, M. C. M. Beveridge, K. L. Cochrane, S. 22 Funge-Smith and F. Poulain (eds.)]. FAO, Rome, Italy, pp. 628. 23
Kalikoski, D. C., S. Jentoft, P. McConney and S. Siar, 2019: Empowering small-scale fishers to eradicate rural poverty. 24 Maritime Studies, 18(2), 121-125, doi:10.1007/s40152-018-0112-x. 25
Kämpf, N. et al., 2003: Classification of Amazonian Dark Earths and Other Ancient Anthropic Soils. In: Amazonian 26 Dark Earths: Origin Properties Management [Lehmann, J., D. C. Kern, B. Glaser and W. I. Wodos (eds.)]. 27 Springer Netherlands, Dordrecht, pp. 77-102. ISBN 978-1-4020-2597-6. 28
Karlsson, M. and I. Bryceson, 2016: Continuity and change: understanding livelihood shifts and adaptation in coastal 29 Belize 1830–2012. Local Environment, 21(2), 137-156, doi:10.1080/13549839.2014.926871. 30
Kasecker, T. P., M. B. Ramos-Neto, J. M. C. da Silva and F. R. Scarano, 2018: Ecosystem-based adaptation to climate 31 change: defining hotspot municipalities for policy design and implementation in Brazil. Mitigation and 32 Adaptation Strategies for Global Change, 23(6), 981-993, doi:10.1007/s11027-017-9768-6. 33
Kastens, J. H. et al., 2017: Soy moratorium impacts on soybean and deforestation dynamics in Mato Grosso, Brazil. 34 PloS One, 12(4), e0176168, doi:10.1371/journal.pone.0176168. 35
Kates, R. W., W. R. Travis and T. J. Wilbanks, 2012: Transformational adaptation when incremental adaptations to 36 climate change are insufficient. Proceedings of the National Academy of Sciences of the United States of America, 37 109(19), 7156–7161, doi:10.1073/pnas.1115521109. 38
Kauffman, C., 2014: Financing watershed conservation: Lessons from Ecuador’s evolving water trust funds. Agric. 39 Water Manage., 145, 39-49, doi:10.1016/j.agwat.2013.09.013. 40
Keenan, R. J., 2015: Climate change impacts and adaptation in forest management: a review. Annals of Forest Science, 41 72(2), 145-167, doi:10.1007/s13595-014-0446-5. 42
Kern, D. C., M. De Lp Ruivo and F. J. L. Frazão, 2009: Terra preta nova: The dream of Wim Sombroek. In: Amazonian 43 Dark Earths: Wim Sombroek's Vision. Springer, Dordrecht, pp. 339-349. ISBN 9781402090301. 44
Kern, J. et al., 2019: What can we learn from ancient fertile anthropic soil (Amazonian Dark Earths, shell mounds, 45 Plaggen soil) for soil carbon sequestration? Catena, doi:10.1016/j.catena.2018.08.008. 46
Khalid, A. et al., 2020: Hydrodynamic and Wave Responses During Storm Surges on the Southern Brazilian Coast: A 47 Real-Time Forecast System. Water, 12(12), doi:10.3390/w12123397. 48
Khan, M. et al., 2020: Twenty-five years of adaptation finance through a climate justice lens. Climatic Change, 161(2), 49 251-269, doi:10.1007/s10584-019-02563-x. 50
Khatri-Chhetri, A. et al., 2019: Stakeholders prioritization of climate-smart agriculture interventions: Evaluation of a 51 framework. Agricultural Systems, 174, 23-31, doi:10.1016/j.agsy.2019.03.002. 52
Khouakhi, A., G. Villarini and G. A. Vecchi, 2017: Contribution of Tropical Cyclones to Rainfall at the Global Scale. 53 Journal of Climate, 30(1), 359-372, doi:10.1175/JCLI-D-16-0298.1. 54
Kitoh, A., S. Kusunoki and T. Nakaegawa, 2011: Climate change projections over South America in the late 21st 55 century with the 20 and 60 km mesh Meteorological Research Institute atmospheric general circulation model 56 (MRI-AGCM). Journal of Geophysical Research: Atmospheres, 116(D6), doi:10.1029/2010JD014920. 57
Klein Goldewijk, K., A. Beusen, J. Doelman and E. Stehfest, 2017: Anthropogenic land use estimates for the Holocene 58 – HYDE 3.2. Earth Syst. Sci. Data, 9(2), 927-953, doi:10.5194/essd-9-927-2017. 59
Klenk, N., A. Fiume, K. Meehan and C. Gibbes, 2017: Local knowledge in climate adaptation research: moving 60 knowledge frameworks from extraction to co-production. WIREs Climate Change, 8(5), e475, 61 doi:10.1002/wcc.475. 62
ACCEPTED VERSIO
N
SUBJECT TO FIN
AL EDITS
FINAL DRAFT Chapter 12 IPCC WGII Sixth Assessment Report
Do Not Cite, Quote or Distribute 12-145 Total pages: 181
Knapp, G., 2017: Mountain Agriculture for Global Markets: The Case of Greenhouse Floriculture in Ecuador. Annals of 1 the American Association of Geographers, 107(2), 511-519, doi:10.1080/24694452.2016.1203282. 2
Kobres, P.-Y. et al., 2019: A systematic review and evaluation of Zika virus forecasting and prediction research during 3 a public health emergency of international concern. PLoS neglected tropical diseases, 13(10), e0007451, 4 doi:10.1371/journal.pntd.0007451. 5
Koch, F., 2018: Mainstreaming adaptation: a content analysis of political agendas in Colombian cities. Climate and 6 Development, 10(2), 179-192, doi:10.1080/17565529.2016.1223592. 7
Kongsager, R., 2017: Barriers to the adoption of alley cropping as a climate-smart agriculture practice: lessons from 8 maize cultivation among the Maya in southern Belize. Forests, 8(7), 260, doi:10.3390/f8070260. 9
Koubi, V., G. Spilker, L. Schaffer and T. Böhmelt, 2016: The role of environmental perceptions in migration decision-10 making: evidence from both migrants and non-migrants in five developing countries. Population and 11 Environment, 38(2), 134-163, doi:10.1007/s11111-016-0258-7. 12
Koutroulis, A. G. et al., 2019: Global water availability under high-end climate change: A vulnerability based 13 assessment. Global and Planetary Change, 175(January), 52-63, doi:10.1016/j.gloplacha.2019.01.013. 14
Krause, G., 2014: The scientific challenge of bridging the gap from the local to the earth system level: lessons from the 15 study of mangroves and people in North Brazil. Regional Environmental Change, 14(6), 2089-2103, 16 doi:10.1007/s10113-014-0636-6. 17
Krellenberg, K. and B. Katrin, 2014: Inter- and Transdisciplinary Research for Planning Climate Change Adaptation 18 Responses: The Example of Santiago de Chile. Interdisciplinary Science Reviews, 39(4), 360-375, 19 doi:10.1179/0308018814Z.00000000097. 20
Krellenberg, K. and J. Welz, 2017: Assessing Urban Vulnerability in the Context of Flood and Heat Hazard: Pathways 21 and Challenges for Indicator-Based Analysis. Social Indicators Research, 132(2), 709-731, doi:10.1007/s11205-22 016-1324-3. 23
Kreps, G., G. Martínez Pastur and P. L. Peri, 2012: Cambio climático en Patagonia Sur. Escenarios futuros en el 24 manejo de los recursos naturales. Instituto Nacional de Tecnología Agropecuaria, Buenos Aires, 101 pp. 25 Available at: https://inta.gob.ar/documentos/cambio-climatico-en-patagonia-sur-escenarios-futuros-en-el-manejo-26 de-los-recursos-naturales (accessed 16/06/2021). 27
Krisher, L. K. et al., 2016: Successful malaria elimination in the Ecuador–Peru border region: epidemiology and lessons 28 learned. Malaria Journal, 15(1), 573-573, doi:10.1186/s12936-016-1630-x. 29
Krishnamurthy, P. K., K. Lewis and R. J. Choularton, 2014: A methodological framework for rapidly assessing the 30 impacts of climate risk on national-level food security through a vulnerability index. Global Environmental 31 Change, 25(1), 121-132, doi:10.1016/j.gloenvcha.2013.11.004. 32
Kronenberg, M. et al., 2016: The Projected Precipitation Reduction over the Central Andes may Severely Affect 33 Peruvian Glaciers and Hydropower Production. Energy Procedia, 97, 270-277, doi:10.1016/j.egypro.2016.10.072. 34
Krug, L. A. et al., 2013: The construction of causal networks to estimate coral bleaching intensity. Environmental 35 Modelling and Software, 42, 157-167, doi:10.1016/j.envsoft.2013.01.003. 36
Kubisch, E. L., V. Corbalán, N. R. Ibargüengoytía and B. Sinervo, 2016: Local extinction risk of three species of lizard 37 from Patagonia as a result of global warming. Canadian Journal of Zoology, 94(1), 49-59, doi:10.1139/cjz-2015-38 0024. 39
Kummu, M. et al., 2016: The world's road to water scarcity: shortage and stress in the 20th century and pathways 40 towards sustainability. Scientific Reports, 6(December), 38495, doi:10.1038/srep38495. 41
Labra, M. E., 2002: La reinvención neoliberal de la inequidad en Chile: el caso de la salud. Cadernos de Saúde Pública, 42 18(4), 1041-1052, doi:10.1590/S0102-311X2002000400010. 43
Lachaud, M. A., B. E. Bravo-Ureta and C. E. Ludena, 2017: Agricultural productivity in Latin America and the 44 Caribbean in the presence of unobserved heterogeneity and climatic effects. Climatic Change, 143(3), 445-460, 45 doi:10.1007/s10584-017-2013-1. 46
Läderach, P. et al., 2013: Mesoamerican Coffee: Building a Climate Change Adaptation Strategy. CIAT Policy Brief 47 No. 2, International Center for Tropical Agriculture (CIAT), Cali, Colombia, 4 pp. Available at: 48 https://cgspace.cgiar.org/handle/10568/29001 (accessed 17/09/2019). 49
Lagos, N. A. et al., 2016: Effects of temperature and ocean acidification on shell characteristics of Argopecten 50 purpuratus: implications for scallop aquaculture in an upwelling-influenced area. Aquaculture Environment 51 Interactions, 8, 357-370, doi:10.3354/aei00183. 52
Laguna, F., M. E. Grillet, J. R. León and C. Ludeña, 2017: Modelling malaria incidence by an autoregressive 53 distributed lag model with spatial component. Spatial and Spatio-temporal Epidemiology, 22, 27-37, 54 doi:10.1016/j.sste.2017.05.001. 55
Lambert, N. J. and J. Eise, 2020: Farming in the Face of Uncertainty: How Colombian Coffee Farmers Conceptualize 56 and Communicate Their Experiences With Climate Change. International Journal of Communication, 14. 57
Lambin, E. F. et al., 2018: The role of supply-chain initiatives in reducing deforestation. Nature Climate Change, 8(2), 58 109-116, doi:10.1038/s41558-017-0061-1. 59
Lampis, A., 2013: La adaptación al cambio climático: el reto de las dobles agendas. In: Cambio climático, movimientos 60 sociales y políticas públicas. Una vinculación necesaria, 1 ed. [Postigo, J. (ed.)]. CLACSO, Pontificia 61 Universidad Católica del Perú e Instituto de Ciencias Alejandro Lipschutz, Santiago de Chile, pp. 29-50. ISBN 62 978-956-351-460-5. 63
ACCEPTED VERSIO
N
SUBJECT TO FIN
AL EDITS
FINAL DRAFT Chapter 12 IPCC WGII Sixth Assessment Report
Do Not Cite, Quote or Distribute 12-146 Total pages: 181
Lampis, A., P. H. Campello Torres, P. R. Jacobi and A. L. Leonel, 2020: A produção de riscos e desastres na América 1 latina em um contexto de emergência climática. O Social em Questão,(48), 75–96. 2
Lan, L. et al., 2018: Farm-level and community aggregate economic impacts of adopting climate smart agricultural 3 practices in three mega environments. PLOS ONE, 13(11), e0207700, doi:10.1371/journal.pone.0207700. 4
Landesmann, J. B., J. H. Gowda, L. A. Garibaldi and T. Kitzberger, 2015: Survival, growth and vulnerability to drought 5 in fire refuges: implications for the persistence of a fire-sensitive conifer in northern Patagonia. Oecologia, 6 179(4), 1111-1122, doi:10.1007/s00442-015-3431-2. 7
Lapola, D. M. et al., 2019a: Heat stress vulnerability and risk at the (super) local scale in six Brazilian capitals. Climatic 8 Change, 154(3), 477-492, doi:10.1007/s10584-019-02459-w. 9
Lapola, D. M. et al., 2019b: A climate-change vulnerability and adaptation assessment for Brazil's protected areas. 10 Conservation Biology, 34(2), 427-437, doi:10.1111/cobi.13405. 11
Lapola, D. M. et al., 2014: Pervasive transition of the Brazilian land-use system. Nature Climate Change, 4(1), 27-35, 12 doi:10.1038/nclimate2056. 13
Lapola, D. M. et al., 2018: Limiting the high impacts of Amazon forest dieback with no-regrets science and policy 14 action. Proceedings of the National Academy of Sciences of the United States of America, 115(46), 11671-11679, 15 doi:10.1073/pnas.1721770115. 16
Laporta, G. Z. et al., 2015: Malaria vectors in South America: current and future scenarios. Parasites & Vectors, 8(1), 17 426, doi:10.1186/s13071-015-1038-4. 18
Lara, M. et al., 2018: Landslide susceptibility maps of Santiago city Andean foothills, Chile. Andean Geology, 45(3), 19 433-442, doi:10.5027/andgeoV45n3-3151. 20
Lardies, M. A. et al., 2017: Physiological and histopathological impacts of increased carbon dioxide and temperature on 21 the scallops Argopecten purpuratus cultured under upwelling influences in northern Chile. Aquaculture, 479, 455-22 466, doi:10.1016/j.aquaculture.2017.06.008. 23
Larson, A. M. and E. Petkova, 2011: An Introduction to Forest Governance, People and REDD+ in Latin America: 24 Obstacles and Opportunities. Forests, 2(1), doi:10.3390/f2010086. 25
Lasage, R. et al., 2015: A Stepwise, participatory approach to design and implement community based adaptation to 26 drought in the Peruvian Andes. Sustainability (Switzerland), 7(2), 1742-1773, doi:10.3390/su7021742. 27
Lavell, A., 2016: Colombia, Peru y Mexico: Reporte Regional Final para América Latina. Reducing Relocation Risk in 28 Urban Areas. The Bartlett Development Planning Unit, UCL. Available at: 29 https://www.ucl.ac.uk/bartlett/development/sites/bartlett/files/wp4_closure_rep_flacso_esp.pdf (accessed 30 01/09/2021). 31
Lázaro, W. L. et al., 2020: Climate change reflected in one of the largest wetlands in the world: an overview of the 32 Northern Pantanal water regime. Acta Limnologica Brasiliensia, 32, e104, doi:10.1590/S2179-975X7619. 33
Le, T. D. N., 2020: Climate change adaptation in coastal cities of developing countries: characterizing types of 34 vulnerability and adaptation options. Mitigation and Adaptation Strategies for Global Change, 25(5), 739-761, 35 doi:10.1007/s11027-019-09888-z. 36
Leal Filho, W., 2018: Climate Change in Latin America: An Overview of Current and Future Trends. In: Climate 37 Change Adaptation in Latin America : Managing Vulnerability, Fostering Resilience [Leal Filho, W. and L. E. 38 Freitas (eds.)]. Springer International Publishing, Cham, pp. 529-537. ISBN 1610-2010. 39
Leal Filho, W. et al., 2018: Fostering coastal resilience to climate change vulnerability in Bangladesh, Brazil, Cameroon 40 and Uruguay: a cross-country comparison. Mitigation & Adaptation Strategies for Global Change, 23(4), 579-41 602, doi:10.1007/s11027-017-9750-3. 42
Leal Filho, W. et al., 2021: Whose voices, whose choices? Pursuing climate resilient trajectories for the poor. 43 Environmental Science & Policy, 121, 18-23, doi:10.1016/j.envsci.2021.02.018. 44
Leão, Z. M. A. N. et al., 2016: Brazilian coral reefs in a period of global change: A synthesis. Brazilian Journal of 45 Oceanography, 64, 97-116, doi:10.1590/S1679-875920160916064sp2. 46
Lee, D. R. et al., 2014: Developing local adaptation strategies for climate change in agriculture: A priority-setting 47 approach with application to Latin America. Global Environmental Change, 29, 78-91, 48 doi:10.1016/j.gloenvcha.2014.08.002. 49
Lee, J. Y. et al., 2021: Future Global Climate: Scenario-Based Projections and Near-Term Information. In: Climate 50 Change 2021: The Physical Science Basis. Contribution of Working Group I to the Sixth Assessment Report of the 51 Intergovernmental Panel on Climate Change [Masson-Delmotte, V., P. Zhai, A. Pirani, S. L. Connors, C. Péan, S. 52 Berger, N. Caud, Y. Chen, L. Goldfarb, M. I. Gomis, M. Huang, K. Leitzell, E. Lonnoy, J. B. R. Matthews, T. K. 53 Maycock, T. Waterfield, O. Yelekçi, R. Yu and B. Zhou (eds.)]. Cambridge University Press. 54
Lee, T. and T. Lee, 2016: Evolutionary urban climate resilience: assessment of Seoul’s policies. International Journal 55 of Climate Change Strategies and Management, 8(5), 597-612, doi:10.1108/IJCCSM-06-2015-0066. 56
Lehmann, J., 2009: Terra preta nova - Where to from here? In: Amazonian Dark Earths: Wim Sombroek's Vision. 57 Springer, Dordrecht, pp. 473-486. ISBN 9781402090301. 58
Lehmann, J. et al., 2003: Nutrient availability and leaching in an archaeological Anthrosol and a Ferralsol of the Central 59 Amazon basin: Fertilizer, manure and charcoal amendments. Plant and Soil, doi:10.1023/A:1022833116184. 60
Leichenko, R. and J. A. Silva, 2014: Climate change and poverty: vulnerability, impacts, and alleviation strategies. 61 Wiley Interdisciplinary Reviews: Climate Change, 5(4), 539-556. 62
Leichenko, R. M. and K. L. O'Brien, 2019: Climate and society: transforming the future. Polity, Cambridge, 250 pp. 63
ACCEPTED VERSIO
N
SUBJECT TO FIN
AL EDITS
FINAL DRAFT Chapter 12 IPCC WGII Sixth Assessment Report
Do Not Cite, Quote or Distribute 12-147 Total pages: 181
Leisher, C. et al., 2019: Guía para el monitoreo y la evaluación de los Fondos de Agua. The Nature Conservancy, 23 1 pp. Available at: https://s3.amazonaws.com/tnc-craft/library/Water-Funds_ME-2 Guide_0719_Es.pdf?mtime=20190910204650 (accessed 16/06/2021). 3
Leite-Filho, A. T. et al., 2021: Deforestation reduces rainfall and agricultural revenues in the Brazilian Amazon. Nature 4 Communications, 12(1), 2591, doi:10.1038/s41467-021-22840-7. 5
Leiva G, M. A. et al., 2013: A five-year study of particulate matter (PM2.5) and cerebrovascular diseases. 6 Environmental Pollution, 181, 1-6, doi:10.1016/j.envpol.2013.05.057. 7
Lemos, M. C. et al., 2016: Linking development to climate adaptation: Leveraging generic and specific capacities to 8 reduce vulnerability to drought in NE Brazil. Global Environmental Change, 39, 170-179, 9 doi:10.1016/j.gloenvcha.2016.05.001. 10
León-Muñoz, J., M. A. Urbina, R. Garreaud and J. L. Iriarte, 2018: Hydroclimatic conditions trigger record harmful 11 algal bloom in western Patagonia (summer 2016). Scientific Reports, 8(1), 1330, doi:10.1038/s41598-018-19461-12 4. 13
Leroy, D., 2019: Farmers' Perceptions of and Adaptations to Water Scarcity in Colombian and Venezuelan Páramos in 14 the Context of Climate Change. Mountain Research and Development, 39(2), R21-R34, doi:10.1659/MRD-15 JOURNAL-D-18-00062.1. 16
Lesjak, J. and D. F. Calderini, 2017: Increased Night Temperature Negatively Affects Grain Yield, Biomass and Grain 17 Number in Chilean Quinoa. Front Plant Sci, 8, 352-352, doi:10.3389/fpls.2017.00352. 18
Lewnard, J. A. et al., 2014: Forecasting Temporal Dynamics of Cutaneous Leishmaniasis in Northeast Brazil. PLOS 19 Neglected Tropical Diseases, 8(10), e3283, doi:10.1371/journal.pntd.0003283. 20
Li, D. et al., 2018: Vulnerability of the global terrestrial ecosystems to climate change. Global Change Biology, 24(9), 21 4095-4106, doi:10.1111/gcb.14327. 22
Lillo-Ortega, G. et al., 2019: On the evaluation of adaptation practices: a transdisciplinary exploration of drought 23 measures in Chile. Sustainability Science, 14(4), 1057–1069, doi:10.1007/s11625-018-0619-5. 24
Lima, C. H. R., A. AghaKouchak and J. T. Randerson, 2018: Unraveling the Role of Temperature and Rainfall on 25 Active Fires in the Brazilian Amazon Using a Nonlinear Poisson Model. Journal of Geophysical Research: 26 Biogeosciences, 123(1), 117-128, doi:10.1002/2017JG003836. 27
Lima, G. N. d. and V. O. Magaña Rueda, 2018: The urban growth of the metropolitan area of Sao Paulo and its impact 28 on the climate. Weather and Climate Extremes, 21, 17-26, doi:10.1016/j.wace.2018.05.002. 29
Lima, H. N. et al., 2002: Pedogenesis and pre-Colombian land use of "Terra Preta Anthrosols" ("Indian black earth") of 30 Western Amazonia. Geoderma, 110(1-2), 1-17, doi:10.1016/S0016-7061(02)00141-6. 31
Lima, S. M. Q., T. P. A. Ramos, M. J. da Silva and R. de Souza Rosa, 2017: Diversity, Distribution, and Conservation 32 of the Caatinga Fishes: Advances and Challenges. In: Caatinga: The Largest Tropical Dry Forest Region in South 33 America [Silva, J. M. C. d., I. R. Leal and M. Tabarelli (eds.)]. Springer International Publishing, Cham, pp. 97-34 131. ISBN 978-3-319-68339-3. 35
Lin, Y.-C., W.-J. Chi, Y.-T. Lin and C.-Y. Lai, 2020: The spatiotemporal estimation of the risk and the international 36 transmission of COVID-19: a global perspective. Scientific Reports, 10(1), 20021, doi:10.1038/s41598-020-37 77242-4. 38
Lindoso, D. P. et al., 2018: Harvesting water for living with drought: Insights from the Brazilian Human Coexistence 39 with Semi-Aridity approach towards achieving the sustainable development goals. Sustainability, 10(3), 622, 40 doi:10.3390/su10030622. 41
Lindsay, A., 2018: Social learning as an adaptive measure to prepare for climate change impacts on water provision in 42 Peru. Journal of Environmental Studies and Sciences, 8(4), 477–487, doi:10.1007/s13412-017-0464-3. 43
Lins-de-Barros, F. and L. Parente-Ribeiro, 2018: How Much Is a Beach Worth: Economic Use and Vulnerability to 44 Coastal Erosion: The Case of Ipanema and Arpoador Beaches, Rio de Janeiro (Brazil). In: Climate Change 45 Adaptation in Latin America : Managing Vulnerability, Fostering Resilience [Leal Filho, W. and L. E. Freitas 46 (eds.)]. Springer International Publishing, Cham, pp. 207-222. 47
Lippi, C. A. et al., 2019: Geographic shifts in Aedes aegypti habitat suitability in Ecuador using larval surveillance data 48 and ecological niche modeling: Implications of climate change for public health vector control. PLOS Neglected 49 Tropical Diseases, 13(4), e0007322, doi:10.1371/journal.pntd.0007322. 50
Liu, Y. and J. Chen, 2021: Future global socioeconomic risk to droughts based on estimates of hazard, exposure, and 51 vulnerability in a changing climate. Science of The Total Environment, 751, 142159, 52 doi:10.1016/j.scitotenv.2020.142159. 53
Lizana, X. C., A. Avila, A. Tolaba and J. P. Martinez, 2017: Field responses of potato to increased temperature during 54 tuber bulking: Projection for climate change scenarios, at high-yield environments of Southern Chile. Agricultural 55 and Forest Meteorology, 239, 192-201, doi:10.1016/j.agrformet.2017.03.012. 56
Lizarralde Oliver, S. and H. Ribeiro, 2016: Water Supply, Climate Change and Health Risk Factors: Example Case of 57 Sao Paulo -Brazil. [Leal Filho, W., U. M. Azeiteiro and F. Alves (eds.)]. Springer, pp. 433-447. 58
Llopart, M. et al., 2014: Climate change impact on precipitation for the Amazon and La Plata basins. Climatic Change, 59 125(1), 111-125, doi:10.1007/s10584-014-1140-1. 60
Llopart, M., M. Simões Reboita and R. Porfírio da Rocha, 2020: Assessment of multi-model climate projections of 61 water resources over South America CORDEX domain. Climate Dynamics, 54(1), 99-116, doi:10.1007/s00382-62 019-04990-z. 63
ACCEPTED VERSIO
N
SUBJECT TO FIN
AL EDITS
FINAL DRAFT Chapter 12 IPCC WGII Sixth Assessment Report
Do Not Cite, Quote or Distribute 12-148 Total pages: 181
Lluch-Cota, S. E., F. Arreguín-Sánchez, C. J. Salvadeo and P. Del Monte Luna, 2018: Chapter 10: Climate change 1 impacts, vulnerabilities and adaptations: Northeast Tropical Pacific marine fisheries. In: Impacts of climate 2 change on fisheries and aquaculture Synthesis of current knowledge, adaptation and mitigation options [Barange, 3 M., T. Barhi, M. C. M. Beveridge, K. Cochrane, S. Funge-Smith and F. Poulain (eds.)]. Food and Agriculture 4 Organization of the United Nations, Rome, pp. 207-218. 5
Loboguerrero, A. M. et al., 2018: Bridging the gap between climate science and farmers in Colombia. Clim. Risk 6 Manag., 22, 67-81, doi:10.1016/j.crm.2018.08.001. 7
Loboguerrero, A. M. et al., 2019: Food and Earth Systems: Priorities for Climate Change Adaptation and Mitigation for 8 Agriculture and Food Systems. Sustainability, 11(5), doi:10.3390/su11051372. 9
Lobos, T. E. et al., 2018: Regulated deficit irrigation effects on physiological parameters, yield, fruit quality and 10 antioxidants of Vaccinium corymbosum plants cv. Brigitta. Irrigation Science, 36(1), 49-60, doi:10.1007/s00271-11 017-0564-6. 12
Locatelli, B. et al., 2017: Research on climate change policies and rural development in Latin America: Scope and gaps. 13 Sustainability (Switzerland), 9(10), 1-17, doi:10.3390/su9101831. 14
Locatelli, B. et al., 2011: Forests and Climate Change in Latin America: Linking Adaptation and Mitigation. Forests, 15 2(1), doi:10.3390/f2010431. 16
Locatelli, B., C. Pavageau, E. Pramova and M. Di Gregorio, 2015: Integrating climate change mitigation and adaptation 17 in agriculture and forestry: Opportunities and trade-offs. Wiley Interdisciplinary Reviews: Climate Change, 6(6), 18 585-598, doi:10.1002/wcc.357. 19
Locatelli, B. et al., 2020: Climate change policy networks: connecting adaptation and mitigation in multiplex networks 20 in Peru. Climate Policy, 20(3), 354-372, doi:10.1080/14693062.2020.1730153. 21
Løken, I., 2019: Climate-Induced Migration in the Ancash Region in Peru. 22 Long, R. D., A. Charles and R. L. Stephenson, 2015: Key principles of marine ecosystem-based management. Marine 23
Policy, 57, 53-60, doi:10.1016/j.marpol.2015.01.013. 24 Lopes, P. F. M. et al., 2019: The Challenge of Managing Amazonian Small-Scale Fisheries in Brazil. In: Viability and 25
Sustainability of Small-Scale Fisheries in Latin America and The Caribbean [Salas, S., M. J. Barragán-Paladines 26 and R. Chuenpagdee (eds.)]. Springer International Publishing, Cham, pp. 219-241. ISBN 978-3-319-76078-0. 27
López-Álvarez, L., 2016: Malaria sensitivity to climate in Colombia: The importance of data availability, quality and 28 format. In: Climate Services for health: Improving public health decision-making in a new climate - Case studies 29 [Shumake-Guillemot, J. and L. Fernandez-Montoya (eds.)]. World Meteorological Organization and World Health 30 Organization, Geneva, pp. 78-79. 31
López-Feldman, A., 2014: Shocks, Income and Wealth: Do They Affect the Extraction of Natural Resources by Rural 32 Households? World Development, 64, S91-S100, doi:10.1016/j.worlddev.2014.03.012. 33
López-Franca, N. et al., 2016: Changes in temperature extremes for 21st century scenarios over South America derived 34 from a multi-model ensemble of regional climate models. Climate Research, 68, 151-167, doi:10.3354/cr01393. 35
López-García, J., Y. Carvajal-Escobar and A. Enciso-Arango, 2017: Sistemas De Alerta Temprana Con Enfoque 36 Participativo: Un Desafío Para La Gestión Del Riesgo En Colombia. Luna Azul,(44), 231-246, 37 doi:10.17151/luaz.2017.44.14. 38
López Feldman, A. J. and D. Hernández Cortés, 2016: Climate Change and Agriculture: A Review of the Literature 39 with Emphasis on Latin America. Trimest. Econ., 83(332), 459-496, doi:10.20430/ete.v83i332.231. 40
López, M. S. et al., 2021: Dengue emergence in the temperate Argentinian province of Santa Fe, 2009–2020. Scientific 41 Data, 8(1), 134, doi:10.1038/s41597-021-00914-x. 42
Lovejoy, T. E. and C. Nobre, 2018: Amazon Tipping Point. Science Advances, 4(2), eaat2340, 43 doi:10.1126/sciadv.aat2340. 44
Lovino, M. A., O. V. Müller, E. H. Berbery and G. V. Müller, 2018: How have daily climate extremes changed in the 45 recent past over northeastern Argentina? Global and Planetary Change, 168, 78-97, 46 doi:10.1016/j.gloplacha.2018.06.008. 47
Lowe, R. et al., 2013: The development of an early warning system for climate-sensitive disease risk with a focus on 48 dengue epidemics in Southeast Brazil. Statistics in Medicine, 32(5), 864-883, doi:10.1002/sim.5549. 49
Lowe, R. et al., 2014: Dengue outlook for the World Cup in Brazil: an early warning model framework driven by real-50 time seasonal climate forecasts. The Lancet Infectious Diseases, 14(7), 619-626, doi:10.1016/S1473-51 3099(14)70781-9. 52
Lowe, R. et al., 2016: Using climate knowledge to guide dengue prevention and risk communication ahead of Brazil’s 53 2014 FIFA World Cup. [Shumake-Guillemot, J. and L. Fernandez-Montoya (eds.)]. World Meteorological 54 Organization and World Health Organization, Geneva, pp. 218-218. 55
Lowe, R. et al., 2017: Climate services for health: predicting the evolution of the 2016 dengue season in Machala, 56 Ecuador. The Lancet Planetary Health, 1(4), 142-151, doi:10.1016/S2542-5196(17)30064-5. 57
Loyola, R. D. et al., 2014: Clade-specific consequences of climate change to amphibians in Atlantic Forest protected 58 areas. Ecography, 37(1), 65-72, doi:10.1111/j.1600-0587.2013.00396.x. 59
Loyola, R. D. et al., 2012: Severe Loss of Suitable Climatic Conditions for Marsupial Species in Brazil: Challenges and 60 Opportunities for Conservation. PLOS ONE, 7(9), e46257, doi:10.1371/journal.pone.0046257. 61
Lutz, D. A., R. L. Powell and M. R. Silman, 2013: Four decades of Andean timberline migration and implications for 62 biodiversity loss with climate change. PloS one, 8(9), 1-9, doi:10.1371/journal.pone.0074496. 63
ACCEPTED VERSIO
N
SUBJECT TO FIN
AL EDITS
FINAL DRAFT Chapter 12 IPCC WGII Sixth Assessment Report
Do Not Cite, Quote or Distribute 12-149 Total pages: 181
Lyons, W., 2019: Cloud Forests of Costa Rica: Ecosystems in Peril. Weatherwise, 72(3), 32-37, 1 doi:10.1080/00431672.2019.1586505. 2
Lyra, A. et al., 2017: Projections of climate change impacts on central America tropical rainforest. Climatic Change, 3 141(1), 93-105, doi:10.1007/s10584-016-1790-2. 4
Macedo, M. N. et al., 2012: Decoupling of deforestation and soy production in the southern Amazon during the late 5 2000s. Proceedings of the National Academy of Sciences, 109(4), 1341-1346, doi:10.1073/pnas.1111374109. 6
Machado-Silva, F. et al., 2020: Drought and fires influence the respiratory diseases hospitalizations in the Amazon. 7 Ecological Indicators, 109, 105817, doi:10.1016/j.ecolind.2019.105817. 8
Machin, A. B., L. F. Nascimento, K. Mantovani and E. B. Machin, 2019: Effects of exposure to fine particulate matter 9 in elderly hospitalizations due to respiratory diseases in the South of the Brazilian Amazon. Brazilian Journal of 10 Medical and Biological Research, 52, 1-7, doi:10.1590/1414-431x20188130. 11
Mackey, B. G., J. E. M. Watson, G. Hope and S. Gilmore, 2008: Climate change, biodiversity conservation, and the 12 role of protected areas: An Australian perspective. Biodiversity, 9(3-4), 11-18, 13 doi:10.1080/14888386.2008.9712902. 14
Maeda, E. E. et al., 2015: Disruption of hydroecological equilibrium in southwest Amazon mediated by drought. 15 Geophysical Research Letters, 42(18), 7546-7553, doi:10.1002/2015GL065252. 16
Maezumi, S. Y. et al., 2018a: The legacy of 4,500 years of polyculture agroforestry in the eastern Amazon. Nature 17 Plants, 4(8), 540-547, doi:10.1038/s41477-018-0205-y. 18
Maezumi, S. Y. et al., 2018b: New insights from pre-Columbian land use and fire management in Amazonian dark 19 earth forests. Frontiers in Ecology and Evolution, doi:10.3389/fevo.2018.00111. 20
Magalhães, H. F., I. S. Feitosa, E. de Lima Araújo and U. P. Albuquerque, 2021: Perceptions of Risks Related to 21 Climate Change in Agroecosystems in a Semi-arid Region of Brazil. Human Ecology, doi:10.1007/s10745-021-22 00247-8. 23
Magni, G., 2017: Indigenous knowledge and implications for the sustainable development agenda. European Journal of 24 Education, 52(4), 437-447, doi:10.1111/ejed.12238. 25
Magoni, M. and C. M. Munoz, 2018: Climate Change and Heat Waves in Colombia. Possible Effects and Adaptation 26 Strategies. In: Sustainable Urban Development and Globalization: New strategies for new challenges—with a 27 focus on the Global South [Petrillo, A. and P. Bellaviti (eds.)]. Springer International Publishing, Cham, pp. 351-28 361. ISBN 978-3-319-61988-0. 29
Magrin, G. O. et al., 2014: Central and South America. In: Climate Change 2014: Impacts, Adaptation, and 30 Vulnerability. Part B: Regional Aspects. Contribution of Working Group II to the Fifth Assessment Report of the 31 Intergovernmental Panel of Climate Change [Barros, V. R., C. B. Field, D. J. Dokken, M. D. Mastrandrea, K. J. 32 Mach, T. E. Bilir, M. Chatterjee, K. L. Ebi, Y. O. Estrada, R. C. Genova, B. Girma, E. S. Kissel, A. N. Levy, S. 33 MacCracken, P. R. Mastrandrea and L. L. White (eds.)]. Cambridge University Press, Cambridge, United 34 Kingdom and New York, NY, USA, pp. 1499-1566. ISBN 9781107058163. 35
Mahlknecht, J., R. González-Bravo and F. J. Loge, 2020: Water-energy-food security: A Nexus perspective of the 36 current situation in Latin America and the Caribbean. Energy, 194, 116824, doi:10.1016/j.energy.2019.116824. 37
Mahon, R. et al., 2019: Fit for purpose? Transforming National Meteorological and Hydrological Services into National 38 Climate Service Centers. Climate Services, 13, 14-23, doi:10.1016/j.cliser.2019.01.002. 39
Malhado, A. C. M., G. F. Pires and M. H. Costa, 2010: Cerrado conservation is essential to protect the Amazon 40 rainforest. Ambio, 39(8), 580-584, doi:10.1007/s13280-010-0084-6. 41
Malizia, A. et al., 2020: Elevation and latitude drives structure and tree species composition in Andean forests: Results 42 from a large-scale plot network. PLOS ONE, 15(4), e0231553, doi:10.1371/journal.pone.0231553. 43
Malmros, J. K. et al., 2018: Snow cover and snow albedo changes in the central Andes of Chile and Argentina from 44 daily MODIS observations (2000–2016). Remote Sensing of Environment, 209, 240-252, 45 doi:10.1016/j.rse.2018.02.072. 46
Manchego, C. E. et al., 2017: Climate change versus deforestation: Implications for tree species distribution in the dry 47 forests of southern Ecuador. PLOS ONE, 12(12), e0190092, doi:10.1371/journal.pone.0190092. 48
Manes, S. et al., 2021: Endemism increases species' climate change risk in areas of global biodiversity importance. 49 Biological Conservation, 257, 109070, doi:10.1016/j.biocon.2021.109070. 50
Mangone, G., 2016: Constructing hybrid infrastructure: Exploring the potential ecological, social, and economic 51 benefits of integrating municipal infrastructure into constructed environments. Cities, 55, 165-179, 52 doi:10.1016/j.cities.2016.04.004. 53
Mansourian, S., 2017: Governance and forest landscape restoration: A framework to support decision-making. Journal 54 for Nature Conservation, 37, 21-30, doi:10.1016/j.jnc.2017.02.010. 55
Mansourian, S., A. Belokurov and P. J. Stephenson, 2009: The role of forest protected areas in adaptation to climate 56 change. In: Adapting to climate change [Nations, F. a. A. O. o. t. U. (ed.)]. Unasylva No. 231/232, Rome, pp. 63-57 69. 58
Mansur, A. V. et al., 2016: An assessment of urban vulnerability in the Amazon Delta and Estuary: a multi-criterion 59 index of flood exposure, socio-economic conditions and infrastructure. Sustainability Science, 11(4), 625-643, 60 doi:10.1007/s11625-016-0355-7. 61
Mantyka-Pringle, C. S. et al., 2015: Climate change modifies risk of global biodiversity loss due to land-cover change. 62 Biological Conservation, 187, 103-111, doi:10.1016/j.biocon.2015.04.016. 63
ACCEPTED VERSIO
N
SUBJECT TO FIN
AL EDITS
FINAL DRAFT Chapter 12 IPCC WGII Sixth Assessment Report
Do Not Cite, Quote or Distribute 12-150 Total pages: 181
Marcovitch, J., S. Margulis and C. B. S. Dubeux, 2010: Economia da Mudança do Clima no Brasil: Custos e 1 Oportunidades. Ibep, G., São Paulo, 82 pp. Available at: 2 http://www.colit.pr.gov.br/arquivos/File/Publicacoes/Economia_do_clima.pdf (accessed 27/09/2019). 3
Marengo, J. A. et al., 2020a: Trends in extreme rainfall and hydrogeometeorological disasters in the Metropolitan Area 4 of São Paulo: a review. Annals of the New York Academy of Sciences, 1472(1), 5-20, doi:10.1111/nyas.14307. 5
Marengo, J. A., L. M. Alves and R. R. Torres, 2016: Regional climate change scenarios in the Brazilian Pantanal 6 watershed. Clim Res, 68, 201-213, doi:10.3354/cr01324. 7
Marengo, J. A. et al., 2020b: Changing Trends in Rainfall Extremes in the Metropolitan Area of São Paulo: Causes and 8 Impacts. Frontiers in Climate, 2, 3, doi:10.3389/fclim.2020.00003. 9
Marengo, J. A. and M. Bernasconi, 2015: Regional differences in aridity/drought conditions over Northeast Brazil: 10 present state and future projections. Climatic Change, 129(1-2), 103-115, doi:10.1007/s10584-014-1310-1. 11
Marengo, J. A. et al., 2013: Recent Extremes of Drought and Flooding in Amazonia: Vulnerabilities and Human 12 Adaptation. American Journal of Climate Change, 2(2), 87-96, doi:10.4236/ajcc.2013.22009. 13
Marengo, J. A. et al., 2021: Extreme Drought in the Brazilian Pantanal in 2019–2020: Characterization, Causes, and 14 Impacts. Frontiers in Water, 3(13), doi:10.3389/frwa.2021.639204. 15
Marengo, J. A. et al., 2019: Increase Risk of Drought in the Semiarid Lands of Northeast Brazil Due to Regional 16 Warming above 4 °C. In: Climate Change Risks in Brazil [Nobre, C. A., J. A. Marengo and W. R. Soares (eds.)]. 17 Springer International Publishing, Cham, pp. 181-200. ISBN 978-3-319-92881-4. 18
Marengo, J. A. et al., 2020c: Assessing drought in the drylands of northeast Brazil under regional warming exceeding 19 4 °C. Natural Hazards, 103(2), 2589-2611, doi:10.1007/s11069-020-04097-3. 20
Marengo, J. A. and J. C. Espinoza, 2016: Extreme seasonal droughts and floods in Amazonia: Causes, trends and 21 impacts. International Journal of Climatology, 36(3), 1033-1050, doi:10.1002/joc.4420. 22
Marengo, J. A. et al., 2020d: Central South America. In: State of the Climate in 2019. American Meteorological 23 Society, pp. S344-S346. 24
Marengo, J. A. et al., 2018: Changes in Climate and Land Use Over the Amazon Region: Current and Future Variability 25 and Trends. Frontiers in Earth Science, 6, 1-21, doi:10.3389/feart.2018.00228. 26
Marengo, J. A., R. R. Torres and L. M. Alves, 2017: Drought in Northeast Brazil—past, present, and future. Theoretical 27 and Applied Climatology, 129(3), 1189-1200, doi:10.1007/s00704-016-1840-8. 28
Maretti, C. C. et al., 2019: Marine and coastal protected and conserved areas strategy in Brazil: Context, lessons, 29 challenges, finance, participation, new management models, and first results. Aquatic Conservation: Marine and 30 Freshwater Ecosystems, 29(S2), 44-70, doi:10.1002/aqc.3169. 31
Mariano, D. A. et al., 2018: Use of remote sensing indicators to assess effects of drought and human-induced land 32 degradation on ecosystem health in Northeastern Brazil. Remote Sensing of Environment, 213, 129-143, 33 doi:10.1016/j.rse.2018.04.048. 34
Mariano Gutiérrez, T., P. Jorge Castillo, B. Laura Naranjo and M. J. Akester, 2017: Current state of goods, services and 35 governance of the Humboldt Current Large Marine Ecosystem in the context of climate change. Environmental 36 Development, 22, 175-190, doi:10.1016/j.envdev.2017.02.006. 37
Marín, A., 2019: Adaptive Capacity to Coastal Disasters: Challenges and Lessons from Small-Scale Fishing 38 Communities in Central-Southern Chile. In: Viability and Sustainability of Small-Scale Fisheries in Latin America 39 and The Caribbean [Salas, S., M. J. Barragán-Paladines and R. Chuenpagdee (eds.)]. Springer International 40 Publishing, Cham, pp. 51-78. ISBN 978-3-319-76078-0. 41
Marinho, D. P. and H. V. d. O. Silva, 2018: Relatório do Projeto Construção de Indicadores de Vulnerabilidade da 42 População como Insumo para a Elaboração das Ações de Adaptação à Mudança do Clima no Brasil: Volume: 43 Pernambuco. Fundação Oswaldo Cruz, Ministério do Meio Ambiente e Fundo Nacional sobre Mudança do Clima 44 FIOCRUZ, Rio de Janeiro, RJ, 123 pp. Available at: 45 https://www.mma.gov.br/images/arquivo/80182/Vulnerabilidade%20%C3%A0%20Mudan%C3%A7a%20do%2046 Clima/Relat%C3%B3rio_Final_Pernambuco_Novo.pdf (accessed 11/10/2020). 47
Mark, B. G. et al., 2017: Glacier loss and hydro-social risks in the Peruvian Andes. Global and Planetary Change, 159, 48 61-76, doi:10.1016/j.gloplacha.2017.10.003. 49
Marques Di Giulio, G., A. M. Bedran-Martins, M. d. P. Vasconcellos and W. Costa Ribeiro, 2017: Mudanças 50 climáticas, riscos e adaptação na megacidade de São Paulo, Brasil. Sustainability in Debate/Sustentabilidade em 51 Debate, 8(2), 75-87, doi:doi:10.18472/SustDeb.v8n2.2017.19868. 52
Marques, T. H. N., D. Rizzi, P. R. M. Pellegrino and N. C. B. Moura, 2018: Jaguaré Project: Requalification of urban 53 hydrographic basins methodology. Revista LABVERDE, 9(1), 12-27, doi:10.11606/issn.2179-2275.v9i1p12-27. 54
Martin, C., G. Campillo, H. Meirovich and J. Navarrete, 2013: Climate Change Mitigation & Adaptation through 55 Publically-Assisted Housing: Theoretical Framework for the IDB's Regional Policy Dialogue on Climate Change. 56 Inter-American Development Bank, United States, North America, 56 pp. Available at: 57 https://publications.iadb.org/publications/english/document/Climate-Change-Mitigation--Adaptation-through-58 Publically-Assisted-Housing-Theoretical-Framework-for-the-IDB-Regional-Policy-Dialogue-on-Climate-59 Change.pdf (accessed 17/10/2020). 60
Martínez-Alier, J. et al., 2018: Blockadia: movimientos de base contra los combustibles fósiles y a favor de la justicia 61 climática. Anuario Internacional CIDOB, 41-49. 62
ACCEPTED VERSIO
N
SUBJECT TO FIN
AL EDITS
FINAL DRAFT Chapter 12 IPCC WGII Sixth Assessment Report
Do Not Cite, Quote or Distribute 12-151 Total pages: 181
Martinez-Harms, M. J., H. Caceres, D. Biggs and H. P. Possingham, 2017: After Chile's fires, reforest private land. 1 Science, 356(6334), 147-148, doi:10.1126/science.aan0701. 2
Martínez, C. et al., 2018: Coastal erosion in central Chile: A new hazard? Ocean and Coastal Management, 156, 141-3 155, doi:10.1016/j.ocecoaman.2017.07.011. 4
Martínez, R. et al., 2017: Evolución, vulnerabilidad e impactos económicos y sociales de El Niño 2015-2016 en 5 América Latina. Investigaciones Geográficas,(68), 65-78, doi:10.14198/INGEO2017.68.0. 6
Martins, A. C., D. P. Silva, P. De Marco and G. A. R. Melo, 2015: Species conservation under future climate change: 7 the case of Bombusbellicosus, a potentially threatened South American bumblebee species. Journal of Insect 8 Conservation, 19(1), 33-43, doi:10.1007/s10841-014-9740-7. 9
Martins, I. M. and M. A. Gasalla, 2018: Perceptions of climate and ocean change impacting the resources and 10 livelihood of small-scale fishers in the South Brazil Bight. Climatic Change, 147(3), 441-456, 11 doi:10.1007/s10584-018-2144-z. 12
Martins, K. A., P. d. Souza Pereira, R. Silva-Casarín and A. V. Nogueira Neto, 2017: The Influence of Climate Change 13 on Coastal Erosion Vulnerability in Northeast Brazil. Coastal Engineering Journal, 59(2), 1740007-1740001-14 1740007-1740025, doi:10.1142/S0578563417400071. 15
Martins, M. A., J. Tomasella and C. G. Dias, 2019: Maize yield under a changing climate in the Brazilian Northeast: 16 Impacts and adaptation. Agric. Water Manage., 216, 339-350, doi:10.1016/j.agwat.2019.02.011. 17
Masiokas, M. H. et al., 2020: A Review of the Current State and Recent Changes of the Andean Cryosphere. Frontiers 18 in Earth Science, 8, 99. 19
Matera, J., 2016: Livelihood diversification and institutional (dis-)trust: Artisanal fishing communities under resource 20 management programs in Providencia and Santa Catalina, Colombia. Marine Policy, 67, 22-29, 21 doi:10.1016/j.marpol.2016.01.021. 22
Mathez-Stiefel, S.-L. et al., 2017: Research Priorities for the Conservation and Sustainable Governance of Andean 23 Forest Landscapes. Mountain Research and Development, 37(3), 323-339, doi:10.1659/MRD-JOURNAL-D-16-24 00093.1. 25
Matoso, S. C. G., P. G. S. Wadt, V. S. De Souza Júnior and X. L. O. Pérez, 2019: Synthesis of enriched biochar as a 26 vehicle for phosphorus in tropical soils. Acta Amazonica, 49(4), 268-276, doi:10.1590/1809-4392201803852. 27
Mattar, S., V. Morales, A. Cassab and A. J. Rodríguez-Morales, 2013: Effect of climate variables on dengue incidence 28 in a tropical Caribbean municipality of Colombia, Cerete, 2003–2008. International Journal of Infectious 29 Diseases, 17(5), e358-e359, doi:10.1016/j.ijid.2012.11.021. 30
Matus C, P. and M. Oyarzún G, 2019: Impact of Particulate Matter (PM2,5) and children’s hospitalizations for 31 respiratory diseases. A case cross-over study. Revista Chilena de Pediatría, 90(2), 166-174, 32 doi:10.32641/rchped.v90i2.750. 33
Maurer, E. P., N. Roby, I. T. Stewart-Frey and C. M. Bacon, 2017: Projected twenty-first-century changes in the 34 Central American mid-summer drought using statistically downscaled climate projections. Regional 35 Environmental Change, 17(8), 2421-2432, doi:10.1007/s10113-017-1177-6. 36
Mbow, C. et al., 2019: Food Security. In: Climate Change and Land. An IPCC Special Report on climate change, 37 desertification, land degradation, sustainable land management, food security, and greenhouse gas fluxes in 38 terrestrial ecosystems. In Press. 39
McDonald, A. et al., 2016: Bio-climatic bulletins to forecast dengue vectors in Panama. In: Climate Services for health: 40 Improving public health decision-making in a new climate - Case studies [Shumake-Guillemot, J. and L. 41 Fernandez-Montoya (eds.)]. World Meteorological Organization and World Health Organization, Geneva, pp. 42 132-135. 43
McDowell, G. et al., 2019: Adaptation action and research in glaciated mountain systems: Are they enough to meet the 44 challenge of climate change? Global Environmental Change, 54(September 2018), 19-30, 45 doi:10.1016/j.gloenvcha.2018.10.012. 46
McDowell, G. et al., 2021: Lived experiences of 'peak water' in the high mountains of Nepal and Peru. Climate and 47 Development, 1-14, doi:10.1080/17565529.2021.1913085. 48
McDowell, N. G. et al., 2020: Pervasive shifts in forest dynamics in a changing world. Science, 368(6494), eaaz9463, 49 doi:10.1126/science.aaz9463. 50
McLeman, R., 2019: International migration and climate adaptation in an era of hardening borders. Nature Climate 51 Change, 9(12), 911-918, doi:10.1038/s41558-019-0634-2. 52
McMartin, D. W. et al., 2018: Limitations of Water Resources Infrastructure for Reducing Community Vulnerabilities 53 to Extremes and Uncertainty of Flood and Drought. Environmental Management, 62(6), 1038-1047, 54 doi:10.1007/s00267-018-1104-8. 55
McMichael, A. J., R. E. Woodruff and S. Hales, 2006: Climate change and human health: present and future risks. The 56 Lancet, 367(9513), 859-869, doi:10.1016/S0140-6736(06)68079-3. 57
McNamara, K. E. and L. Buggy, 2017: Community-based climate change adaptation: a review of academic literature. 58 Local Environment, 22(4), 443-460, doi:10.1080/13549839.2016.1216954. 59
McPhearson, T. et al., 2018: Urban Ecosystems and Biodiversity. In: Climate Change and Cities: Second Assessment 60 Report of the Urban Climate Change Research Network [Rosenzweig, C., W. Solecki, P. Romero-Lankao, S. 61 Mehrotra, S. Dhakal and S. Ali Ibrahim (eds.)]. Cambridge University Press, New York, United States of 62 America, pp. 257-318. ISBN 978-1-316-60333-8. 63
ACCEPTED VERSIO
N
SUBJECT TO FIN
AL EDITS
FINAL DRAFT Chapter 12 IPCC WGII Sixth Assessment Report
Do Not Cite, Quote or Distribute 12-152 Total pages: 181
McTarnaghan, S., C. Martín, T. Srini and J. Collazos, 2016: Revisão da literatura sobre habitação na América Latina e 1 no Caribe [Gold, A., M. Suminski and Y. Guzman (eds.)]. Fase I: Iniciativa Global de Pesquisa sobre Habitação, 2 Urban Institute, Habitat for Humanity, Institute, U., 110 pp. Available at: 3 https://www.habitat.org/sites/default/files/Global-Housing-Research-Initiative-PORTUGUESE-FINAL-Oct-4 2016.pdf (accessed 17/10/2020). 5
Medeiros, S. R. M. d., R. G. Carvalho and M. R. C. Pimenta, 2014: A proteção do ecossistema manguezal à luz da 6 lei:12.651/2012: novos desafios para a sustentabilidade dos manguezais do Rio Grande do Norte. Revista 7 Geotemas, 4(2), 59-78. 8
Meerow, S. and J. P. Newell, 2016: Urban resilience for whom, what, when, where, and why? Urban Geography, 40(3), 9 309-329, doi:10.1080/02723638.2016.1206395. 10
Mehrotra, S. et al., 2018: Urban Transportation. In: Climate Change and Cities: Second Assessment Report of the 11 Urban Climate Change Research Network [Rosenzweig, C., W. D. Solecki, P. Romero-Lankao, S. Mehrotra, S. 12 Dhakal and S. Ali Ibrahim (eds.)]. Cambridge University Press, New York, United States of America, pp. 491–13 518. 14
Meier, W. J. H., J. Grießinger, P. Hochreuther and M. H. Braun, 2018: An Updated Multi-Temporal Glacier Inventory 15 for the Patagonian Andes With Changes Between the Little Ice Age and 2016. Frontiers in Earth Science, 6, 62, 16 doi:10.3389/feart.2018.00062. 17
Mejia, A., 2014: Water Scarcity in Latin America and the Caribbean. In: Water for Americs: Challenges and 18 Opportunities [Garrido, A. and M. Shechter (eds.)]. Routledge, Oxford, pp. 1-34. ISBN 9781315774848. 19
Mekonnen, M. M. and A. Y. Hoekstra, 2016: Four billion people facing severe water scarcity. Science Advances, 2(2), 20 e1500323, doi:10.1126/sciadv.1500323. 21
Mekonnen, M. M. et al., 2015: Sustainability, efficiency and equitability of water consumption and pollution in Latin 22 America and the Caribbean. Sustainability, 7(2), 2086-2112, doi:10.3390/su7022086. 23
Meldrum, G. et al., 2018: Climate change and crop diversity: farmers’ perceptions and adaptation on the Bolivian 24 Altiplano. Environment, Development and Sustainability, 20(2), 703-730, doi:10.1007/s10668-016-9906-4. 25
Mellado, C. et al., 2019: Ocean acidification exacerbates the effects of paralytic shellfish toxins on the fitness of the 26 edible mussel Mytilus chilensis. Science of The Total Environment, 653, 455-464, 27 doi:10.1016/j.scitotenv.2018.10.399. 28
Melo, O. and W. Foster, 2021: Agricultural and Forestry Land and Labor Use under Long-Term Climate Change in 29 Chile. Atmosphere, 12(3), doi:10.3390/atmos12030305. 30
Menéndez, C. G., P. G. Zaninelli, A. F. Carril and E. Sánchez, 2016: Hydrological cycle, temperature, and land surface-31 atmosphere interaction in the la Plata Basin during summer: Response to climate change. Climate Research, 68(2-32 3), 231-241, doi:10.3354/cr01373. 33
Menezes, J. A., 2018: Relatório do Projeto Construção de Indicadores de Vulnerabilidade da População como Insumo 34 para a Elaboração das Ações de Adaptação à Mudança do Clima no Brasil: Volume: Amazonas. Fundação 35 Oswaldo Cruz, Ministério do Meio Ambiente e Fundo Nacional sobre Mudança do Clima FIOCRUZ, Rio de 36 Janeiro, RJ, 120 pp. Available at: 37 https://www.mma.gov.br/images/arquivo/80182/Vulnerabilidade%20%C3%A0%20Mudan%C3%A7a%20do%2038 Clima/Relat%C3%B3rio_Final_Amazonas_Novo.pdf (accessed 11/10/2020). 39
Menezes, J. A. et al., 2018: Mapping human vulnerability to climate change in the Brazilian Amazon: The construction 40 of a municipal vulnerability index. PLoS ONE, 13(2), e0190808, doi:10.1371/journal.pone.0190808. 41
Mera, M., X. C. Lizana and D. F. Calderini, 2015: Chapter 6 - Cropping systems in environments with high yield 42 potential of southern Chile. In: Crop Physiology (Second Edition) [Sadras, V. O. and D. F. Calderini (eds.)]. 43 Academic Press, San Diego, pp. 111-140. ISBN 978-0-12-417104-6. 44
Merlinsky, M. G., 2016: Mists of the Riachuelo: River Basins and Climate Change in Buenos Aires. Latin American 45 Perspectives, 43(4), 43-55, doi:10.1177/0094582x15623764. 46
Mesclier, É., M. Piron and P. Gluski, 2015: Territories and Inclusion in the Peripheries of Lima (Peru): An Exploratory 47 Approach Based on Data about Water Supply and Sewage Disposal. L’Espace géographique, 44(3), 273-288. 48
Meseguer-Ruiz, O. et al., 2018: Spatial behaviour of daily observed extreme temperatures in Northern Chile (1966–49 2015): data quality, warming trends, and its orographic and latitudinal effects. Stochastic Environmental Research 50 and Risk Assessment, 32, 3503–3523, doi:10.1007/s00477-018-1557-6. 51
Metropolitan Municipality of Lima, 2014: Ordenanza 1836 - 2014 - MML. Estrategia de Adaptación y Acciones de 52 Mitigación de la provincia de Lima al Cambio Climático, Municipalidad Metropolitana de Lima, Lima, Perú. 53 Available at: http://smia.munlima.gob.pe/normas/detalle/76 (accessed 16/06/2021). 54
Metropolitan Municipality of Lima, 2021: Local Climate Change Plan (Plan Local de Cambio Climático de Lima). 55 Available at: https://www.descubrelima.pe/plan-local-cambio-climatico/#plcc-lima. 56
Metternicht, G., A. Sabelli and J. Spensley, 2014: Climate change vulnerability, impact and adaptation assessment 57 lessons from Latin America. International Journal of Climate Change Strategies and Management, 6(4), 442-476, 58 doi:10.1108/IJCCSM-06-2013-0076. 59
Mettler-Grove, J., 2020: Impactos en la salud pública y desigualdades frente al cambio climático en América Latina: 60 Una aproximación hacia las consecuencias diferenciales de las inundaciones y olas de calor en la Cuenca 61 Matanza Riachuelo./Public health impacts and inequalities in the face of climate change in Latin America: an 62
ACCEPTED VERSIO
N
SUBJECT TO FIN
AL EDITS
FINAL DRAFT Chapter 12 IPCC WGII Sixth Assessment Report
Do Not Cite, Quote or Distribute 12-153 Total pages: 181
approach towards the differential consequences of floods and heat waves in the Matanza Riachuelo watershed. 1 Available at: https://digitalcollections.sit.edu/isp_collection/3304/ (accessed 02/09/2021). 2
Meza, F. J. et al., 2014: Assessing water demands and coverage sensitivity to climate change in the urban and rural 3 sectors in central Chile. Journal of Water and Climate Change, 5(2), 192-203, doi:10.2166/wcc.2014.019. 4
Michelutti, N., C. A. Cooke, W. O. Hobbs and J. P. Smol, 2015: Climate-driven changes in lakes from the Peruvian 5 Andes. Journal of Paleolimnology, 54(1), 153-160, doi:10.1007/s10933-015-9843-5. 6
Miguez, M. G., J. M. Bahiense, O. M. Rezende and A. P. Veról, 2014: Sustainable Urban Drainage Approach, Focusing 7 on LID Techniques, Applied to the Design of New Housing Subdivisions in the Context of a Growing City. 8 International Journal of Sustainable Development and Planning, 9(4), 538-552, doi:10.2495/SDP-V9-N4-538-9 552. 10
Miguez, M. G., O. M. Rezende and A. P. Veról, 2015a: City Growth and Urban Drainage Alternatives: Sustainability 11 Challenge. Journal of Urban Planning and Development, 141(3), 04014026, doi:10.1061/(asce)up.1943-12 5444.0000219. 13
Miguez, M. G., A. P. Veról, M. M. De Sousa and O. M. Rezende, 2015b: Urban Floods in Lowlands—Levee Systems, 14 Unplanned Urban Growth and River Restoration Alternative: A Case Study in Brazil. Sustainability, 7(8), 11068-15 11097, doi:10.3390/su70811068. 16
Milan, A. and R. Ho, 2014: Livelihood and migration patterns at different altitudes in the Central Highlands of Peru. 17 Climate and Development, 6(1), 69-76, doi:10.1080/17565529.2013.826127. 18
Milkoreit, M. et al., 2018: Defining tipping points for social-ecological systems scholarship—an interdisciplinary 19 literature review. Environmental Research Letters, 13(3), 033005, doi:10.1088/1748-9326/aaaa75. 20
Miller, R. et al., 2013a: Climate Change Adaptation Planning in Latin American and Caribbean Cities. Complete 21 Report: Santos, Brazil. ICF GHK, London, 134 pp. Available at: 22 https://www.worldbank.org/en/results/2014/01/31/climate-change-adaptation-planning-in-latin-american-and-23 caribbean-cities (accessed 03/06/2021). 24
Miller, R. et al., 2013b: Climate Change Adaptation Planning in Latin American and Caribbean Cities. Final Report: 25 El Progreso, Honduras. ICF GHK, London, 125 pp. Available at: 26 https://www.worldbank.org/en/results/2014/01/31/climate-change-adaptation-planning-in-latin-american-and-27 caribbean-cities (accessed 03/06/2021). 28
Miller, R. et al., 2013c: Climate Change Adaptation Planning in Latin American and Caribbean Cities. Final report: 29 Estelí, Nicaragua. London, 128 pp. Available at: https://www.worldbank.org/en/results/2014/01/31/climate-30 change-adaptation-planning-in-latin-american-and-caribbean-cities (accessed 03/06/2021). 31
Miller, R. et al., 2013d: Climate Change Adaptation Planning in Latin American and Caribbean Cities. Final report: 32 Cusco, Peru. London, 132 pp. Available at: https://www.worldbank.org/en/results/2014/01/31/climate-change-33 adaptation-planning-in-latin-american-and-caribbean-cities (accessed 03/06/2021). 34
Mills-Novoa, M., R. Boelens, J. Hoogesteger and J. Vos, 2020: Governmentalities, hydrosocial territories & recognition 35 politics: The making of objects and subjects for climate change adaptation in Ecuador. Geoforum, 115, 90-101, 36 doi:10.1016/j.geoforum.2020.06.024. 37
Milner, A. M. et al., 2017: Glacier shrinkage driving global changes in downstream systems. Proceedings of the 38 National Academy of Sciences, 114(37), 9770-9778, doi:10.1073/pnas.1619807114. 39
MINAM Peru, 2016: Supreme Decree N°009-2016. Available at: https://www.minam.gob.pe/wp-40 content/uploads/2016/07/DS_009-2016-MINAM.pdf (accessed 01/09/2021). 41
Ministerio Agropecuario y Forestal de Nicaragua, 2013: Plan de Adaptación a la Variabilidad y el Cambio Climático 42 en el Sector Agropecuario, Forestal y Pesca en Nicaragua, Ministerio Agropecuario y Forestal, Nicaragua, 43 Nicaragua, 131 pp. Available at: https://www.yumpu.com/es/document/read/38160254/plan-de-adaptacion-a-la-44 variabilidad-y-el-cambio-climatico-magfor (accessed 26/10/2020). 45
Ministério da Saúde and FIOCRUZ, Observatório de Clima e Saúde. Available at: https://climaesaude.icict.fiocruz.br/. 46 Ministerio de Ambiente y Desarrollo Sostenible de Colombia, 2016: Plan Nacional de Adaptación al Cambio 47
Climático, Departamento Nacional de Planeación, Ministerio de Ambiente y Desarrollo Sostenible República de 48 Colombia, Colombia, 283 pp. Available at: 49 https://www4.unfccc.int/sites/NAPC/Documents/Parties/Colombia%20NAP%20Spanish.pdf (accessed 50 22/10/2020). 51
Ministerio de Ambiente y Desarrollo Sostenible de la República de Argentina, 2019: Plan Nacional de Adaptación y 52 Mitigación al Cambio Climático de Argentina, Ministerio de Ambiente y Desarrollo Sostenible, R. d. A., 53 Argentina, 153 pp. (accessed 23/10/2020). 54
Ministerio de Ambiente y Energía de la República de Costa Rica, 2018: Política Nacional de Adaptación al Cambio 55 Climático de Costa Rica 2018- 2030, Costa Rica, 84 pp. Available at: https://cambioclimatico.go.cr/wp-56 content/uploads/2017/12/final-politica-adaptacion-24-abril.pdf (accessed 22/10/2020). 57
Ministerio de Economía Fomento y Turismo de Chile, 2015: Plan de Adaptación al Cambio Climático para la Pesca y 58 Acuicultura, Subsecretaria de Pesca y Acuicultura del Ministerio de Economía, Fomento y Turismo Departamento 59 de Cambio Climático Ministerio de Medio Ambiente Chile, Chile, 39 pp. Available at: https://mma.gob.cl/wp-60 content/uploads/2016/12/Plan-Pesca-y-Acuicultura-CMS.pdf (accessed 21/10/2020). 61
ACCEPTED VERSIO
N
SUBJECT TO FIN
AL EDITS
FINAL DRAFT Chapter 12 IPCC WGII Sixth Assessment Report
Do Not Cite, Quote or Distribute 12-154 Total pages: 181
Ministerio de Medio Ambiente de Chile, 2014a: Plan de Adaptación al Cambio Climático en Biodiversidad, Oficina de 1 Cambio Climático y la División de Recursos Naturales y Biodiversidad del Ministerio de Medio Ambiente, Chile, 2 Chile, 97 pp. Available at: http://metadatos.mma.gob.cl/sinia/PDF008.pdf (accessed 21/10/2020). 3
Ministerio de Medio Ambiente de Chile, 2014b: Plan Nacional de Adaptación al Cambio Climático, Departamento de 4 Cambio Climático del Ministerio de Medio Ambiente, Chile, Chile, 80 pp. Available at: https://mma.gob.cl/wp-5 content/uploads/2016/02/Plan-Nacional-Adaptacion-Cambio-Climatico-version-final.pdf (accessed 21/10/2020). 6
Ministerio de Medio Ambiente de Chile, 2017: Plan de Adaptación y Mitigación de los Servicios de Infraestructura al 7 Cambio Climático, Ministerio de Obras Públicas y Ministerio de Medio Ambiente, Chile, Chile, 126 pp. Available 8 at: http://www.dgop.cl/Documents/PlanAccionMop.pdf (accessed 21/10/2020). 9
Ministerio de Medio Ambiente de Chile, 2019: Resumen ejecutivo, en “Determinación del riesgo de los impactos del 10 Cambio Climático en las costas de Chile”, Ministerio de Medio Ambiente de Chile, Santiago de Chile, Chile, 94 11 pp. Available at: https://cambioclimatico.mma.gob.cl/wp-content/uploads/2020/04/2019-09-23-Informe-V00-12 CCCostas-Resumen-Ejecutivo-Rev1.pdf (accessed 10/03/2020). 13
Ministerio de Medio Ambiente y Recursos Naturales de El Salvador, 2015: Plan Nacional de Cambio Climático del 14 Salvador, Gobierno el Salvador, Ministerio de Medio Ambiente y Recursos Naturales, El Salvador, 70 pp. 15 Available at: 16 http://www.cac.int/sites/default/files/Plan_Nacional_de_Cambio_Clim%C3%A1tico._MARN._2015.pdf 17 (accessed 22/10/2020). 18
Ministerio de Salud de Chile, 2017: Plan de Adaptación al Cambio Climático Sector Salud, Ministerio de Salud, 19 División de Cambio Climático del Ministerio de Medio Ambiente Chile, 34 pp. Available at: 20 https://degreyd.minsal.cl/wp-content/uploads/2018/07/Plan-de-adaptacio%CC%81n-al-cambio-21 clima%CC%81tico-para-salud-2016.pdf (accessed 16/06/2021). 22
Ministerio de Seguridad de Argentina, 2018: Plan Nacional para la Reducción del Riesgo de Desastres de Argentina 23 2018-2013. 106 pp. Available at: http://www.senado.gov.ar/upload/26448.pdf (accessed 16/06/2021). 24
Ministerio de Vivienda, C. y. S. d. P., 2017: Supreme Decree 019–2017-Vivienda, Peru. Available at: 25 https://www.minam.gob.pe/wp-content/uploads/2017/07/DS-019-2017-VIVIENDA-1.pdf (accessed 01/09/2021). 26
Ministerio de Vivienda Ordenamiento Territorial y Medio Ambiente de la República de Uruguay, 2010: Plan Nacional 27 de Respuesta al Cambio Climático, Ministerio de Vivienda, Ordenamiento Territorial y Medio Ambiente 28 República de Uruguay, Montevideo, Uruguay, 101 pp. Available at: https://www.gub.uy/ministerio-29 ambiente/politicas-y-gestion/planes/plan-nacional-respuesta-cambio-climatico (accessed 23/10/2020). 30
Ministerio del Ambiente Gobierno del Perú, 2021: Plan Nacional de Adaptación al Cambio Climático del Perú: un 31 insumo para la actualización de la Estrategia Nacional ante el Cambio Climático. Ministerio del Ambiente del 32 Perú, Peru, 615 pp. 33
Ministry of Environment and Natural Resources of El Salvador, 2013: Síntesis de la evaluación de necesidades 34 tecnológicas (ENT) y Plan de acción para la transferencia de tecnologías priorizadas en adaptación al cambio 35 climático, El Salvador. San Salvador, 191-191 pp. Available at: 36 https://unfccc.int/ttclear/misc_/StaticFiles/gnwoerk_static/TNR_CRE/e9067c6e3b97459989b2196f12155ad5/8f4c37 345c13974d21ae4d4d2f5f39b04e.pdf (accessed 16/06/2021). 38
Ministry of Environment of Brazil, 2016a: National Adaptation Plan to Climate Change. Genenal Strategy (volume 1), 39 1, Ministry of Environment of Brazil, Brazil, 310 pp. Available at: 40 https://www4.unfccc.int/sites/NAPC/Documents/Parties/Brazil%20NAP%20English.pdf (accessed 21/10/2020). 41
Ministry of Environment of Brazil, 2016b: National Adaptation Plan to Climate Change. Sectoral and Thematic 42 Strategies. Volume 2, Ministry of Environment, Brazil, Brazil, 264 pp. Available at: 43 https://www.mma.gov.br/images/arquivo/80182/BOOK_PNA_Volume%20II%20v4.pdf (accessed 21/10/2020). 44
Ministry of Health Costa Rica, 2016: Plan Nacional de Salud 2016-2020, Ministry of Health of Costa Rica, 209 pp. 45 Available at: https://www.ministeriodesalud.go.cr/index.php/biblioteca-de-archivos/sobre-el-ministerio/politcas-y-46 planes-en-salud/planes-en-salud/964-plan-nacional-de-salud-2016-2020/file (accessed 01/11/2020). 47
Ministry of Health of Chile and Ministry of Environment of Chile, 2016: Plan de Adaptación al Cambio Climático del 48 Sector Salud. Santiago de Chile, 50 pp. Available at: http://portal.mma.gob.cl/wp-content/uploads/2017/02/Plan-49 de-Adaptacion-al-CC-para-Salud-Version-Final.pdf (accessed 16/06/2021). 50
Ministry of Health of El Salvador, 2017: Plan nacional de gestión de riesgos a desastres de El Salvador. San Salvador, 51 120-120 pp. Available at: http://asp.salud.gob.sv/regulacion/pdf/planes/plan_gestion_de_riesgos_desastres_v1.pdf 52 (accessed 2019/9/30). 53
Miranda Sara, L. and I. Baud, 2014: Knowledge-building in adaptation management: concertación processes in 54 transforming Lima water and climate change governance. Environment and Urbanization, 26(2), 505-524, 55 doi:10.1177/0956247814539231. 56
Miranda Sara, L., S. Jameson, K. Pfeffer and I. Baud, 2016: Risk perception: The social construction of spatial 57 knowledge around climate change-related scenarios in Lima. Habitat International, 54, 136-149, 58 doi:10.1016/j.habitatint.2015.12.025. 59
Miranda Sara, L., K. Pfeffer and I. Baud, 2017: Unfolding Urban Geographies of Water-Related Vulnerability and 60 Inequalities: Recognising Risks in Knowledge Building in Lima, Peru. In: Urban Water Trajectories [Bell, S., A. 61 Allen, P. Hofmann and T.-H. Teh (eds.)]. Springer International Publishing, Cham, pp. 81-98. ISBN 978-3-319-62 42686-0. 63
ACCEPTED VERSIO
N
SUBJECT TO FIN
AL EDITS
FINAL DRAFT Chapter 12 IPCC WGII Sixth Assessment Report
Do Not Cite, Quote or Distribute 12-155 Total pages: 181
Miranda Sara, L. R., 2021: Knowledge building in configuring metropolitan water governance: Water-related climate 1 risk scenarios, governance networks, concertacion processes and territorialities in Lima, Peru. University of 2 Amsterdam, Lima, Peru, 200 pp. 3
Mirzabaev, A. et al., 2019: Desertification. In: Climate Change and Land. An IPCC Special Report on climate change, 4 desertification, land degradation, sustainable land management, food security, and greenhouse gas fluxes in 5 terrestrial ecosystems. In Press. 6
Mishra, V., A. R. Ganguly, B. Nijssen and D. P. Lettenmaier, 2015: Changes in observed climate extremes in global 7 urban areas. Environmental Research Letters, 10(2), 024005, doi:10.1088/1748-9326/10/2/024005. 8
Mistry, J., B. A. Bilbao and A. Berardi, 2016: Community owned solutions for fire management in tropical ecosystems: 9 Case studies from Indigenous communities of South America. Philosophical Transactions of the Royal Society B: 10 Biological Sciences, 371(1696), 20150174, doi:10.1098/rstb.2015.0174. 11
MML, 2021: Ordenanza N° 2353-2021, Lima, Peru. Available at: 12 https://busquedas.elperuano.pe/normaslegales/ordenanza-que-declara-de-interes-metropolitano-el-desarrollo-13 ordenanza-no-2353-1960260-2/. 14
Modernel, P. et al., 2019: Grazing management for more resilient mixed livestock farming systems on native grasslands 15 of southern South America. Grass and Forage Science, 74(4), 636-649, doi:10.1111/gfs.12445. 16
Modernel, P. et al., 2016: Land use change and ecosystem service provision in Pampas and Campos grasslands of 17 southern South America. Environmental Research Letters, 11(11), 113002, doi:10.1088/1748-9326/11/11/113002. 18
Mohan, D. et al., 2018: Biochar production and applications in soil fertility and carbon sequestration-a sustainable 19 solution to crop-residue burning in India. RSC Advances, 8(1), 508-520, doi:10.1039/c7ra10353k. 20
Mohor, G. S., D. A. Rodriguez, J. Tomasella and J. L. Siqueira Júnior, 2015: Exploratory analyses for the assessment of 21 climate change impacts on the energy production in an Amazon run-of-river hydropower plant. Journal of 22 Hydrology: Regional Studies, 4, 41-59, doi:10.1016/j.ejrh.2015.04.003. 23
Molina-Carpio, J. et al., 2017: Hydroclimatology of the Upper Madeira River basin: spatio-temporal variability and 24 trends. Hydrological Sciences Journal, 62(6), 911-927, doi:10.1080/02626667.2016.1267861. 25
Molina, O., T. T. Luong and C. Bernhofer, 2020: Projected Changes in the Water Budget for Eastern Colombia Due to 26 Climate Change. Water, 12(1), 65, doi:10.3390/w12010065. 27
Molina, R. D. et al., 2019: Forest-Induced Exponential Growth of Precipitation Along Climatological Wind Streamlines 28 Over the Amazon. Journal of Geophysical Research: Atmospheres, 124(5), 2589-2599, 29 doi:10.1029/2018JD029534. 30
Moline, E. F. d. V. and E. L. M. Coutinho, 2015: Atributos químicos de solos da Amazônia Ocidental após sucessão da 31 mata nativa em áreas de cultivo. Revista de Ciências Agrarias - Amazon Journal of Agricultural and 32 Environmental Sciences, 58(1), 14-20, doi:10.4322/rca.1683. 33
Monsalves-Gavilán, P., J. Pincheira-Ulbrich and F. Rojo Mendoza, 2013: Climate change and its effects on urban 34 spaces in Chile: A summary of research carried out in the period 2000-2012. Atmósfera, 26(4), 547-566, 35 doi:10.1016/S0187-6236(13)71095-6. 36
Montalba, R. et al., 2015: Determinación de los niveles de riesgo socioecológico ante sequías en sistemas agrícolas 37 campesinos de La Araucanía chilena. Influencia de la diversidad cultural y la agrobiodiversidad. Papers. Revista 38 de Sociologia: Riesgos ambientales, sostenibilidad y políticas de implicación ciudadana, 100, 607-624, 39 doi:10.5565/rev/papers.2168. 40
Montero, N. et al., 2018: Warmer and wetter conditions will reduce offspring production of hawksbill turtles in Brazil 41 under climate change. PLOS ONE, 13(11), e0204188, doi:10.1371/journal.pone.0204188. 42
Montoya, E. et al., 2020: Human Contribution to Amazonian Plant Diversity: Legacy of Pre-Columbian Land Use in 43 Modern Plant Communities. In: Neotropical Diversification: Patterns and Processes [Rull, V. and A. C. Carnaval 44 (eds.)]. Springer International Publishing, Cham, pp. 495-520. ISBN 978-3-030-31167-4. 45
Mora, D. E. et al., 2014: Climate changes of hydrometeorological and hydrological extremes in the Paute basin, 46 Ecuadorean Andes. Hydrology and Earth System Sciences, 18(2), 631-648, doi:10.5194/hess-18-631-2014. 47
Moragues, S. et al., 2019: Slope instability analysis in South Patagonia applying multivariate and bivariate techniques 48 on Landsat images during 2001–2015 period. CATENA, 174, 339-352, doi:10.1016/J.CATENA.2018.11.024. 49
Morales-Yokobori, M. L. (ed.), Contribution to the Understanding of Rainfalls Occurring in Buenos Aires City 50 (Argentina) Between 1960 and 2018. Recent Advances in Environmental Science from the Euro-Mediterranean 51 and Surrounding Regions (2nd Edition), Cham, Springer International Publishing, 949-955 pp. ISBN 978-3-030-52 51210-1. 53
Moreno, D., É. Quiñones and L. C. Tovar, 2014: Los Sistemas de Alerta Temprana, SAT, una herramienta para la 54 prevención de desastres por inundación y efectos del cambio climático. Ciencias e Ingeniería al Día, Revista 55 Institucional de la Facultad de Ingeniería, Universidad de Cartagena, 9(1), 1-18. 56
Moreno, J. M. et al., 2020a: Resumen para Responsables de Políticas. Adaptación frente a los riesgos del cambio 57 climático en los países iberoamericanos – Informe RIOCCADAPT. Madrid, Spain, 60 pp. Available at: 58 http://rioccadapt.com/wp-content/uploads/00B_ResumenCambioClimatico.pdf (accessed 09/08/2021). 59
Moreno, J. M. et al., 2020b: Adaptation to Climate Change Risks in Ibero-American Countries — RIOCCADAPT 60 Report/Adaptación frente a los riesgos del cambio climático en los países iberoamericanos. Informe 61 RIOCCADAPT. Hill, M., Madrid, España, 676 pp. Available at: http://rioccadapt.com/wp-62 content/uploads/RIOCCADAPT-REPORT.pdf (accessed 28/08/2021). 63
ACCEPTED VERSIO
N
SUBJECT TO FIN
AL EDITS
FINAL DRAFT Chapter 12 IPCC WGII Sixth Assessment Report
Do Not Cite, Quote or Distribute 12-156 Total pages: 181
Morera, S. B. et al., 2017: The impact of extreme El Niño events on modern sediment transport along the western 1 Peruvian Andes (1968–2012). Scientific Reports, 7(1), 11947-11947, doi:10.1038/s41598-017-12220-x. 2
Moret, P., M. d. l. Á. Aráuz, M. Gobbi and Á. Barragán, 2016: Climate warming effects in the tropical Andes: first 3 evidence for upslope shifts of Carabidae (Coleoptera) in Ecuador. Insect Conservation and Diversity, 9(4), 342-4 350, doi:10.1111/icad.12173. 5
Moret, P. et al., 2020: When the Ice Has Gone: Colonisation of Equatorial Glacier Forelands by Ground Beetles 6 (Coleoptera: Carabidae). Neotropical Entomology, 49(2), 213-226, doi:10.1007/s13744-019-00753-x. 7
Morueta-Holme, N. et al., 2015: Strong upslope shifts in Chimborazo's vegetation over two centuries since Humboldt. 8 Proceedings of the National Academy of Sciences, 112(41), 12741-12745, doi:10.1073/pnas.1509938112. 9
Moser-Reischl, A. et al., 2019: Growth patterns and effects of urban micro-climate on two physiologically contrasting 10 urban tree species. Landscape and Urban Planning, 183, 88-99, doi:10.1016/j.landurbplan.2018.11.004. 11
Motschmann, A. et al., 2020a: Losses and damages connected to glacier retreat in the Cordillera Blanca, Peru. Climatic 12 Change, 162(2), 837-858, doi:10.1007/s10584-020-02770-x. 13
Motschmann, A., C. Huggel, R. Muñoz and A. Thür, 2020b: Towards integrated assessments of water risks in 14 deglaciating mountain areas: water scarcity and GLOF risk in the Peruvian Andes. Geoenvironmental Disasters, 15 7(26), 1–18, doi:10.1186/s40677-020-00159-7. 16
Moulton, H., M. Carey, C. Huggel and A. Motschmann, 2021: Narratives of ice loss: New approaches to shrinking 17 glaciers and climate change adaptation. Geoforum, 125, 47-56, doi:10.1016/j.geoforum.2021.06.011. 18
Moura, R. L. et al., 2013: Spatial patterns of benthic megahabitats and conservation planning in the Abrolhos Bank. 19 Continental Shelf Research, 70, 109-117, doi:10.1016/j.csr.2013.04.036. 20
Muehe, D., 2010: Brazilian coastal vulnerability to climate change. Pan-American Journal of Aquatic Sciences, 5(2), 21 173-183. 22
Muis, S. et al., 2018: Influence of El Niño-Southern Oscillation on Global Coastal Flooding. Earth's Future, 6(9), 1311-23 1322, doi:10.1029/2018EF000909. 24
Muis, S. et al., 2019: Spatiotemporal patterns of extreme sea levels along the western North-Atlantic coasts. Scientific 25 Reports, 9(1), 1-12, doi:10.1038/s41598-019-40157-w. 26
Müller-Hansen, F. et al., 2019: Can Intensification of Cattle Ranching Reduce Deforestation in the Amazon? Insights 27 From an Agent-based Social-Ecological Model. Ecological Economics, 159, 198-211, 28 doi:10.1016/j.ecolecon.2018.12.025. 29
Müller, A. and R. Höfer, 2014: The Impacts of Climate and Land-Use Change on Flood and Heat Hazards. In: Climate 30 Adaptation Santiago [Krellenberg, K. and B. Hansjürgens (eds.)]. Springer Berlin Heidelberg, Berlin, Heidelberg, 31 pp. 107-126. ISBN 978-3-642-39103-3. 32
Mundo, I. A. et al., 2010: Austrocedrus chilensis growth decline in relation to drought events in northern Patagonia, 33 Argentina. Trees, 24(3), 561-570, doi:10.1007/s00468-010-0427-8. 34
Municipalidad de Lima, 2021: Plan Local de Cambio Climático de la Provincia de Lima 2021-2030, Lima, Peru. 35 Available at: https://www.descubrelima.pe/plan-local-cambio-climatico/ (accessed 01/09/2021). 36
Municipalidad de Santiago, Plan de Acción para el Clima y la Energía Sostennible: Estratégias de mitigación y 37 adaptación al cambio climático: 2020-2030. Available at: http://pactodealcaldes-la.eu/pt-br/biblioteca/plan-de-38 accion-climatica-santiago-chile/. 39
Município de Rio de Janeiro, 2019: Decreto Rio n. 45781, de 03 de abril de 2019, Prefeitura deo Rio de Janeiro, Rio de 40 Janeiro, RJ, Brasil. Available at: https://www.rio.rj.gov.br/web/pmus/documentos/-41 /document_library_display/7QYh/view/9477225 (accessed 17/10/2020). 42
Municipio del Distrito Metropolitano de Quito, 2016: Atlas Ambiental Quito sostenible 2016. Municipio de Quito, 43 Quito. 44
Municipio del Distrito Metropolitano de Quito, 2020: Plan de Acción de Cambio Climático de Quito, Quito, Ecuador. 45 Available at: https://www.quitoneutral.com/pacq2020 (accessed 01/09/2021). 46
Muntó, A., 2018: La lucha por la vivienda en una ciudad capitalista. El caso de la cooperativa autogestiva 'El Molino' / 47 The struggle for housing in a capitalist city. The case of self-managed cooperative 'El Molino' / A luta pela 48 habitação em uma cidade capitalista. O caso da cooperativa auto-administrada 'El Molino'. Psicología, 49 Conocimiento y Sociedad, 8(1), 62-85, doi:10.26864/pcs.v8.n1.4. 50
Muñoz-Zanzi, C. et al., 2014: Leptospira Contamination in Household and Environmental Water in Rural Communities 51 in Southern Chile. International Journal of Environmental Research and Public Health, 11(7), 6666-6680, 52 doi:10.3390/ijerph110706666. 53
Muñoz, A. A. et al., 2020a: Water Crisis in Petorca Basin, Chile: The Combined Effects of a Mega-Drought and Water 54 Management. Water, 12(3), doi:10.3390/w12030648. 55
Muñoz, A. A. et al., 2019a: Multidecadal environmental pollution in a mega-industrial area in central Chile registered 56 by tree rings. Science of The Total Environment, 696, 133915, doi:10.1016/j.scitotenv.2019.133915. 57
Muñoz, Á. G. et al., 2020b: AeDES: a next-generation monitoring and forecasting system for environmental suitability 58 of Aedes-borne disease transmission. Scientific Reports, 10(1), 12640, doi:10.1038/s41598-020-69625-4. 59
Muñoz, Á. G. et al. (eds.), Towards a ZIKV Climate-Health Service at the Latin American Observatory. 2016. 60 Muñoz, Á. G. et al., 2017: Could the Recent Zika Epidemic Have Been Predicted? Frontiers in Microbiology, 8(1291), 61
doi:10.3389/fmicb.2017.01291. 62
ACCEPTED VERSIO
N
SUBJECT TO FIN
AL EDITS
FINAL DRAFT Chapter 12 IPCC WGII Sixth Assessment Report
Do Not Cite, Quote or Distribute 12-157 Total pages: 181
Muñoz, E. et al., 2019b: An adaptive basin management rule to improve water allocation resilience under climate 1 variability and change-a case study in the Laja Lake basin in southern Chile. Water, 11(8), 1733, 2 doi:10.3390/w11081733. 3
Murcia, C., M. R. Guariguata, M. Peralvo and V. Gálmez, 2017: La restauración de bosques andinos tropicales: 4 Avances, desafíos y perspectivas del futuro. Center for International Forestry Research (CIFOR), 5 doi:10.17528/cifor/006524. 6
Mussetta, P. and M. J. Barrientos, 2015: Vulnerabilidad de productores rurales de Mendoza ante el Cambio Ambiental 7 Global: clima, agua, economía y sociedad. Revista de la Facultad de Ciencias Agrarias UNCuyo, 47(2), 145-170. 8
Mustonen, T. et al., 2021: 2021 Compendium of Indigenous Knowledge and Local Knowledge: Towards Inclusion of 9 Indigenous Knowledge and Local Knowledge in Global Reports on Climate Change. Snowchange Cooperative, 10 Snowchange Cooperative, Kontiolahti, Finland, 38 pp. Available at: http://www.snowchange.org/pages/wp-11 content/uploads/2021/06/Raportti_150ppi.pdf (accessed 30/06/2021). 12
Mycoo, M. A., 2014: Autonomous household responses and urban governance capacity building for climate change 13 adaptation: Georgetown, Guyana. Urban Climate, 9, 134-154, doi:10.1016/j.uclim.2014.07.009. 14
Nabout, J. C., M. R. Magalhães, M. A. de Amorim Gomes and H. F. da Cunha, 2016: The Impact of Global Climate 15 Change on the Geographic Distribution and Sustainable Harvest of Hancornia speciosa Gomes (Apocynaceae) in 16 Brazil. Environmental Management, 57(4), 814-821, doi:10.1007/s00267-016-0659-5. 17
Nagy, G. J. et al., 2018: An Assessment of the Relationships between Extreme Weather Events, Vulnerability, and the 18 Impacts on Human Wellbeing in Latin America. International Journal of Environmental Research and Public 19 Health, 15(9), 1802, doi:10.3390/ijerph15091802. 20
Nagy, G. J., M. Gómez-Erache and R. Kay, 2015: A risk-based and participatory approach to assessing climate 21 vulnerability and improving governance in coastal Uruguay. In: Climate Change and the Coast: Building Resilient 22 Communities [Glavovic, B., M. Kelly, R. Kay and A. Travers (eds.)]. CRC Press, Boca Raton, Florida, U.S.A., pp. 23 357–378. 24
Nagy, G. J. et al., 2019: Climate vulnerability, impacts and adaptation in Central and South America coastal areas. 25 Regional Studies in Marine Science, 29, 100683-100683, doi:10.1016/j.rsma.2019.100683. 26
Nagy, G. J. et al., 2014a: Adjusting to current climate threats and building alternative future scenarios for the Rio de la 27 Plata coast and estuarine front, Uruguay. Revista de Gestão Costeira Integrada - Journal of Integrated Coastal 28 Zone Management, 14(4), 553-568, doi:10.5894/rgci472. 29
Nagy, G. J., L. Seijo, J. E. Verocai and M. Bidegain, 2014b: Stakeholders' climate perception and adaptation in coastal 30 Uruguay. International Journal of Climate Change Strategies and Management, 6(1), 63-84, 31 doi:doi:10.1108/IJCCSM-03-2013-0035. 32
Nahuelhual, L., A. Carmona, M. Aguayo and C. Echeverria, 2014: Land use change and ecosystem services provision: 33 A case study of recreation and ecotourism opportunities in southern Chile. Landscape Ecology, 29, 329-344, 34 doi:10.1007/s10980-013-9958-x. 35
Natiello, M. et al., 2008: Indigenous dengue fever, Buenos Aires, Argentina. Emerg Infect Dis, 14(9), 1498-1499, 36 doi:10.3201/eid1409.080143. 37
National Ozone Action Unit of Guyana, 2016: National Climate Change Adaptation Policy and Implementation Plan, 38 Caribbean: Planning for Adaptation to Global Climate Change, Guyana, 74 pp. 39
Naumann, G. et al., 2018: Global Changes in Drought Conditions Under Different Levels of Warming. Geophysical 40 Research Letters, 45(7), 3285-3296, doi:10.1002/2017GL076521. 41
Nava, A., J. S. Shimabukuro, A. A. Chmura and S. L. B. Luz, 2017: The impact of global environmental changes on 42 infectious disease emergence with a focus on risks for Brazil. ILAR Journal, 58(3), 393-400, 43 doi:10.1093/ilar/ilx034. 44
Navarro, J. M. et al., 2016: Ocean warming and elevated carbon dioxide: multiple stressor impacts on juvenile mussels 45 from southern Chile. ICES Journal of Marine Science, 73(3), 764-771, doi:10.1093/icesjms/fsv249. 46
ND-Gain, 2020: ND-GAIN Country Index, University of Notre Dame. Available at: https://gain.nd.edu/our-47 work/country-index/. 48
Negra, C. et al., 2014: Brazil, Ethiopia, and New Zealand lead the way on climate-smart agriculture. Agriculture & 49 Food Security, 3(1), 19, doi:10.1186/s40066-014-0019-8. 50
Nehren, U. et al., 2019: Natural Hazards and Climate Change Impacts in the State of Rio de Janeiro: A Landscape 51 Historical Analysis. In: Strategies and Tools for a Sustainable Rural Rio de Janeiro [Nehren, U., S. Schlϋter, C. 52 Raedig, D. Sattler and H. Hissa (eds.)]. Springer Series on Environmental Management, Cham, pp. 313-330. 53 ISBN 978-3-319-89644-1. 54
Neill, C. et al., 2013: Watershed responses to Amazon soya bean cropland expansion and intensification. Philosophical 55 Transactions of the Royal Society B: Biological Sciences, 368(1619), 20120425, doi:10.1098/rstb.2012.0425. 56
Neilson, J. W. et al., 2017: Significant Impacts of Increasing Aridity on the Arid Soil Microbiome. mSystems, 2(3), 57 e00195-00116, doi:10.1128/mSystems.00195-16. 58
Neiva, D. H., S. M. Da Silva and C. Cardoso, 2017: Analysis of Climate Behavior and Land Use in the City of Rio de 59 Janeiro, RJ, Brazil. Climate, 5(3), doi:10.3390/cli5030052. 60
Nelson-Nuñez, J., J. P. Walters and D. Charpentier, 2019: Exploring the challenges to sustainable rural drinking water 61 services in Chile. Water Policy, 21(6), 1251-1265, doi:10.2166/wp.2019.120. 62
ACCEPTED VERSIO
N
SUBJECT TO FIN
AL EDITS
FINAL DRAFT Chapter 12 IPCC WGII Sixth Assessment Report
Do Not Cite, Quote or Distribute 12-158 Total pages: 181
Nelson, D. R., M. C. Lemos, H. Eakin and Y.-J. Lo, 2016: The limits of poverty reduction in support of climate change 1 adaptation. Environmental Research Letters, 11(9), 94011, doi:10.1088/1748-9326/11/9/094011. 2
Nepstad, D. et al., 2014: Slowing Amazon deforestation through public policy and interventions in beef and soy supply 3 chains. Science, 344(6188), 1118-1123, doi:10.1126/science.1248525. 4
Neukom, R. et al., 2015: Facing unprecedented drying of the Central Andes? Precipitation variability over the period 5 AD 1000–2100. Environmental Research Letters, 10(8), 1-13, doi:10.1088/1748-9326/10/8/084017. 6
Neumann, B., A. T. Vafeidis, J. Zimmermann and R. J. Nicholls, 2015: Future coastal population growth and exposure 7 to sea-level rise and coastal flooding - A global assessment. PLoS ONE, 10(3), doi:10.1371/journal.pone.0118571. 8
Niles, M. T. and J. D. Salerno, 2018: A cross-country analysis of climate shocks and smallholder food insecurity. PLOS 9 ONE, 13(2), e0192928, doi:10.1371/journal.pone.0192928. 10
Njue, N. et al., 2019: Citizen science in hydrological monitoring and ecosystem services management: State of the art 11 and future prospects. Science of The Total Environment, 693, 133531, doi:10.1016/j.scitotenv.2019.07.337. 12
NOAA, 2019: Historical El Nino / La Nina episodes (1950-present). Cold and warm episodes by season. Available at: 13 http://www.cpc.ncep.noaa.gov/products/analysis_monitoring/ensostuff/ensoyears.shtml (accessed 17/06/2021). 14
Nobre, C. A. et al., 2016a: Some Characteristics and Impacts of the Drought and Water Crisis in Southeastern Brazil 15 during 2014 and 2015. Journal of Water Resource and Protection, 8(2), 252-262, doi:10.4236/jwarp.2016.82022. 16
Nobre, C. A. et al., 2016b: Land-use and climate change risks in the Amazon and the need of a novel sustainable 17 development paradigm. Proceedings of the National Academy of Sciences, 113(39), 10759-10768, 18 doi:10.1073/pnas.1605516113. 19
Nolte, C., A. Agrawal, K. M. Silvius and B. S. Soares-Filho, 2013: Governance regime and location influence avoided 20 deforestation success of protected areas in the Brazilian Amazon. Proceedings of the National Academy of 21 Sciences, 110(13), 4956-4961, doi:10.1073/pnas.1214786110. 22
Northey, S. A. et al., 2017: The exposure of global base metal resources to water criticality, scarcity and climate 23 change. Global Environmental Change, 44, 109-124, doi:10.1016/j.gloenvcha.2017.04.004. 24
Novoa, V. et al., 2019: Understanding agricultural water footprint variability to improve water management in Chile. 25 Science of The Total Environment, 670, 188-199, doi:10.1016/j.scitotenv.2019.03.127. 26
NU CEPAL, 2018: Atlas of migration in Northern Central America. Economic Comission for Latin America and the 27 Caribbean (ECLAC), Santiago, Chile, 45 pp. Available at: https://www.cepal.org/en/publications/44288-atlas-28 migration-northern-central-america (accessed 17/06/2021). 29
NU CEPAL, MINURVI and ONU HABITAT, 2016: América Latina y el Caribe: Desafíos, dilemas y compromisos de 30 una agenda urbana común. Comisión Económica para América Latina y el Caribe, Oficina Regional para 31
América Latina y el Caribe del Programa de Naciones Unidas para los Asentamientos Humanos and Foro de Ministros 32 y Autoridades Máximas de la Vivienda y el Urbanismo de América Latina y el Caribe Santiago, Chile, 62 pp. 33 Available at: https://repositorio.cepal.org/bitstream/handle/11362/40656/1/S1600986_es.pdf (accessed 34 17/10/2020). 35
Nunes, L. H., R. Greco and J. A. Marengo, 2018: Climate change in Santos Brazil: Projections, impacts and adaptation 36 options. 1-302 pp. ISBN 9783319965352. 37
Núñez Collado, J. R. and H.-H. Wang, 2020: Slum upgrading and climate change adaptation and mitigation: Lessons 38 from Latin America. Cities, 104, 102791, doi:10.1016/j.cities.2020.102791. 39
Núñez, J. et al., 2017: Reconciling Drought Vulnerability Assessment Using a Convergent Approach: Application to 40 Water Security in the Elqui River Basin, North-Central Chile. Water, 9(8), doi:10.3390/w9080589. 41
O'Neill, B. C. et al., 2017: IPCC reasons for concern regarding climate change risks. Nature Climate Change, 7(1), 28-42 37, doi:10.1038/nclimate3179. 43
O’Leary, G. J. et al., 2018: Challenges and Responses to Ongoing and Projected Climate Change for Dryland Cereal 44 Production Systems throughout the World. Agronomy, 8(4), doi:10.3390/agronomy8040034. 45
OAS, 2016: Inter-American Program for Sustainable Development (PIDS): 2016–2021. Organization of American 46 States. Department of Sustainable Development, Washington, United States, 34 pp. Available at: 47 http://www.oas.org/en/sedi/pub/PIDS_2017.pdf (accessed 09/08/2021). 48
Obraczka, M., M. Beyeler, A. Magrini and L. Legey, 2017: Analysis of Coastal Environmental Management Practices 49 in Subregions of California and Brazil. Journal of Coastal Research, 33(6), 1315-1322, 50 doi:10.2112/JCOASTRES-D-15-00239.1. 51
Ochoa-Tocachi, B. F. et al., 2019: Potential contributions of pre-Inca infiltration infrastructure to Andean water 52 security. Nature Sustainability, 2(7), 584-593, doi:10.1038/s41893-019-0307-1. 53
Odell, S. D., A. Bebbington and K. E. Frey, 2018: Mining and climate change: A review and framework for analysis. 54 The Extractive Industries and Society, 5(1), 201-214, doi:10.1016/j.exis.2017.12.004. 55
OECD, 2017: OECD Review of Fisheries 2017 General Survey of Fisheries Policies. OECD Publishing, Organisation 56 for Economic Co-operation and Development, 117 pp. Available at: 57 http://www.oecd.org/officialdocuments/publicdisplaydocumentpdf/?cote=TAD/FI(2017)14/FINAL&docLanguag58 e=En (accessed 17/06/2021). 59
OECD, 2018: Income inequality. Available at: https://www.oecd-ilibrary.org/content/data/459aa7f1-en (accessed 60 18/10/2020). 61
OECD and FAO, 2019: OECD-FAO Agricultural Outlook 2019-2028. OECD Publishing and FAO, Paris, France and 62 Rome, Italy. Available at: https://doi.org/10.1787/agr_outlook-2019-en (accessed 09/08/2021). 63
ACCEPTED VERSIO
N
SUBJECT TO FIN
AL EDITS
FINAL DRAFT Chapter 12 IPCC WGII Sixth Assessment Report
Do Not Cite, Quote or Distribute 12-159 Total pages: 181
OECD/Food and Agriculture Organization of the United Nations, 2015: OECD-FAO Agricultural Outlook 2015-1 2024 OECD Publishing, Paris, France, 148 pp. 2
Oertel, M., F. J. Meza and J. Gironás, 2020: Observed trends and relationships between ENSO and standardized 3 hydrometeorological drought indices in central Chile. Hydrological Processes, 34(2), 159-174, 4 doi:10.1002/hyp.13596. 5
Ohz, A., A. H. F. Klein and D. Franco, 2020: A Multiple Linear Regression-Based Approach for Storm Surge 6 Prediction Along South Brazil. In: Climate Change, Hazards and Adaptation Options: Handling the Impacts of a 7 Changing Climate [Leal Filho, W., G. J. Nagy, M. Borga, P. D. Chávez Muñoz and A. Magnuszewski (eds.)]. 8 Springer International Publishing, Cham, pp. 27-50. ISBN 978-3-030-37425-9. 9
OICS, 2021: Reserva Ecológica Costanera Sur. Parque ecológico Multifuncional. Observatório de Inovação para 10 Cidades Sustentáveis, Buenos Aires, Argentina. Available at: https://oics.cgee.org.br/estudos/-/estudo-de-11 caso/article/reserva-ecologica-costanera-sur_5ce70dae45e3fa1e7217bcff (accessed 01/09/2021). 12
OIM, 2017: Encuesta sobre migración internacional de personas guatemaltecas y remesas 2016. Organización 13 Internacional para las Migraciones OIM, Guatemala. 14
OIT, 2019: Panorama Laboral Temático 5: Mujeres en el mundo del trabajo. Retos pendientes hacia una efectiva 15 equidad en América Latina y el Caribe. OIT/Oficina Regional para América Latina y el Caribe, Lima, 200 pp. pp. 16 Available at: https://www.ilo.org/wcmsp5/groups/public/---americas/---ro-17 lima/documents/publication/wcms_715183.pdf (accessed 17/06/2021). 18
Ojeda, D., 2014: Descarbonización y despojo: desigualdades socioambientales y las geografías del cambio climático. 19 In: Desigualdades socioambientales en América Latina [Göbel, B., M. Góngora-Mera and A. Ulloa (eds.)]. 20 Universidad Nacional de Colombia-Ibero-Amerikanisches Institut, Bogotá, pp. 255-290. ISBN 978-958-775-221-21 2. 22
Okumura, C. K. et al., 2021: Integrated water resouce management as a development driver – Prospecting a sanitation 23 improvement cycle for the greater Rio de Janeiro using the city blueprint approach. Journal of Cleaner 24 Production, 315, 128054, doi:10.1016/j.jclepro.2021.128054. 25
Olivares, I., J. C. Svenning, P. M. van Bodegom and H. Balslev, 2015: Effects of Warming and Drought on the 26 Vegetation and Plant Diversity in the Amazon Basin. Botanical Review, 81(1), 42-69, doi:10.1007/s12229-014-27 9149-8. 28
Oliveira-Filho, R. R. d. et al., 2016: On the impact of the Brazilian Forest Code on mangroves: A comment to Ferreira 29 and Lacerda (2016). Ocean & Coastal Management, 132, 36-37, doi:10.1016/j.ocecoaman.2016.08.002. 30
Oliveira Duarte, L. et al., 2019: Textile natural fibers production regarding the agroforestry approach. SN Applied 31 Sciences, 1(8), 914, doi:10.1007/s42452-019-0937-y. 32
Oliveira, J. and P. Pereda, 2020: The impact of climate change on internal migration in Brazil. Journal of 33 Environmental Economics and Management, 103, 102340, doi:10.1016/j.jeem.2020.102340. 34
Oliveira, L. J. C., M. H. Costa, B. S. Soares-Filho and M. T. Coe, 2013: Large-scale expansion of agriculture in 35 Amazonia may be a no-win scenario. Environmental Research Letters, 8(2), 024021, doi:10.1088/1748-36 9326/8/2/024021. 37
Oliver-Smith, A., 2014: Climate Change Adaptation and Disaster Risk Reduction in Highland Peru. In: Adapting to 38 Climate Change: Lessons from Natural Hazards Planning [Glavovic, B. C. and G. P. Smith (eds.)]. Springer 39 Netherlands, Dordrecht, pp. 77-100. ISBN 978-94-017-8631-7. 40
Oliver-Smith, A., 2021: The choice of perils understanding resistance to resettlement for urban disaster risk reduction 41 and climate change adaptation. In: Rethinking Urban Risk and Resettlement in the Global South [Johnson, C., G. 42 Jain and A. Lavell (eds.)]. UCL Press, pp. 133-153. ISBN 9781787358294. 43
Olivera, M., M. G. Podcameni, M. C. Lustosa and L. Graça, 2021: A dimensão de gênero no Big Push para a 44 Sustentabilidade no Brasil. As mulheres no contexto da transformação social e ecológica da economia brasileira 45 [Stiftung, C. E. p. a. A. L. e. o. C. e. F. F. E. (ed.)]. CEPAL, Santiago and Sao Paulo. Available at: 46 https://www.cepal.org/pt-br/publicaciones/46643-dimensao-genero-big-push-sustentabilidade-brasil-mulheres-47 contexto-transformacao (accessed 03/08/2021). 48
Oliveras, I., L. O. Anderson and Y. Malhi, 2014: Application of remote sensing to understanding fire regimes and 49 biomass burning emissions of the tropical Andes. Global Biogeochemical Cycles, 28(4), 480-496, 50 doi:10.1002/2013GB004664. 51
Oliveras, I. et al., 2018: Fire effects and ecological recovery pathways of tropical montane cloud forests along a time 52 chronosequence. Global Change Biology, 24(2), 758-772, doi:10.1111/gcb.13951. 53
Olmo, M., M. L. Bettolli and M. Rusticucci, 2020: Atmospheric circulation influence on temperature and precipitation 54 individual and compound daily extreme events: Spatial variability and trends over southern South America. 55 Weather and Climate Extremes, 29, 100267, doi:10.1016/j.wace.2020.100267. 56
Olsson, L. et al., 2019: Land Degradation. In: Climate Change and Land. An IPCC Special Report on climate change, 57 desertification, land degradation, sustainable land management, food security, and greenhouse gas fluxes in 58 terrestrial ecosystems. In Press. 59
ONEMI, 2015: Plan Estratégico Nacional Para la Gestión del Riesgo de Desastres 2015-2018 de Chile. Ministerio del 60 Interior y Seguridad Pública, 177 pp. Available at: 61 https://www.preventionweb.net/files/52889_52889planestrategicobaja.pdf (accessed 17/06/2021). 62
ACCEPTED VERSIO
N
SUBJECT TO FIN
AL EDITS
FINAL DRAFT Chapter 12 IPCC WGII Sixth Assessment Report
Do Not Cite, Quote or Distribute 12-160 Total pages: 181
Oppenheimer, M. et al., 2014: Emergent risks and key vulnerabilities. In: Climate Change 2014: Impacts, Adaptation, 1 and Vulnerability. Part A: Global and Sectoral Aspects. Contribution of Working Group II to the Fifth Assessment 2 Report of the Intergovernmental Panel of Climate Change [Field, C. B., V. R. Barros, D. J. Dokken, K. J. Mach, 3 M. D. Mastrandrea, T. E. Bilir, M. Chatterjee, K. L. Ebi, Y. O. Estrada, R. C. Genova, B. Girma, E. S. Kissel, A. 4 N. Levy, S. MacCracken, P. R. Mastrandrea and L. L. White (eds.)]. Cambridge University Press, Cambridge, 5 United Kingdom and New York, NY, USA, pp. 1039-1099. 6
OPS and WHO, 2018: Taller Subregional Salud en Planes Nacionales de Adaptación al Cambio Climático: 7 Centroamérica. Organización Panamericana de la Salud (OPS) and World Health Organization (WHO), Ciudad 8 de Panamá, 34 pp. Available at: 9 https://www.paho.org/hq/index.php?option=com_docman&view=download&category_slug=manuals-training-10 materials-9890&alias=45593-taller-subregional-salud-planes-nacionales-adaptacion-al-cambio-climatico-11 centroamerica-2018-spanish-only-593&Itemid=270&lang=en (accessed 17/06/2021). 12
Orlove, B. et al., 2019: Framing climate change in frontline communities: anthropological insights on how mountain 13 dwellers in the USA, Peru, and Italy adapt to glacier retreat. Regional Environmental Change, 19(5), 1295-1309, 14 doi:10.1007/s10113-019-01482-y. 15
Orlowsky, B. and S. I. Seneviratne, 2012: Global changes in extreme events: Regional and seasonal dimension. 16 Climatic Change, 110(3-4), 669-696, doi:10.1007/s10584-011-0122-9. 17
Otto, I. M. et al., 2017: Social vulnerability to climate change: a review of concepts and evidence. Regional 18 Environmental Change, 17(6), 1651-1662, doi:10.1007/s10113-017-1105-9. 19
Ovalle-Rivera, O. et al., 2015: Projected shifts in Coffea arabica suitability among major global producing regions due 20 to climate change. PloS one, 10(4), e0124155-e0124155, doi:10.1371/journal.pone.0124155. 21
Ovalle-Rivera, O. et al., 2020: Assessing the accuracy and robustness of a process-based model for coffee agroforestry 22 systems in Central America. Agroforestry Systems, 94(5), 2033-2051, doi:10.1007/s10457-020-00521-6. 23
Ovando, A. et al., 2016: Extreme flood events in the Bolivian Amazon wetlands. Journal of Hydrology: Regional 24 Studies, 5, 293-308, doi:10.1016/j.ejrh.2015.11.004. 25
Oviedo, A. F. P., S. Mitraud, D. G. McGrath and M. Bursztyn, 2016: Implementing climate variability at the 26 community level in the Amazon floodplain. Environmental Science and Policy, 63, 151-160, 27 doi:10.1016/j.envsci.2016.05.017. 28
Oyanedel, R., A. Marín, J. C. Castilla and S. Gelcich, 2016: Establishing marine protected areas through bottom-up 29 processes: insights from two contrasting initiatives in Chile. Aquatic Conservation: Marine and Freshwater 30 Ecosystems, 26(1), 184-195, doi:10.1002/aqc.2546. 31
Oyarzún, D. and C. M. Brierley, 2019: The future of coastal upwelling in the Humboldt current from model projections. 32 Climate Dynamics, 52(1-2), 599-615, doi:10.1007/s00382-018-4158-7. 33
Oyedotun, T. D. T. and N. Ally, 2021: Environmental issues and challenges confronting surface waters in South 34 America: A review. Environmental Challenges, 3, 100049, doi:10.1016/j.envc.2021.100049. 35
Pabón-Caicedo, J. D. et al., 2020: Observed and Projected Hydroclimate Changes in the Andes. Frontiers in Earth 36 Science, 8, 61, doi:10.3389/feart.2020.00061. 37
Pacheco, F. S. et al., 2021: Nutrient Balance and Use Efficiency in Agricultural Lands in the Vermelho River 38 Watershed, Upper Pantanal, Brazil. Journal of Geophysical Research: Biogeosciences, 126(3), e2020JG005673, 39 doi:10.1029/2020JG005673. 40
Pacifici, M. et al., 2015: Assessing species vulnerability to climate change. Nature Climate Change, 5(3), 215-224, 41 doi:10.1038/nclimate2448. 42
Paerregaard, K., 2018: The climate-development nexus: using climate voices to prepare adaptation initiatives in the 43 Peruvian Andes. Climate and Development, 10(4), 360-368, doi:10.1080/17565529.2017.1291400. 44
Paerregaard, K., A. B. Stensrud and A. O. Andersen, 2016: Water Citizenship: Negotiating Water Rights and 45 Contesting Water Culture in the Peruvian Andes. Latin American Research Review, 51(1), 198–217, 46 doi:10.1353/lar.2016.0012. 47
Palacios, J. et al., 2016: Innovative community-based data collection to understand and find solutions to rainfall-related 48 diarrhoeal diseases in Ecuador. In: Climate Services for health: Improving public health decision-making in a new 49 climate - Case studies [Shumake-Guillemot, J. and L. Fernandez-Montoya (eds.)]. World Meteorological 50 Organization and World Health Organization, Geneva, pp. 104-105. 51
Palomo, I. et al., 2021: Assessing nature-based solutions for transformative change. One Earth, 4(5), 730-741, 52 doi:10.1016/j.oneear.2021.04.013. 53
Pan, W., O. Branch and B. Zaitchik, 2014: Impact of Climate Change on Vector-Borne Disease in the Amazon. In: 54 Global Climate Change and Public Health [Pinkerton, K. E. and W. N. Rom (eds.)]. Springer, pp. 193-210. ISBN 55 9781461484172. 56
Pan, Y. et al., 2011: A Large and Persistent Carbon Sink in the World’s Forests. Science, 333(6045), 988-993, 57 doi:10.1126/science.1201609. 58
Pandey, S. D. et al., 2020: Properties of carbon particles in archeological and natural Amazon rainforest soils. CATENA, 59 194, 104687, doi:10.1016/j.catena.2020.104687. 60
Paralovo, S. L. et al., 2019: Observations of particulate matter, NO2, SO2, O3, H2S and selected VOCs at a semi-urban 61 environment in the Amazon region. Science of The Total Environment, 650, 996-1006, 62 doi:10.1016/j.scitotenv.2018.09.073. 63
ACCEPTED VERSIO
N
SUBJECT TO FIN
AL EDITS
FINAL DRAFT Chapter 12 IPCC WGII Sixth Assessment Report
Do Not Cite, Quote or Distribute 12-161 Total pages: 181
Parise, C. K., L. J. Calliari and N. Krusche, 2009: Extreme storm surges in the south of Brazil: Atmospheric conditions 1 and shore erosion. Brazilian Journal of Oceanography, 57(3), 175-188, doi:10.1590/s1679-87592009000300002. 2
Parraguez-Vergara, E., J. R. Barton and G. Raposo-Quintana, 2016: Impacts of Climate Change in the Andean Foothills 3 of Chile: Economic and Cultural Vulnerability of Indigenous Mapuche Livelihoods. Journal of Developing 4 Societies, 32(4), 454-483, doi:10.1177/0169796X16667874. 5
Parraguez-Vergara, E. et al., 2018: Does indigenous and campesino traditional agriculture have anything to contribute 6 to food sovereignty in Latin America? Evidence from Chile, Peru, Ecuador, Colombia, Guatemala and Mexico. 7 Int. J. Agric. Sustain., 16(4-5), 326-341, doi:10.1080/14735903.2018.1489361. 8
Parry, L. et al., 2018: Social Vulnerability to Climatic Shocks Is Shaped by Urban Accessibility. Annals of the 9 American Association of Geographers, 108(1), 125-143, doi:10.1080/24694452.2017.1325726. 10
Paterson, B. and A. Charles, 2019: Community-based responses to climate hazards: typology and global analysis. 11 Climatic Change, 152(3), 327-343, doi:10.1007/s10584-018-2345-5. 12
Pauleit, S. et al., 2017: Nature-Based Solutions and Climate Change – Four Shades of Green. In: Nature-based 13 Solutions to Climate Change Adaptation in Urban Areas: linkages between science, policy and practice [Kabisch, 14 N., H. Korn, J. Staddler and A. Bonn (eds.)]. Springer, Cham, Switzerland, pp. 29-49. 15
Paz, S., M. Negev, A. Clermont and M. S. Green, 2016: Health Aspects of Climate Change in Cities with 16 Mediterranean Climate, and Local Adaptation Plans. International Journal of Environmental Research and Public 17 Health, 13(4), 438, doi:10.3390/ijerph13040438. 18
PBMC, 2014: Impactos, vulnerabilidades e adaptação às mudanças climáticas. Contribuição do Grupo de Trabalho 2 19 do Painel Brasileiro de Mudanças Climáticas ao Primeiro Relatório da Avaliação Nacional sobre Mudanças 20 Climáticas. COPPE. Universidade Federal do Rio de Janeiro, Rio de Janeiro, RJ, Brasil, 414 pp. ISBN 978-85-21 285-0207-7. 22
PBMC, 2016: Mudanças Climáticas e Cidades. Relatório Especial Do Painel Brasileiro de Mudanças Climáticas 23 [Ribeiro, S. K. and A. S. Santos (eds.)]. Painel Brasileiro de Mudanças Climáticas, COPPE - UFRJ, Rio de 24 Janeiro, Brasil, 116 pp. ISBN 978-85-285-0344-9. 25
Pegas, F. d. V., D. Weaver and G. Castley, 2015: Domestic tourism and sustainability in an emerging economy: Brazil's 26 littoral pleasure periphery. Journal of Sustainable Tourism, 23(5), 748-769, doi:10.1080/09669582.2014.998677. 27
Pelicice, F. M., P. S. Pompeu and A. A. Agostinho, 2015: Large reservoirs as ecological barriers to downstream 28 movements of Neotropical migratory fish. Fish and Fisheries, 16(4), 697-715, doi:10.1111/faf.12089. 29
Peña-Guerrero, M. D. et al., 2020: Drought impacts on water quality and potential implications for agricultural 30 production in the Maipo River Basin, Central Chile. Hydrological Sciences Journal, 65(6), 1005-1021, 31 doi:10.1080/02626667.2020.1711911. 32
Peña, M. P., J. Barichivich and A. Maldonado, 2014: Climatic drivers of tree growth in a swamp forest island in the 33 semiarid coast of Chile. Journal of Arid Environments, 109, 15-22, doi:10.1016/j.jaridenv.2014.05.003. 34
Pepermans, Y. and P. Maeseele, 2016: The politicization of climate change: problem or solution? WIREs Climate 35 Change, 7(4), 478-485, doi:10.1002/wcc.405. 36
Pereda, P., 2016: Predicting the impacts of climate on dengue in Brazil: integrated risk modelling and mapping. In: 37 Climate Services for health: Improving public health decision-making in a new climate - Case studies [Shumake-38 Guillemot, J. and L. Fernandez-Montoya (eds.)]. World Meteorological Organization and World Health 39 Organization, Geneva, pp. 84-85. 40
Pereira, V. S. et al., 2011: Análise dos atendimentos ambulatoriais por doenças respiratórias no Município de Alta 41 Floresta - Mato Grosso - Amazônia brasileira. Epidemiologia e Serviços de Saúde, 20(3), 393-400, 42 doi:10.5123/S1679-49742011000300014. 43
Peres, L. d. F., A. J. d. Lucena, O. C. Rotunno Filho and J. R. d. A. França, 2018: The urban heat island in Rio de 44 Janeiro, Brazil, in the last 30 years using remote sensing data. International Journal of Applied Earth Observation 45 and Geoinformation, 64, 104-116, doi:10.1016/j.jag.2017.08.012. 46
Pérez-Escamilla, R., M. B. Gubert, B. Rogers and A. Hromi-Fiedler, 2017: Food security measurement and governance: 47 Assessment of the usefulness of diverse food insecurity indicators for policy makers. Global Food Security, 14, 48 96-104, doi:10.1016/j.gfs.2017.06.003. 49
Pérez, T., C. Mattar and R. Fuster, 2018: Decrease in Snow Cover over the Aysén River Catchment in Patagonia, Chile. 50 Water, 10, 619, doi:10.3390/w10050619. 51
Peri, P., G. Martínez and L. Nahuelhual, 2021: Ecosystem Services in Patagonia. A Multi-Criteria Approach for an 52 Integrated Assessment, 1 ed. Natural and Social Sciences of Patagonia, Springer International Publishing, 53 Switzerland. ISBN 978-3-030-69166-0. 54
Perreault, T., 2020: Climate Change and Climate Politics: Parsing the Causes and Effects of the Drying of Lake Poopó, 55 Bolivia. Journal of Latin American Geography, 19(3), 26-46, doi:10.1353/lag.2020.0070. 56
Petit, I. J. et al., 2018: Protected areas in Chile: are we managing them? Revista Chilena de Historia Natural, 91(1), 1, 57 doi:10.1186/s40693-018-0071-z. 58
Petrova, D. et al., 2020: The 2018–2019 weak El Niño: Predicting the risk of a dengue outbreak in Machala, Ecuador. 59 International Journal of Climatology, n/a(n/a), doi:10.1002/joc.6744. 60
Pfeffer, K., 2018: Knowing the city. Twente University - ITC, 31 pp. Available at: 61 https://webapps.itc.utwente.nl/librarywww/papers_2018/chap/pfeffer_kno.pdf (accessed 31/10/2020). 62
ACCEPTED VERSIO
N
SUBJECT TO FIN
AL EDITS
FINAL DRAFT Chapter 12 IPCC WGII Sixth Assessment Report
Do Not Cite, Quote or Distribute 12-162 Total pages: 181
Phillips, C. A. et al., 2020: Compound climate risks in the COVID-19 pandemic. Nature Climate Change, 10(7), 586-1 588, doi:10.1038/s41558-020-0804-2. 2
Picasso, V. D. et al., 2014: Sustainability of meat production beyond carbon footprint: a synthesis of case studies from 3 grazing systems in Uruguay. Meat Science, 98(3), 346-354, doi:10.1016/j.meatsci.2014.07.005. 4
Piggott-McKellar, A. E., K. E. McNamara, P. D. Nunn and J. E. M. Watson, 2019: What are the barriers to successful 5 community-based climate change adaptation? A review of grey literature. Local Environment, 24(4), 374-390, 6 doi:10.1080/13549839.2019.1580688. 7
Pinho, P. F., J. A. Marengo and M. S. Smith, 2015: Complex socio-ecological dynamics driven by extreme events in the 8 Amazon. Regional Environmental Change, 15(4), 643-655, doi:10.1007/s10113-014-0659-z. 9
Pinho, P. F. et al., 2014: Ecosystem protection and poverty alleviation in the tropics: Perspective from a historical 10 evolution of policy-making in the Brazilian Amazon. Ecosystem Services, 8, 97-109, 11 doi:10.1016/j.ecoser.2014.03.002. 12
Pino-Cortés, E. et al., 2020: Effect of socioeconomic status on the relationship between short-term exposure to PM2.5 13 and cardiorespiratory mortality and morbidity in a megacity: the case of Santiago de Chile. Air Quality, 14 Atmosphere & Health, 13(5), 509-517, doi:10.1007/s11869-020-00818-6. 15
Pino, P. et al., 2015: Chile Confronts its Environmental Health Future After 25 Years of Accelerated Growth. Annals of 16 Global Health, 81(3), 354-367, doi:10.1016/j.aogh.2015.06.008. 17
Pinzón, R. E., K. Hibino, I. Takayabu and T. Nakaegawa, 2017: Virtually experiencing future climate changes in 18 Central America with MRI-AGCM: climate analogues study. Hydrological Research Letters, 11(2), 106-113, 19 doi:10.3178/hrl.11.106. 20
Piper, F. I., M. J. Gundale and A. Fajardo, 2015: Extreme defoliation reduces tree growth but not C and N storage in a 21 winter-deciduous species. Ann Bot, 115(7), 1093-1103, doi:10.1093/aob/mcv038. 22
Pires, A. P. F. et al., 2017: Forest restoration can increase the Rio Doce watershed resilience. Perspectives in Ecology 23 and Conservation, 15(3), 187-193, doi:10.1016/j.pecon.2017.08.003. 24
Piticar, A., 2018: Changes in heat waves in Chile. Global and Planetary Change, 169(October 2017), 234-246, 25 doi:10.1016/j.gloplacha.2018.08.007. 26
Pizarro, J., P. M. Vergara, S. Cerda and D. Briones, 2016: Cooling and eutrophication of southern Chilean lakes. 27 Science of The Total Environment, 541, 683-691, doi:10.1016/j.scitotenv.2015.09.105. 28
Pokorny, B. et al., 2013: From large to small: Reorienting rural development policies in response to climate change, 29 food security and poverty. Forest Policy Econ., 36, 52-59, doi:10.1016/j.forpol.2013.02.009. 30
Polk, M. H. et al., 2017: Exploring hydrologic connections between tropical mountain wetlands and glacier recession in 31 Peru's Cordillera Blanca. Applied Geography, 78, 94-103, doi:10.1016/j.apgeog.2016.11.004. 32
Pollett, S. et al., 2020: Identification and evaluation of epidemic prediction and forecasting reporting guidelines: A 33 systematic review and a call for action. Epidemics, 33, 100400, doi:10.1016/j.epidem.2020.100400. 34
Pompeu, J. et al., 2021: Is domestic agricultural production sufficient to meet national food nutrient needs in Brazil? 35 PLOS ONE, 16(5), e0251778, doi:10.1371/journal.pone.0251778. 36
Ponce, C., 2020: Intra-seasonal climate variability and crop diversification strategies in the Peruvian Andes: A word of 37 caution on the sustainability of adaptation to climate change. World Development, 127, 104740, 38 doi:10.1016/j.worlddev.2019.104740. 39
Pons, D. et al., 2018: Escenarios de aridez para Guatemala para los años 2030, 2050 y 2070 utilizando modelos de 40 cambio climático. Revista Yu'am, 2(4), 4-16. 41
Pons, D. et al., 2017: On the Production of Climate Information in the High Mountain Forests of Guatemala. 1 ed. 42 Routledge, pp. 87-99. ISBN 1138066974;9781138066977;. 43
Porkka, M., M. Kummu, S. Siebert and O. Varis, 2013: From Food Insufficiency towards Trade Dependency: A 44 Historical Analysis of Global Food Availability. PLOS ONE, 8(12), e82714, doi:10.1371/journal.pone.0082714. 45
Porras, I., P. Steele and E. Y. Mohammed, 2016: Upscaling solutions: The role of conditional transfers for poverty 46 reduction and ecosystem management. IIED, London, 48 pp. Available at: 47 https://pubs.iied.org/pdfs/16050IIED.pdf (accessed 17/06/2021). 48
Portilla Cabrera, C. V. and J. J. Selvaraj, 2020: Geographic shifts in the bioclimatic suitability for Aedes aegypti under 49 climate change scenarios in Colombia. Heliyon, 6(1), e03101, doi:10.1016/j.heliyon.2019.e03101. 50
Pörtner, H. O. et al., 2021: IPBES-IPCC co-sponsored workshop report synopsis on biodiversity and climate change. 51 IPBES and IPCC. Available at: https://zenodo.org/record/4920414#.YSaj0o77SUk (accessed 25/08/2021). 52
Portugal Del Pino, D., S. Borelli and S. Pauleit, 2020: Nature-Based Solutions in Latin American Cities. In: The 53 Palgrave Handbook of Climate Resilient Societies. Springer International Publishing, Cham, pp. 1-28. ISBN 978-54 3-030-32811-5. 55
Postigo, J. C., 2013: Adaptation of Andean Herders to Political and Climatic Changes. In: Continuity and Change in 56 Cultural Adaptation to Mountain Environments: From Prehistory to Contemporary Threats [Lozny, L. R. (ed.)]. 57 Springer New York, New York, NY, pp. 229-258. ISBN 978-1-4614-5702-2. 58
Postigo, J. C., 2014: Perception and Resilience of Andean Populations Facing Climate Change. Journal of 59 Ethnobiology, 34(3), 383-400, doi:10.2993/0278-0771-34.3.383. 60
Postigo, J. C., 2019: Multi-temporal Adaptations to Change in the Central Andes. In: Climate and Culture: 61 Multidisciplinary Perspectives on a Warming World [Feola, G., H. Geoghegan and A. Arnall (eds.)]. Cambridge 62 University Press, Cambridge, pp. 117-140. ISBN 1108422500. 63
ACCEPTED VERSIO
N
SUBJECT TO FIN
AL EDITS
FINAL DRAFT Chapter 12 IPCC WGII Sixth Assessment Report
Do Not Cite, Quote or Distribute 12-163 Total pages: 181
Poveda, G. et al., 2020: High Impact Weather Events in the Andes. Frontiers in Earth Science, 8, 162. 1 Prager, S. et al., 2020: Vulnerability to Climate Change and Economic Impacts in the Agriculture Sector in Latin 2
America and the Caribbean. IDB Technical Note IDB-TN-01985, Inter-American Development Bank (IDB) and 3 International Center for Tropical Agriculture (CIAT), Cali, Colombia, 155 pp. Available at: 4 http://dx.doi.org/10.18235/0002580. 5
Prefeitura da Cidade do Rio de Janeiro, 2015: Plano Municipal de Saneamento Básico da Cidade do Rio de Janeiro. 6 Drenagem e Manejo de Águas Pluviais Urbanas, Prefeitura da Cidade do Rio de Janeiro. Available at: 7 http://www.rio.rj.gov.br/web/rio-aguas/exibeconteudo?id=5825189 (accessed 27/10/2020). 8
Prefeitura da Cidade do Rio de Janeiro, 2016: Estratégia de Adaptação às Mudanças Climáticas da Cidade do Rio de 9 Janeiro, Prefeitura da Cidade do Rio de Janeiro, Rio de Janeiro, Brazil, 90 pp. Available at: 10 http://www.rio.rj.gov.br/dlstatic/10112/6631312/4179912/ESTRATEGIA_PORT.pdf (accessed 17/10/2020). 11
Prefeitura da Cidade do Rio de Janeiro, 2021: Plano de Desenvolvimento Sustentável e Ação Climática da Cidade do 12 Rio de Janeiro, Rio de Janeiro, Brazil. Available at: rio.rj.gov.br/web/planejamento/pds (accessed 01/09/2021). 13
Prefeitura do Município de São Paulo, 2015: Plano de Mobilidade de São Paulo: PlanMob/SP 2015, Secretaria 14 Municipal de Transportes, São Paulo, SP, Brasil, 201 pp. Available at: 15 https://www.prefeitura.sp.gov.br/cidade/secretarias/upload/chamadas/planmobsp_v072__1455546429.pdf 16 (accessed 17/10/2020). 17
Prefeitura do Município de São Paulo, 2021: PlanClimaSP: Plano de Ação climática do Município de São Paulo 2020-18 2050, Prefeitura do Município de São Paulo, Sao Paulo, Brazil, 342 pp. Available at: 19 https://www.prefeitura.sp.gov.br/cidade/secretarias/upload/meio_ambiente/arquivos/PlanClimaSP_BaixaResoluca20 o.pdf (accessed 01/09/2021). 21
Prefeitura Municipal de Curitiba, 2020: PlanClima Plano de Mitigação e Adaptação às Mudanças Climáticas, Curitiba, 22 Brazil. Available at: https://mid.curitiba.pr.gov.br/2020/00306556.pdf (accessed 01/09/2021). 23
Prefeitura Municipal do Salvador, 2020: Plano de Mitigação e Adaptação às Mudanças do Clima de Salvador, 24 Salvador, Brazil. Available at: 25 http://www.prodeturssa.salvador.ba.gov.br/images/prodeturssa/documentos/PMAMC.pdf (accessed 01/09/2021). 26
Priotto, G. and R. Salvador Aruj, 2017: Migraciones, ambiente y cambio climático. Estudios de Caso en América del 27 Sur. Cuadernos Migratorios, OIM, Buenos Aires, Argentina. Available at: 28 file:///C:/Users/Maria/Downloads/migraciones_ambiente_y_cambio_climatico_estudio_de_casos_en_america_del29 _sur_0.pdf (accessed 25/08/2021). 30
Programa Estado de la Nación - Estado de la Región, 2016: Fifth State of the Region Report on Sustainable Human 31 Development. Summary. PEN CONARE, San José, Costa Rica, 69 pp. Available at: 32 http://repositorio.conare.ac.cr/bitstream/handle/20.500.12337/731/Fifth%20State%20of%20the%20Region%20Re33 port%20on%20Susteinable%20Human%20Development%202016_libro.pdf?sequence=1&isAllowed=y (accessed 34 17/06/2021). 35
Puente-Sotomayor, F., A. Egas and J. Teller, 2021: Land policies for landslide risk reduction in Andean cities. Habitat 36 International, 107, 102298, doi:10.1016/j.habitatint.2020.102298. 37
Qin, H., P. Romero-Lankao, J. Hardoy and A. Rosas-Huerta, 2015: Household responses to climate-related hazards in 38 four Latin American cities: A conceptual framework and exploratory analysis. Urban Climate, 14, 94-110, 39 doi:10.1016/j.uclim.2015.05.003. 40
Qin, Y. et al., 2020: Agricultural risks from changing snowmelt. Nature Climate Change, 10(5), 459-465, 41 doi:10.1038/s41558-020-0746-8. 42
Quadrado, G. P., S. R. Dillenburg, E. S. Goulart and E. G. Barboza, 2021: Historical and geological assessment of 43 shoreline changes at an urbanized embayed sandy system in Garopaba, Southern Brazil. Regional Studies in 44 Marine Science, 42, 101622, doi:10.1016/j.rsma.2021.101622. 45
Quichi, E. et al., 2016: Ecuador–Peru cooperation for climate-informed dengue surveillance: creating an 46 interdisciplinary multinational team. In: Climate Services for health: Improving public health decision-making in 47 a new climate - Case studies [Shumake-Guillemot, J. and L. Fernandez-Montoya (eds.)]. World Meteorological 48 Organization and World Health Organization, Geneva, pp. 12-13. 49
Quijada, Y. et al., 2018: Social Inequality and Mental Health in Chile, Ecuador, and Colombia. Latin American 50 Perspectives, 46(6), 92-108, doi:10.1177/0094582X18803682. 51
Quimbayo Ruiz, G. and F. Vásquez Rodríguez, 2016a: Ecología política urbana: Otra aproximación al modelo de 52 ciudad en Colombia. Naturaleza urbana, Instituto Alexander von Humboldt, Bogotá, Colombia. Available at: 53 https://www.ecologiapolitica.info/?p=6020 (accessed 01/09/2021). 54
Quimbayo Ruiz, G. A. and F. Vásquez Rodríguez, 2016b: Hacia una ecología política de la urbanización en América 55 Latina. Ecología Política, 43-51 pp. Available at: https://www.ecologiapolitica.info/?p=6020 (accessed 56 01/09/2021). 57
Quinn, A. D. et al., 2018: Adaptation Becoming Business as Usual: A Framework for Climate-Change-Ready Transport 58 Infrastructure. Infrastructures, 3(2), 10, doi:10.3390/infrastructures3020010. 59
Quintero-Herrera, L. L. et al., 2015: Potential impact of climatic variability on the epidemiology of dengue in Risaralda, 60 Colombia, 2010–2011. Journal of Infection and Public Health, 8(3), 291-297, doi:10.1016/j.jiph.2014.11.005. 61
Quiñones, R. A. et al., 2019: Environmental issues in Chilean salmon farming: a review. Reviews in Aquaculture, 11(2), 62 375-402, doi:10.1111/raq.12337. 63
ACCEPTED VERSIO
N
SUBJECT TO FIN
AL EDITS
FINAL DRAFT Chapter 12 IPCC WGII Sixth Assessment Report
Do Not Cite, Quote or Distribute 12-164 Total pages: 181
Quiroga, S., C. Suárez, J. Diego Solís and P. Martinez-Juarez, 2020: Framing vulnerability and coffee farmers’ 1 behaviour in the context of climate change adaptation in Nicaragua. World Development, 126, 104733, 2 doi:10.1016/j.worlddev.2019.104733. 3
Rabatel, A. et al., 2018: Toward an imminent extinction of Colombian glaciers? Geografiska Annaler: Series A, 4 Physical Geography, 100(1), 75-95, doi:10.1080/04353676.2017.1383015. 5
Racloz, V., R. Ramsey, S. Tong and W. Hu, 2012: Surveillance of Dengue Fever Virus: A Review of Epidemiological 6 Models and Early Warning Systems. PLOS Neglected Tropical Diseases, 6(5), e1648, 7 doi:10.1371/journal.pntd.0001648. 8
Radel, C., B. Schmook, L. Carte and S. Mardero, 2018: Toward a Political Ecology of Migration: Land, Labor 9 Migration, and Climate Change in Northwestern Nicaragua. World Development, 108, 263-273, 10 doi:10.1016/j.worlddev.2017.04.023. 11
Raffaele, E., M. A. Nuñez, J. Eneström and M. Blackhall, 2016: Fire as mediator of pine invasion: evidence from 12 Patagonia, Argentina. Biological Invasions, 18(3), 597-601, doi:10.1007/s10530-015-1038-5. 13
Ragettli, S., W. W. Immerzeel and F. Pellicciotti, 2016: Contrasting climate change impact on river flows from high-14 altitude catchments in the Himalayan and Andes Mountains. Proceedings of the National Academy of Sciences, 15 113(33), 9222-9227, doi:10.1073/pnas.1606526113. 16
Ramajo, L. et al., 2019: Physiological responses of juvenile Chilean scallops (Argopecten purpuratus) to isolated and 17 combined environmental drivers of coastal upwelling. ICES Journal of Marine Science, 76(6), 1836-1849, 18 doi:10.1093/icesjms/fsz080. 19
Ramajo, L. et al., 2020: Upwelling intensity modulates the fitness and physiological performance of coastal species: 20 Implications for the aquaculture of the scallop Argopecten purpuratus in the Humboldt Current System. Science of 21 The Total Environment, 745, 140949, doi:10.1016/j.scitotenv.2020.140949. 22
Ramalho, Q. et al., 2021: Reforestation can compensate negative effects of climate change on amphibians. Biological 23 Conservation, 260, 109187, doi:10.1016/j.biocon.2021.109187. 24
Ramírez-Santana, M. et al., 2020: Reduced neurobehavioral functioning in agricultural workers and rural inhabitants 25 exposed to pesticides in northern Chile and its association with blood biomarkers inhibition. Environmental 26 Health, 19(1), 84, doi:10.1186/s12940-020-00634-6. 27
Ramirez-Villegas, J. et al., 2014: Using species distributions models for designing conservation strategies of Tropical 28 Andean biodiversity under climate change. Journal for Nature Conservation, 22(5), 391-404, 29 doi:10.1016/j.jnc.2014.03.007. 30
Rammig, A., 2020: Tropical carbon sinks are out of sync. Nature, 579(7797), 38-39, doi:10.1038/d41586-020-00423-8. 31 Ramos, E. P. and F. de Salles Cavedon-Capdeville, 2017: Regional responses to climate change and migration in Latin 32
America. In: Research Handbook on Climate Change, Migration and the Law [Mayer, B. and F. Crépeau (eds.)]. 33 Edward Elgar Publishing, pp. 262–287. 34
Ranasinghe, R. et al., 2021: Climate Change Information for Regional Impact and for Risk Assessment. In: Climate 35 Change 2021: The Physical Science Basis. Contribution of Working Group I to the Sixth Assessment Report of the 36 Intergovernmental Panel on Climate Change [Masson-Delmotte, V., P. Zhai, A. Pirani, S. L. Connors, C. Péan, S. 37 Berger, N. Caud, Y. Chen, L. Goldfarb, M. I. Gomis, M. Huang, K. Leitzell, E. Lonnoy, J. B. R. Matthews, T. K. 38 Maycock, T. Waterfield, O. Yelekçi, R. Yu and B. Zhou (eds.)]. Cambridge University Press. 39
Rangecroft, S. et al., 2013: Climate Change and Water Resources in Arid Mountains: An Example from the Bolivian 40 Andes. Ambio, 42(7), 852-863, doi:10.1007/s13280-013-0430-6. 41
Rao, N. D., B. J. van Ruijven, K. Riahi and V. Bosetti, 2017: Improving poverty and inequality modelling in climate 42 research. Nature Climate Change, 7(12), 857-862, doi:10.1038/s41558-017-0004-x. 43
Rasch, R., 2017: Income Inequality and Urban Vulnerability to Flood Hazard in Brazil. Social Science Quarterly, 98(1), 44 299-325, doi:10.1111/ssqu.12274. 45
Rasch, R. J., 2016: Assessing urban vulnerability to flood hazard in Brazilian municipalities. Environment and 46 Urbanization, 28(1), 145-168, doi:10.1177/0956247815620961. 47
Rasmussen, L. A., H. Conway and C. F. Raymond, 2007: Influence of upper air conditions on the Patagonia icefields. 48 Global and Planetary Change, 59(1), 203-216, doi:10.1016/j.gloplacha.2006.11.025. 49
Rasmussen, M. B., 2016a: Unsettling Times: Living with the Changing Horizons of the Peruvian Andes. Latin 50 American Perspectives, 43(4), 73-86, doi:10.1177/0094582x16637867. 51
Rasmussen, M. B., 2016b: Water futures: Contention in the construction of productive infrastructure in the peruvian 52 highlands. Anthropologica, 58(2), 211–226, doi:10.3138/anth.582.T04. 53
Raven, J. et al., 2018: Urban planning and design. In: Climate Change and Cities: Second Assessment Report of the 54 Urban Climate Change Research Network [Rosenzweig, C., W. Solecki, P. Romero-Lankao, S. Mehrotra, S. 55 Dhakal and S. Ali Ibrahim (eds.)]. Cambridge University Press, New York, United States of America, pp. 139–56 172. ISBN 978-1-316-60333-8. 57
Ray, D. K., J. S. Gerber, G. K. MacDonald and P. C. West, 2015: Climate variation explains a third of global crop yield 58 variability. Nature Communications, 6(1), 5989, doi:10.1038/ncomms6989. 59
Reay, D., 2019: Climate-Smart Coffee. In: Climate-Smart Food [Reay, D. (ed.)]. Springer International Publishing, 60 Cham, pp. 93-104. ISBN 978-3-030-18206-9. 61
ACCEPTED VERSIO
N
SUBJECT TO FIN
AL EDITS
FINAL DRAFT Chapter 12 IPCC WGII Sixth Assessment Report
Do Not Cite, Quote or Distribute 12-165 Total pages: 181
Reboita, M. S., R. P. da Rocha, M. R. de Souza and M. Llopart, 2018: Extratropical cyclones over the southwestern 1 South Atlantic Ocean: HadGEM2-ES and RegCM4 projections. International Journal of Climatology, 38(6), 2 2866-2879, doi:10.1002/joc.5468. 3
Reckien, D. et al., 2017: Climate change, equity and the Sustainable Development Goals: an urban perspective. 4 Environment and Urbanization, 29(1), 159-182, doi:10.1177/0956247816677778. 5
RedMuniCC, Red Chilena de Municipios ante el Cambio Climático. Available at: https://www.redmunicc.cl/. 6 Reguero, B. G. et al., 2015: Effects of climate change on exposure to coastal flooding in Latin America and the 7
Caribbean. PLoS ONE, 10(7), 1-19, doi:10.1371/journal.pone.0133409. 8 Rehm, E. M. and K. J. Feeley, 2015a: Freezing temperatures as a limit to forest recruitment above tropical Andean 9
treelines. Ecology, 96(7), 1856-1865, doi:10.1890/14-1992.1. 10 Rehm, E. M. and K. J. Feeley, 2015b: The inability of tropical cloud forest species to invade grasslands above treeline 11
during climate change: potential explanations and consequences. Ecography, 38(12), 1167-1175, 12 doi:10.1111/ecog.01050. 13
Reid, H. et al., 2018: Chapter 16 - A Framework for Assessing the Effectiveness of Ecosystem-Based Approaches to 14 Adaptation. In: Resilience [Zommers, Z. and K. Alverson (eds.)]. Elsevier Inc., pp. 207-216. ISBN 15 9780128118917. 16
Reid, J. L. et al., 2019: The ephemerality of secondary forests in southern Costa Rica. Conservation Letters, 12(2), 17 e12607, doi:10.1111/conl.12607. 18
Reinthaler, J. et al., 2019a: Fast shrinkage of glaciers on active volcanoes in Latin America. Journal of Glaciology. 19 Reinthaler, J. et al., 2019b: Area changes of glaciers on active volcanoes in Latin America between 1986 and 2015 20
observed from multi-temporal satellite imagery. Journal of Glaciology, 65(252), 542-556, 21 doi:10.1017/jog.2019.30. 22
Reis, S. M. et al., 2018: Climate and fragmentation affect forest structure at the southern border of Amazonia. Plant 23 Ecology & Diversity, 11(1), 13-25, doi:10.1080/17550874.2018.1455230. 24
Repetto, A., 2016: Crecimiento, pobreza y desigualdad: la vía chilena. Economía y Política, 3(1), 71-101, 25 doi:10.15691/07194714.2016.003. 26
Retsa, A. et al., 2020: Biodiversity and Ecosystem Services A business case for re/insurance. Swiss Re Management 27 Ltd, Zurich, Switzerland 60 pp. 28
Revi, A. et al., 2014: Urban areas. In: Climate Change 2014: Impacts, Adaptation, and Vulnerability. Part A: Global 29 and Sectoral Aspects. Contribution of Working Group II to the Fifth Assessment Report of the Intergovernmental 30 Panel of Climate Change [Field, C. B., V. R. Barros, D. J. Dokken, K. J. Mach, M. D. Mastrandrea, T. E. Bilir, M. 31 Chatterjee, K. L. Ebi, Y. O. Estrada, R. C. Genova, B. Girma, E. S. Kissel, A. N. Levy, S. MacCracken, P. R. 32 Mastrandrea and L. L. White (eds.)]. Cambridge University Press, Cambridge, United Kingdom and New York, 33 NY, USA, pp. 535-612. 34
Reyer, C. P. O. et al., 2017: Climate change impacts in Latin America and the Caribbean and their implications for 35 development. Regional Environmental Change, 17(6), 1601-1621, doi:10.1007/s10113-015-0854-6. 36
Reyes-García, V. et al., 2016: Local indicators of climate change: The potential contribution of local knowledge to 37 climate research. Wiley Interdisciplinary Reviews: Climate Change, 7(1), 109–124, doi:10.1002/wcc.374. 38
Rezende, O. M., F. M. Miranda, A. N. Haddad and M. G. Miguez, 2019: A Framework to Evaluate Urban Flood 39 Resilience of Design Alternatives for Flood Defence Considering Future Adverse Scenarios. Water, 11(7), 1485, 40 doi:10.3390/w11071485. 41
Ribalaygua, J., E. Gaitán, J. Pórtoles and R. Monjo, 2018: Climatic change on the Gulf of Fonseca (Central America) 42 using two-step statistical downscaling of CMIP5 model outputs. Theoretical and Applied Climatology, 132(3-4), 43 867-883, doi:10.1007/s00704-017-2130-9. 44
Ribeiro, L. C. S., E. O. V. Silva, J. R. L. Andrade and K. B. Souza, 2017: Tourism and regional development in the 45 Brazilian Northeast. Tourism Economics, 23(3), 717–727. Available at: 10.1177/1354816616652752. 46
Ribeiro Neto, A., A. R. da Paz, J. A. Marengo and S. C. Chou, 2016: Hydrological Processes and Climate Change in 47 Hydrographic Regions of Brazil. Journal of Water Resource and Protection, 08(12), 1103-1127, 48 doi:10.4236/jwarp.2016.812087. 49
Richards, P., H. Pellegrina, L. VanWey and S. Spera, 2015: Soybean Development: The Impact of a Decade of 50 Agricultural Change on Urban and Economic Growth in Mato Grosso, Brazil. PLOS ONE, 10(4), e0122510, 51 doi:10.1371/journal.pone.0122510. 52
Rito, K. F. et al., 2017: Precipitation mediates the effect of human disturbance on the Brazilian Caatinga vegetation. 53 Journal of Ecology, 105(3), 828-838, doi:10.1111/1365-2745.12712. 54
Robert, M. A., A. M. Stewart-Ibarra and E. L. Estallo, 2020: Climate change and viral emergence: evidence from 55 Aedes-borne arboviruses. Current opinion in virology, 40, 41-47, doi:10.1016/j.coviro.2020.05.001. 56
Robert, M. A. et al., 2019: Arbovirus emergence in the temperate city of Córdoba, Argentina, 2009–2018. Scientific 57 Data, 6(1), 276, doi:10.1038/s41597-019-0295-z. 58
Roco, L., B. Bravo-Ureta, A. Engler and R. Jara-Rojas, 2017: The Impact of Climatic Change Adaptation on 59 Agricultural Productivity in Central Chile: A Stochastic Production Frontier Approach. Sustainability, 9(9), 1648, 60 doi:10.3390/su9091648. 61
Roco, L., A. Engler, B. E. Bravo-Ureta and R. Jara-Rojas, 2015: Farmers’ perception of climate change in 62 mediterranean Chile. Regional Enviromental Change, 15(5), 867-879, doi:10.1007/s10113-014-0669-x. 63
ACCEPTED VERSIO
N
SUBJECT TO FIN
AL EDITS
FINAL DRAFT Chapter 12 IPCC WGII Sixth Assessment Report
Do Not Cite, Quote or Distribute 12-166 Total pages: 181
Roco, L., D. Poblete, F. Meza and G. Kerrigan, 2016: Farmers’ Options to Address Water Scarcity in a Changing 1 Climate: Case Studies from two Basins in Mediterranean Chile. Environmental Management, 58(6), 958-971, 2 doi:10.1007/s00267-016-0759-2. 3
Rodrigues, M. G. d. A. et al., 2019: The role of deforestation on American cutaneous leishmaniasis incidence: spatial-4 temporal distribution, environmental and socioeconomic factors associated in the Brazilian Amazon. Tropical 5 Medicine & International Health, 24(3), 348-355, doi:10.1111/tmi.13196. 6
Rodríguez-Catón, M., R. Villalba, M. Morales and A. Srur, 2016: Influence of droughts on Nothofagus pumilio forest 7 decline across northern Patagonia, Argentina. Ecosphere, 7(7), 1-17, doi:10.1002/ecs2.1390. 8
Rodríguez-Dueñas, A. and I. P. Rivera, 2016: Quito siembra: Agricultura urbana. Agencia de Promoción Económica 9 ConQuito Quito, A. d., Quito, Ecuador, 43 pp. Available at: http://www.conquito.org.ec/wp-10 content/uploads/2016/11/QUITO_SIEMBRA_AGRICULTURA_URBANA_CONQUITO.pdf (accessed 11 17/06/2021). 12
Rodríguez-Guerra, A. and N. Cuvi, 2019: Contaminación del Aire y Justicia Ambiental en Quito, Ecuador. Fronteiras: 13 Journal of Social, Technological and Environmental Science, 8(3), 13-46, doi:10.21664/2238-8869.2019v8i3.p13-14 46. 15
Rodriguez-Morales, A. J. et al., 2019: Epidemiology of zoonotic tick-borne diseases in Latin America: Are we just 16 seeing the tip of the iceberg? F1000Research, 7(1988), doi:10.12688/f1000research.17649.2. 17
Rodríguez-Morales, M. et al., 2019: Ecohydrology of the Venezuelan páramo: water balance of a high Andean 18 watershed. Plant Ecology and Diversity, 12(6), 573–591, doi:10.1080/17550874.2019.1673494. 19
Rodríguez-Morata, C. et al., 2018: Linking atmospheric circulation patterns with hydro-geomorphic disasters in Peru. 20 International Journal of Climatology, 38(8), 3388-3404, doi:10.1002/joc.5507. 21
Rodríguez-Morata, C. et al., 2019: The anomalous 2017 coastal El Niño event in Peru. Climate Dynamics, 52(9), 5605-22 5622, doi:10.1007/s00382-018-4466-y. 23
Rodríguez-Rodríguez, J. A., J. E. Mancera-Pineda and J. M. Rodríguez-P, 2016: Validación y aplicación de un modelo 24 de restauración de manglar basado en individuos para tres especies en la Ciénaga Grande de Santa Marta. 25 Caldasia, 38(2), 285-299, doi:10.15446/caldasia.v38n2.55360. 26
Rodríguez, D. I., G. Anríquez and J. L. Riveros, 2016: Food security and livestock: The case of Latin America and the 27 Caribbean. Ciencia e investigación agraria, 43(1), 5-15, doi:10.4067/S0718-16202016000100001 28
Rodríguez, L. et al., 2021: Agroforestry systems impact soil macroaggregation and enhance carbon storage in 29 Colombian deforested Amazonia. Geoderma, 384, 114810, doi:10.1016/j.geoderma.2020.114810. 30
Rojas, C., J. Pino, C. Basnou and M. Vivanco, 2013: Assessing land-use and -cover changes in relation to geographic 31 factors and urban planning in the metropolitan area of Concepción (Chile). Implications for biodiversity 32 conservation. Applied Geography, 39, 93-103, doi:10.1016/j.apgeog.2012.12.007. 33
Rojas, E., 2019: "No time to waste" in applying the lessons from Latin America's 50 years of housing policies. 34 Environment and Urbanization, 31(1), 177-192, doi:10.1177/0956247818781499. 35
Rojas, O. et al., 2017: Urban Growth and Flood Disasters in the Coastal River Basin of South-Central Chile (1943–36 2011). Sustainability, 9(2), doi:10.3390/su9020195. 37
Rolando, J. L. et al., 2017: Key ecosystem services and ecological intensification of agriculture in the tropical high-38 Andean Puna as affected by land-use and climate changes. Agriculture, Ecosystems & Environment, 236, 221-233, 39 doi:10.1016/j.agee.2016.12.010. 40
Rolla, A. L. et al., 2018: Climate impacts on crop yields in Central Argentina. Adaptation strategies. Agricultural 41 Systems, 160, 44-59, doi:10.1016/j.agsy.2017.08.007. 42
Rolla, A. L., M. N. Nuñez, J. J. Ramayón and M. E. Ramayón, 2019: Impacts of climate change on bovine livestock 43 production in Argentina. Climatic Change, 153(3), 439-455, doi:10.1007/s10584-019-02399-5. 44
Romanello, M., A. McGushin and C. Di Napoli, 2021: The 2021 Report of the Lancet Countdown on Health and 45 Climate Change. Lancet, T. Available at: https://www.thelancet.com/countdown-health-climate/about (accessed 46 25/08/2021). 47
Romeo, R., F. Grita, F. Parisi and L. Russo, 2020: Vulnerability of mountain peoples to food insecurity: updated data 48 and analysis of drivers. FAO and UNCCD, Rome, Italy, 124 pp. Available at: https://doi.org/10.4060/cb2409en 49 (accessed 29/06/2021). 50
Romero-Duque, L. P., J. M. Trilleras, F. Castellarini and S. Quijas, 2020: Ecosystem services in urban ecological 51 infrastructure of Latin America and the Caribbean: How do they contribute to urban planning? Science of The 52 Total Environment, 728, 138780, doi:10.1016/j.scitotenv.2020.138780. 53
Romero-Lankao, P. et al., 2018: Urban transformative potential in a changing climate. Nature Climate Change, 8(9), 54 754-756, doi:10.1038/s41558-018-0264-0. 55
Romero-Lankao, P. and D. Gnatz, 2019: Risk Inequality and the Food-Energy-Water (FEW) Nexus: A Study of 43 City 56 Adaptation Plans. Frontiers in Sociology, 4(31), doi:10.3389/fsoc.2019.00031. 57
Romero-Lankao, P., D. M. Gnatz, O. Wilhelmi and M. Hayden, 2016: Urban Sustainability and Resilience: From 58 Theory to Practice. Sustainability, 8(12), doi:10.3390/su8121224. 59
Romero-Lankao, P. et al., 2014: Scale, urban risk and adaptation capacity in neighborhoods of Latin American cities. 60 Habitat International, 42, 224-235, doi:10.1016/j.habitatint.2013.12.008. 61
ACCEPTED VERSIO
N
SUBJECT TO FIN
AL EDITS
FINAL DRAFT Chapter 12 IPCC WGII Sixth Assessment Report
Do Not Cite, Quote or Distribute 12-167 Total pages: 181
Romero-Lankao, P., H. Qin and M. Borbor-Cordova, 2013: Exploration of health risks related to air pollution and 1 temperature in three Latin American cities. Social Science & Medicine, 83, 110-118, 2 doi:10.1016/j.socscimed.2013.01.009. 3
Ronchail, J. et al., 2018: The flood recession period in Western Amazonia and its variability during the 1985–2015 4 period. Journal of Hydrology: Regional Studies, 15, 16-30, doi:10.1016/j.ejrh.2017.11.008. 5
Ronchi, S. and A. Arcidiacono, 2019: Adopting an Ecosystem Services-Based Approach for Flood Resilient Strategies: 6 The Case of Rocinha Favela (Brazil). Sustainability, 11(1), doi:10.3390/su11010004. 7
Rosa, L. and P. D'Odorico, 2019: The water-energy-food nexus of unconventional oil and gas extraction in the Vaca 8 Muerta Play, Argentina. Journal of Cleaner Production, 207, 743-750, doi:10.1016/j.jclepro.2018.10.039. 9
Rosales-Rueda, M., 2018: The impact of early life shocks on human capital formation: evidence from El Niño floods in 10 Ecuador. Journal of Health Economics, 62, 13-44, doi:10.1016/j.jhealeco.2018.07.003. 11
Rosenzweig, C. et al., 2018: Climate Change and Cities: Second Assessment Report of the Urban Climate Change 12 Research Network. In: Climate Change and Cities: Second Assessment Report of the Urban Climate Change 13 Research Network [Rosenzweig, C., W. D. Solecki, P. Romero-Lankao, S. Mehrotra, S. Dhakal and S. Ali 14 Ibrahim (eds.)]. Cambridge University Press, New York, United States of America, pp. xvii-xlii. ISBN 15 9781316603338. 16
Rosero, P. et al., 2021: Multi-taxa colonisation along the foreland of a vanishing equatorial glacier. Ecography, 44(7), 17 1010-1021, doi:10.1111/ecog.05478. 18
Rouault, F., F. Ossio, P. González-Levín and F. Meza, 2019: Impact of Climate Change on the Energy Needs of Houses 19 in Chile. Sustainability, 11(24), doi:10.3390/su11247068. 20
Roy, J. et al., 2018: Sustainable development, poverty eradication and reducing inequalities. In: Global Warming of 21 1.5°C. An IPCC Special Report on the impacts of global warming of 1.5°C above pre-industrial levels and related 22 global greenhouse gas emission pathways, in the context of strengthening the global response to the threat of 23 climate change, sustainable development, and efforts to eradicate poverty [Masson-Delmotte, V., P. Zhai, H.-O. 24 Pörtner, D. Roberts, J. Skea, P. R. Shukla, A. Pirani, W. Moufouma-Okia, C. Péan, R. Pidcock, S. Connors, J. B. 25 R. Matthews, Y. Chen, X. Zhou, M. I. Gomis, E. Lonnoy, T. Maycock, M. Tignor and T. Waterfield (eds.)]. In 26 Press. 27
Ruano, S. and A. Milan, 2014: Climate change, rainfall patterns, livelihoods and migration in Cabrican, Guatemala. 28 UNU-EHS Reports, 14, United Nations University, Bonn, 76 pp. pp. Available at: 29 http://i.unu.edu/media/ehs.unu.edu/news/3774/11648.pdf (accessed 17/06/2021). 30
Ruaro, R. et al., 2019: Climate change will decrease the range of a keystone fish species in La Plata River Basin, South 31 America. Hydrobiologia, 836(1), 1-19, doi:10.1007/s10750-019-3904-0. 32
Rubio-Palis, Y. et al., 2013: Malaria entomological risk factors in relation to land cover in the Lower Caura River 33 Basin, Venezuela. Memórias do Instituto Oswaldo Cruz, 108, 220-228, doi:10.1590/0074-0276108022013015. 34
Rudel, T. K. et al., 2015: LivestockPlus: Forages, sustainable intensification, and food security in the tropics. Ambio, 35 44(7), 685-693, doi:10.1007/s13280-015-0676-2. 36
Ruggiero, P. G. C., J. P. Metzger, L. Reverberi Tambosi and E. Nichols, 2019: Payment for ecosystem services 37 programs in the Brazilian Atlantic Forest: Effective but not enough. Land Use Policy, 82(November 2018), 283-38 291, doi:10.1016/j.landusepol.2018.11.054. 39
Ruiz-de-Oña, C., P. Rivera-Castañeda and Y. Merlín-Uribe, 2019: Coffee, Migration and Climatic Changes: 40 Challenging Adaptation Dichotomic Narratives in a Transborder Region. Social Sciences, 8(12), 323, 41 doi:10.3390/socsci8120323 42
Ruiz-Mallén, I., E. Corbera, D. Calvo-Boyero and V. Reyes-García, 2015: Participatory scenarios to explore local 43 adaptation to global change in biosphere reserves: Experiences from Bolivia and Mexico. Environmental Science 44 and Policy, 54, 398-408, doi:10.1016/j.envsci.2015.07.027. 45
Ruiz-Mallén, I., Á. Fernández-Llamazares and V. Reyes-García, 2017: Unravelling local adaptive capacity to climate 46 change in the Bolivian Amazon: the interlinkages between assets, conservation and markets. Climatic Change, 47 140(2), 227-242, doi:10.1007/s10584-016-1831-x. 48
Ruiz-Vásquez, M., P. A. Arias, J. A. Martínez and J. C. Espinoza, 2020: Effects of Amazon basin deforestation on 49 regional atmospheric circulation and water vapor transport towards tropical South America. Climate Dynamics, 50 54(9-10), 4169-4189, doi:10.1007/s00382-020-05223-4. 51
Rusticucci, M., M. Barrucand and S. Collazo, 2017: Temperature extremes in the Argentina central region and their 52 monthly relationship with the mean circulation and ENSO phases. International Journal of Climatology, 37(6), 53 3003-3017, doi:10.1002/joc.4895. 54
Rusticucci, M. et al., 2020: Hacia un Observatorio Latinoamericano de Clima y Salud: Seminario sobre Instrumentos y 55 Metodologías. Revista de Salud Ambiental, 20(2), 119–128. 56
Ryan, D., 2012: Report on the Status and Quality of Public Policies on Climate Change and Development in Latin 57 America - Agriculture and Forestry Sector. Plataforma Climática Latinoamericana, 26 pp. pp. 58
Ryan, D. and E. Bustos, 2019: Knowledge gaps and climate adaptation policy: a comparative analysis of six Latin 59 American countries. Climate Policy, 19(10), 1297-1309, doi:10.1080/14693062.2019.1661819. 60
Ryan, S. J., C. J. Carlson, E. A. Mordecai and L. R. Johnson, 2019: Global expansion and redistribution of Aedes-borne 61 virus transmission risk with climate change. PLOS Neglected Tropical Diseases, 13(3), e0007213, 62 doi:10.1371/journal.pntd.0007213. 63
ACCEPTED VERSIO
N
SUBJECT TO FIN
AL EDITS
FINAL DRAFT Chapter 12 IPCC WGII Sixth Assessment Report
Do Not Cite, Quote or Distribute 12-168 Total pages: 181
Sá, J. C. d. M. et al., 2017: Low-carbon agriculture in South America to mitigate global climate change and advance 1 food security. Environment International, 98, 102-112, doi:10.1016/j.envint.2016.10.020. 2
Saito, S. M. et al., 2019: Urban population exposed to risks of landslides, floods and flash floods in Brazil. Sociedade & 3 Natureza, 31, doi: 4
10.14393/SN-v31-2019-46320. 5 Salas, C. et al., 2016: The Forest Sector in Chile: An Overview and Current Challenges. Journal of Forestry, 114(5), 6
562-571, doi:10.5849/jof.14-062. 7 Salazar, A. et al., 2016: Deforestation changes land–atmosphere interactions across South American biomes. Global 8
and Planetary Change, 139, 97-108, doi:10.1016/j.gloplacha.2016.01.004. 9 Salazar, A. et al., 2018: The ecology of peace: preparing Colombia for new political and planetary climates. Frontiers 10
in Ecology and the Environment, 16(9), 525-531, doi:10.1002/fee.1950. 11 Salvador, C. et al., 2020: Effects of droughts on health: Diagnosis, repercussion, and adaptation in vulnerable regions 12
under climate change. Challenges for future research. Science of The Total Environment, 703, 134912, 13 doi:10.1016/j.scitotenv.2019.134912. 14
Sampaio, G. et al., 2019: Assessing the possible impacts of a 4 °C or higher warming in Amazonia. In: Climate Change 15 Risks in Brazil [Nobre, C., J. Marengo and W. Soares (eds.)]. Springer, Cham, pp. 201-218. ISBN 16 9783319928814. 17
Sampaio, G. et al., 2021: CO2 physiological effect can cause rainfall decrease as strong as large-scale deforestation in 18 the Amazon. Biogeosciences, 18(8), 2511-2525, doi:10.5194/bg-18-2511-2021. 19
Sánchez, A. L., N. E. Sánchez and A. M. Gómez Sánchez, 2017: Climatic phenomenon and meteorological variables 20 influencing the dengue fever incidence in Colombian South Pacific region: modeling study. Annals of Tropical 21 Medicine and Public Health, 10(6), 1489-1495. 22
Sánchez, E. et al., 2015: Regional climate modelling in CLARIS-LPB: a concerted approach towards twentyfirst 23 century projections of regional temperature and precipitation over South America. Climate Dynamics, 45(7-8), 24 2193-2212, doi:10.1007/s00382-014-2466-0. 25
Sánchez, T. et al., 2019: Association between air pollution and sleep disordered breathing in children. Pediatric 26 Pulmonology, 54(5), 544-550, doi:10.1002/ppul.24256. 27
Sandholz, S., W. Lange and U. Nehren, 2018: Governing green change: Ecosystem-based measures for reducing 28 landslide risk in Rio de Janeiro. International Journal of Disaster Risk Reduction, 32, 75-86, 29 doi:10.1016/j.ijdrr.2018.01.020. 30
Sandoval, V. and J. P. Sarmiento, 2019: A neglected issue: Informal settlements, urban development, and disaster risk 31 reduction in Latin America and the Caribbean. UNDRR Global Assessment Report on Disaster Risk Reduction 32 (GAR 2019), United Nations Office for Disaster Risk Reduction UNDRR, Geneva, 26 pp. Available at: 33 https://www.preventionweb.net/go/66656 (accessed 31/10/2020). 34
Santamaria-Aguilar, S., M. Schuerch, A. T. Vafeidis and S. C. Carretero, 2017: Long-Term Trends and Variability of 35 Water Levels and Tides in Buenos Aires and Mar del Plata, Argentina. Frontiers in Marine Science, 4(380), 36 doi:10.3389/fmars.2017.00380. 37
Santofimia, E. et al., 2017: Acid rock drainage in Nevado Pastoruri glacier area (Huascarán National Park, Perú): 38 hydrochemical and mineralogical characterization and associated environmental implications. Environmental 39 Science and Pollution Research, 24(32), 25243-25259, doi:10.1007/s11356-017-0093-0. 40
Santos, J., J. Monteiro, D. Ceballos and J. Soto, 2016: Lecciones aprendidas al enfrentar los efectos de eventos 41 hidrometeorológicos extremos en los sistemas agrícolas y servicios ecosistémicos en América Latina. La Granja, 42 24(2), 69-82, doi:10.17163/lgr.n24.2016.06. 43
Santos, R. B. d. and D. P. Marinho, 2018: Relatório do Projeto Construção de Indicadores de Vulnerabilidade da 44 População como Insumo para a Elaboração das Ações de Adaptação à Mudança do Clima no Brasil: Volume: 45 Espírito Santo. Fundação Oswaldo Cruz, Ministério do Meio Ambiente e Fundo Nacional sobre Mudança do 46 Clima FIOCRUZ, Rio de Janeiro, RJ, 120 pp. Available at: 47 https://www.mma.gov.br/images/arquivo/80182/Vulnerabilidade%20%C3%A0%20Mudan%C3%A7a%20do%2048 Clima/Relat%C3%B3rio_Final_EspiritoSanto_Novo.pdf (accessed 11/10/2020). 49
Sapiains Arrué, R. and A. M. Ugarte Caviedes, 2017: Contribuciones de la Psicología al abordaje de la dimensión 50 humana del cambio climático en Chile (Segunda parte). Interdisciplinaria. Revista de Psicología y Ciencias 51 Afines, 34(2), 259-274, doi:10.16888/interd.2017.34.1.6. 52
Sarkodie, S. A. and V. Strezov, 2019: Economic, social and governance adaptation readiness for mitigation of climate 53 change vulnerability: Evidence from 192 countries. Science of The Total Environment, 656, 150-164, 54 doi:10.1016/j.scitotenv.2018.11.349. 55
Sarricolea, P. and O. Meseguer-Ruiz, 2019: Urban Climates of Large Cities: Comparison of the Urban Heat Island 56 Effect in Latin America. In: Urban Climates in Latin America [Henríquez, C. and H. Romero (eds.)]. Springer 57 International Publishing, Cham, pp. 17-32. ISBN 978-3-319-97013-4. 58
Sarricolea, P. et al., 2020: Recent wildfires in Central Chile: Detecting links between burned areas and population 59 exposure in the wildland urban interface. Science of The Total Environment, 706, 135894, 60 doi:10.1016/j.scitotenv.2019.135894. 61
Satterthwaite, D. et al., 2020: Building Resilience to Climate Change in Informal Settlements. One Earth, 2(2), 143-62 156, doi:10.1016/j.oneear.2020.02.002. 63
ACCEPTED VERSIO
N
SUBJECT TO FIN
AL EDITS
FINAL DRAFT Chapter 12 IPCC WGII Sixth Assessment Report
Do Not Cite, Quote or Distribute 12-169 Total pages: 181
Satterthwaite, D. et al., 2018: Responding to climate change in cities and in their informal settlements and economies. 1 Background paper prepared for the IPCC International Scientific Conference on Cities and Climate Change in 2 Edmonton, March 2018. International Institute for Environment and Development (IIED) and IIED-América 3 Latina, 61 pp. Available at: https://pubs.iied.org/pdfs/G04328.pdf (accessed 21/09/2019). 4
Saurral, R. I., I. A. Camilloni and V. R. Barros, 2017: Low-frequency variability and trends in centennial precipitation 5 stations in southern South America. International Journal of Climatology, 37(4), 1774-1793, 6 doi:10.1002/joc.4810. 7
Saylor, C. R., K. A. Alsharif and H. Torres, 2017: The importance of traditional ecological knowledge in agroecological 8 systems in Peru. International Journal of Biodiversity Science, Ecosystem Services & Management, 13(1), 150-9 161, doi:10.1080/21513732.2017.1285814. 10
Scarano, F. R., 2017: Ecosystem-based adaptation to climate change: concept, scalability and a role for conservation 11 science. Perspectives in Ecology and Conservation, 15(2), 65-73, doi:10.1016/j.pecon.2017.05.003. 12
Scarano, F. R. and P. Ceotto, 2015: Brazilian Atlantic forest: impact, vulnerability, and adaptation to climate change. 13 Biodiversity and Conservation, 24(9), 2319-2331, doi:10.1007/s10531-015-0972-y. 14
Scarano, F. R. et al., 2018: Chapter 6: Options for governance and decision-making across scales and sectors. In: IPBES 15 (2018): The IPBES regional assessment report on biodiversity and ecosystem services for the Americas [Rice, J., 16 C. S. Seixas, M. E. Zaccagnini, M. Bedoya-Gaitán and N. Valderrama (eds.)]. Secretariat of the Intergovernmental 17 Science-Policy Platform on Biodiversity and Ecosystem Services, Bonn, Germany, pp. 521-581. ISBN 18 9783947851010. 19
Schaller, S., N. Jean-Baptiste and P. Lehmann, 2016: Oportunidades y obstáculos para la adaptación urbana frente al 20 cambio climático en América Latina: Casos de la Ciudad de México, Lima y Santiago de Chile. EURE (Santiago), 21 42(127), 257-278, doi:10.4067/S0250-71612016000300011. 22
Schauwecker, S. et al., 2017: The freezing level in the tropical Andes, Peru: An indicator for present and future glacier 23 extents. Journal of Geophysical Research: Atmospheres, 122(10), 5172-5189, doi:10.1002/2016JD025943. 24
Schembergue, A. et al., 2017: Sistemas Agroflorestais como Estratégia de Adaptação aos Desafios das Mudanças 25 Climáticas no Brasil. Revista de Economia e Sociologia Rural, 55(1), 9-30, doi:10.1590/1234-56781806-26 94790550101 27
Schivo, F., V. Bauni, P. Krug and R. D. Quintana, 2019: Distribution and richness of amphibians under different 28 climate change scenarios in a subtropical region of South America. Applied Geography, 103(February 2018), 70-29 89, doi:10.1016/j.apgeog.2019.01.003. 30
Schmidt, M. J. et al., 2014: Dark earths and the human built landscape in Amazonia: A widespread pattern of anthrosol 31 formation. Journal of Archaeological Science, doi:10.1016/j.jas.2013.11.002. 32
Schneider, W., D. Donoso, J. Garcés-Vargas and R. Escribano, 2017: Water-column cooling and sea surface salinity 33 increase in the upwelling region off central-south Chile driven by a poleward displacement of the South Pacific 34 High. Progress in Oceanography, 151, 38-48, doi:10.1016/j.pocean.2016.11.004. 35
Scholes, R. J., 2016: Climate change and ecosystem services. WIREs Climate Change, 7(4), 537-550, 36 doi:10.1002/wcc.404. 37
Schoolmeester, T. et al., 2018: The Andean Glacier and Water Atlas – The Impact of Glacier Retreat on Water 38 Resources. UNESCO and GRID-Arendal, Paris, France and Arendal, Norway, 77 pp. ISBN 978-92-3-100286-1. 39
Schütze, M., J. Seidel, A. Chamorro and C. León, 2019: Integrated modelling of a megacity water system – The 40 application of a transdisciplinary approach to the Lima metropolitan area. Journal of Hydrology, 573, 983-993, 41 doi:10.1016/j.jhydrol.2018.03.045. 42
Schwartzman, S. et al., 2013: The natural and social history of the indigenous lands and protected areas corridor of the 43 Xingu River basin. Philosophical Transactions of the Royal Society B: Biological Sciences, 368(1619), 20120164, 44 doi:10.1098/rstb.2012.0164. 45
Scientific American, 2015: El Niño golpea con fuerza a Centroamérica y trae sequía, inundaciones y hambre. Scientific 46 American Español. Available at: http://www.scientificamerican.com/espanol/noticias/el-nino-golpea-con-fuerza-47 a-centroamerica-y-trae-sequia-inundaciones-y-hambre/ (accessed 17/06/2021). 48
Scordo, F. et al., 2017: Evolution of Water Resources in the “Bajo de Sarmiento” (Extraandean Patagonia): Natural and 49 Anthropogenic Impacts. Anuário do Instituto de Geociências - UFRJ, 40(2), 106-117, 50 doi:10.11137/2017_2_106_117. 51
Scoville-Simonds, M., 2018: Climate, the Earth, and God – Entangled narratives of cultural and climatic change in the 52 Peruvian Andes. World Development, 110, 345-359, doi:10.1016/j.worlddev.2018.06.012. 53
Scoville-Simonds, M., H. Jamali and M. Hufty, 2020: The Hazards of Mainstreaming: Climate change adaptation 54 politics in three dimensions. World Development, 125, 104683, doi:10.1016/j.worlddev.2019.104683. 55
Secretaría de Recursos Naturales y Ambiente del Gobierno de la República de Honduras, 2018: Plan Nacional de 56 Adaptación al Cambio Climático de Honduras, Honduras, 67 pp. 57
Seddon, A. W. R. et al., 2016: Sensitivity of global terrestrial ecosystems to climate variability. Nature, 531, 229-232, 58 doi:10.1038/nature16986. 59
Sedeh, V., 2014: Floods and displacement in Bolivia. In: The State of Environmental Migration 2014: Review of the 60 Year 2013 [Gemenne, F., P. Brücker and D. Ionesco (eds.)]. International Organization for MIgration and 61 SciencesPo, Sc, pp. 175-187. 62
ACCEPTED VERSIO
N
SUBJECT TO FIN
AL EDITS
FINAL DRAFT Chapter 12 IPCC WGII Sixth Assessment Report
Do Not Cite, Quote or Distribute 12-170 Total pages: 181
Seehaus, T. et al., 2019: Changes of the tropical glaciers throughout Peru between 2000 and 2016 - Mass balance and 1 area fluctuations. The Cryosphere Discussions, 1-34, doi:10.5194/tc-2018-289. 2
Segnestam, L., 2017: Gendered Experiences of Adaptation to Drought: Patterns of Change in El Sauce, Nicaragua. 3 Latin American Research Review, 52(5), 807-823, doi:10.25222/larr.220. 4
Seiler, C., R. W. A. Hutjes and P. Kabat, 2013: Likely Ranges of Climate Change in Bolivia. Journal of Applied 5 Meteorology and Climatology, 52(6), 1303-1317, doi:10.1175/JAMC-D-12-0224.1. 6
Seimon, T. A. et al., 2017: Long-term monitoring of tropical alpine habitat change, Andean anurans, and chytrid fungus 7 in the Cordillera Vilcanota, Peru: Results from a decade of study. Ecology and Evolution, 7(5), 1527-1540, 8 doi:10.1002/ece3.2779. 9
Sena, A., C. Barcellos, C. Freitas and C. Corvalan, 2014: Managing the health impacts of drought in Brazil. 10 International Journal of Environmental Research and Public Health, 11(10), 10737-10751, 11 doi:10.3390/ijerph111010737. 12
Sena, A., C. Barcellos, C. Freitas and C. Corvalan, 2016: Managing the health impacts of drought in Brazil: A 13 comprehensive risk reduction framework. In: Climate Services for health: Improving public health decision-14 making in a new climate - Case studies [Shumake-Guillemot, J. and L. Fernandez-Montoya (eds.)]. World 15 Meteorological Organization and World Health Organization, Geneva, pp. 166-169. 16
Seneviratne, S. I. et al., 2021: Weather and Climate Extreme Events in a Changing Climate. In: Climate Change 2021: 17 The Physical Science Basis. Contribution of Working Group I to the Sixth Assessment Report of the 18 Intergovernmental Panel on Climate Change [Masson-Delmotte, V., P. Zhai, A. Pirani, S. L. Connors, C. Péan, S. 19 Berger, N. Caud, Y. Chen, L. Goldfarb, M. I. Gomis, M. Huang, K. Leitzell, E. Lonnoy, J. B. R. Matthews, T. K. 20 Maycock, T. Waterfield, O. Yelekçi, R. Yu and B. Zhou (eds.)]. Cambridge University Press. 21
Sepúlveda, S. A., S. M. Moreiras, M. Lara and A. Alfaro, 2015: Debris flows in the Andean ranges of central Chile and 22 Argentina triggered by 2013 summer storms: characteristics and consequences. Landslides, 12(1), 115-133, 23 doi:10.1007/s10346-014-0539-0. 24
Serrano Vincenti, S., J. C. Ruiz and F. Bersosa, 2017: Heavy rainfall and temperature projections in a climate change 25 scenario over Quito, Ecuador. La Granja: Revista de Ciencias de la Vida, 25(1), 16-32, 26 doi:10.17163/lgr.n25.2017.02. 27
Sette Whitaker Ferreira, J. et al., 2020: Housing policies and the roles of local governments in Latin America: recent 28 experiences. Environment and Urbanization, 32(2), 333-350, doi:10.1177/0956247820935699. 29
SGR, 2018: Plan Nacional de Respuesta ante Desastres de Ecuador. Secretaría de Gestión de Riesgos, 448 pp. 30 Available at: https://www.gestionderiesgos.gob.ec/wp-content/uploads/downloads/2018/08/Plan-Nacional-de-31 Respuesta-SGR-RespondeEC.pdf (accessed 17/06/2021). 32
SGRD et al., 2014: Plan Nacional de Gestión del Riesgo de Desastres 2014-2021 de Perú. Lima, 70 pp. Available at: 33 https://www.indeci.gob.pe/wp-content/uploads/2019/01/fil20140605171327.pdf (accessed 17/06/2021). 34
Shapiro-Garza, E. et al., 2020: A participatory framework for feasibility assessments of climate change resilience 35 strategies for smallholders: lessons from coffee cooperatives in Latin America. Int. J. Agric. Sustain., 18(1), 21-36 34, doi:10.1080/14735903.2019.1658841. 37
Sharma, N. et al., 2016: Bioenergy from agroforestry can lead to improved food security, climate change, soil quality, 38 and rural development. Food and Energy Security, 5(3), 165-183, doi:10.1002/fes3.87. 39
Sheffield, P. E. et al., 2013: Current and Future Heat Stress in Nicaraguan Work Places under a Changing Climate. 40 Industrial Health, 51(1), 123-127, doi:10.2486/indhealth.2012-0156. 41
Shepard, G. H. et al., 2020: Ancient and Traditional Agriculture in South America: Tropical Lowlands. Environmental 42 Science, doi:10.1093/acrefore/9780199389414.013.597. 43
Sherman, M. et al., 2015: Vulnerability and adaptive capacity of community food systems in the Peruvian Amazon: a 44 case study from Panaillo. Natural Hazards, 77(3), 2049-2079, doi:10.1007/s11069-015-1690-1. 45
Shi, L. et al., 2016: Roadmap towards justice in urban climate adaptation research. Nature Climate Change, 6(2), 131-46 137, doi:10.1038/nclimate2841. 47
Shokry, G., J. J. T. Connolly and I. Anguelovski, 2020: Understanding climate gentrification and shifting landscapes of 48 protection and vulnerability in green resilient Philadelphia. Urban Climate, 31, 100539, 49 doi:10.1016/j.uclim.2019.100539. 50
Sietsma, A. J., J. D. Ford, M. W. Callaghan and J. C. Minx, 2021: Progress in climate change adaptation research. 51 Environmental Research Letters, 16(5), 054038, doi:10.1088/1748-9326/abf7f3. 52
Silva, A. M. C. d., I. E. Mattos, E. Ignotti and S. d. S. Hacon, 2013: Material particulado originário de queimadas e 53 doenças respiratórias Revista de Saúde Pública, 47 345-352, doi:10.1590/S0034-8910.2013047004410. 54
Silva, C., F. Leiva and J. Lastra, 2019a: Predicting the current and future suitable habitat distributions of the anchovy 55 (Engraulis ringens) using the Maxent model in the coastal areas off central-northern Chile. Fisheries 56 Oceanography, 28(2), 171-182, doi:10.1111/fog.12400. 57
Silva, C. et al., 2015: Forecasts of swordfish (Xiphias gladius) and common sardine (Strangomera bentincki) off Chile 58 under the A2 IPCC climate change scenario. Progress in Oceanography, 134, 343-355, 59 doi:10.1016/j.pocean.2015.03.004. 60
Silva de Souza, K. I., P. L. Borges Chaffe, T. M. Portela Nogueira and C. R. Silva de Carvalho Pinto, 2021: 61 Environmental damage of urbanized stream corridors in a coastal plain in Southern Brazil. Ocean & Coastal 62 Management, 211, 105739, doi:10.1016/j.ocecoaman.2021.105739. 63
ACCEPTED VERSIO
N
SUBJECT TO FIN
AL EDITS
FINAL DRAFT Chapter 12 IPCC WGII Sixth Assessment Report
Do Not Cite, Quote or Distribute 12-171 Total pages: 181
Silva, E., 2016: Patagonia, without Dams! Lessons of a David vs. Goliath campaign. The Extractive Industries and 1 Society, 3(4), 947-957, doi:10.1016/J.EXIS.2016.10.004. 2
Silva, H. et al., 2016: Effect of water availability on growth, water use efficiency and omega 3 (ALA) content in two 3 phenotypes of chia (Salvia hispanica L.) established in the arid Mediterranean zone of Chile. Agric. Water 4 Manage., 173(2016), 67-75, doi:10.1016/j.agwat.2016.04.028. 5
Silva, H. V. d. O., D. P. Marinho and F. C. V. Marincola, 2018: Relatório do Projeto Construção de Indicadores de 6 Vulnerabilidade da População como Insumo para a Elaboração das Ações de Adaptação à Mudança do Clima no 7 Brasil: Volume: Maranhão. Fundação Oswaldo Cruz, Ministério do Meio Ambiente e Fundo Nacional sobre 8 Mudança do Clima FIOCRUZ, Rio de Janeiro, RJ, 160 pp. Available at: 9 https://www.mma.gov.br/images/arquivo/80182/Vulnerabilidade%20%C3%A0%20Mudan%C3%A7a%20do%2010 Clima/Relat%C3%B3rio_Final_Maranhao_Novo.pdf (accessed 11/10/2020). 11
Silva, J. L. B. d. et al., 2020: Changes in the water resources, soil use and spatial dynamics of Caatinga vegetation cover 12 over semiarid region of the Brazilian Northeast. Remote Sensing Applications: Society and Environment, 20, 13 100372, doi:10.1016/j.rsase.2020.100372. 14
Silva, J. L. S. E. et al., 2019b: Climate change will reduce suitable Caatinga dry forest habitat for endemic plants with 15 disproportionate impacts on specialized reproductive strategies. PLoS ONE, 14(5), e0217028, 16 doi:10.1371/journal.pone.0217028. 17
Silva, J. M. C., L. C. F. Barbosa, I. R. Leal and M. Tabarelli, 2017: The Caatinga: Understanding the Challenges. In: 18 Caatinga: The Largest Tropical Dry Forest Region in South America, 1st ed. [Silva, J. M. C. d., I. R. Leal and M. 19 Tabarelli (eds.)]. Springer, Cham, Switzerland, pp. 3-19. ISBN 978-3-319-68339-3. 20
Silva, J. M. C. d., A. Rapini, L. C. F. Barbosa and R. R. Torres, 2019c: Extinction risk of narrowly distributed species 21 of seed plants in Brazil due to habitat loss and climate change. PeerJ, 7, e7333, doi:10.7717/peerj.7333. 22
Silva Junior, C. H. L. et al., 2019: Fire Responses to the 2010 and 2015/2016 Amazonian Droughts. Frontiers in Earth 23 Science, 7(97), doi:10.3389/feart.2019.00097. 24
Silva Junior, C. H. L. et al., 2021: The Brazilian Amazon deforestation rate in 2020 is the greatest of the decade. Nature 25 Ecology & Evolution, 5(2), 144-145, doi:10.1038/s41559-020-01368-x. 26
Silva, P. S. et al., 2019d: Impacts of the 1.5 °C global warming target on future burned area in the Brazilian Cerrado. 27 Forest Ecology and Management, 446, 193-203, doi:10.1016/j.foreco.2019.05.047. 28
Silva, R. et al., 2014: Present and Future Challenges of Coastal Erosion in Latin America. Journal of Coastal Research, 29 71(sp1), 1-16, doi:10.2112/SI71-001.1. 30
Silva Rodríguez de San Miguel, J. A., E. Martínez Díaz and D. M. Monroy Becerril, 2021: The relationship between 31 climate change and internal migration in the Americas. Management of Environmental Quality: An International 32 Journal, 32(4), 822-839, doi:10.1108/MEQ-01-2021-0020. 33
Singh-Renton, S. and I. McIvor, 2015: Review of current fisheries management performance and conservation 34 measures in the WECAFC area. FAO Fisheries and Aquaculture Technical Paper, Bridgetown, Barbados, 293 pp. 35 pp. Available at: http://www.fao.org/documents/card/en/c/da5cd80f-0e6e-427b-9ac1-9f0be50cf1c5/ (accessed 36 17/06/2021). 37
Singh, C. et al., 2020a: Assessing the feasibility of adaptation options: methodological advancements and directions for 38 climate adaptation research and practice. Climatic Change, 162(2), 255-277, doi:10.1007/s10584-020-02762-x. 39
Singh, N., S. Singh and R. K. Mall, 2020b: Chapter 17 - Urban ecology and human health: implications of urban heat 40 island, air pollution and climate change nexus. In: Urban Ecology [Verma, P., P. Singh, R. Singh and A. S. 41 Raghubanshi (eds.)]. Elsevier, pp. 317-334. ISBN 978-0-12-820730-7. 42
Singh, R. and G. S. Singh, 2017: Traditional agriculture: a climate-smart approach for sustainable food production. 43 Energy, Ecology and Environment, 2(5), 296-316, doi:10.1007/s40974-017-0074-7. 44
Siña, M. et al., 2016: Understanding Perceptions of Climate Change, Priorities, and Decision-Making among 45 Municipalities in Lima, Peru to Better Inform Adaptation and Mitigation Planning. PLOS ONE, 11(1), e0147201, 46 doi:10.1371/journal.pone.0147201. 47
Sippy, R. et al., 2019: Seasonal patterns of dengue fever in rural Ecuador: 2009-2016. PLOS Neglected Tropical 48 Diseases, 13(5), e0007360, doi:10.1371/journal.pntd.0007360. 49
Skansi, M. d. l. M. et al., 2013: Warming and wetting signals emerging from analysis of changes in climate extreme 50 indices over South America. Global and Planetary Change, 100, 295-307, doi:10.1016/j.gloplacha.2012.11.004. 51
Skarbø, K. and K. VanderMolen, 2016: Maize migration: key crop expands to higher altitudes under climate change in 52 the Andes. Climate and Development, 8(3), 245-255, doi:10.1080/17565529.2015.1034234. 53
Sloat, L. L. et al., 2020: Climate adaptation by crop migration. Nature Communications, 11(1), 1243, 54 doi:10.1038/s41467-020-15076-4. 55
Smith, L. T., L. E. O. C. Aragão, C. E. Sabel and T. Nakaya, 2014: Drought impacts on children's respiratory health in 56 the Brazilian Amazon. Scientific Reports, 4, 3726, doi:10.1038/srep03726. 57
Smith, P. and C. Henríquez, 2019: Public Spaces as Climate Justice Places? Climate Quality in the City of Chillán, 58 Chile. Environmental Justice, 12(4), 164-174, doi:10.1089/env.2018.0041. 59
Soares-Filho, B. et al., 2014: Cracking Brazil's Forest Code. Science, 344(6182), 363-364, 60 doi:10.1126/science.1246663. 61
Soares, M. D. R. et al., 2021: Land-use change and its impact on physical and mechanical properties of Archaeological 62 Black Earth in the Amazon rainforest. CATENA, 202, 105266, doi:10.1016/j.catena.2021.105266. 63
ACCEPTED VERSIO
N
SUBJECT TO FIN
AL EDITS
FINAL DRAFT Chapter 12 IPCC WGII Sixth Assessment Report
Do Not Cite, Quote or Distribute 12-172 Total pages: 181
Sombroek, W. et al., 2003: Amazonian Dark Earths as Carbon Stores and Sinks. In: Amazonian dark earths. Springer, 1 Dordrecht, pp. 125-139. 2
Somers, L. D. et al., 2019: Groundwater Buffers Decreasing Glacier Melt in an Andean Watershed—But Not Forever. 3 Geophysical Research Letters, 46(22), 13016-13026, doi:10.1029/2019GL084730. 4
Son, J. Y. et al., 2016: The impact of temperature on mortality in a subtropical city: effects of cold, heat, and heat waves 5 in São Paulo, Brazil. International Journal of Biometeorology, 60(1), 113-121, doi:10.1007/s00484-015-1009-7. 6
Soruco, A. et al., 2015: Contribution of glacier runoff to water resources of La Paz city, Bolivia (16° S). Annals of 7 Glaciology, 56(70), 147-154, doi:10.3189/2015AoG70A001. 8
Sosa-Rodriguez, F. S., 2014: From federal to city mitigation and adaptation: climate change policy in Mexico City. 9 Mitigation and Adaptation Strategies for Global Change, 19(7), 969-996, doi:10.1007/s11027-013-9455-1. 10
Soto, D. et al., 2019: Salmon farming vulnerability to climate change in southern Chile: understanding the biophysical, 11 socioeconomic and governance links. Reviews in Aquaculture, 11(2), 354-374, doi:10.1111/raq.12336. 12
Soto Winckler, J. and G. Del Castillo Pantoja, 2019: Agua como recurso estratégico: Desafíos para Chile en un 13 escenario de cambio climático. Revista Política y Estrategia, 134, 55-92, doi:10.26797/rpye.v0i134.787. 14
Souza, C. M. et al., 2020: Reconstructing Three Decades of Land Use and Land Cover Changes in Brazilian Biomes 15 with Landsat Archive and Earth Engine. Remote Sensing, 12(17), doi:10.3390/rs12172735. 16
Souza, C. R. d. G., A. P. Souza and J. Harari, 2019: Long Term Analysis of Meteorological-Oceanographic Extreme 17 Events for the Baixada Santista Region. In: Climate Change in Santos Brazil: Projections, Impacts and 18 Adaptation Options [Nunes, L. H., R. Greco and J. A. Marengo (eds.)]. Springer International Publishing, Cham, 19 pp. 97-134. ISBN 978-3-319-96535-2. 20
Souza Piao, R., V. L. Silva, I. Navarro del Aguila and J. de Burgos Jiménez, 2021: Green Growth and Agriculture in 21 Brazil. Sustainability, 13(3), doi:10.3390/su13031162. 22
Spalding, M. D. et al., 2007: Marine Ecoregions of the World: A Bioregionalization of Coastal and Shelf Areas. 23 BioScience, 57(7), 573-583, doi:10.1641/b570707. 24
Spalding, M. D. et al., 2014: The role of ecosystems in coastal protection: Adapting to climate change and coastal 25 hazards. Ocean and Coastal Management, 90, 50-57, doi:10.1016/j.ocecoaman.2013.09.007. 26
Spencer, B. et al., 2017: Case studies in co-benefits approaches to climate change mitigation and adaptation. Journal of 27 Environmental Planning and Management, 60(4), 647-667, doi:10.1080/09640568.2016.1168287. 28
Spencer, N. and M.-A. Urquhart, 2018: Hurricane Strikes and Migration: Evidence from Storms in Central America and 29 the Caribbean. Weather, Climate, and Society, 10(3), 569-577, doi:10.1175/WCAS-D-17-0057.1. 30
Spera, S. A., J. M. Winter and T. F. Partridge, 2020: Brazilian maize yields negatively affected by climate after land 31 clearing. Nature Sustainability, 3(10), 845-852, doi:10.1038/s41893-020-0560-3. 32
Spinoni, J. et al., 2019: A new global database of meteorological drought events from 1951 to 2016. Journal of 33 Hydrology: Regional Studies, 22, 100593, doi:10.1016/j.ejrh.2019.100593. 34
Spinoni, J. et al., 2015: Towards identifying areas at climatological risk of desertification using the Köppen–Geiger 35 classification and FAO aridity index. International Journal of Climatology, 35(9), 2210-2222, 36 doi:10.1002/joc.4124. 37
Stan, K. et al., 2020: Climate change scenarios and projected impacts for forest productivity in Guanacaste Province 38 (Costa Rica): lessons for tropical forest regions. Regional Environmental Change, 20(1), 14, doi:10.1007/s10113-39 020-01602-z. 40
Stathatou, P. Μ. et al., 2016: Vulnerability of water systems: a comprehensive framework for its assessment and 41 identification of adaptation strategies. Desalination and Water Treatment, 57(5), 2243-2255, 42 doi:10.1080/19443994.2015.1012341. 43
Stäubli, A. et al., 2018: Analysis of Weather- and Climate-Related Disasters in Mountain Regions Using Different 44 Disaster Databases. In: Climate Change, Extreme Events and Disaster Risk Reduction: Towards Sustainable 45 Development Goals [Mal, S., R. B. Singh and C. Huggel (eds.)]. Springer International Publishing, Cham, pp. 17-46 41. ISBN 978-3-319-56469-2. 47
Stein, A., 2019: Adaptación al cambio climático en ciudades con altos niveles de riesgo social y ambiental: El caso de 48 dos barrios populares en Tegucigalpa, Honduras. Medio Ambiente y Urbanización, 90(1), 169-204. 49
Stein, A. and C. Moser, 2014: Asset planning for climate change adaptation: Lessons from Cartagena, Colombia. 50 Environment and Urbanization, 26(1), 166-183, doi:10.1177/0956247813519046. 51
Stein, A. and C. Moser, 2015: La planificación de activos para la adaptación al cambio climático: lecciones de 52 Cartagena, Colombia. Medio Ambiente y Urbanización, 83, Latina, I.-A., 49-70 pp. Available at: 53 https://www.ingentaconnect.com/contentone/iieal/meda/2015/00000083/00000001/art00003 (accessed 54 31/10/2020). 55
Stein, A., C. Moser and I. Vance, 2018: Asset Planning for Climate Change Adaptation in Poor Neighborhoods of 56 Tegucigalpa, Honduras. Inter-American Development Bank, 94 pp. Available at: 57 https://publications.iadb.org/publications/english/document/Asset-Planning-for-Climate-Change-Adaptation-in-58 Poor-Neighborhoods-of-Tegucigalpa-Honduras.pdf (accessed 31/10/2020). 59
Stein Heinemann, A., 2018: Cambio climático y conflictividad socioambiental en América Latina y el Caribe. América 60 Latina Hoy, 79, 9-39, doi:10.14201/alh201879939. 61
ACCEPTED VERSIO
N
SUBJECT TO FIN
AL EDITS
FINAL DRAFT Chapter 12 IPCC WGII Sixth Assessment Report
Do Not Cite, Quote or Distribute 12-173 Total pages: 181
Stennett-Brown, R. K., J. J. P. Jones, T. S. Stephenson and M. A. Taylor, 2017: Future Caribbean temperature and 1 rainfall extremes from statistical downscaling. International Journal of Climatology, 37(14), 4828-4845, 2 doi:10.1002/joc.5126. 3
Stensrud, A. B., 2016: Harvesting Water for the Future: Reciprocity and Environmental Justice in the Politics of 4 Climate Change in Peru. Latin American Perspectives, 43(4), 56-72, doi:10.1177/0094582x16637866. 5
Stewart-Ibarra, A. M. and R. Lowe, 2013: Climate and non-climate drivers of dengue epidemics in southern coastal 6 Ecuador. The American Journal of Tropical Medicine and Hygiene, 88(5), 971-981, doi:10.4269/ajtmh.12-0478. 7
Storlazzi, C. D. et al., 2018: Most atolls will be uninhabitable by the mid-21st century because of sea-level rise 8 exacerbating wave-driven flooding. Science Advances, 4(4), eaap9741, doi:10.1126/sciadv.aap9741. 9
Strassburg, B. B. N. et al., 2019: Strategic approaches to restoring ecosystems can triple conservation gains and halve 10 costs. Nature Ecology & Evolution, 3(1), 62-70, doi:10.1038/s41559-018-0743-8. 11
Strassburg, B. B. N. et al., 2017: Moment of truth for the Cerrado hotspot. Nature Ecology & Evolution, 1(4), 0099, 12 doi:10.1038/s41559-017-0099. 13
Strassburg, B. B. N. et al., 2020: Global priority areas for ecosystem restoration. Nature, doi:10.1038/s41586-020-2784-14 9. 15
Strassburg, B. B. N. et al., 2014: Biophysical suitability, economic pressure and land-cover change: a global 16 probabilistic approach and insights for REDD+. Sustainability Science, 9(2), 129-141, doi:10.1007/s11625-013-17 0209-5. 18
Suarez, M. L., L. Ghermandi and T. Kitzberger, 2004: Factors predisposing episodic drought-induced tree mortality in 19 Nothofagus– site, climatic sensitivity and growth trends. Journal of Ecology, 92(6), 954-966, doi:10.1111/j.1365-20 2745.2004.00941.x. 21
Sudmeier-Rieux, K. et al., 2017: Identifying emerging issues in disaster risk reduction, migration, climate change and 22 sustainable development. Springer, Switzerland. ISBN 3319338781. 23
Sullivan, M. J. P. et al., 2020: Long-term thermal sensitivity of Earth's tropical forests. Science 368(6493), 869-874, 24 doi:10.1126/science.aaw7578. 25
Sun, Q. et al., 2019: Global heat stress on health, wildfires, and agricultural crops under different levels of climate 26 warming. Environment International, 128, 125-136, doi:10.1016/j.envint.2019.04.025. 27
Sun, Q. et al., 2021: A global, continental, and regional analysis of changes in extreme precipitation. Journal of 28 Climate, 34(1), 243-258, doi:10.1175/JCLI-D-19-0892.1. 29
Takahashi, K. and A. G. Martínez, 2019: The very strong coastal El Niño in 1925 in the far-eastern Pacific. Climate 30 Dynamics, 52(12), 7389-7415, doi:10.1007/s00382-017-3702-1. 31
Tall, A., J. Y. Coulibaly and M. Diop, 2018: Do climate services make a difference? A review of evaluation 32 methodologies and practices to assess the value of climate information services for farmers: Implications for 33 Africa. Climate Services, 11, 1-12, doi:10.1016/j.cliser.2018.06.001. 34
Tanner, T. et al., 2015a: Livelihood resilience in the face of climate change. Nature Climate Change, 5(1), 23-26, 35 doi:10.1038/nclimate2431. 36
Tanner, T. et al., 2015b: The Triple Dividend of Resilience. Realising development goals through the multiple benefits 37 of disaster risk management. Overseas Development Institute, International Bank of Reconstruction and 38 Development and World Bank, London, UK and Washington D.C., United States of America, 37 pp. Available at: 39 https://www.gfdrr.org/sites/default/files/publication/The_Triple_Dividend_of_Resilience.pdf (accessed 40 31/08/2021). 41
Tapasco, J. et al., 2015: Impactos Económicos del Cambio Climático en Colombia: Sector Ganadero. Monografía No. 42 254, Banco Interamericano de Desarrollo, Washington D.C., United States, 45 pp. Available at: 43 https://publications.iadb.org/publications/spanish/document/Impactos-econ%C3%B3micos-del-cambio-44 clim%C3%A1tico-en-Colombia-sector-ganadero.pdf (accessed 25/08/2021). 45
Tapia-Garay, V. et al., 2018: Assessing the risk zones of Chagas' disease in Chile, in a world marked by global climatic 46 change. Memórias do Instituto Oswaldo Cruz, 113(1), 24-29, doi:10.1590/0074-02760170172. 47
Taylor, M. A. et al., 2018: Future Caribbean climates in a world of rising temperatures: The 1.5 vs 2.0 Dilemma. 48 Journal of Climate, 31(7), 2907-2926, doi:10.1175/JCLI-D-17-0074.1. 49
Teferi, Z. A. and P. Newman, 2018: Slum Upgrading: Can the 1.5 °C Carbon Reduction Work with SDGs in these 50 Settlements? Urban Planning, 3(2), doi:10.17645/up.v3i2.1239. 51
Tehelen, K. and M. J. Pacha, 2017: Estudios de vulnerabilidad en América Latina y el Caribe: recomendaciones a 52 través de la experiencia. CDKN, 28 pp. Available at: https://cdkn.org/wp-content/uploads/2017/05/Guia-53 Vulnerabilidad-ok.pdf (accessed 17/06/2021). 54
Teichmann, C. et al., 2013: How does a regional climate model modify the projected climate change signal of the 55 driving GCM: A study over different CORDEX regions using REMO. Atmosphere, 4(2), 214-236, 56 doi:10.3390/atmos4020214. 57
Teixeira, C. D. et al., 2019: Sustained mass coral bleaching (2016–2017) in Brazilian turbid-zone reefs: taxonomic, 58 cross-shelf and habitat-related trends. Coral Reefs, 38(4), 801-813, doi:10.1007/s00338-019-01789-6. 59
Tellman, B. et al., 2018: Opportunities for natural infrastructure to improve urban water security in Latin America. 60 PLOS ONE, 13(12), e0209470, doi:10.1371/journal.pone.0209470. 61
ACCEPTED VERSIO
N
SUBJECT TO FIN
AL EDITS
FINAL DRAFT Chapter 12 IPCC WGII Sixth Assessment Report
Do Not Cite, Quote or Distribute 12-174 Total pages: 181
Tellman, B., J. E. Saiers and O. A. R. Cruz, 2016: Quantifying the impacts of land use change on flooding in data-poor 1 watersheds in El Salvador with community-based model calibration. Regional Environmental Change, 16(4), 2 1183-1196, doi:10.1007/s10113-015-0841-y. 3
Tellman, B. et al., 2020: Illicit Drivers of Land Use Change: Narcotrafficking and Forest Loss in Central America. 4 Global Environmental Change, 63, 102092, doi:10.1016/j.gloenvcha.2020.102092. 5
Tengö, M. et al., 2014: Connecting Diverse Knowledge Systems for Enhanced Ecosystem Governance: The Multiple 6 Evidence Base Approach. AMBIO, 43(5), 579-591, doi:10.1007/s13280-014-0501-3. 7
Terrazas, C., J. A. Castro-Rodriguez, C. A. Camargo Jr and A. Borzutzky, 2019: Solar radiation, air pollution, and 8 bronchiolitis hospitalizations in Chile: An ecological study. Pediatric Pulmonology, 54(9), 1466-1473, 9 doi:10.1002/ppul.24421. 10
Thiede, B., C. Gray and V. Mueller, 2016: Climate variability and inter-provincial migration in South America, 1970–11 2011. Global Environmental Change, 41, 228-240, doi:10.1016/j.gloenvcha.2016.10.005. 12
Thielen, D. et al., 2020: Quo vadis Pantanal? Expected precipitation extremes and drought dynamics from changing sea 13 surface temperature. PLOS ONE, 15(1), e0227437, doi:10.1371/journal.pone.0227437. 14
Thomas, G., 2014: Ciudades más verdes en América Latina y el Caribe. Un informe de la FAO sobre la Agricultura 15 Urbana y Periurbana en la región. FAO (Organización de las Naciones Unidas para la Agricultura y la 16 Alimentación), Roma, 51 pp. Available at: http://www.fao.org/ag/agp/greenercities/pdf/GGCLAC/Ciudades-mas-17 verdes-America-Latina-Caribe.pdf (accessed 17/06/2021). 18
Thomas, K. et al., 2019: Explaining differential vulnerability to climate change: A social science review. WIREs 19 Climate Change, 10(2), e565, doi:10.1002/wcc.565. 20
Thompson-Hall, M., E. R. Carr and U. Pascual, 2016: Enhancing and expanding intersectional research for climate 21 change adaptation in agrarian settings. Ambio, 45(3), 373-382, doi:10.1007/s13280-016-0827-0. 22
Thompson, D., 2016: Community adaptations to environmental challenges under decentralized governance in 23 southwestern Uruguay. J. Rural Stud., 43, 71-82, doi:10.1016/j.jrurstud.2015.11.008. 24
Thompson, L. G. et al., 2017: Impacts of Recent Warming and the 2015/2016 El Niño on Tropical Peruvian Ice Fields. 25 Journal of Geophysical Research: Atmospheres, 122(23), 12,688-612,701, doi:10.1002/2017JD026592. 26
Thomson, M. C. and S. J. Mason, 2018: Climate information for public health action. Routledge, London. 27 Thornton, P. K. et al., 2018: A framework for priority-setting in climate smart agriculture research. Agricultural 28
Systems, 167, 161-175, doi:10.1016/j.agsy.2018.09.009. 29 Tito, R., H. L. Vasconcelos and K. J. Feeley, 2018: Global climate change increases risk of crop yield losses and food 30
insecurity in the tropical Andes. Global Change Biology, 24(2), e592-e602, doi:10.1111/gcb.13959. 31 To, P. and W. Dressler, 2019: Rethinking 'success’: The politics of payment for forest ecosystem services in Vietnam. 32
Land Use Policy, 81(February 2019), 582-593, doi:10.1016/j.landusepol.2018.11.010. 33 Tollefson, J., 2020: Why deforestation and extinctions make pandemics more likely. Nature, 584, 175-176, 34
doi:10.1038/d41586-020-02341-1. 35 Tomasella, J. et al., 2018: Desertification trends in the Northeast of Brazil over the period 2000–2016. International 36
Journal of Applied Earth Observation and Geoinformation, 73, 197-206, doi:10.1016/j.jag.2018.06.012. 37 Tomby, S. and J. Zhang, 2018: Impacts of Climate Change: Floods and Guyana Sugar Industry. International Journal 38
of Scientific and Research Publications, 8(2), 479-486. 39 Tomby, S. and J. Zhang, 2019: Vulnerability assessment of Guyanese sugar to floods. Climatic Change, 154(1), 179-40
193, doi:10.1007/s10584-019-02412-x. 41 Toro-Mujica, P., C. Aguilar, R. R. Vera and F. Bas, 2017: Carbon footprint of sheep production systems in semi-arid 42
zone of Chile: A simulation-based approach of productive scenarios and precipitation patterns. Agricultural 43 Systems, 157, 22-38, doi:10.1016/j.agsy.2017.06.012. 44
Torres, R. et al., 2015: Vulnerability and resistance to neoliberal environmental changes: An assessment of agriculture 45 and forestry in the Biobio region of Chile (1974–2014). Geoforum, 60, 107-122, 46 doi:10.1016/j.geoforum.2014.12.013. 47
Torres, R. and M. Peralvo, 2019: Dinámicas Territoriales en el Chocó Andino del Distrito Metropolitano de Quito: 48 Estado actual, tendencias y estrategias para la conservación, restauración y uso sostenible. Consorcio para el 49 Desarrollo Sostenible de la Ecorregión Andina (CONDESAN), Secretaría de Ambiente del MDMQ y Fundación 50 Imaymana, Quito, Ecuador. 51
Tovar, C., C. A. Arnillas, F. Cuesta and W. Buytaert, 2013: Diverging responses of tropical Andean biomes under 52 future climate conditions. PloS one, 8(5), e63634, doi:10.1371/journal.pone.0063634. 53
Trotman, A. et al., 2018: Fortalecimiento de los servicios climáticos para el sector de la salud en el Caribe. 67, World 54 Meteorological Organization, 14-19 pp. Available at: https://public.wmo.int/es/resources/bulletin/fortalecimiento-55 de-los-servicios-clim%C3%A1ticos-para-el-sector-de-la-salud-en-el (accessed 10/08/2021). 56
Trujillo, L. et al., 2020: Respiração do solo e dinâmica da liteira fina em Terra Preta de Índio e solos adjacentes, na 57 Amazônia Central. Revista Brasileira De Ciências Da Amazônia, 9(4), 07-20, doi:10.47209/2317-58 5729.v.9.n.4.p.07-20. 59
Úbeda, X. and P. Sarricolea, 2016: Wildfires in Chile: A review. Global and Planetary Change, 146, 152-161, 60 doi:10.1016/j.gloplacha.2016.10.004. 61
Ugarte-Avilés, T., C. Manterola, R. Cartes-Velásquez and T. Otzen, 2017: Impact of proximity of thermoelectric power 62 plants on bronchial obstructive crisis rates. BMC Public Health, 17(1), 96, doi:10.1186/s12889-016-4008-7. 63
ACCEPTED VERSIO
N
SUBJECT TO FIN
AL EDITS
FINAL DRAFT Chapter 12 IPCC WGII Sixth Assessment Report
Do Not Cite, Quote or Distribute 12-175 Total pages: 181
Ulla, T., 2016: El Niño floods in Argentina: A story of displacement and vulnerability. In: The State of Environmental 1 Migration 2016: A review of 2015 [Gemenne, F., C. Zickgraf and D. Ionesco (eds.)]. Presses Universitaires de 2 Liège, Liège, Belgium, pp. 123-147. 3
Ulloa, A., 2019: Indigenous Knowledge Regarding Climate in Colombia: Articulations and Complementarities among 4 Different Knowledges. In: Climate and Culture: Multidisciplinary Perspectives on a Warming World [Arnall, A., 5 G. Feola and H. Geoghegan (eds.)]. Cambridge University Press, Cambridge, pp. 68-92. ISBN 9781108422505. 6
Ulpiani, G., 2021: On the linkage between urban heat island and urban pollution island: Three-decade literature review 7 towards a conceptual framework. Science of The Total Environment, 751, 141727, 8 doi:10.1016/j.scitotenv.2020.141727. 9
UN-Habitat, 2015: Informal Settlements. United Nations Human Settlements Programme, New York, N.Y., 9 pp. 10 Available at: http://habitat3.org/wp-content/uploads/Habitat-III-Issue-Paper-22_Informal-Settlements-2.0.pdf 11 (accessed 31/10/2020). 12
UN-Habitat, 2018: Thematic guide: Addressing the Most Vulnerable First: Pro-Poor Climate Action in Informal 13 Settlements. United Nations Human Settlements Programme (UN-Habitat), Nairobi, Kenya, 60 pp. Available at: 14 https://reliefweb.int/sites/reliefweb.int/files/resources/Pro-15 poor%20Climate%20Action%20in%20Informal%20Settlements%20-%20WEB.pdf (accessed 17/06/2021). 16
UN General Assembly, 2015: Transforming our world: the 2030 Agenda for Sustainable Development, 35 pp. 17 UNDESA, 2019: World Urbanization Prospects: The 2018 Revision (ST/ESA/SER.A/420). United Nations, Department 18
of Economic and Social Affairs, Population Division, New York, 103 pp. Available at: 19 https://population.un.org/wup/Publications/Files/WUP2018-Report.pdf (accessed 24/09/2019). 20
UNDP, 2020: 2020 Human Development Report, United Nations Development Programme Available at: 21 http://hdr.undp.org/en/data (accessed 20/05/2021). 22
UNEP-WCMC and IUCN, 2020a: Global Partnership on Aichi Target 11, UNEP-WCMC and IUCN, Cambridge, UK. 23 Available at: https://www.protectedplanet.net/en/thematic-areas/global-partnership-on-aichi-target-11 (accessed 24 14/09/2020). 25
UNEP-WCMC and IUCN, 2020b: Protected Planet: The World Database on Protected Areas (WDPA) [Online], 26 UNEP-WCMC and IUCN, Cambridge, UK. Available at: www.protectedplanet.net (accessed 24/10/2020). 27
UNEP-WCMC, WorldFish Centre, WRI and TNC, 2018: Global distribution of warm-water coral reefs, compiled from 28 multiple sources including the Millennium Coral Reef Mapping Project. Version 4.0. Includes contributions from 29 IMaRS-USF and IRD (2005), IMaRS-USF (2005) and Spalding et al. (2001). UN Environment World 30 Conservation Monitoring Centre, Cambridge, UK. Available at: http://data.unep-wcmc.org/datasets/1 (accessed 31 27/10/2020). 32
UNEP, 2015: Aportes Legislativos de América Latina y el Caribe en Materia de Cambio Climático [Ipenza Peralta, C. 33 A. (ed.)]. UNEP, Ciudad de Panamá, Panamá, 162 pp. Available at: 34 https://sinia.minam.gob.pe/documentos/aportes-legislativos-america-latina-caribe-materia-cambio-climatico 35 (accessed 17/09/2019). 36
UNEP, 2018: The Adaptation Gap Report 2018. United Nations Environment Programme, Nairobi, Kenya, 104 pp. 37 Available at: https://www.unep.org/resources/adaptation-gap-report-2018 (accessed 28/08/2021). 38
UNESCO, 2012: Documento de Sistematización: Proyecto de Fortalecimiento de Capacidades en los Sistemas de 39 Alerta Temprana en América Central , desde una Perspectiva de Multiamenaza. 30 pp. 40
UNGRD, 2015: Plan Nacional de Gestión del Riesgo de Desastres de Colombia. Bogotá, 63 pp. Available at: 41 http://portal.gestiondelriesgo.gov.co/Documents/PNGRD-2015-2025-Version-Preliminar.pdf (accessed 42 17/06/2021). 43
UNICEF and WHO, 2019: Progress on household drinking water, sanitation and hygiene 2000-2017: Special focus on 44 inequalities. United Nations Children's Fund (UNICEF) and World Health Organization (WHO), 138 pp. 45 Available at: https://www.who.int/water_sanitation_health/publications/jmp-report-2019/en/ (accessed 46 28/09/2020). 47
UNISDR and CEPREDENAC, 2014: Informe Regional del Estado de la Vulnerabilidad y Riesgos de Desastres en 48 Centroamérica. UNISDR, Panama, 229 pp. 49
United Nations Environment Programme, 2021: Making Peace with Nature: A scientific blueprint to tackle the climate, 50 biodiversity and pollution emergencies. UNEP, Nairobi, Kenya, 166 pp. Available at: 51 https://www.unep.org/resources/making-peace-nature (accessed 25/08/2021). 52
Uribe Rivera, D., C. Vera Burgos, M. Paicho and G. Espinoza, 2017: Observatorio ecosocial para el seguimiento del 53 cambio climático en ecosistemas de altura en la Región de Taracapá: Propuestas, avances y proyecciones. Diálogo 54 andino, 63-82, doi:10.4067/S0719-26812017000300063. 55
Urquiza, A. and M. Billi, 2020a: Seguridad hídrica y energética en América Latina y el Caribe: definición y 56 aproximación territorial para el análisis de brechas y riesgos de la población. CEPAL, Santiago, Chile, 130 pp. 57 Available at: https://repositorio.cepal.org/bitstream/handle/11362/46408/1/S2000631_es.pdf (accessed 58 09/08/2021). 59
Urquiza, A. and M. Billi, 2020b: Water markets and social–ecological resilience to water stress in the context of climate 60 change: an analysis of the Limarí Basin, Chile. Environment, Development and Sustainability, 22(3), 1929-1951, 61 doi:10.1007/s10668-018-0271-3. 62
ACCEPTED VERSIO
N
SUBJECT TO FIN
AL EDITS
FINAL DRAFT Chapter 12 IPCC WGII Sixth Assessment Report
Do Not Cite, Quote or Distribute 12-176 Total pages: 181
Urrutia-Jalabert, R. et al., 2018: Climate variability and forest fires in central and south-central Chile. Ecosphere, 9(4), 1 e02171, doi:10.1002/ecs2.2171. 2
Urrutia-Jalabert, R. et al., 2015: Environmental correlates of stem radius change in the endangered Fitzroya 3 cupressoides forests of southern Chile. Agricultural and Forest Meteorology, 200, 209-221, 4 doi:10.1016/j.agrformet.2014.10.001. 5
Urrutia, J. et al., 2018: Hydrogeology and sustainable future groundwater abstraction from the Agua Verde aquifer in 6 the Atacama Desert, northern Chile. Hydrogeology Journal, 26(6), 1989-2007, doi:10.1007/s10040-018-1740-3. 7
Urrutia, R. and M. Vuille, 2009: Climate change projections for the tropical Andes using a regional climate model: 8 Temperature and precipitation simulations for the end of the 21st century. Journal of Geophysical Research: 9 Atmospheres, 114(D2), doi:10.1029/2008JD011021. 10
Valadares, R. G. and T. A. d. Cunha, 2018: The participation of cooperatives in housing public policies in Brazil and 11 Uruguay. Cadernos EBAPE.BR, 16(4), 667-678, doi:10.1590/1679-395167443 12
Valderrama, M. E., Á. I. Cadena Monroy and E. Behrentz Valencia, 2019: Challenges in greenhouse gas mitigation in 13 developing countries: A case study of the Colombian transport sector. Energy Policy, 124(C), 111-122. 14
Valdés-Pineda, R. et al., 2014: Water governance in Chile: Availability, management and climate change. Journal of 15 Hydrology, 519, 2538-2567, doi:10.1016/j.jhydrol.2014.04.016. 16
Valdivia, C. et al., 2010: Adapting to Climate Change in Andean Ecosystems: Landscapes, Capitals, and Perceptions 17 Shaping Rural Livelihood Strategies and Linking Knowledge Systems. Annals of the Association of American 18 Geographers, 100(4), 818-834, doi:10.1080/00045608.2010.500198. 19
Vale, M. M. et al., 2021: Climate Change and Biodiversity in the Atlantic Forest: Best Climatic Models, Predicted 20 Changes and Impacts, and Adaptation Options. In: The Atlantic Forest: History, Biodiversity, Threats and 21 Opportunities of the Mega-diverse Forest [Marques, M. C. M. and C. E. V. Grelle (eds.)]. Springer International 22 Publishing, Cham, pp. 253-267. ISBN 978-3-030-55322-7. 23
Vale, M. M., T. V. Souza, M. A. S. Alves and R. Crouzeilles, 2018: Planning protected areas network that are relevant 24 today and under future climate change is possible: the case of Atlantic Forest endemic birds. PeerJ, 6, e4689, 25 doi:10.7717/peerj.4689. 26
Valente de Macedo, L. S., M. E. Barda Picavet, J. A. Puppim de Oliveira and W.-Y. Shih, 2021: Urban green and blue 27 infrastructure: A critical analysis of research on developing countries. Journal of Cleaner Production, 313, 28 127898, doi:10.1016/j.jclepro.2021.127898. 29
Vallet, A. et al., 2019: Linking equity, power, and stakeholders’ roles in relation to ecosystem services. Ecology 30 and Society, 24(2), doi:10.5751/ES-10904-240214. 31
van der Sleen, P. et al., 2015: No growth stimulation of tropical trees by 150 years of CO2 fertilization but water-use 32 efficiency increased. Nat. Geosci., 8(1), 24-28, doi:10.1038/ngeo2313. 33
van Kerkhoff, L. et al., 2019: Towards future-oriented conservation: Managing protected areas in an era of climate 34 change. Ambio, 48(7), 699-713, doi:10.1007/s13280-018-1121-0. 35
Van Leeuwen, C. J., S. H. A. Koop and R. M. A. Sjerps, 2016: City Blueprints: baseline assessments of water 36 management and climate change in 45 cities. Environment, Development and Sustainability, 18(4), 1113-1128, 37 doi:10.1007/s10668-015-9691-5. 38
Vannuccini, S. et al., 2018: Chapter 3: Understanding the impacts of climate change for fisheries and aquaculture: 39 global and regional supply and demand trends and prospects 41 Stefania. In: Impacts of climate change on 40 fisheries and aquaculture Synthesis of current knowledge, adaptation and mitigation options [Barange, M., T. 41 Barhi, M. C. M. Beveridge, K. Cochrane, S. Funge-Smith and F. Poulain (eds.)]. Food and Agriculture 42 Organization of the United Nations, Rome, pp. 41-61. 43
Vargas, J. et al., 2018a: RED 2017. Urban growth and access to opportunities: a challenge for Latin America 44 [America, C. A. F. D. B. o. L. (ed.)]. Report on Economic Development (RED 2017), Bogotá, Colombia. ISBN 45 980-6810-01-5. 46
Vargas, R. et al., 2018b: Climate risk and food availability in Guatemala. Environment and Development Economics, 47 23(5), 558-579, doi:10.1017/S1355770X18000335. 48
Vargas, X. et al. (eds.), Water availability in a mountainous Andean watershed under CMIP5 climate change scenarios. 49 Cold and Mountain Region Hydrological Systems Under Climate Change: Towards Improved Projections 50 Proceedings of H02, IAHS-IAPSO-IASPEI Assembly, July 2013, Gothenburg, Sweden, 33-38 pp. 51
Vauchel, P. et al., 2017: A reassessment of the suspended sediment load in the Madeira River basin from the Andes of 52 Peru and Bolivia to the Amazon River in Brazil, based on 10years of data from the HYBAM monitoring 53 programme. Journal of Hydrology, 553, 35-48, doi:10.1016/j.jhydrol.2017.07.018. 54
Vaughan, C. et al., 2017: Creating an enabling environment for investment in climate services: The case of Uruguay’s 55 National Agricultural Information System. Climate Services, 8, 62-71, doi:10.1016/j.cliser.2017.11.001. 56
Vázquez-Rowe, I., G. Larrea-Gallegos, P. Villanueva-Rey and A. Gilardino, 2017: Climate change mitigation 57 opportunities based on carbon footprint estimates of dietary patterns in Peru. PLOS ONE, 12(11), e0188182, 58 doi:10.1371/journal.pone.0188182. 59
Veldkamp, T. I. E. et al., 2017: Water scarcity hotspots travel downstream due to human interventions in the 20th and 60 21st century. Nature Communications, 8(1), 15697, doi:10.1038/ncomms15697. 61
Vemado, F. and A. J. Pereira Filho, 2016: Severe Weather Caused by Heat Island and Sea Breeze Effects in the 62 Metropolitan Area of São Paulo, Brazil. Advances in Meteorology, 2016, 13, doi:10.1155/2016/8364134. 63
ACCEPTED VERSIO
N
SUBJECT TO FIN
AL EDITS
FINAL DRAFT Chapter 12 IPCC WGII Sixth Assessment Report
Do Not Cite, Quote or Distribute 12-177 Total pages: 181
Venegas-González, A., F. R. Juñent, A. G. Gutiérrez and M. T. Filho, 2018a: Recent radial growth decline in response 1 to increased drought conditions in the northernmost Nothofagus populations from South America. Forest Ecology 2 and Management, 409, 94-104, doi:10.1016/j.foreco.2017.11.006. 3
Venegas-González, A. et al., 2018b: Efecto de la variabilidad climática sobre los patrones de crecimiento y 4 establecimiento de Nothofagus macrocarpa en Chile central Bosque, 39(1), 81-93, doi:10.4067/S0717-5 92002018000100081. 6
Venerus, L. A. and P. V. Cedrola, 2017: Review of marine recreational fisheries regulations in Argentina. Marine 7 Policy, 81, 202-210, doi:10.1016/j.marpol.2017.03.007. 8
Vera, C. S. and L. Díaz, 2015: Anthropogenic influence on summer precipitation trends over South America in CMIP5 9 models. International Journal of Climatology, 35(10), 3172-3177, doi:10.1002/joc.4153. 10
Verba, J. T., M. G. Pennino, M. Coll and P. F. M. Lopes, 2020: Assessing drivers of tropical and subtropical marine 11 fish collapses of Brazilian Exclusive Economic Zone. Science of The Total Environment, 702, 134940, 12 doi:10.1016/j.scitotenv.2019.134940. 13
Vergara, A., 2018: Latin America’s Shifting Politics: Virtue, Fortune, and Failure in Peru. Journal of Democracy, 14 29(4), 65-76, doi:10.1353/jod.2018.0063. 15
Vergara, W. et al., 2007: Economic impacts of rapid glacier retreat in the Andes. Eos, Transactions American 16 Geophysical Union, 88(25), 261-264, doi:10.1029/2007EO250001. 17
Vergara, W., A. R. Rios, P. Trapido and H. Malarín, 2014: Agriculture and Future Climate in Latin America and the 18 Caribbean: Systemic Impacts and Potential Responses. Discussion Paper Climate Change and Sustainability 19 Division, IDB-DP-329, 1-20 pp. Available at: https://www.uncclearn.org/wp-content/uploads/library/idb40.pdf 20 (accessed 31/10/2020). 21
Vicente-Serrano, S. M. et al., 2018: Recent changes in monthly surface air temperature over Peru, 1964–2014. 22 International Journal of Climatology, 38(1), 283-306, doi:10.1002/joc.5176. 23
Vicuña, S. et al., 2013: Exploring possible connections between hydrological extreme events and climate change in 24 central south Chile. Hydrological Sciences Journal, 58(8), 1598-1619, doi:10.1080/02626667.2013.840380. 25
Vidal Merino, M., D. Sietz, F. Jost and U. Berger, 2019: Archetypes of Climate Vulnerability: a Mixed-method 26 Approach Applied in the Peruvian Andes. Climate and Development, 11(5), 418-434, 27 doi:10.1080/17565529.2018.1442804. 28
VIDECI, 2017: Programa Nacional de Gestión de Riesgos de Bolivia. 44 pp. Available at: 29 http://www.defensacivil.gob.bo/web/uploads/pdfs/PNGRD2017.pdf (accessed 17/06/2021). 30
Vieira, R. M. S. P. et al., 2015: Identifying areas susceptible to desertification in the Brazilian northeast. Solid Earth, 31 6(1), 347-360, doi:10.5194/se-6-347-2015. 32
Viguera, B. et al., 2019: Percepciones de cambio climático y respuestas adaptativas de caficultores costarricenses de 33 pequeña escala. Agronomía Mesoamericana, 30, 333-351. 34
Villafuerte, J., J. Rodriguez, K. Limones and L. Pérez, 2018: Adaptación autónoma al cambio climático: experiencias 35 de emprendimientos rurales de Ecuador. Letras Verdes. Revista Latinoamericana de Estudios Socioambientales, 36 24, 57-82, doi:10.17141/letrasverdes.24.2018.3273. 37
Villamizar, A. et al., 2017: Climate adaptation in South America with emphasis in coastal areas: the state-of-the-art and 38 case studies from Venezuela and Uruguay. Climate and Development, 9(4), 364-382, 39 doi:10.1080/17565529.2016.1146120. 40
Vincenti-Gonzalez, M. F., A. Tami, E. F. Lizarazo and M. E. Grillet, 2018: ENSO-driven climate variability promotes 41 periodic major outbreaks of dengue in Venezuela. Scientific Reports, 8(1), 5727, doi:10.1038/s41598-018-24003-42 z. 43
Vitriol, V. et al., 2014: Respuesta de los centros de atención primaria en salud mental después del terremoto y tsunami 44 del 2010 en la Región del Maule. Revista médica de Chile, 142(9), 1120-1127, doi:10.4067/S0034-45 98872014000900005. 46
Viviroli, D. et al., 2020: Increasing dependence of lowland populations on mountain water resources. Nature 47 Sustainability, doi:10.1038/s41893-020-0559-9. 48
Vogt, N. et al., 2016: Local ecological knowledge and incremental adaptation to changing flood patterns in the Amazon 49 delta. Sustainability Science, 11(4), 611-623, doi:10.1007/s11625-015-0352-2. 50
Vörösmarty, C. J. et al., 2013: Extreme rainfall, vulnerability and risk: a continental-scale assessment for South 51 America. Philosophical Transactions of the Royal Society A: Mathematical, Physical and Engineering Sciences, 52 371(2002), 20120408, doi:10.1098/rsta.2012.0408. 53
Vuille, M. et al., 2018: Rapid decline of snow and ice in the tropical Andes – Impacts, uncertainties and challenges 54 ahead. Earth-Science Reviews, 176, 195-213, doi:10.1016/j.earscirev.2017.09.019. 55
Vuille, M. et al., 2015: Impact of the global warming hiatus on Andean temperature. Journal of Geophysical Research: 56 Atmospheres, 120(9), 3745-3757, doi:10.1002/2015JD023126. 57
Walker, B. J. A., W. N. Adger and D. Russel, 2014a: Institutional barriers to climate change adaptation in decentralised 58 governance structures: Transport planning in England. Urban Studies, 52(12), 2250-2266, 59 doi:10.1177/0042098014544759. 60
Walker, W. et al., 2014b: Forest carbon in Amazonia: the unrecognized contribution of indigenous territories and 61 protected natural areas. Carbon Management, 5(5-6), 479-485, doi:10.1080/17583004.2014.990680. 62
ACCEPTED VERSIO
N
SUBJECT TO FIN
AL EDITS
FINAL DRAFT Chapter 12 IPCC WGII Sixth Assessment Report
Do Not Cite, Quote or Distribute 12-178 Total pages: 181
Walshe, R. and A. Argumedo, 2016: Ayni, Ayllu, Yanantin and Chanincha: The Cultural Values Enabling Adaptation 1 to Climate Change in Communities of the Potato Park, in the Peruvian Andes. GAIA, 25(3), 166-173, 2 doi:10.14512/gaia.25.3.7. 3
Wamsler, C. et al., 2020: Environmental and climate policy integration: Targeted strategies for overcoming barriers to 4 nature-based solutions and climate change adaptation. Journal of Cleaner Production, 247, 119154, 5 doi:10.1016/j.jclepro.2019.119154. 6
Wang, C.-J., J.-Z. Wan and Z.-X. Zhang, 2017a: Expansion potential of invasive tree plants in ecoregions under climate 7 change scenarios: an assessment of 54 species at a global scale. Scandinavian Journal of Forest Research, 32(8), 8 663-670, doi:10.1080/02827581.2017.1283049. 9
Wang, G. et al., 2017b: Continued increase of extreme El Niño frequency long after 1.5 °C warming stabilization. 10 Nature Climate Change, 7(8), 568-572, doi:10.1038/nclimate3351. 11
Warn, E. and S. B. Adamo, 2014: The impact of climate change: migration and cities in South America. World 12 Meteorological Organization 63. 13
Warner, B. P., 2016: Understanding actor-centered adaptation limits in smallholder agriculture in the Central American 14 dry tropics. Agriculture and Human Values, 33(4), 785-797, doi:10.1007/s10460-015-9661-4. 15
Warner, K. and T. Afifi, 2014: Where the rain falls: Evidence from 8 countries on how vulnerable households use 16 migration to manage the risk of rainfall variability and food insecurity. Climate and Development, 6(1), 1-17, 17 doi:10.1080/17565529.2013.835707. 18
Warren, R. et al., 2018: The implications of the United Nations Paris Agreement on climate change for globally 19 significant biodiversity areas. Climatic Change, 147(3), 395-409, doi:10.1007/s10584-018-2158-6. 20
Warszawski, L. et al., 2013: A multi-model analysis of risk of ecosystem shifts under climate change. Environmental 21 Research Letters, 8(4), 044018, doi:10.1088/1748-9326/8/4/044018. 22
Watanabe, M., 2015: Gestión del riesgo de desastres en ciudades de América Latina. Apuntes de investigación, 23 Practical Action, Perú, 17 pp. Available at: https://solucionespracticas.org.pe/Gestion-del-riesgo-de-desastres-en-24 ciudades-de-America-Latina (accessed 17/06/2021). 25
Watts, N. et al., 2018: The Lancet Countdown on health and climate change: from 25 years of inaction to a global 26 transformation for public health. The Lancet, 391(10120), 581--630, doi:10.1016/ S0140-6736(17)32464-9. 27
Waylen, K. A. et al., 2015: Can scenario-planning support community-based natural resource management? 28 Experiences from three countries in Latin America. Ecology and Society, 20(4), doi:10.5751/ES-07926-200428. 29
Weatherdon, L. V. et al., 2016: Observed and Projected Impacts of Climate Change on Marine Fisheries, Aquaculture, 30 Coastal Tourism, and Human Health: An Update. Frontiers in Marine Science, 3, 48. 31
Webb, M. F. et al., 2016: Exploring mechanisms of food insecurity in indigenous agricultural communities in 32 Guatemala: a mixed methods study. BMC Nutrition, 2(1), 55, doi:10.1186/s40795-016-0091-5. 33
Webb, M. J. et al., 2020: Water, agriculture, and climate dynamics in central Chile’s Aconcagua River Basin. Physical 34 Geography, 1-21, doi:10.1080/02723646.2020.1790719. 35
Welz, J. and K. Krellenberg, 2016: Vulnerabilidad frente al cambio climático en la Región Metropolitana de Santiago 36 de Chile: Posiciones teóricas versus evidencias empíricas. Eure, 42(125), 251-272, doi:10.4067/S0250-37 71612016000100011. 38
Welz, J., A. Schwarz and K. Krellenberg, 2014: Understanding Hazard Exposure for Adaptation in a Climate Change 39 Context. In: Climate Adaptation Santiago [Krellenberg, K. and B. Hansjürgens (eds.)]. Springer Berlin 40 Heidelberg, Berlin, Heidelberg, pp. 127-147. ISBN 978-3-642-39103-3. 41
WFP, 2014: Seguridad Alimentaria, Desastres y Cambio Climático en la Región Andina, factores que contribuyen a la 42 vulnerabilidad de la población ante la Inseguridad Alimentaria en Relación a los Riesgos de Desastres y el 43 Cambio Climático. World Food Programme, 1 pp. Available at: 44 https://cdn.wfp.org/wfp.org/publications/andean_map_final_es_96px.pdf (accessed 03/09/2021). 45
Whitlock, C. et al., 2015: Past and Present Vulnerability of Closed-Canopy Temperate Forests to Altered Fire Regimes: 46 A Comparison of the Pacific Northwest, New Zealand, and Patagonia. BioScience, 65(2), 151-163, 47 doi:10.1093/biosci/biu194. 48
WHO, 2017: Financing universal Water, Sanitation and Hygiene under the Sustainable Development Goals - GLAAS 49 2017 report. UN-Water global analysis and assessment of sanitation and drinking-water (GLAAS): 2017 report, 50 220, World Health Organization (WHO), Geneva, 96 pp. Available at: 51 http://www.who.int/water_sanitation_health/publications/glaas-report-2017/en/ (accessed 17/09/2019). 52
WHO and UNFCCC, 2015: Climate and health country profile – 2015 Colombia. World Health Organization and 53 United Nations Framework Convention on Climate Change, 8 pp. Available at: 54 https://apps.who.int/iris/bitstream/handle/10665/208859/WHO_FWC_PHE_EPE_15.05_eng.pdf?sequence=1 55 (accessed 17/06/2021). 56
WHO and UNFCCC, 2020: Health & Climate Change: Country profile 2020 - Guyana. Small Island Developing States 57 Initiative. World Health Organization and United Nations Framework Convention on Climate Change,, 17 pp. 58 Available at: https://cdn.who.int/media/docs/default-source/climate-change/who-unfccc-cch-country-profile-59 guyana.pdf?sfvrsn=7fd8e6db_2&download=true (accessed 25/06/2021). 60
WHO and WMO, 2012: Atlas of health and climate. World Health Organization and World Meteorological 61 Organization, Geneva, 68 pp. Available at: https://www.who.int/globalchange/publications/atlas/report/en/ 62 (accessed 17/06/2021). 63
ACCEPTED VERSIO
N
SUBJECT TO FIN
AL EDITS
FINAL DRAFT Chapter 12 IPCC WGII Sixth Assessment Report
Do Not Cite, Quote or Distribute 12-179 Total pages: 181
WHO and WMO, 2016: Climate Services for Health: Improving public health decision-making in a new climate. World 1 Health Organization (WHO) and World Meteorological Organization, Geneva, 218 pp. pp. 2
Wiegant, D., M. Peralvo, P. van Oel and A. Dewulf, 2020: Five scale challenges in Ecuadorian forest and landscape 3 restoration governance. Land Use Policy, 96, 104686, doi:10.1016/j.landusepol.2020.104686. 4
Wilbanks, T. J. and R. W. Kates, 2010: Beyond Adapting to Climate Change: Embedding Adaptation in Responses to 5 Multiple Threats and Stresses. Annals of the Association of American Geographers, 100(4), 719 - 728, 6 doi:10.1080/00045608.2010.500200. 7
Wilbanks, T. J. et al., 2007: Industry, settlement and society. In: Climate Change 2007: Impacts, Adaptation and 8 Vulnerability. Contribution of Working Group II to the Fourth Assessment Report of the Intergovernmental Panel 9 on Climate Change [Parry, M. L., O. F. Canziani, J. P. Palutikof, P. J. van der Linden and C. E. Hanson (eds.)]. 10 Cambridge University Press, Cambridge, UK, pp. 357-390. 11
Wilson, R. et al., 2018: Glacial lakes of the Central and Patagonian Andes. Global and Planetary Change, 162, 275-12 291, doi:10.1016/j.gloplacha.2018.01.004. 13
Wiltshire, A. (ed.), Developing early warning systems: a checklist. Third International Conference on Early Warning: 14 From concept to action 27-29 March 2006, Bonn, Germany. 15
Wimberly, M. C., K. M. de Beurs, T. V. Loboda and W. K. Pan, 2021: Satellite Observations and Malaria: New 16 Opportunities for Research and Applications. Trends in parasitology, 37(6), 525-537, 17 doi:10.1016/j.pt.2021.03.003. 18
Winckler, P. et al., 2017: El temporal del 8 de agosto de 2015 en las regiones de Valparaíso y Coquimbo, Chile Central. 19 Latin American Journal of Aquatic Research, 45(4), 622-648, doi:10.3856/vol45-issue4-fulltext-1. 20
Winklerprins, A., 2009: Sweep and Char and the Creation of Amazonian Dark Earths in Homegardens. In: Amazonian 21 Dark Earths: Wim Sombroek's Vision [Woods, W. I., W. G. Teixeira, J. Lehmann, C. Steiner, A. WinklerPrins and 22 L. Rebellato (eds.)]. Springer Netherlands, Dordrecht, pp. 205-211. ISBN 978-1-4020-9031-8. 23
WMO, 2014: Health Exemplar to the User Interface Platform of the Global Framework for Climate Services. World 24 Meteorological Organization (WMO), Geneva, Switzerland, 72 pp. Available at: 25 https://gfcs.wmo.int/sites/default/files/Priority-Areas/Health/GFCS-HEALTH-EXEMPLAR-FINAL-26 14152_en.pdf (accessed 17/06/2021). 27
Wong, K. V., A. Paddon and A. Jimenez, 2013: Review of World Urban Heat Islands: Many Linked to Increased 28 Mortality. Journal of Energy Resources Technology, 135(2), 022101, doi:10.1115/1.4023176. 29
Woods, W. I. and J. M. McCann (eds.), The anthropogenic origin and persistence of Amazonian dark earths. 30 Conference of Latin Americanist Geographers, 1999, University of Texas Press, 7-14 pp. 31
World Bank, 2014: Bogota Disaster Vulnerability Reduction Project in Support on the Second Phase of the Disaster 32 Vulnerability Reduction Program. 67 pp. Available at: 33 https://documents.worldbank.org/curated/en/474671468261324583/pdf/ICR29520P0857270Box385299B00OUO34 090.pdf (accessed 03/06/2021). 35
World Bank, 2021: Climate Change Action Plan 2021-2015: Supporting Green, Resilient, and Inclusive Development. 36 The World Bank Group, Washington DC, United States, 49 pp. Available at: 37 https://openknowledge.worldbank.org/bitstream/handle/10986/35799/CCAP-2021-38 25.pdf?sequence=2&isAllowed=y (accessed 25/08/2021). 39
World Bank Group, 2015: Community-led Partnerships for Resilience. Global Facility for Disaster Reduction and 40 Recovery, Washington D.C., United States of America, 72 pp. Available at: https://huairou.org/wp-41 content/uploads/2015/12/WBGFDRR_S.GuptaCommunity_led_partnership_JUNE24_1lowres-1_0.pdf (accessed 42 01/09/2021). 43
Wrathall, D. J. and N. Suckall, 2016: Labour migration amidst ecological change. Migration and Development, 5(2), 44 314-329, doi:10.1080/21632324.2015.1022967. 45
Wu, X. et al., 2019: Investigating Surface Urban Heat Islands in South America Based on MODIS Data from 2003–46 2016. Remote Sensing, 11(10), doi:10.3390/rs11101212. 47
Wu, Y. and L. M. Polvani, 2017: Recent trends in extreme precipitation and temperature over Southeastern South 48 America: The dominant role of stratospheric ozone depletion in the CESM large ensemble. Journal of Climate, 49 30(16), 6433-6441, doi:10.1175/JCLI-D-17-0124.1. 50
WWAP, 2018: The United Nations World Water Development Report 2018: Nature-Based Solutions for Water. 51 UNESCO, Paris, France, 139 pp. ISBN 978-92-3-100264-9. 52
WWAP, 2020: United Nations World Water Development Report 2020: Water and Climate Change. UNESCO, Paris, 53 France, 219 pp. Available at: https://unesdoc.unesco.org/ark:/48223/pf0000372985.locale=en (accessed 54 01/11/2020). 55
Yamamoto, L., D. A. Serraglio and F. d. S. Cavedon-Capdeville, 2018: Human mobility in the context of climate 56 change and disasters: a South American approach. International Journal of Climate Change Strategies and 57 Management, 10(1), 65-85, doi:10.1108/IJCCSM-03-2017-0069. 58
Yamin, L. E., F. Ghesquiere, O. D. Cardona and M. G. Ordaz, 2013: Modelación probabilista para la gestión del riesgo 59 de desastre - El caso de Bogotá, Colombia. Banco Mundial and Universidad de los Andes, Bogotá, 183 pp. 60 Available at: 61 https://www.gfdrr.org/sites/default/files/publication/modelacionprobabilistaparalagestiondelriesgodedesastre_elca62 sodebogotacolombia_reduced.pdf (accessed 03/06/2021). 63
ACCEPTED VERSIO
N
SUBJECT TO FIN
AL EDITS
FINAL DRAFT Chapter 12 IPCC WGII Sixth Assessment Report
Do Not Cite, Quote or Distribute 12-180 Total pages: 181
Yang, J. et al., 2018: Amazon drought and forest response: Largely reduced forest photosynthesis but slightly increased 1 canopy greenness during the extreme drought of 2015/2016. Global Change Biology, 24(5), 1919-1934, 2 doi:10.1111/gcb.14056. 3
Yeni, F. and H. Alpas, 2017: Vulnerability of global food production to extreme climatic events. Food Research 4 International, 96, 27-39, doi:10.1016/j.foodres.2017.03.020. 5
Yevenes, M. A., R. Figueroa and O. Parra, 2018: Seasonal drought effects on the water quality of the Biobío River, 6 Central Chile. Environmental Science and Pollution Research, 25(14), 13844-13856, doi:10.1007/s11356-018-7 1415-6. 8
Young, K. R., A. G. Ponette-González, M. H. Polk and J. K. Lipton, 2017: Snowlines and Treelines in the Tropical 9 Andes. Annals of the American Association of Geographers, 107(2), 429-440, 10 doi:10.1080/24694452.2016.1235479. 11
Yu, D., Y. Liu, P. Shi and J. Wu, 2019: Projecting impacts of climate change on global terrestrial ecoregions. 12 Ecological Indicators, 103, 114-123, doi:10.1016/j.ecolind.2019.04.006. 13
Zador, M. et al., 2015: Tropical Andes Biodiversity Hotspot. Ecosystem Profile Technical Summary. NatureServe and 14 EcoDecisión, 1-53 pp. Available at: 15 https://www.cepf.net/sites/default/files/tropical_andes_profile_final_4_2015.pdf (accessed 29/06/2021). 16
Zalakeviciute, R., Y. Rybarczyk, J. López-Villada and M. V. Diaz Suarez, 2018: Quantifying decade-long effects of 17 fuel and traffic regulations on urban ambient PM2.5 pollution in a mid-size South American city. Atmospheric 18 Pollution Research, 9(1), 66-75, doi:10.1016/j.apr.2017.07.001. 19
Zalles, J. I., 2018: Turismo basado en naturaleza y conservación biológica: decisiones de uso de suelo en Mindo. Letras 20 Verdes. Revista Latinoamericana de Estudios Socioambientales, 23, 178-198, 21 doi:10.17141/letrasverdes.23.2018.2861. 22
Zambrano, F., M. Lillo-Saavedra, K. Verbist and O. Lagos, 2016: Sixteen Years of Agricultural Drought Assessment of 23 the BioBío Region in Chile Using a 250 m Resolution Vegetation Condition Index (VCI). Remote Sensing, 8(6), 24 doi:10.3390/rs8060530. 25
Zambrano, L., R. Pacheco-Muñoz and T. Fernández, 2017: A spatial model for evaluating the vulnerability of water 26 management in Mexico City, Sao Paulo and Buenos Aires considering climate change. Anthropocene, 17, 1-12, 27 doi:10.1016/j.ancene.2016.12.001. 28
Zambrano, L. I. et al., 2012: Potential impacts of climate variability on Dengue Hemorrhagic Fever in Honduras, 2010. 29 Tropical Biomedicine, 29(4), 499-507. 30
Zamora, N., 2018: The Landslide Hazard Map of Bogota an Updating. International Archives of the Photogrammetry, 31 Remote Sensing and Spatial Information Sciences, XLII-4/W8, 233-244, doi:10.5194/isprs-archives-XLII-4-W8-32 233-2018. 33
Zavaleta, C. et al., 2018: Multiple non-climatic drivers of food insecurity reinforce climate change maladaptation 34 trajectories among Peruvian Indigenous Shawi in the Amazon. PLOS ONE, 13(10), e0205714, 35 doi:10.1371/journal.pone.0205714. 36
Zemp, M. et al., 2019: Global glacier mass changes and their contributions to sea-level rise from 1961 to 2016. Nature, 37 568(7752), 382-386, doi:10.1038/s41586-019-1071-0. 38
Zenghelis, D., A. Manley and J. Wdowin, 2020: Public debt, public wealth and economic dynamics [Cambridge, U. o. 39 (ed.)]. Bennett Institute Working Paper, University of Cambridge, 14 pp. Available at: 40 https://www.bennettinstitute.cam.ac.uk/publications/public-debt-public-wealth-and-economic-dynamics/ 41 (accessed 25/08/2021). 42
Zenteno, J. S., P. F. Rosende, B. C. Manzur and I. S. Vega, 2021: Breast cancer incidence and the air pollution level in 43 the communes of Chile: an ecological study. Ecancermedicalscience, 15, 1191-1191, 44 doi:10.3332/ecancer.2021.1191. 45
Zhang, Q. et al., 2021: Water dispersible colloids and related nutrient availability in Amazonian Terra Preta soils. 46 Geoderma, 397, 115103, doi:10.1016/j.geoderma.2021.115103. 47
Zhang, X. et al., 2015: Mapping Drought Risk (Wheat) of the World. In: World Atlas of Natural Disaster Risk [Shi, P. 48 and R. Kasperson (eds.)]. Springer Berlin Heidelberg, Berlin, Heidelberg, pp. 227-242. ISBN 978-3-662-45430-5. 49
Zhao, Q. et al., 2019: The association between heatwaves and risk of hospitalization in Brazil: A nationwide time series 50 study between 2000 and 2015. PLOS Medicine, 16(2), e1002753, doi:10.1371/journal.pmed.1002753. 51
Zhao, W. et al., 2017: Climatic factors driving vegetation declines in the 2005 and 2010 Amazon droughts. PLoS ONE, 52 12(4), 1-19, doi:10.1371/journal.pone.0175379. 53
Zhao, Y. et al., 2016: Detailed dynamic land cover mapping of Chile: Accuracy improvement by integrating multi-54 temporal data. Remote Sensing of Environment, 183, 170-185, doi:10.1016/j.rse.2016.05.016. 55
Zilli, M. et al., 2020: The impact of climate change on Brazil's agriculture. Science of The Total Environment, 740, 56 139384, doi:10.1016/j.scitotenv.2020.139384. 57
Zimmer, A. et al., 2018: Time lag between glacial retreat and upward migration alters tropical alpine communities. 58 Perspectives in Plant Ecology, Evolution and Systematics, 30, 89-102, doi:10.1016/j.ppees.2017.05.003. 59
Zimmerer, K. S., 2014: Conserving agrobiodiversity amid global change, migration, and nontraditional livelihood 60 networks: the dynamic uses of cultural landscape knowledge. Ecology and Society, 19(2), doi:10.5751/ES-06316-61 190201. 62
ACCEPTED VERSIO
N
SUBJECT TO FIN
AL EDITS
FINAL DRAFT Chapter 12 IPCC WGII Sixth Assessment Report
Do Not Cite, Quote or Distribute 12-181 Total pages: 181
Zu Ermgassen, E. K. H. J. et al., 2018: Results from On-The-Ground Efforts to Promote Sustainable Cattle Ranching in 1 the Brazilian Amazon. Sustainability, 10(4), doi:10.3390/su10041301. 2
Zúñiga, F., M. Jaime and C. Salazar, 2021: Crop farming adaptation to droughts in small-scale dryland agriculture in 3 Chile. Water Resources and Economics, 34, 100176, doi:10.1016/j.wre.2021.100176. 4
5
ACCEPTED VERSIO
N
SUBJECT TO FIN
AL EDITS