accepted manuscript - universidad de cantabria
TRANSCRIPT
Accepted Manuscript
Synthesis, microstructure and volumetry of novel metalthiocyanate ionic liquids with [BMIM] cation
Oscar Cabeza, Luis M. Varela, Esther Rilo, Luisa Segade,Montserrat Domínguez-Pérez, David Ausín, Imanol de Pedro,Jesús Rodríguez Fernández, Jesús González, M. Pilar Vazquez-Tato, Yago Arosa, Elena López-Lago, Raúl de la Fuente, JuanJ. Parajó, Josefa Salgado, María Villanueva, Vladimir Matveev,Alexandr Ievlev, Julio A. Seijas
PII: S0167-7322(19)30372-1DOI: https://doi.org/10.1016/j.molliq.2019.03.088Reference: MOLLIQ 10629
To appear in: Journal of Molecular Liquids
Received date: 19 January 2019Revised date: 14 March 2019Accepted date: 17 March 2019
Please cite this article as: O. Cabeza, L.M. Varela, E. Rilo, et al., Synthesis, microstructureand volumetry of novel metal thiocyanate ionic liquids with [BMIM] cation, Journal ofMolecular Liquids, https://doi.org/10.1016/j.molliq.2019.03.088
This is a PDF file of an unedited manuscript that has been accepted for publication. Asa service to our customers we are providing this early version of the manuscript. Themanuscript will undergo copyediting, typesetting, and review of the resulting proof beforeit is published in its final form. Please note that during the production process errors maybe discovered which could affect the content, and all legal disclaimers that apply to thejournal pertain.
© 2019. This manuscript version is made available under the CC-BY-NC-ND 4.0 license http://creativecommons.org/licenses/by-nc-nd/4.0/
ACC
EPTE
D M
ANU
SCR
IPT
1
SYNTHESIS, MICROSTRUCTURE AND VOLUMETRY OF NOVEL METAL
THIOCYANATE IONIC LIQUIDS WITH [BMIM] CATION
Oscar Cabeza*a, Luis M. Varela
b Esther Rilo
a, Luisa Segade
a, Montserrat Domínguez-Pérez
a,
David Ausína, Imanol de Pedro
c, Jesús Rodríguez Fernández
c, Jesús González
c, M. Pilar
Vazquez-Tatod, Yago Arosa
b, Elena López-Lago
b, Raúl de la Fuente
b, Juan J. Parajó
b, Josefa
Salgadob, María Villanueva
b, Vladimir Matveev
e, Alexandr Ievlev
e and Julio A. Seijas
d
a Departamento de Física y Ciencias de la Tierra, Facultade de Ciencias, Universidade da Coruña, Campus de A
Zapateira s/n E-15071, A Coruña. Spain. b
Grupo de Nanomateriales, Fotónica y Materia Blanda. Departamentos de Física de Partículas y de Física
Aplicada, Facultade de Física, Universidade de Santiago de Compostela, Campus Vida s/n. E-15782, Santiago de
Compostela. Spain c Departamento CITIMAC, Facultad de Ciencias, Universidad de Cantabria, Avenida de los Castros, s/n. E-39005
Santander. Spain. d
Departamento de Química Orgánica, Facultad de Ciencias, Universidade de Santiago de Compostela, Rúa
Alfonso X o Sabio s/n. E-27002, Lugo. Spain. e
Department of Nuclear Physics Research Methods, Saint Petersburg State University, 78 199034, 7/9
Universitetskaya nab., Saint Petersburg, Russia.
*e-mail: [email protected]
Abstract:
We present a new family of ionic liquids (ILs) with a common cation, 1-butyl-3-methyl
imidazolium, the popular [BMIM]+ (also written C4C1Im
+) and a variety of anionic complexes
(also called adducts) based in thiocyanate (SCN)-: one blank compound, BMIM(SCN), and ten
doped with metals having different oxidation states: Al+3
, Mn+2
, Fe+3
, Cr+3
, Ni+2
, Hg+2
, Zn+2
,
Co+2
, Cd+2
and Cu+, forming, respectively, [BMIM]3[Al(SCN)6], [BMIM]4 Mn(SCN)6,
[BMIM]3 Fe(SCN)6, [BMIM]3 Cr(SCN)6, [BMIM]4 Ni(SCN)6, [BMIM]2 Hg(SCN)4, [BMIM]2
Zn(SCN)4, [BMIM]2 Co(SCN)4, [BMIM]2 Cd(SCN)4 and [BMIM]3 Cu(SCN)4. All of them
were synthesized by us, except the blank IL and the Co thiocyanate, which are commercial.
Obtained products have been characterized by NMR, and also by electrospray ionization, MS-
ES, which allows the determination of the new ILs purities. Then, compounds have been
analyzed using FT-IR and Raman spectroscopy. In addition, magnetic susceptibility and
refractive index measurements were performed in some of the compounds studied, as well as
thermal characterization using DSC and TGA. Finally, experimental measurements of density
on all those ILs have been performed, and for some of the samples in a broad temperature range
(about 100 K). In spite of being very similar compounds from the chemical point of view, they
present quite different physical properties, including optical, thermal and magnetic ones... Also,
they show different oxidation states (one with +1, six with +2 and other three with +3). We
guess that this family of ILs will have interesting applications, mainly for photonic devices.
Keywords: metal thiocyanates; ionic liquids; synthesis; microstructure; volumetry.
ACCEPTED MANUSCRIPT
ACC
EPTE
D M
ANU
SCR
IPT
2
1. INTRODUCTION
As it is well known, ionic liquids (ILs) are a new class of materials with many interesting
proposed applications. Their common physico-chemical properties include very low volatility,
good electrical conductivity, broad electrochemical window, high stability both thermal and
electrical and selective solvation depending on the given compound [1]. In addition, there are
millions of pure ILs that may be obtained by combining different cations (usually organic and
alkyl chained) with a plethora of anions (from halogens to big organic anions). We can obtain
trillions of different compounds if we mix two different ILs between them, and so on, being
theoretically possible to obtain the optical compound for any given application [2]. These range
from solvents for separation and refining, both organic [3] and inorganic [4] compounds
(including nuclear waste [5]), electrolytes for metal deposition [6] or for electrochemical
devices [7], lubricants [8] and many more.
In this paper we present the synthesis and structure of a new family of ILs, majority of them
never described before. This family is based in the already known IL 1-butyl-3-methyl
imidazolium thiocyanate, BMIM(SCN), a commercial IL which has been studied in many
papers, both pure [9-13] and forming part of different mixtures with water [14-16], alcohols
[17-21] or other solvents [14,15], and even with other ILs with the same cation [22]. In
addition, it has been also studied the parent compounds with 1-ethyl-3-methyl imidazolium,
EMIM(SCN) [13,23,24] and 1-hexyl-3-methyl imidazolium HMIM(SCN) [25-27]. Also, other
thiocyanate ILs with cations based in pirrolidinium [11,16] and piperidinium [11,13,16,28,29]
have been investigated. Finally, the potential parameters for BMIM(SCN) have been published,
which is an important information to perform molecular simulation on this compound [30]. The
blank IL presents very interesting properties and have been proposed as electrolyte for
supercapacitors [31] and batteries, if mixed with lithium salts [32]. Also, it has a great potential
for liquid fuel desulfuration [33], among other proposed applications.
If we include a metal cation in the BMIM(SCN) IL, we will obtain new compunds with very
different physico-chemical properties. The metal cation will form anionic complexes with the
thiocyanate anion, depending on the size and electronic structure of the metal cation whether
the formed complex is in octahedral or tetrahedral configuration. At our knowledge, there is
only one metal thiocyanate in the market, the [BMIM]2 Co(SCN)4, which presents interesting
properties as thermochromism [34,35], and it has been also proposed as electrolyte for dye-
sensitized solar cells [36]. Very recently some of us have published the thermochromism that
present another metal thiocyanate based IL, the [BMIM]4 Ni(SCN)6, which was synthesized by
us [37]. Finally, novel metal thiocyanates with zinc and cadmium based in methyl imidazole
have been published this year and their structure resolved by single crystal X-ray diffraction
[38], which present luminescence properties. Definitively, ILs based in metal thiocyanates are
very promising materials which have potential applications in electrochemical and photonic
devices, presenting as well magnetic and catalytic properties. Also, note that parent compounds
based in cyanate anion present negative thermal expansion [39,40], but this effect have not
been observed in the metal thiocyanate IL compounds we prepared here.
In this paper we present the synthesis of eight new metal thiocyanates with the 1-butyl-3-
methyl imidazolium cation, and study some of their structural, optical, magnetic and thermal
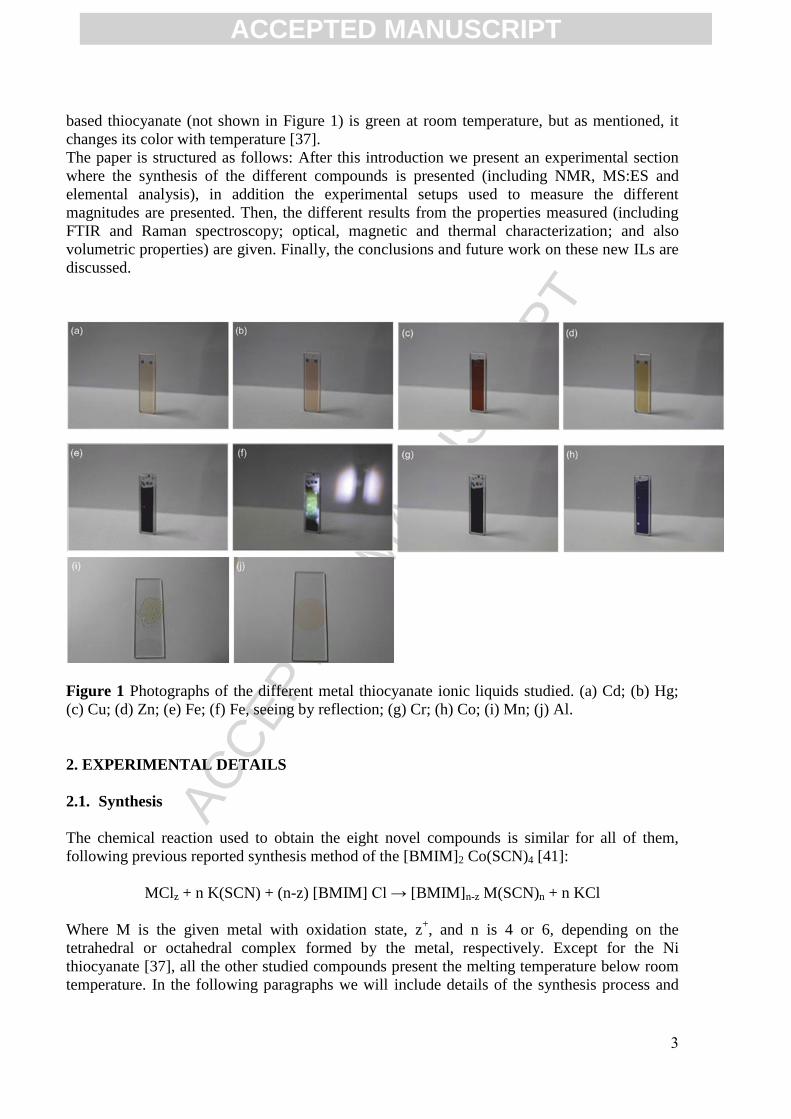
characteristics, as well as its volumetric properties. A photograph of these new compounds
(including Co thiocyanate) are given in Figure 1, where we can observe the different color that
presents each compound: Cd, light pink; Hg, reddish brown; Zn, yellowish; Cu, brown; Fe, red;
Fe by reflection, green; Cr, purple; Co, blue; Mn, yellowish; Al, reddish brown. Finally, Ni
ACCEPTED MANUSCRIPT
ACC
EPTE
D M
ANU
SCR
IPT
3
based thiocyanate (not shown in Figure 1) is green at room temperature, but as mentioned, it
changes its color with temperature [37].
The paper is structured as follows: After this introduction we present an experimental section
where the synthesis of the different compounds is presented (including NMR, MS:ES and
elemental analysis), in addition the experimental setups used to measure the different
magnitudes are presented. Then, the different results from the properties measured (including
FTIR and Raman spectroscopy; optical, magnetic and thermal characterization; and also
volumetric properties) are given. Finally, the conclusions and future work on these new ILs are
discussed.
Figure 1 Photographs of the different metal thiocyanate ionic liquids studied. (a) Cd; (b) Hg;
(c) Cu; (d) Zn; (e) Fe; (f) Fe, seeing by reflection; (g) Cr; (h) Co; (i) Mn; (j) Al.
2. EXPERIMENTAL DETAILS
2.1. Synthesis
The chemical reaction used to obtain the eight novel compounds is similar for all of them,
following previous reported synthesis method of the [BMIM]2 Co(SCN)4 [41]:
MClz + n K(SCN) + (n-z) [BMIM] Cl → [BMIM]n-z M(SCN)n + n KCl
Where M is the given metal with oxidation state, z+, and n is 4 or 6, depending on the
tetrahedral or octahedral complex formed by the metal, respectively. Except for the Ni
thiocyanate [37], all the other studied compounds present the melting temperature below room
temperature. In the following paragraphs we will include details of the synthesis process and
ACCEPTED MANUSCRIPT
ACC
EPTE
D M
ANU
SCR
IPT
4
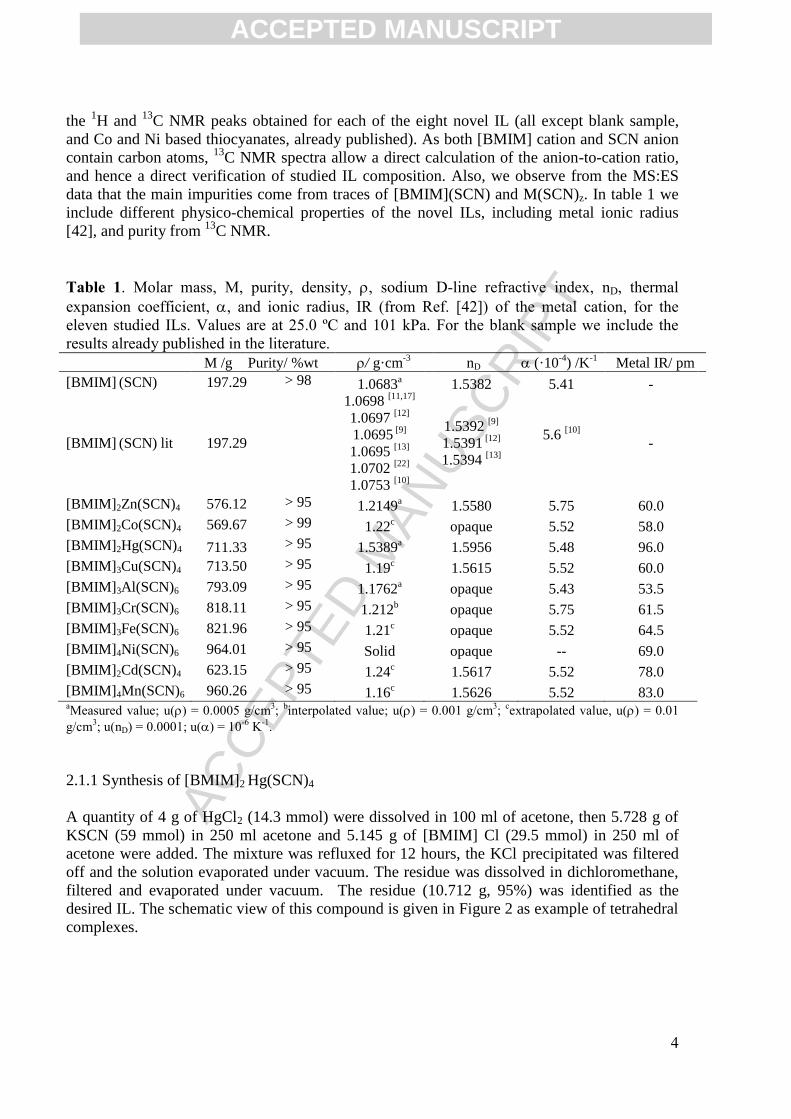
the 1H and
13C NMR peaks obtained for each of the eight novel IL (all except blank sample,
and Co and Ni based thiocyanates, already published). As both [BMIM] cation and SCN anion
contain carbon atoms, 13
C NMR spectra allow a direct calculation of the anion-to-cation ratio,
and hence a direct verification of studied IL composition. Also, we observe from the MS:ES
data that the main impurities come from traces of [BMIM](SCN) and M(SCN)z. In table 1 we
include different physico-chemical properties of the novel ILs, including metal ionic radius
[42], and purity from 13
C NMR.
Table 1. Molar mass, M, purity, density, , sodium D-line refractive index, nD, thermal
expansion coefficient, , and ionic radius, IR (from Ref. [42]) of the metal cation, for the
eleven studied ILs. Values are at 25.0 ºC and 101 kPa. For the blank sample we include the
results already published in the literature.
M /g Purity/ %wt / g·cm-3 nD (·10
-4) /K
-1 Metal IR/ pm
[BMIM] (SCN) 197.29 > 98 1.0683a 1.5382 5.41 -
[BMIM] (SCN) lit 197.29
1.0698 [11,17]
1.0697 [12]
1.0695 [9]
1.0695 [13]
1.0702 [22]
1.0753 [10]
1.5392 [9]
1.5391 [12]
1.5394 [13]
5.6 [10]
-
[BMIM]2Zn(SCN)4 576.12 > 95 1.2149a 1.5580 5.75 60.0
[BMIM]2Co(SCN)4 569.67 > 99 1.22c opaque 5.52 58.0
[BMIM]2Hg(SCN)4 711.33 > 95 1.5389a 1.5956 5.48 96.0
[BMIM]3Cu(SCN)4 713.50 > 95 1.19c 1.5615 5.52 60.0
[BMIM]3Al(SCN)6 793.09 > 95 1.1762a opaque 5.43 53.5
[BMIM]3Cr(SCN)6 818.11 > 95 1.212b opaque 5.75 61.5
[BMIM]3Fe(SCN)6 821.96 > 95 1.21c opaque 5.52 64.5
[BMIM]4Ni(SCN)6 964.01 > 95 Solid opaque -- 69.0
[BMIM]2Cd(SCN)4 623.15 > 95 1.24c 1.5617 5.52 78.0
[BMIM]4Mn(SCN)6 960.26 > 95 1.16c 1.5626 5.52 83.0
aMeasured value; u() = 0.0005 g/cm
3;
binterpolated value; u() = 0.001 g/cm
3;
cextrapolated value, u() = 0.01
g/cm3; u(nD) = 0.0001; u() = 10
-6 K
-1.
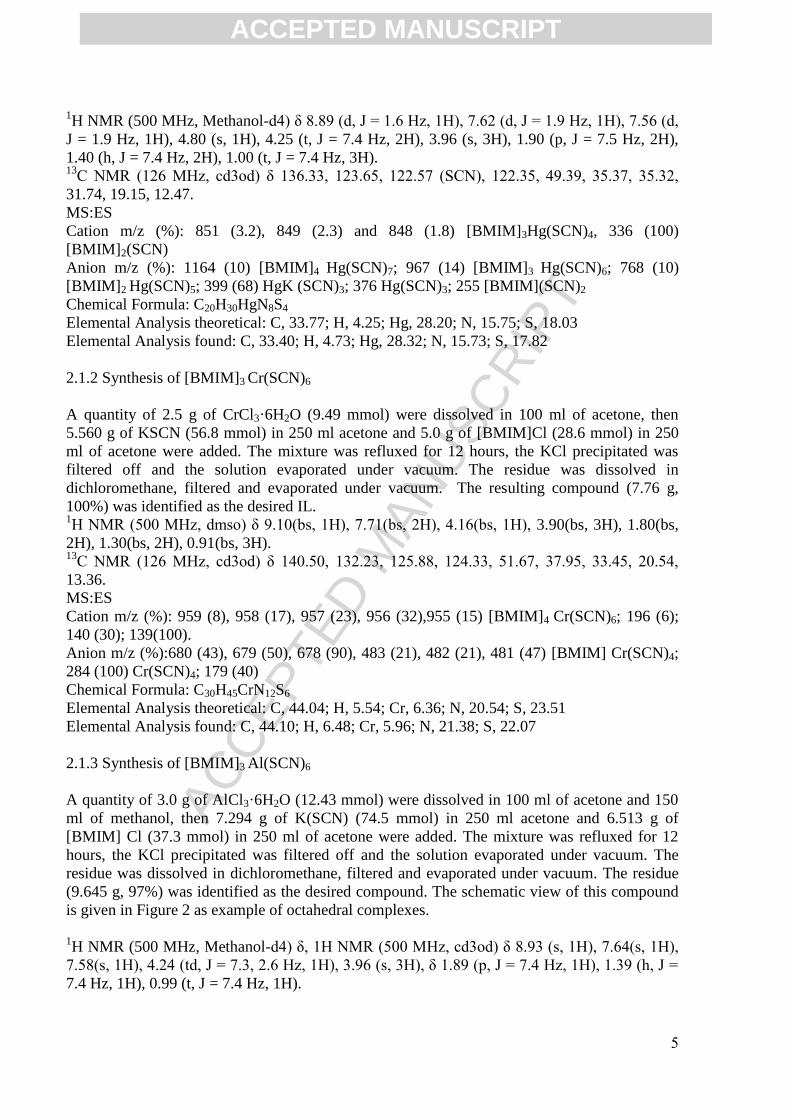
2.1.1 Synthesis of [BMIM]2 Hg(SCN)4
A quantity of 4 g of HgCl2 (14.3 mmol) were dissolved in 100 ml of acetone, then 5.728 g of
KSCN (59 mmol) in 250 ml acetone and 5.145 g of [BMIM] Cl (29.5 mmol) in 250 ml of
acetone were added. The mixture was refluxed for 12 hours, the KCl precipitated was filtered
off and the solution evaporated under vacuum. The residue was dissolved in dichloromethane,
filtered and evaporated under vacuum. The residue (10.712 g, 95%) was identified as the
desired IL. The schematic view of this compound is given in Figure 2 as example of tetrahedral
complexes.
ACCEPTED MANUSCRIPT
ACC
EPTE
D M
ANU
SCR
IPT
5
1H NMR (500 MHz, Methanol-d4) δ 8.89 (d, J = 1.6 Hz, 1H), 7.62 (d, J = 1.9 Hz, 1H), 7.56 (d,
J = 1.9 Hz, 1H), 4.80 (s, 1H), 4.25 (t, J = 7.4 Hz, 2H), 3.96 (s, 3H), 1.90 (p, J = 7.5 Hz, 2H),
1.40 (h, J = 7.4 Hz, 2H), 1.00 (t, J = 7.4 Hz, 3H). 13
C NMR (126 MHz, cd3od) δ 136.33, 123.65, 122.57 (SCN), 122.35, 49.39, 35.37, 35.32,
31.74, 19.15, 12.47.
MS:ES
Cation m/z (%): 851 (3.2), 849 (2.3) and 848 (1.8) [BMIM]3Hg(SCN)4, 336 (100)
[BMIM]2(SCN)
Anion m/z (%): 1164 (10) [BMIM]4 Hg(SCN)7; 967 (14) [BMIM]3 Hg(SCN)6; 768 (10)
[BMIM]2 Hg(SCN)5; 399 (68) HgK (SCN)3; 376 Hg(SCN)3; 255 [BMIM](SCN)2
Chemical Formula: C20H30HgN8S4
Elemental Analysis theoretical: C, 33.77; H, 4.25; Hg, 28.20; N, 15.75; S, 18.03
Elemental Analysis found: C, 33.40; H, 4.73; Hg, 28.32; N, 15.73; S, 17.82
2.1.2 Synthesis of [BMIM]3 Cr(SCN)6
A quantity of 2.5 g of CrCl3·6H2O (9.49 mmol) were dissolved in 100 ml of acetone, then
5.560 g of KSCN (56.8 mmol) in 250 ml acetone and 5.0 g of [BMIM]Cl (28.6 mmol) in 250
ml of acetone were added. The mixture was refluxed for 12 hours, the KCl precipitated was
filtered off and the solution evaporated under vacuum. The residue was dissolved in
dichloromethane, filtered and evaporated under vacuum. The resulting compound (7.76 g,
100%) was identified as the desired IL. 1H NMR (500 MHz, dmso) δ 9.10(bs, 1H), 7.71(bs, 2H), 4.16(bs, 1H), 3.90(bs, 3H), 1.80(bs,
2H), 1.30(bs, 2H), 0.91(bs, 3H). 13
C NMR (126 MHz, cd3od) δ 140.50, 132.23, 125.88, 124.33, 51.67, 37.95, 33.45, 20.54,
13.36.
MS:ES
Cation m/z (%): 959 (8), 958 (17), 957 (23), 956 (32),955 (15) [BMIM]4 Cr(SCN)6; 196 (6);
140 (30); 139(100).
Anion m/z (%):680 (43), 679 (50), 678 (90), 483 (21), 482 (21), 481 (47) [BMIM] Cr(SCN)4;
284 (100) Cr(SCN)4; 179 (40)
Chemical Formula: C30H45CrN12S6
Elemental Analysis theoretical: C, 44.04; H, 5.54; Cr, 6.36; N, 20.54; S, 23.51
Elemental Analysis found: C, 44.10; H, 6.48; Cr, 5.96; N, 21.38; S, 22.07
2.1.3 Synthesis of [BMIM]3 Al(SCN)6
A quantity of 3.0 g of AlCl3·6H2O (12.43 mmol) were dissolved in 100 ml of acetone and 150
ml of methanol, then 7.294 g of K(SCN) (74.5 mmol) in 250 ml acetone and 6.513 g of
[BMIM] Cl (37.3 mmol) in 250 ml of acetone were added. The mixture was refluxed for 12
hours, the KCl precipitated was filtered off and the solution evaporated under vacuum. The
residue was dissolved in dichloromethane, filtered and evaporated under vacuum. The residue
(9.645 g, 97%) was identified as the desired compound. The schematic view of this compound
is given in Figure 2 as example of octahedral complexes.
1H NMR (500 MHz, Methanol-d4) δ, 1H NMR (500 MHz, cd3od) δ 8.93 (s, 1H), 7.64(s, 1H),
7.58(s, 1H), 4.24 (td, J = 7.3, 2.6 Hz, 1H), 3.96 (s, 3H), δ 1.89 (p, J = 7.4 Hz, 1H), 1.39 (h, J =
7.4 Hz, 1H), 0.99 (t, J = 7.4 Hz, 1H).
ACCEPTED MANUSCRIPT
ACC
EPTE
D M
ANU
SCR
IPT
6
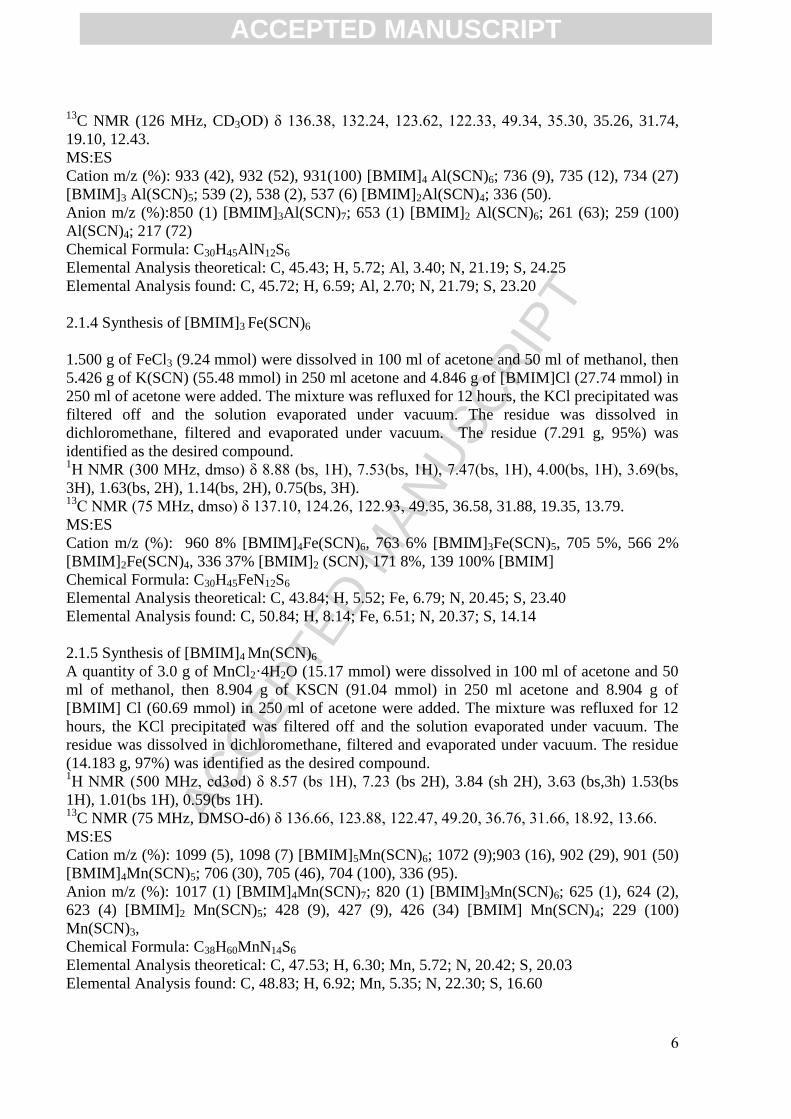
13C NMR (126 MHz, CD3OD) δ 136.38, 132.24, 123.62, 122.33, 49.34, 35.30, 35.26, 31.74,
19.10, 12.43.
MS:ES
Cation m/z (%): 933 (42), 932 (52), 931(100) [BMIM]4 Al(SCN)6; 736 (9), 735 (12), 734 (27)
[BMIM]3 Al(SCN)5; 539 (2), 538 (2), 537 (6) [BMIM]2Al(SCN)4; 336 (50).
Anion m/z (%):850 (1) [BMIM]3Al(SCN)7; 653 (1) [BMIM]2 Al(SCN)6; 261 (63); 259 (100)
Al(SCN)4; 217 (72)
Chemical Formula: C30H45AlN12S6
Elemental Analysis theoretical: C, 45.43; H, 5.72; Al, 3.40; N, 21.19; S, 24.25
Elemental Analysis found: C, 45.72; H, 6.59; Al, 2.70; N, 21.79; S, 23.20
2.1.4 Synthesis of [BMIM]3 Fe(SCN)6
1.500 g of FeCl3 (9.24 mmol) were dissolved in 100 ml of acetone and 50 ml of methanol, then
5.426 g of K(SCN) (55.48 mmol) in 250 ml acetone and 4.846 g of [BMIM]Cl (27.74 mmol) in
250 ml of acetone were added. The mixture was refluxed for 12 hours, the KCl precipitated was
filtered off and the solution evaporated under vacuum. The residue was dissolved in
dichloromethane, filtered and evaporated under vacuum. The residue (7.291 g, 95%) was
identified as the desired compound. 1H NMR (300 MHz, dmso) δ 8.88 (bs, 1H), 7.53(bs, 1H), 7.47(bs, 1H), 4.00(bs, 1H), 3.69(bs,
3H), 1.63(bs, 2H), 1.14(bs, 2H), 0.75(bs, 3H). 13
C NMR (75 MHz, dmso) δ 137.10, 124.26, 122.93, 49.35, 36.58, 31.88, 19.35, 13.79. MS:ES
Cation m/z (%): 960 8% [BMIM]4Fe(SCN)6, 763 6% [BMIM]3Fe(SCN)5, 705 5%, 566 2%
[BMIM]2Fe(SCN)4, 336 37% [BMIM]2 (SCN), 171 8%, 139 100% [BMIM]
Chemical Formula: C30H45FeN12S6
Elemental Analysis theoretical: C, 43.84; H, 5.52; Fe, 6.79; N, 20.45; S, 23.40
Elemental Analysis found: C, 50.84; H, 8.14; Fe, 6.51; N, 20.37; S, 14.14
2.1.5 Synthesis of [BMIM]4 Mn(SCN)6
A quantity of 3.0 g of MnCl2·4H2O (15.17 mmol) were dissolved in 100 ml of acetone and 50
ml of methanol, then 8.904 g of KSCN (91.04 mmol) in 250 ml acetone and 8.904 g of
[BMIM] Cl (60.69 mmol) in 250 ml of acetone were added. The mixture was refluxed for 12
hours, the KCl precipitated was filtered off and the solution evaporated under vacuum. The
residue was dissolved in dichloromethane, filtered and evaporated under vacuum. The residue
(14.183 g, 97%) was identified as the desired compound. 1H NMR (500 MHz, cd3od) δ 8.57 (bs 1H), 7.23 (bs 2H), 3.84 (sh 2H), 3.63 (bs,3h) 1.53(bs
1H), 1.01(bs 1H), 0.59(bs 1H). 13
C NMR (75 MHz, DMSO-d6) δ 136.66, 123.88, 122.47, 49.20, 36.76, 31.66, 18.92, 13.66.
MS:ES
Cation m/z (%): 1099 (5), 1098 (7) [BMIM]5Mn(SCN)6; 1072 (9);903 (16), 902 (29), 901 (50)
[BMIM]4Mn(SCN)5; 706 (30), 705 (46), 704 (100), 336 (95).
Anion m/z (%): 1017 (1) [BMIM]4Mn(SCN)7; 820 (1) [BMIM]3Mn(SCN)6; 625 (1), 624 (2),
623 (4) [BMIM]2 Mn(SCN)5; 428 (9), 427 (9), 426 (34) [BMIM] Mn(SCN)4; 229 (100)
Mn(SCN)3,
Chemical Formula: C38H60MnN14S6
Elemental Analysis theoretical: C, 47.53; H, 6.30; Mn, 5.72; N, 20.42; S, 20.03
Elemental Analysis found: C, 48.83; H, 6.92; Mn, 5.35; N, 22.30; S, 16.60
ACCEPTED MANUSCRIPT
ACC
EPTE
D M
ANU
SCR
IPT
7
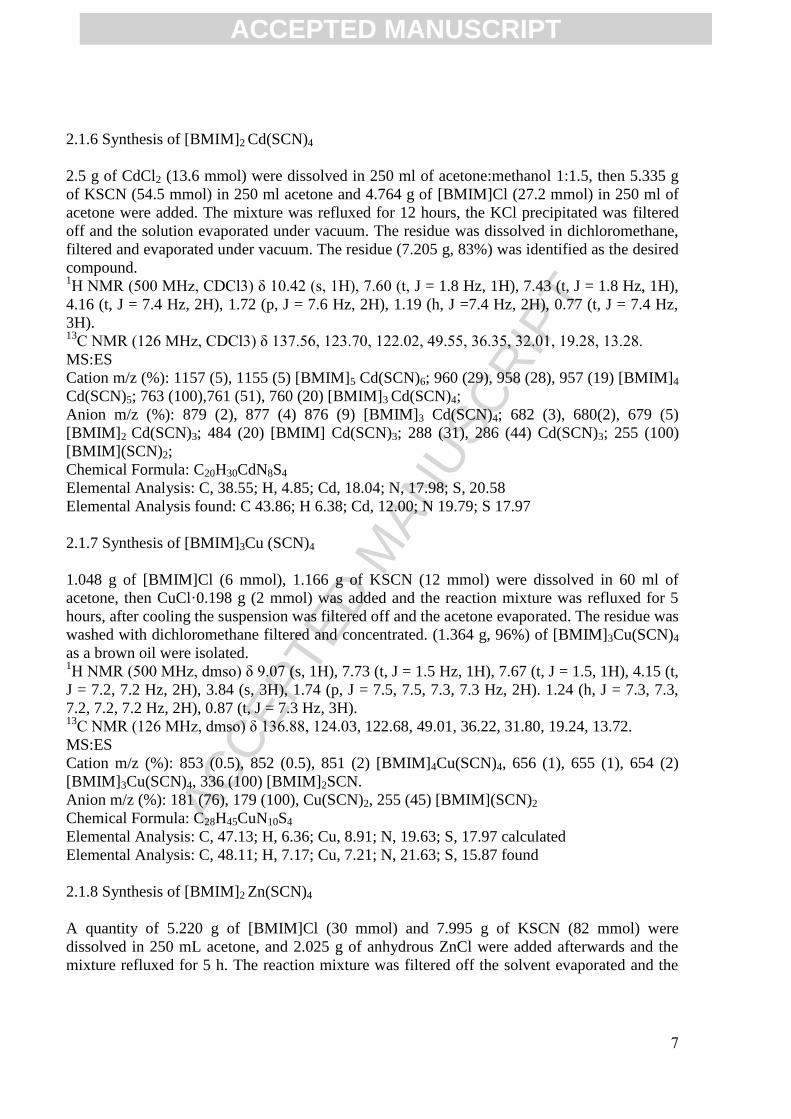
2.1.6 Synthesis of [BMIM]2 Cd(SCN)4
2.5 g of CdCl2 (13.6 mmol) were dissolved in 250 ml of acetone:methanol 1:1.5, then 5.335 g
of KSCN (54.5 mmol) in 250 ml acetone and 4.764 g of [BMIM]Cl (27.2 mmol) in 250 ml of
acetone were added. The mixture was refluxed for 12 hours, the KCl precipitated was filtered
off and the solution evaporated under vacuum. The residue was dissolved in dichloromethane,
filtered and evaporated under vacuum. The residue (7.205 g, 83%) was identified as the desired
compound. 1H NMR (500 MHz, CDCl3) δ 10.42 (s, 1H), 7.60 (t, J = 1.8 Hz, 1H), 7.43 (t, J = 1.8 Hz, 1H),
4.16 (t, J = 7.4 Hz, 2H), 1.72 (p, J = 7.6 Hz, 2H), 1.19 (h, J =7.4 Hz, 2H), 0.77 (t, J = 7.4 Hz,
3H). 13
C NMR (126 MHz, CDCl3) δ 137.56, 123.70, 122.02, 49.55, 36.35, 32.01, 19.28, 13.28.
MS:ES
Cation m/z (%): 1157 (5), 1155 (5) [BMIM]5 Cd(SCN)6; 960 (29), 958 (28), 957 (19) [BMIM]4
Cd(SCN)5; 763 (100),761 (51), 760 (20) [BMIM]3 Cd(SCN)4;
Anion m/z (%): 879 (2), 877 (4) 876 (9) [BMIM]3 Cd(SCN)4; 682 (3), 680(2), 679 (5)
[BMIM]2 Cd(SCN)3; 484 (20) [BMIM] Cd(SCN)3; 288 (31), 286 (44) Cd(SCN)3; 255 (100)
[BMIM](SCN)2;
Chemical Formula: C20H30CdN8S4
Elemental Analysis: C, 38.55; H, 4.85; Cd, 18.04; N, 17.98; S, 20.58
Elemental Analysis found: C 43.86; H 6.38; Cd, 12.00; N 19.79; S 17.97
2.1.7 Synthesis of [BMIM]3Cu (SCN)4
1.048 g of [BMIM]Cl (6 mmol), 1.166 g of KSCN (12 mmol) were dissolved in 60 ml of
acetone, then CuCl·0.198 g (2 mmol) was added and the reaction mixture was refluxed for 5
hours, after cooling the suspension was filtered off and the acetone evaporated. The residue was
washed with dichloromethane filtered and concentrated. (1.364 g, 96%) of [BMIM]3Cu(SCN)4
as a brown oil were isolated. 1H NMR (500 MHz, dmso) δ 9.07 (s, 1H), 7.73 (t, J = 1.5 Hz, 1H), 7.67 (t, J = 1.5, 1H), 4.15 (t,
J = 7.2, 7.2 Hz, 2H), 3.84 (s, 3H), 1.74 (p, J = 7.5, 7.5, 7.3, 7.3 Hz, 2H). 1.24 (h, J = 7.3, 7.3,
7.2, 7.2, 7.2 Hz, 2H), 0.87 (t, J = 7.3 Hz, 3H). 13
C NMR (126 MHz, dmso) δ 136.88, 124.03, 122.68, 49.01, 36.22, 31.80, 19.24, 13.72.
MS:ES
Cation m/z (%): 853 (0.5), 852 (0.5), 851 (2) [BMIM]4Cu(SCN)4, 656 (1), 655 (1), 654 (2)
[BMIM]3Cu(SCN)4, 336 (100) [BMIM]2SCN.
Anion m/z (%): 181 (76), 179 (100), Cu(SCN)2, 255 (45) [BMIM](SCN)2
Chemical Formula: C28H45CuN10S4
Elemental Analysis: C, 47.13; H, 6.36; Cu, 8.91; N, 19.63; S, 17.97 calculated
Elemental Analysis: C, 48.11; H, 7.17; Cu, 7.21; N, 21.63; S, 15.87 found
2.1.8 Synthesis of [BMIM]2 Zn(SCN)4
A quantity of 5.220 g of [BMIM]Cl (30 mmol) and 7.995 g of KSCN (82 mmol) were
dissolved in 250 mL acetone, and 2.025 g of anhydrous ZnCl were added afterwards and the
mixture refluxed for 5 h. The reaction mixture was filtered off the solvent evaporated and the
ACCEPTED MANUSCRIPT
ACC
EPTE
D M
ANU
SCR
IPT
8
residue washed with dichloromethane and filtered. The residue is kept overnight under vacuum
(7.900g, 93%). 1H-NMR (300MHz, DMSO-d6) δ: 9.03 (s, 1H Im-H2), 7.68 (t, 1H, J=1.7Hz), 7.62 (t, 1H,
J=1.73Hz), 4.16 (t, 2H, J=7.23Hz), 3.85 (s, 3H, N-Me), 1.85-1.73 (m, 2H), 1.30 (h, 2H,
J=7.5Hz), 0.90 (t, 3H, J=7.34Hz). 13
C NMR (75 MHz, dmso) δ 137.20, 135.33, 124.31, 122.99, 49.48, 36.49, 31.99, 19.46, 13.77.
MS:ES
Cation m/z (%): 717 (20), 715 (26), 713 (24) [BMIM]3Zn(SCN)4, 336 (10) [BMIM]2SCN, 293
(50), 291(21), 186 (100).
Anion m/z (%): 439 (4), 437 (5), 435 (8), [BMIM]Zn(SCN)4 242 (47), 240 (70), 238 (100)
Zn(SCN)3.
Chemical Formula: C20H30N8S4Zn
Elemental Analysis: C, 41.70; H, 5.25; Zn, 11.35; N, 19.45; S, 22.26 calculated
Elemental Analysis: C, 42.55; H, 6.09; Zn, 10.38; N, 19.82; S, 21.18 found
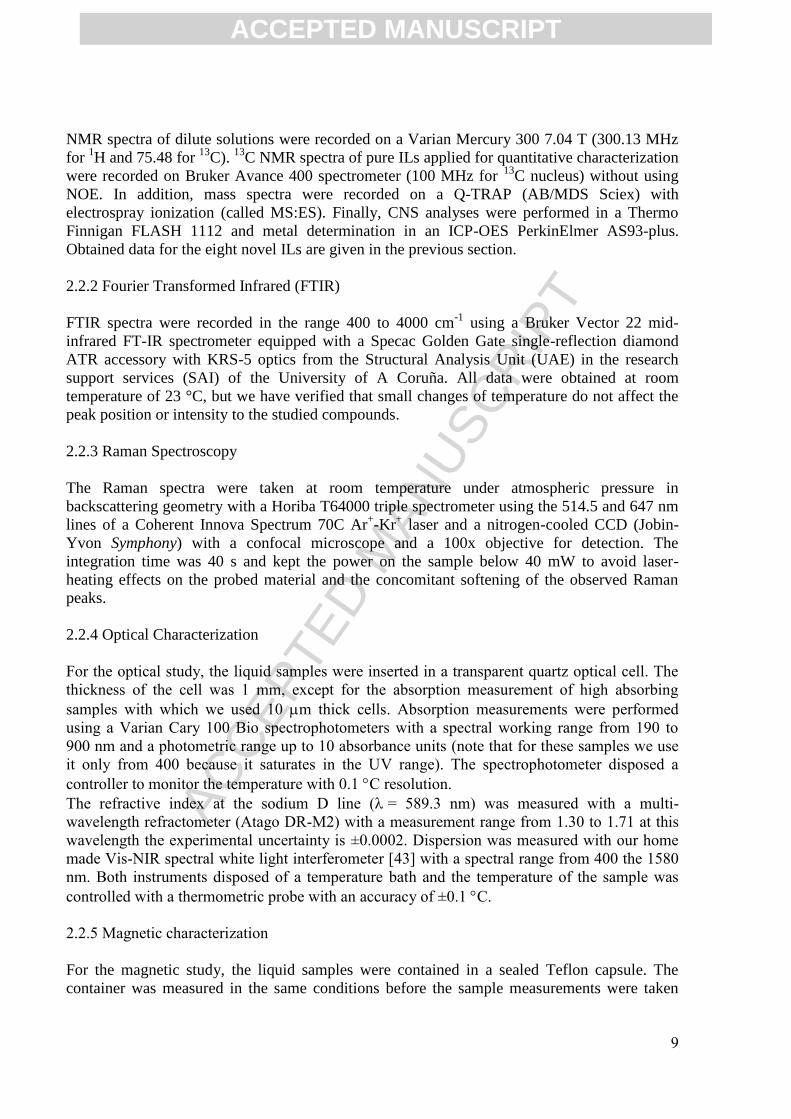
A schematic view of the two metal thiocyanate configurations (tetrahedral and octahedral)
appears in Figure 2, at left for [BMIM]3 Al(SCN)6, and at right for [BMIM]2 Hg(SCN)4
Figure 2. Schematic view of an octahedral (at left) and a tetrahedral (at right) configurations
for the metal cation Al and Hg respectively.
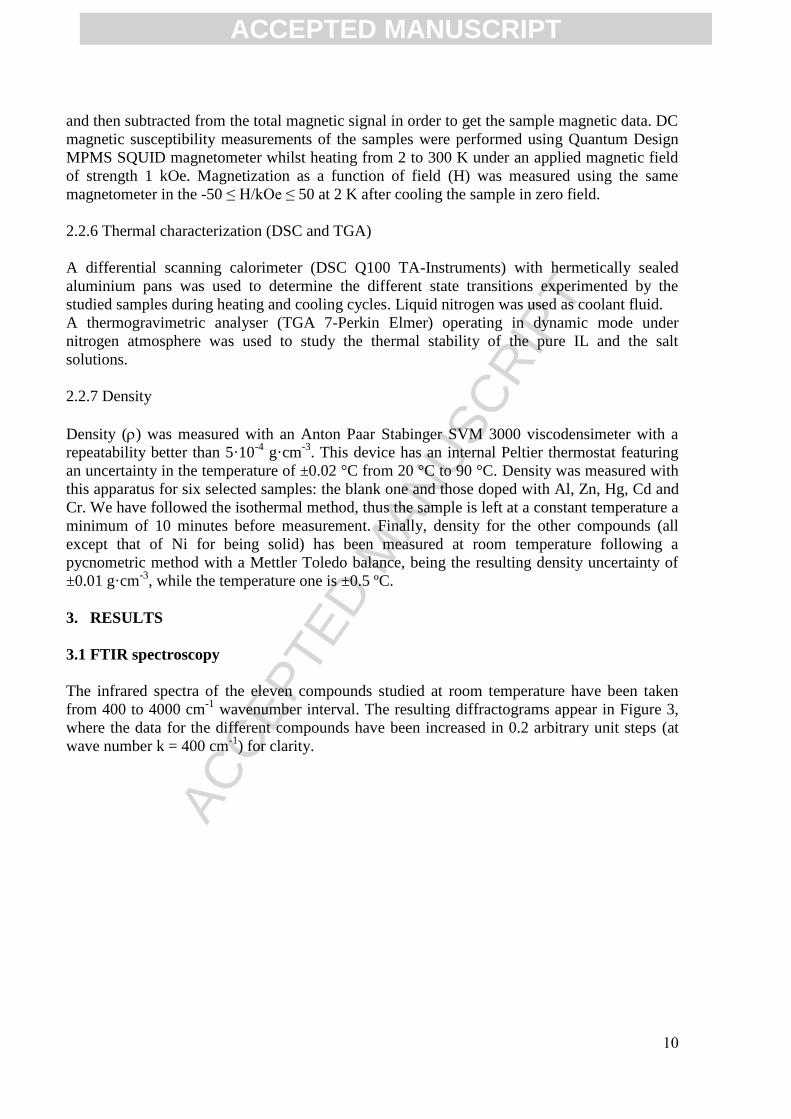
As both cation and anion of the synthesized ILs contain carbon atoms, structure and
composition of the ILs with diamagnetic metals might be also tested using measurements of
integral intensities of 13
C NMR lines. Such measurements, for some of the compounds, are
shown on Table 2 and confirmed the expected structure and composition.
Table 2. Anion/cation relationship obtained from 13
C NMR
Compound anion/cat Expected
[BMIM]2 Zn(SCN)4 1.94 ± 0.02 2
[BMIM]3 Cu(SCN)4 1.31 ± 0.02 1.33
[BMIM]3 Al(SCN)6 2.03 ± 0.02 2
[BMIM] (SCN) 0.95 ± 0.02 1
2.2. Apparatus
In this section we summarize the apparatus used for the multiple characterization of the new
compounds and include also the measurement method followed in each case.
2.2.1 NMR, MS:ES and Elementary Analysis
ACCEPTED MANUSCRIPT
ACC
EPTE
D M
ANU
SCR
IPT
9
NMR spectra of dilute solutions were recorded on a Varian Mercury 300 7.04 T (300.13 MHz
for 1H and 75.48 for
13C).
13C NMR spectra of pure ILs applied for quantitative characterization
were recorded on Bruker Avance 400 spectrometer (100 MHz for 13
C nucleus) without using
NOE. In addition, mass spectra were recorded on a Q-TRAP (AB/MDS Sciex) with
electrospray ionization (called MS:ES). Finally, CNS analyses were performed in a Thermo
Finnigan FLASH 1112 and metal determination in an ICP-OES PerkinElmer AS93-plus.
Obtained data for the eight novel ILs are given in the previous section.
2.2.2 Fourier Transformed Infrared (FTIR)
FTIR spectra were recorded in the range 400 to 4000 cm-1
using a Bruker Vector 22 mid-
infrared FT-IR spectrometer equipped with a Specac Golden Gate single-reflection diamond
ATR accessory with KRS-5 optics from the Structural Analysis Unit (UAE) in the research
support services (SAI) of the University of A Coruña. All data were obtained at room
temperature of 23 °C, but we have verified that small changes of temperature do not affect the
peak position or intensity to the studied compounds.
2.2.3 Raman Spectroscopy
The Raman spectra were taken at room temperature under atmospheric pressure in
backscattering geometry with a Horiba T64000 triple spectrometer using the 514.5 and 647 nm
lines of a Coherent Innova Spectrum 70C Ar+-Kr
+ laser and a nitrogen-cooled CCD (Jobin-
Yvon Symphony) with a confocal microscope and a 100x objective for detection. The
integration time was 40 s and kept the power on the sample below 40 mW to avoid laser-
heating effects on the probed material and the concomitant softening of the observed Raman
peaks.
2.2.4 Optical Characterization
For the optical study, the liquid samples were inserted in a transparent quartz optical cell. The
thickness of the cell was 1 mm, except for the absorption measurement of high absorbing
samples with which we used 10 m thick cells. Absorption measurements were performed
using a Varian Cary 100 Bio spectrophotometers with a spectral working range from 190 to
900 nm and a photometric range up to 10 absorbance units (note that for these samples we use
it only from 400 because it saturates in the UV range). The spectrophotometer disposed a
controller to monitor the temperature with 0.1 C resolution.
The refractive index at the sodium D line (= 589.3 nm) was measured with a multi-
wavelength refractometer (Atago DR-M2) with a measurement range from 1.30 to 1.71 at this
wavelength the experimental uncertainty is ±0.0002. Dispersion was measured with our home
made Vis-NIR spectral white light interferometer [43] with a spectral range from 400 the 1580
nm. Both instruments disposed of a temperature bath and the temperature of the sample was
controlled with a thermometric probe with an accuracy of ±0.1 C.
2.2.5 Magnetic characterization
For the magnetic study, the liquid samples were contained in a sealed Teflon capsule. The
container was measured in the same conditions before the sample measurements were taken
ACCEPTED MANUSCRIPT
ACC
EPTE
D M
ANU
SCR
IPT
10
and then subtracted from the total magnetic signal in order to get the sample magnetic data. DC
magnetic susceptibility measurements of the samples were performed using Quantum Design
MPMS SQUID magnetometer whilst heating from 2 to 300 K under an applied magnetic field
of strength 1 kOe. Magnetization as a function of field (H) was measured using the same
magnetometer in the -50 ≤ H/kOe ≤ 50 at 2 K after cooling the sample in zero field.
2.2.6 Thermal characterization (DSC and TGA)
A differential scanning calorimeter (DSC Q100 TA-Instruments) with hermetically sealed
aluminium pans was used to determine the different state transitions experimented by the
studied samples during heating and cooling cycles. Liquid nitrogen was used as coolant fluid.
A thermogravimetric analyser (TGA 7-Perkin Elmer) operating in dynamic mode under
nitrogen atmosphere was used to study the thermal stability of the pure IL and the salt
solutions.
2.2.7 Density
Density () was measured with an Anton Paar Stabinger SVM 3000 viscodensimeter with a
repeatability better than 5·10-4
g·cm-3
. This device has an internal Peltier thermostat featuring
an uncertainty in the temperature of ±0.02 °C from 20 °C to 90 °C. Density was measured with
this apparatus for six selected samples: the blank one and those doped with Al, Zn, Hg, Cd and
Cr. We have followed the isothermal method, thus the sample is left at a constant temperature a
minimum of 10 minutes before measurement. Finally, density for the other compounds (all
except that of Ni for being solid) has been measured at room temperature following a
pycnometric method with a Mettler Toledo balance, being the resulting density uncertainty of
±0.01 g·cm-3
, while the temperature one is ±0.5 ºC.
3. RESULTS
3.1 FTIR spectroscopy
The infrared spectra of the eleven compounds studied at room temperature have been taken
from 400 to 4000 cm-1
wavenumber interval. The resulting diffractograms appear in Figure 3,
where the data for the different compounds have been increased in 0.2 arbitrary unit steps (at
wave number k = 400 cm-1
) for clarity.
ACCEPTED MANUSCRIPT
ACC
EPTE
D M
ANU
SCR
IPT
11
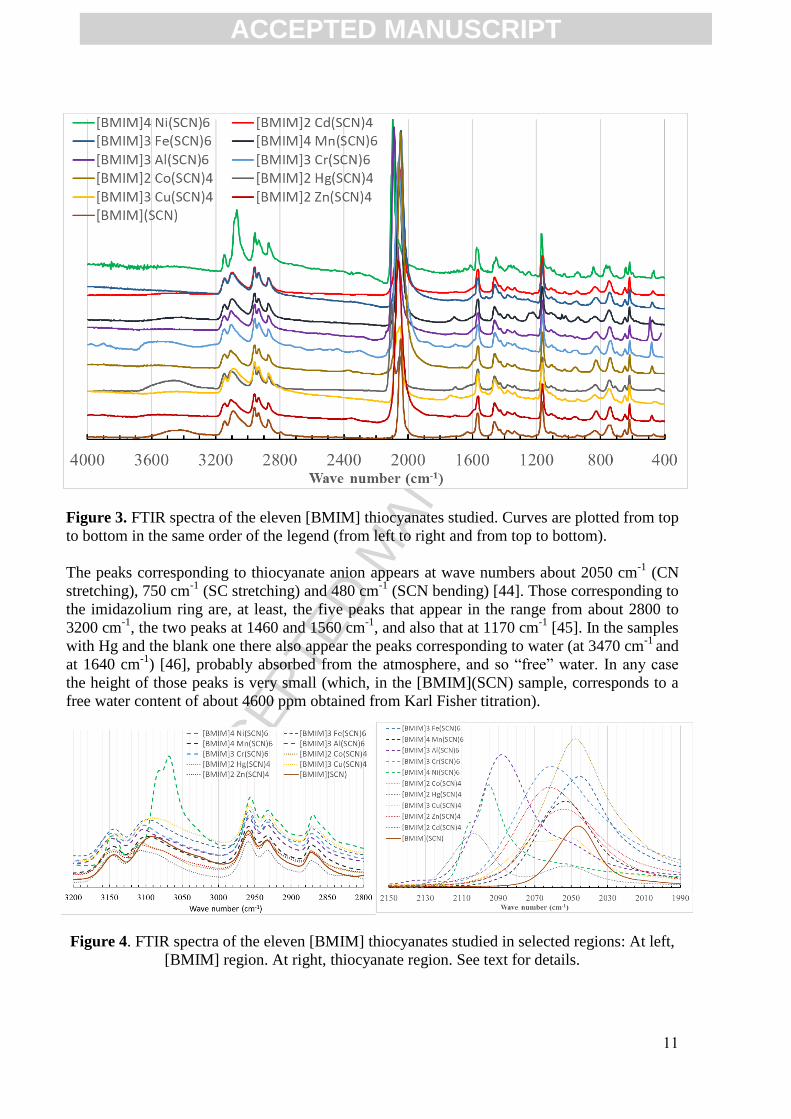
Figure 3. FTIR spectra of the eleven [BMIM] thiocyanates studied. Curves are plotted from top
to bottom in the same order of the legend (from left to right and from top to bottom).
The peaks corresponding to thiocyanate anion appears at wave numbers about 2050 cm-1
(CN
stretching), 750 cm-1
(SC stretching) and 480 cm-1
(SCN bending) [44]. Those corresponding to
the imidazolium ring are, at least, the five peaks that appear in the range from about 2800 to
3200 cm-1
, the two peaks at 1460 and 1560 cm-1
, and also that at 1170 cm-1
[45]. In the samples
with Hg and the blank one there also appear the peaks corresponding to water (at 3470 cm-1
and
at 1640 cm-1
) [46], probably absorbed from the atmosphere, and so “free” water. In any case
the height of those peaks is very small (which, in the [BMIM](SCN) sample, corresponds to a
free water content of about 4600 ppm obtained from Karl Fisher titration).
Figure 4. FTIR spectra of the eleven [BMIM] thiocyanates studied in selected regions: At left,
[BMIM] region. At right, thiocyanate region. See text for details.
ACCEPTED MANUSCRIPT
ACC
EPTE
D M
ANU
SCR
IPT
12
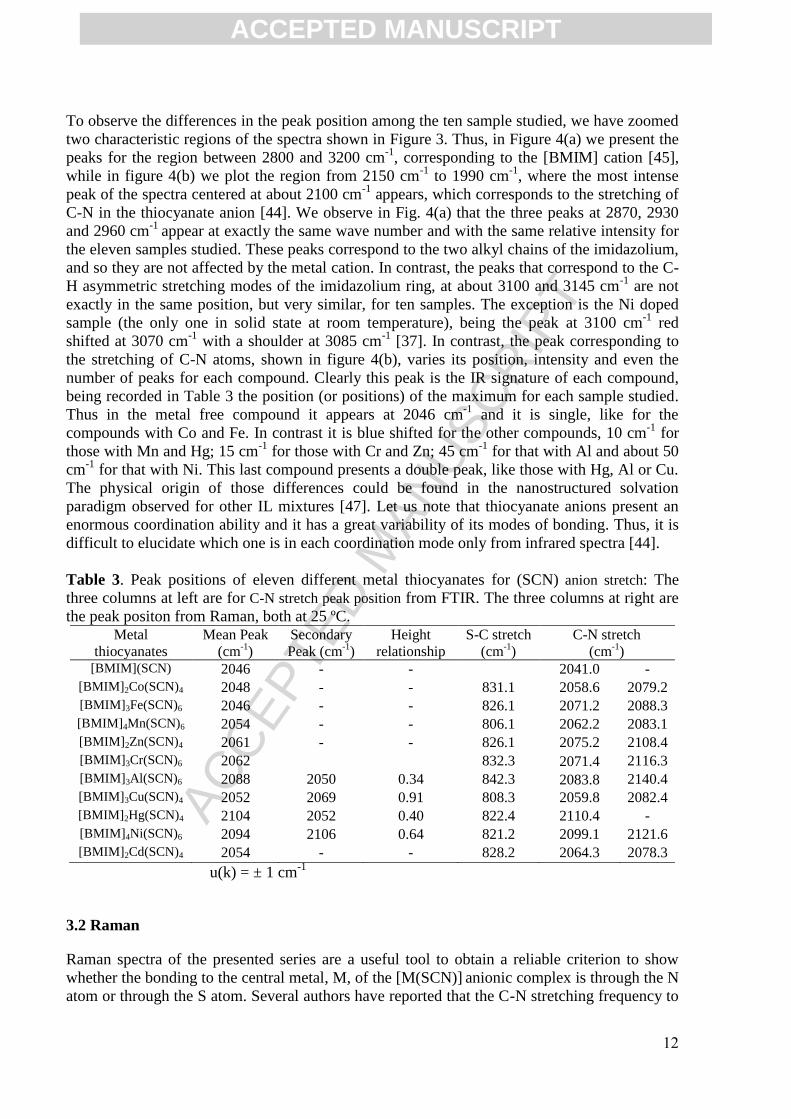
To observe the differences in the peak position among the ten sample studied, we have zoomed
two characteristic regions of the spectra shown in Figure 3. Thus, in Figure 4(a) we present the
peaks for the region between 2800 and 3200 cm-1
, corresponding to the [BMIM] cation [45],
while in figure 4(b) we plot the region from 2150 cm-1
to 1990 cm-1
, where the most intense
peak of the spectra centered at about 2100 cm-1
appears, which corresponds to the stretching of
C-N in the thiocyanate anion [44]. We observe in Fig. 4(a) that the three peaks at 2870, 2930
and 2960 cm-1
appear at exactly the same wave number and with the same relative intensity for
the eleven samples studied. These peaks correspond to the two alkyl chains of the imidazolium,
and so they are not affected by the metal cation. In contrast, the peaks that correspond to the C-
H asymmetric stretching modes of the imidazolium ring, at about 3100 and 3145 cm-1
are not
exactly in the same position, but very similar, for ten samples. The exception is the Ni doped
sample (the only one in solid state at room temperature), being the peak at 3100 cm-1
red
shifted at 3070 cm-1
with a shoulder at 3085 cm-1
[37]. In contrast, the peak corresponding to
the stretching of C-N atoms, shown in figure 4(b), varies its position, intensity and even the
number of peaks for each compound. Clearly this peak is the IR signature of each compound,
being recorded in Table 3 the position (or positions) of the maximum for each sample studied.
Thus in the metal free compound it appears at 2046 cm-1
and it is single, like for the
compounds with Co and Fe. In contrast it is blue shifted for the other compounds, 10 cm-1
for
those with Mn and Hg; 15 cm-1
for those with Cr and Zn; 45 cm-1
for that with Al and about 50
cm-1
for that with Ni. This last compound presents a double peak, like those with Hg, Al or Cu.
The physical origin of those differences could be found in the nanostructured solvation
paradigm observed for other IL mixtures [47]. Let us note that thiocyanate anions present an
enormous coordination ability and it has a great variability of its modes of bonding. Thus, it is
difficult to elucidate which one is in each coordination mode only from infrared spectra [44].
Table 3. Peak positions of eleven different metal thiocyanates for (SCN) anion stretch: The
three columns at left are for C-N stretch peak position from FTIR. The three columns at right are
the peak positon from Raman, both at 25 ºC. Metal
thiocyanates
Mean Peak
(cm-1
)
Secondary
Peak (cm-1
)
Height
relationship
S-C stretch
(cm-1
) C-N stretch
(cm-1
) [BMIM](SCN) 2046 - - 2041.0 -
[BMIM]2Co(SCN)4 2048 - - 831.1 2058.6 2079.2
[BMIM]3Fe(SCN)6 2046 - - 826.1 2071.2 2088.3
[BMIM]4Mn(SCN)6 2054 - - 806.1 2062.2 2083.1
[BMIM]2Zn(SCN)4 2061 - - 826.1 2075.2 2108.4
[BMIM]3Cr(SCN)6 2062 832.3 2071.4 2116.3
[BMIM]3Al(SCN)6 2088 2050 0.34 842.3 2083.8 2140.4
[BMIM]3Cu(SCN)4 2052 2069 0.91 808.3 2059.8 2082.4
[BMIM]2Hg(SCN)4 2104 2052 0.40 822.4 2110.4 -
[BMIM]4Ni(SCN)6 2094 2106 0.64 821.2 2099.1 2121.6
[BMIM]2Cd(SCN)4 2054 - - 828.2 2064.3 2078.3
u(k) = ± 1 cm-1
3.2 Raman
Raman spectra of the presented series are a useful tool to obtain a reliable criterion to show
whether the bonding to the central metal, M, of the [M(SCN)] anionic complex is through the N
atom or through the S atom. Several authors have reported that the C-N stretching frequency to
ACCEPTED MANUSCRIPT
ACC
EPTE
D M
ANU
SCR
IPT
13
be usually higher in S-thiocyanates than in N-thiocyanates, though there are some exceptions
[48,49]. Therefore, the C-S stretching frequency has been found to have the characteristic
values of 780-860 cm-1
in N-thiocyanate complexes as opposed to cu. 700 cm-1
in S-
thiocyanate ones. For the bridging coordination mode, there are rather broad frequency ranges
and these depend on the number and types of coordination bonds of the thiocyanate ligand. It
usually appears in the range of 485-475 and 470-430 cm-1
for N and S-thiocyanates [50].
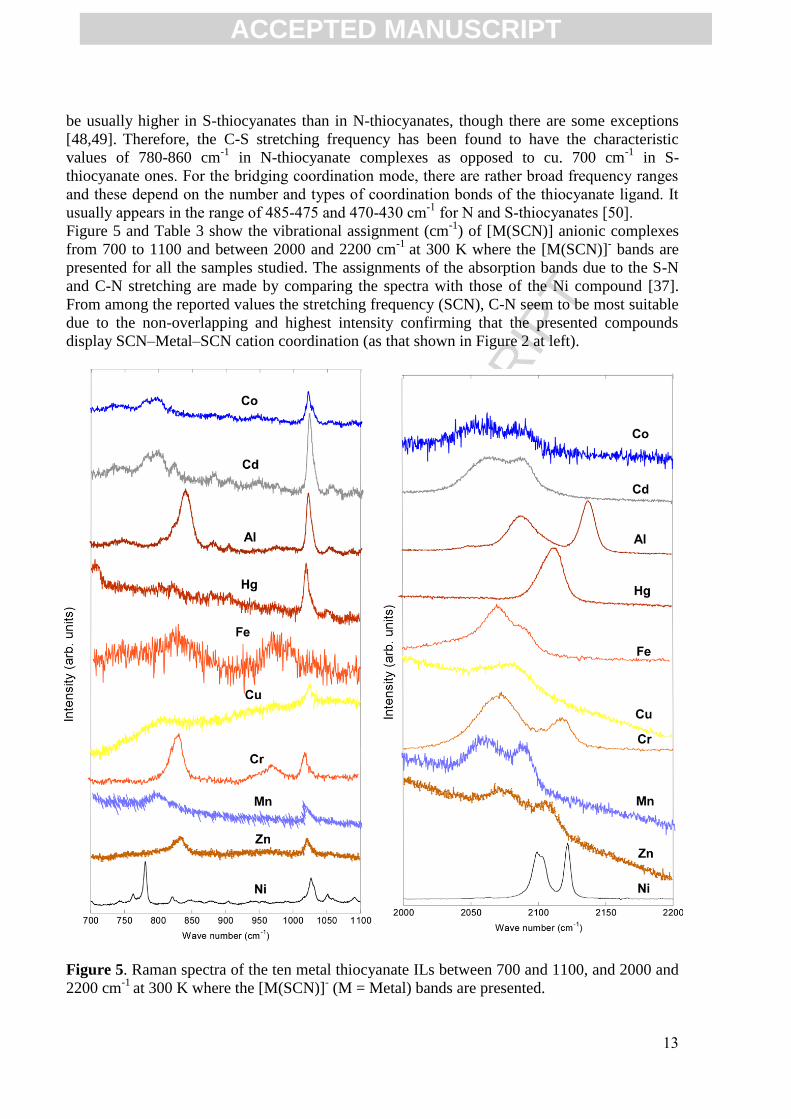
Figure 5 and Table 3 show the vibrational assignment (cm-1
) of [M(SCN)] anionic complexes
from 700 to 1100 and between 2000 and 2200 cm-1
at 300 K where the [M(SCN)]- bands are
presented for all the samples studied. The assignments of the absorption bands due to the S-N
and C-N stretching are made by comparing the spectra with those of the Ni compound [37].
From among the reported values the stretching frequency (SCN), C-N seem to be most suitable
due to the non-overlapping and highest intensity confirming that the presented compounds
display SCN–Metal–SCN cation coordination (as that shown in Figure 2 at left).
Figure 5. Raman spectra of the ten metal thiocyanate ILs between 700 and 1100, and 2000 and
2200 cm-1
at 300 K where the [M(SCN)]- (M = Metal) bands are presented.
ACCEPTED MANUSCRIPT
ACC
EPTE
D M
ANU
SCR
IPT
14
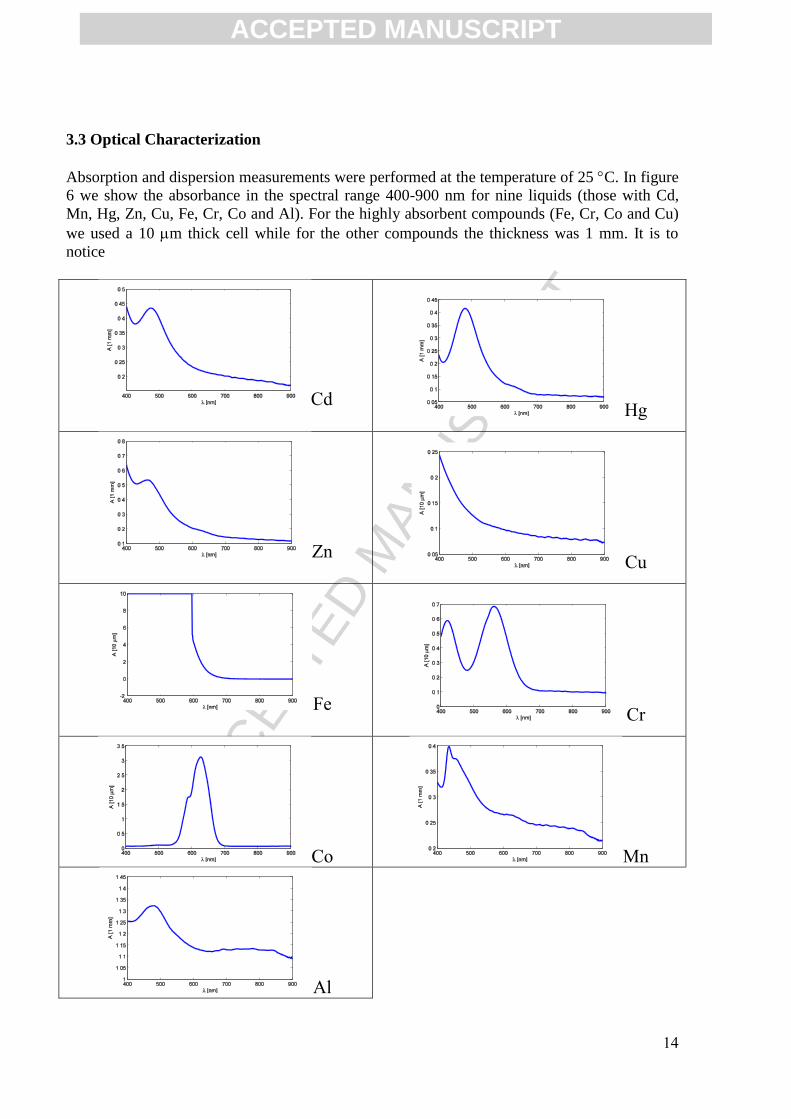
3.3 Optical Characterization
Absorption and dispersion measurements were performed at the temperature of 25 C. In figure
6 we show the absorbance in the spectral range 400-900 nm for nine liquids (those with Cd,
Mn, Hg, Zn, Cu, Fe, Cr, Co and Al). For the highly absorbent compounds (Fe, Cr, Co and Cu)
we used a 10 m thick cell while for the other compounds the thickness was 1 mm. It is to
notice
Cd
Hg
Zn
Cu
Fe
Cr
Co Mn
Al
ACCEPTED MANUSCRIPT

ACC
EPTE
D M
ANU
SCR
IPT
15
Figure 6. Absorbance of nine compounds in the Vis range for from 400 to 800 nm.
that the compounds with high absorption (Fe, Cr and Co) are paramagnetic with low
ferromagnetic interactions (except the Mn based compound which has the same magnetic order
but low absorption), while the other five with low absorption are diamagnetic (see Section 3.4
for the magnetic characterization details). Far more, the Fe compound present the highest
absorption; it exceeds the working photometric range of our instrument in the whole Vis band
except in the range 600-700 nm, even if we used the thin cell to performed the measurement.
For all compounds absorption is large in the Vis band and falls monotonically in the IR band.
Except the Cu compound with and absorption curve which decrease monotonically (and the Fe
compound as noted above), all compounds present one or two peaks of absorption in the Vis
range (except the Cu-based compound).
Figure 7. Refractive indices in the spectral range 400 to 1580 nm
On the other hand, we measured the refractive index for liquids with Cd, Mn, Hg, Zn or Cu in a
broad spectral range, from 400 to 1600 nm. The too high absorption of liquids with Fe, Cr or Co
did not allow us to perform the measurement. Furthermore, we were not able to insert the Al
thiocyanate in the measurement cell due to its too high viscosity. Figure 7 shows the refractive
index curve of the five compounds in the spectral range selected, although the curve begins far
away 400 nm for the Cu compound because of the limitation of absorption. They present the
typical behavior of normal dispersion; high refractive index and dispersion for smaller
wavelengths and smaller refractive index and dispersion for larger wavelengths. Refractive
index values are between 1.52 and 1.63, being similar for liquids with Cd, Mn, Zn or Cu and
larger for the liquid with Hg. The Abbe Number (or V-number) is a magnitude used usually as
a measure of material dispersion. It is defined as:
1D
F C
nV
n n
(1)
where nD, nF and nC are the refractive indices of the material at the wavelengths of the
Fraunhofer D, F and C spectral lines (589.3 nm, 486.1 nm and 656.3 nm respectively). In
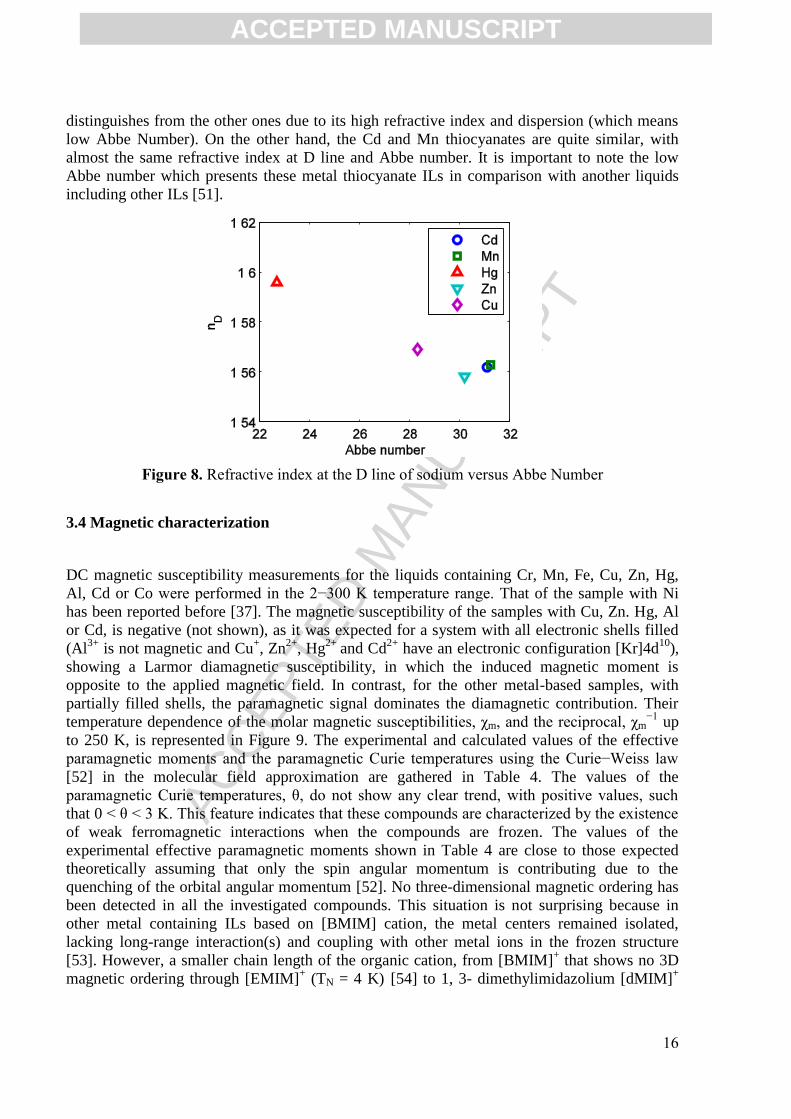
Figure 8 we plot the typical Abbe diagram for the five liquids. In the plot the liquid with Hg
ACCEPTED MANUSCRIPT
ACC
EPTE
D M
ANU
SCR
IPT
16
distinguishes from the other ones due to its high refractive index and dispersion (which means
low Abbe Number). On the other hand, the Cd and Mn thiocyanates are quite similar, with
almost the same refractive index at D line and Abbe number. It is important to note the low
Abbe number which presents these metal thiocyanate ILs in comparison with another liquids
including other ILs [51].
Figure 8. Refractive index at the D line of sodium versus Abbe Number
3.4 Magnetic characterization
DC magnetic susceptibility measurements for the liquids containing Cr, Mn, Fe, Cu, Zn, Hg,
Al, Cd or Co were performed in the 2−300 K temperature range. That of the sample with Ni
has been reported before [37]. The magnetic susceptibility of the samples with Cu, Zn. Hg, Al
or Cd, is negative (not shown), as it was expected for a system with all electronic shells filled
(Al3+
is not magnetic and Cu+, Zn
2+, Hg
2+ and Cd
2+ have an electronic configuration [Kr]4d
10),
showing a Larmor diamagnetic susceptibility, in which the induced magnetic moment is
opposite to the applied magnetic field. In contrast, for the other metal-based samples, with
partially filled shells, the paramagnetic signal dominates the diamagnetic contribution. Their
temperature dependence of the molar magnetic susceptibilities, χm, and the reciprocal, χm−1
up
to 250 K, is represented in Figure 9. The experimental and calculated values of the effective
paramagnetic moments and the paramagnetic Curie temperatures using the Curie−Weiss law
[52] in the molecular field approximation are gathered in Table 4. The values of the
paramagnetic Curie temperatures, θ, do not show any clear trend, with positive values, such
that 0 < θ < 3 K. This feature indicates that these compounds are characterized by the existence
of weak ferromagnetic interactions when the compounds are frozen. The values of the
experimental effective paramagnetic moments shown in Table 4 are close to those expected
theoretically assuming that only the spin angular momentum is contributing due to the
quenching of the orbital angular momentum [52]. No three-dimensional magnetic ordering has
been detected in all the investigated compounds. This situation is not surprising because in
other metal containing ILs based on [BMIM] cation, the metal centers remained isolated,
lacking long-range interaction(s) and coupling with other metal ions in the frozen structure
[53]. However, a smaller chain length of the organic cation, from [BMIM]+ that shows no 3D
magnetic ordering through [EMIM]+ (TN = 4 K) [54] to 1, 3- dimethylimidazolium [dMIM]
+
ACCEPTED MANUSCRIPT
ACC
EPTE
D M
ANU
SCR
IPT
17
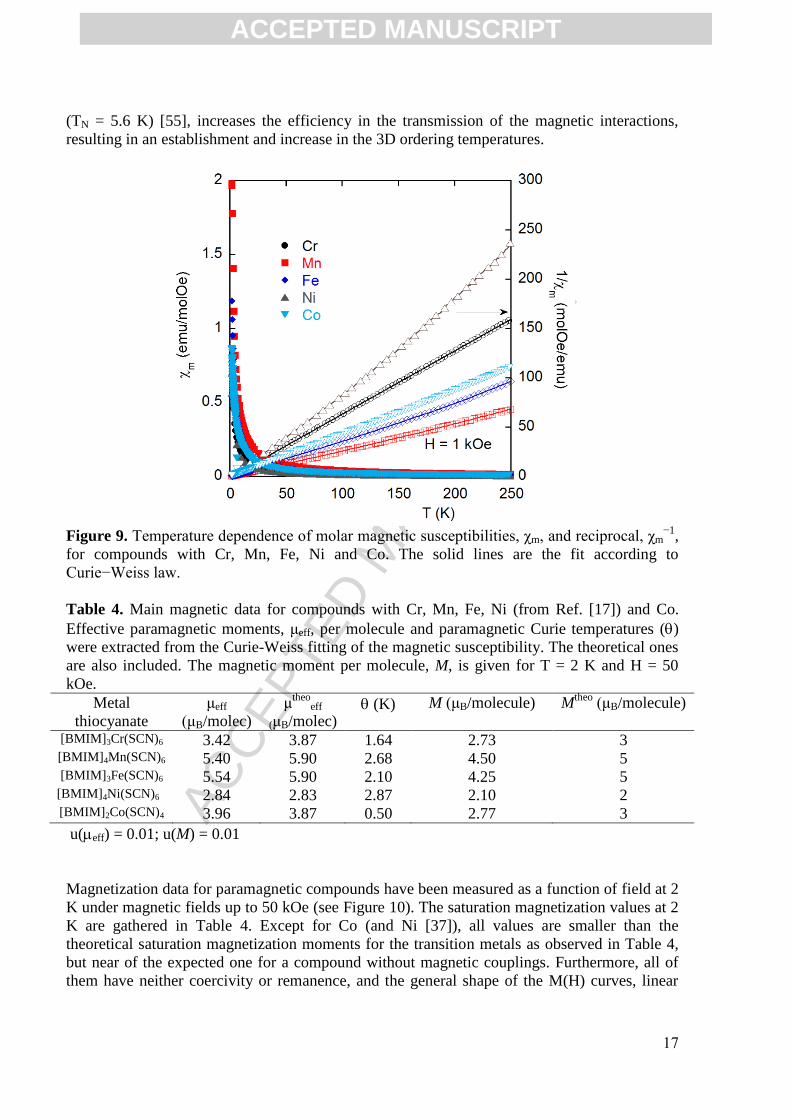
(TN = 5.6 K) [55], increases the efficiency in the transmission of the magnetic interactions,
resulting in an establishment and increase in the 3D ordering temperatures.
Figure 9. Temperature dependence of molar magnetic susceptibilities, χm, and reciprocal, χm
−1,
for compounds with Cr, Mn, Fe, Ni and Co. The solid lines are the fit according to
Curie−Weiss law.
Table 4. Main magnetic data for compounds with Cr, Mn, Fe, Ni (from Ref. [17]) and Co.
Effective paramagnetic moments, μeff, per molecule and paramagnetic Curie temperatures ()
were extracted from the Curie-Weiss fitting of the magnetic susceptibility. The theoretical ones
are also included. The magnetic moment per molecule, M, is given for T = 2 K and H = 50
kOe.
Metal
thiocyanate
μeff
(μB/molec)
μtheo
eff
(μB/molec)
(K) M (μB/molecule) Mtheo
(μB/molecule)
[BMIM]3Cr(SCN)6 3.42 3.87 1.64 2.73 3 [BMIM]4Mn(SCN)6 5.40 5.90 2.68 4.50 5 [BMIM]3Fe(SCN)6 5.54 5.90 2.10 4.25 5
[BMIM]4Ni(SCN)6 2.84 2.83 2.87 2.10 2 [BMIM]2Co(SCN)4 3.96 3.87 0.50 2.77 3
u(eff) = 0.01; u(M) = 0.01
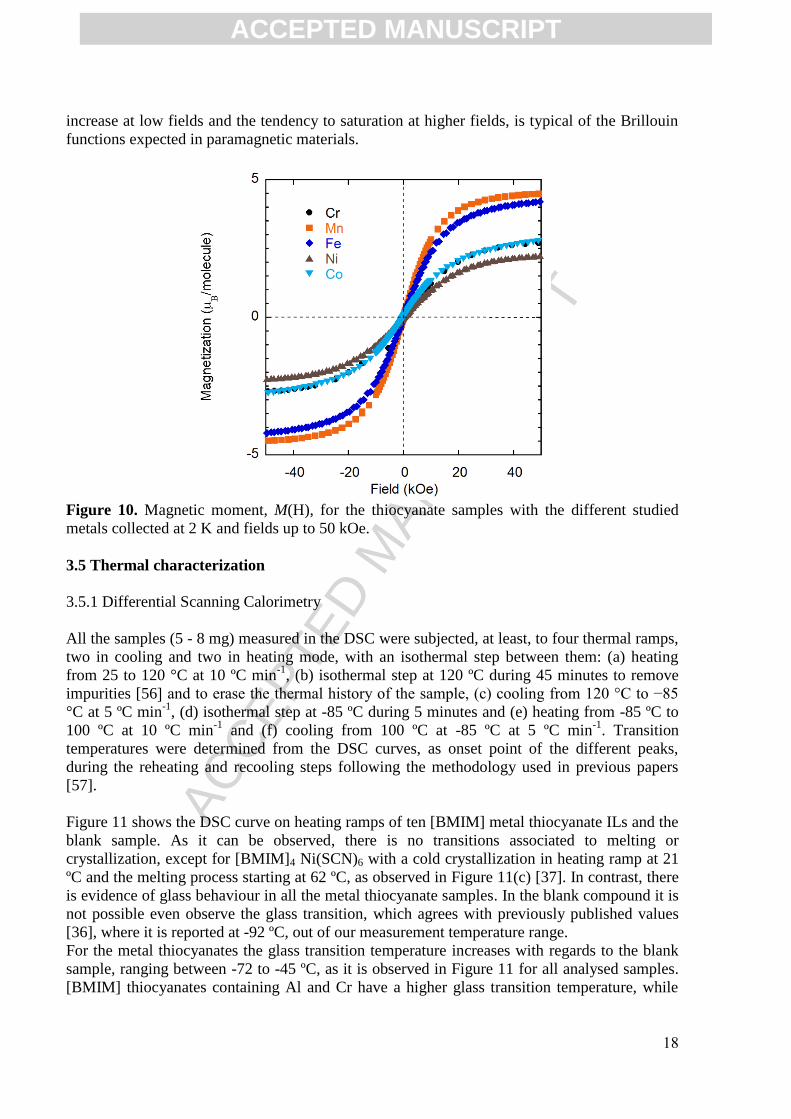
Magnetization data for paramagnetic compounds have been measured as a function of field at 2
K under magnetic fields up to 50 kOe (see Figure 10). The saturation magnetization values at 2
K are gathered in Table 4. Except for Co (and Ni [37]), all values are smaller than the
theoretical saturation magnetization moments for the transition metals as observed in Table 4,
but near of the expected one for a compound without magnetic couplings. Furthermore, all of
them have neither coercivity or remanence, and the general shape of the M(H) curves, linear
ACCEPTED MANUSCRIPT
ACC
EPTE
D M
ANU
SCR
IPT
18
increase at low fields and the tendency to saturation at higher fields, is typical of the Brillouin
functions expected in paramagnetic materials.
Figure 10. Magnetic moment, M(H), for the thiocyanate samples with the different studied
metals collected at 2 K and fields up to 50 kOe.
3.5 Thermal characterization
3.5.1 Differential Scanning Calorimetry
All the samples (5 - 8 mg) measured in the DSC were subjected, at least, to four thermal ramps,
two in cooling and two in heating mode, with an isothermal step between them: (a) heating
from 25 to 120 °C at 10 ºC min-1
, (b) isothermal step at 120 ºC during 45 minutes to remove
impurities [56] and to erase the thermal history of the sample, (c) cooling from 120 °C to −85
°C at 5 ºC min-1
, (d) isothermal step at -85 ºC during 5 minutes and (e) heating from -85 ºC to
100 ºC at 10 ºC min-1
and (f) cooling from 100 ºC at -85 ºC at 5 ºC min-1
. Transition
temperatures were determined from the DSC curves, as onset point of the different peaks,
during the reheating and recooling steps following the methodology used in previous papers
[57].
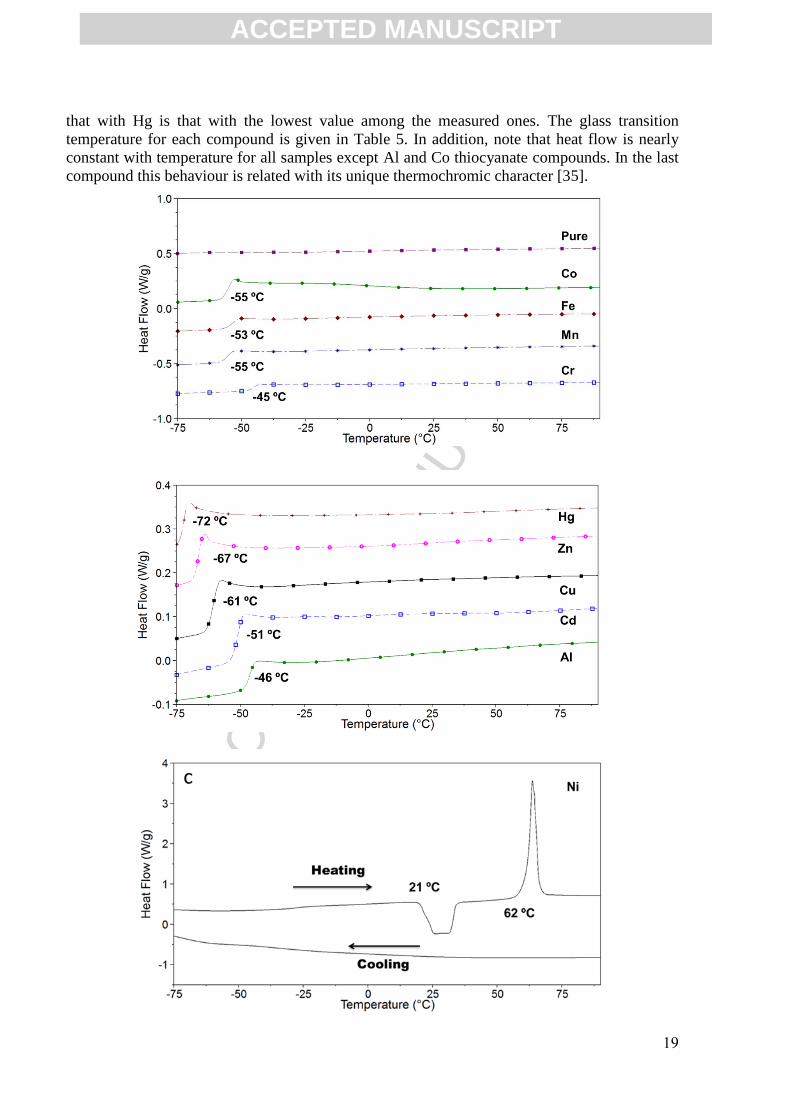
Figure 11 shows the DSC curve on heating ramps of ten [BMIM] metal thiocyanate ILs and the
blank sample. As it can be observed, there is no transitions associated to melting or
crystallization, except for [BMIM]4 Ni(SCN)6 with a cold crystallization in heating ramp at 21
ºC and the melting process starting at 62 ºC, as observed in Figure 11(c) [37]. In contrast, there
is evidence of glass behaviour in all the metal thiocyanate samples. In the blank compound it is
not possible even observe the glass transition, which agrees with previously published values
[36], where it is reported at -92 ºC, out of our measurement temperature range.
For the metal thiocyanates the glass transition temperature increases with regards to the blank
sample, ranging between -72 to -45 ºC, as it is observed in Figure 11 for all analysed samples.
[BMIM] thiocyanates containing Al and Cr have a higher glass transition temperature, while
ACCEPTED MANUSCRIPT
ACC
EPTE
D M
ANU
SCR
IPT
19
that with Hg is that with the lowest value among the measured ones. The glass transition
temperature for each compound is given in Table 5. In addition, note that heat flow is nearly
constant with temperature for all samples except Al and Co thiocyanate compounds. In the last
compound this behaviour is related with its unique thermochromic character [35].
ACCEPTED MANUSCRIPT
ACC
EPTE
D M
ANU
SCR
IPT
20
Figure 11. DSC curves of ten [BMIM] metal thiocyanate ILs and the blank sample.
3.5.2 Thermogravimetric Analysis
For TGA, samples of (3 - 5 mg) were placed in an open platinum pan and dynamic experiments
were performed at temperatures from (100 to 800) ºC, with different heating rates, between 1
and 20 ºC min-1
and with a purge gas flow of 20 cm3·min
-1. Each analysis was repeated three
times.
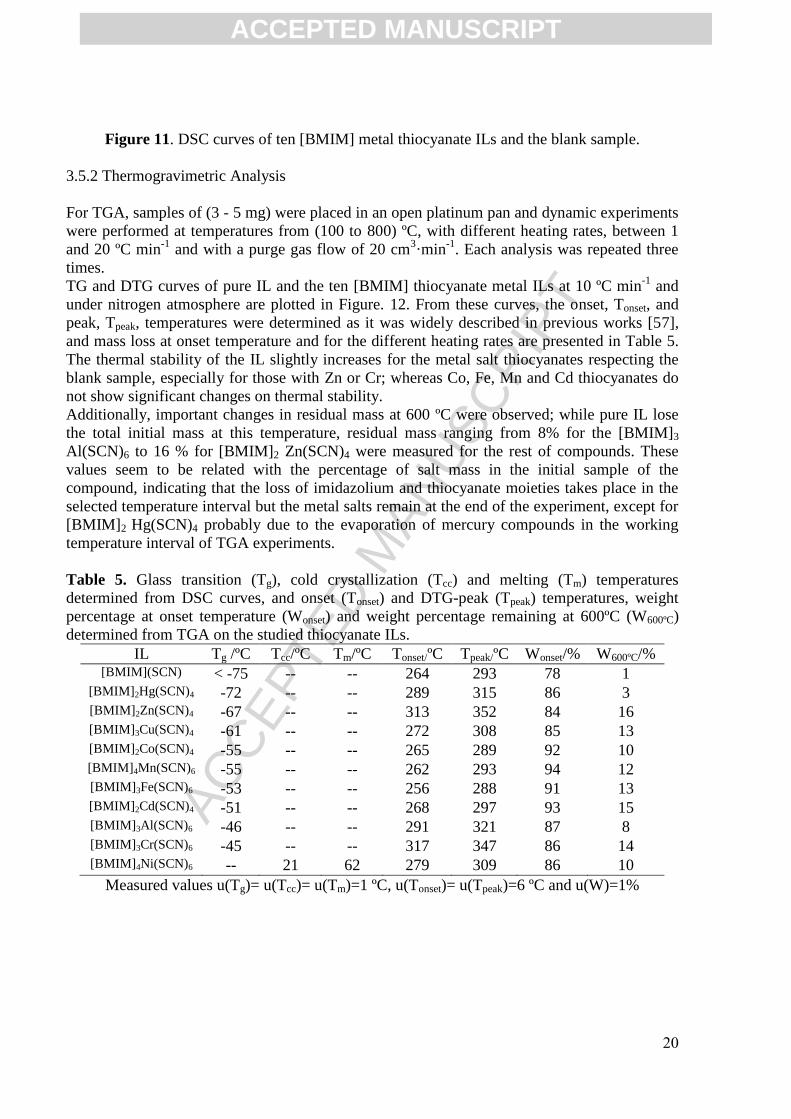
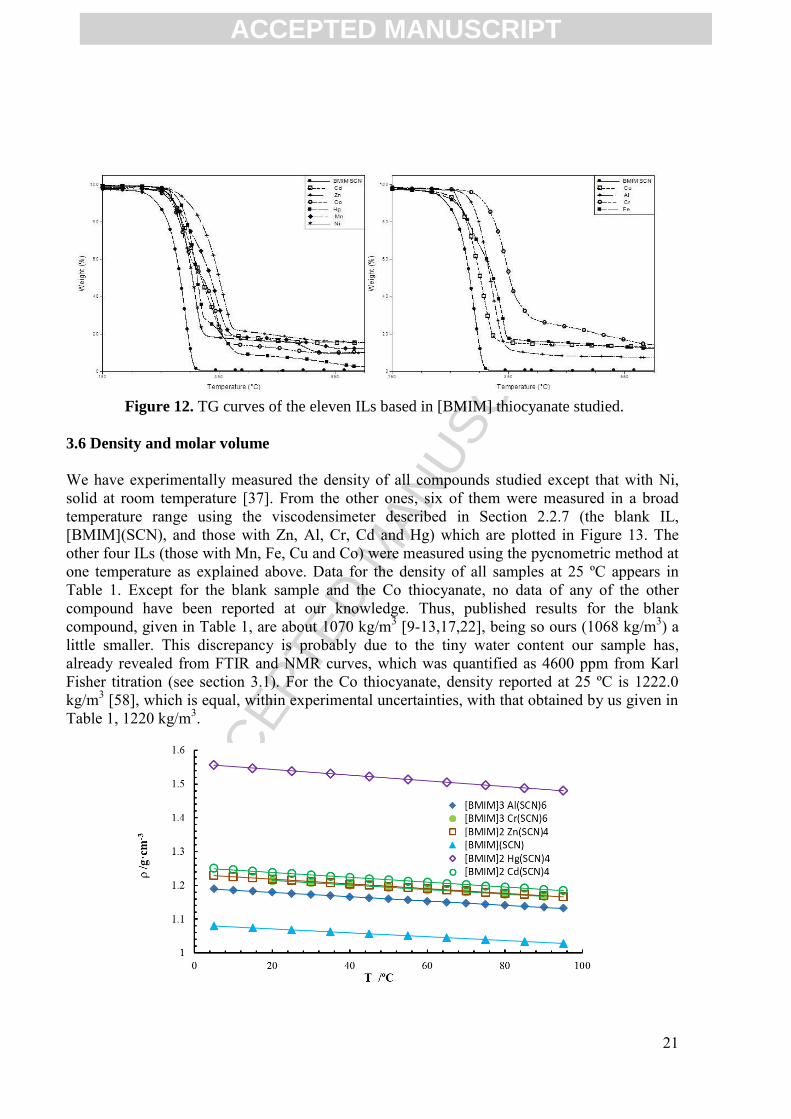
TG and DTG curves of pure IL and the ten [BMIM] thiocyanate metal ILs at 10 ºC min-1
and
under nitrogen atmosphere are plotted in Figure. 12. From these curves, the onset, Tonset, and
peak, Tpeak, temperatures were determined as it was widely described in previous works [57],
and mass loss at onset temperature and for the different heating rates are presented in Table 5.
The thermal stability of the IL slightly increases for the metal salt thiocyanates respecting the
blank sample, especially for those with Zn or Cr; whereas Co, Fe, Mn and Cd thiocyanates do
not show significant changes on thermal stability.
Additionally, important changes in residual mass at 600 ºC were observed; while pure IL lose
the total initial mass at this temperature, residual mass ranging from 8% for the [BMIM]3
Al(SCN)6 to 16 % for [BMIM]2 Zn(SCN)4 were measured for the rest of compounds. These
values seem to be related with the percentage of salt mass in the initial sample of the
compound, indicating that the loss of imidazolium and thiocyanate moieties takes place in the
selected temperature interval but the metal salts remain at the end of the experiment, except for
[BMIM]2 Hg(SCN)4 probably due to the evaporation of mercury compounds in the working
temperature interval of TGA experiments.
Table 5. Glass transition (Tg), cold crystallization (Tcc) and melting (Tm) temperatures
determined from DSC curves, and onset (Tonset) and DTG-peak (Tpeak) temperatures, weight
percentage at onset temperature (Wonset) and weight percentage remaining at 600ºC (W600ºC)
determined from TGA on the studied thiocyanate ILs.
IL Tg /ºC Tcc/ºC Tm/ºC Tonset/ºC Tpeak/ºC Wonset/% W600ºC/% [BMIM](SCN) < -75 -- -- 264 293 78 1
[BMIM]2Hg(SCN)4 -72 -- -- 289 315 86 3 [BMIM]2Zn(SCN)4 -67 -- -- 313 352 84 16 [BMIM]3Cu(SCN)4 -61 -- -- 272 308 85 13 [BMIM]2Co(SCN)4 -55 -- -- 265 289 92 10 [BMIM]4Mn(SCN)6 -55 -- -- 262 293 94 12 [BMIM]3Fe(SCN)6 -53 -- -- 256 288 91 13 [BMIM]2Cd(SCN)4 -51 -- -- 268 297 93 15 [BMIM]3Al(SCN)6 -46 -- -- 291 321 87 8 [BMIM]3Cr(SCN)6 -45 -- -- 317 347 86 14 [BMIM]4Ni(SCN)6 -- 21 62 279 309 86 10
Measured values u(Tg)= u(Tcc)= u(Tm)=1 ºC, u(Tonset)= u(Tpeak)=6 ºC and u(W)=1%
ACCEPTED MANUSCRIPT
ACC
EPTE
D M
ANU
SCR
IPT
21
Figure 12. TG curves of the eleven ILs based in [BMIM] thiocyanate studied.
3.6 Density and molar volume
We have experimentally measured the density of all compounds studied except that with Ni,
solid at room temperature [37]. From the other ones, six of them were measured in a broad
temperature range using the viscodensimeter described in Section 2.2.7 (the blank IL,
[BMIM](SCN), and those with Zn, Al, Cr, Cd and Hg) which are plotted in Figure 13. The
other four ILs (those with Mn, Fe, Cu and Co) were measured using the pycnometric method at
one temperature as explained above. Data for the density of all samples at 25 ºC appears in
Table 1. Except for the blank sample and the Co thiocyanate, no data of any of the other
compound have been reported at our knowledge. Thus, published results for the blank
compound, given in Table 1, are about 1070 kg/m3 [9-13,17,22], being so ours (1068 kg/m
3) a
little smaller. This discrepancy is probably due to the tiny water content our sample has,
already revealed from FTIR and NMR curves, which was quantified as 4600 ppm from Karl
Fisher titration (see section 3.1). For the Co thiocyanate, density reported at 25 ºC is 1222.0
kg/m3 [58], which is equal, within experimental uncertainties, with that obtained by us given in
Table 1, 1220 kg/m3.
ACCEPTED MANUSCRIPT
ACC
EPTE
D M
ANU
SCR
IPT
22
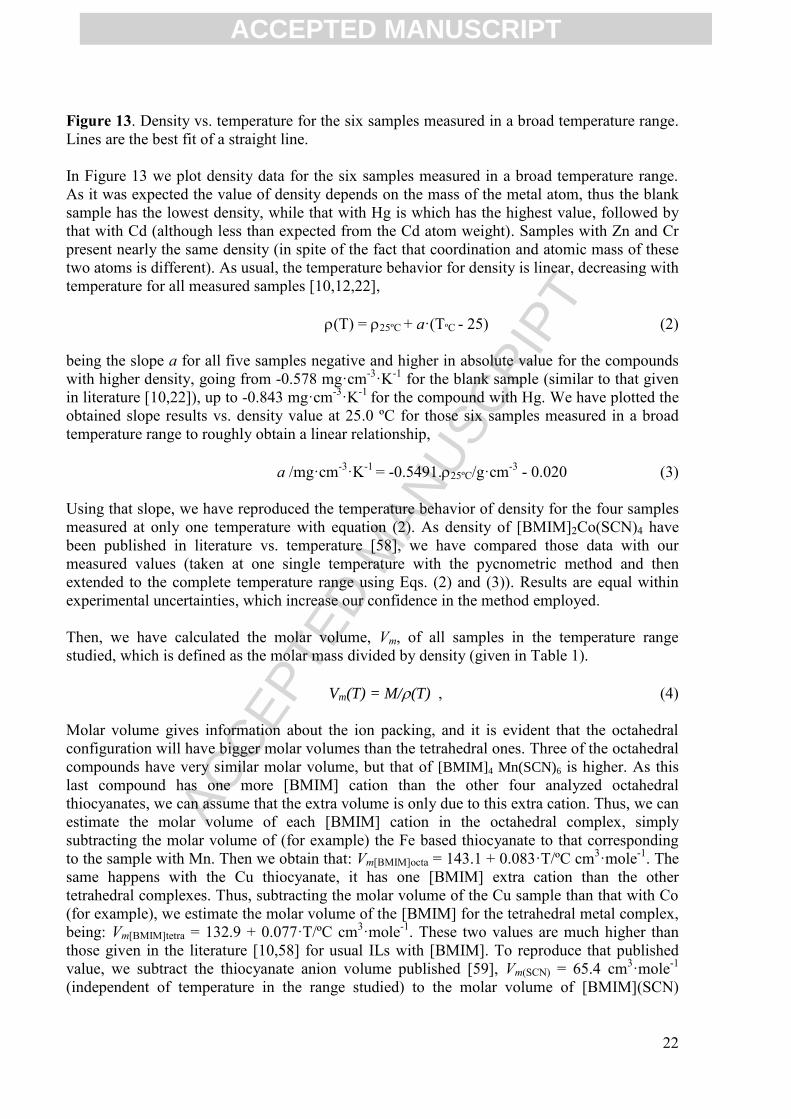
Figure 13. Density vs. temperature for the six samples measured in a broad temperature range.
Lines are the best fit of a straight line.
In Figure 13 we plot density data for the six samples measured in a broad temperature range.
As it was expected the value of density depends on the mass of the metal atom, thus the blank
sample has the lowest density, while that with Hg is which has the highest value, followed by
that with Cd (although less than expected from the Cd atom weight). Samples with Zn and Cr
present nearly the same density (in spite of the fact that coordination and atomic mass of these
two atoms is different). As usual, the temperature behavior for density is linear, decreasing with
temperature for all measured samples [10,12,22],
(T) = 25ºC + a·(TºC - 25) (2)
being the slope a for all five samples negative and higher in absolute value for the compounds
with higher density, going from -0.578 mg·cm-3
·K-1
for the blank sample (similar to that given
in literature [10,22]), up to -0.843 mg·cm-3
·K-1
for the compound with Hg. We have plotted the
obtained slope results vs. density value at 25.0 ºC for those six samples measured in a broad
temperature range to roughly obtain a linear relationship,
a /mg·cm-3
·K-1
= -0.5491.25ºC/g·cm-3
- 0.020 (3)
Using that slope, we have reproduced the temperature behavior of density for the four samples
measured at only one temperature with equation (2). As density of [BMIM]2Co(SCN)4 have
been published in literature vs. temperature [58], we have compared those data with our
measured values (taken at one single temperature with the pycnometric method and then
extended to the complete temperature range using Eqs. (2) and (3)). Results are equal within
experimental uncertainties, which increase our confidence in the method employed.
Then, we have calculated the molar volume, Vm, of all samples in the temperature range
studied, which is defined as the molar mass divided by density (given in Table 1).
Vm(T) = M/(T) , (4)
Molar volume gives information about the ion packing, and it is evident that the octahedral
configuration will have bigger molar volumes than the tetrahedral ones. Three of the octahedral
compounds have very similar molar volume, but that of [BMIM]4 Mn(SCN)6 is higher. As this
last compound has one more [BMIM] cation than the other four analyzed octahedral
thiocyanates, we can assume that the extra volume is only due to this extra cation. Thus, we can
estimate the molar volume of each [BMIM] cation in the octahedral complex, simply
subtracting the molar volume of (for example) the Fe based thiocyanate to that corresponding
to the sample with Mn. Then we obtain that: Vm[BMIM]octa = 143.1 + 0.083·T/ºC cm3·mole
-1. The
same happens with the Cu thiocyanate, it has one [BMIM] extra cation than the other
tetrahedral complexes. Thus, subtracting the molar volume of the Cu sample than that with Co
(for example), we estimate the molar volume of the [BMIM] for the tetrahedral metal complex,
being: Vm[BMIM]tetra = 132.9 + 0.077·T/ºC cm3·mole
-1. These two values are much higher than
those given in the literature [10,58] for usual ILs with [BMIM]. To reproduce that published
value, we subtract the thiocyanate anion volume published [59], Vm(SCN) = 65.4 cm3·mole
-1
(independent of temperature in the range studied) to the molar volume of [BMIM](SCN)
ACCEPTED MANUSCRIPT
ACC
EPTE
D M
ANU
SCR
IPT
23
measured, and so we obtain: Vm[BMIM]free = 116.7 + 0.103·T/ºC cm3·mole
-1, equal to the results
published before within a 1% [10,59]. These three different volumes for the same cation
indicates the influence of the ionic packing on its effective size.
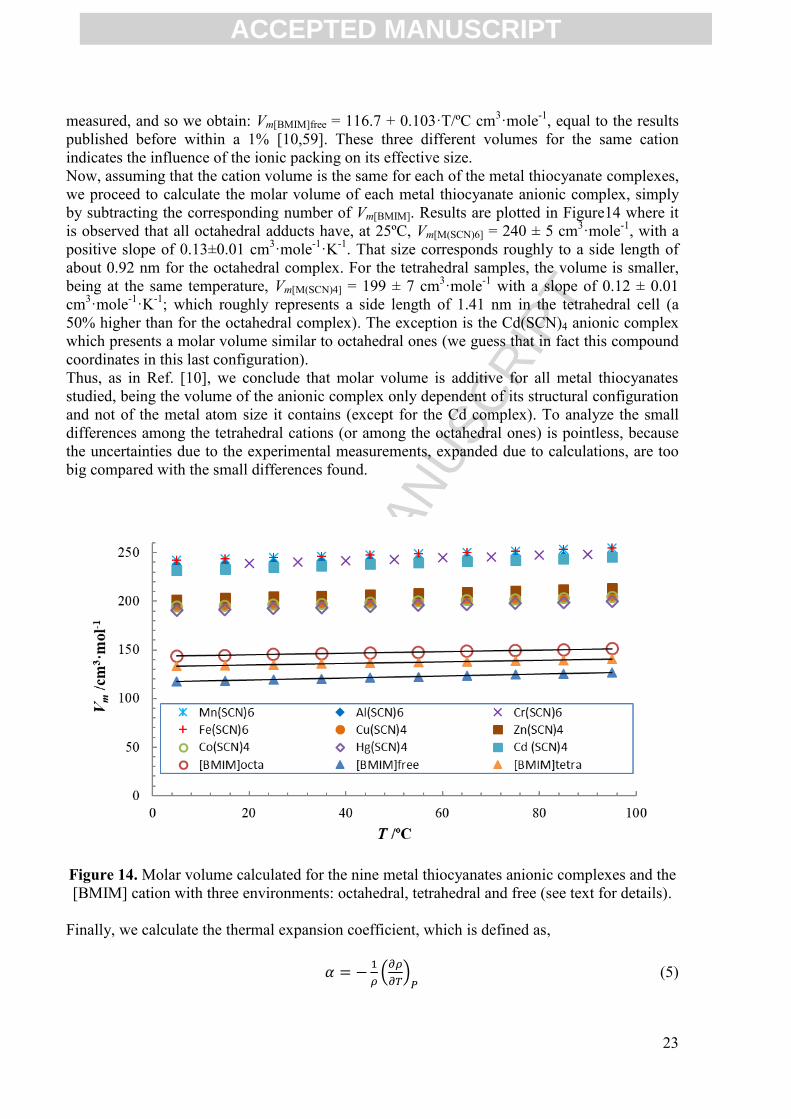
Now, assuming that the cation volume is the same for each of the metal thiocyanate complexes,
we proceed to calculate the molar volume of each metal thiocyanate anionic complex, simply
by subtracting the corresponding number of Vm[BMIM]. Results are plotted in Figure14 where it
is observed that all octahedral adducts have, at 25ºC, Vm[M(SCN)6] = 240 ± 5 cm3·mole
-1, with a
positive slope of 0.13±0.01 cm3·mole
-1·K
-1. That size corresponds roughly to a side length of
about 0.92 nm for the octahedral complex. For the tetrahedral samples, the volume is smaller,
being at the same temperature, Vm[M(SCN)4] = 199 ± 7 cm3·mole
-1 with a slope of 0.12 ± 0.01
cm3·mole
-1·K
-1; which roughly represents a side length of 1.41 nm in the tetrahedral cell (a
50% higher than for the octahedral complex). The exception is the Cd(SCN)4 anionic complex
which presents a molar volume similar to octahedral ones (we guess that in fact this compound
coordinates in this last configuration).
Thus, as in Ref. [10], we conclude that molar volume is additive for all metal thiocyanates
studied, being the volume of the anionic complex only dependent of its structural configuration
and not of the metal atom size it contains (except for the Cd complex). To analyze the small
differences among the tetrahedral cations (or among the octahedral ones) is pointless, because
the uncertainties due to the experimental measurements, expanded due to calculations, are too
big compared with the small differences found.
Figure 14. Molar volume calculated for the nine metal thiocyanates anionic complexes and the
[BMIM] cation with three environments: octahedral, tetrahedral and free (see text for details).
Finally, we calculate the thermal expansion coefficient, which is defined as,
𝛼 = −1
𝜌(
𝜕𝜌
𝜕𝑇)
𝑃 (5)
ACCEPTED MANUSCRIPT
ACC
EPTE
D M
ANU
SCR
IPT
24
So, taken into account Eq. (2) and the value of the density vs. temperature slope value given in
Eq. (3), we can obtain that the value for all our studied samples at every temperature is,
𝛼 =(0.5491·ρ25º𝐶+ 0.020)·10−3
ρ25º𝐶−10−3(0.5491·ρ25º𝐶+0.020)·(𝑇−25) (6)
Where ºC is given in g/cm3, T in ºC, and the resulting parameter will have as unities K
-1.
The calculated values for all samples studied at 25.0 ºC are given in Table 1, being the
uncertainty of the values obtained from equation (6) lower than 10-6
K-1
. As observed, values
are very similar for all compounds, being the lowest one that corresponding to the blank sample
and the highest one (6% higher than the lowest) for those compounds with Zn and Cr. It is
noteworthy that value does not depend on the complex structure type or on the size of the
metal cation. The result given in literature for [BMIM]2Co(SCN)4 [58] is equal to that obtained
by us within 1%.
4 Conclusions
We present the synthesis, microstructure and volumetric properties of ten ILs based in the 1-
butyl-3-methyl imidazolium thiocyanate doped with different metal cations. Depending on the
metal size the metal-thiocyanate configuration can be octahedral or tetrahedral. We have
characterized the obtained compound using NMR, FTIR and Raman spectroscopy, also the
magnetic behavior of those compounds were obtained. In addition, we have measured their
optical and thermal characteristics and also their volumetric properties. Chemically all metal
doped compounds are very similar, as also observed from NMR or FTIR spectroscopy, but
their optical, thermal and volumetric properties differ a lot among them. Thus, color, Vis
radiation absorption and refractive index is very dependent of the metal nature. On the other
hand, the metal doped samples (except that with Ni) presents a glass transition at a temperature
different for each compound, in general lower with the atomic size of the metal (exception is
that with Cd). Finally, the volumetric behavior is easily explained taking into account the
metal-thiocyanate complex, because all tetrahedral adducts have a similar molar volume,
smaller than that measured for octahedral ones (which are very similar among them). The only
exception is for the sample with Cd, which has a molar volume similar to the octahedral
complexes, while this compound was supposed to present a tetrahedral one.
Acknowledgements
We acknowledge comments with our colleague Dr. A. Macías. We also acknowledge the
financial support of Ministerio de Economía y Competitividad (MINECO) (MAT2014-57943-
C3-(1-3)-P and MAT2017-89239-C2-(1,2)-P); Xunta de Galicia (AGRU 2015/11, GRC
ED431C 2016/001 and ED431D 2017/06). All these research projects were partially supported
by FEDER.
References
[1] R. D. Rogers and K.R. Seddon (Eds.). Ionic Liquids, Industrial Applications to Green
Chemistry, ACS Symp. Series 818, Am. Chem. Soc., Washington, 2002.
ACCEPTED MANUSCRIPT
ACC
EPTE
D M
ANU
SCR
IPT
25
[2] M. Armand, F. Endress, D.R. MacFarlane, H. Ohno and B. Scrosati. Ionic-liquid materials
for the electrochemical challenges of the future. Nature Mat. 8 (2009) 621-629.
[3] A.F.M. Cláudio, C.F.C. Marques, I. Boal-Palheiros, M.G. Freire, J.A.P. Coutinho.
Development of back-extraction and recyclability routes for ionic-liquid-based aqueous
two-phase systems. Green Chem. 16 (2014) 259-268.
[4] M.L. Dietz. Ionic Liquids as Extraction Solvents: Where do We Stand? Separation Sci. &
Technol. 40 (2006) 2047-2063
[5] K.E. Gutowski. Industrial uses and applications of ionic liquids. Physical Sciences Reviews
3 (2018).
[6] Q. Zhang, Q. Wang, S. Zhang, X. Lu, X. Zhang. Electrodeposition in Ionic Liquids. Chem.
Phys. Chem. 17 (2016) 335-340.
[7] H. Ohno (Ed.). Electrochemical aspects of Ionic Liquids, Wiley and Sons, New Jersey,
2011.
[8] I. Otero, E.R. López, M. Reichelt, M. Villanueva, J. Salgado, J. Fernández. Ionic Liquids
Based on Phosphonium Cations as Neat Lubricants or Lubricant Additives for a
Steel/Steel Contact. ACS Applied Materials & Interfaces 6 (2014) 13115-13128.
[9] G. Vakili-Nezhaad, M. Vatani, M. Asghari, I. Ashour. Effect of temperature on the physical
properties of 1-butyl-3-methylimidazolium based ionic liquids with thiocyanate and
tetrafluoroborate anions, and 1-hexyl-3-methylimidazolium with tetrafluoroborate and
hexafluorophosphate anions. J. Chem. Thermodynamics 54 (2012) 148–154.
[10] S.A. Pandit, M.A. Rather, S.A. Bhat, G.M. Rather, M.A. Bhat. Influence of the Anion on
the Equilibrium and Transport Properties of 1-Butyl-3-methylimidazolium Based Room
Temperature Ionic Liquids. J Solution Chem. 45 (2016) 1641–1658.
[11] L. Galán-Sánchez, J. Ribé-Espel, F. Onink, G.W. Meindersma, A.B. de Haan. Density,
Viscosity, and Surface Tension of Synthesis Grade Imidazolium, Pyridinium, and
Pyrrolidinium Based Room Temperature Ionic Liquids. J. Chem. Eng. Data 54 (2009)
2803–2812.
[12] G. Gonfa, M.A. Bustam, N. Muhammad, A.S. Khan. Evaluation of Thermophysical
Properties of Functionalized Imidazolium Thiocyanate Based Ionic Liquids. Ind. Eng.
Chem. Res. 54 (2015) 12428−12437.
[13] C.M.S.S. Neves, K.A. Kurnia, J.A.P. Coutinho, I.M. Marrucho, J.N.C. Lopes, M.G. Freire,
L.P.N. Rebelo. Systematic Study of the Thermophysical Properties of Imidazolium-
Based Ionic Liquids with Cyano-Functionalized Anions. J. Phys. Chem. B 117 (2013)
10271-10283.
[14] U. Domanska, M. Laskowska, A. Pobudkowska. Phase equilibria study of the binary
systems (1-butyl-3-methylimidazolium thiocyanate ionic liquid + organic solvent or
water), J. Phys. Chem. B 113 (2009) 6397–6404.
[15] U. Domanska, M. Laskowska, Measurements of activity coefficients at infinite dilution of
aliphatic and aromatic hydrocarbons, alcohols, thiophene, tetrahydrofuran, MTBE, and
water in ionic liquid [BMIM][SCN] using GLC, J. Chem. Thermodyn. 41 (2009) 645–
650.
[16] I. Bahadur, T.M. Letcher, S. Singh, G.G. Redhi, P. Venkatesu, D. Ramjugernath. Excess
molar volumes of binary mixtures (an ionic liquid + water): A review. J. Chem.
Thermodynamics 82 (2015) 34–46.
[17] U. Domanska, M. Laskowska. Temperature and composition dependence of the density
and viscosity of binary mixtures of {1-butyl-3-methylimidazolium thiocyanate + 1-
alcohols}, J. Chem. Eng. Data 54 (2009) 2113–2119.
ACCEPTED MANUSCRIPT
ACC
EPTE
D M
ANU
SCR
IPT
26
[18] U. Domanska, M. Laskowska. Effect of temperature and composition on the density and
viscosity of binary mixtures of ionic liquid with alcohols, J. Solution Chem. 38 (2009)
779–799.
[19] U. Domanska, M. Królikowska. Density and viscosity of binary mixtures of {1-butyl-3-
methylimidazolium thiocyanate + 1-heptanol, 1-octanol, 1-nonanol, or 1-decanol}, J.
Chem. Eng. Data 55 (2010) 2994–3004.
[20] U. Domanska, M. Królikowska. Effect of temperature and composition on the surface
tension and thermodynamic properties of binary mixtures of 1-butyl3-methylimidazolium
thiocyanate with alcohols, J. Colloid Interface Sci. 348 (2010) 661–667.
[21] A. Bagheri, S.A. Mirbakhshi. Study of the surface properties and surface concentration of
ionic liquid–alcohol mixtures. Physics and Chemistry of Liquids 54 (2016) 529-541.
[22] H.F.D. Almeida, J.N. Canongia Lopes, L.P.N. Rebelo, J.A.P. Coutinho, M.G. Freire, I.M.
Marrucho. Densities and Viscosities of Mixtures of Two Ionic Liquids Containing a
Common Cation. J. Chem. Eng. Data 61 (2016) 2828–2843.
[23] U. Domanska, M. Królikowska, M. Królikowski. Phase behaviour and physicochemical
properties of the binary systems {1-ethyl-3-methylimidazolium thiocyanate or 1-ethyl-3-
methylimidazolium tosylate + water, or + an alcohol}, Fluid Phase Equilibr. 294 (2010)
72–83.
[24] L.E. Ficke, R.R. Novak, J.F. Brennecke. Thermodynamic and Thermophysical Properties
of Ionic Liquid + Water Systems. J. Chem. Eng. Data 55 (2010) 4946–4950.
[25] U. Domanska, A. Marciniak, M. Królikowska, M. Arasimowicz. Activity coefficients at
infinite dilution measurements for organic solutes and water in the ionic liquid 1-hexyl-3-
methylimidazolium thiocyanate, J. Chem. Eng. Data 55 (2010) 2532–2536.
[26] U. Domanska, M. Królikowska. Measurements of activity coefficients at infinite dilution
in solvent mixtures with thiocyanate-based ionic liquids using glc technique, J. Phys.
Chem. B 114 (2010) 8460–8466.
[27] U. Domanska, M. Królikowska, M. Arasimowicz. Phase equilibria of (1-hexyl3-
methylimidazolium thiocyanate + water, alcohol, or hydrocarbon) binary systems, J.
Chem. Eng. Data 55 (2010) 773–777.
[28] U. Domanska, M. Królikowska, K. Paduszynski. Physico-chemicalproperties and phase
behaviour of piperidinium-based ionic liquids, Fluid Phase Equilibr. 303 (2011) 1–9.
[29] U. Domanska, M. Królikowska. Measurements of activity coefficients at infinite dilution
for organic solutes and water in the ionic liquid 1-butyl-1-methylpiperidinium
thiocyanate, J. Chem. Eng. Data 56 (2011) 124–129.
[30] A. Mondal, S. Balasubramanian. A Refined All-Atom Potential for Imidazolium-Based
Room Temperature Ionic Liquids: Acetate, Dicyanamide, and Thiocyanate Anions. J.
Phys. Chem. B 119 (2015) 11041−11051.
[31] M.M. Vadiyar, S.K. Patil, S.C. Bhise, A.V. Ghule, S.-H. Han, S.S. Kolekar. Improved
Electrochemical Performance of a ZnFe2O4 Nanoflake-Based Supercapacitor Electrode
by Using Thiocyanate-Functionalized Ionic Liquid Electrolytes. Eur. J. Inorg. Chem.
(2015) 5832–5838.
[32] Z.P. Rosol, N.J. German, S.M. Gross. Solubility, ionic conductivity and viscosity of
lithium salts in room temperature ionic liquids. Green Chem. 11 (2009) 1453–1457.
[33] S.A. Dharaskar, K.L. Wasewar, M.N. Varma, D.Z. Shende. Synthesis, characterization,
and application of 1-butyl-3-methylimidazolium thiocyanate for extractive
desulfurization of liquid fuel. Environ Sci. Pollut. Res. 23 (2016) 9284–9294.
[34] S.J. Osborne, S. Wellens, C. Ward, S. Felton, R.M. Bowman, K. Binnemans, M. Swadźba-
Kwaśny, H.Q.N. Gunaratnea, P. Nockemann. Thermochromism and switchable
ACCEPTED MANUSCRIPT
ACC
EPTE
D M
ANU
SCR
IPT
27
paramagnetism of cobalt(II) in thiocyanate ionic liquids. Dalton Trans. 44 (2015) 11286–
11289.
[35] Be. May, M. Honle, B. Heller, F. Greco, R. Bhuin, H.-P. Steinruck, F. Maier. Surface-
Induced Changes in the Thermochromic Transformation of an Ionic Liquid Cobalt
Thiocyanate Complex. J. Phys. Chem. Lett. 8 (2017) 1137−1141.
[36] Z. Wang, L. Wang, Y. Zhang, J. Guo, H. Li, F. Yan. Dye-sensitized solar cells based on
cobalt containing room temperature ionic liquid redox shuttles. RSC Adv. 7 (2017)
13689–13695.
[37] E. López Lago, J.A. Seijas, I. de Pedro, J. Rodríguez Fernández, M.P. Vázquez-Tato, J.A.
Gonzalez, E. Rilo, L.M. Segade, O. Cabeza, C.D. Rodríguez Fernández, Y. Arosa, B.
Algnamat, L.M. Varela , J. Troncoso , R. de la Fuente. Structural and physical properties
of a new reversible and continuous thermochromic ionic liquid in a wide temperature
interval: [BMIM]4Ni(SCN)6. New J. of Chemistry. 42 (2018) 15561-15571.
[38] A.D. Santo, H. Pérez, G.A. Echeverría, O.E. Piro, R.A. Iglesias, R.E. Carbonio, A.B.
Altabet, D.M. Gil. Exploring weak intermolecular interactions in thiocyanate-bonded
Zn(II) and Cd(II) complexes with methylimidazole: crystal structures, Hirshfeld surface
analysis and luminiscence properties. RSC Adv. 8 (2018) 23891-23902.
[39] A.E. Phillips, A.L. Goodwin, G.J. Halder, P.D. Southon, C.J. Kepert. Nanoporosity and
Exceptional Negative Thermal Expansion in Single-Network Cadmium Cyanide. Angew.
Chem. Int. Ed. 47 (2008) 1396 –1399.
[40] A.L. Goodwin, M. Calleja, M.J. Conterio, M.T. Dove, J.S.O. Evans, D.A. Keen, L. Peters,
M.G. Tucker. Colossal Positive and Negative Thermal Expansion in the Framework
Material Ag3[Co(CN)6]. Science 319 (2008) 794-797.
[41] T. Peppel, M. Koeckerling, M. Geppert-Rybczynska, R.V. Ralys, J.K. Lehmann, S.P.
Verevkin, A. Heintz. Low-viscosity paramagnetic ionic liquids with doubly charged
[Co(SCN)4]2- ions. Angew. Chem., Int. Ed. 49 (2010) 7116–7119.
[42] R.D. Shannon. Revised Effective Ionic Radii and Systematic Studies of Interatomic
Distances in Halides and Chalcogenides. Acta Cryst. A 32 (1976) 751–767.
[43] Y. Arosa, C.D. Rodríguez-Fernández, E. López-Lago, A. Amigo, L.M. Varela, O. Cabeza,
R. de la Fuente. Refractive index measurement of imidazolium based ionic liquids in the
Vis-NIR. Optical Materials 73 (2017) 647-667.
[44] M. Kabešova, J. Gažo. Structure and classification of thiocyanates and the mutual
influence of their ligands. Chem. Zvesti 34 (1980) 800-841.
[45] O. Hofft, S. Bahr, V. Kempter. Investigations with Infrared Spectroscopy on Films of the
Ionic Liquid [EMIM]Tf2N. Langmuir 24 (2008) 11562-11566.
[46] B. Stuart. Infrared spectroscopy: Fundamentals and applications. J. Wiley & Sons, Ltd.
Chichester, 2004.
[47] V.V. Matveev, A. Ievlev, M.A. Vovk, O. Cabeza, J. Salgado-Carballo, J.J. Parajó, J.R.
Rodríguez, R. de la Fuente, E. Lähderanta, L.M. Varela. NMR investigation of the
structure and single-particle dynamics of inorganic salt solutions in a protic ionic liquid.
J. Mol. Liq. (2018). Accepted for publication.
[48] X. Wang, D. Xu, X. Cheng, J. Huang. Preparation and characterization of Hg(N2H4CS)4
Zn(SCN)4. Journal of Crystal Growth 271 (2004) 120-127.
[49] P.-O. Kinell, B. Strandberg, Infrared and Raman spectra of some systems Containing
thiocyanate groups. Acta Chemica Scandinavica 13 (1959) 1607-1622.
[50] A. Sabatini, I. Bertini. Infrared Spectra between 100 and 2500 cm-1
of Some Complex
Metal Cyanates, Thiocyanates, and Selenocyanate. Inorganic Chemistry 4 (1965) 959-
961.
ACCEPTED MANUSCRIPT
ACC
EPTE
D M
ANU
SCR
IPT
28
[51] J.A. Novoa-López, H. Michinel, E. López-Lago. Optical Properties of Ionic Liquids, in
Ionic Liquids in Separation Technology. Ed. A. Pérez de los Ríos and F.J. Hernández-
Fernández. Elsevier, 2014.
[52] R. Boca. A Handbook of Magnetochemical Formulae; Elsevier, 2012.
[53] S. Hayashi; H.-O. Hamaguchi. Discovery of a Magnetic Ionic Liquid [BMIM]FeCl4.
Chemistry Letters 33 (2004) 1590-1591.
[54] I. de Pedro, D.P. Rojas, J. Albo, P. Luis, A. Irabien, J.A. Blanco, J. Rodriguez Fernandez.
Long-range magnetic ordering in magnetic ionic liquid: Emim[FeCl4]. Journal of
Physics-Condensed Matter 22 (2010) 296006.
[55] I. de Pedro, O. Fabelo, A. García-Saiz, O. Vallcorba, J. Junquera, J.A. Blanco, J.C.
Waerenborgh, D. Andreica, A. Wildes, M.T. Fernández-Díaz, J. Rodríguez Fernández.
Dynamically slow solid-to-solid phase transition induced by thermal treatment of
DimimFeCl4 magnetic ionic liquid. Physical Chemistry Chemical Physics 18 (2016)
21881-21892.
[56] A.D.R. Macfarlane, M. Kar, J.M. Pringle. Physical and thermal properties, in
Fundaments of Ionic Liquids From Chemistry to Applications. Wiley and Sons, 2017: pp.
103–142.
[57] M. Villanueva, J.J. Parajó, P.B. Sánchez, J. García, J. Salgado, Liquid range temperature
of ionic liquids as potential working fluids for absorption heat pumps, J. Chem.
Thermodyn. 91 (2015) 127–135.
[58] M. Geppert-Rybczynska, J.K. Lehmann, T. Peppel, M. Kockerling, A. Heintz. Studies of
Physicochemical and Thermodynamic Properties of the Paramagnetic 1-Alkyl-3-
methylimidazolium Ionic Liquids (EMIm)2[Co(SCN)4] and ([BMIM])2[Co(SCN)4]. J.
Chem. Eng. Data 55 (2010) 5534-5538.
[59] W. Guan, X.X. Ma, L. Long, J. Tong, D.W. Fang, J.Z., Yang. Ionic parachor and its
application in acetic acid ionic liquid homologue 1-alkyl-3-methylimidazolium acetate
{[C(n)mim][OAc](n = 2,3,4,5,6)}. J. Phys. Chem B 115 (2011) 12915–12920.
ACCEPTED MANUSCRIPT
ACC
EPTE
D M
ANU
SCR
IPT
29
Highlights:
We present a new family of metal thiocyanate ionic liquids [BMIM]n-zM+z
(SCN)n, with
n being 4 or 6.
Metal cations used where: Al+3
, Mn+2
, Fe+3
, Cr+3
, Ni+2
, Hg+2
, Zn+2
, Co+2
, Cd+2
and Cu+;
and also a blank one: [BMIM](SCN).
Obtained products have been characterized by NMR, MS-ES, FT-IR and Raman
spectroscopy.
In addition, magnetic, optical and thermal characterization were performed on the
samples.
Volumetry shows that molar volume does not depend on the metal nature, but on the
kind of metal-thiocyanate complex.
ACCEPTED MANUSCRIPT