author's accepted manuscript uncertainty evaluation in radon concentra- tion measurement using...
TRANSCRIPT

Author's Accepted Manuscript
Uncertainty evaluation in radon concentra-tion measurement using charcoal canister
G. Pantelić, M.Eremić Savković, M. Živanović, J.Nikolić, M. Rajačić, D. Todorović
PII: S0969-8043(13)00432-6DOI: http://dx.doi.org/10.1016/j.apradiso.2013.11.012Reference: ARI6395
To appear in: Applied Radiation and Isotopes
Received date: 1 April 2013Accepted date: 2 November 2013
Cite this article as: G. Pantelić, M.Eremić Savković, M. Živanović, J. Nikolić, M.Rajačić, D. Todorović, Uncertainty evaluation in radon concentration measure-ment using charcoal canister, Applied Radiation and Isotopes, http://dx.doi.org/10.1016/j.apradiso.2013.11.012
This is a PDF file of an unedited manuscript that has been accepted forpublication. As a service to our customers we are providing this early version ofthe manuscript. The manuscript will undergo copyediting, typesetting, andreview of the resulting galley proof before it is published in its final citable form.Please note that during the production process errors may be discovered whichcould affect the content, and all legal disclaimers that apply to the journalpertain.
www.elsevier.com/locate/apradiso

Uncertainty evaluation in radon concentration measurement using charcoal canister
G. Panteli�a,*, M. Eremi� Savkovi�b, M. Živanovi�a, J. Nikoli�a, M. Raja�i�a, D. Todorovi�a
aUniversity of Belgrade, Vin�a Institute of Nuclear Sciences, Mike Petrovi�a Alasa 12-14,
11001 Belgrade, Serbia
bSerbian Institute of Occupational Health "Dr Dragomir Karajovi�", Deligradska 29, 11001
Belgrade, Serbia
Abstract
Active charcoal detectors are used for testing the concentration of radon in dwellings. The
method of measurement is based on radon adsorption on coal and measurement of gamma
radiation of radon daughters. The contributions to the final measurement uncertainty are
identi�ed, based on the equation for radon activity concentration calculation. Different
methods for setting the region of interest for gamma spectrometry of canisters were discussed
and evaluated. The obtained radon activity concentration and uncertainties do not depend on
peak area determination method.
Keywords
Radon; charcoal; gamma-ray spectrometry; uncertainty
*Corresponding author. E-mail address: [email protected] (G. Panteli�)

1. Introduction
Radon levels in houses and in workplaces have been investigated and monitored worldwide
very extensively in the last four decades. The charcoal canister method of radon concentration
estimation is the most widely used method of screening (Eremi�-Savkovi� et al., 2002; Manic
et al., 2006; Tondeur et al., 2011; Yu et al., 1992). This method is sufficiently precise and
shows significant correlation with results from etch track detectors (Cortina et al., 2008).
Almost all published data for radon concentration obtained by charcoal canister measurement
are without measurement uncertainty. The influence of counting statistics as a major part of
the uncertainty was indicated in Zhukovsky et al., (2010) and the total uncertainty of radon
concentration measurements conducted by a single charcoal canister was estimated to be
between 25-35 % (k=2). Many factors can influence the combined uncertainty of radon
measurements. One example is the influence of exposure conditions (Ronca-Battista and
Gray, 1988).
In this paper we identify all the contributions to the total measurement uncertainty.
An integral part of the charcoal canister method is the gamma spectrometry of canisters. We
show that spectral region of interest (ROI) in gamma spectrometry does not influence the
measurement uncertainty.
2. Material and methods
Active charcoal detectors are used for radon concentration screening in dwellings in
accordance with the US EPA protocol 520/5-87-005 (Grey and Windham, 1987).
The measurement method is based on radon adsorption on charcoal and measurement of
gamma radiation of radon daughters (214Pb and 214Bi). It is based on the high affinity of
activated charcoal for several gases and vapors, one of which is 222Rn. Activated charcoal is
used to construct passive radon charcoal canisters in the following way: a metal can is filled

with low-activity activated charcoal. A metal grid, with 30-50% of the total area in holes, is
placed over the charcoal. The can is closed with a padded metal lid, and adhesive vinyl tape is
used to seal the canister.
The canister is exposed by removing the metal lid. The exposure should last no less than 48
hours. During the exposure, radon is adsorbed to and desorbed from the activated charcoal,
and it also undergoes radioactive decay. After the exposure, the canister is re-sealed by
replacing the metal lid and vinyl tape. Measurements are then made of the radon progeny by
gamma spectrometry, with the canisters being placed centrally on the face of the detector.
Three gamma energies are used, 295 keV and 352 keV (energies of 214Pb photons) and 609
keV (energy of 214Bi photon). It is necessary to wait at least 3 hours between sealing the
canister and measurement, in order to attain radioactive equilibrium.
Before every exposure, canisters are prepared by heating open canisters four hours at 1100 C.
During the drying, adsorbed water vapor, radon and its progeny, as well as other adsorbed
species, are desorbed. After the drying, canisters are sealed and are ready for the next
exposure.
3. Calculation of radon concentration
Carbon filters were opened and exposed in closed rooms for between 3-6 days and are placed
at distance of at least 1 m from the floor and walls. At the end of exposure and after achieving
equilibrium between radon and its daughters (at least 3 hours after exposure), the
measurements were carried out using NaI or HPGe detectors. Radon concentration ARn is
calculated using the equation:
fffRn DCEt
BGA���
��
(1)
where:
G = gross counts of 3 full energy peaks (295 keV, 352 keV, 609 keV);

B = gross counts of the same areas of the background spectrum;
t = measurement time (30 minutes);
Ef =detector efficiency;
Cf = calibration factor for radon adsorption rate;
Df =decay factor from the midpoint of exposure to the time of counting.
The detector efficiency was determined using a standard canister with the same geometry and
matrix as the canisters used for measurements. Standard canister contains a known activity of
226Ra. Background canister is a regular radon measurement canister, which has never been
exposed. Detectors were calibrated by 226Ra of known activity in the same geometry (Radium
nitrate uniformly distributed in charcoal, Isotope Products Laboratories, Los Angeles, USA).
Typical 226Ra spectra obtained with a standard canister are shown on figures 1-2.
The gross count will depend on the selection of Region of Interest (ROI). In this paper, three
different methods for ROI selection are used, and the results obtained by different methods
are compared:
1) ROI covers the whole spectral area between 289 keV and 615 keV for HP Ge detector
(ORTEC) (Fig.1.a) and the whole spectral area between 270 keV and 720 keV for NaI (Fig.
2.a). These ROIs include the three peaks of interest;
2) ROI is divided into three parts, where each part represents, respectively, one of the three
peaks of interest; peak area is selected by the user (Figs. 1.b and 2.b);
3) ROI is divided into three parts, where each part, respectively, represents one of the three
peaks of interest marked automatically by the software, Canberra – Genie 2K or ORTEC-
Gamma Vision 32 (Fig. 1.c).
The Ortec and Canberra spectra and window settings are very similar. For the NaI spectrum
the same method was used but, because of the poorer resolution, the peak areas selected by
the user were 270-318 keV, 320-415 keV, 510-720 keV.

Methods 2 and 3 require a modification of equation (1). While the net peak area can be
calculated simply as G-B when there is only one ROI, in case of three separate ROIs, a slight
modification is required. This modification is presented by equation (2):
)(� ���i
ii BGBG (2)
where Gi represents the gross area of the ith peak in the measured spectrum and Bi is the gross
area in the background spectrum for the same channel as Gi.
The emission probabilities for the photons in the ROIs do not enter into the calculations
because of the way in which the detector efficiency calibration is performed.
Due to all the processes that take place during and after exposure of canisters, the gamma
photon count rate is not a linear function of the exposure time of the canister. The correction
is introduced through correction factor Cf, by multiplying initial calibration factor Cf0 with
appropriate “adjustment factor”, Af. Canisters are therefore calibrated by using radon
calibration chambers (chambers with known radon concentrations and with controlled
environmental conditions) for defined exposure periods (Grey and Windham, 1987).
Adjustment factor is empirically determined for a number of humidities (20 %, 50 %, 80 %)
and exposure times (from 24 h to 144 h) and the exact value for each case is determined by
interpolation. The original manual (Grey and Windham, 1987) contained information for the
calibration of charcoal canisters in a chamber where the air was relatively stagnant. Later an
addendum (EERF, 1989) was added to the manual containing calibration and adjustment
factors for canisters in an active air environment, which more closely resembles a residential
environment. The final calibration factor (radon adsorption rate) Cf includes dependence on
humidity and time of exposure and can be read from the original tables and graphs in EERF,
1989.
4. Uncertainty calculations

The contributions to the combined measurement uncertainty are identi�ed, based on the
equation (1) for radon activity concentration calculation and guide to the expression of
uncertainty in measurement (ISO, 1995). The components which were considered were
uncertainties of: counting statistics, efficiency, canister weighing, calibration factor for radon
adsorption rate, which includes uncertainty of adjustment factor, decay factor, exposure time
and measurement time. Each of these components contribute to the measurement
uncertainty, and it was necessary to evaluate their magnitude.
Uncertainty of radon concentration is calculated using following equation:
� � � �� �
2222
2
222
��
���
���
�
���
���
�
���
���
�� �
��
������
���
�
f
f
f
f
f
f
Rn
Rn
DD
CC
EE
tt
BGBG
AA (3)
where �X represents uncertainty of quantity X. If three separate peaks are used instead, the
equation becomes:
� � � � � � � � � � � �� �
2222
2321321
23
22
21
23
22
21
2
��
���
���
�
���
���
�
���
���
�� �
������
��������������
���
�
f
f
f
f
f
f
Rn
Rn
DD
CC
EE
tt
BBBGGGBBBGGG
AA
(4)
Uncertainties of measurement time and decay factor are neglected, because they are below 0.1
%. Relative uncertainty of detector efficiency and calibration factor for radon adsorption rate
are estimated to be 2 % and 5.8 % respectively. Uncertainties of peak areas �Gi and �Bi are
equal to the square root of appropriate peak area.
5. Results
The canisters were exposed in schools and dwellings. Gamma spectrometry measurements
were performed on three different detectors, and different ROI settings were used. Typical
results obtained by Ortec HPGe detector and Gamma Vision 32 software, results obtained by
Canberra HPGe detector and Genie 2K software and results obtained by NaI detector and
Gamma Vision 32 software are presented in Table 1. The combined uncertainty presented in
table 1 is the expanded uncertainty with coverage factor of k =2.
A typical set of measurement results (for 5th entry for OGe in Table 1) is given in Table 2. A
typical uncertainty budget is shown in Table 3.
6. Discussion
Results presented in Table 1 clearly show that the results obtained by equation (1) do not
depend on ROI settings, as long as the detector efficiency calibration is done the same way.
Only the first component of the equations (3) and (4) depend on ROI settings and counting
statistics. Because of poor counting statistics the uncertainties are higher at low radon
concentrations for all ROI settings, detectors and software packages. At the higher radon
concentrations the contribution of the peak area uncertainties are small. In these cases, the
radon concentration uncertainty depends only on detector efficiency uncertainty and
calibration factor for radon adsorption rate uncertainty and become the same for all ROI
settings.
7. Conclusion
In this paper, all the quantities that contribute to the combined measurement uncertainty in
charcoal canister method for radon concentration screening were identified. Different methods
for setting the region of interest for gamma spectrometry of canisters were discussed and
evaluated. It was shown that the three methods that were used for ROI settings do not
influence the results for radon concentration and appropriate combined measurement
uncertainty. Because of that we recommend to use method with one continuous ROI which is
less sensitive to gamma spectrometry system instabilities, manifested by energy calibration
shifts.

References
EERF, 1989. Addendum to EERF Standard Operating Procedures for Rn-222 Measurement
Using Charcoal Canisters.
Cortina, D., Durán, I., Llerena, J.J., 2008. Measurements of indoor radon concentrations in the
Santiago de Compostela area. J. Environm. Radioactivity 99, 1583-1588.
Eremi�-Savkovi�, M., Panteli�, G., Tanaskovi�, I., Vuleti�, V., Javorina, Lj., 2002.
Concentration of radon in apartments on the territory of Belgrade in period 1997-2001.
Archives of toxicology, kinetics and xenobiotic metabolism 10, No. 1-2, 195-197.
Grey, D.J., Windham, S.T., 1987. EERF Standard Operating Procedures for Radon-222
Measurement Using Charcoal Canisters. EPA 520/5-87-005.
ISO, 1995. Guide to the expression of uncertainty in measurement. International
Organization for Standardization, Geneva, Switzerland, ISBN 92-67-10188-9.
Manic, G., Petrovic, S., Manic, V., Popovic, D., Todorovic, D., 2006. Radon concentrations in
a spa in Serbia. Environment International 32, 533-537.
Ronca-Battista, M., Gray, D., 1988. The influence of changing exposure conditions on
measurements of radon concentrations with the charcoal adsorption technique. Radiat. Prot.
Dosim. 24, 361-365.
Tondeur, F., Ródenas, J., Querol, A., Ortiz, J., Juste, B., 2011. Indoor radon measurements in
the city of Valencia. Appl. Radiat. Isot. 69, 1131-1133.
Yu, K.N., Young, E.C.M., Stokes, M.J., Luo, D.L., Zhang, C.X., 1992. Indoor radon and
environmental gamma radiation in Hong Kong. Radiat. Prot. Dosim. 40, 259-263.

Zhukovsky, M.Onischenko, A., Bastrikov, V., 2010. Radon measurements – discussion of
error estimates for selected methods. Appl. Radiat. Isot. 68, 816-820.

Figure captions:
Figure 1
Spectrum of 226Ra measured with Ortec HPGe detector. Range of interest: a) the total sum of
counts in all channels between 289 keV and 615 keV; b) peak area selected by the user; c)
peak area selected automatically by the software (GammaVision 32).
Figure 2
Spectrum of 226Ra measured with NaI detector. Range of interest: a) the total sum of counts in
all channels between 270 keV and 720 keV; b) peak area selected by the user (270-318 keV,
320-415 keV, 510-720 keV).

Table 1
Radon concentrations in schools and dwellings in Belgrade, measured with Ortec HPGe
detector (OGe), Canbera HPGe (CGe) and NaI. Calculation was performed with: a) the total
sum of counts in all channels between 289 keV and 615 keV (for OGe and CGe) and all
channels between 270 keV and 720 keV for NaI; b) peak area selected by the user; c) peak
area selected automatically by the software . Uncertainties are stated at coverage factor of
k=2.
Method (a) Method (b) Method (c)
Det. Radon Combined Radon Combined Radon Combined concentration uncertainty concentration uncertainty concentration uncertainty
(Bq/m3) (%) (Bq/m3) (%) (Bq/m3) (%)
(OGe) 19 (26) 23 (21) 21 (21) 25 (24) 26 (20) 25 (19) 58 (17) 53 (17) 55 (16) 61 (15) 60 (15) 61 (15) 129 (14) 124 (14) 122 (14) 210 (12) 204 (13) 204 (13) 598 (12) 599 (12) 601 (12) 850 (12) 855 (12) 856 (12) 1197 (12) 1219 (12) 1205 (12) 1655 (12) 1670 (12) 1676 (12)
(CGe) 21 (24) 21 (20) 23 (17) 24 (20) 24 (19) 24 (17) 51 (14) 51 (15) 51 (14) 99 (13) 99 (16) 97 (15) 144 (14) 153 (14) 150 (14) 170 (13) 169 (13) 168 (13) 366 (12) 367 (12) 368 (12) 445 (12) 446 (12) 448 (12) 519 (12) 526 (12) 524 (12) 792 (12) 802 (12) 799 (12) (NaI) 21 (24) 23 (22) - - 36 (18) 39 (18) - - 56 (16) 60 (15) - - 129 (13) 135 (13) - - 183 (12) 183 (12) - - 243 (12) 253 (12) - - 327 (12) 333 (12) - - 415 (12) 419 (12) - - 623 (12) 633 (12) - - 966 (12) 979 (12) - -
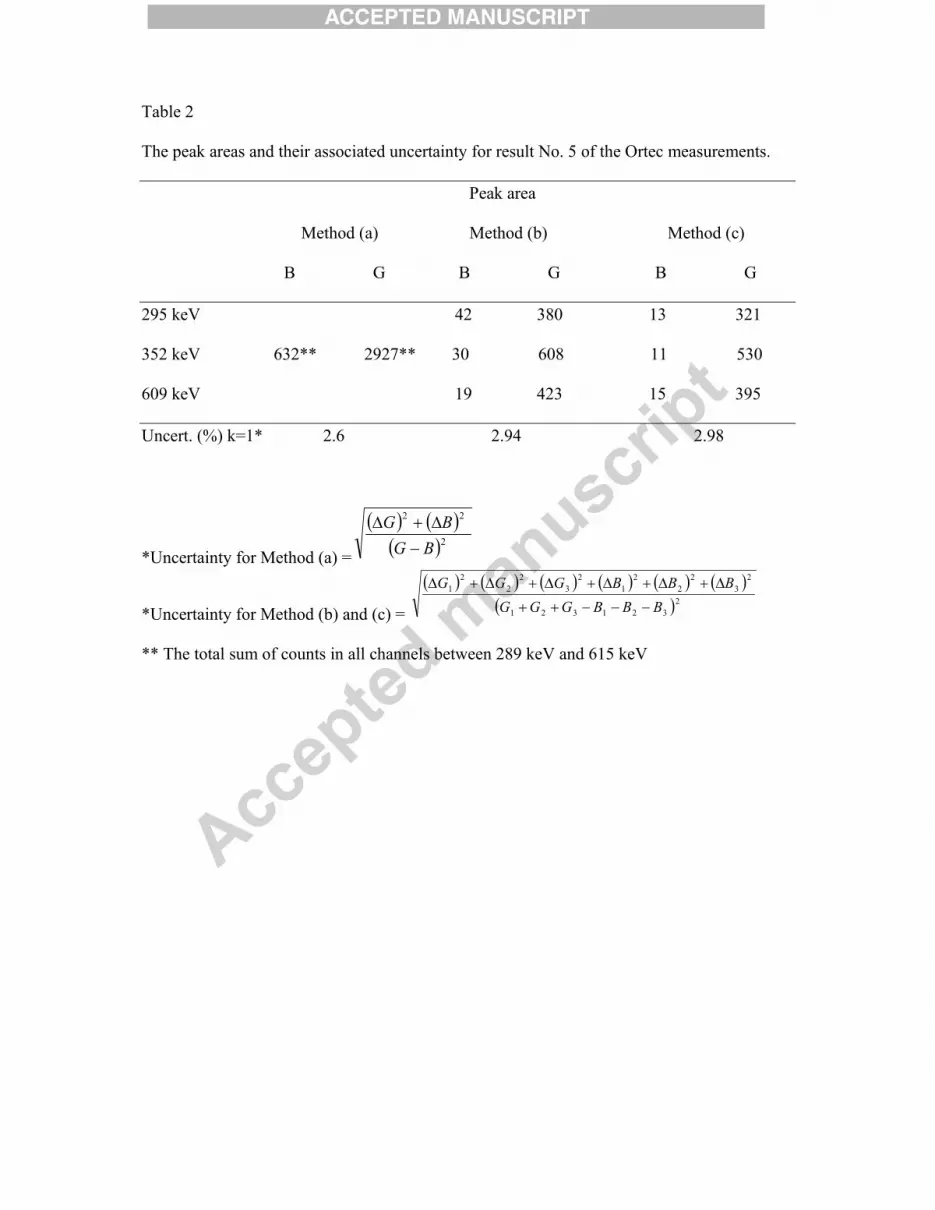
Table 2
The peak areas and their associated uncertainty for result No. 5 of the Ortec measurements. Peak area Method (a) Method (b) Method (c)
B G B G B G
295 keV 42 380 13 321
352 keV 632** 2927** 30 608 11 530
609 keV 19 423 15 395
Uncert. (%) k=1* 2.6 2.94 2.98
*Uncertainty for Method (a) =
� � � �� �2
22
BGBG
����
*Uncertainty for Method (b) and (c) =
� � � � � � � � � � � �� �2
321321
23
22
21
23
22
21
BBBGGGBBBGGG
�����
�����������
** The total sum of counts in all channels between 289 keV and 615 keV

Table 3
A typical uncertainty budget for the result No. 5 of the Ortec measurements. Symbol Quantity Type Probability Relative Standard
distribution Uncertainty (%) Method (a) Method (b) Method (c)
Gi - Bi Net counts A Normal 2.6 3* 3* T Time B Rectangular < 0.1 < 0.1 < 0.1 Ef Efficiency B Normal 2 2 2 Cf Calibration factor B Normal 5.8 5.8 5.8 Df Decay factor B Normal < 0.1 < 0.1 < 0.1 Combined standard uncertainty (k = 1) 6.7 6.8 6.8 (k = 2) 14 14 14 *uncertainty from all Gi and Bi

� Measurement uncertainty budget for radon activity concentration established. � Three different methods for ROI selection are used and compared. � Recommend to use one continuous ROI, less sensitive to gamma spectrometry
system instabilities.

Figure 1
a)
b)
c)
Figure

Figure 2
a)
b)