accepted manuscript - core
TRANSCRIPT

Accepted Manuscript
A finite element based approach for fatigue life prediction ofheaded shear studs
Md. Manik Mia, Anjan K. Bhowmick
PII: S2352-0124(19)30001-3DOI: https://doi.org/10.1016/j.istruc.2019.01.001Reference: ISTRUC 379
To appear in: Structures
Received date: 6 September 2018Revised date: 27 December 2018Accepted date: 3 January 2019
Please cite this article as: Md. Manik Mia, Anjan K. Bhowmick , A finite element basedapproach for fatigue life prediction of headed shear studs. Istruc (2019), https://doi.org/10.1016/j.istruc.2019.01.001
This is a PDF file of an unedited manuscript that has been accepted for publication. Asa service to our customers we are providing this early version of the manuscript. Themanuscript will undergo copyediting, typesetting, and review of the resulting proof beforeit is published in its final form. Please note that during the production process errors maybe discovered which could affect the content, and all legal disclaimers that apply to thejournal pertain.
ACCEP
TED M
ANUSC
RIPT
1
A finite element based approach for fatigue life prediction of headed shear studs
Md. Manik Mia and Anjan K. Bhowmick
Department of Building, Civil and Environmental Engineering, Concordia University,
Montreal, Quebec, Canada
Abstract: Steel shear studs in bridges are subjected to rapidly fluctuating stresses causing
fatigue failure. Research on fatigue of shear studs mainly focused on tests. Both AASHTO
and Canadian design curve for fatigue resistance of shear studs are based on the tests
conducted in the mid 1960’s by Slutter and Fisher. This paper presents a finite element
based approach using push-out specimen for fatigue life estimation of headed shear stud
connectors. Both crack initiation and crack propagation life are estimated and an excellent
correlation is found when compared against test results. In addition, since a significant
amount of push-out tests data on headed shear studs are now available, this paper evaluates
the fatigue design curves of different standards, with special focus given to evaluation of
the value of constant amplitude fatigue limit (CAFL) given in the current AASHTO and
Canadian code (CSA S6-14). The regression analysis also shows that the current fatigue
curves in different codes can be used for shear studs as large as 31.8 mm. Thus, restriction
of use of studs larger than 25 mm (1 inch) in different bridge codes (CSA S6, Eurocode 4,
and AASHTO) can be waived.
Keywords: Fatigue-life; crack initiation life; crack propagation life; push-out test; shear
stud
ACCEPTED MANUSCRIPT

ACCEP
TED M
ANUSC
RIPT
2
1. Introduction
Headed shear studs are used worldwide in steel-concrete composite bridges and these shear
connectors are welded on top of steel beam. Their primary purpose is to prevent horizontal
movement and separation between steel beam and concrete slab, which allows them to act
as one unit. One of the major drawbacks of headed shear stud connectors is that it is very
sensitive to fatigue and care must be taken if used in fatigue prone sites. Repeated or
fluctuating stress can initiate micro-cracks in materials which may propagate with the
continued application of cyclic stress. This process is known as fatigue. In bridges, fatigue
failure can be dangerous since it occurs suddenly without significant prior deformations.
Thus, the fatigue resistance of shear studs in composite beams is important for the safe of
whole structure and needs to be well investigated.
Bridge Design Codes (CSA S6-14 [1]; ASSHTO 2014 [2]; Eurocode 4 [3]) provide design
guidelines for headed shear stud to meet both ultimate limit state (ULS) and fatigue limit
state (FLS). In all the codes, to satisfy fatigue requirements at the FLS, designers will have
to keep the stress levels below an empirically determined threshold for a given number of
load cycles. Previous edition of CSA S6 (CSA S6-06 [4]) had exactly same equations as
AASHTO for design of headed shear studs subjected to fatigue loading. These equations
were based on fitting a curve through the push-out test data of Slutter and Fisher [5]. The
test performed by Slutter and Fisher [5] in Leigh University is considered as one of the
major works in fatigue problems of shear studs in steel-concrete composite beam. Slutter
and Fisher [5] tested 44 samples containing 19 mm and 22 mm studs under constant
amplitude stress cycles ranging from 55 MPa to 138 MPa and it was reported that stress
ACCEPTED MANUSCRIPT

ACCEP
TED M
ANUSC
RIPT
3
range rather than maximum stress is the important factor for fatigue life of shear studs. The
effect of minimum stress was found to be significant only in case of stress reversals.
Most of the research on shear stud focussed mainly on medium and small diameter studs.
Thus, design codes have restrictions for selection of shear studs. In CSA S6-14, the use of
studs with a diameter greater than 25 mm (1 inch) is not permitted. AASHTO does not
recommend use of shear stud diameter larger than 1¼". According to Eurocode 4, shear
stud should have diameter between 16 mm and 25 mm and the tensile strength of the stud
should be less than 500 MPa. Yet, often it becomes necessary to use shear studs with large
diameter and higher strength in construction. Another important consideration in design of
shear studs is the strength of the concrete deck. Current fatigue equations in design codes
are based on push-out tests of shear studs embedded in light weight and normal weight
concrete. Shear studs now-a-days are widely used in composite girder bridges with high
performance and ultra-high performance concrete decks with strengths significantly
exceeding those of normal weight concrete. Thus, applicability of code equations and
design curves for fatigue design of larger shear studs and fatigue design of studs embedded
in high strength concrete needs to be studied. Fatigue resistance of shear stud is best
determined through testing, which is very expensive and time consuming. It is often
impractical, and sometimes impossible, to test full size structural components. Thus,
analytical prediction models are often required as an alternative mean. A detailed finite
element model of push out test has been developed using general purpose finite element
software ABAQUS [6]. The FE model included both geometric and material nonlinearities.
Using the developed model, a FE based approach for fatigue life estimation is proposed
ACCEPTED MANUSCRIPT

ACCEP
TED M
ANUSC
RIPT
4
using push-out specimen. A parametric study is then conducted using the validated FE
model to investigate effects of different parameters, such as stud spacing and concrete
compressive strength, on fatigue life of shear studs.
As stated earlier, the AASHTO design curve for fatigue resistance is based on the research
conducted in the mid 1960’s by Slutter and Fisher. However, a significant amount of push-
out tests have been conducted to investigate the fatigue resistance of shear connectors since
1960’s. Lee et al. [7] experimentally investigated the fatigue property of large diameter
shear studs subjected to low cycle fatigue load. They pointed out that the fatigue strength
of large studs was a little lower than that of normal studs. Mundie [8] performed twelve
push-out tests and reported significant underestimation in fatigue life of shear studs by
AASHTO. With large amount of push-out test data available fatigue design curves
available in different bridge standards can be evaluated. This is done in this paper by
conducting a regression analysis of available push-out test data. One important difference
in fatigue design of shear stud between Eurocode and the North American bridge codes is
that unlike European counterpart, where no constant amplitude fatigue limit (CAFL) is
recommended, North American bridge codes recommend a CAFL value of 48 MPa.
Constant amplitude fatigue limit/threshold is the stress range below which there will not
be any fatigue failure and the stud is assumed to have an infinite fatigue life. In reality,
however, the stresses a bridge experience over its design life are variable in amplitude. In
both S6-14 and AASHTO, to ensure an infinite fatigue life for shear stud, the constant
amplitude threshold is divided by 2 to obtain variable amplitude fatigue limit stress range.
Assessment of the CAFL value provided in AASHTO and CSA S6 requires close
ACCEPTED MANUSCRIPT

ACCEP
TED M
ANUSC
RIPT
5
examination of test data of push-out specimens subjected to stress amplitude near the
CAFL value. This paper also evaluates the constant amplitude fatigue limit (CAFL) given
in current AASHTO and Canadian code.
2. Fatigue life prediction techniques
There are two basic approaches that are used to calculate total number of cycles a
component can sustain before failure: use of Δσ – N curves and fracture mechanics
approach. In this paper, fracture mechanics approach is used to predict total fatigue life. In
fracture mechanics approach, there are three stages of crack growth: crack initiation stage,
stable crack propagation stage and unstable crack propagation stage. The total fatigue life
is the sum of crack initiation and crack propagation life. Crack initiation life is calculated
using empirical correlation approach and stable crack propagation life is calculated using
linear elastic fracture mechanics (LEFM) approach The strain-based method by Smith et
al. [9], Eq. (1), is used in this study for calculating fatigue crack initiation life.
∆𝜀
2=
(𝜎′𝑓)2
𝜎𝑚𝑎𝑥𝐸 (𝑁𝑖𝑛𝑖𝑡 )
2𝑏 + 𝜎′𝑓 𝜀′𝑓
𝜎𝑚𝑎𝑥 (𝑁𝑖𝑛𝑖𝑡)𝑏+𝑐 (1)
where ∆𝜀
2 is the strain range, 𝜎𝑚𝑎𝑥 is the maximum local stress accounting for plasticity, E
is the modulus of elasticity, 𝜎′𝑓 is fatigue strength coefficient, 𝜀′𝑓 is fatigue ductility
coefficient, b and c are fatigue strength exponent and fatigue ductility exponent,
respectively and Ninit is the crack initiation life. The crack initiation life parameters are
obtained from the research work of Josi and Grondin [10]. Once the crack is initiated, it
starts to propagate with the subsequent load cycles. In this stage, crack front grows more
and more until failure occurs. According to Paris [11], the logarithm of crack growth rate,
ACCEPTED MANUSCRIPT

ACCEP
TED M
ANUSC
RIPT
6
𝑑𝑎/𝑑𝑁 is proportional to logarithm of stress intensity factor range, ∆𝐾 and can be
expressed as:
𝑑𝑎/𝑑𝑁 = 𝐶 (∆𝐾)𝑚 (2)
where C and m are material constants. It has been observed that crack does not propagate
if stress intensity factor is less than a certain value known as threshold stress intensity factor
range, ∆𝐾𝑡ℎ. Following equation has been used in this paper to estimate crack propagation
life:
𝑁𝑝𝑟𝑜𝑝 = ∫𝑑𝑎
𝐶 (∆𝐾 𝑚−∆𝐾𝑡ℎ𝑚 )
𝑎𝑓
𝑎𝑜 (3)
where 𝑎𝑜 and 𝑎𝑓 are the initial and final crack sizes respectively. As per guidelines of
ASTM standard [12], ∆K can be taken as ∆𝐾 = 𝐾𝑚𝑎𝑥 if only tension portion of stress
cycles are considered. From the research work of Fisher et al. [13] and Ibrahim et al. [14],
it has been found that initial crack size is the most important factor in crack propagation
life and final crack size is less significant. Ellyin [15] pointed out the restrictions to use
LEFM approach in case of very small initial crack size and Chen et al. [16] suggested 1 to
5 mm as initial crack size. In this study, initial crack size of 1.0 mm was used and it gave
an excellent correlation with test results.
3. Nonlinear finite element model of push-out test
A detailed nonlinear finite element model has been developed for simulating push-out test.
The push-out specimen similar to those of Lee et al. [7] test was used in this study for
fatigue life investigation and the essential components of push-out specimen were modeled
with the help of general purpose finite element software ABAQUS [6].
3.1 Model geometry
ACCEPTED MANUSCRIPT

ACCEP
TED M
ANUSC
RIPT
7
For the detailed FE model, all the components of push-out specimen such as concrete slab,
steel beam, shear stud and rebar were modeled. The thickness of steel beam and concrete
slab were 14 mm and 200 mm respectively. Fig 1(a) presents the geometry of the push-out
test by Lee et al. [7]. Due to the symmetry of push-out specimen, a quarter of the whole
model shown in Fig. 1(b) was used. The headed shear stud is the most key element in push-
out specimen. Two shear studs of 25 mm and 27 mm diameter were selected with weld
collar height of 7 mm.
3.2 Contact and interaction
In order to simulate proper test condition, it is very important to use proper constraint
between different parts of the push-out specimen in FE analysis. The nodes of the concrete
slab and steel beam around the studs were constrained to the surfaces of shear studs by
using tie constraint. In Abaqus, it is necessary to define master and slave surfaces. Shear
studs were selected as master surface and concrete slab as slave. Surface-to-surface contact
procedure was used in Abaqus/Explicit with normal behavior (“Hard” contact) and
tangential behavior (“frictionless” formulation). A frictionless interaction was used
between steel beam and concrete slab. Figure 2 shows the surfaces used for tie constraint
definition. For this study, a displacement controlled procedure was followed. Downward
displacement was applied to the top surface of the steel beam denoted as “Load surface” in
Fig. 3. MPC constraint was used between load surface and the control point to ensure
uniform distribution of load/displacement. ABAQUS allows to apply load on a surface
uniformly through MPC constraint by connecting all the nodes lying on that surface to the
constraint control point.
3.3 Boundary condition
ACCEPTED MANUSCRIPT

ACCEP
TED M
ANUSC
RIPT
8
Boundary conditions are very important for the simulation of experimental program and
any inappropriate boundary conditions may cause completely different and wrong results.
As shown in Fig. 4, X-axis symmetric boundary condition (BC) was applied to surface 1
and all the nodes lying in surface-1 were restricted from moving in the X direction and
rotation about Y and Z axis were also restrained. The Z-axis symmetric BC was applied to
the middle of the steel beam web and all the nodes in the middle of the steel beam web,
designated as surface 2, were restrained in Z direction, as well as rotation about X and Y
axis were also restrained. At the bottom surface of concrete slab, all translational and
rotational movements were restrained.
3.4 FE mesh
To obtain accurate results from finite element analysis of the detailed model, three-
dimensional solid element (hexahedral) was used to model the push-out components
provided they are not distorted. Solid elements can be used for both linear and complex
non-linear simulations involving contact, plasticity and large deformations. For concrete
slab, steel beam and headed shear studs, three-dimensional eight-node element (C3D8R)
was selected and T3D2 truss element with linear approximation of displacement was used
for rebar. T3D2 element has two nodes and three translational degrees of freedom. Figure
5 presents FE meshes for the concrete slab, steel beam and shear stud with weld collar. A
mesh convergence study was conducted to select the appropriate mesh size for the push-
out model of Gattesco and Giuriani [17]. It was observed that the difference in results
(test/predicted) for each shear stud was less than 1% when overall mesh size increased from
ACCEPTED MANUSCRIPT
ACCEP
TED M
ANUSC
RIPT
9
10 mm to 25 mm. Thus, to reduce the computation time, 25 mm mesh size was selected in
this study.
3.5 Material properties
In this paper, the uniaxial stress-strain curve of concrete used in Eurocode, as shown in Fig.
6, was used with slight modifications. There are three parts in this stress-strain curve; in
first part, stress increases linearly up to 0.4 f 'c. The young’s modulus is calculated based
on the formula of CSA A23.3-14 [18]:
𝐸𝑐𝑜𝑛𝑐𝑟𝑒𝑡𝑒 = 4500√ f 'c (4)
where f 'c and 𝐸𝑐𝑜𝑛𝑐𝑟𝑒𝑡𝑒 are cylindrical compressive strength and modulus of concrete
respectively. The second part of the curve is an ascending part up to 0.9 f 'c and the peak
stress was used as 0.9 f 'c, as suggested in CSA A23.3-14 [18]. The strain (εc1) related to
0.9 f 'c was taken as 0.0022 and Poisson’s ratio of 0.2 was used for concrete. The third part
of the curve is a descending part up to r f 'c , where the value of r is the reduction factor
taken from the study of Ellobody et al. [19]. The ultimate strain (αεc1) of concrete was used
as 0.0035, as suggested by CSA A23.3-14 [18]. For concrete in tension, the tensile stress
is assumed to increase linearly until crack forms and 𝑓𝑡 is calculated based on CSA A23.3-
14 [18]:
𝑓𝑡 = 0.6√ f 'c (5)
where 𝑓𝑡 and f 'c are in MPa. Finally, 𝑓𝑡, tensile stress decreases linearly to zero. The strain
(βεt) at zero tensile stress was taken as 0.005. Concrete damaged plasticity model available
in ABAQUS was used in the definition of concrete material in FE model. In order to
represent the inelastic behavior of concrete, yielding parts of the stress-strain curve of
ACCEPTED MANUSCRIPT
ACCEP
TED M
ANUSC
RIPT
10
concrete are used separately in this material model for compression and tension. Concrete
damaged plasticity model assumes a non-associated potential plastic flow, and Drucker-
Prager hyperbolic function was used in this study. The dilation angle was taken as 20⁰ .
The ratio of biaxial compressive strength to uniaxial compressive strength and eccentricity
were taken as 1.16 and 0.10, respectively as suggested in ABAQUS.
For both structural and reinforcement steel, bi-linear stress-strain relationships were
assumed representing a simple elastic-plastic model. Poisson’s ratio was taken as 0.3 for
structural and reinforcement steel material. The material properties used in the tests of Lee
et al. [7] for structural and reinforcement steel and headed studs were used in the FE
analysis.
The nonlinear plastic behavior of shear stud is introduced in FE model using a multi-
linear isotropic hardening model and Ramberg-Osgood parameters, k' and n', as shown
below:
ε = σ
E + (
σ
k′)n′ (6)
The value of K' and n' were obtained from the structural engineering report of Josi and
Grondin [10] and were 727 MPa and 0.15 respectively.
3.6 Validation of finite element model
Lee et al. [7] performed push-out tests on three stud diameters of 25, 27 and 30 mm to
investigate experimentally static and fatigue behavior of large shear stud connectors. For
each diameter of shear stud, three static tests were conducted. Finite element analyses of
ACCEPTED MANUSCRIPT

ACCEP
TED M
ANUSC
RIPT
11
these nine specimens were conducted. Details of the validation of static strength of shear
stud using FE analysis are presented elsewhere [20]. Table 1 compares the static strengths
from push-out tests of Lee et al. [7] with the FE analysis results. A good agreement of both
static strength and ultimate slip are found. It is important to note that since three tests were
performed for each diameter, the average value was used for comparison purpose. Figure
7 shows that for different stud diameters, the static strength obtained from tests are very
close to that obtained from FE analyses.
In addition to Lee et al. [7] test, results from push-out test of Gattesco and Giuriani [17]
were compared with results from FE analysis. In their tests, compressive cube strength of
concrete (fcu) was used as 32.5 MPa and compressive cylinder strength of concrete was
assumed as 26 MPa (0.8 fcu). Also, the shear stud diameter for the test was 19 mm. Details
of the push-out test of Gattesco and Giuriani [17] are presented elsewhere [20]. Figure 8
presents the finite element model validation of the push-out test of Gattesco and Giuriani
[17]. Load versus relative displacement curve from the test was compared with results from
FE analysis. The ultimate slip value was reported as 9.7 mm in the test of Gattesco and
Giuriani [17], while from FE analysis, it was found as 9.61 mm. The slip at which the load
was reduced by 10% from its peak was used as ultimate slip in the developed FE model.
The developed FE push-out model was also validated, as shown in Fig. 9, with test results
of Loh et al. [21] for 19 mm shear stud. A good correlation of both capacity of shear stud
and ultimate slip was observed.
ACCEPTED MANUSCRIPT

ACCEP
TED M
ANUSC
RIPT
12
Using the developed finite element model and the proposed approach for fatigue life
estimation of headed shear stud connector discussed in the following sections 4.1 and 4.2
fatigue life is estimated for headed shear studs.
4. Prediction of fatigue life
4.1 Crack initiation life
Lee et al. [7] tested 12 specimens for fatigue life investigation on three different diameters:
25, 27 and 30 mm. In this study, five specimens of 25 mm diameter, three specimens of 27
mm and three specimens of 30 mm shear studs were taken and an approach for fatigue life
prediction of shear stud using push-out specimen has been proposed. The stress range and
concrete strength collected from test of Lee et al. [7] are shown in the following Table 2.
ABAQUS dynamic explicit formulation was adopted for the analysis in this study.
ABAQUS explicit formulation has previously been applied in many problems such as crack
and failure of concrete material. Dynamic explicit is a time control method since the global
mass and stiffness matrices need not be formed and inverted resulting relatively
inexpensive increment compared to implicit analysis. It is important to note here that crack
was not explicitly modeled in the FE model. Rather, it was assumed that crack will generate
in highly stressed area. The location of highly stressed area was identified from FE analysis.
In the first time step, the model was fully loaded to maximum load. The load was then
reduced to minimum load in the second time step, and finally it was reloaded to maximum
load again in time step 3. After time step 2 and 3, the nominal strains and stress were
ACCEPTED MANUSCRIPT

ACCEP
TED M
ANUSC
RIPT
13
recorded from the output file. Lee et al. [7] pointed out the critical location of push-out
specimen as the base of the weld collar, which was also observed in FE analysis, shown in
Fig.10. Once strain range and maximum stress at critical location were obtained, crack
initiation life (𝑁𝑖𝑛𝑖𝑡 ) was calculated using Eq. (1).
4.2 Crack propagation life
According to the proposed FE based approach, total fatigue life was calculated as
summation of crack initiation life and crack propagation life.
Total fatigue life = crack initiation life (𝑁𝑖𝑛𝑖𝑡 ) + crack propagation life (𝑁𝑝𝑟𝑜𝑝 )
Crack propagation life was obtained by integrating Eq. (3) between the limits of initial
crack size and final crack size. As started earlier in section 2, for this study, initial crack
size of 1 mm was used, and it gave an excellent correlation with test results. For crack
propagation life, it is very important to identify the fatigue failure modes. Figure 11 shows
the two common fatigue failure modes, Mode A, in which crack initiates at the top of the
weld collar and then propagates along the stud-weld interface; in Mode B, crack initiates
at the base of the weld collar and propagates until it reaches to the base of the weld collar
again through the joist material. In the test of Lee et al. [7], Mode B was reported. Assuming
Mode B fatigue failure mode governs final crack size was assumed as weld base diameter.
It was pointed out by Josi and Grondin [10] that final crack size has very less effect on the
crack propagation life (𝑁𝑝𝑟𝑜𝑝 ).
For prediction of crack propagation life, another important parameter is stress intensity
factor which is used in fracture mechanics to predict the stress state near the tip of a crack.
ACCEPTED MANUSCRIPT
ACCEP
TED M
ANUSC
RIPT
14
The stress intensity factor, 𝐾 , used in Eq. (3), was calculated using the following formula
from the research work of Josi and Grondin [10]:
𝐾 = βE βS βW βG σ √(𝜋𝑎) (7)
where βE, βS, βG, βW are correction factors for elliptical crack front, free surface, geometrical
discontinuity and finite width respectively. σ is the reference stress in the uncracked
condition and 𝑎 is the half-crack length. The crack shape and stress gradient correction
factors were determined using the research work of Ibrahim et al. [14]:
βE = 1
𝐸𝐾 (8)
where 𝐸𝐾 = complete elliptical integral of the second kind, and is given by:
𝐸𝐾 = [ 1 + 1.464 (𝑎
𝑏)
1.65
]0.5
(9)
where 𝑎 and b are the minor and major semi diameters of an elliptical crack, assuming an
elliptical crack shape, respectively. Free surface correction factor, βS was taken 1.12 as
suggested by Broek [22]. The finite thickness correction factor, βW was determined with
the following relationship [22]:
𝛽𝑤 = √1
cos (𝜋𝑎
𝑊) (10)
βG was determined using the following formula used by Ibrahim et al. [14]:
βG = 𝑆𝐶𝐹
1+0.88𝑎0.576 (11)
where 𝑆𝐶𝐹 is the stress concentration factor. In the research work of Josi and Grondin [10],
SCF was taken as 1.0 considering nominal stress, σ at the center of the initial flaw or crack.
This assumption was also applied in the present work. The relationship between the two
semi-axes of the elliptical crack, 𝑎 and b proposed by Fisher et al. [13] was employed:
𝑏 = 1.088 𝑎0.946 (12)
ACCEPTED MANUSCRIPT

ACCEP
TED M
ANUSC
RIPT
15
where 𝑎 and b are in inches. After getting 𝐾, crack propagation life was calculated using
Eq. (3).
The fatigue life of the eleven specimens of Lee et al. [7] obtained from FE analyses using
the above-mentioned procedure are given below in Table 3. The mean test to predicted
(FEA) fatigue life, as shown in Table 3, is 0.996 and the coefficient of variation is 0.41. It
is observed from Table 3 that for most of the specimens the proposed FEA based method
predicts the fatigue life of headed shear stud reasonably well. For few cases, for specimens
FT25A3, FT25B3, and FT30A3, fatigue life from the FEA based approach did not provide
very good correlation with test results. This may be due to many factors, such as variability
in surface roughness, variability in specimen geometry, weld imperfections, any initial
flaws that might cause stress concentrations etc., that affect stresses in shear studs. As an
example, FT25A2 and FT25A3 have same geometry and same concrete strength, but stress
range applied during the test for FT25A3 specimen is higher (170 MPa) in comparison to
FT25A2 (150 MPa). Thus, fatigue life for shear stud specimen FT25A3 should be lower
than FT25A2. However, this was not the case in the test and a significant higher fatigue
life was reported for the FT25A3 specimen. Since no variability and imperfections were
measured for the test specimens, it was not possible to account them in the finite element
analysis.
5. Parametric study
With the proposed FE based approach for fatigue life estimation a brief parametric study
was conducted to investigate effect of different parameters on fatigue life of shear stud.
ACCEPTED MANUSCRIPT

ACCEP
TED M
ANUSC
RIPT
16
Effects of two parameters, stud spacing and concrete compressive strength, on fatigue life
of headed shear stud were studied.
5.1 Effect of stud spacing on fatigue life
To investigate the effect of stud spacing on fatigue life, three different shear stud spacings
(200 mm, 250 mm, and 300 mm) were considered. In Table 4, FT25A2 and FT25A3 have
same concrete compressive strength of 30 MPa and FT25B1 has concrete compressive
strength of 40 MPa. In the FE analysis, concrete slab was kept constant (200 mm) for all
three specimens. As expected, shown in Table 4, a decrease in the fatigue life was observed
with the increase of stud spacing for all fatigue specimens. Figure. 12 shows the variation
of fatigue life with the change of stud spacing for fatigue specimen FT25A2.
5.2 Effect of concrete strength on fatigue life of shear stud
From the push-out test of Slutter and Fisher [5] the strength of concrete was found to have
minor effects on fatigue life of shear stud. The mean compressive strength of all cylinders
was around 30 MPa in their test. Now-a-days, concrete strengths higher than 30 MPa are
used in steel-concrete composite bridges. Thus, another parameter, concrete compressive
strength was taken to investigate its effects on fatigue life. Five different concrete
cylindrical compressive strengths (25, 30, 35, 40 and 45 MPa) were chosen. Results from
FE analyses are shown in Table 5 and Fig. 13. It can be observed that an increase in
concrete strength leads to an increase in fatigue life.
6. Evaluation of code provisions for fatigue design of shear stud
ACCEPTED MANUSCRIPT

ACCEP
TED M
ANUSC
RIPT
17
Bridge Design Codes (CSA S6, 2014; ASSHTO 2014, Eurocode 4) provide guidelines for
fatigue design of headed shear studs. This section briefly reviews the fatigue design
provisions of shear studs in ASSHTO (2014), Eurocode 4, and CHBDC.
6.1 AASHTO fatigue design provisions
The fatigue design provisions described in the current AASHTO LRFD Bridge Design
Specifications (AASHTO 2014) are based on fitting a curve through the test data of Slutter
and Fisher [5]. In addition, a constant stress amplitude fatigue limit (CAFL) of 24.2 MPa
is provided. AASHTO provides the following equation in terms of the shear force range,
rZ :
22 19ddZr (13)
where Nlog5.29238 ; d stud diameter and N number of fatigue cycles.
Equation (13) can be rearranged as
𝑆𝑟 =4
𝜋(238 − 29.5 log 𝑁) ≥ 24.2 MPa (14)
Thus, fatigue design curve for stud shear connectors in the AASHTO (2014) is a straight
line on a semi-log (Sr -log N) scale.
6.2 Eurocode 4 fatigue design provisions
For welded shear studs used with normal weight concrete, the fatigue curve in Eurocode 4
is given as:
(∆𝜏𝑅)𝑚𝑁𝑅 = (∆𝜏𝑐)𝑚𝑁𝑐 (15)
ACCEPTED MANUSCRIPT
ACCEP
TED M
ANUSC
RIPT
18
where ∆𝜏𝑅= fatigue shear strength related to the cross-sectional area of the shank of the
stud, 𝑚 = slope of the fatigue strength curve and equal to 8.0, ∆𝜏𝑐= 90 MPa at a reference
value of 𝑁𝑐= 2x10⁶ cycles, 𝑁𝑅= number of stress-range cycles
Equation (15) can be rearranged in the following log-log equation:
log 𝑁 = 21.93 − 8 log 𝑆𝑟 (16)
Unlike AASHTO, Eurocode 4 does not provide a constant amplitude fatigue limit (CAFL)
for shear stud.
6.3 CSA S6-14 fatigue design provisions
Previous edition of CSA S6 (CSA S6-06) had exactly same equations as AASHTO for
design of headed shear studs subjected to fatigue loading. These equations were based on
pushout test data of Slutter and Fisher [5]. Based on the regression analysis of a large
amount of pushout test results by Zhang (2007) changes were made in the fatigue
provisions of shear stud in the current edition of CSA S6-14. The current Canadian
highway bridge design code (CHBDC), CSA S6-14 adopted a log-log relation between
stress range and fatigue life and was approximated by current fatigue category D curve.
The detail Category D also has the same constant amplitude fatigue limit (CAFL) of 48
MPa, used in earlier version of S6 (S6-06). This has been retained in the current S6-14.
According to current CSA S6-14, shear studs shall be designed to satisfy:
𝜏𝑠𝑟 ≤ 𝐹𝑠𝑟𝐷 (17)
where 𝜏𝑠𝑟is the stress range obtained from analysis; 𝐹𝑠𝑟𝐷 is fatigue stress range resistance
for Category D, as determined by the following equations.
ACCEPTED MANUSCRIPT
ACCEP
TED M
ANUSC
RIPT
19
𝐹𝑠𝑟𝐷 = (
𝛾
𝑁𝑐)
1 3⁄
(18)
When 𝐹𝑠𝑟 < 𝐹𝑠𝑟𝑡, 𝐹𝑠𝑟𝐷 = (
𝛾′
𝑁𝑐)
1 5⁄
≥𝐹𝑠𝑟𝑡
2 (19)
where 𝛾, 𝛾′ are fatigue life constants pertaining to the fatigue detail category D; 𝑁𝑐 is
specified number of design stress cycles.
The reason for using a fatigue curve with two slopes is an approximate way to take into
account the progressive reduction of the CAFL because of the damage caused by the stress
ranges higher than CAFL. Fracture mechanics also confirms this reduction of the slope of
the S-N curve in the high cycle fatigue region.
6.4 Regression analysis of pushout test data
An analysis of the log of stress range (Sr, MPa) and log of fatigue life (N) obtained from
push-out tests presented in literature (Lehman et al. [23]; Slutter and Fisher [5]; Mainstone
and Menzies [24]; Hallam [25]; Roderick and Ansorian [26]; Lo [27]; Oehlers and Foley
[28]; Maeda and Matsui [29]; Naithani et al. [30]; Oehlers [31]; Faust et al. [32]; Bode et
al. [33]; Shim et al. [34]; Badie et al. [35]; Lee et al. [7]; Ahn et al. [36]; Hanswille et al.
[37]; Mundie [8]) was conducted to evaluate the current fatigue curves in bridge codes. In
total, 344 push-out test results were used in the regression analysis. The mean regression
line for push-out tests data is represented in the form of:
log 𝑁 = 𝑚 ∙ log 𝑆𝑟 + log 𝑎 (20)
ACCEPTED MANUSCRIPT

ACCEP
TED M
ANUSC
RIPT
20
It is common practice to take the design equation as the mean minus two standard
deviations, which can be expressed as:
log 𝑁 = 𝑚 ∙ log 𝑆𝑟 + log 𝑎 − 2𝜎 (21)
where 𝜎 is the standard deviation = √∑ (𝑝𝑟𝑒𝑑𝑖𝑐𝑡𝑒𝑑−𝑚𝑒𝑎𝑠𝑢𝑟𝑒𝑑)2𝑛
𝑖=1
𝑛−2
𝑚 and 𝑎 are regression constants, representing the slope and intercept of the regression
line; 𝑛 is the number of test data points.
Results from regression analysis of all the pushout test data are shown in Table 6. The
linear log-log design curve was obtained by shifting the mean regression line by 2 times
the standard deviation. Figure 14 presents the regression lines for the selected pushout tests.
Both mean and the design (mean-2σ), regression lines are presented. The regression lines
were constrained to have a slope 3.0. This is because the slope constant 3 has been a best
fit for a large number of different structural details tested in fatigue. The regression lines
were also compared against the current Canadian fatigue category design curves. It is
observed that the design regression line lies above the design curve for fatigue Category
E1. The mean regression line closely matches with current Canadian fatigue curve for
fatigue category D. The linear log-log mean regression curve is in good agreement with the
previous Canadian fatigue curve in the infinite life region, when the number of cycles is
more than approximately 1 million.
Results from regression analysis were also compared, as shown in Fig. 15, with the fatigue
design curves in different codes. Since the AASHTO/CSA S6-06 fatigue design curve for
shear stud curve is semi-log, the fatigue design stress range decreases more rapidly in the
ACCEPTED MANUSCRIPT
ACCEP
TED M
ANUSC
RIPT
21
high cycle fatigue region (when the number of cycles is more than 1 million). In
comparison to Eurocode, AASHTO/ CSA S6-06 fatigue design curve for shear stud is
always conservative.
Badie et al. [35] and Mundie [8] conducted pushout tests with shear stud diameters of 22.2
mm and 31.8 mm. A comparison of the mean regression line of fatigue test results of
31.8 mm diameter studs (25 push-out test data) with 22 mm diameter studs (23 push-out
test data) indicates, as shown in Fig. 16, that there is no significant difference of fatigue
resistance between the two diameters.
6.5 Evaluation of CAFL for headed shear stud
Unlike Eurocode, both AASHTO and Canadian Highway Bridge design code (CHBDC),
CSA S6-14 have included a constant amplitude fatigue limit of 48 MPa for shear stud
which often governs the stud fatigue design for bridges with moderate-to-high traffic
demands. However, no reference has been cited to justify this CAFL value. In this section,
available fatigue test results near the existing CSA/AASHTO CAFL will be reviewed to
evaluate the CAFL value for shear stud. In general, the highest stress range at which a
runout (non-failure) occurs can be considered as the constant amplitude fatigue threshold.
In this study, push-out fatigue tests performed at applied stress levels ranging in values
from 30 MPa to 100 MPa and declared as runouts are considered. Both double sided and
single sided pushout test results with 3/4 inch and 7/8 inch shear studs are considered. In
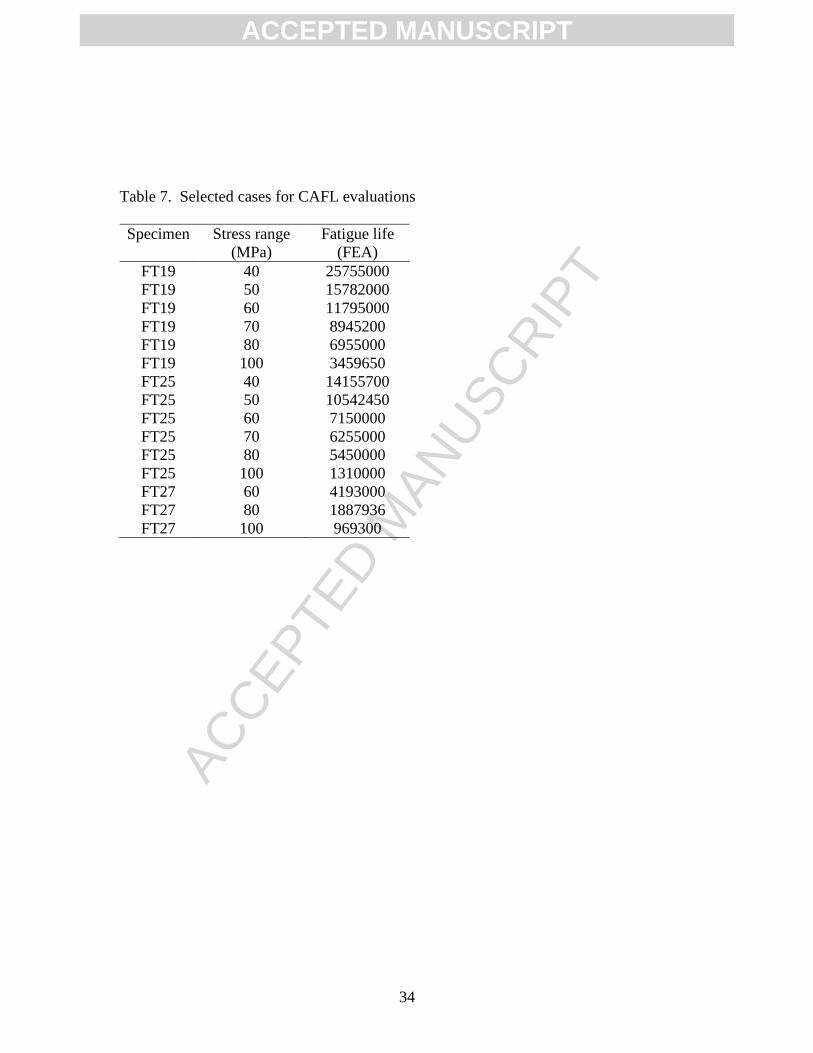
addition, the FE based approach proposed in this paper is used to analyses fifteen (15) more
cases where the push-out specimens were subjected to stress ranges between 40 MPa and
ACCEPTED MANUSCRIPT
ACCEP
TED M
ANUSC
RIPT
22
100 MPa. Three different stud diameters (19 mm, 25 mm, and 27 mm) were considered in
analysis. Table 7 presents the details of the selected specimens and estimated fatigue life
for the shear studs.
It can be seen from Fig. 17 that most of the runout test data are close to the current CAFL
value of 48 MPa. The mean value of stress ranges at which runout occurs are 56 MPa and
70 MPa for 3/4 inch and 7/8 inch shear studs, respectively. In Europe, often, the stress cycle
corresponding to 5 million cycles is set as the constant amplitude limit for that detail. From
Fig. 17, the stress range corresponding to 5 million cycles from CHBDC fatigue curve is
about 52 MPa. Thus, current CAFL value of 48 MPa in CSA S6-14 and AASHTO 2014
appears to be conservative.
7. Summary and Conclusions
A finite element based approach using the push-out test is proposed for fatigue life
estimation of headed shear stud connectors. Both crack initiation life and crack propagation
life were estimated and a good correlation was found with test results. The finite element
model using the proposed approach was used to conduct a parametric study to investigate
the effect of concrete strength and stud spacing on fatigue life of shear stud. In addition, a
regression analysis of the push-out test data available in literature was conducted. The
following conclusions were drawn from this study.
(1) From the regression analysis, it can be observed that the mean regression line could
be closely approximated by the fatigue Category D curve of Canadian highway
ACCEPTED MANUSCRIPT
ACCEP
TED M
ANUSC
RIPT
23
bridge design code (CHBDC). Considering that pushout test results provides lower
bound estimation of fatigue life of shear studs a mean regression line is justified to
use. In addition, the proposed fatigue curve in current CHBDC is still conservative,
especially in the high cycle fatigue region where most of the bridges will fall.
(2) Regression analysis of push-out test data showed that AASHTO provides the most
conservative estimate of fatigue life of shear stud both in high cycle fatigue and low
cycle fatigue regions in comparison to Eurocode and Canadian standard. In
addition, notable amount of overestimation of fatigue life was observed in case of
CSA S6-14 in the low cycle fatigue region.
(3) A closer look at the run-out test results from pushout tests showed that the current
constant amplitude fatigue threshold of 48 MPa is reasonable value to use. With
more test results available near the stress range of CAFL, the limiting CAFL value
can be increased.
(4) Study showed that the current fatigue curves in codes can be used for shear stud of
diameter of 31.8 mm. Thus, restriction of use of studs larger than 25 mm (1 inch)
in different bridge codes (CSA S6, Eurocode 4, and AASHTO) can be waived.
(5) The parametric study revealed that the effect of concrete strength on fatigue life is
insignificant. Also, fatigue life decreases with the increase of shear stud spacing for
all fatigue specimens.
Acknowledgements
Funding for this research project is provided by the Faculty of Engineering and Computer
Science, Concordia University, Montreal, Canada, and the Natural Sciences and
ACCEPTED MANUSCRIPT

ACCEP
TED M
ANUSC
RIPT
24
Engineering Research Council of Canada. The authors also gratefully acknowledge Dr.
Gilbert Y Grondin of AECOM, Edmonton, AB, Canada for his valuable suggestions in this
project.
LIST OF SYMBOLS
∆𝜀
2
Strain amplitude
𝜎′𝑓 Fatigue strength coefficient
𝑁𝑖𝑛𝑖𝑡 Crack initiation life
𝜎𝑚𝑎𝑥 Maximum applied stress
𝐸 Elastic modulus
b Fatigue strength exponent
𝜀′𝑓 Fatigue ductility coefficient
c Fatigue ductility exponent
𝑑𝑎/𝑑𝑁 Crack growth rate
∆𝐾 Stress intensity factor range
𝐶 Fatigue constant
𝑚 Slope of the design curve
𝑁𝑝𝑟𝑜𝑝 Crack propagation life
𝑎𝑜 Initial crack size
𝑎𝑓 Final crack size
∆𝐾𝑡ℎ Threshold stress intensity factor range
𝐸𝑐𝑜𝑛𝑐𝑟𝑒𝑡𝑒 Elastic modulus of concrete
𝑓′𝑐 Concrete compressive strength
ACCEPTED MANUSCRIPT

ACCEP
TED M
ANUSC
RIPT
25
𝑓𝑡 Concrete tensile strength
𝐾 Stress intensity factor
αεc1 Ultimate strain of concrete
βεt Tensile strain at zero stress
εc1 Compressive strain of concrete
εt Tensile strain of concrete
βE Correction factor for elliptical crack front
βs Correction factor for free surface
βG Correction factor for geometrical discontinuity
βW Correction factor for finite width
𝑎 minor semi diameter of an elliptical crack, or
half the crack length
𝑏 major semi diameter of an elliptical crack
𝐸𝐾 Complete elliptical integral of the second kind
SCF Stress concentration factor
Zr Shear force range
d Shear stud diameter
N Number of fatigue cycles
Sr Stress range
𝛥𝜏𝑅 Stress range
𝑁𝑅 Number of stress range cycles
𝛥𝜏𝑐 Reference stress range
𝑁𝑐 Specified number of design stress cycles
𝜏𝑠𝑟 Stress range
𝐹𝑠𝑟𝐷 Fatigue stress range resistance for category D
γ Fatigue life constant to fatigue detail category D
γ′ Fatigue life constant to fatigue detail category D
𝐹𝑠𝑟𝑡 Threshold stress range
ACCEPTED MANUSCRIPT

ACCEP
TED M
ANUSC
RIPT
26
References
[1] CAN/CSA S6-14. Canadian Highway Bridge Design Code, Toronto, Ontario, Canada;
2014.
[2] AASHTO LRFD Bridge Design Specifications. American Association of State
Highway and Transportation Officials, Washington, D.C; 2014
[3] CEN 1994-2 Eurocode 4. Design of composite steel and concrete structures - Part 2:
General rules for bridges. Brussels, Belgium; 2005.
[4] CAN/CSA S6-06. Canadian Highway Bridge Design Code, Toronto, Ontario, Canada;
2014.
[5] Slutter, R.G., and Fisher, J.W. Fatigue strength of shear connectors. Highway research
record no. 147, National Research Council, Washington, D.C; 1966.
[6] ABAQUS standard user's manual, Version 6.13. Hibbitt, Karlsson and Sorensen, USA;
2013.
[7] Lee, P.G., Shim, C.S, and Chang, S.P. Static and fatigue behavior of large stud shear
connectors for steel-concrete composite bridges. Journal of Constructional Steel
Research 2005; 61(9): 1270-1285.
[8] Mundie, D.L. Fatigue testing and design of large diameter shear studs used in highway
bridges. M.Sc. thesis. Department of Civil Engineering, Auburn University, USA;
2011.
[9] Smith, K.N, Watson, P., and Topper, T.H. A stress-strain function for the fatigue of
materials. Journal of Materials 1970; 5(4): 767-778.
ACCEPTED MANUSCRIPT
ACCEP
TED M
ANUSC
RIPT
27
[10] Josi, G., and Grondin, G.Y. Reliability-beased management of fatigue failures.
Structural Engineering Report 285, Department of Civil and Environmental
Engineering, University of Alberta, Edmonton, Canada; 2010.
[11] Paris, P., and Erdogan, F. A critical analysis of crack propagation laws. Journal of
Basic Engineering 1963; 85(4): 528-533.
[12] ASTM designation E647. Standard test method for measurement of fatigue crack
growth rates, American Society for Testing and Materials. Philadelphia, USA; 2000.
[13] Fisher, J.W., Albrecht, P.A., Yen, B.T., Klingermen, D.J., and McNamee, B.M.
Fatigue strength of steel beams with welded stiffeners and attachments. NCHRP report
no. 147, Transportation Research Board, National Research Council, Washington,
D.C; 1974.
[14] Ibrahim, S.A., El-Dakhakhni, W.W., Elgaaly, M. Fatigue of corrugated-web plate
girders: Analytical study. Journal of Structural Engineering 2006; 132(9): 1381-1392.
[15] Ellyin, F. Fatigue damage, crack growth and life prediction. Chapman & Hall, London,
U.K; 1997.
[16] Chen, H., Grondin, G.Y., and Driver, R.G. Fatigue resistance of high performance
steel. Structural Engineering Report 258, Department of Civil and Environmental
Engineering, University of Alberta, Edmonton, Canada; 2005.
[17] Gattesco, N. and Giuriani, E. Experimental study on stud shear connectors subjected
to cyclic loading. Journal of Constructional Steel Research 1996; 38(1): 1-21.
[18] CAN/CSA-A23.3-14. Design of concrete structures, Toronto, Ontario, Canada; 2014.
ACCEPTED MANUSCRIPT
ACCEP
TED M
ANUSC
RIPT
28
[19] Ellobody, E., Young, B., Lam, D. Behavior of normal and high strength concrete-
filled compact steel tube circular stub columns. Journal of Constructional Steel
Research 2006; 62(7): 706-715.
[20] Mia, M. M., Bhowmick, A.K. Static Strength of Headed Shear Stud Connectors Using
Finite Element Analysis. 6th International Conference on Engineering Mechanics and
Materials 2017, Vancouver, BC, Canada, May 31-June 3.
[21] Loh, H.Y., Uy, B. and Bradford, M.A. The effects of partial shear connection in the
hogging moment regions of composite beams, Part I – Experimental study. Journal of
Constructional Steel Research 2004; 60: 921-62.
[22] Broek, D. The practical use of fracture mechanics. 2nd ed. Kluwer Academic
Publishers, Netherlands; 1989.
[23] Lehman, H. G., Lew, H.S., and Toprac, A.A. Fatigue strength of 3/4 inch
studs in lightweight concrete. Research Report No. 76-1F, Center for Highway
Research, The University of Texas, Austin, Texas; 1965.
[24] Mainstone, R. J. and Menzies, J.B. Shear Connectors in Steel Concrete Composite
Beams for Bridges 1: Static and Fatigue Test on Push-out Specimens. Concrete 1967;
291-302.
[25] Hallam, M. W. The behaviour of stud shear connectors under repeated loading.
Research Report No, R281, University of Sydney, School of Civil Engineering,
Sydney, Austrailia; 1976.
[26] Roderick, J. W., and Ansorian, P. Repeated loading of composite beams. Civil
Engineering Transactions CE18(2) 1976;109-116.
ACCEPTED MANUSCRIPT

ACCEP
TED M
ANUSC
RIPT
29
[27] Lo KK. Fatigue testing of stud shear connectors. M.Eng thesis, University of
Melbourne, 1978.
[28] Oehlers DJ, Foley L. The fatigue strength of stud shear connectors in composite
beams. Proc. Instn Civ. Engrs, Part 2, 79, 349–364, 1985.
[29] Maeda Y and Matsui S. Effects of concrete placing direction on static and fatigue
strengths of stud shear connectors. Tech. Reports, Osaka University, October 1983;
33(1733):397–406.
[30] Naithani, K.C., Gupta, V.K. and Gadh, A.D. Behavior of Shear Connectors under
Dynamic Loads. Materials and Structures 1988; 21 (125): 359-363.
[31] Oehlers, D. J. The Derivation of the Fatigue Endurance of Stud Shear Connections in
Composite Steel and Concrete Bridge Beam. Department of Civil Engineering. The
University of Adelaide. Report No. R81, 1988.
[32] Faust, T., Leffer, A., and Mensinger, M. Fatigue of Headed Studs Embedded in
LWAC. LACER No. 4, 1999; 226-230.
[33] Bode, H., Mensinger, M, and Leffer, A. The Shear Connection of Steel-Concrete
Composite Bridges under Non-Static Loading. Stahlbau, 2001; 70 (4): 277-286.
[34] Shim, C.S., Lee, P.G. and Chang, S.P. Design of Shear Connection in Composite Steel
and Concrete Bridges with Pre-Cast Decks. Journal of Constructional Steel Research
2001, 57(2): 203-219.
[35] Badie, S.S. Tadros, M.K., Kakish, H.F., Splittgerber, D.L. and Baishya, M.C. Large
Shear Studs for Composite Action in Steel Bridge Girders. Journal of Bridge
Engineering 2002; 7(3):195-203.
ACCEPTED MANUSCRIPT

ACCEP
TED M
ANUSC
RIPT
30
[36] Ahn, J. H., Kim, S. H., and Jeong, Y. J. Fatigue experiment of stud welded on steel
plate for a new bridge deck system. Steel and Composite Structures 2007; 7(5): 391-
404.
[37] Hanswille, G., Porsch, M., and Ustundag, C. Resistance of headed studs subjected to
fatigue loading Part I: Experimental study. Journal of Constructional Steel Research
2007; 63(4): 475-484.
ACCEPTED MANUSCRIPT

ACCEP
TED M
ANUSC
RIPT
31
Table 1: Comparison of FE Analysis Results with Test Results of Lee et al. [7]
Diameter
of Stud
(mm)
Test Results FE Analysis
Results
Specimen
Staic
strength
(kN)
Average Ultimate
slip
(mm)
Average Staic
strength
(kN)
Ultimate
slip
(mm)
25 ST25B1 176.4
180.13
6.33
6.79
175.39
8.59 ST25B2 176.7 6.72
ST25B3 187.3 7.31
27 ST27C1 208.2
211.20
9.19
8.82
208.00
9.12 ST27C2 238.5 8.36
ST27C3 186.9 8.92
30 ST30C1 222.8
232.27
9.39
9.36
242.92
10.02 ST30C2 240.0 9.24
ST30C3 234.0 9.46
ACCEPTED MANUSCRIPT

ACCEP
TED M
ANUSC
RIPT
32
Table 2. Selected specimens for FE analysis
Specimen Concrete strength
(MPa)
Stress range
(MPa)
FT25A2 30 150.0
FT25A3 30 170.0
FT25B1
FT25B2
40
40
130.0
150.0
FT25B3
FT27A1
FT27A2
40
30
30
177.3
128.4
150.0
FT27A3 30 170.0
FT30A1 30 130.0
FT30A2 30 150.0
FT30A3 30 156.1
Table 3. Fatigue life prediction by the proposed approach
Specimen Fatigue life
(Test)
Fatigue life
(FEA)
Variation
(Test/FEA)
FT25A2 44827 50586 0.886
FT25A3 60000 38646 1.553
FT25B1 387209 355439 1.089
FT25B2 61063 61351 0.995
FT25B3 5320 29409 0.181
FT27A1 142641 135513 1.053
FT27A2 22488 26797 0.839
FT27A3 13766 20752 0.663
FT30A1 75484 55897 1.350
FT30A2 10436 13453 0.776
FT30A3 19333 12331 1.568
Mean of Test/FEA 0.996
COV of Test/FEA 0.41
ACCEPTED MANUSCRIPT

ACCEP
TED M
ANUSC
RIPT
33
Table 4. Fatigue life variation with stud spacing
Stud spacing
(mm)
Fatigue life (cycles)
FT25A2 FT25A3 FT25B1
200 134360 89275 376015
250 50586 38646 355439
300 22545 17143 231393
Table 5. Fatigue life variation with concrete strength
Concrete strength
(MPa)
Fatigue life (cycles)
FT25A2 FT25A3 FT25B1
25 41478 32919 296636
30 50586 38646 309500
35 55608 47197 318768
40 61351 66031 355439
45 62184 69791 450018
Table 6. Regression analysis of pushout test data
Constant Regression value Constrained regression value
m 3.432 3.0
logamean 12.684 11.773
logadesign 11.46 10.32
amean 4.83×10¹² MPa 5.93×10¹¹ MPa
adesign 2.88 ×10¹¹ MPa 2.09 ×10¹⁰ MPa
ACCEPTED MANUSCRIPT
ACCEP
TED M
ANUSC
RIPT
34
Table 7. Selected cases for CAFL evaluations
Specimen Stress range
(MPa)
Fatigue life
(FEA)
FT19 40 25755000
FT19 50 15782000
FT19 60 11795000
FT19 70 8945200
FT19 80 6955000
FT19 100 3459650
FT25 40 14155700
FT25 50 10542450
FT25 60 7150000
FT25 70 6255000
FT25 80 5450000
FT25 100 1310000
FT27 60 4193000
FT27 80 1887936
FT27 100 969300
ACCEPTED MANUSCRIPT

ACCEP
TED M
ANUSC
RIPT
35
Figure Captions for “A finite element based approach for fatigue life prediction of
headed shear studs”
Md. Manik Mia and Anjan K. Bhowmick
Department of Building, Civil and Environmental Engineering, Concordia University,
Montreal, Quebec, Canada
Fig. 1. Push-out specimen: (a) Geometry of pushout test of Lee et al. [7]; and
(b) A quarter of push-out specimen used in FE model
Fig. 2. Surfaces in contact interaction between steel beam and concrete slab
Fig.3. MPC constraint between load surface and control constraint point
Fig. 4. Boundary condition for finite element model
Fig. 5. FE mesh of the Model: (a) Concrete slab, (b) Steel beam with stud, and (c) Shear
stud with weld
Fig. 6. Stress-strain relationships for concrete material
Fig. 7. Validation of FE model with test results of Lee et al. [7]
Fig. 8. Validation of FE model with test results of Gattesco and Giuriani [17]
Fig. 9. Validation of FE model with test results of Loh et al. [21]
Fig. 10. Critical location of shear stud
Fig. 11. Fatigue failure modes: (a) Mode A; and (b) Mode B
Fig. 12 Effect of stud spacing on fatigue life (FT25A2)
Fig. 13. Concrete strength effects on fatigue life of shear studs (FT25A2)
Fig. 14. Regression analysis of push-out test data
Fig. 15. Evaluation of fatigue curves in different codes
Fig. 16. Regression analysis of push-out test by Badie et al. [34] and Mundie [8]
Fig. 17. Current design curves with available run-out test data
ACCEPTED MANUSCRIPT

Figure 1

Figure 2

Figure 3

Figure 4

Figure 5

Figure 6

Figure 7

Figure 8

Figure 9

Figure 10

Figure 11

Figure 12

Figure 13

Figure 14

Figure 15
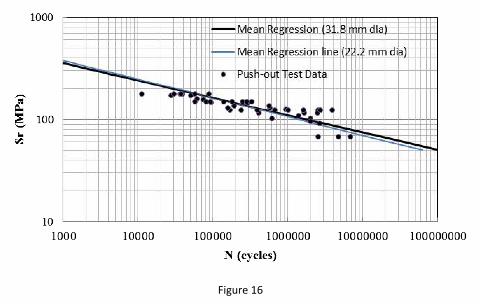
Figure 16

Figure 17