regional decentralization and fiscal incentives: federalism, chinese style
TRANSCRIPT
Regional Decentralization and Fiscal Incentives:
Federalism, Chinese Style1
Hehui JinDepartment of Economics
Stanford University
Yingyi QianDepartment of Economics
University of Maryland
and
Barry R. WeingastHoover Institution and
Department of Political ScienceStanford University
January 2000
Abstract
The theory of market-preserving federalism stresses the importance of decentralization andincentives of government on market development. Using a panel data set, we investigate thecentral-provincial relationship during China's reform process. [In comparison with the pre-reformperiod,] we find much stronger correlations between local government budgetary revenue collectionand its budgetary expenditure under the implementation of "fiscal contracting system." *comparedwith the pre-reform period.* We also find that more fiscal decentralization and stronger fiscalincentives — the latter measured in terms of higher (ex ante) marginal local *budgetary* revenueretention rate — implies faster development of non-state enterprises and more reform in state-ownedenterprises, while the Party's control over appointment has opposite effects. However, the Party'scontrol is effective in restricting local government's investment but ineffective in curbing local creditexpansion, suggesting that the Party's control had played some, but limited, role in helpingmacroeconomic stability. We also compare federalism, Chinese style, to federalism, Russian style.
1 We would like to thank Roger Gordon, Yasheng Huang, John McMillan, Peter Murrell, Gerard Roland,Andrei Shleifer, Heng-fu Zou, and the participants at the Fifth Nobel Symposium in Economics for helpfulcomments and discussions and the Center for Research on Economic Development and Policy Reform at Stanfordfor financial support.
1
I. Introduction
Reforming the government is a crucial component of both the transition from a planned
to a market economy and economic development. Creating thriving markets in these
economies typically require transforming a highly centralized and interventionist
government into one that complements the market and fosters decentralized economic
activities. Democracy, separation of powers, and the rule of law are among the
important institutions that allow citizens to hold the government accountable for its
economic actions and to secure markets from arbitrary state intrusion. Yet in many
countries, these institutions are incomplete or absent altogether, raising questions about
how these states can improve their governance structures. In this paper, we study
federalism as an alternative approach. By devolving power from the central to local
levels, federalism may help implement a limited yet effective government.
Traditional theories of federalism emphasize allocative benefits of
decentralization in public goods and services. There are two related ideas. First,
according to Hayek's (1945) idea on the use of knowledge in society, local
governments have better access to local information, which allows them to provide
public goods and services more efficiently than the national government. Second,
Tiebout (1956) introduced the inter-jurisdictional competition dimension and argued
2
that such a competition provides a sorting mechanism to better match public goods and
services with consumers' preferences. Drawing on these ideas, Musgrave (1959) and
Oates (1972) built a theory of fiscal federalism, stressing among other things the
appropriate assignment of taxes and expenditures to the various levels of government
to improve welfare. They also suggested that inappropriate decentralization may
induce a range of allocative distortions, regional inequality, and fiscal instability.
Extending the traditional theory, the recent theory of "market-preserving
federalism" emphasizes additional benefits of decentralization, which appear to be
especially important for transition and developing economies (McKinnon, 1997; Qian
and Roland, 1998; Qian and Weingast, 1997; Weingast, 1995; and Wildasin, 1997).
[Paralleling several other recent studies of public incentives under federalism, these
works stress:] the importance of decentralization of authority and the incentives of
governments [( Buchanan and Brennan, 1980; Epple and Zelenitz, 1981; Inman 1988;
and Inman and Rubinfeld, 1997)]. This theory focuses on how the inter-governmental
relationship affects the government's behavior toward business enterprises and market
development. The issue of aligning government incentives with promoting markets is
especially acute for transition economies just emerging from central planning. In these
countries, as in developing countries generally, economic development depends
crucially on whether the government plays the role of the "grabbing hand" or that of the
3
"helping hand" vis-a-vis business enterprises (Shleifer and Vishny 1999). The theory
of market-preserving federalism suggests how and when federalism can serve as a
means of limiting the grabbing hand and encouraging the helping hand of governments
in these countries.
Lacking democracy, the rule of law, and other constitutional constraints on the
national government, China's transition to markets has long been associated with the
devolution of authority from the central to local governments (Montinola, Qian, and
Weingast, 1995; Chang and Wang, 1998; Oi 1999, Xu and Zhuang, 1998). Using a
provincial data set from 1982 to 1992, we study empirically the emergence of the
Chinese style of federalism from the perspective of market-preserving federalism. As
far as we know, we are the first to include in the data the ex ante marginal rates of local
revenue retention. *Data on the ex ante, or promised, sharing schemes are indeed much
harder to come by. Yet* [Although this data is difficult to obtain,] we think it is the
right variable for studying the effects of incentives on the margin[. I]n contrast, the
more readily available data on the ex post ratios of revenue retention over collection
only measures the average realized revenue retention.
Our first major finding concerns the change of fiscal incentives facing local
governments. In examining the implementation of the "fiscal contracting system"
between the central and provincial governments, we find that the discrepancy between
4
ex ante contracts and ex post implementation declined over time and was *not too big*
[relatively small] on average. The implementation of the fiscal contracting system has
immediate implications on the fiscal incentives faced by local governments. We find,
on average, a strong correlation between ex post provincial budgetary revenue
collection and expenditure in post-reform period, about four times as large in the
magnitute as before the reform. Our finding also reveals a substantial reduction in the
ratchet effect after the reform as compared to the pre-reform period. [Put simply, in the
pre-reform period, the central government reacted to higher local revenues this year by
requiring higher remittances next year; in the post-reform period, this ratchet effect is
far smaller.]
Our second major finding concerns the effects of fiscal decentralization, fiscal
incentives, and the Party's control over local government official appointment[s] on
provincial economic development and reform. We find that, across provinces and over
time, more fiscal decentralization and stronger fiscal incentives — the latter measured
in terms of higher (ex ante) marginal local revenue retention rate — positively affect
the development of non-state enterprises in terms of the growth of rural or total non-
state enterprise employment. {YQ: I removed a “they” here and replaced it with my
guess at the appropriate antecedent. If I’m wrong, please fix:} In addition, more fiscal
decentralization and stronger fiscal incentives *they* also induce more reforms in state-
5
owned enterprises in terms of the increased shares of contract workers in the total state
employment and bonuses in total employee wages. On the other hand, we find that the
Party's control over personnel has the opposite effect: closer integration of provincial
officials with the central government — indexed by their career background vis-a-vis
the central government — entails slower development of non-state enterprises and less
reform in state enterprises.
Although the Party's control plays a negative role in promoting provincial
economic development and reform, {YQ: is this accurate?:} [following Huang (1996)]
we find some evidence suggesting that it may have helped macroeconomic stability.
Specifically, stronger association of provincial officials with the central government
implies a more restricted expansion of local government-driven investment that [many]
viewed as a source of macroeconomic instability during the period we study. [We also
show that] the Party's control is ineffective in curtailing the expansion of bank credit,
another source of macroeconomic instability. This [instability] constitutes a main
reason for the later monetary reform.
We compare Federalism, Chinese style, with Federalism, Russian style. Recent
studies of Russia's transition stress the problematic role of the government in reform.
Shleifer (1997) and Frye and Shleifer (1997), for example, provide evidence that local
governments in Russia have been playing the role of "grabbing hands" that retard

6
private business development. Zhuravskaya (2000) finds that the existing revenue
sharing schemes between the Russian regional and local governments provide the latter
with no fiscal incentives to increase their tax base: increases in local government
revenues were almost entirely exacted by the regional government. It is the lack of
fiscal incentives that explains why local government is predetory on private businesses.
This contrast in incentives faced by local governments presents a partial
explanation for the different performances of the Chinese and Russian reforms.
Interestingly, Russia has done more than China in terms of privatization of state-owned
enterprises and liberalization of markets. But apparently it has failed to provide local
governments with good incentives to pursue local prosperity. Our perspective suggests
the critical importance of government incentives for successful reform. Liberalization
and privatization without altering government incentives are insufficient to produce
meaningful economic reform.
To our knowledge, there are only few empirical studies on the effects of fiscal
federalism on economic and government performance. Using the data from both the
U.S. states and the world, Oates (1985) tested Brennan and Buchanan's (1980)
hypothesis that the size of the public sector should vary inversely with the extent of
fiscal decentralization and only found very weak supporting evidence. Huther and Shah
(1998) assembled a sample of 80 nations to examine the relationship between fiscal
7
decentralization and a series of measures of economic and political performance (such
as debt-to-GDP ratio, quality of government, and political freedom). In nearly every
case, they found a significant and positive correlation between increased fiscal
decentralization and improved performance. We will review several recent studies on
China's fiscal federalism later.
The remainder of the paper is organized as follows. Section II describes the
central-local relationship during China's reform. Section III develops our theoretical
perspective. Section IV describes the data and the construction of variables. Section
V presents evidence on the implementation of the fiscal contracting system and the
resulting fiscal incentives for local governments. Section VI presents evidence on the
effects of fiscal decentralization, fiscal incentives, and the Party's control over
personnel. Our conclusions follow.
II. Regional Decentralization and Fiscal Contracting during China's Reform
A. Regional Decentralization during the Reform
8
China's government administration (and its fiscal system) has five levels: (1)
central; (2) provincial; (3) prefecture; (4) county; and (5) township.2 We refer to all
subnational governments as local governments in this paper in general, but in the
empirical sections we refer to provincial governments as local governments.
2 Below the township level, the village is an informal level of government. A municipality can be one of thelevels of a province, prefecture, or county; most municipalities are at the prefecture level.
Since 1979, devolution of economic authority from the central to local
governments has been a critical component of [Chinese] reform. Because of the legacy
of central planning, the government had comprehensive control over the economy.
Therefore, devolution of government authority from the central to local levels is a much
broader issue than fiscal affairs. First, local governments supervise about three quarters
of the state industrial firms[, as measured by] *with regard to* output; they also have
a major responsibility for state fixed investments. Second, local governments assume
primary authority to regulate the local economy, such as licensing, defining the scope
and role of non-state firms, coordinating urban development plans, and even resolving
business disputes. Third, local governments provide an array of local public goods,
9
such as schools, health care, culture, police, as well as infrastructure and other support
for economic development. For example, they play an important role in attracting
foreign investment into their localities.
Before the reform, the shares of local government expenditure in total
government expenditure were 46% for 1971-75 and 50% for 1976-80. After the
reform, the shares were 51% for 1981-85 and 60% for 1986-90. Only a few countries,
such as Switzerland and the United States, have a share of local government spending
as total government spending above 40 percent. On average, the share for
industrialized countries is 34 percent and, for developing countries, 22 percent (World
Bank, 1996). Therefore, by this measurement of decentralization alone, China has
always been very decentralized as compared to other countries.
However, the share of local government expenditures itself does not capture the
important aspects of reform and decentralization in China. Prior to the reforms, local
governments had no authority over the structure of local expenditures. After the
reforms, local governments acquired authority over expenditures within a broad set of
guidelines set by the central government. In particular, ministries at the central level
could no longer issue mandatory spending targets for provinces. Provinces also gained
the authority to decide on the fiscal arrangements with the sub-provincial governments
within the provinces (Oksenberg and Tong, 1991). Given that the local government has
10
the authority over its spending structure, the higher the share of local spending in total
government spending, the more the fiscal decentralization.
Despite decentralization in the fiscal and economic spheres, China [remains]
*has been, and still is,* under the one-party political system. The essential channel of
the Communist Party's control is its continued monopolistic political power over the
appointment and dismissal of government officials. In particular, the central
government, through the Party, selects top provincial officials. In terms of the
allocation of authority over appointing and dismissing local government officials, there
is no fundamental change before and after the reform.
[Nonetheless, the central government has used its appointment powers
differently since the initiation of reform.] *However,* Local government officials
appointed by the central government are far from homogeneous. [Local government
officials vary considerably in a range of characteristics, both cross-regional and over
time.] Some *of them* [officials] have deeper roots in their localities because they are
promoted from within the provinces. Others are more loyal to the central government
because they serve concurrently in the central government or because they are
transferred from the central government ministries or Party apparatus. {rewrote this
sent:} Not only does the effective influence of the central government over provincial
11
government policy vary with the characteristics of local government officials, but
provincial government officials' local knowledge and networks also differ.
B. The Fiscal Contracting System
China's decentralization involved more than just the devolution of government
authority. It also involved changes concerning how revenue is divided between central
and local governments through a major institutional innovation called the "fiscal
contracting system" (caizheng chengbao zhi) introduced between 1980 and 1993.
Government revenue in China falls into two categories: budgetary funds and
extra-budgetary funds.3 Budgetary funds include major taxes and some surcharges.
Up to 1994, all budgetary revenues except custom's duties were collected by local
governments and shared upward with the central government. In 1980, reforms put into
place the fiscal contracting system, which is also known by its nickname "eating from
separate kitchens" (fenzao chifan). This system represents a dramatic departure from
the previous system of "unified revenue collection and unified spending" (tongshou
tongzhi), or what is known as "eating from one big pot" (chi daguofan). The previous
system provided few incentives for the local governments to collect revenues or
3 The third category is off-budget funds (also known as "self-raised funds"), which include surcharges, userfees, and other types of fees. Because they are not recorded, we cannot include them in the research.
12
develop their local economies. The new system altered the vertical relationships
between the central and provincial governments. The local governments not only had
the authority over local expenditures, more importantly, they also entered long-term
fiscal contracts (typically five years) with the central government. [Two rationales
underlie] the new fiscal contracting system: [it was] intended [first] to guarantee the
central government a certain flow of revenue from local governments; *on the one hand
and* [and second] to provide local governments with incentives to build up local
economies and their revenue base on the other.
Under the fiscal contracting system, the central and provincial revenue and
expenditures were determined in three steps (Wong, 1997). First, central fixed revenue
was defined to include custom's duties, direct tax or profit remittance from the central
government supervised state-owned enterprises (SOEs), and some other taxes. All
other revenue falls under the heading "local revenue."
Second, the local revenue was divided between the central and provincial
governments according to pre-determined sharing schemes. These schemes evolved
through three phases. The first phase ran from 1980 to 1984, the second from 1985 to
1987 (transitional), and the third from 1988 to 1993. These sharing schemes vary
across provinces and over time. For example, between 1980 and 1987, Guangdong
province would remit a fixed amount per year, and between 1988 and 1993, it would
13
remit an amount that increased by a fixed 9 percent per year. Guizhou province would
receive subsidies which increased by a fixed 10 percent per year. On the other hand,
Jiangsu province would remit a fixed share of revenue to the central government. Over
time, many provincial governments retained 100 percent of the total local revenue at
the margin, which effectively made them residual claimants.
Third, after the division of local revenue according to the sharing schemes, some
extra remittance and transfer payments took place between the central government and
the provinces. For example, the central government sometimes "borrowed" from the
provinces. It also made additional transfer payments (not specified in the sharing
schemes) to provinces, which generally fell into two categories: earmarked subsidies
(zhuanxiang butie), the most important one is price subsidies for urban residents
compensating them for food price increases, and matching grants (peitao buokuan),
such as funds for highway building. {I rewrote this sent:} Of course, the larger this type
of ex post redistribution, the less important the pre-determined revenue sharing
schemes.
The second revenue category, [called] extra-budgetary funds, consists of tax
surcharges and user fees levied by central and local government's agencies, as well as
earnings from {YQ: is this all SOEs or just those under the local government’s
jurisdiction?:}SOEs. The extra-budgetary revenue emerged in the 1950s but only
14
became institutionalized after the reform. Unlike the budgetary local revenues, the
extra-budgetary local revenues are not subject to sharing with the central government,
although the latter may impose taxes on them. In 1978, total extra-budgetary revenue
was about 10 percent of the GDP while total budgetary revenue was about 31 percent.
In 1993, the extra-budgetary revenue was up to 16 percent of the GDP and the
budgetary revenue was down to 16 percent of the GDP (Statistical Yearbook of China,
1995). While about three-quarters of the extra-budgetary funds are retained earnings
by SOEs and by their supervisory government agencies at the central and local levels,
at least 30 percent of the extra-budgetary funds are used for government expenditures
to supplement the budgetary funds (Fan, 1996).
III. Transition to Markets and the Theory of Market-Preserving Federalism
A fundamental issue in transition economies (and, to a large extent, developing
economies) is reorienting the role of government from one that commands and controls
the economy to one that fosters decentralized markets. However, private initiatives and
market development will not emerge automatically unless the government stops playing
the "grabbing hand." On the other hand, they will flourish faster if the government
plays the "helping hand." Whether the government plays one role or the other depends
15
on the institutional constraints [it faces.] *imposed upon the government.* In mature
market economies, the rule of law, separation of powers, and democracy are all
important institutions to make the government accountable. In many transition or
developing countries, in contrast, these liberal mechanisms are incomplete or absent
altogether. Federalism, with the vertical division of power within the government, is
an alternative to provide the credible limits on government behavior.
Not just any form of federalism will do (Parikh and Weingast, 1997). In
particular, federalism needs to be structured to insure local government authority and
proper incentives. Building on many previous contributions (e.g., Buchanan and
Brennan, 1980; Epple and Zelenitz, 1981; Inman 1988; and Inman and Rubinfeld,
1997), the theory of market-preserving federalism stresses the appropriate institutional
arrangement of government decentralization and its effects on market development
(McKinnon, 1997; Qian and Roland, 1998; Qian and Weingast, 1997; Weingast, 1995;
and Wildasin, 1997). In the Chinese context and during the period we study, the major
development event is the fast growth of "non-state enterprises," which include both
private and "collective" enterprises, the latter are in effect local government enterprises.
At the same time, reforms were also carried out inside state enterprises without
privatization. These reforms include the introduction of bonuses to supplement fixed

16
wages to enhance the incentives of employees and the increased number of workers
hired on the term rather than permanent basis.
How does market-preserving federalism contribute to the market development?
The benefit from decentralization of authority is first due to the nature of dispersed
knowledge in the economy as Hayek stressed. Decentralization of government
authority makes better use of local information possessed by local governments. In
contrast, centralization of government authority is costly because information
transmission from local to central government is often distorted and incomplete.
Second, the case of decentralization also rests on the differences among people at the
central and local levels. Local government officials who have long worked in the
locality have more local knowledge about the environment and have better local
networks than the officials who were previously working at the central government.
Local government officials may also have different objectives from the central
government officials. For example, central government officials are far more concerned
about ideology than local government officials. Third, decentralization induces inter-
jurisdictional competition. Under centralization, the central government has monopoly
power of economic regulation. Under decenralization with goods and factor mobility,
competition rewards local governments friendly to markets as factors of production
17
move to their regions, while punishes heavily interventionist local governments which
lose factors of production.
Our first hypothesis is that the more decentralization of authority to local
governments, the faster the growth of the non-state sector and the more reform in state-
owned enterprises in the local economy. {YQ: I don’t follow that this next sent means:
it’s incomplete:} The converse is also true, the closer association of local government
officials with the central government.
But decentralization of authority *would be* [is] meaningless if the central
government takes away all *the* revenue [generated by] *that* local governments
*generate.* Conversely, the larger the marginal fraction of revenues a local government
is allowed to keep, the stronger the local government's incentives to increase its
revenue base, which in turn depends on local economic prosperity. This implies that
strong links between local expenditures and local revenue help align the interests of
local governments to local market development. Note that such links require limits on
inter-governmental fiscal transfers, in two directions — limits on central government
exactions from lower governments and limits on the central government's creation of
a soft budget constraint in the form of subsidies to fiscally imprudent local
governments.
18
Our second hypothesis is that the higher the marginal proportion of revenue
retained by the local governments, the faster the growth of the non-state sector and the
more reform in state-owned enterprises. Because onerous restrictions on enterprises
reduce their revenue, lower governments facing stronger fiscal incentives are likely to
impose fewer economic restrictions on and give more support for non-state enterprises.
Stronger fiscal incentives may lead local governments to restructure the state-owned
enterprises under their supervision, becuase poorly performing SOEs increase their
financial burden.
Although the market-preserving federalism theory stresses the important benefits
of decentralization, it does not consider a complete decentralization desirable. There
are certain areas, such as the supply of national public goods, where the authority needs
to be centralized. Decentralization of authority in monetary policy, for example, will
result in inflation, because it creates a free-rider's problem as each region would get the
full benefit of inflation but only bear a partial cost. In a mature federal system, the
federal government has a clear responsibility for the supply of national public goods.
In China, such a federal authority is absent. For example, China continued to rely on
an old institution — the Party control — to achieve the macroeconomic stability. Our
third hypothesis is that the Party's control over personnel appointment helps maintain
macroeconomic stability.
19
[To determine whether these hypotheses hold in practice requires empirical
data.] *These hypotheses need to be tested because the claimed effects do not always
come out naturally.* Decentralization may be ineffective, or worse, it may be
counterproductive because local governments use their newly acquired authority to
protect and exploit the local economy rather than expanding it. Provincial governments
may fail to respond to incentives. Or these incentives may result in more corruption
rather than more development. Finally, the Party control over appointment may not be
effective at all in maintaining macroeconomic stabilility because of the bureaucratic
delay or the crudeness of the instrument.
Although it extends the traditional theory of fiscal federalism, the theory of
market-preserving federalism differs from the former in important ways. One major
difference concerns the role of revenue transfers between the central and local
governments. While arguing for the benefits of decentralization of expenditure,
traditional fiscal federalism usually does not consider regional self-finance (i.e.,
requiring that local governments rely on their own tax revenue to finance their
expenditures) desirable because of possible allocative distortions under decentralized
revenue collection. This approach is often used to rationalize sizeable transfers from
the central to local governments in order to address vertical imbalances. *fill the gap
between decentralized expenditure and centralized revenue collection.* In contrast, the
20
theory of market-preserving federalism stresses the importance of governments'
incentives. For that purpose, it emphasizes the potential benefit of linking local
governments' revenue collection with their expenditure. {I reversed the clauses in this
sent and broke it in two:} This is especially important for economies *that just step out
of* [emerging from] the shadow of central planning. The pervasive revenue
redistribution in these economies destroyed both local governments' positive incentives
and their financial discipline.
IV. Data and Variables
In most of our empirical work, we use a panel data set of 29 provinces after the reform
from 1982 to 1992.4 For the purposes of comparison, we also use pre-reform
provincial revenue and expenditure data from the period from 1970 to 1979. We
obtained most of our data from the State Statistical Bureau (1997), supplemented by
data from various sources of official government publications at the national,
provincial, and municipality levels. Table 1 presents summary statistics of the variables
defined below.
21
[Insert Table 1 here]
A. Variables for Regional Decentralization
We use two variables to measure the degree of decentralization. We first
consider the fiscal aspect of decentralization in terms of budgetary expenditure. The
measure of fiscal decentralization is the ratio of provincial government spending (per
capita) to central government spending (per capita) as in Zhang and Zou (1998). Under
the assumption that local government has the authority over its expenditure, the higher
the ratio, the more the fiscal decentralization. This is the most common measure for
fiscal decentralization used in the literature.
4 The data excludes Tibet.
We make one adjustment to the fiscal expenditure data because the original data
has an inconsistency: *problem:* price subsidies were netted out from revenue and
expenditure before 1986 but added *back* to both revenue and expenditure
after[ward.] *1986.* Most of the price subsidies are the central government's
earmarked transfers to local governments (Wong, 1997). To make the data consistent
22
throughout the sample period, we exclude the price subsidies from the government
expenditure data after 1986. Because explicit provincial data on their price subsidy
expenditures are unavailable, we use the following method to estimate them. First, we
apply the central and local shares of price subsidies nationwide (Hofman, 1993) to
calculate the total local expenditures of the price subsidies for each year. Because the
price subsidies are exclusively for urban residents and they are provided more or less
uniformly across provinces, we then use the provincial share of urban residency in the
country to allocate price subsidies to each province. Figure 1 presents the sample
average of local government budgetary expenditure in total government budgetary
expenditure over time.
[Insert Figure 1 here]
The second variable we use for decentralization or centralization relates to
personnel appointment. Because top provincial officials are not elected but are
appointed by the central government and the Communist Party, it is important to see
how this political control process affects the economic behavior of local governments
and performance of local economy. Constructed by Huang (1996), this variable
concerns characteristics of top provincial officials in their relationship with the central
government. The index, called bureaucratic integration, is based on the career
background of the provincial Party Secretaries. [The indexed] for a provincial Party
23
Secretary [was] *the* scored *is* 1 if he/she was promoted from within the same
province; 2 if he/she was moved to the current post from another province; 3 if he/she
served in the central government before his/her current appointment; and 4 if he/she
concurrently holds a post in the central government (such as a Politburo seat).
This variable measures the degree of "closeness" of top provincial officials with
the central government: The higher the score, the closer is the top provincial officials
to the central government. {YQ: why does the last part of the sentence hold? I made
a guess:} A lower score provincial official is more likely to have better local
information and local connections, and moreover, they are more [likely to be]
committed to [fostering] *the* local prosperity. In contrast, a higher score provincial
official is more likely to have poor local information and local connections, but better
central government connections and more loyal to central government's objectives.
Figure 2 plots the average of bureaucratic integration across provinces over time.
[Insert Figure 2 here]
B. Variables for Fiscal Incentives
[Our] fiscal decentralization measure *by the ratios of local to central
government expenditure* does not capture the [marginal] fiscal incentives facing local
governments. *at the margin.* To examine the ex post fiscal incentives, we look at
24
realized provincial budgetary revenue and budgetary expenditure separately. As
explained in section II, provincial budgetary revenue is the revenue generated in the
province, excluding those revenues designated as the central government's fixed
revenue. On the other hand, provincial budgetary expenditure is the actual provincial
government spending, after contractual obligations are fulfilled and renegotiation takes
place. We also consider provincial extra-budgetary revenue and extra-budgetary
expenditure. Although *there is* no sharing arrangement *through fiscal contracts on*
[cover] extra-budgetary revenue, *between the central and provincial government, there
is no reason for us to believe a priori that* the central government *will not take away
any* [might extract a portion of these] funds.5 *from local extra-budgetary revenue.
Therefore, these two variables can take different values.*
{I rewrote this sent:}We also measure (ex ante) fiscal incentives, defined as the
(ex ante) marginal retention rate of local revenue collection by provincial governments,
*which was contained in* [as determined by] the fiscal contracts between the central
and provincial governments. In contrast to the ratio of local to central government
5 All provincial budgetary and extra-budgetary data are consolidated figures within a province.
25
expenditure, the fiscal incentive variable measures how local governments are rewarded
(or punished) at the margin from an increase (or decrease) in local revenue collection.
The fiscal contracting system was implemented between 1980 and 1993.
However, data for 1980 and 1981 are incomplete. Data for 1993 is distortionary due
to the anticipation of a major change in the fiscal system in 1994. For example, one
provision of the 1994 reform, announced in the fourth quarter of 1993, compensated
local governments based on their 1993 figures of local expenditure. This provision
gave an incentive for local governments to inflate the local expenditure figures toward
the year end. We exclude 1993 and use only the data from 1982 to 1992.6 {YQ:
moved this to FN6}*We collected the information about provincial marginal retention
rates in the fiscal contracts from Chen (1988), Oksenberg and Tong (1991), and Bahl
and Wallich (1992). In cases where there are several marginal retention rates for
6 We collected the information about provincial marginal retention rates in the fiscal contracts from Chen(1988), Oksenberg and Tong (1991), and Bahl and Wallich (1992). In cases where there are several marginalretention rates for different revenue brackets, we use the rate for the highest revenue bracket because the datareveals that all the provinces in fact ended up with that bracket. Furthermore, we use the 1992 data with caution,because in that year four provinces were selected for the experiment of a new tax system to be implementednationwide in 1994. Therefore, these provinces were not officially on the fiscal contracting system any more. Dropping off these four data points has little effect on our results.
26
different revenue brackets, we use the rate for the highest revenue bracket because the
data reveals that all the provinces in fact ended up with that bracket.*
The provincial marginal revenue retention rates involve one complication.
Starting in 1986, several large cities became fiscally independent from [their]
provinces, *where they are located,* directly contracting with the central government
(they are known as "separately plan listed cities"). We have tried to incorporate the
information on these city contracts into the provincial contracts by constructing an
average provincial marginal retention rate using city revenue and provincial revenue
(excluding the relevant city) as weights.7 Figure 3 plots the average of the provincial
marginal revenue retention rates and the share of provinces with 100 percent marginal
retention rates.
[Insert Figure 3 here]
C. Variables for Local Economic Performance
The non-state sector in urban and, especially, rural areas is widely regarded as
the engine of China's growth. We use two variables to measure the development
reflecting the entry and expansion of non-state enterprises: growth of rural enterprise
7 The incorporated information on "separately plan listed cities" include Wuhan (1986-92) in Hubei;Chongqing (1986-92) in Sichuan; Shenyang (1988-92) in Heilongjiang; Ningbo (1988-92) in Zhejiang; andQingdao (1991-92) in Shandong. Information sources are the provincial and city statistical yearbooks.
27
employment, which covers all non-agricultural activities in the rural areas, and growth
of non-state non-agricultural employment, which includes both urban and rural non-
state industry and services.
We study the reform within the state sector by examining two variables: the
changes in the share of contract workers in total state employment and in the share of
bonuses in total state employee wages. Prior to 1992, China did not privatize any state
enterprise. *But the* [Nonetheless] state-owned enterprises *still* underwent modest
reforms. For example, they changed their employment practices by hiring workers on
a contractual basis rather than giving them permanent positions. They also increasingly
used bonuses as a form of payment in addition to fixed salary. Both reforms were
intended to improve workers' incentives.8
Local governments in China have the control over local fixed investments. We
use the log of local government fixed investment to indicate the level of local
government investment activities and the ratio of local to central government fixed
8 Groves et al. (1994) used the similar variables as the measurements of state-owned enterprise reform inChina, and their data came from the enterprise level survey in four provinces.
28
investment to measure the relative weight of the local government’s role in investment
relative to the central government in a province.
During the period spanned by our data, the state banking system was
decentralized to a large degree, and local governments had enormous influence over
credit policy. We use two variables as measures of local credit expansion: per capita
new loans from state banks and per capita new loans from credit cooperatives. The
provincial governments have direct influence over state bank branches in their
provinces, but their influence on credit cooperatives are only indirect because these
cooperatives are supervised by county governments.
V. The Fiscal Incentives for Local Governments
We assess the implementation of the fiscal contracting system by first comparing the
actual provincial expenditure with the revenue retention amount implied by the ex ante
fiscal contracts. This allows us to estimate the extent of ex post readjustment of
revenue remittance and subsidies beyond the contracts. High ex ante marginal retention
rates together with small ex post readjustments *would support the claim* [show] that
29
the implementation of the fiscal contracting system *is responsible for* [creates] the
ex post strong link between revenue and expenditure.
*With* the [data] *information* on fiscal contracts *, we can* [allows us to]
examine the deviation of actual implementation of the fiscal contract from the promised
one. Fiscal readjustment (ex post) *is a* measure[s]*ment of* the difference between
actual provincial expenditure and "pre-defined" revenue retention, as indicated in the
fiscal contracts.9 A negative value of fiscal readjustment means that the province
spends less than the contractual provision would entail. We interpret the first case to
be the one in which the province ex post remitted extra revenue to the central
government, for example, *when it was* [if it were] forced to "lend" revenue to the
central government. These cases represent the central government's "predation." *On
the other hand,* A positive value of fiscal readjustment indicates that the province ex
post received extra subsidies from the central government, a signal of the "soft budget
constraint" (Kornai, 1986).10 For any given year, we use the average of this variable
9 Again, the data is adjusted for price subsidies after 1986: local portions of price subsidies are excluded fromlocal expenditure. They were earmarked central government transfers and were determined solely by the numberof urban residents anyway.
10 We make a few qualifications regarding the interpretation of the variable fiscal readjustment. First, weimplicitly assume that each province has a balanced budget each year without carry-overs from the previous yearor savings into the next year. This is basically true. Second, because our information about the fiscal contractsis limited to fixed subsidies/remittances and marginal retention rates, we have to omit other pre-defined transfersor transfers based on exogenous criteria such as natural disaster relief. However, such transfers are notsignificant. Third, because we look at net transfers (i.e., expenditure minus revenue retention), it is possible thattwo way transfers are high but net transfers are low. Despite these limitations, this variable provides useful

30
across provinces weighted by provincial expenditure to measure the average deviation
of implemented fiscal contracts from the promised ones.
information on the significance of ex post readjustment of fiscal revenue retention.
{YQ: I broke this sentence in two:}Consider Table 2, which reports in column
(6) the weighted average of the fiscal readjustment across provinces between 1982 and
1992, as measured by the absolute difference between actual expenditure and
contractual revenue retention divided by expenditure. The data display a declining trend
over time. After 1986, this variable fell below 8 percent. This evidence suggests that
the extent of ex post readjustments have become more limited over time. Further, after
1986, they have been relatively limited in scope. On average, actual provincial
expenditures correspond reasonably well to their contractual revenue retention. Of
course, we do not expect an exact correspondence due to ex post adjustments to
exogenous events that occur during the year, such as natural disasters.
[Insert Table 2 here]
31
Next we divide the provinces into two categories: extra remittance provinces,
defined as those whose expenditure fall short of pre-defined revenue; and extra subsidy
recipient provinces, defined as those whose expenditure exceed pre-defined revenue.
Examining the two groups separately, we find that there are generally fewer extra
revenue remitting provinces (see column (7), first panel of Table 3) than extra
subsidized provinces (see column (7), second panel of Table 3). This indicates that the
ex post extra transfers from the center to provinces (i.e., the problem of soft budget
constraints) is quantitatively more significant than extra transfers from the provinces
to the center.11
[Insert Table 3 here]
Because of the potential [for] *problem of* central government predation, the
phenomena of extra remitting provinces is of special interest. If the central government
behaved in a predatory fashion — for example, if it consistently forced the more
successful provinces to remit significant amount of additional revenue — the magnitude
of this figure would be significant. The results in the first panel of Table 3 suggest that
these additional remittances are small. After the difficult year of 1989, only one-third
11 This may also due to the fact that we were unable to account for some earmarked subsidies.
32
of the provinces remitted additional money, and the average amounted to a relatively
small portion of their expenditure, under four percent.
Table 3 also reveals two aspects of a sudden increase in extra remittances from
provinces to the central government in 1989. First, the average quantity of extra
remittances increased to 7.67 percent of expenditures (see column (6), first panel).
Second, the number of provinces making the extra remittances jumped to 19 out of 28
(see column (7), first panel). The Table also shows a decrease in extra subsidies from
the central to local governments as compared with other years, before and after
(columns (6) and (7), second panel).
The changes in 1989 are not surprising. In that year, conservatives in the
government temporarily gained power after the Tiananmen Square incident, causing a
temporary setback in reform. Importantly, Table 3 reveals two aspects of this setback.
First, this change was relatively short lived: after 1989, the fiscal data return to their
previous trend. Second, the absolute amount was modest. Although many more
provinces were subject to additional remittances in 1989, remittances averaged less
than eight percent of expenditures. Indeed, these data support the common anecdotal
evidence in the literature that the setback in reform after Tiananmen Square was
temporary. By the early 1990s, the number of provinces with extra remittances were
small, as was the average magnitude of the extra remittance.
33
What is the role of the fiscal contracting system in providing fiscal incentives for
local governments? We provide evidence showing that *implementation of* the fiscal
contracting system has improved fiscal incentives by providing a stronger link between
provincial marginal revenue collection and marginal expenditure. To that end, we look
at the correlations between provincial ex post realized revenue and expenditure. We
run the following fixed effect model:
(5.1) Xit = ai + ?t + ßYit + µit,
where Xit is province i’s expenditure in year t, Yit is province i’ revenue in year t, the
a i's are provincial fixed effects, ?t's are the year dummies, and µit's are the disturbance
terms. These tests are designed to *tell us how closely* examine the link [between]
*are* local expenditures *to* and local revenues, after controlling for provincial
inherent characteristics and nationwide changes over time.
Table 4 reports the results. For data from 1982 to 1992, row (1) shows a
coefficient of 0.752 on provincial budgetary revenue in its budgetary expenditure
equation; and row (2) shows an even larger coefficient for the extra-budgetary
expenditure equation (0.965). These results *mean* [imply] that, on average, a one
yuan increase in provincial budgetary revenue results in about three-quarters yuan of

34
provincial budgetary expenditure. Further, the relationship becomes almost one to one
for extra-budgetary revenue and expenditure. Taken together, the results demonstrate
that the fiscal system in China's reform has produced, on average, a strong link between
local expenditure and local revenue generation. *As a result, the* Provinces in China
[therefore] tend to be "self financing" at the margin. This translates into strong fiscal
incentives for local governments to pursue local prosperity in order to increase their
own revenue base.12
[Insert Table 4 here]
To put the above results in perspective, we compare them with the results from
pre-reform China. Using data on pre-reform China from 1970 to 1979, row (1) of
Table 4 reveals a very small coefficient on provincial budgetary revenue in the
budgetary expenditure equation, 0.184 before the reform as compared to 0.752 after the
reform. [These results show that,] prior to economic reform, the central government
extracted revenue from high revenue provinces while subsidizing low revenue
provinces. [Indeed,] a coefficient of 0.184 indicates that, prior to the reforms, the
central government, on average, extracted over 80 percent of any increase in local
revenues. This figure fell dramatically after the reform, indicating that the central
12 Using the three year data of 1983, 1987, and 1990 individually, Knight and Li (1999) also found that thecorrelations between local extra-budgetary revenue and expenditure were generally higher than those betweenlocal budgetary revenue and expenditure, and the latter increased over time.
35
government, on average, extracts less than twenty-five percent of any increase in local
revenues.
A comparison of our findings with similar investigations of post-transition Russia
is revealing. Zhuravskaya (2000) examined the fiscal incentives of city governments in
the region-city fiscal relationship in post-reform Russia, showing a pattern which she
interpreted as predation. Using the data of 35 cities for the period 1992-1997 and by
regressing the change in "shared revenues" between local and regional governments on
the change of "own revenue," she finds that the coefficient is -0.90. She interprets this
result as evidence that increases in a city's revenue are almost entirely offset by
decreases in shared revenues from the region to the city. Exaction of this magnitude
destroys cities' fiscal incentives to increase their tax base. These results stand in sharp
contrast with the post-reform China. In a separate regression we find that in China, any
increase in extra-budgetary revenue (corresponds to "own revenue" in Russia) does not
have this kind of negative effect on the change of budgetary expenditure (corresponds
to "shared revenue" in Russia). The coefficient is actually positive, which in part
reflects the fact that budgetary and extra-budgetary revenues have similar tax bases.
We next investigate an aspect of dynamic incentives, that is, the possibility of
a "ratchet effect" over time. The ratchet effect occurs when higher revenue collection
this year leads to a higher revenue remittance or fewer subsidies in the future
36
(Weitzman, 1980). [For example to what extent do revisions in the fiscal contract exact
recent fiscal gains?] We study this problem by regressing the difference between
budgetary expenditure and revenue (i.e., "subsidies" or negative "revenue remittance")
on the previous year's budgetary revenue to see the ratchet effect for the remittance
level. We also regress the difference as a proportion of budgetary revenue on the
previous year's budgetary revenue to see the ratchet effect for the remittance rate. The
ratchet effect implies a negative coefficient from these regressions, and the larger the
absolute number, the greater the effect.
{YQ: don’t we want to say here that, when we hold constant for inflation, the
effect is even smaller, .16?} Row (1) of Table 5 shows a modest ratchet effect for the
level after the reform, and row (2) shows that this effect survives inflation adjustment,
although becomes somewhat smaller. For every one yuan increase in provincial
revenue in the current year, the province will face, on average, a 0.24 yuan increase of
remittance to the central government in the next year. {YQ: what does this sent mean?
It seems to contradict the above. Please explain:}However, rows (3) and (4) show that
there is no ratchet effect for the rate. These results imply that, on average, the level of
remittance to the central government increased modestly over time from provinces
experiencing economic growth, but not the rate.
[Insert Table 5 here]
37
[In contrast, our investigation of the ratchet effect prior to the reforms reveals
(see row (1) of Table 5) a very strong ratchet effect before the reform: a one yuan
increase in this year's provincial revenue results in a 0.55 yuan reduction in next year's
subsidies (or, an increase in the next year's revenue remittance). In comparison, at
0.24, the ratchet effect after the reform halved from the pre-reform value. Moreover,
there was also a ratchet effect for the rate: row (3) shows that a 100 million yuan of
revenue increase in the previous year led to 1.7 percentage points increase of the rate
of remittance. This ratchet effect on the rate disappeared after the reform. Therefore,
provinces' concerns about increased future obligations from current increase of revenue
collection abated after the reform.
VI. The Effects of Regional Decentralization and Fiscal Incentives
In investigating the effects of regional decentralization and fiscal incentives [on the
local economy], we focus on three variables: fiscal decentralization (as measured by
the ratio of local to central spending), bureaucratic integration (as measured by the
career background of local government officials vis-a-vis the central government), and
ex ante fiscal incentives (as measured by the ex ante marginal local retention rate in the
38
fiscal contract). To our knowledge, we are the first to use the last variable as well as
the combination of the three in an econometric study of China's reform.
Specifically, we investigate the following model:
(6.1) Xit = ai + ßt + d'Zit + s 'Wit + uit.
In equation (6.1), Xit is a vector of variables measuring local economic performance in
a province. The ai's represent the provincial specific effects, which we assume are
constant for each province, implying that our specification is a fixed effect model. The
ßt's are the annual dummies, which are intended to capture the effects of nationwide
macroeconomic fluctuation. Zit is a vector of variables measuring fiscal
decentralization, bureaucratic integration, and fiscal incentives. Wit is a vector of
control variables. The uit's are the disturbance terms. Our fixed effect model implies
that any correlations between X and Z cannot be attributed to inherent provincial
characteristics.
Development and Reform
Our first task is to test the first and second hypotheses. Table 6 presents our
results on the effects of fiscal decentralization, fiscal incentives, and bureaucratic
39
integration on the development of non-state enterprises. The dependent variable in the
first panel of Table 6 is the growth of rural enterprise employment, a narrower measure
of non-state sector development; the dependent variable in the second panel is the
growth of non-state-non-agricultural employment in both urban and rural areas, a
broader measure. In these regressions, the control variables in W include the lagged
level variables, which are the share of rural enterprise employment in rural labor force
and the share of non-state-non-agricultural employment in total labor force respectively.
The two panels give similar results. First, the level variables have negative
coefficients, which is expected. In a model in which a "convergence" tendency exists,
"frontier" can be pushed outward by the increase of "effort," which is determined by
regional decentralization and fiscal incentives. Given regional decentralization and
fiscal incentives, the higher the previous level of industrialization, the harder it is to
grow faster. Second, both the single variable and multivariable regressions reveal that
fiscal decentralization have positive effects on the development of non-state
enterprises.13 Third, fiscal incentives have positive and significant effects on the
development of non-state enterprises; these effects remain significant even after
13 A previous study by Zhang and Zou (1998) reported a negative and significant effect of fiscaldecentralization on provincial growth during China's reform. We found that such negative effect would disappearand actually would turn into a positve effect if the set of annual dummy variables is included in their regressions. This suggests that their findings perhaps resulted from the failure to filter out economy-wide cyclic effects.
40
controlling for fiscal decentralization. This implies that fiscal decentralization alone is
not enough to explain the growth of the non-state sector, fiscal incentives have
additional explanatory power. Quantitatively, if the marginal revenue retention rate in
a province increases by 10 percentage points, then the growth rate of non-state
enterprises in that province would increase by 1.33 percentage points, when it is
measured for rural area only; and 1.02 percentage points, when measured for both rural
and urban areas. Finally, bureaucratic integration has a negative effect on developing
non-state enterprises. If the degree of bureaucratic association with the central
government moves up by one unit (say if the current provincial Party secretary who was
previously promoted from within the province is now replaced by someone who is
moved from another province), then the growth rate of non-state enterprises in the
province would be reduced by 1.5 percentage points for rural area and by 1.0
percentage points for both rural and urban areas respectively.
[Insert Table 6 here]
We carry out a similar exercise for the reform of state-owned enterprises. The
first panel of Table 7 reports our results on the change of the share of contract workers
in total state employment and the second panel on the change in the share of bonuses
in total employee wages. Again, the level control variables -- the share of contract
workers and the share of bonuses -- have negative coefficients, which mean that the
41
higher the [initial] shares, *to start with,* the more difficult it is to increase the shares
further. [The degree of] fiscal decentralization has significant effects on the change of
the share of bonuses in total employee wages, but not on the change of the share of
contract workers in total state employment. However, fiscal incentives have positive
effects for both reform measurements. Stronger fiscal incentives foster reform by
increasing the share of contract workers relative to permanent workers and the share
of bonuses in total employee wages. These effects remain significant after controlling
for fiscal decentralization. A 10 percentage point increase in the marginal revenue
retention rate in a province leads to a 0.49 percentage point increase in the share of
contract workers and a 0.32 percentage point increase in the share of bonuses.
In contrast to permanent workers, who are under the traditional socialist labor
conditions of "iron rice bowls," contract workers do not have tenure and are more likely
subject to market conditions. More contract workers relative to permanent workers
mean that enterprises are better restructured to market orientation. Bonuses, as
compared to fixed wages, represent a compensation form that is more closely linked
to workers performance, a higher share of bonuses in total employee wages implies
enterprise workers are better motivated. Finally, we find negative effects of
bureaucratic integration on the reforms in both measures. The effect is significant for
the share of contract workers, but not for the share of bonuses.
42
[Insert Table 7 here]
Macroeconomic Stability
We have demonstrated that Party control over personnel has a negative effect on
development and reform. [We now turn to our third hypothesis concerning whether]
*does the* Party control play[s a] positive role [in] helping macroeconomic stability.
*Our next task is to test our third hypothesis.* We examine two aspects related to
macroeconomic stability, one on real side and the other on financial side. Consider the
real side: during this period, excessive local government fixed investment was often
considered an importance source of macroeconomic instability and inflation. We
examine the relationship between bureaucratic integration and local government's fixed
investment and report the results in Table 8. Although we found that more fiscal
incentives are associated with higher local government investment, we also found that
more bureaucratic integration is associated with lower local government fixed
investment. Here local government investment is measured by both the level of local
government fixed investment and by the ratio of local to central government fixed
43
investment. These effects remain even after controlling for fiscal decentralization. This
suggests that Party control does play a role in maintaining macroeconomic stability.14
14 Huang (1996) also obtained the result on the effect of bureaucratic integration in curbing local governmentinvestment in a different regression without the fixed effect and without controlling for fiscal decentralization andfiscal incentives.
[Insert Table 8 here]
On the financial side, we examine the relationship between bureaucratic
integration and local credit expansion (see Table 9). In China and during the period,
all the credit sources were controlled by government, especially by local governments.
Local governments had have influences on credit expansion from two types of financial
institutions: state banks and credit cooperatives. The provincial governments had direct
influence over state bank branches in their provinces, but not directly over credit
cooperatives {YQ:is this correct:}(which the county governments controlled). We
found that fiscal decentralization has a positive effect on credit expansion from both
sources, but fiscal incentives only have significant effects on the access to loans from
the state banks, not from credit cooperatives. This provides some evidence that
44
stronger fiscal incentives for local governments were associated with more local
government's access to credit from the sources that they have direct control over. On
the other hand, unlike its effect on local government investment, bureaucratic
integration has no significant effect on local credit expansion from either source. This
suggests that the Party control is not effective in controlling local governments' access
to credit. To the extent that credit expansion is a major source of inflation, the Party's
control has not achieved that objective. This is perhaps an important reason for the
monetary reform in 1994.
[Insert Table 9 here]
Robustness
To check the robustness of our estimations, we consider several alternative
specifications. First, in addition to the fixed effect models, we also estimated the
random effect models and tested for the validity of the two specifications. We report
the Hausman test results at the bottom of Tables 6-9, which favor the fixed effect model
over the random effect model in almost all cases. As noted by Hsiao (1986), the
random effect models are no longer valid when the provincial specific effects are
correlated with the other independent variables. {What does “in the later” mean in this
sent?:}This is certainly the case in our models as we show, in the later, that both the
45
marginal incentives and bureaucratic integration depend on provincial specific
conditions which are captured in provincial fixed effects. This is why the random effect
model is rejected in almost all the cases.
Second, we have also run parallel regressions replacing the fiscal incentive
variable with a qualitative variable that takes value 1 if the marginal retention rate is
100 percent and 0 otherwise. This intends to test the impacts of the possible
error-in-variable problem in the measurement of the marginal retention rates. The
results are reported in the last columns of Tables 10 and 11. The magnitudes and
significance of the all our estimated coefficients remain unchanged except for the non-
agricultural employment equation in which the coefficient of fiscal incentive turns out
positive but insignificant, indicating that there may exist some error-in-variable
problem. But clearly, the problem is not serious enough to distort our qualitative
results.
[Insert Tables 10 and 11 here]
Third, to see if our estimations are sensitive to our choice of control variables in
the estimations of the development and reform equations, we have replaced the control
variable with alternative variables representing the level of economic development,
such as per capita GDP, per capita government revenue, and the share of non-
agriculture labor force in the total labor force. We want to make sure that our results
46
are not sensitive to the correlation between our independent variables (i.e., marginal
retention rates and bureaucratic integration) and the level of economic development.
The first three columns of Tables 10 and 11 present the estimation results using these
alternative control variables. All the results indicate that our estimates are quite robust.
The qualitative results concerning the positive effects of fiscal decentralization and
fiscal incentives and the negative effects of bureaucratic integration have been
preserved in almost all cases.
For the equations of macroeconomic stability, we have also estimated the models
with alternative control variables for the level of development. Again the all of our
qualitative results hold unchanged, as shown in Tables 12 and 13.
[Insert Tables 12 and 13 here]
The Endogeneity Problem Related to Marginal Retention Rates and Bureaucratic
Integration
In this subsection we turn to the possible endogeneity problem. The marginal
retention rates are treated as a largely predetermined variable in our model, since the
fiscal contracts are determined every 3-5 years and remain rather stable during the
intervals. {YQ: I rewrote this sent:}Still, one may argue that the choice of marginal
retention rates depended on certain characteristics that also influenced the dependent
47
variables. However, we argue that, since the contracts are fixed for several years, the
characteristics which were considered in the choice of marginal retention rates are often
those long-term factors which do not subject to year to year changes. These factors are
more or less stable, and therefore can be largely captured by our provincial fixed
effects.
Generally speaking, the marginal retention rates are not based on current income
levels. We found that, even in simple regressions, they are not correlated with per
capita real GDP. {YQ: I rewrote the next three sent’s:}In particular, richer provinces
were not systematically more likely to get higher or lower incentives. Even when the
sample is restricted to revenue surplus provinces, there is no significant correlation
between marginal retention rates and per capita GDP. Nor is the marginal retention rate
determined randomly. The result in Table 14 show that they are negatively correlated
with the level of per capita budgetary revenues. The positive correlation holds after
controlling for bureaucratic integration, minorities regions and budgetary revenue
shares in total government revenues, but fails to hold after controlling for the share of
urban residency in total population. Higher marginal retention rates are given to
minority regions. But minority dummy becomes insignificant when urban residency or
per capita budgetary revenue is included. A quite robust result is that marginal rates
are negatively correlated with urban residency and the importance of the province in
48
generating budgetary revenues for the center (as measured by the shares of the
provincial budgetary revenue in national totals). Both factors are more or less stable
in the short run.
[Insert Table 14 here]
Because top provincial bureaucrats, once appointed, usually remain in office for
at least 5 years, the variable of bureaucratic integration remains relatively stable for
each province, displaying perhaps two or three discrete jumps during our sample period
of 11 years. As Huang (1996) explained, this variable is constructed primarily on the
basis of the career background of provincial officials that is based on their past
performance history; only the coding of the concurrent centralists refers to their
contemporaneous status. These facts enable us to treat [bureaucratic integration] as
predetermined. But unlike the marginal retention rates, the bureaucratic integration is
found positively correlated with per capita GDP [(see Table 15)]. Richer provinces are
more bureaucratically integrated than poorer provinces. It is also positively correlated
with per capita budgetary revenues, the share of urban residency in total population, the
share of state industry in the province. No evidence shows that minority regions are
either less or more integrated.
[Insert Table 15 here]

49
Since both the marginal retention rates and bureaucratic integration remain stable
in most of the years, we only have to consider its endogenous determination when they
display discrete jumps. This suggests that the same variables lagged one year are good
candidates for instruments. With these instruments we have run two stage regressions
for all the equations and found all of them yield the similar results as we obtained
before. These results indicate that the endogeneity problem is not serious in our models.
[Insert Table 16 here]
In summary, we found evidence showing that more fiscal decentralization and
stronger fiscal incentives are associated with the faster development of non-state
enterprises and in reform of state enterprises in China. We also found evidence that
greater bureaucratic integration, reflecting the Communist Party’s control over
personnel, has the opposite effect. On the crucial issue of development and reform, the
fiscal contracting system seems to play a major positive role. Although Party control
generally is not favorable to development and reform, it seems to have some role in
maintaining macroeconomic stability through restricting local government investment,
but not through restricting credit expansion.
Some of our above results parallel recent studies for Russia. Using a (ex post)
binary proxy for fiscal incentives rather than the (ex ante) marginal retention rate here,
Zhuravskaya (2000) found in Russia cities stronger fiscal incentives have positive
50
effects on private business formation, the shares of local public spending on education
and health care, and the outcome of local public goods provision as measured in terms
of reducing infant mortality rates and the percentages of school children who have to
go to evening schools to compensate for the lack of education provided by the local
governments. Freinkman and Yossifov (1998) used the share of local governments
total revenue in the consolidated regional budgetary revenue as a measure of fiscal
decentralization within a region. They found that fiscal decentralization increases the
share of expenditures on education in regional government budget, increases regional
industrial output growth, but it also increases regional budget deficits.
VII. Conclusions
Building on the theory of market-preserving federalism, this paper studies the changing
central-local relationship in China and its impact on market development. Many
anecdotes suggest the importance of decentralization and government incentives in the
previous studies on China's reforms (for example, Montinola, Qian, and Weingast,
1995). The econometric results in this paper provide some systematic evidence on the
importance of decentralization and incentives. We find that fiscal decentralization and
51
fiscal incentives are generally conducive to local economic development. In contrast,
Communist Party control over personnel is not so conducive, despite its contributions
to macroeconomic stability.
Relying on the traditional theory of fiscal federalism, some economists criticize
China's decentralization and provincial "self-financing" on three grounds. First, some
argue decentralization and fiscal contracting seemed to create a variety of
microeconomic distortions (Wong, 1992). For example, decentralization may have
induced local governments into over-investment, duplication, regional market
protectionism, and more local bureaucratic interventions. Second, decentralization and
fiscal contracting seemed to have increased regional inequality due to the constraints
on revenue redistribution by the central government (Wong, 1991). Third, the fiscal
contracting system also greatly reduced the central government's ability to conduct
fiscal policy because it surrendered fiscal instruments and received fewer tax revenues
(Bahl and Wallace, 1992).
{YQ: I moved this sent to a new paragraph. We have to explain why we
conclude this and why the traditional fiscal federalism perspective is wrong.}}Focusing
on incentives of government, our results show that some of these criticisms of China's
decentralization and fiscal reform need to be qualified or even reconsidered.
52
Comparisons of local government incentives between China and Russia are
striking. There are of course many differences between the Chinese and Russian
transition paths, including political and historical reasons as well as initial conditions.
Our study of federalism, Chinese style, and the other studies on federalism, Russian
style, indicate that one crucial difference concerns the incentives provided for local
governments to pursue market-oriented reform. Therefore, discussions on transition
should go beyond the usual focus on stabilization, liberalization, and privatization to
pay more attention to the government's incentives and the institutional foundations
shaping them.
In closing, we raise two issues. First, our empirical findings demonstrate that
some aspects of the fiscal system in China were problematic and need further reforms.
We found that the contracting system was subjected to the problem of renegotiation,
as shown by the ratchet effects over time and ex post extra subsidies. We also found
that stronger fiscal incentives were associated with more credit available to local
governments, which could be a source of financial instability. While enormously
valuable during the transition period, the fiscal contracting system has shortcomings.
This suggests that this system is best viewed as a transitional arrangement. In fact,
China began to correct some of these problems with its 1994 fiscal and monetary
reforms. These new reforms replaced the fiscal contracting system with a rule-based
53
fiscal federal system and, at the same time, it also hardened local government budget
constraints by recentralizing monetary policy and restricting local governments' access
to credit. Evaluations of these new reforms await further research.
Second, our perspective yields an important cross-national prediction about
federalism and economic growth, in particular, a positive relationship between the
strength of fiscal incentives faced by lower-level governments and economic
performance. Countries with strong fiscal incentives are expected to experience
relatively high growth while those with low fiscal incentives are expected to experience
low or no growth. Whether this prediction holds empirically also awaits further work.
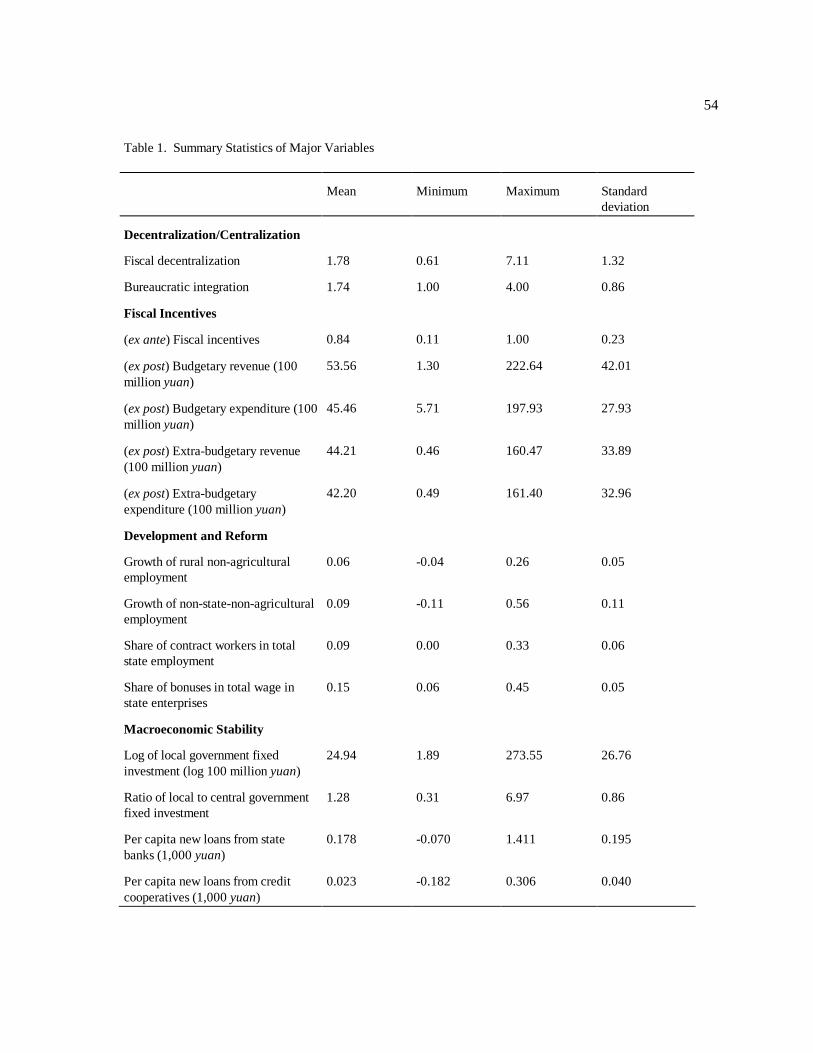
54
Table 1. Summary Statistics of Major Variables
Mean Minimum Maximum Standarddeviation
Decentralization/Centralization
Fiscal decentralization 1.78 0.61 7.11 1.32
Bureaucratic integration 1.74 1.00 4.00 0.86
Fiscal Incentives
(ex ante) Fiscal incentives 0.84 0.11 1.00 0.23
(ex post) Budgetary revenue (100million yuan)
53.56 1.30 222.64 42.01
(ex post) Budgetary expenditure (100million yuan)
45.46 5.71 197.93 27.93
(ex post) Extra-budgetary revenue(100 million yuan)
44.21 0.46 160.47 33.89
(ex post) Extra-budgetaryexpenditure (100 million yuan)
42.20 0.49 161.40 32.96
Development and Reform
Growth of rural non-agriculturalemployment
0.06 -0.04 0.26 0.05
Growth of non-state-non-agriculturalemployment
0.09 -0.11 0.56 0.11
Share of contract workers in totalstate employment
0.09 0.00 0.33 0.06
Share of bonuses in total wage instate enterprises
0.15 0.06 0.45 0.05
Macroeconomic Stability
Log of local government fixedinvestment (log 100 million yuan)
24.94 1.89 273.55 26.76
Ratio of local to central governmentfixed investment
1.28 0.31 6.97 0.86
Per capita new loans from statebanks (1,000 yuan)
0.178 -0.070 1.411 0.195
Per capita new loans from creditcooperatives (1,000 yuan)
0.023 -0.182 0.306 0.040
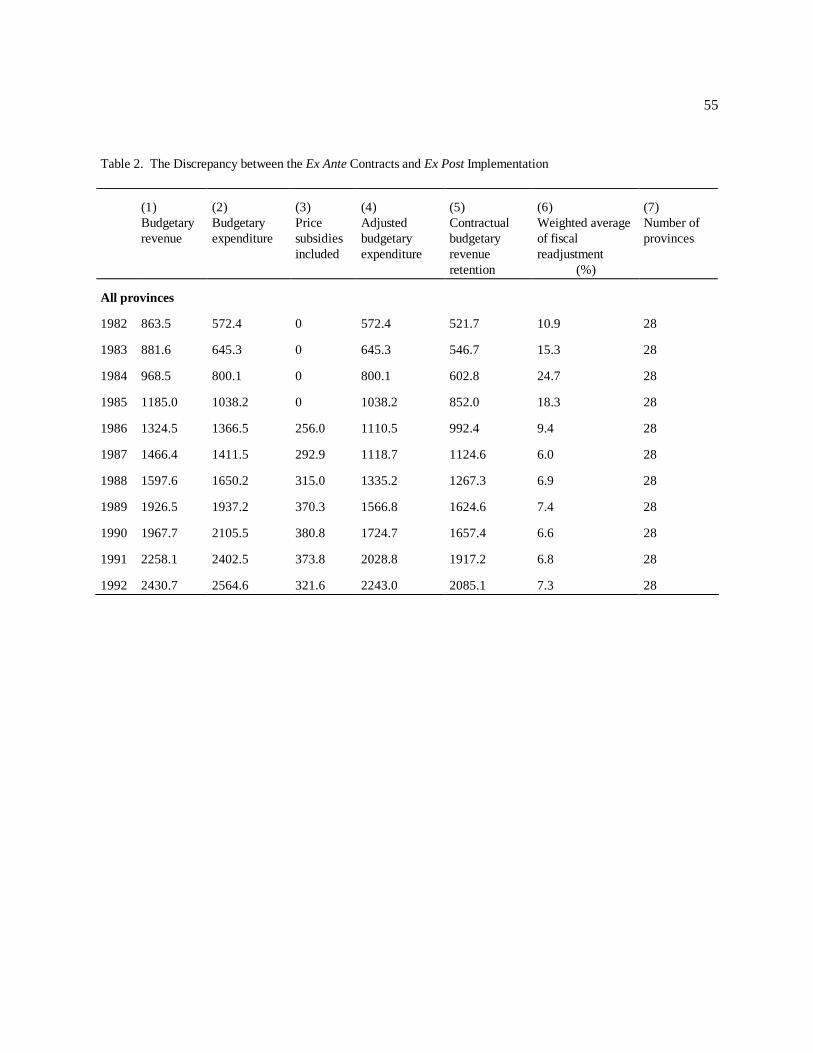
55
Table 2. The Discrepancy between the Ex Ante Contracts and Ex Post Implementation
(1)Budgetaryrevenue
(2)Budgetaryexpenditure
(3)Pricesubsidiesincluded
(4)Adjustedbudgetaryexpenditure
(5)Contractualbudgetaryrevenueretention
(6)Weighted averageof fiscalreadjustment
(%)
(7)Number ofprovinces
All provinces
1982 863.5 572.4 0 572.4 521.7 10.9 28
1983 881.6 645.3 0 645.3 546.7 15.3 28
1984 968.5 800.1 0 800.1 602.8 24.7 28
1985 1185.0 1038.2 0 1038.2 852.0 18.3 28
1986 1324.5 1366.5 256.0 1110.5 992.4 9.4 28
1987 1466.4 1411.5 292.9 1118.7 1124.6 6.0 28
1988 1597.6 1650.2 315.0 1335.2 1267.3 6.9 28
1989 1926.5 1937.2 370.3 1566.8 1624.6 7.4 28
1990 1967.7 2105.5 380.8 1724.7 1657.4 6.6 28
1991 2258.1 2402.5 373.8 2028.8 1917.2 6.8 28
1992 2430.7 2564.6 321.6 2243.0 2085.1 7.3 28

56
Table 3. Extra Remittances vs. Extra Subsidies
(1)Budgetaryrevenue
(2)Budgetaryexpenditure
(3)Pricesubsidiesincluded
(4)Adjustedbudgetaryexpenditure
(5)Contractualbudgetaryrevenueretention
(6)Weighted averageof fiscalreadjustment (%)
(7)Number ofprovinces
Provinces paying extra remittance (adjusted budgetary expenditure < contractual revenue retention)
1982 193.4 110.1 0 110.1 116.0 -5.3 6
1983 0 0 0 0 0 N/A 0
1984 0 0 0 0 0 N/A 0
1985 184.2 46.1 0 46.1 47.9 -4.0 1
1986 79.8 82.9 16.3 66.6 72.0 -6.6 1
1987 611.5 702.8 150.9 551.9 597.2 -6.5 14
1988 418.2 392.6 79.1 313.4 336.6 -5.9 6
1989 1368.3 1313.7 259.4 1054.3 1155.1 -7.7 19
1990 873.7 827.3 149.8 677.6 713.5 -4.3 10
1991 694.4 742.2 107.8 634.4 660.2 -3.5 7
1992 591.7 596.4 60.0 536.4 550.8 -2.4 4
Provinces receiving extra subsidies (adjusted budgetary expenditure > contractual revenue retention)
1982 670.2 462.3 0 462.3 405.8 12.2 22
1983 881.6 645.3 0 645.3 546.7 15.3 28
1984 968.5 800.1 0 800.1 602.8 24.7 28
1985 1000.7 992.1 0 992.1 804.1 19.0 27
1986 1244.7 1283.6 239.7 1043.9 920.4 9.6 27
1987 855.0 708.8 142.0 555.8 527.4 5.6 14
1988 1179.4 1257.6 235.8 1021.8 930.7 7.3 22
1989 558.3 623.5 111.0 512.5 469.5 6.9 10
1990 1093.9 1278.2 231.0 1047.1 944.0 8.1 19
1991 1563.8 1660.4 266.0 1394.4 1256.9 8.3 22
1992 1839.0 1968.3 261.7 1706.6 1534.3 8.8 25
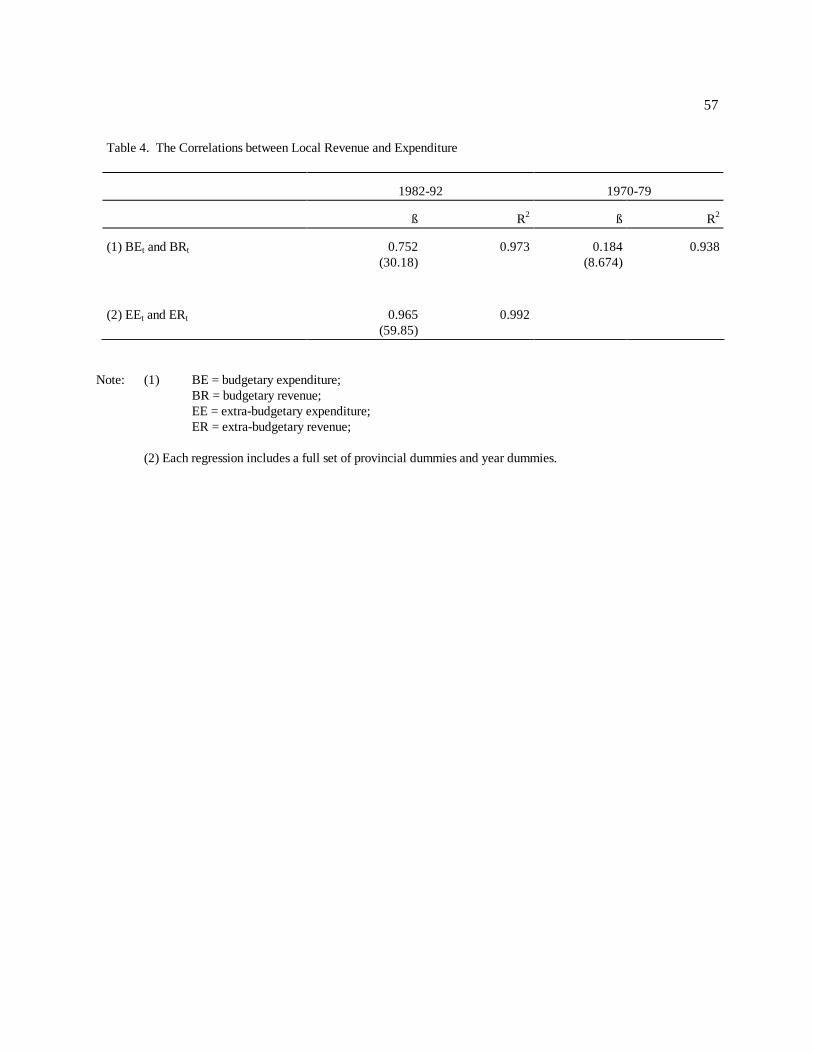
57
Table 4. The Correlations between Local Revenue and Expenditure
1982-92 1970-79
ß R2 ß R2
(1) BEt and BRt 0.752(30.18)
0.973 0.184(8.674)
0.938
(2) EEt and ERt 0.965(59.85)
0.992
Note: (1) BE = budgetary expenditure;BR = budgetary revenue;EE = extra-budgetary expenditure;ER = extra-budgetary revenue;
(2) Each regression includes a full set of provincial dummies and year dummies.
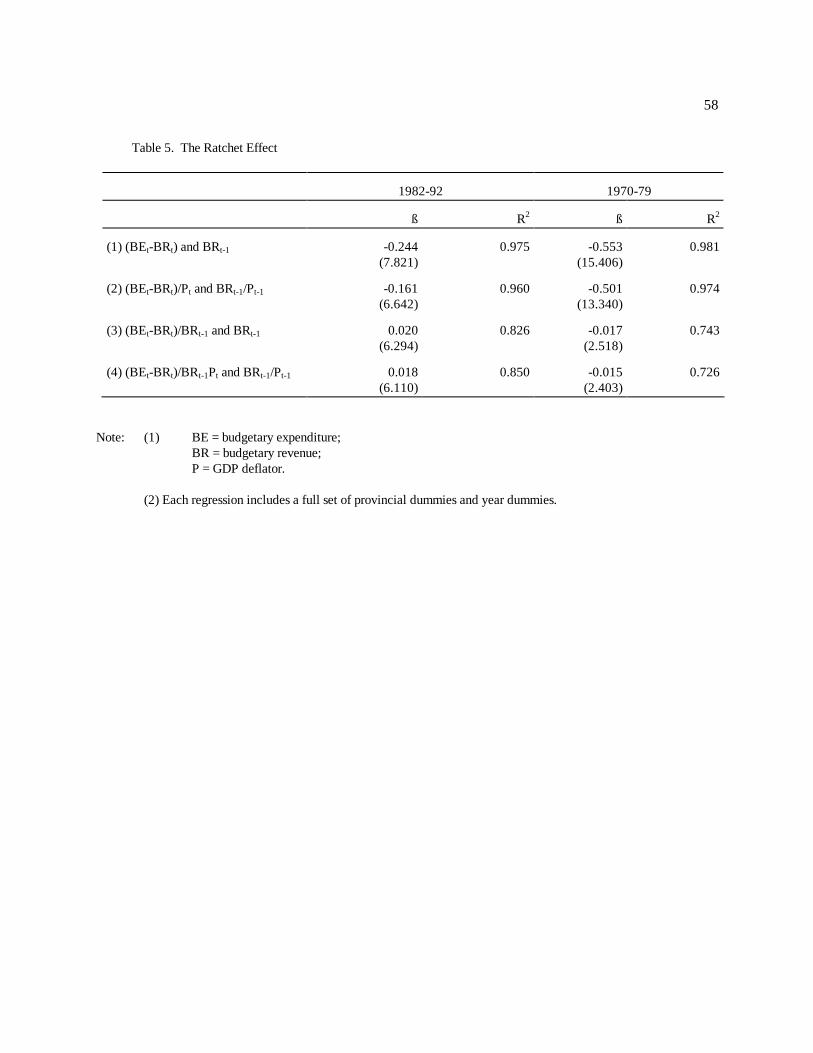
58
Table 5. The Ratchet Effect
1982-92 1970-79
ß R2 ß R2
(1) (BEt-BRt) and BRt-1 -0.244(7.821)
0.975 -0.553(15.406)
0.981
(2) (BEt-BRt)/Pt and BRt-1/Pt-1 -0.161(6.642)
0.960 -0.501(13.340)
0.974
(3) (BEt-BRt)/BRt-1 and BRt-1 0.020(6.294)
0.826 -0.017(2.518)
0.743
(4) (BEt-BRt)/BRt-1Pt and BRt-1/Pt-1 0.018(6.110)
0.850 -0.015(2.403)
0.726
Note: (1) BE = budgetary expenditure;BR = budgetary revenue;P = GDP deflator.
(2) Each regression includes a full set of provincial dummies and year dummies.
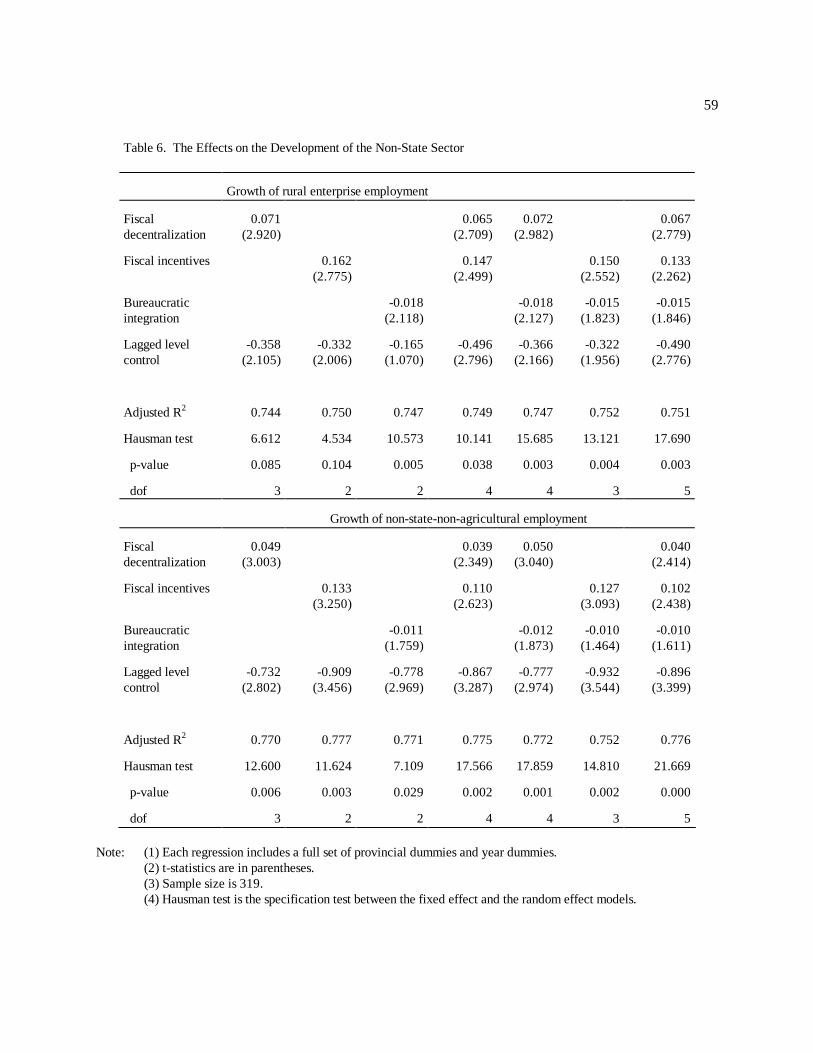
59
Table 6. The Effects on the Development of the Non-State Sector
Growth of rural enterprise employment
Fiscaldecentralization
0.071(2.920)
0.065(2.709)
0.072(2.982)
0.067(2.779)
Fiscal incentives 0.162(2.775)
0.147(2.499)
0.150(2.552)
0.133(2.262)
Bureaucraticintegration
-0.018(2.118)
-0.018(2.127)
-0.015(1.823)
-0.015(1.846)
Lagged levelcontrol
-0.358(2.105)
-0.332(2.006)
-0.165(1.070)
-0.496(2.796)
-0.366(2.166)
-0.322(1.956)
-0.490(2.776)
Adjusted R2 0.744 0.750 0.747 0.749 0.747 0.752 0.751
Hausman test 6.612 4.534 10.573 10.141 15.685 13.121 17.690
p-value 0.085 0.104 0.005 0.038 0.003 0.004 0.003
dof 3 2 2 4 4 3 5
Growth of non-state-non-agricultural employment
Fiscaldecentralization
0.049(3.003)
0.039(2.349)
0.050(3.040)
0.040(2.414)
Fiscal incentives 0.133(3.250)
0.110(2.623)
0.127(3.093)
0.102(2.438)
Bureaucraticintegration
-0.011(1.759)
-0.012(1.873)
-0.010(1.464)
-0.010(1.611)
Lagged levelcontrol
-0.732(2.802)
-0.909(3.456)
-0.778(2.969)
-0.867(3.287)
-0.777(2.974)
-0.932(3.544)
-0.896(3.399)
Adjusted R2 0.770 0.777 0.771 0.775 0.772 0.752 0.776
Hausman test 12.600 11.624 7.109 17.566 17.859 14.810 21.669
p-value 0.006 0.003 0.029 0.002 0.001 0.002 0.000
dof 3 2 2 4 4 3 5
Note: (1) Each regression includes a full set of provincial dummies and year dummies.(2) t-statistics are in parentheses.(3) Sample size is 319.(4) Hausman test is the specification test between the fixed effect and the random effect models.
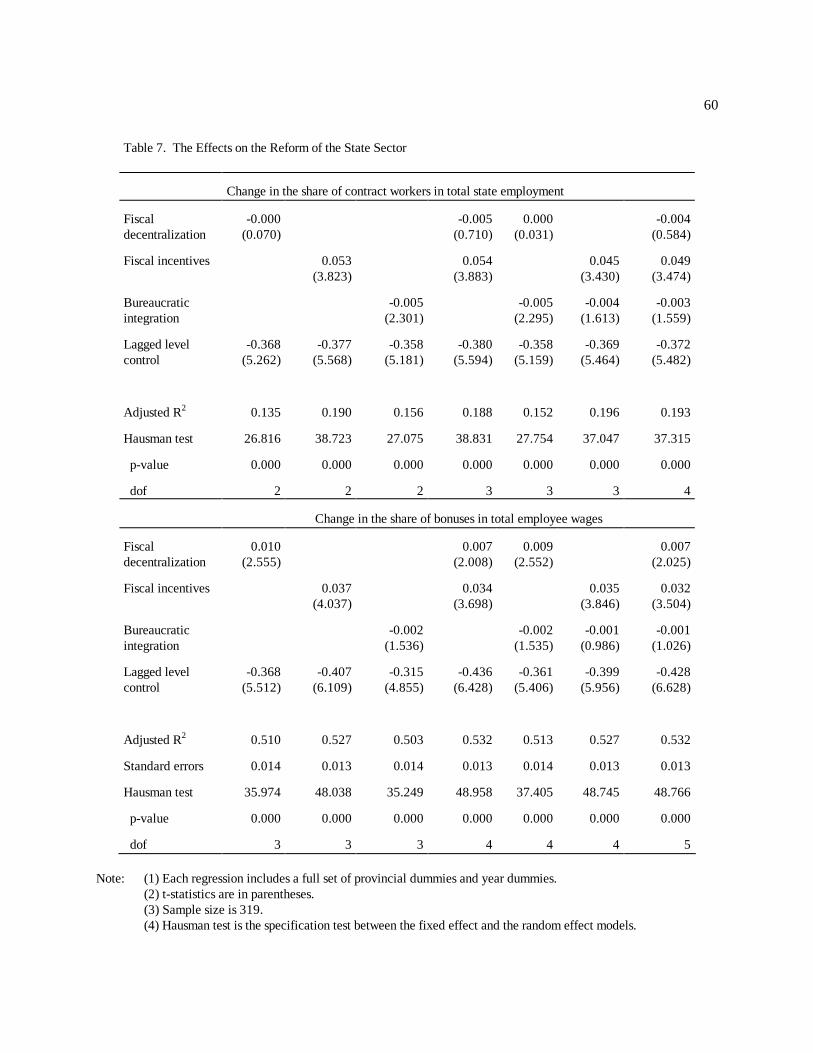
60
Table 7. The Effects on the Reform of the State Sector
Change in the share of contract workers in total state employment
Fiscaldecentralization
-0.000(0.070)
-0.005(0.710)
0.000(0.031)
-0.004(0.584)
Fiscal incentives 0.053(3.823)
0.054(3.883)
0.045(3.430)
0.049(3.474)
Bureaucraticintegration
-0.005(2.301)
-0.005(2.295)
-0.004(1.613)
-0.003(1.559)
Lagged levelcontrol
-0.368(5.262)
-0.377(5.568)
-0.358(5.181)
-0.380(5.594)
-0.358(5.159)
-0.369(5.464)
-0.372(5.482)
Adjusted R2 0.135 0.190 0.156 0.188 0.152 0.196 0.193
Hausman test 26.816 38.723 27.075 38.831 27.754 37.047 37.315
p-value 0.000 0.000 0.000 0.000 0.000 0.000 0.000
dof 2 2 2 3 3 3 4
Change in the share of bonuses in total employee wages
Fiscaldecentralization
0.010(2.555)
0.007(2.008)
0.009(2.552)
0.007(2.025)
Fiscal incentives 0.037(4.037)
0.034(3.698)
0.035(3.846)
0.032(3.504)
Bureaucraticintegration
-0.002(1.536)
-0.002(1.535)
-0.001(0.986)
-0.001(1.026)
Lagged levelcontrol
-0.368(5.512)
-0.407(6.109)
-0.315(4.855)
-0.436(6.428)
-0.361(5.406)
-0.399(5.956)
-0.428(6.628)
Adjusted R2 0.510 0.527 0.503 0.532 0.513 0.527 0.532
Standard errors 0.014 0.013 0.014 0.013 0.014 0.013 0.013
Hausman test 35.974 48.038 35.249 48.958 37.405 48.745 48.766
p-value 0.000 0.000 0.000 0.000 0.000 0.000 0.000
dof 3 3 3 4 4 4 5
Note: (1) Each regression includes a full set of provincial dummies and year dummies.(2) t-statistics are in parentheses.(3) Sample size is 319.(4) Hausman test is the specification test between the fixed effect and the random effect models.
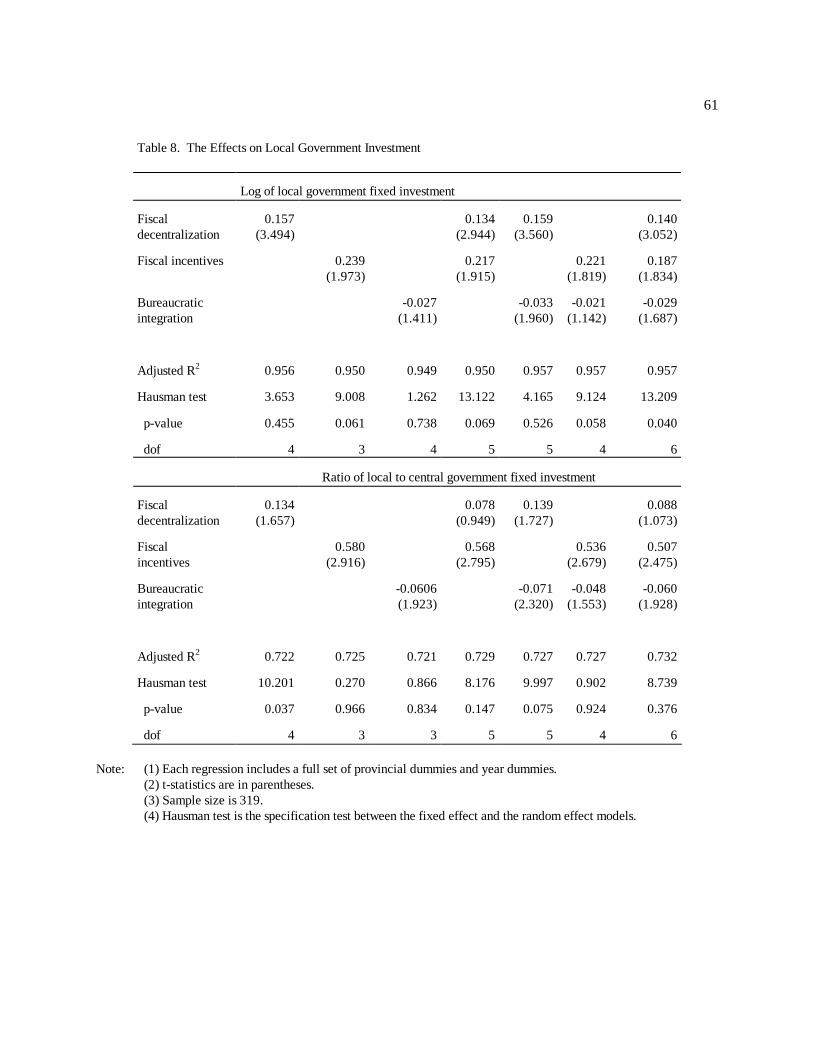
61
Table 8. The Effects on Local Government Investment
Log of local government fixed investment
Fiscaldecentralization
0.157(3.494)
0.134(2.944)
0.159(3.560)
0.140(3.052)
Fiscal incentives 0.239(1.973)
0.217(1.915)
0.221(1.819)
0.187(1.834)
Bureaucraticintegration
-0.027(1.411)
-0.033(1.960)
-0.021(1.142)
-0.029(1.687)
Adjusted R2 0.956 0.950 0.949 0.950 0.957 0.957 0.957
Hausman test 3.653 9.008 1.262 13.122 4.165 9.124 13.209
p-value 0.455 0.061 0.738 0.069 0.526 0.058 0.040
dof 4 3 4 5 5 4 6
Ratio of local to central government fixed investment
Fiscaldecentralization
0.134(1.657)
0.078(0.949)
0.139(1.727)
0.088(1.073)
Fiscalincentives
0.580(2.916)
0.568(2.795)
0.536(2.679)
0.507(2.475)
Bureaucraticintegration
-0.0606(1.923)
-0.071(2.320)
-0.048(1.553)
-0.060(1.928)
Adjusted R2 0.722 0.725 0.721 0.729 0.727 0.727 0.732
Hausman test 10.201 0.270 0.866 8.176 9.997 0.902 8.739
p-value 0.037 0.966 0.834 0.147 0.075 0.924 0.376
dof 4 3 3 5 5 4 6
Note: (1) Each regression includes a full set of provincial dummies and year dummies.(2) t-statistics are in parentheses.(3) Sample size is 319.(4) Hausman test is the specification test between the fixed effect and the random effect models.
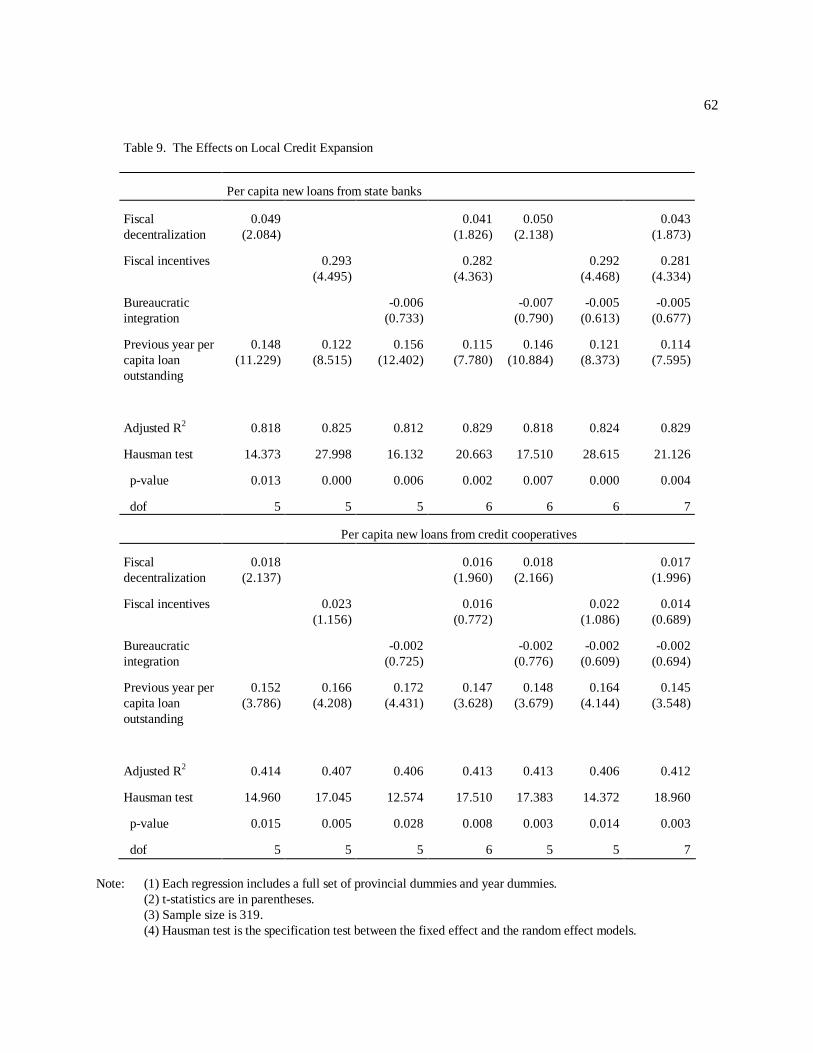
62
Table 9. The Effects on Local Credit Expansion
Per capita new loans from state banks
Fiscaldecentralization
0.049(2.084)
0.041(1.826)
0.050(2.138)
0.043(1.873)
Fiscal incentives 0.293(4.495)
0.282(4.363)
0.292(4.468)
0.281(4.334)
Bureaucraticintegration
-0.006(0.733)
-0.007(0.790)
-0.005(0.613)
-0.005(0.677)
Previous year percapita loanoutstanding
0.148(11.229)
0.122(8.515)
0.156(12.402)
0.115(7.780)
0.146(10.884)
0.121(8.373)
0.114(7.595)
Adjusted R2 0.818 0.825 0.812 0.829 0.818 0.824 0.829
Hausman test 14.373 27.998 16.132 20.663 17.510 28.615 21.126
p-value 0.013 0.000 0.006 0.002 0.007 0.000 0.004
dof 5 5 5 6 6 6 7
Per capita new loans from credit cooperatives
Fiscaldecentralization
0.018(2.137)
0.016(1.960)
0.018(2.166)
0.017(1.996)
Fiscal incentives 0.023(1.156)
0.016(0.772)
0.022(1.086)
0.014(0.689)
Bureaucraticintegration
-0.002(0.725)
-0.002(0.776)
-0.002(0.609)
-0.002(0.694)
Previous year percapita loanoutstanding
0.152(3.786)
0.166(4.208)
0.172(4.431)
0.147(3.628)
0.148(3.679)
0.164(4.144)
0.145(3.548)
Adjusted R2 0.414 0.407 0.406 0.413 0.413 0.406 0.412
Hausman test 14.960 17.045 12.574 17.510 17.383 14.372 18.960
p-value 0.015 0.005 0.028 0.008 0.003 0.014 0.003
dof 5 5 5 6 5 5 7
Note: (1) Each regression includes a full set of provincial dummies and year dummies.(2) t-statistics are in parentheses.(3) Sample size is 319.(4) Hausman test is the specification test between the fixed effect and the random effect models.
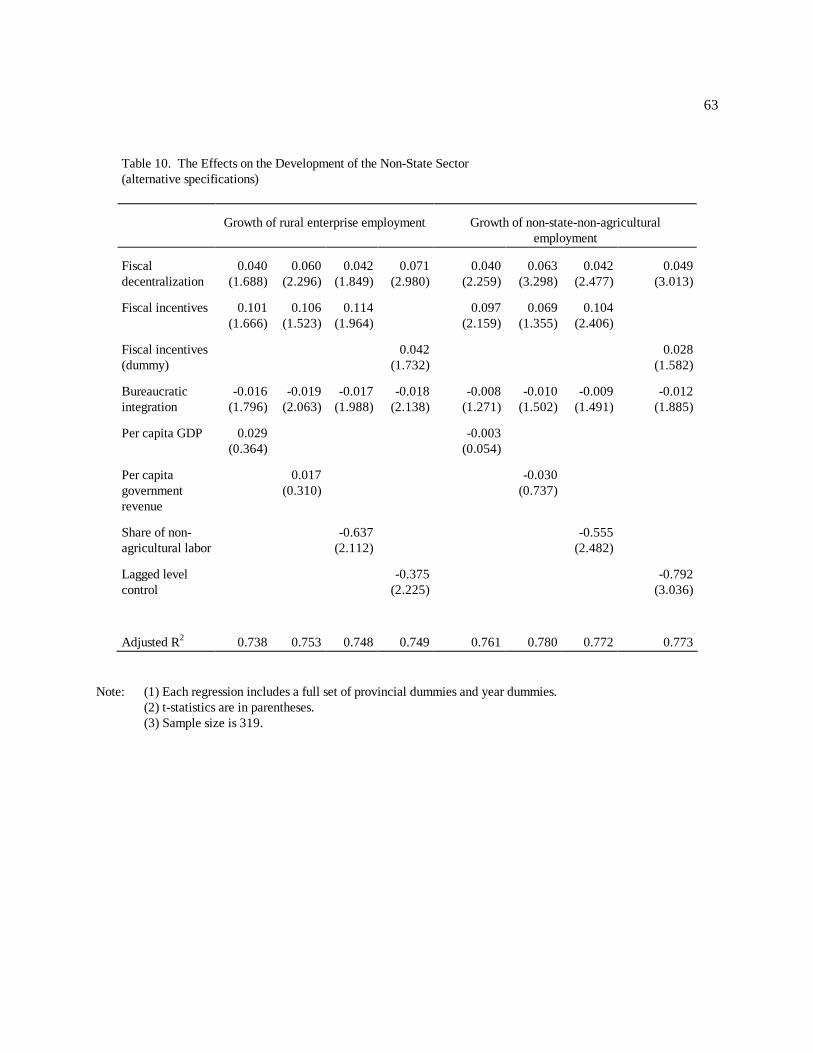
63
Table 10. The Effects on the Development of the Non-State Sector(alternative specifications)
Growth of rural enterprise employment Growth of non-state-non-agriculturalemployment
Fiscaldecentralization
0.040(1.688)
0.060(2.296)
0.042(1.849)
0.071(2.980)
0.040(2.259)
0.063(3.298)
0.042(2.477)
0.049(3.013)
Fiscal incentives 0.101(1.666)
0.106(1.523)
0.114(1.964)
0.097(2.159)
0.069(1.355)
0.104(2.406)
Fiscal incentives(dummy)
0.042(1.732)
0.028(1.582)
Bureaucraticintegration
-0.016(1.796)
-0.019(2.063)
-0.017(1.988)
-0.018(2.138)
-0.008(1.271)
-0.010(1.502)
-0.009(1.491)
-0.012(1.885)
Per capita GDP 0.029(0.364)
-0.003(0.054)
Per capitagovernmentrevenue
0.017(0.310)
-0.030(0.737)
Share of non-agricultural labor
-0.637(2.112)
-0.555(2.482)
Lagged levelcontrol
-0.375(2.225)
-0.792(3.036)
Adjusted R2 0.738 0.753 0.748 0.749 0.761 0.780 0.772 0.773
Note: (1) Each regression includes a full set of provincial dummies and year dummies.(2) t-statistics are in parentheses.(3) Sample size is 319.
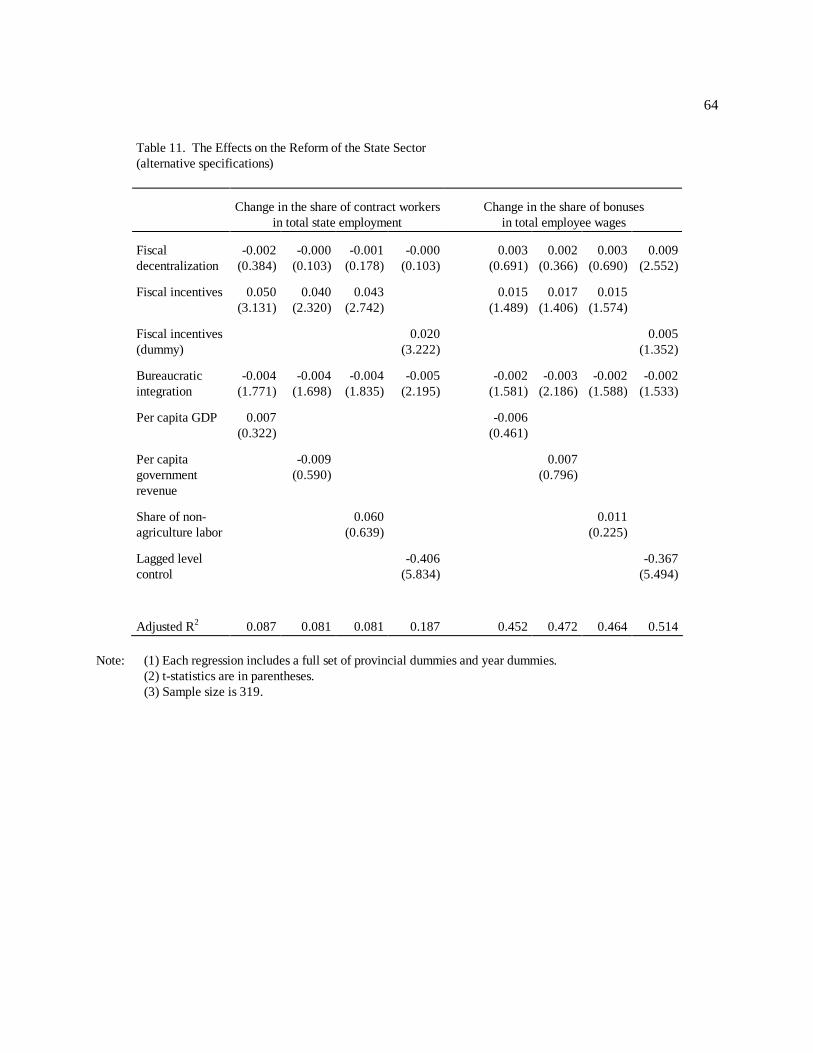
64
Table 11. The Effects on the Reform of the State Sector(alternative specifications)
Change in the share of contract workersin total state employment
Change in the share of bonusesin total employee wages
Fiscaldecentralization
-0.002(0.384)
-0.000(0.103)
-0.001(0.178)
-0.000(0.103)
0.003(0.691)
0.002(0.366)
0.003(0.690)
0.009(2.552)
Fiscal incentives 0.050(3.131)
0.040(2.320)
0.043(2.742)
0.015(1.489)
0.017(1.406)
0.015(1.574)
Fiscal incentives(dummy)
0.020(3.222)
0.005(1.352)
Bureaucraticintegration
-0.004(1.771)
-0.004(1.698)
-0.004(1.835)
-0.005(2.195)
-0.002(1.581)
-0.003(2.186)
-0.002(1.588)
-0.002(1.533)
Per capita GDP 0.007(0.322)
-0.006(0.461)
Per capitagovernmentrevenue
-0.009(0.590)
0.007(0.796)
Share of non-agriculture labor
0.060(0.639)
0.011(0.225)
Lagged levelcontrol
-0.406(5.834)
-0.367(5.494)
Adjusted R2 0.087 0.081 0.081 0.187 0.452 0.472 0.464 0.514
Note: (1) Each regression includes a full set of provincial dummies and year dummies.(2) t-statistics are in parentheses.(3) Sample size is 319.
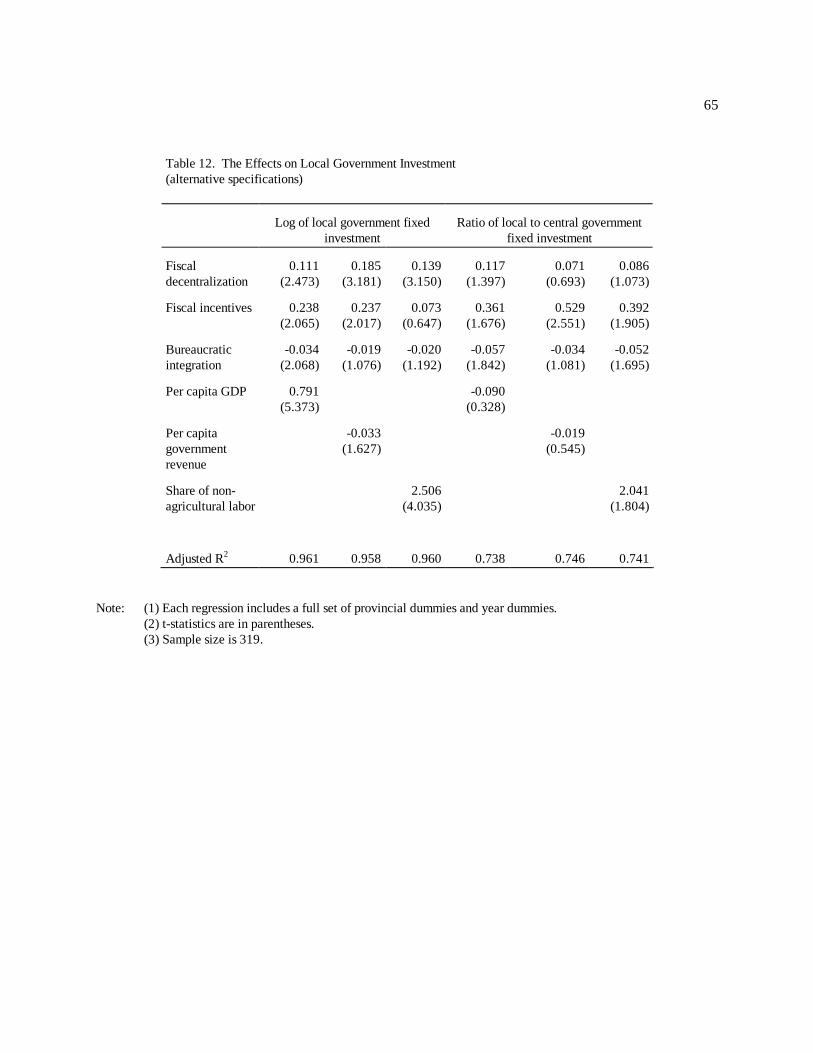
65
Table 12. The Effects on Local Government Investment(alternative specifications)
Log of local government fixedinvestment
Ratio of local to central governmentfixed investment
Fiscaldecentralization
0.111(2.473)
0.185(3.181)
0.139(3.150)
0.117(1.397)
0.071(0.693)
0.086(1.073)
Fiscal incentives 0.238(2.065)
0.237(2.017)
0.073(0.647)
0.361(1.676)
0.529(2.551)
0.392(1.905)
Bureaucraticintegration
-0.034(2.068)
-0.019(1.076)
-0.020(1.192)
-0.057(1.842)
-0.034(1.081)
-0.052(1.695)
Per capita GDP 0.791(5.373)
-0.090(0.328)
Per capitagovernmentrevenue
-0.033(1.627)
-0.019(0.545)
Share of non-agricultural labor
2.506(4.035)
2.041(1.804)
Adjusted R2 0.961 0.958 0.960 0.738 0.746 0.741
Note: (1) Each regression includes a full set of provincial dummies and year dummies.(2) t-statistics are in parentheses.(3) Sample size is 319.
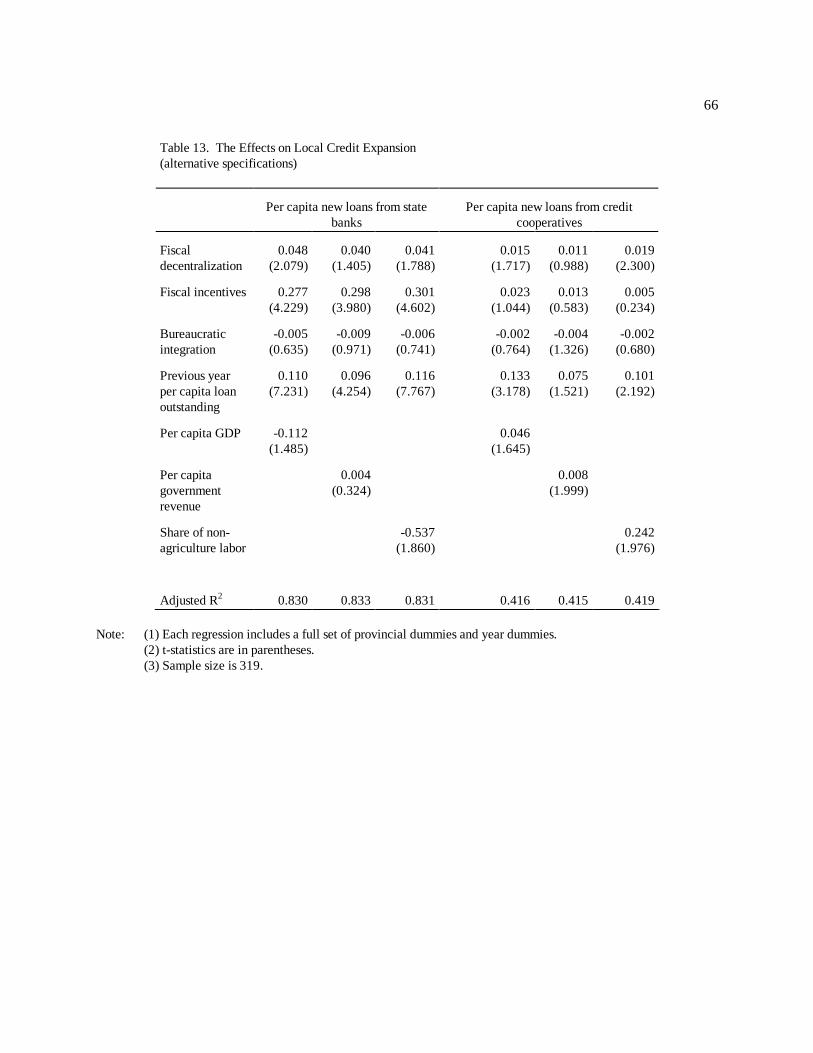
66
Table 13. The Effects on Local Credit Expansion(alternative specifications)
Per capita new loans from statebanks
Per capita new loans from creditcooperatives
Fiscaldecentralization
0.048(2.079)
0.040(1.405)
0.041(1.788)
0.015(1.717)
0.011(0.988)
0.019(2.300)
Fiscal incentives 0.277(4.229)
0.298(3.980)
0.301(4.602)
0.023(1.044)
0.013(0.583)
0.005(0.234)
Bureaucraticintegration
-0.005(0.635)
-0.009(0.971)
-0.006(0.741)
-0.002(0.764)
-0.004(1.326)
-0.002(0.680)
Previous yearper capita loanoutstanding
0.110(7.231)
0.096(4.254)
0.116(7.767)
0.133(3.178)
0.075(1.521)
0.101(2.192)
Per capita GDP -0.112(1.485)
0.046(1.645)
Per capitagovernmentrevenue
0.004(0.324)
0.008(1.999)
Share of non-agriculture labor
-0.537(1.860)
0.242(1.976)
Adjusted R2 0.830 0.833 0.831 0.416 0.415 0.419
Note: (1) Each regression includes a full set of provincial dummies and year dummies.(2) t-statistics are in parentheses.(3) Sample size is 319.
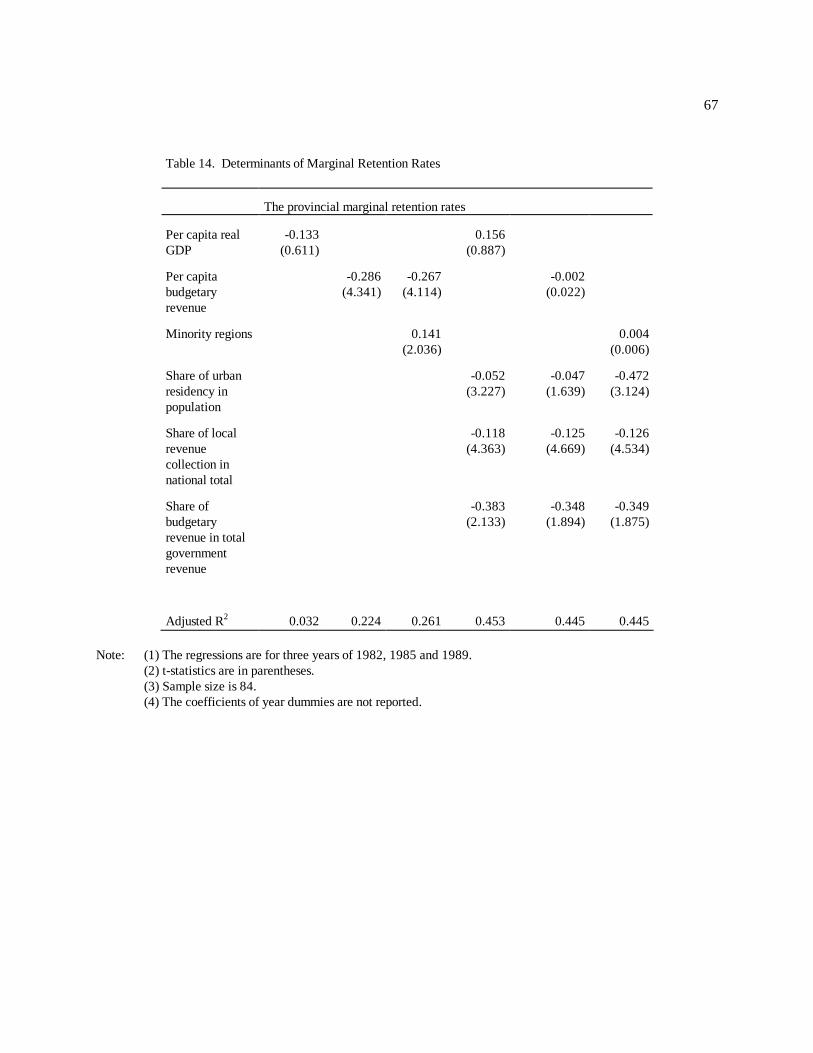
67
Table 14. Determinants of Marginal Retention Rates
The provincial marginal retention rates
Per capita realGDP
-0.133(0.611)
0.156(0.887)
Per capitabudgetaryrevenue
-0.286(4.341)
-0.267(4.114)
-0.002(0.022)
Minority regions 0.141(2.036)
0.004(0.006)
Share of urbanresidency inpopulation
-0.052(3.227)
-0.047(1.639)
-0.472(3.124)
Share of localrevenuecollection innational total
-0.118(4.363)
-0.125(4.669)
-0.126(4.534)
Share ofbudgetaryrevenue in totalgovernmentrevenue
-0.383(2.133)
-0.348(1.894)
-0.349(1.875)
Adjusted R2 0.032 0.224 0.261 0.453 0.445 0.445
Note: (1) The regressions are for three years of 1982, 1985 and 1989.(2) t-statistics are in parentheses.(3) Sample size is 84.(4) The coefficients of year dummies are not reported.
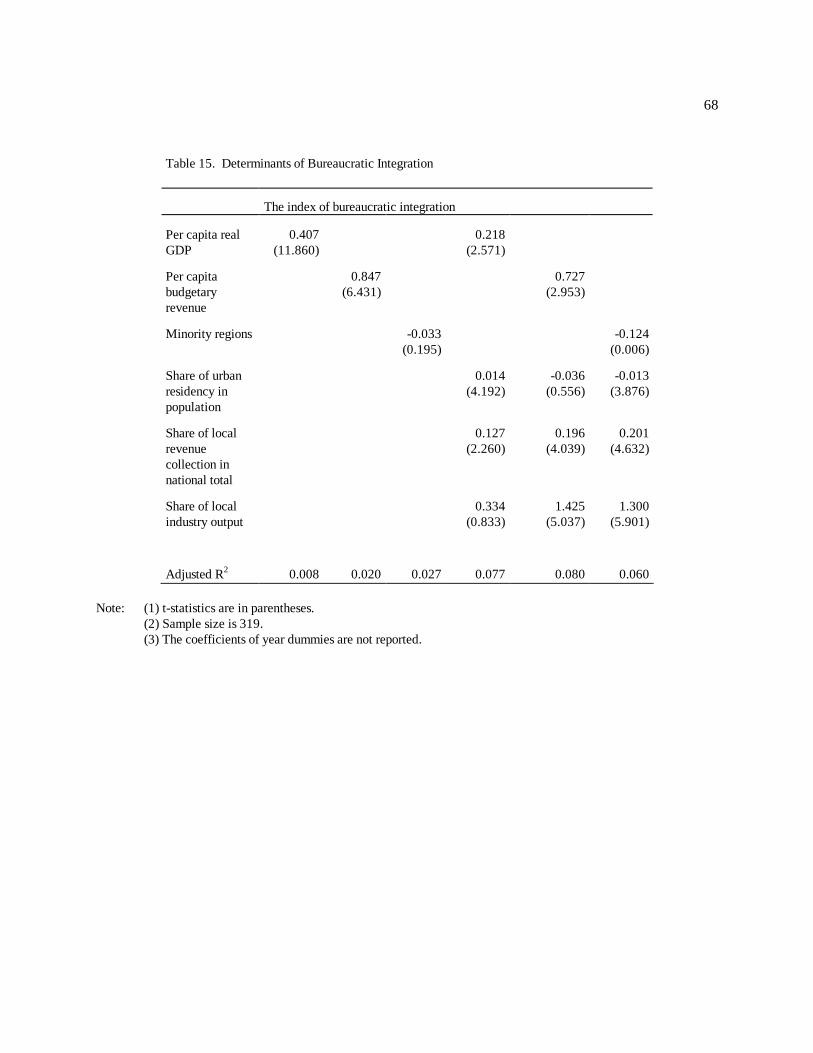
68
Table 15. Determinants of Bureaucratic Integration
The index of bureaucratic integration
Per capita realGDP
0.407(11.860)
0.218(2.571)
Per capitabudgetaryrevenue
0.847(6.431)
0.727(2.953)
Minority regions -0.033(0.195)
-0.124(0.006)
Share of urbanresidency inpopulation
0.014(4.192)
-0.036(0.556)
-0.013(3.876)
Share of localrevenuecollection innational total
0.127(2.260)
0.196(4.039)
0.201(4.632)
Share of localindustry output
0.334(0.833)
1.425(5.037)
1.300(5.901)
Adjusted R2 0.008 0.020 0.027 0.077 0.080 0.060
Note: (1) t-statistics are in parentheses.(2) Sample size is 319.(3) The coefficients of year dummies are not reported.
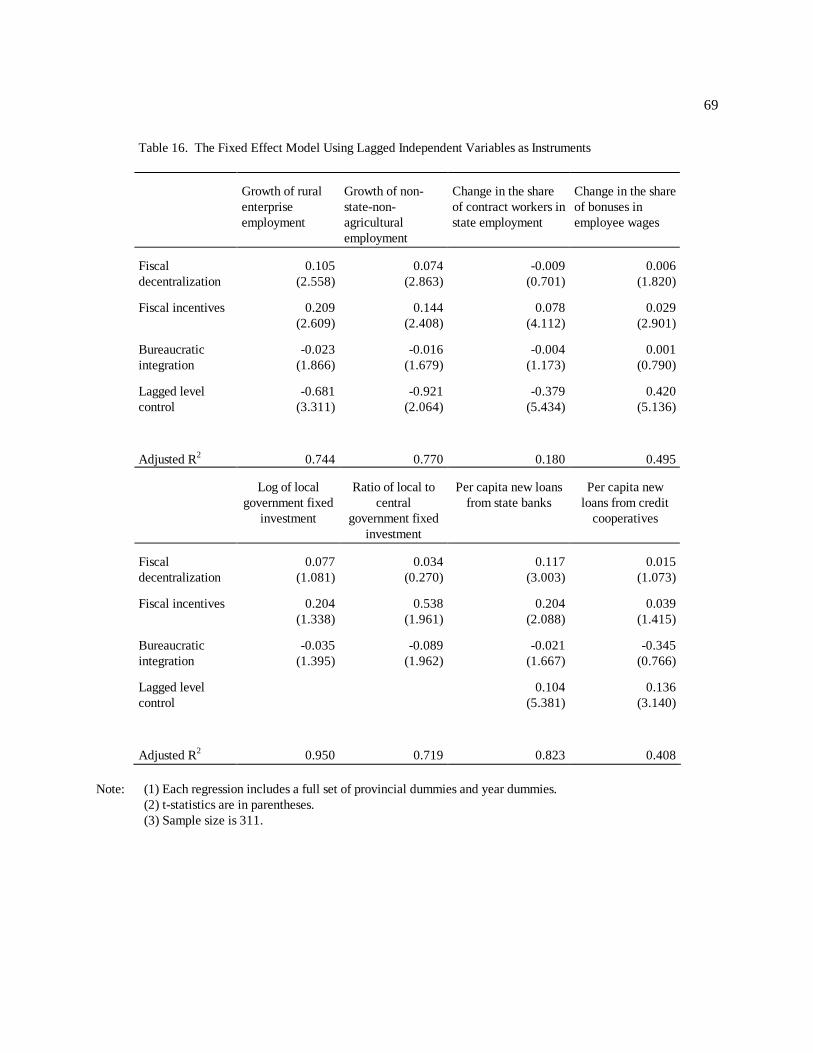
69
Table 16. The Fixed Effect Model Using Lagged Independent Variables as Instruments
Growth of ruralenterpriseemployment
Growth of non-state-non-agriculturalemployment
Change in the shareof contract workers instate employment
Change in the shareof bonuses inemployee wages
Fiscaldecentralization
0.105(2.558)
0.074(2.863)
-0.009(0.701)
0.006(1.820)
Fiscal incentives 0.209(2.609)
0.144(2.408)
0.078(4.112)
0.029(2.901)
Bureaucraticintegration
-0.023(1.866)
-0.016(1.679)
-0.004(1.173)
0.001(0.790)
Lagged levelcontrol
-0.681(3.311)
-0.921(2.064)
-0.379(5.434)
0.420(5.136)
Adjusted R2 0.744 0.770 0.180 0.495
Log of localgovernment fixed
investment
Ratio of local tocentral
government fixedinvestment
Per capita new loansfrom state banks
Per capita newloans from credit
cooperatives
Fiscaldecentralization
0.077(1.081)
0.034(0.270)
0.117(3.003)
0.015(1.073)
Fiscal incentives 0.204(1.338)
0.538(1.961)
0.204(2.088)
0.039(1.415)
Bureaucraticintegration
-0.035(1.395)
-0.089(1.962)
-0.021(1.667)
-0.345(0.766)
Lagged levelcontrol
0.104(5.381)
0.136(3.140)
Adjusted R2 0.950 0.719 0.823 0.408
Note: (1) Each regression includes a full set of provincial dummies and year dummies.(2) t-statistics are in parentheses.(3) Sample size is 311.
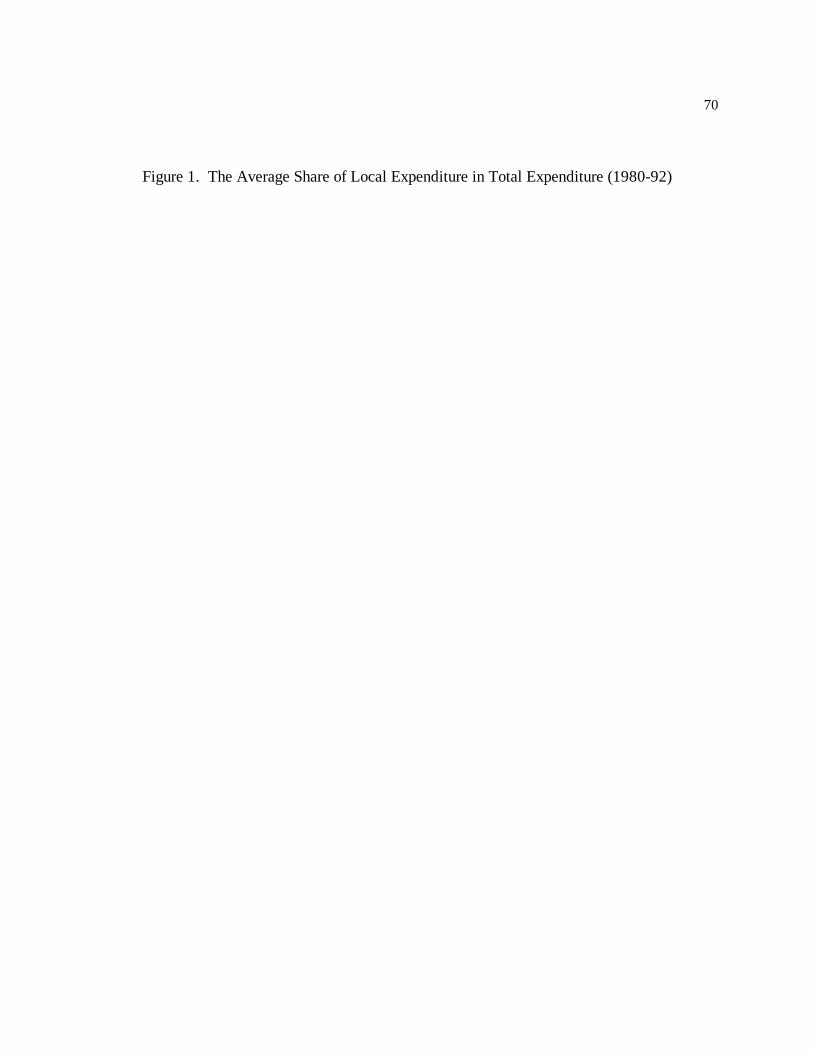
70
Figure 1. The Average Share of Local Expenditure in Total Expenditure (1980-92)

71
Figure 2. The Average Level of Bureaucratic Integration (1980-92)

72
Figure 3. Provincial Marginal Revenue Retention Rates (1980-92)
73
References
Bahl, Roy, and Christine Wallich. "Intergovernmental Fiscal Relations in China," Working Papers,Country Economics Department, The World Bank, WPS 863, 1992.
Brennan, Geoffrey, and James M. Buchanan. The Power to Tax: Analytical Foundations of a FiscalConstitution. New York: Cambridge University Press, 1980.
Chang, Chun; and Yijiang Wang. "Economic Transition under a Semi-Federalist Government: TheExperience of China." China Economic Review, Spring, 1998, 9(1), pp. 1-23.
Chen, Rulong (ed.). The Fiscal System in Contemporary China (Dangdai Zhongguo Caizheng),Beijing: China Social Science Press, 1988.
Epple, Dennis, and Alan Zelenitz. "The Implications of Competition Among Jurisdictions: DoesTiebout Need Politics." Journal of Political Economy, 1981, 89, pp. 1197-1217.
Fan, Gang. "New Norms in Public Revenue and Expenditure," in Shuguang Zhang (ed.), CaseStudies in China's Institutional Change, Shanghai People's Publishing House, 1996.
Freinkman, Lev, and Plamen Yossifov. "Decentralization in Regional Fiscal Systems in Russia:Trends and Links to Economic Performance." Mimeo, the World Bank, 1998.
Frye, Timothy, and Andrei Shleifer, "The Invisible Hand and the Grabbing Hand." AmericanEconomic Review, May 1997, 87, pp. 354-358.
Groves, Theodore, Yongmiao Hong, John McMillan, and Barry Naughton. "Autonomy andIncentives in Chinese State Enterprises," Quarterly Journal of Economics, 1994, 109(1), pp.183-209.
Hayek, Friedrich A. "The Use of Knowledge in Society." American Economic Review, 35, pp. 519-30, 1945.
Hofman, Bert. "An Analysis of Chinese Fiscal Data over the Reform Period." China EconomicReview, 1993, 4(2), pp. 213-230.
Hsiao, Cheng. Analysis of Panel Data. Cambridge: Cambridge University Press, 1986.
Huang, Yasheng. Inflation and Investment Controls in China: The Political Economy of Central-Local Relations During the Reform Era. Cambridge: Cambridge University Press, 1996.
Huther, Jeffrey; and Shah, Anwar. "Applying a Simple Measure of Good Governance to the Debateon Fiscal Decentralization." Policy Research Working Paper 1894. The World Bank, 1998.
74
Inman, Robert. "Federal Assistance and Local Services in the United States: The Evolution of a NewFiscal Order," in H. Rosen (ed.), Fiscal Federalism: Quantitative Studies. Chicago:University of Chicago Press, 1988.
Inman, Robert P., and Daniel L. Rubinfeld. “The Political Economy of Federalism,” in Dennis C.Meuller (ed.), Perspectives on Public Choice. New York: Cambridge University Press, 1997.
Knight, John; and Shi Li. "Fiscal Decentralization: Incentives, Redistribution and Reform in China." Oxford Development Studies, 27(1), 1999, pp.5-32.
Kornai, Janos. "The Soft Budget Constraints," KYKLOS, 1986, 39(1), pp. 3-30.
McKinnon, Ronald. "Market-Preserving Federalism in the American Monetary Union," in M. Blejerand T. Ter-Minassian (eds.), Macroeconomic Dimensions of Public Finance: Essays inHonour of Vito Tanzi. London: Boutledge, 1997, pp. 73-93.
Montinola, Gabriella, Yingyi Qian, and Barry Weingast. "Federalism, Chinese Style: The PoliticalBasis for Economic Success in China," World Politics, October, 1995, 48(1), pp. 50-81.
Musgrave, Richard, Theory of Public Finance: A Study in Public Economy, New York: McGraw,1959.
Oates, Wallace. Fiscal Federalism, New York: Harcourt Brace Jovanovich, 1972.
Oates, Wallace. "Searching for Leviathan: An Empirical Study." American Economic Review. 75:748-57, 1985.
Oksenberg, Michel, and Tong, James. "The Evolution of Central-Provincial Fiscal Relations in China,1971-1984: The Formal System." China Quarterly, March 1991, pp.
Parikh, and Barry R. Weingast. "A Comparative Theory of Federalism: The Case of India." VirginiaLaw Review, October 1997, 83, pp. 1593-1615.
Qian, Yingyi, and Gerard Roland. "Federalism and the Soft Budget Constraint," American EconomicReview, December 1998, 88(5), pp. 1143-1162.
Qian, Yingyi, and Barry R. Weingast. "China's Transition to Markets: Market-Preserving Federalism,Chinese Style," Journal of Policy Reform, 1996, 1, pp. 149-185.
Qian, Yingyi, and Barry R. Weingast. "Federalism As a Commitment to Market Incentives," Journalof Economic Perspectives, Fall 1997, 11(4), pp. 83-92.
75
Shleifer, Andrei. "Government in Transition." European Economic Review, 1997, 41, pp. 385-410.
State Statistical Bureau. China Regional Economy: A Profile of 17 Years of Reform and Opening-Up, Beijing: China Statistical Press, 1997.
Tiebout, Charles. "A Pure Theory of Local Expenditures." Journal of Political Economy, 1956, 64,pp. 416-24.
Weingast, Barry R. "The Economic Role of Political Institutions: Market-Preserving Federalism andEconomic Growth," Journal of Law, Economics, and Organization, April 1995, 11, pp. 1-31.
Weitzman, Martin. "The Ratchet Principle and Performance Incentives." Bell Journal of Economics,1980.
Wildasin, David E. "Externalities and Bailouts: Hard and Soft Budget Constraints in Inter-Governmental Fiscal Relations," mimeo, Vanderbilt University, 1997.
Wong, Christine P.W. "Central-Local Relations in an Era of Fiscal Decline: The Paradox of FiscalDecentralization in Post-Mao China." China Quarterly, December 1991, pp. 691-715.
Wong, Christine P.W. "Fiscal Reform and Local Industrialization: The Problematic Sequencing ofReform in Post-Mao China." Modern China, April 1992, 18(2), pp. 197-227.
Wong, Christine P.W. (eds.). Financing Local Government in the People's Republic of China. Hong Kong: Oxford University Press, 1997.
World Bank. The Chinese Economy: Fighting Inflation, Deepening Reforms, A World BankCountry Study, Washington, D.C., 1996.
Xu, Chenggang, and Juzhong Zhuang. "Why China Grew: The Role of Decentralization," in PeterBoone, Stanislaw Gomulka, and Richard Layard (eds.), Emerging from Communism: Lessonsfrom Russia, China, and Eastern Europe, Cambridge: MIT Press, 1998.
Zhang, Tao, and Heng-fu Zou. "Fiscal Decentralization, Public Spending, and Economic Growth inChina." Journal of Public Economics, 1998, 67, pp. 221-240.
Zhuravskaya, Ekaterina V. "Incentives to Provide Local Public Goods: Fiscal Federalism, RussianStyle." Journal of Public Economics, 2000, forthcoming.