fiscal decentralization in the russian federation
TRANSCRIPT

International Studies Program
Working Paper 99-3July 1999
Fiscal Decentralizationin the RussianFederation during theTransition
Jorge Martinez-VazquezL.F. Jameson Boex

We would like to thank Roy Bahl, Michael Bell, Richard Bird, Lev Freinkman, Albert Igudin,*
Galina Kourliandskaia, John Mikesell, Yelena Nikolayenko and Sally Wallace for their comments andmany helpful suggestions. We are grateful to Lev Freinkman, Stepan Titov and Alexander Morozov forsharing various data sets with us. This research was funded by the U.S. Agency for InternationalDevelopment under Georgia State University’s Russian Fiscal Reform Project and the World BankInstitute. The opinions expressed in this study are strictly the authors’ own, and should not be attributedto either USAID or the World Bank.
Fiscal Decentralization in the Russian Federationduring the Transition
Jorge Martinez-Vazquez and Jameson Boex *
Department of EconomicsSchool of Policy StudiesGeorgia State University
December 1998(Revised July 1999)

-i-
FISCAL DECENTRALIZATION IN THE RUSSIAN FEDERATIONDURING THE TRANSITION
Jorge Martinez-Vazquez and Jameson Boex
TABLE OF CONTENTS
LIST OF TABLES . . . . . . . . . . . . . . . . . . . . . . . . . . . . . . . . . . . . . . . . . . . . . . . . . . . . . . . . -iii-
CHAPTER ITHE DYNAMICS OF DECENTRALIZATION IN THE RUSSIAN FEDERATION -1-I.1 The Forces behind Decentralization in the Russian Federation . . . . . . . . . . . . . -2-I.2 A Historical Overview of Intergovernmental Fiscal Relations Since 1992 . . . . -6-I.3 The Role of Politics in the Decentralization Process . . . . . . . . . . . . . . . . . . . -10-I.4 Dimensions of Fiscal Decentralization in the Russian Federation . . . . . . . . . . -13-
CHAPTER IIEXPENDITURE RESPONSIBILITIES . . . . . . . . . . . . . . . . . . . . . . . . . . . . . . . . . -15-II.1 How Have Expenditures Been Assigned? . . . . . . . . . . . . . . . . . . . . . . . . . . . -15-II.2 How Has the System Performed ? . . . . . . . . . . . . . . . . . . . . . . . . . . . . . . . . . -22-II.3 Pending Policy Issues in Expenditure Assignments . . . . . . . . . . . . . . . . . . . . -26-
CHAPTER IIIREVENUE ASSIGNMENTS AND TAX ADMINISTRATION ISSUES . . . . . . . . -35-III.1 How Have Revenues Been Assigned? . . . . . . . . . . . . . . . . . . . . . . . . . . . . . . -35-III.2 Trends in Revenue Collections . . . . . . . . . . . . . . . . . . . . . . . . . . . . . . . . . . . -41-III.3 How Has the System Performed? . . . . . . . . . . . . . . . . . . . . . . . . . . . . . . . . . -44-III.4 The Role of Perverse Incentives and Soft Budget Constraints . . . . . . . . . . . . -49-III.5 The Role of Tax Administration . . . . . . . . . . . . . . . . . . . . . . . . . . . . . . . . . . -50-III.6 Pending Reform Agenda in Revenue Assignments . . . . . . . . . . . . . . . . . . . . . -52-
CHAPTER IVTHE SYSTEM OF TRANSFERS . . . . . . . . . . . . . . . . . . . . . . . . . . . . . . . . . . . . . . . . . . . . -58-
IV.1 Evolution of the System of Transfers . . . . . . . . . . . . . . . . . . . . . . . . . . . . . . -58-IV.2 The Current System of Transfers . . . . . . . . . . . . . . . . . . . . . . . . . . . . . . . . . -62-IV.3 How Has the Transfer System Performed? . . . . . . . . . . . . . . . . . . . . . . . . . . -66-IV.4 Pending Policy Agenda for the Reform of Transfers . . . . . . . . . . . . . . . . . . . -70-

-ii-
CHAPTER VSUBNATIONAL BORROWING, DEBT AND FINANCIAL CONTROLS . . . . . . -76-V.1 Evolution of the Legal Framework for Borrowing . . . . . . . . . . . . . . . . . . . . -76-V.2 Analysis of Subnational Deficits and Debts . . . . . . . . . . . . . . . . . . . . . . . . . . -77-V.3 Pending Policy Agenda for the Reform of Subnational Borrowing . . . . . . . . -82-
CHAPTER VIIMPLEMENTING REFORM . . . . . . . . . . . . . . . . . . . . . . . . . . . . . . . . . . . . . . . . . -86-VI.1 Piece-meal versus Unified Reform Strategy . . . . . . . . . . . . . . . . . . . . . . . . . . -86-VI.2 Uniform versus Asymmetric Federalism and Addressing Fiscal Disparities . . -87-VI.3 Compliance with the Federal Laws by the Regions . . . . . . . . . . . . . . . . . . . . -89-VI.4 Communications Between Federal and Regional Governments . . . . . . . . . . . -91-VI.5 Determining the Form of Fiscal Federalism . . . . . . . . . . . . . . . . . . . . . . . . . . -91-
REFERENCES . . . . . . . . . . . . . . . . . . . . . . . . . . . . . . . . . . . . . . . . . . . . . . . . . . . . . . . . . . -94-

-iii-
LIST OF TABLES
Table 1: Assignment of Expenditure Responsibilities in the Russian Federation in 1997 . . . . -98-
Table 2: Distribution of Expenditures Between the Levels of the Government, 1992-1997 . -99-
Table 3: Distribution of Expenditures Between the Levels of the Government, 1992-1997 -100-
Table 4: Distribution of Expenditures by Function Between the Levels of Government, 1992-1997 . . . . . . . . . . . . . . . . . . . . . . . . . . . . . . . . . . . . . -101-
Table 5: Average Regional Expenditures by Category, as Percent of Total Regional Expenditures, 1994-1997 . . . . . . . . . . . . . . . . . . . . . . . . . . . . . . . . . . . . . -102-
Table 6: Evaluation of Composition of Expenditures for Subnational Governments in Real Terms, 1992-1997 . . . . . . . . . . . . . . . . . . . . . . . . . . . . . . . . . . . . . . . . . . . -103-
Table 7: Regional Economic Disparities in the Russian Federation: Per Capita Gross Regional Product , Selected Years from 1992-1996 . . . . . . . . . . . . . . . . . . . . . . . . -104-
Table 8: Measures of Horizontal Fiscal Imbalance in the Russian Federation: Per Capita Consolidated Regional Expenditures, 1992-1997 . . . . . . . . . . . . . . . . . . . . . . . . . . -105-
Table 9: Level of Equalization at Different Stages of Revenue Assignment:Coefficient of Variation of Cumulative Per Capita Allocation, 1992-1997 . . . . . . . . -106-
Table 10: Regional Socio-Economic and Demographic Variables: Descriptive Statistics . . -107-
Table 11: Determinants of Per Capita Expenditures, 1994-1997 . . . . . . . . . . . . . . . . . . . . . -108-
Table 12: Determinants of Per Capita Expenditures on National Economy, 1994-1997 . . . -109-
Table 13: Determinants of Per Capita Expenditures on Housing and Public Utilities, 1994-1997 . . . . . . . . . . . . . . . . . . . . . . . . . . . . . . . . . . . . . . . . . . . . . . . . -110-
Table 14: Determinants of Per Capita Expenditures on Education, 1994-1997 . . . . . . . . . . -111-
Table 15: Determinants of Per Capita Expenditures on Public Health and Physical Education, 1994-1997 . . . . . . . . . . . . . . . . . . . . . . . . . . . . . . . . . . . . . . . -112-

-iv-
Table 16: Expenditure Assignment in the Budget Code, 1998 . . . . . . . . . . . . . . . . . . . . . . -113-
Table 17: Legislated Sharing Rates of Major Taxes in the Russian Federation . . . . . . . . . . -114-
Table 18: Status of Taxes in the Tax Code (1998) . . . . . . . . . . . . . . . . . . . . . . . . . . . . . . . -115-
Table 19: Own Revenues and Shared Revenues as a Percentage of Consolidated Subnational Collections (Excluding Transfers and Subventions) . . . . -116-
Table 20: Distribution of Revenues Between the Levels of Government, 1992-1997 . . . . . -117-
Table 21: Russia: Consolidated Subnational Own Source Revenue Collections, 1997 . . . . . -119-
Table 22: Summary of Legislative Control over Subnational Own Source Revenues . . . . . -120-
Table 23: Distribution of Revenues Between the Levels of the Government, 1992-1997 . . -121-
Table 24: Evaluation of Composition of Revenues for Subnational Governments in Real Terms, 1992-1997 . . . . . . . . . . . . . . . . . . . . . . . . . . . . . . . . . . . . . . . . . . . -122-
Table 25: Russia: Measures of Vertical Fiscal Imbalance for the Subnational Sector, 1997 . -123-
Table 26: Measures of Vertical Fiscal Imbalance for the Subnational Sector:An International Comparison . . . . . . . . . . . . . . . . . . . . . . . . . . . . . . . . . . . . . . . . . -124-
Table 27: Measures of Regional Fiscal Disparities in the Russian Federation:Per Capita Revenue Collections (including Federal Share), 1993-1997 . . . . . . . . . . -125-
Table 28: Concentration of Total Revenue Collections (Including Federal Share) Among Regions: Share of Total Revenues Collected by Selected Regions, 1993-1997 . . . . -126-
Table 29: Concentration of Regional Revenue Collections Among Regions:Share of Regional Revenues Collected by Selected Regions, 1992-1997 . . . . . . . . . -127-
Table 30: Analysis of Regional Natural Resource Tax (NRT) Collections, 1994-1997 . . . . -128-
Table 31: Fund for Financial Support of the Regions (FFSR) . . . . . . . . . . . . . . . . . . . . . . -129-
Table 32: Formula for Allocating FFSR Transfers, 1999 . . . . . . . . . . . . . . . . . . . . . . . . . . -131-

-v-
Table 33: Funding Sources for the Regions of the Russian Federation: Average Regional Funding by Source as Percent of Total Expenditures, 1992-1997 -132-
Table 34: Federal Transfers to the Regions, 1992-1997 . . . . . . . . . . . . . . . . . . . . . . . . . . . -133-
Table 35: Evaluation of Composition of Transfers for Subnational Governments in Real Terms, 1992-1997 . . . . . . . . . . . . . . . . . . . . . . . . . . . . . . . . . . . . . . . . . . . -134-
Table 36: Regression Analysis: Per Capita FFSR Transfers, 1994-1997 . . . . . . . . . . . . . . . -135-
Table 37: Regression Analysis: Per Capita Other Transfers (Excluding Budget Loans), 1994-1997 . . . . . . . . . . . . . . . . . . . . . . . . . . . . . . . . . . . . . . . . . . . . . . . . . -136-
Table 38: Regression Analysis: Allocation of (Per Capita) Regional Resources, 1994 . . . . . -137-
Table 39: Regression Analysis: Allocation of (Per Capita) Regional Resources, 1995 . . . . . -138-
Table 40: Regression Analysis: Allocation of (Per Capita) Regional Resources, 1996 . . . . . -139-
Table 41: Regression Analysis: Allocation of (Per Capita) Regional Resources, 1997 . . . . . -140-
Table 42: Explaining Tax Effort for Regional Collections, 1994-1997 . . . . . . . . . . . . . . . . -141-
Table 43: Explaining Tax Effort for Overall Collections (Including Federal Share), 1994-1997 . . . . . . . . . . . . . . . . . . . . . . . . . . . . . . . . . . . . . . . . . . . . . . . . . -142-
Table 44: Percent of the Executed Share of a Region in the FFSR . . . . . . . . . . . . . . . . . . . -143-
Table 45: Russia: Consolidated Budget Execution as Percent of GDP, 1992-1997 . . . . . . . -145-
Table 46: Relative Size of Subnational Debt: Comparison of Selected Countries . . . . . . . . -146-
Table 47: Regression Analysis: Per Capita “Other Sources of Financing”, 1994-1997 . . . . -147-

According to the Russian Constitution of 1993, the Russian Federation comprises 89 subnational1
regions or “subjects of the Federation,” including 49 oblasts, 21 republics, 6 krai and 2 cities (Moscow andSt. Petersburg). In addition, the Russian Federation contains 11 autonomous oblasts, or okrugs. Theseokrugs are actually sub-units within larger oblasts, but they are independent from these oblasts for fiscaland budgetary purposes. One of the 21 republics, Chechnya, for all intents and purposes is not aparticipating member of the federation and will therefore be left out of the current discussion. Hence, thereare 88 regions, or subjects of the Federation, with which the federal government maintains regular fiscalrelations. The term “oblast” is often used more broadly to refer to all regional governments, includingrepublics, krais, cities and okrugs.
-1-
CHAPTER ITHE DYNAMICS OF DECENTRALIZATION IN THE RUSSIAN FEDERATION
Intergovernmental fiscal relations may be the most contentious issue in the Russian Federationtoday. This is the result of the complexity of the problems intertwined with intergovernmental relations.These problems include the recent history of disintegration of the Soviet Union; the war in Chechnya; theethno-linguistic, religious and historical differences across its vast territory; great variations in theendowment of mineral resources; increasingly large economic and fiscal disparities across regions and localgovernments; and the spreading sentiment in some regions that they can be better off by seceding from theFederation. It is not an overstatement to say that the survival of the Russian nation itself depends on theestablishment of a system of intergovernmental fiscal relations that is functional and appropriate.
At the time of independence it was generally accepted that a federative form of government wasthe only political system that would fit the size and diversity of the country (Polishchuk, 1996). There wasless consensus on what form the federation should take. Since its conception, there has been overwhelmingand continued pressure for decentralization in Russia. However, the motivations behind this push fordecentralization have been both positive, such as the desire to achieve a more efficient and fair government,but in many cases also negative, resulting from a lack of national solidarity and regions intent on prevailingover common national interests. In an environment of political instability and economic transition, thenegative motives seem to have dominated the evolution of the system of intergovernmental relations inRussia.
There has been a significant difference between the legislated system of intergovernmental relationsand reality. On paper, a transparent and symmetric system of intergovernmental relations was developedin the years after the disintegration of the Soviet Union. Previously differentiated sharing rates for sharedtaxes were standardized and a formula-driven equalization mechanism was introduced to replace a systemof negotiated transfers, while Articles 71 and 72 of the Constitution assigned expenditure responsibilitiesbetween the federal government and the “subjects of the Federation.” In reality, there exists general1

Not everyone will agree with the definition of Russia’s regime as a federation. McLure et al.2
(1996) remark that the Russian Federation is a federation in little more than name because of the very fewlegal powers and the virtual lack of revenue autonomy of the regions. For instance, China, whose approachto intergovernmental relations is similar in many ways to Russia, is a unitary country. At the same time, inactuality many Russian regions on different occasions have claimed de facto powers akin to those of aconfederation, such as refusing to remit tax collections to the center or taking over the responsibilities ofthe federal government in the regions. This type of fiscal relation characterized by confrontation and at timeschaotic claims to power have been described as “fiscal feudalism” in Russia (Lavrov, 1998).
-2-
confusion, dissatisfaction and even open political conflict between the federal government and the regions(and in some cases, between the regions and local governments). Since independence from the SovietUnion, the federal government has struggled for power with the regional governments. This power strugglehas been facilitated by the ambiguity with which expenditure responsibilities are assigned in the Constitutionand the large number of bilateral fiscal arrangements between the federal government and individual regions,which together have watered down both the transparency as well as the symmetry in intergovernmentalfiscal relations in Russia.
I.1 The Forces behind Decentralization in the Russian Federation
The basic economic argument for decentralization in Russia is identical to that in other countries intransition, namely the failure of the socialist economic model and the centralized government control thatit represented. More generally, fiscal decentralization in Russia has been fueled by the belief thatdecentralization is an effective way for increasing the efficiency of government and strengthening democraticinstitutions. Until very recently, much less attention was paid to some of the risks associated with greaterdecentralization such as a more unequal distribution of resources and the possibility of compromisingmacroeconomic stability.
The dynamics of decentralization in Russia has involved elements of delegation, or a “top down”process by which the federal government has delegated a number of expenditure responsibilities to theregions which are subject to strict federal expenditure guidelines, while granting only very limited ownrevenue-raising abilities to subnational governments. The use of delegation as a means of decentralizationprovided both for continued centralized control over expenditures as well as providing federal budget relief,as delegation of expenditure responsibilities frequently did not come with adequate additional funding orassignment of additional revenue sources (Igudin, 1998). The process of decentralization in Russia alsocontains elements of devolution or the “bottom up” approach to decentralization, in which regionalgovernments have gained a constitutional right to govern their own affairs and to formulate and execute theirown budgets, with little meddling so far from the federal authorities. These elements give Russia featuresof a federal system. 2
This mix of decentralization models is conspicuous in the 1993 Constitution which is deliberatelyobscure regarding whether power originates at the center or in the regions (Teague, 1996). In reality,

Of the 21 ethnic republics only six actually have a majority ethnic population. In fact, in many of3
the 21 ethnic republics the majority of the population is Russian.
-3-
power is shared, but its division is far from having been decided. Given the basic unresolved issue of wherepower originates, a safety valve in the 1993 Constitution allowed the federal government to enter intobilateral treaties with regional governments. With the onset of the first treaties in 1994 it was clear that theregions could factually circumvent the Constitution (OECD, 1997 and Teague, 1996). This was alsoevidenced in the regional constitutions and statutes approved by the regional legislatures. The favorabletreatment given to ethnic republics, such as Tatarstan and Bashkortostan, created resentment and imitatorsamong many other regions. This has led to the evolution of asymmetric federalism in which some regionsare more equal than others in terms of the resources they get to keep rather than remit to the center.
Political Factors
The process of reform of the system of intergovernmental fiscal relations in Russia involves manyquestions and issues of an economic and technical nature, but this process has been and continues to beforemost a political process. The relevance of politics in the Russian Federation is without doubt connectedto its vast territory, very significant disparities in industrial development and resource endowments, and itsethno-linguistic diversity. These factors continue to exert significant centrifugal forces on the country. Thenatural case against these centrifugal forces should come from an integrated economy that allows growthand prosperity in a way that makes being part of the whole more beneficial than regional autonomy orindependence. Unfortunately, the transition to a market economy has failed so far to bring the requiredeconomic growth and prosperity to all or even to a majority of the regions.
As we recall, the Russian Federation was created out of the process of disintegration of the SovietUnion when Russia and other former Soviet republics refused to remit tax revenues to the Sovietgovernment in Moscow, proclaimed that their laws took precedence over Soviet laws and ultimatelydeclared themselves independent. This process led to a weak political start for the Russian Federationbecause it gave opportunity to the autonomous republics within Russia also to declare independence or toassert high degrees of autonomy (Teague, 1996). The assertiveness of the regions, especially the ethnicrepublics, to grab more power grew bolder during 1992-93 as the President and Parliament (the Supreme3
Soviet) were involved in a power struggle of their own.
As a stopgap measure the Federation Treaty was signed in March 1992 to regulate therelationships between the federal and regional governments, but two republics (Tatarstan andBashkortostan) refused to sign it. As would happen again with the 1993 Constitution, the Federation Treatyleft the issues of the division of power between the federal and regional governments unresolved. Althoughthe ethnic republics were given some additional powers in the Federation Treaty, these were taken awayin the 1993 Constitution.
Treisman (1996 and 1998b) and others have remarked on the important role that separatist4
demands have played in the actual flow of fiscal resources between the center and the regions in Russia.A pattern of favoring the 21 ethnic republics over the other regions in the form of larger subsidies,permission to retain a higher share of tax collections, and special decrees granting economic benefits, was
-4-
Increasingly, regional positions on federation issues and federal policies have been prone to splitalong the lines of “have” and “have-not” regions. These two groups are formed around the so-called“donor” regions, which contribute more in overall taxes than they get back in revenue sharing and transfers,and “subsidy” regions, which receive a net inflow of funds from Moscow. The group of “donor” regionshas varied with transfer and revenue sharing policies but includes Moscow City, St. Petersburg, NizhnyNovgorod, Samara, Sverdlovsk, Volgograd, Tyumen, Khanty-Mansi, Krasnoyarsk, and Sakha (Yakutia).A formal association of these regions has been promoted by the mayor of Moscow, Mr. Luzhkov.Although regions have entered large geographical associations to bargain with the federal government (theNorthwest, the Volga basin, the Central-Black Earth, the Urals, and the Siberian associations) it is the“donor” versus “subsidy” divide that increasingly dominates the political process.
Not surprisingly, the element of devolution has gained importance in the decentralization processas democratic institutions have developed at the subnational level. A significant shift in the balance of powerbetween the federal government and the regions came with the 1993 Constitution and a subsequent lawwhich required that by the end of 1996 all subjects of the Federation had to have popularly elected headsof the executive. All regions but five complied with the deadline and the rest of the elections followed in1997. While previously many regions had been amenable to following orders, the election of regionalgovernors left the federal authorities in a position of having to negotiate with each one of the regions.
Negative centrifugal forces have gained momentum in part due to the failure of federal authoritiesto provide enough funding for basic services and also due to the perception in the regions that abuse, fraudand cronyism abound in Moscow. Separatist demands and open opposition to federal government policiesby some regions have been common over the past six years. These demands have been more pronouncedin some regions than in others. Regional strength vis-a-vis the center got a very significant boost by thevacuum of power created by the financial crisis and the dismissal of Kiriyenko’s administration in August1998. This time, as in the earlier years of the transition, several regions declared they would stop remittingfunds to Moscow. Several others introduced price controls and prohibited the export of food supplies fromthe region, while Kaliningrad even intended to declare a state of emergency.
Asymmetric Federalism
In response to regional opposition and centrifugal forces, the federal government appears to haveoffered systematically more advantages and privileges to the politically “difficult” regions. This type ofresponse has created an asymmetric federalist system (Wallich 1994), a pattern that clearly emerged in1992. Many researchers have documented this pattern of advantageous fiscal flows to difficult regions.4

identified by several authors (Lavrov, 1995).
The 1993 Constitution itself declared all subjects of the Federation equal, but it also granted the5
ethnic republics special rights such as passing their own constitutions and electing their heads ofgovernment. However, these same rights in one form or another were also given to all the other regions.
-5-
Asymmetric federalism, taking the form of particular political and economic arrangements, is frequentlyregarded as a flexible policy that accommodates regional diversity as in the case of Canada or Spain overthe past 20 years (McLure et al., 1996). Asymmetrical federalism has also been heralded as a positive wayto address the growing conflict of interest and growing divergence between richer regions, with strongereconomic bases and more incentives to resist interregional distributions, and poorer regions which arebecoming increasingly dependent on federal transfers (Freinkman et. al., 1998).
This asymmetric treatment of subjects of the Federation would not appear to be unconstitutional.5
The ambiguity in Articles 71 and 72 of the 1993 Constitution concerning the division of powers betweenthe federal government and the regions, as well as provisions in the Constitution allowing the federalauthorities to enter into bilateral agreements with separate regions all seem to point to the legality ofasymmetrical federalism. Bilateral agreements provide a contractual framework between the federalgovernment and a region within which detailed functional agreements are stipulated. The functional areascovered by these bilateral agreements include budgetary relations (expenditure and revenue assignments),state property, sectoral regulations, ownership and use of natural resources, environmental protection andregional migration. Until 1995, these treaties were used for the clarification of intergovernmental fiscalrelations between the Federation and the ethnic republics.
While legal, such bilateral agreements created a good deal of resentment among mono-ethnicregions. Starting in 1995 their use was expanded to cover other types of regions (oblasts, krais, okrugsand city regions) as well. The expanded use of bilateral treaties to cover other types of regions was causedby increased pressure and resentment from these regions and coincided with the presidential electioncampaign in the first half of 1996. Consequently, the federal government has been involved in asimultaneous bargaining game in which concessions to one region affect those that have to be granted toother regions; asymmetric results followed because not all participants had the same degree of credibilityand bargaining power (Solnick, 1995). The pattern of results seems to show that Moscow has tended toreward rather than punish those regions that were or have been more defiant.
As a result, asymmetric federalism has caused a situation where all regions have an incentive todeviate from federal laws and press for more special treatment which, at the same time, leads to a weakergovernment and probably to worse economic situations for all regions (Treisman, 1996). Why is it thenthat the federal authorities have chosen asymmetric federalism which keeps in motion a mechanism for dis-union and resentment among the regions, and which may eventually bring about the auto-disintegration ofthe Russian Federation? Solnick (1995) argues that the inability of the federal authorities to enforce therules may have eroded the reputation of the federal government. The fear of the lack of ability to imposeuniversal rules may have caused the federal government to consider independent bilateral negotiations a

-6-
superior solution. Moscow’s strategy to buy the consent of the less cooperative regions indicates thatasymmetric federalism is not necessarily a superior solution but one that has been imposed on the federalgovernment by political reality. Prior to the implementation of bilateral treaties there was a constantresistance if not outright opposition to fiscal discipline by some subnational governments. The bilateralarrangements have had the strategic effect of weakening any coordinated action and demands by the ethnicrepublics and may have prevented the cessation of Tatarstan. As a result, the net impact of asymmetricfederalism has been to foster, but also to help control, the centrifugal forces in Russia. Also, the bilateralagreements appear to be only one of several causes of the poor fiscal incentives and poor revenuecollections at the subnational level.
The most significant feature of the past six years in Russia has been the lack of a coherent visionfor decentralization. With hindsight, one notes that the differences in views and positions of various regionshave made it impossible to create a consensus. The events of the past six years will make it even harderto develop a consensus on the overall strategy for reform and to find an appropriate balance among keyobjectives underpinning the decentralization policy: fairness in the allocation of resources across regions,the promotion of growth and a more efficient allocation of resources, the preservation of macroeconomicstability and fiscal and monetary discipline. The process of defining an overall strategy for the reform ofintergovernmental fiscal relations and the weighting of the different objectives to be pursued in this reformshould be expected to continue to be difficult and slow, if at all possible, given the diverging interestsbetween regions and the significant difficulties by the federal government to restore growth and prosperityin the country.
I.2 A Historical Overview of Intergovernmental Fiscal Relations Since 1992
An integral part of the Russian transition to a market-based economy has been the decentralizationof government functions. The road to meaningful decentralization is proving to be a difficult one for Russia.Three main phases can be distinguished in this process of decentralization, namely (i) the early years of thetransition (1992-93), (ii) the reform process started in 1994, and (iii) more recent reform policies (1997-98). The role of politics, which has been central in defining each of these phases of decentralization policy,will be discussed following the historical overview.
The early years of the transition (1992-93)
This early period of decentralization can be best characterized as a continuation of the approachesand practices inherited form the Soviet Union. Subnational budgets were based on negotiated expenditurenorms. Customized revenue sharing rates and bargained transfers were used to fund the budgets of allsubnational governments. The major change in this period was the shifting down to subnational governmentsof financing responsibilities for expenditures that in the past had been the responsibility of the federalgovernment, including price subsidies for food and other goods, such as medicines, local transportation andpublic utilities. This meant a significant increase in the involvement of subnational governments in theeconomic sphere. During this period, responsibility for many of the social welfare policies was also

Subnational governments, properly speaking, do not receive revenues from service fees. Service6
fees are retained by the spending agencies that earned them; at least formally, they are not sources ofbudget revenues.
These were granted in 1992 by the Law on the Rights of Local Self-Government and the Law7
on Basic Principles of the Budget System and the Budgetary Process and in 1993 by the Law onBudgetary Rights.
The exception was a short-lived tax sharing assignment in June 1992 when all regions got identical8
sharing rates for all taxes.
In 1993 the regulating tax was the VAT.9
Through the entire Soviet period, tax sharing rates for the major taxes were kept low enough so10
that most regions got an annual subvention from the federal budget. In 1992 and 1993, tax sharing rateswere increased to the point that fewer oblasts required a general subvention from the federal government.But, in 1993 alone, sharing rates were changed three times.
-7-
transferred to subnational governments. In addition, the federal government delegated responsibilities forcapital investment in many different areas to the regions.
The greater expenditure responsibilities of subnational governments were accompanied by anincrease in the subnational governments’ share in overall government expenditures and an increase in theimportance of intergovernmental transfers. These changes occurred against a background of a drasticdecrease in the involvement of the public sector in the economy; overall public sector expendituresdecreased from 52 percent of GDP in 1992 to 42 percent by 1994.
Regional governments received funding from three different sources: first, their own revenuesgenerated from regional and local taxes; second, the sharing of revenues from the major taxes (theenterprise profit tax (EPT), individual income tax, VAT, and excise taxes); and third, transfers. 6
Only a small degree of budgetary autonomy was granted at the subnational level giving regions andlocal governments discretion on how to spend their budget funds. The most significant factor standing in7
the way of full decentralization was, in fact, that regional and local governments were given little revenueraising authority. Subnational budget officials were also under “dual subordination” to both federal andsubnational authorities.
During virtually this entire early period, the federal government retained the power that it had inthe old regime to “regulate” the rate of at least one of the major taxes and therefore the power to reducefunding to those oblasts with large tax bases and to increase funding to those oblasts with smaller taxbases. Transfers took the form of negotiated “subventions” in 1992-93 and they were utilized when the8 , 9
other two sources of revenue were not enough to cover a negotiated “minimum required expenditurebudget.” 10

-8-
At the local level, rayons and cities had the same general structure of funding sources as theregions, but revenue sharing and subventions were from their regional governments rather than from thefederal government. Regional governments typically shared revenues with their local governments in verysimilar ways, replicating the relation between the federal and regional governments. Each local governmentusually had its own customized sharing rate for at least one major tax with revenues shared between theregion and local governments. This “regulating” principle in tax sharing had appeal because it gave theupper level government the ability to redistribute funds to poorer jurisdictions which had smaller tax bases.But the ability to “regulate” revenues in this fashion came at the cost of destroying lower level governmentbudget autonomy and introducing perverse fiscal incentives. In particular, the upper level government couldalways recapture or “claw back” the previous year’s budget surplus of local governments or offset anyincrease in local revenues (coming from a higher local tax effort) simply by reducing the sharing rate of theregulating taxes. In fact, this was a common occurrence.
The period 1992-93 is also characterized by the enactment of a series of general laws regulatingfiscal issues and served as the backdrop for the drafting of the 1993 Constitution. Laws enacted in theearly period of transition include the Law on the Fundamental Principles of the Budgetary System andthe Budgetary Process of October 1991, the Law on the Foundations of the Tax System in theRussian Federation of December 1991, and the Law on the Foundations of Budgetary Rights andRights to Form and Use Extra-budgetary Funds of April 1993. A prominent feature of these laws, inparticular the Foundations of the Tax System, is that many of their provisions were ignored and unfulfilled(Wallich, 1994; Lavrov, 1998; and Igudin, 1998). While regional noncompliance with federal legislationwas not unusual under the Soviet regime, the continued lack of compliance during the early years oftransition converted some of these laws into mere proclamations. This created a precedent for thecontinued pattern of selective compliance by regions of federal laws.
Not long after the disintegration of the Soviet Union, some of the ethnic republics (most notablySakha (Yakutia), Tatarstan and Bashkortostan) stopped tax remittances to Moscow and insisted on a“single channel” arrangement by which the regions would retain all tax collections and make one singlenegotiated payment to the federal government. Either because the federal government was absorbed in anintense fight between the presidency and the parliament or because it lacked effective means ofenforcement, the most forceful response from the federal government to these demands was to make theseregional governments responsible for all federal programs in the regions.
In summary, the 1992-1993 period was a continuation of the system inherited from the SovietUnion. Regional and local budgets were basically extensions of the federal government, and the systemof intergovernmental relations was characterized by tightly centralized finances. Revenue sharing andintergovernmental transfers continued to be used as accounting tools to balance subnational budgets, whosesize was determined nominally on the basis of expenditure norms but mostly by negotiation. There wereonly a few changes to the system during the early period. The single-most important change was the majorshift in expenditure responsibilities from the federal to subnational governments, in part to bring morebalance to the federal budget and also partially in an effort to discontinue the provision of subsidies andservices that the public sector could no longer afford.

-9-
From the 1994 reforms to 1997
Important reforms in the system of intergovernmental fiscal relations took place in 1994. Thebudgetary autonomy of subnational governments was strengthened during this period and the federalgovernment stopped the ad hoc offloading of expenditure responsibilities to regional and local governmentsthat characterized the earlier period. However, the murkiness of the responsibilities of different levels ofgovernment continued and the federal government continued the practice of unfunded mandates tosubnational governments. In revenue assignments, sharing rates for all major taxes shared between thefederal government and regional governments were standardized across all regions and have remainedvirtually unchanged since then. To offset the discontinuation of regulated sharing rates, a formula-drivenmechanism of equalization transfers was introduced in 1994. Subnational governments also experiencedsome increase in the level of revenue autonomy through federal legislation authorizing the introduction ofnew subnational taxes in the period from 1993 to 1996. Finally, subnational governments were also givendiscretion over the regional share of the enterprise profit tax by being allowed to lower the regional shareof the tax anywhere from 22 percent to zero percent.
The reforms implemented around 1994 stopped short of introducing a transparent, stable andrational system of intergovernmental fiscal relations. In revenue assignments, the uniform revenue sharingarrangements were not always respected in practice by the regions and the power granted to subnationalgovernments to introduce new taxes led to introduction of a myriad of small taxes creating significanteconomic distortions. At the same time, fundamental problems with revenue assignments were notaddressed. For example, revenues from the VAT continued to be shared based on the region where thetax was paid (as opposed to the region where the productive value was added) while revenues from theEPT continued to be shared in the region where the firm’s headquarters were located. The equalizingcapacity of the new formula-driven transfer system was limited because of limited funding and because offundamental problems with the equalization formula. A part of the new formula still tried to fill the “gap”between some measure of revenue collections and normative expenditure needs rather than equalizingdifferences in fiscal capacity and actual expenditure needs across the regions. The general dissatisfactionwith the formula for equalization transfers caused legislators to increasingly subject the formula’s results topolitical negotiations. The federal government never complemented the introduction of formula-drivenequalization transfers with a system of categorical or conditional grants to pursue sectoral objectives.Instead the federal government maintained the ad hoc and non- transparent mechanism of “mutualsettlements.” These are non-budgeted and primarily negotiated funds which are only made public afterbudget execution. Similarly, the federal government has continued to use ad hoc budgetary loans toregional governments which are often not paid back.
The 1993 Constitution together with the reforms of 1994 appeared to have strengthened theposition of the federal government vis-a-vis the regions and brought some order and stability to the systemof intergovernmental relations. The signing of bilateral treaties, starting with the ethnic republics of Tatarstan,Sakha (Yakutia) and Bashkortostan, brought back some power to the regions, but in a more orderly

Of course, the approach did not work for Chechnya.11
-10-
fashion that had been the case early in the transition. The combination of the 1994 reforms and the signingof the bilateral treaties was successful in bringing most dissenting regions into the system. 11
Also a characteristic of this period is that the reform efforts concentrated almost exclusively on thefiscal relations between the federal government and the regions. The regional governments were left on theirown to structure their relationships with local governments (cities and rayons). For the most part, intra-regional fiscal relationships continued as they were in the earlier period, thus perpetuating the former Sovietapproach.
The Reforms of 1997 and 1998
Starting in late 1997 and continuing in 1998, the government began to introduce a set of significantreforms before the ruble devaluation and financial crisis hit in August 1998. This was an expansive agendafor reform based on the draft Tax Code, the Budget Code, the Law on Financial Foundations of LocalSelf-Governments (approved in September 1997) and the Concept of Reform of IntergovernmentalFiscal Relations in the Russian Federation. The Budget Code addresses the reform of expenditure andbudgeting issues, and the draft Tax Code addresses issues of revenue assignment. The Concept ofReform was drafted by an interagency working group led by the Ministry of Finance and formally approvedby the government before the ruble crisis in August 1998. A significant feature of this reform agenda wasa willingness by the federal government to structure to a greater extent the intra-regional systems of fiscalrelations which until now had been left at the discretion of the regional governments. In particular, regionalgovernments were required to on average meet some minimum sharing rates for the major taxes with localgovernments. The Concept of Reform also calls for an important change in the system of transfers. Thisreform agenda is ambitious but also somewhat uncoordinated and incomplete; details of the reformproposals are reviewed in the chapters below.
I.3 The Role of Politics in the Decentralization Process
Politics have played a pervasive role in the design and workings of intergovernmental fiscal relationsin Russia. However, observers have held widely different views on the impact that politics have had on theoverall performance of the system. In one view, the failure of the political system to accommodate widelydiverse economic and political interests in the regions has fed conflict and heightened the political andeconomic instability in Russia during the transition period ( Polishchuk, 1996; Ordeshook, 1995). In adifferent view, the political system has effectively saved the Russian Federation from political disintegrationby facilitating political solutions, such as awarding special fiscal status to regions, that convinced all regions(except Chechnya) not to pursue secession from the federation (Treisman, 1996 and 1998a,b andFreinkman et. al., 1998).

The regions that stopped or greatly reduced remittances to the federal government early in 199212
included the ethnic republics of Tatarstan, Chechnya, Sakha (Yakutia) and Bashkortostan.
-11-
Part of the cause of the conflict between the federal government and some of the regions in theRussian Federation has been identified as the failure of the State Duma to provide adequate representationfor regional interests and by the fact that it has been left almost exclusively to the regional administrations(through the Federation Council) to represent those interests. The lack of adequate representation ofregional interests in the State Duma has been explained by the fact that half of the 450 Duma deputies areelected from nation-wide party lists. It has also been alleged that deputies from poorer regions have beenconsistently “bought” by national forces controlling bigger purses of resources and interests (Polishchuk,1996; Ordeshook, 1995).
Overall, three distinctive periods can be identified regarding how the political process has affectedthe substance of intergovernmental fiscal relations. These periods are (1) the pre-Constitution period(1992-1993), (2) post-Constitution policies (1993-1996), and (3) growing political concerns with the costof the bilateral tax treaties (1997-1998). The correspondence in timing of these three political periods andthe phases of development of the Russian system of intergovernmental relations (discussed in the SectionI.2) underscores the pervasiveness of politics in determining the evolution of the intergovernmental relationsin Russia.
The Pre-Constitution period (1992-93)
The pre-Constitution period (1992-93) was characterized by the openly confrontational politicalrelations between the federal and regional governments. This period was also marked by open politicaldefiance of the federal authorities outside of fiscal issues. It was common among ethnic republics to startpolitical campaigns (so-called “sovereignty parades”) to gain special status recognized in signed agreementswith the federal government.
During this period, the federal government unilaterally shifted expenditure responsibilities andmandates on subnational governments without, in the view of the regions, providing adequate additionalfunding. Regional governments responded with the threat and often the action of withholding tax revenuescollected in their territories for the federal government. While at the start of 1992 just a few regions hadstopped or greatly reduced remittances to the federal government, by the end of 1992 there were similar12
problems with 20 regions and by 1993 this number had increased to 30 regions (Wallich, 1994). Thecollective power of the regions vis-a-vis the federal government was also evidenced by the effectiverejection by the regions of the revenue assignments contained in the Law on the Basic Principles ofTaxation of December 1991. Among other measures, this law provided an exclusive assignment of VAT,taxes on international trade and certain excises to the federal government, while assigning the personalincome tax and enterprise profit tax to the regions.

Preferential treatment has taken several forms, including preferential fiscal arrangements (as with13
the earlier agreements with Tatarstan, Bashkortostan, and Sakha), free economic zones (as in Ingushetiaand Kaliningrad), or regional development programs (such as in Komi).
-12-
Post-Constitution Policies (1993-1996)
The second period started with the federal government crackdown in 1993 directed at both theconservative Supreme Soviet and the dissenting regions, and the enactment of the new Constitution. TheConstitution gave considerable powers to the federal executive vis-a-vis the parliament and the regions,but stopped well short of concretely defining powers and settling past disputes. The Constitution also gavethe federal government the ability to arrive at a series of bilateral agreements with a large number of regions.While confrontations between the federal government and some regions continued to test the strength ofthe federation during this period, the nature of these confrontations appears to have shifted from centrifugaltensions toward a competition between regions for special recognition and accordance of an advantageousfiscal status.
During this second period several new features surfaced in the political arena. Confrontation ofregional interests caused by the increasingly significant economic and fiscal regional disparities washeightened. While poorer regions favored higher federal taxes and more transfers, richer regions stronglyopposed both. Although economic conflict is not particular to Russia, the Russian case is more troublesomebecause the conflicting economic and political interests can be directly identified with regional boundaries(Polishchuk, 1996).
In response to the continued pressure from many regions, a pattern of more organized and long-term oriented bargaining between the federal government and the regions developed. The federalgovernment, empowered by the Constitution, entered into a series of bilateral treaties with the regions tryingto balance regional objectives that conflicted with national interests. The regions, first based on ethnic claimsand later simply on threats and demands, bargained for and obtained preferential fiscal treatments. At13
the same time demands from poorer regions emerged for increased regional redistribution and regionspressed the federal government to continue to fund a wide array of public goods and services that it hadearlier sought to offload onto the regions.
These regional demands were met most clearly through the allocation of transfers to the regions.Lavrov (1995) and Treisman (1996, 1998a,b), among other researchers, have found that federal transfershave been more responsive to political pressures than to other objectives such as equalization and fairnessacross regions. The federal government seems to have used transfers quite systematically to appeaseopponents and dissenters in the regions. For example, it has been argued that those regions that gaveYeltsin or his supporters little support in elections or those regions that declared sovereignty early in thetransition have tended to get larger transfers.

-13-
Growing Concerns with the Cost of Bilateral Agreements (1997-1998)
Although during the post-Constitution period inflation was contained by a restrictive monetarypolicy, the conflicting budget demands were resolved by the federal government running a deficit andborrowing first domestically and then internationally to finance the deficit. That was the political choice. Highinterest rates and short-term maturities ballooned the debt service requirements and ultimately led to theruble devaluation and debt default in August 1998. Besides creating mounting budgetary pressures, thegranting of special fiscal treatments to many regions has carried other costs. These include resentmentamong regions, compromising the objective of a unified national market, and creating the conditions forcontinued demands for special treatment by practically all regions, where the heads of the executive andthe legislatures, now democratically elected, had little excuse not to pursue the narrow interests of theirconstituencies.
In the period from 1997-1998, however, political awareness was mounting at the federal level ofthe straightjacket that these bilateral agreements had put upon federal budget policy. These concernslargely coincided with the onset of the financial crisis of 1998 that culminated in the collapse of the rublein August 1998. Recognition was given to the fact that these bilateral agreements are a contributing factorin the lackluster performance of federal tax collections, in addition to other factors such as the large numberof tax holidays and exemptions granted by the Russian tax system in the earlier years of the transition. Butundoing the damage from bilateral agreements is proving much more difficult than getting rid of tax holidaysand exemptions. Bringing bilateral treaties in line with the general legislative framework should achieve,among other things, the application to all regions of standard sharing rates for the major taxes. It is unclearat this point whether and to what extent this goal has been accomplished. The main means of enforcementin the hands of the federal authorities is the withholding of FFSR equalization funds and other transfers. But,even if this enforcement tool gets used, there is a significant number of regions (including some of the mostpolitically problematic) for which this tool will be largely ineffective, since these regions do not receive anyequalization transfers and only modest amounts of mutual settlements.
I.4 Dimensions of Fiscal Decentralization in the Russian Federation
The remainder of the chapters provide an in-depth analysis of the various dimensions of the Russiansystem of intergovernmental fiscal relations. Each chapter contains the discussion of a particular dimensionof fiscal decentralization in the Russian Federation. The assignment of expenditure responsibilities in theRussian Federation is discussed and analyzed in Chapter II. Next, the assignment of tax revenues and otherrevenue issues, including tax administration and financial administration are considered in Chapter III.Chapter IV presents the use of intergovernmental transfers in the Russian system. Chapter V addressesthe topics of subnational borrowing and emergency fiscal controls. Finally, Chapter VI reviews the mainissues in policy formulation faced by the Russian government in their efforts to reform their system ofintergovernmental fiscal relations.

In addition to these data issues, the Russian ruble was “re-denominated” in January 1997: one14
“new” ruble was issued for every thousand “old” rubles. Unless otherwise mentioned, all amounts are statedin “old” rubles.
-14-
The exposition of the Russian system of intergovernmental fiscal relations in the following chaptersis supported extensively by empirical analyses. Most of the data used for this purpose originates from theMinistry of Finance of the Russian Federation and exhibits problems common to transitional economies.The reliability of the fiscal data is particularly limited due to the heavy reliance in Russia on methods ofgovernment financing that are not reflected in reported budget figures (such as budget arrears), as well asthe pervasive use of non-monetary fiscal transactions (for example, governments frequently engage in swapsin which budget arrears are settled with tax arrears). These shortcomings of the data need to be kept in14
mind when drawing conclusion based on the analyses below.

These expenditure assignments are evaluated in Section II.3. 15
-15-
CHAPTER IIEXPENDITURE RESPONSIBILITIES
To some extent the expenditure assignment prevailing in Russia today is the one inherited from theSoviet Union. Yet while during Soviet times lower-level governments had practically no discretion onexpenditure decisions, during the transition period regional and local governments have been able toexercise considerable discretion in expenditure decisions. This chapter looks at the formal assignment ofexpenditure responsibilities as well as the actual distribution of expenditures during the years of economictransition. In addition, the performance of the system of expenditure assignments is appraised. This chapterconcludes with a summary of pending policy issues in the area of expenditures assignments.
II.1 How Have Expenditures Been Assigned?
Several things should be considered when examining the assignment of expenditure responsibilitiesin Russia during the economic transition. First, how have the expenditure responsibilities been assigned(both legally and in practice) among the various levels of government ? Second, have there been anychanges in the general expenditure pattern over time ? Third, what trends or patterns can be detected whenlooking at expenditures by main functional classification over the transition period.
Legislative Assignments of Expenditure Responsibilities
Neither the Constitution nor any other legislation has clearly defined the assignment of expenditureresponsibilities in Russia. Until recently, the only explicit reference to the division of expenditureresponsibilities between the federal and regional governments was in the 1993 Constitution (Articles 71 and72). In the Constitution some responsibilities are exclusively assigned to the federal level while otherresponsibilities are assigned jointly to the federal and regional levels; there are no responsibilities specificallyassigned to regional governments. Yet, these constitutional provisions are quite vague. No paramountcyis assigned in the Constitution in case of conflict between federal and regional policies in joint policy areas,nor is there any indication who is primarily responsibility for the concurrent responsibilities listed in Article72 of the Russian Constitution. The closest attempt to make a more explicit assignment of expenditureresponsibilities is contained in the Budget Code which was approved by the State Duma in 1998, but whichwon’t come into effect until January 1, 2000. 15

See Martinez-Vazquez (1994) and World Bank (1996).16
See Titov (1997) and Freinkman and Titov (1994). 17
-16-
Although the Constitution states that either the federal or regional governments can delegatefunctions to local governments, the Constitution does not enumerate any direct responsibilities for localgovernments. To this effect, the Law on General Principles of Organization of Local Self-Governmentin the Russian Federation of August 1995 contains a list (Article 6) of local government expenditureresponsibilities. This provision has been interpreted as stating that the federal and regional authorities haveno direct competence in these areas of local responsibility (Igudin, 1998). The de facto assignment ofexpenditure responsibilities that has taken shape over the past six years bears little resemblance to thosestated in the Constitution.
The de facto expenditure assignment that prevails in Russia today, outlined in Table 1, largelycomplies with the general principle that each level of government should be responsible for expenditureswith different service areas: services affecting the entire nation, such as defense and national security, shouldbe the responsibility of the federal government; services affecting many communities, such as tertiaryhospitals, should be the responsibility of regional governments; and those affecting exclusively the residentsof a community, such as sanitation, should be the responsibility of local governments.
As is obvious from Table 1, there are many areas in which two or even three levels of governmentshare responsibilities. In principle, it is useful to distinguish in expenditure assignments between (a) theresponsibility to fund expenditures, (b) the responsibility to regulate expenditure functions, and (c) theresponsibility to implement expenditure programs. Although the federal government has issued extensiveregulations and mandates that affect subnational government spending in Russia, the relevant legislation onexpenditure assignments has not clearly differentiated between the responsibilities to fund, regulate andimplement expenditure programs.
The major changes in expenditure assignments took place in 1992 and 1993 when the federalgovernment shifted a wide array of responsibilities down to subnational governments. The responsibilities16
delegated to subnational governments included social welfare responsibilities for consumer subsidies, cashsubsidies for vulnerable groups, welfare programs for pensioners and the disabled, family and childallowances and support for the homeless. Responsibilities for most kinds of subsidies were shifted downas well, including those for agriculture and transport. In addition, regional governments were made partiallyresponsible for housing for the military. During the same period, the federal government also shifted downresponsibilities for many types of investment in infrastructure. Previously, all investments were centralizedin the central government planning agency (Gosplan). This massive reassignment of responsibilities at thebeginning of the transition process had the double purpose of helping to bring the federal budget deficitunder control and also to reduce or eliminate certain kinds of expenditures, especially subsidies. However,in practice the delegation of so many expenditure responsibilities to the subnational level created problems,as regional expenditures on other categories (especially social services) were crowded out. Although a17

Often it is part of the treaty agreement that the regional government takes over some or all18
responsibilities of the federal government in the region including expenditures in overall administration,education, and construction in exchange for allowing the regional government to keep a larger share ofrevenues
-17-
few of the responsibilities shifted to the subnational level in 1992-93 were eventually taken up again by thefederal government, the bulk of these added responsibilities remain at the subnational level.
In 1994 responsibility for many law enforcement activities was transferred to regional governments(Titov, 1997). After 1994 the assignments of expenditure responsibilities have become more stable. Yet,in practice expenditure assignments in the Russian Federation have continued to evolve as many sharedresponsibilities have been adjusted in the annual budgets (Igudin, 1998). This has been especially true forthe division of responsibilities between the regional and local governments, where many functions are sharedbetween these two levels of government and the actual division of subnational responsibilities differs fromregion to region. The issuance of expenditure mandates by the federal government has also contributedto the redefinition of shared responsibilities after 1994. In addition, a lack of uniformity in expenditureassignments between the federal and regional governments is perpetuated because special arrangementswere introduced in bilateral treaties between these two levels of government. 18
Changes in Expenditure Patterns Over Time
Since the beginning of the transition, the amount of economic resources available to the publicsector in real terms has dropped substantially. This has been the product of the government’sdisengagement from many aspects of economic activity, the implementation of fiscal policies and the factthat real GDP dropped by more than 40 percent during the early transition period. Even when measuredas a percent of GDP, total government expenditures (excluding extra-budgetary funds) dropped from 51.9percent of GDP in 1992 to 32.9 percent in 1997 (Table 2). But while federal government expenditures aspercent of GDP dropped by more than 20 percentage points from 1992 to 1997, subnational governmentexpenditures during the same period increased by 5 percentage points. As a percent of GDP, subnationalexpenditures peaked in 1994 at 18.2 percent.
During the transition years the subnational government share in total government expendituresincreased significantly. Subnational governments represented 23.7 percent of government expenditures in1992 and 52.0 percent in 1997 (Table 3). A large part of the decentralization of expenditures was areflection of actual changes in the assignment of expenditure responsibilities in 1992-93. For example, inthis period subnational government expenditures increased in part as a consequence of the divestiture ofsocial expenditure responsibilities by state enterprises (which included housing, kindergartens, health clinicsand other facilities), since many

There are no precise estimates of the additional fiscal burdens on subnational governments that19
followed from the divestiture of social responsibilities by enterprises (Martinez-Vazquez, 1993 and WorldBank, 1996). In 1992 enterprises reported expenditures on social activities equivalent to 4.12 percent ofGDP and 3.3 percent of GDP in 1994. The actual impact on subnational governments varied significantlybecause of different exposure to the problem. Those subnational governments that had the advantage underthe Soviet Union of having state enterprises were more affected. Subnational budgets, on the other hand,were compensated with additional receipts from privatization of enterprises, partial compensation from thefederal budget through mutual settlements, and increased tax collections. In particular, a local turnover taxat a rate of 1.5 percent was introduced in 1993 to help subnational governments fund the additionalexpenditures.
Subnational governments have also periodically taken over federal government expenditures such20
as arrears in federal wages (for universities , the military, the State Tax Service and law enforcementagencies) when these arrears led to social tensions (Freinkman et. al., 1998).
-18-
of these responsibilities were shifted to local governments. Taking over the responsibility for housing19
impacted local budgets significantly because of the increase in energy prices and the decision made by mostregional governments not to implement full cost recovery policies for housing and public utilities.20
Notwithstanding these changes, the overall decentralization of expenditures, as shown in Table 3,seems to have converged toward a level with approximately half of the expenditures going through thefederal budget and the other half going through the subnational budgets. This same rule of half and halfapproximately has also applied to the shares of the regional and local budgets in the consolidated regional(or subnational) budgets. In all, these figures indicate that a high degree of decentralization has taken placein the Russian Federation. However, actual decentralization of expenditure responsibilities can not beinferred from this observed pattern of expenditure decentralization. Even though funds go through localbudgets, in many cases it is still true that the decisions of substance are made by regional officials ordetermined by federal regulations and mandates. For example in education, federal authorities play verysignificant roles in setting educational policies, such as determining curricula or selecting textbooks. Thedegree of true discretion at the regional and local levels is a complex issue that requires close sectoralstudies.
Expenditure Patterns by Main Functional Classification
The actual expenditure shares at each level of government for major expenditure categories, shownin Table 4, help illustrate several important points with regard to actual expenditure assignments. Althoughthere are policy areas of exclusive assignment, such as defense, most functions are shared by different levelsof government. Subnational governments represented over four-fifths of all expenditures in education andhealth in 1996-97. And most of these expenditures take place at the local level rather than the regional. Forhealth services actual expenditure shares of the federal and subnational governments have remainedpractically the same over the entire 1992-1997 period. Among subnational governments there has been

Some of the changes in expenditure composition between the regions and local governments have21
been affected by the definition of “social protection.” See Lavrov et al. (1996).
Social protection expenditures in Table 4 do not include social security expenditures (pension,22
invalidity, health, and unemployment) which are managed separately by four extra-budgetary funds.
-19-
a slight increase in the role of regional governments in health expenditures. The process has been quitedifferent in education expenditures where the share of subnational governments grew from 66.2 percentin 1992 to 86.8 in 1997. Most of the expenditures on education, 67.5 percent in 1996, take place at thelocal government level.
The large shift in expenditure assignments in 1992-93 are reflected in the evolution over time of thesubnational government shares in “national economy” and social protection. While the federal governmentrepresented 80.8 percent of all expenditures in “national economy” in 1992 reflecting a large involvementin pure market activities, by 1997 its share had been reduced to 24 percent. For more recent years,regions’ expenditures for “national economy” are concentrated in subsidies to industry and transportationwhile local governments’ are on housing subsidies and communal services.
In the case of social protection, the reversal has been less dramatic, but still pronounced. In thecase of social protection, there have also been marked ups and downs. Subnational government’s share21
in total expenditures on social protection reached a high of 81.5 percent in 1995, from 28.2 percent in1992. But for 1997, it was down to 58.7 percent. 22
On average the composition of regional consolidated (i.e., regional plus local) budgets has remainedquite stable since 1994 (Table 5). The average share of a region’s consolidated budget spent on healthranged from 15.2 and 16.1 percent in the 1994-1997 period. For education, the average share in theconsolidated regional budget increases slightly form 21.7 percent in 1992 to 24.4 percent in 1997. Bothof these expenditures did not vary much across the regions’ consolidated budgets, as shown by the smallcoefficients of variation in Table 5. On average, the highest share of regional consolidated budgets has goneto the “national economy”, and although the variation across regions has tended to increase somewhat overtime, the variation has remained relatively low. The most important component of “national economy”expenditures has been for housing and public utility subsidies. On average, during the 1994-1997 periodregions spent more on subsidies for housing and public utilities than they spent on health services and justa little less than they spent on education. The importance of housing subsidies in subnational budgetsremained relatively constant over time. Subsidies to agriculture have been the second most importantexpenditure item of “national economy” expenditures, but it decreased from 7.1 percent in 1994 to 4.9percent in 1997. The higher coefficient of variation for this type of expenditure also reflects a widervariation in regional policies in this sector. The importance of expenditures on social protection in regionalconsolidated budgets did not change much during these years and has been relatively small on average, 7.9percent in 1997.

Sequestering is the reduction of expenditure budgets during the ongoing budget year in order to23
adjust for inadequate revenue collections.
Approximately one-third of all kindergartens in Russia closed down from 1992-94. Existing24
infrastructure on health and education was not maintained and practically no new construction took place.The funds dedicated to supplies and operations, other than wages, were cut to a minimum or eliminated.Many schools around the country reported not having books and hospitals lacked basic supplies andmedicines (Martinez-Vazquez, 1994).
-20-
A general concern in Russia, and in the international community, has been the impact that additionalexpenditure responsibilities in the early years of the transition, unfunded expenditure mandates, and overallfiscal austerity may have had on the ability of subnational governments to provide basic social services inhealth, education and social support. An early formal response to these concerns was to grant specialtreatment to the social sector in the readjustment process. The Russian Government declared the socialsectors-- education, health, and social protection -- as priority sectors for budgetary allocations in 1992and 1993, meaning that these sectors were spared from the drastic budgetary cuts suffered by other sectorssuch as defense or the economic sphere. In addition, the Law on Budgetary Process gave manyexpenditure items in the social sectors “protected” status under budget sequestering. Despite the23
protected status, casual evidence indicated that at the beginning of the transition there were significant realcuts in the social sectors.24
However, after the difficulties of the initial years, funding for the social sectors at the subnationallevel did not plummet. Actually, real per capita expenditures at the subnational level peaked in 1994. Realexpenditures per capita in education and health also peaked in 1994 (Table 6). From 1994 to 1997 bothreal expenditure in education and health fell. Stated as indices (where 1994=100), spending on educationwas down to 92.8 in 1997 while spending on health was down to 78.9. On the other hand, per capita realexpenditures on social protection grew slightly over the period; the index for social protection expenditures(also normalized at 100 for 1994) stood at 106.7 in 1997.
Even though the composition of expenditures in the consolidated regional budget has not changedthat much on average, the shares of regional and local governments in the consolidated budget show largevariations across regions. These shares are studied in Lavrov et al. (1996) and Freinkman et. al. (1998).The degree of centralization of regional finances is markedly higher in those regions that are moredependent on federal transfers. There also appears to be a correlation between the degree of regionalcentralization and attitude toward market reforms; more decentralized regions are more likely to haveadopted market reforms.
The Problem of Unfunded Mandates
Unfunded mandates, the imposition of expenditure requirements on subnational governmentswithout adequate funding by the federal authorities, is one of the most vexing problems in the

-21-
intergovernmental budgetary relations in Russia at the present time. The general complaint by local andregional governments is that over the past six years additional expenditure burdens have been imposed onthem by federal legislation without compensating increases in the funds the receive from the federalgovernment. As a result, two specific problems are caused. First, federal mandates effectively restrictsubnational budget autonomy by limiting the control that subnational authorities have over their budgets.Second, in the absence of federal compensation, subnational budgets are further strapped by federalstrictures.
The history of unfunded mandates can be traced back to 1992 when, early in the transition process,the federal government shifted down expenditure responsibilities in many areas of social welfare tosubnational governments. With hindsight, these shifts in expenditure responsibilities appear to have beenmotivated by a desire to decrease the federal deficit. While subnational governments may have anadvantage in delivering these services efficiently, the redistributive nature of social welfare programs justifiestheir full funding by the federal budget. Among others, the reassignment of expenditure responsibilities thattook place in the first period of the transition included cash subsidies for vulnerable groups, welfareprograms for the disabled and pensioners, family and child allowances, support for the homeless, andgeneral consumer subsidies for housing and public utilities. The federal government justified this delegationof responsibilities by arguing that the general funding scheme for subnational governments (i.e., the revenuesharing and transfers) took into account the additional costs of providing these additional services. Thesubnational governments disagreed (and continue to disagree) with this assessment and claim that thefederal government has been imposing unfunded mandates on the regions in an effort to solve its ownbudgetary problems.
Awareness and discussions of the problem of unfunded mandates have increased in recent timesin the Russian Federation, both because of increasing fiscal austerity at all levels of government as well asthe seemingly increasing dimension of the problem. This has resulted into the outright prohibition of thepractice of unfunded mandates. The Law on the Financial Foundations of Local Self-Governmentsof September 1997 prohibits regional governments from issuing unfunded mandates to local governments.The draft Budget Code currently under consideration would prohibit the use of unfunded mandates at anylevel of government. Despite the formal ban on the use of unfunded mandates, there is general skepticismthat this legislation will be effective in ending the practice.

A measure of gross regional product (GRP) is computed by Goskomstat for most regions of25
the Russian Federation. Since the measure of GRP is not computed for any of the autonomous regions inthe Russian Federation, data for these regions were imputed based on the assumption that these regionshave the same level of tax effort as the region in which they are contained. Since some of the autonomousregions have relatively high per capita revenue collections, any analysis using this variable could be biasedif the imputed data are a poor reflection of the actual levels of GRP.
There have also been some variations across regions over time. For example, Kostroma’s26
expenditures per capita increased by 90 percent in real terms between 1992 and 1996 while those in Tuvadecreased by 56 percent in real terms in the same period (Freinkman et. al., 1998)
-22-
II.2 How Has the System Performed ?
The significance of fiscal disparities across regions has grown markedly during the transition years.The increasing differences in regional expenditure levels have been caused in large part by growing regionaleconomic inequalities. Table 7 shows the evolution of gross regional product (GRP) in per capita termsfrom 1992 to 1996, the latest year for which data are available. 25
Increasing Fiscal Disparities Over Time
Horizontal imbalances or fiscal disparities among the regions grew sharply over the transitionperiod. The disparities among the regions in per capita expenditures were always high in Russia, but theyhave grown more pronounced during the transition. As shown in Table 8, the coefficient of variation forper capita expenditures across the regions doubled during the period from 1992 to 1997. A differentmeasure of horizontal imbalance, the dispersion between the maximum and minimum per capitaexpenditures also doubled in the 1992-1997 period. The best-off region in 1992 spent close to 12 timesmore in per capita expenditures than the worst-off region. In 1997 this gap had increased to over 22times.26
The fundamental driving force for these fiscal disparities is the fast growing economic inequalitiesacross regions. Economic disparities among Russian regions were significant at the time of independence.Regional economic inequality was a conspicuous feature of the Soviet system. An additional factor in theincrease of regional expenditure disparities could be increases in price variations across regions. Pricelevels should be expected to have become more dissimilar over time, as federal subsidies for transportationof goods to the northern regions have declined. High inter-regional price differences are also sustained bya lack of inter-regional market integration (Berkowitz and DeJong, 1998).
During the years of economic transition, the coefficient of variation for GRP grew from 0.87 in1992 to 1.04 in 1996 and the difference between the poorest and richest region jumped from 31 times in1992 to 41 times in 1996. The increase in regional inequality can largely be explained by the growing

See Russian Economic Trends (1997.2).27
-23-
concentration of economic activity in just a small group of regions. In 1994, the difference in product per27
capita was five-fold between the average product per capita in the lowest and highest quintiles of theregional distribution (after adjusting for the cost of living, the difference was still four-fold). Concentrationof economic wealth is, of course, much more pronounced for certain types of economic activity. In termsof natural resources, most oil and gas production is concentrated in two autonomous okrugs (Khanty-Mansiand Yamalo-Nenets). About three-fourths of all metal production was concentrated in 10 regions in 1995.The level of concentration in fuel production was about the same. By individual regions, the City ofMoscow received 20 percent of all income, but it represented only 7 percent of the population. With regardto income, distant second and third richest regions were Tyumen oblast (4.5 percent of all income; 1percent of the population) and St. Petersburg (4.3 percent of all income; 3 percent of the population).
The increase in economic disparities has become more acute because many of the industrial-location decisions made under the Soviet Union were non-sustainable in a competitive market environmentand because of the collapse of the military-industrial complex (Polishchuk, 1996). Although national GDPis today approximately half of what it was at the beginning of the transition, different regions experiencedwidely different performances reflecting the structural changes in the economy. Regions that had an exportbase (natural resources, metallurgic and chemical industries), or developed a service industry based oninternational trade and finance, have done relatively well. Foreign direct investment has been concentratedin a small number of regions, especially in Moscow. Regions with an agricultural base or with a heavypresence of military industry and other manufacturing have often done much worse (Sutherland andHanson, 1996).
Has the Fiscal System Dampened Or Contributed To Fiscal Disparities?
The lack of market development and economic growth outside a few regions combined with a lackof labor mobility has brought an enhanced role for the public sector in addressing regional fiscal disparities.How well has the fiscal system performed during the transition? In general, the fiscal system, comprisingthe assignment of revenues and transfers of all kinds, has mostly helped to reduce disparities. Yet, theequalizing effect of the fiscal system as a whole has not been enough to keep up with the increasingdisparities in revenue collections.
The impact of the fiscal system on fiscal disparities is illustrated in Table 9, which presents thecoefficients of variation for the per capita amounts of regional resources allocated at several different stagesof the fiscal system for the years 1992 through 1997. The first stage reflects collections of all revenues inthe regions, including the federal share of joint taxes. At this first stage, the coefficient of variation is highand increases over time from 0.68 in 1993 to 1.61 in 1997. At the second stage of the allocation process,regional shared revenues (excluding the federal share), own source revenues and other regional revenues(before transfers) are considered. In general, this second stage shows a significant decrease in the

The equalization role of revenue assignments and transfers during the transition are discussed in28
more detail in Chapters III and IV.
The dependent variables in the regressions presented in Tables 10-15 are per capita consolidated29
subnational (thus, regional plus local) expenditure levels. Because price levels differ substantially amongthe regions of the Russian Federation, a set of similar regressions was estimated using real per capitasubnational expenditures (adjusted by cost of living) as the dependent variables. The results generated bythis alternative set of regressions is virtually identical to those presented in Tables 10-15.
The notion of higher tax effort in the Russian tax system does not carry the same exact30
connotation associated with the term in Western market-based economies. Subnational governments havelimited scope for statutory discretion in tax collection: they have few taxes that they can levy, few rates thecan change and few tax advantages that they can grant. What is different in Russia and other transitionaleconomies is that despite the fact that the entire tax administration apparatus is a centralized function, theactual collection effort of the regional branches of the State Tax Service and the Tax Police variessignificantly across regions and even across local governments. As discussed in the next chapter, taxadministrators show de facto allegiance to subnational government interests which do not always coincidewith those of the federal government.
-24-
coefficient of variation compared to the first stage. For example, in 1997 the coefficient of variationdecreased from 1.61 in the first stage to 1.39 in the second stage. Thus the system of revenue assignmentshas resulted in a more equal distribution of resources across the regions. The same can not always be saidfor equalization transfers and all other transfers (stages three and four). Based on the coefficient ofvariation, until 1995 transfers of all kinds tended to contribute to a more unequal distribution of fiscalresources across regions. However, at the end of the resource allocation process, we find that thecoefficient of variation for the distribution of per capita expenditures (stage five in Table 9) is substantiallylower that the distribution of all revenues collected in the regions (stage one) for 1995 through 1997. In theearlier years of the transition the reverse was true. 28
What drives the differences in subnational expenditure patterns? Regression analysis was used toexplore the role of conventional determinants of variations in per capita expenditures across regions.29
First, we considered the two conventional determinants of public expenditures: fiscal capacity (the abilityto pay for government services, proxied by gross regional product) and the need for public services(proxied by several measures of socio-economic characteristics). In addition, we also consider a lessconventional determinant, namely the level of tax effort exerted by a region (measured as the ratio of taxcollections and fiscal capacity). The ability to collect taxes in Russia may vary across regions because30
of the extent of the use of barter and underground economies and also because of subnational governmentfiscal policy decisions. From the experience of other countries, we would expect regions with greater fiscalcapacity or greater expenditure needs to have higher expenditure levels. Also, regions who have an intrinsichigher demand for public services (as revealed by the level of collection effort) should have higher regional

A problem with introducing tax effort in an expenditure determination equation is that this variable31
may drive the results because of the identity relation between expenditures and revenues. These latter areused in defining tax effort. It could be argued therefore that tax effort should not be included in the currentanalysis. However, the results from the analysis remain essentially unchanged when tax effort is excludedfrom the regressions.
Understanding the determinants of expenditure composition is especially important for “national32
economy” spending. These expenditures are mostly suboptimal untargeted subsidies for housing and publicutilities, which the federal authorities have unsuccessfully tried to eliminate.
-25-
expenditure levels. Descriptive statistics for the relevant socio-economic variables are presented in Table31
10.
Using measures of fiscal capacity, need and effort, we are able to consistently explain over 90percent of the variation in per capita subnational expenditures across regions from 1994 to 1997 (Table11). Per capita expenditures have been higher in those regions with higher per capita GRP for all the years.The regression coefficients for per capita GRP are positive and significant for each of the years andbecomes larger over time, an indication of the increasingly important role played by variations in the regionaleconomic base or fiscal capacity in explaining regional public expenditures per capita. Per capita regionalexpenditures are also higher in those regions with higher expenditures needs, as measured by the cost ofliving and the presence of population that is either under or over the working age. These population groupsare traditionally considered to have a greater need for government services, particularly in the areas ofeducation and health care. These two types of expenditures are among the most important for subnationalgovernments. The regression coefficients for these variables are positive and almost always statisticallysignificant. A fourth proxy variable for expenditure needs, the percent of the population in the region thatlives in poverty did not have any significant effect on the variation of expenditures per capita. Two possibleexplanations could be considered for this lack of significance; either truly no relationship exists betweenpoverty levels and regional expenditures or poverty is not measured correctly. Last, those regions thatreceived greater transfers as well as regions that exerted a higher tax effort also have experienced higherper capita expenditures.
Determinants of the Composition of Subnational Expenditures
Subnational government expenditures differ not only in level but also in composition. Regressionswere again used to analyze the determinants of expenditure variations across the most importantexpenditure categories: “national economy” spending, education and health care (Tables 12-15). Theseregressions specifically focus on two questions. First, are expenditure levels for certain governmentfunctions influenced by the type of funding received? Second, what is the role of expenditure needs inexplaining the variations in expenditures?
Several consistent patterns arise in the determinants of “national economy” spending, education andhealth care. The regressions explaining the variation across regions for expenditures on “national32

These results tend to coincide with those in previous research. Titov (1997) and Freinkman and33
Haney (1997) have tested different hypotheses on the determinants of the propensity by subnationalgovernments to spend on subsidies (using expenditures on “national economy” as a proxy). Titov (1997)finds that these types of expenditures were closely related to regional GDP for 1992 but not so for 1994.Freinkman and Haney (1997) find that the propensity to spend more in subsidies decreases with regionsthat are economically depressed and increases in fiscally wealthier regions and in those that receive morein federal transfers.
Concept on Reform of Inter-Government Fiscal Relations in the Russian Federation in34
1999-2001" (Annex to the Resolution of the Government of the Russian Federation no. 862, July 30,1998).
-26-
economy” in Table 12 show that for 1994 through 1997 “national economy” spending tended to be higherin richer regions (with higher overall revenues), but also in regions that got more in equalization transfersand all other kinds of transfers. Also significant is that those regions spending more on subsidies were also33
borrowing more and incurring higher budget deficits (“other sources of finance” in Table 12). Expenditureneeds (measured by population under or over working age, cost of living , and the poverty rate) did notdetract from the regions’ tendency to provide subsidies, except marginally in 1996 and 1997 when thecoefficients for cost of living and population under working age were negative and statistically significant.The regressions explaining the variation of expenditures on subsidies to housing and public utilities (ratherthan all “national economy” expenditures) show the same basic patterns. The only difference is that regionswith higher education expenditure needs, as measured by the percent of the population under working age,were less inclined to spend on housing subsidies (Table 13).
The regressions explaining the variation of expenditures on education (Table 14) and health (Table15) also show some important patterns. Regions with higher revenues are able to spend more in educationand health, but for each additional ruble in regional revenues the increase in expenditures here issubstantially smaller than was the case for “national economy” expenditures. For the most part equalizationtransfer from the FFSR also lead to higher expenditures in education and health. Other forms of transfersdo not induce significant changes in either education or health. This result coincides with the interpretationthat mutual settlements address mostly issues on “national economy” expenditures. Several other patternsare revealing. In 1996 and 1997 regional governments appeared to have borrowed to increase theirexpenditure on education and health and those regions with higher poverty levels spent marginally less oneducation, at least in 1995 and 1997. At the same time, the regression analyses suggest that there is nosystematic relationship between spending on education and health and the number of final consumers of therelevant services (i.e., children and seniors, respectively).
II.3 Pending Policy Issues in Expenditure Assignments
A government strategy for the reform intergovernmental fiscal relations has emerged with the“Concept of Reform of Inter-Governmental Fiscal Relations” drafted by the Working Group onIntergovernmental Fiscal Relations in 1998. This document makes a fairly accurate assessment of the34

An example of such confusion is discussed in Bahl et al. (1998). Regional and local officials35
in Leningrad oblast disagree over the assignment of responsibility for teacher salaries. As a result, teachersin this region are annually faced with wage arrears.
-27-
current problems and proposes a strategy for comprehensive reform in intergovernmental fiscal relations.Earlier drafts of this document had focused almost exclusively on reforming the system of intergovernmentaltransfers and on emphasizing the need for a strategy to reform fiscal management at the subnational level.This section complements the analysis in the Concept reform document by highlighting areas in expenditureassignments which will require attention by policy makers in the immediate future.
Better Delineation Between the Public and Private Sectors
Although the extent of involvement of the different levels of government in strictly market activitieshas declined dramatically from socialist planned economy standards, there are still many activities,especially at the regional and local levels, that should be considered private economic activities.Subnational governments on average still spend 32.2 percent, or close to one-third of their budgets ongeneral subsidies for private consumption or producer subsidies. There also has been a renewed impetusamong subnational governments to become entrepreneurs of sorts to stimulate economic activity andemployment. The constitutional mandate prohibiting the federal government from meddling with budgetdecisions of regional governments has made it difficult for federal authorities to promote expenditurerationalization in housing and public utility expenditures at the subnational level. The most effective approachis likely to be a program of conditional grants that requires participating subnational governments to reduceor eliminate these types of expenditures. This is essentially what is being proposed in the Concept onReform of Inter-Government Fiscal Relations.
There Continues To Be a Lack of Explicit Assignment and Confusion in ExpenditureResponsibilities
The Russian Federation still lacks an adequate assignment of expenditure responsibilities in the law.Clearly, a stable and transparent system of intergovernmental fiscal relations will require a well definedinstitutional framework with no ambiguity in order to resolve conflicts in the assignment of expenditureresponsibilities among the different levels of government. The assignment of expenditure responsibilities inthe Budget Code is more explicit and clearer than that in the 1993 Constitution (Table 16), but it still fallsshort of what is needed. Chapter 11 of the Budget Code identifies exclusive responsibilities for each levelof government (federal, regional and local) and a number of responsibilities to be jointly provided by allthree levels of government. However, there are some important responsibilities that are not clearly assigned.For example, education and health services are mentioned in the list of local responsibilities, but only in thecontext of those institutions owned by local governments. So there is no clear distinction of what types ofeducation (primary, secondary and so on) and what types of activities within education (teachers, textbooksor curricula) should be the responsibility of local governments. Neither does the Budget Code provide35

Lavrov (1998) recommends conducting an exhaustive survey of actual expenditure assignments36
as a preliminary step to reforming the expenditure assignment in the Budget Code.
-28-
any mechanism to resolve possible conflicts among levels of government for those functions that are jointlyshared.
In fact, the assignments in the Budget Code are much less clear than the reality that has taken shapeover the past years. The expenditure assignments in the Budget Code appear to be another exercise in legalambiguity that has plagued Russian in the transition. The Concept on Reform of Inter-Government FiscalRelations (1998) does not offer any solution either; it basically reproduces the expenditure assignmentsin the Budget Code. Both the Concept and the Budget Code require revision.
The proper starting point for introducing clarity in the assignment of expenditure responsibilities iswith understanding the actual assignments of expenditure responsibilities that have been in place over thepast years. An inventory of actual expenditure assignments ought to be conducted at different levels ofdetail. The next step would be to examine which of the current de facto assignments are wrong or36
problematic (as discussed in the section directly below.) At a minimum, the clarification of the relationsbetween the government of the Russian Federation and the subjects of the Federation will requireestablishing primary responsibility for the concurrent responsibilities listed in Article 72 of the RussianConstitution. Regions should be assigned primary responsibility for government functions that aretraditionally administered by local or regional governments (such as local administration, law enforcementand elementary and secondary education) while the federal government should be assigned the primaryresponsibility for policy areas that are of national importance or redistributive in nature, such as civil rightsand redistributive social policies. In addition, paramountcy should be established along the lines of primaryresponsibility to reinforce the separation of federal and regional activities. The assignment of primaryresponsibilities and paramountcy could either take place through the conventional legislative process orthrough the amendment of the Constitution of the Russian Federation.
Some Current Expenditure Assignments Should Be Reformed
There are no clear-cut rules for assigning expenditure responsibilities to different levels ofgovernment. Adequate assignments are reached typically as a compromise among often conflictingobjectives pursued by decentralization policy. Several general principles, however, can help guide thedesign and reform of the assignment of expenditure responsibilities.
An efficient provision of government services requires that government satisfies the needs andpreferences of taxpayers in the least-costly way possible. Because local governments are closer totaxpayers, efficiency can typically be increased by keeping the provision of services at the lowest level ofgovernment. This rationale is known as the “principle of subsidiarity.” Higher levels of government shouldbe assigned expenditure responsibilities for those services with significant spillover benefits across smallerjurisdictions. It is likely that smaller governments will fail to adequately internalize those spillover benefits.Higher levels of government should be assigned expenditure responsibilities for those services with

-29-
significant economies of scale and scope. However, these production efficiencies may still be captured bysmaller governments by contracting for services with either non-government enterprises or largergovernment units. The realization of efficiency gains in the allocation of expenditure responsibilities requireseffective democratic representation, proper budgetary institutions, including local discretion to vary thecomposition of the budgets, and the ability to link costs of provision via fees, service charges, or local taxes.
Expenditures undertaken by government for equity or income equalization and for macroeconomicstabilization should generally be the responsibility of the federal government. Attempts by subnationaljurisdictions to redistribute income can easily backfire if there is significant taxpayer mobility. Moreimportantly, the incidence of the poor is likely to be higher in relatively poorer jurisdictions, which bythemselves are less able to address the problem. Subnational governments may have an advantage in theimplementation of redistributive programs but, with very few exceptions those programs should be financedat the national level. The larger dimension of macroeconomic problems and the open borders acrosssubnational governments give a clear advantage to the national government in the area of macroeconomicstabilization. However, subnational governments can play an effective role in outlining and implementingregional development policies.
These general principles for assignment of expenditure responsibilities can help identify wrongassignments but they do not lead to a unique or optimal blueprint for expenditure assignments. Balancingthe objectives of efficiency, equity, and macroeconomic stability can lead to quite different, but equallyadmissible, expenditure assignments.
Overall, most of the current (de facto) expenditure assignments in Russia do not violate the generalprinciples of expenditure assignment. The current assignment could be maintained in many policy areas tothe extent that they are clear to all parties involved. However, even in these areas a formal and explicitstatement of responsibilities will eliminate (or at least reduce) the possibility of arbitrary re-assignments ofexpenditure functions and thus increase certainty and stability in intergovernmental fiscal relations.
Nevertheless, there are some expenditure areas in which the current (de facto) assignments shouldbe reformed. The most important of these is social welfare. A major defect of the current arrangement inexpenditure responsibilities is the failure to distinguish between financial responsibility and delivery orimplementation responsibility. Financial responsibility for most public expenditures with a redistributionalpurpose should be allocated at the federal level. In Russia, those subnational governments that have thehighest need in terms of social welfare are also the least capable of financing these programs. However,many of these regional and local governments still have a comparative advantage in delivering many of thesewelfare programs because of proximity to the population that requires these services. Of course, there aremany types of locally financed expenditures that are redistributive in nature, such as school meals for poorchildren or shelter for the elderly poor, which have a legitimate place in local budgets. There are otherareas that require reassignment of responsibilities. The current responsibilities of subnational governmentsfor national defense, although small, should be completely reassigned to the federal level.
-30-
Based on a clearer division of responsibilities, the sharing rates for the main taxes and the systemof transfers should be reevaluated so that shared taxes and transfers serve as an appropriate source offunding for those policy areas for which regions are given primary responsibility. Given the currentbudgetary constraints faced by the Russia Federation, the level of funding for regional governments willlikely fall short from providing an ideal “minimum level” of government services. Nonetheless, it will beincumbent upon the regional governments to fulfill their constitutional responsibilities to the best of theirability with the available resources.
In the realm of regional public policy, the role of the government of the Russian Federation shouldbe limited to setting national goals (like in Germany) or to serving as a facilitator to harmonize regionalpolicies (as in Canada). However, since regions would have primary responsibility for regional policyissues, the federal government should be prevented from issuing unfunded mandates in these policy areas.
A much harder but also needed exercise would be the harmonization of the many laws, decrees,or departmental orders that impact and overlap with expenditure assignment issues. In particular, whatshould the role of federal agencies (for example, the federal Ministry of Education) and its departmentalorders be vis-a-vis the role of regional and local governments in the delivery of public services (forexample, primary and secondary education)? This work will require distinguishing between the need forthe decentralization of regulatory powers, responsibility for financing, and responsibility for the delivery ofthe public services.
Resolving the Issue of Unfunded Mandates
The problem of unfunded mandates is not an exclusive problem to the Russian Federation. In fact,the issue of federal mandates is practically universal among federal countries. As the respective roles offederal and regional governments evolve over time in a federal system, the shared responsibility ofgovernance often reveals areas where the assignment of jurisdictions is not well-defined. These ambiguitiesarise despite the fact that the assignment of expenditure responsibilities is generally contained in theconstitutions of federal countries. For example, when federal authorities seek to set national standards forair and water pollution, it often becomes a point of contention whether the federal government’s mandateto protect the environment supersedes the regional government’s right to regulate its internal affairs withoutfederal interference. Tensions between the various levels of government are naturally heightened ifunfunded compliance costs are associated with the federal mandate.
Some degree of overlap or concurrence between federal and regional responsibilities is virtuallyunavoidable in any decentralized system of government. One way to avoid political stalemate when conflictarises in areas of shared expenditure responsibility is to establish (in the constitution or through legislation)whether federal policies preempt regional policies in the case of conflict between federal and regionallegislation. One important example of this type of conflict is the occurrence of unfunded mandates. Thedominance of one level of government over another is often referred to as paramountcy. While theprinciple of paramountcy can be invoked to solve conflicts regarding the assignment expenditureresponsibilities and disputes over unfunded mandates, this solution is neither comprehensive nor necessarily

Within the structure of the German federation, responsibility for virtually all policy areas is37
assigned to the federal government while largely limiting the role of the regional governments (Länder) toadministering these policies in accordance with regional customs. The German federal government is underno obligation to provide funds to regions when imposing new mandates. In contrast, in the Canadianfederal system the prohibition on unfunded mandates is implicit in the clearly delineated (and morebalanced) assignment of government responsibilities between the federal government and the provinces(regions). In the United States, the U.S. Constitution does enumerate the jurisdiction of the U.S. federalgovernment. However, courts have been willing to interpret these powers broadly despite the TenthAmendment to the U.S. Constitution which assigns any powers not delegated to the U.S. government “tothe States respectively, or to the people.”
-31-
desirable. As the example regarding environmental policy demonstrates, the issue of federal mandates mayarise even when government responsibilities are clearly and exclusively assigned to the different levels ofgovernment.
Boex and Martinez-Vazquez (1998b) review the policy responses to unfunded mandates inCanada, Germany and the United States. The experiences of these countries show a spectrum of policyalternatives from which to formulate a response on the issue of unfunded mandates. A number of valuablelessons for the Russian Federation can be drawn from the experiences in these countries:
Clarify the Assignment of Expenditure Responsibilities. As discussed above, the first (and perhapsmost important) lesson from the review of practices in other countries is that the best way to avoid conflictsover unfunded mandates (and the federal division of powers in general) is to define the respective roles ofthe federal and regional governments as clearly as possible. While expenditure responsibilities are relativelyclearly assigned in the constitutions of Canada and Germany, the assignment of responsibilities is much37
less clear in the United States. While disputes over expenditure assignments and federal mandates occurrelatively less frequently in either Canada or Germany, federal mandates in the United States are frequentlyat the center of legal disputes between states and federal authorities.
Prohibit New Unfunded Mandates to Prevent Offloading. For budgeting purposes, the policy areasfor which the regional governments are solely or primarily responsible should be considered to lie outsidethe area of federal jurisdiction. Consequently, unfunded federal mandates in these areas should beprohibited by law (as proposed in the new Budget Code) to avoid “offloading” of federal responsibilitiesto the regions without corresponding funding.
Prohibiting unfunded mandates seems to offer a simple and clean solution to the issue of unfundedmandates. However, when taken to an extreme this approach also presents problems. There are somemandates, even unfunded, that may be quite acceptable to subnational governments. For example,mandates that ensure civil rights, voting rights, and generally equal access and opportunity to citizens clearlyserve the national interest and are examples of “good” mandates. In practice, accountability mandates(such as reporting requirements for judicial and financial administration of regional and local governments)are also good mandates that are rarely resisted in other countries, even though sufficient funding frequentlyis not provided for the mandate.

See Kelly (1995) for a review of reimbursement problems with reimbursement problems in the38
United States.
Recent reforms in the U.S. approach towards unfunded mandates may serve as a frame of39
reference for the needed reforms in Russia. As part of the review of federal mandates in the United Statesrequired by the Unfunded Mandate Reform Act (UMRA) of 1995, the U.S. Advisory Commission onIntergovernmental Relations (1996) developed two sets of criteria to evaluate policy proposals. The firstset of criteria was defined for the purpose of selecting mandates that are of significant concern to state andlocal governments. A second set of criteria was developed to develop policy recommendations for thereviewed mandates. While these criteria were specifically developed for application in the U.S. federalsystem, their applicability easily extends to other federal systems.
-32-
In addition to the conceptual shortcomings of this approach, strict prohibition of all unfundedmandates would also cause practical problems. Most importantly, such blanket legislation could result inan administrative nightmare. A review of state mandates in the United States reveals that reimbursementprograms for mandates are administratively complicated, politically controversial, enormously expensive,and often do not work. In addition, there is a need to be realistic about the enforceability of a blanket38
prohibition of unfunded mandates. Outright prohibition of unfunded mandates could be circumvented bythe legislature, as legislators in many countries have traditionally shown a great degree of creativity tocircumvent unfunded mandate statutes. However, a legislative ceiling could be set on the cost that can beimposed on the regions by federal policies before an mandate statute is triggered. At the very least, thiswill ensure that federal policies will be closely scrutinized as to whether they will impose an excessiveburden on regional governments.
Identify and Resolve Existing Unfunded Mandates. Unfunded mandates are an existing problemfor subnational governments in the Russian Federation. A significant number of laws currently on the booksmandate subnational governments to provide social service according to federally established “norms,” suchas cash assistance levels. At the same time, subnational governments are not provided with any additionalfunding to cover these expenses. The first step in effectively dealing with existing unfunded mandates is toidentify which federal programs, based on the clarified assignment of expenditure responsibilities, actuallycontain provisions that impose unfunded mandates.
A possible way to identify existing unfunded mandates is through the establishment of a jointcommittee drawing from the Federation Council, the State Duma, the Ministry of Finance and possiblyrepresentatives from regional and local governments, to carefully review the federal programs that areidentified by subnational governments as imposing the greatest budgetary burdens. This joint review woulddetermine whether a program should be considered an unfunded mandate based on the clarified assignmentof expenditure responsibilities. When the joint committee identifies an unfunded mandate, it should evaluatethe size of the burden imposed by the mandate and make a policy recommendation to either eliminate, fund,or modify the government program. 39
When existing legislation is identified to contain an unfunded mandate, the government will haveseveral options how to deal with these government programs. One solution to the existing problem is torepeal these laws or modify them to give regions much greater flexibility in addressing the relevant policy

-33-
issues. It should be considered quite unlikely that the State Duma will repeal these laws, in light of the factthat it initially tried to devolve these expenditures responsibilities in order to reduce the federal budgetdeficit. At the same time, requiring subnational governments to fund these federal programs from regionalfunds (own revenues, revenue sharing and equalization transfers) would be prohibited under the newBudget Code.
To the extent that the legislature is unwilling to repeal federal laws that impose unfunded mandates,the government (through the Ministry of Finance) should initiate the development of a system of targetedor specific grants to fund the delivery of services at the regional level that are mandated by federal law.This approach forces the State Duma to assume financial responsibility for the federal programs it adoptsand to be realistic about the cost of such programs. By impairing the State Duma’s ability to offload itsfinancial obligations on the regions, such a system of targeted transfers would force the legislature to takeboth the benefits as well as the costs into account when establishing policy priorities.
Increase the Power of the Federation Council as a Watchdog. The Russian political system alreadyincorporates a powerful safeguard against the excessive use of unfunded mandates through the FederationCouncil, which consists of representatives of the subjects of the Federation. The Federation Council hasthe ability to block federal legislation containing unfunded mandates, although its decisions may be overruledby a two-third majority of the State Duma. In practice, this corresponds to requiring a legislative super-majority before an unfunded mandate can be passed. One possible option, although this would require aconstitution amendment, is to require an even greater majority vote from the State Duma to pass legislationthat has been identified as imposing an unfunded mandate. Again, this would require a mechanism toidentify this type of legislation. The current U.S. practice of having the Congressional Budget Officeevaluate each legislative proposal and apply objective criteria to determine whether legislation containsunfunded mandates could serve as a helpful example in this respect.
Increase the Cooperation Between Federal and Subnational Authorities. As a final suggestion, asolution to resolve intergovernmental tensions in a federal country is to establish a working partnershipbetween the various levels of government. Functionally, the system of intergovernmental fiscal relations inRussia lacks an underlying framework of trust and basic cooperation between the federal government andthe regional governments. Efforts should be made to establish more constructive and cooperative relations.In a cooperative atmosphere, federal and regional governments are more likely to jointly develop creativesolutions to the problem of unfunded mandates. Intergovernmental cooperation in working groups andadvisory councils fosters greater understanding between the federal and regional governments. Increasedcommunication also allows regional governments to identify federal mandates that have outlived theirusefulness or need updating, and enables regional governments to present the federal legislature with a setof recommendations for reform or repeal.
In the German system, an important safeguard against the over-use of unfunded federal mandatesis the consensus-oriented approach to politics. The federal government consults extensively with theregional governments through a variety of councils and carefully evaluates the impact on horizontal andvertical equity of federal policy proposals. Similar cooperation is evident in most other federal countries.For example, in Australia a National Fiscal Outlook is prepared on an annual basis by a working group

-34-
of the federal Treasury (equivalent to a Ministry of Finance) and regional treasuries. This documentpresents medium-term projections of federal and regional government finances and serves as backgroundinformation for the annual Premiers’ Conference, a meeting between the Australian Prime Minister and thePremiers of Australia’s states and territories. The Conference presents an opportunity for the heads of thefederal and regional governments to negotiate about the allocation of public resources between the differentlevels of government, discuss the general direction of the national economy and address other issuesconcerning intergovernmental fiscal relations in Australia. Another component of intergovernmentalinteraction in Australia is the Loan Council, which comprises the federal Treasurer as chairperson and hiscounterparts from the states and territories. The Council coordinates public sector borrowing by the federaland regional governments.

The four major shared revenue sources comprise the value-added tax (VAT), the enterprise40
profit tax (EPT) , the personal income tax (PIT) and excise revenues. For the analysis and discussion inthis chapter, these revenues are consistently referred to as shared revenues. All other revenues that accrueto regional or local governments are herein generally referred to as own source revenues. However, thisclassification is not absolute; there are many ways to classify revenue sources in the Russian tax system.For example, in some cases the subnational share of the EPT has been characterized as own sourcerevenue, since regions have been given influence over both the tax base (through exemptions) and theregional share of the EPT tax rate.
-35-
CHAPTER IIIREVENUE ASSIGNMENTS AND TAX ADMINISTRATION ISSUES
To a large extent the question of revenue assignments in the Russian Federation has been limitedto a question of revenue sharing arrangements between the federal and subnational governments for themajor taxes (value-added tax, enterprise profit tax, personal income tax, and excises). The history ofrevenue sharing arrangements for 1992 to 1997 is summarized in Table 17 for the major taxes. Whilerevenue sharing remains the dominant source of revenues for most regional governments, over time regionaland local own taxes have become an increasingly important source of subnational revenues during thetransition.
This chapter reviews the most important issues on the assignment of revenues among the differentlevels of government in Russia. This review includes an analysis of the trends in revenue collections anda discussion of pending reform issues in the realm of revenue assignments. In addition, this chapteraddresses a number issues related to the collection of revenues in Russia, including the role of incentivesand the structure of tax administration.
III.1 How Have Revenues Been Assigned?
The main dichotomy in revenue assignments in the Russian Federation has been between “sharedrevenues” (the sharing of revenues from the four major federal taxes between the federal government andthe regions using temporary sharing rates) and other revenue sources, including subnational or “own source”revenues. Subnational (regional and local) taxes in the Russian context during the transition should be40
understood as those taxes whose collections are “permanently” assigned (in full or in part) to regional andlocal governments. Properly speaking these are not own subnational government taxes since thesegovernments have little or no discretion over the rates or bases for the vast majority of these taxes.Nonetheless, these “own source” revenues form an increasingly important source of subnational revenuesand may be seen as functioning as the predecessors for truly regional and local taxes as these governmentsare slowly given more control over these revenue sources.

-36-
In general terms, three periods can be identified in the practice of revenue assignments sinceindependence. Each of these periods is characterized by a different approach to revenue sharing and policytoward tax autonomy by subnational governments. Although on the whole revenue assignment practiceshave improved over the years, Russia still falls short of having developed an adequate system of revenueassignment.
Revenue Assignments in the Early Years of the Transition
During 1993, the value-added tax (VAT) and in some cases other major taxes, such as theenterprise profit tax (EPT) and excises, were shared between the federal government and the regions atvariable sharing rates and on a derivation basis (i.e., the regional share was assigned to the region in whichthe revenues were collected or derived). Besides these revenues, some minor taxes were allocated 100percent to subnational governments. In the terminology of the former Soviet Union, the sharing rates ofthe most important taxes were “customized” or “regulated.” The reason for “regulating” or adjusting thesharing rates for each individual region was to provide the regional governments with just enough revenuesto finance the “minimum expenditure budget,” which was negotiated with the Ministry of Finance.Forecasted own revenues for subnational governments were subtracted from the minimum expenditurebudgets to arrive at the gap that would have to be financed with revenue sharing. Although considerabledebate and bargaining went on between the Ministry of Finance and the regional governments on sharingrates for particular taxes, these sharing rates were of less importance than the estimated financing gap; thegap would have to be covered with one tax or another. In poorer regions where overall revenue collectionswere low, the budget gap remaining after own source revenues and revenue sharing was covered by“subventions” or lump-sum transfers from the federal budget. The funding of local government budgets byregional governments followed exactly the same process as funding of regional budgets by the federalbudget
Two general points need to be added to the description of revenue assignments during the earlytransition period. First, the system of revenue assignments during this period evolved on a spontaneousbasis and was in open contradiction with the law. In late 1991, the Law on the Basic Principles ofTaxation had come into effect assigning the value-added tax (VAT), customs duties, excises and taxes onfinancial institutions as 100 percent federal taxes not to be shared with any other level of government. TheBasic Principles assigned the personal income tax (PIT) and the EPT to federal government as regulatingtaxes, by means of which the federal government could regulate the flow of revenues to subnationalbudgets. The Basic Principles further assigned 21 minor taxes to subnational governments, and, moreimportantly, prohibited the introduction of any other tax not listed.
The provisions on revenue sharing of the Law on the Basic Principles were never implemented.The federal government was not able to overcome the opposition of the regions, especially the oppositionto not sharing collections from the VAT. Second, the general rules did not apply to all regions. In 1992Tatarstan, Bashkortostan , Yakutia (Sakha) illegally declared fiscal sovereignty and were able to benefit

Chechnya never paid any taxes. Many other regions, up to 24, were at least partially retaining41
additional taxes in 1993. Others, such as Ingushetia, have been practically exempt from paying taxesbecause they were declared free trade zones.
-37-
from a “single channel” regime, whereby the regional government retained all tax collections in the regionand negotiated a single payment with the federal authorities.41
The revenue assignments during 1992-93 presented several important problems. In the first place,there was a lack of revenue autonomy for subnational governments. This denied the system ofintergovernmental fiscal relations the efficiency gains associated with ability of subnational governments toincrease or decrease at the margin the funds available for the provision of regional public services. Thesharing of some taxes with subnational governments, in particular the VAT (which was shared on aderivation basis), was very problematic. While enterprises operating in more than one region got the VATcredited and debited in different regions, there was no mechanism to sort out these flows among theregions. The enterprise profit tax was paid in the region where the business was registered and notapportioned among different regions according to any criteria of economic activity.
Perhaps more important is that the bargained approach to revenue assignments employed duringthe 1992-93 period created perverse incentives for the regions. In particular, subnational governments didnot have any incentive to increase tax collections, either through subnational taxes or better enforcementof shared taxes with the federal government. The budget funding mechanism was openly defined in a waythat any increase in tax effort by the regions would be offset by a reduction in the “regulated” sharing rates,subventions or transfers. The Ministry of Finance had several ways to claw back any additional revenuesand from all appearances it seems to have used them. Issues regarding incentives and tax administrationare discussed in greater detail later on in this chapter.
Due to the perverse incentives caused by this approach to revenue assignments, extra-budgetaryfunds came to play a much more significant role in the subnational government finances during this periodsince these were the only means to hide additional resources from the Ministry of Finance duringnegotiations on minimum budgets for the purpose of increasing overall funding levels. The same perverseincentives, of course, applied to local governments. They had no incentive to collect additional revenuesbecause any gains would get clawed back by the regional governments.
Since the regulated sharing rates were subject to annual changes, the uncertainty regarding theoverall level of funding also robbed subnational governments of any possibility for rational expenditureplanning over time. To address this problem, the Law on Budgetary Rights of April 1993 required thatthe federal government assign to subnational governments full or strictly fixed shares for at least five yearsfor the major taxes, with the exception of VAT. This requirement was only partially respected in futureyears.

Accruing 100 percent to the federal budget are revenues from customs duties; the VAT on42
imports, precious metals and stones, hydrocarbons and excise goods; and license fees for alcoholproduction.
The 10 percent retention of the PIT in 1995 and 1996 for the federal government was earmarked43
for distribution among regions (and on down to local governments) for maintenance of residential housingand social and cultural assets. One reason why this arrangement appears to have been discontinued in 1997is that the funds returned to the regions were in most cases roughly equivalent to the funds they would havehad if they had been able to retain the 10 percent of the PIT.
-38-
The Reform of Revenue Assignments since 1994
An important feature of the reforms that took place in 1994 is that the revenue sharing rates for themajor taxes were standardized across regions. As shown in Table 17, these tax sharing arrangements haveremained practically unchanged since then. In addition, subnational governments gained some measure ofrevenue autonomy during this period.
Major Shared Revenue Sources. The stability of sharing rates was formally set in the 1994 federalbudget law, which stated that the uniform sharing rates applicable that year would remain unchanged until1998. The sharing rates for federal/subnational governments that have applied since 1994 include 0/100for the PIT, 75/25 for the VAT, 37/63 for the EPT, 50/50 for excises on alcohol, 100/0 for excises onenergy products and 0/100 for excises on domestic production. The only change in sharing rates in the42
period from 1994-1998 has been the assignment of 10 percent of the PIT to the federal level in 1995 and1996. This was discontinued in 1997 with the PIT fully assigned again to the subnational level. The draft43
budget for 1999 recommends an alternative arrangement in which a federal PIT is collected at a flat rateof three percent and a regional PIT is collected with a progressive rate structure for incomes exceeding Rb.60,000.
The introduction of standard homogeneous sharing rates at the regional level in 1994 representeda notable achievement for the system of intergovernmental fiscal relations, but, of course sharing rates couldno longer be used for equalizing purposes. This same year, a formula-driven system of equalizationtransfers was also introduced. (Transfers are reviewed in full in Chapter IV). In combination with theformula-driven equalization transfers, homogenous sharing rates created the conditions to eliminate thenegative incentives against increasing collections by subnational governments that were present in the 1992-93 approach. In addition, stability was brought to the revenue assignments by keeping the standard sharingrates without change for several years, permitting regional governments to plan their expenditure budgetsbetter.
However, the perverse incentives to reduce collections did not disappear completely. The federalgovernment still left the door open for negotiation and bargaining with the regions through mutualsettlements, which are unbudgeted and non-transparent forms of transfers. Through these transfers, thefederal government had an avenue to continue to claw back some of the additional revenues raised by thesubnational governments. Starting in 1994, the federal government also negotiated a series of bilateral

Presidential Decree No. 2268 "On Forming Republican Budget and its Relationship to the44
Subject of the Russian Federation" of December 1993.
Presidential Decree No. 1214 of August 1996.45
The federal rate of 13 percent cannot be modified by regional governments.46
-39-
treaties with many regions. These treaties broke away from the standard sharing rules by allowing someof the regions to retain a higher share of revenues than specified in the standard sharing rates.
Although revenue assignments may have improved over this period because of the use of standardsharing rates, the administrative problems and inefficiencies in revenue assignments persisted. The VATcontinued to be shared with regional governments on a collection basis without adjustments, the EPT wasstill shared by place of registration since a new apportionment formula based on payroll and property washardly ever applied. Also the full or almost full assignment of the progressive PIT at the subnational levelon a derivation basis reduced the redistributional and equalizing abilities of this tax.
Other (Own Source) Revenues. In this period, subnational governments gained some measure ofrevenue autonomy. A presidential decree in 1993 lifted the prohibition for the introduction of new taxes44
at the subnational level which was included in the Law on the Basic Principles. Not surprisingly, thismeasure led to the introduction of all sorts of nuisance taxes and other whimsical fees, especially onenterprises. Some of these taxes were removed after taxpayers took legal action. The power for regionsto introduce new taxes at the subnational level was revoked, again by presidential decree in 1996, to beeffective January 1997. 45
Other changes in tax legislation during this period, and still in effect today, provided subnationalgovernments with some degree of tax autonomy. This has contributed to some extent to the ability ofsubnational governments to exercise higher or lower tax effort. The most important of these changes gaveregional governments the freedom under the EPT to apply a tax rate from 0 to 22 percent of the tax base.46
Many regional governments have chosen to grant tax holidays and advantages to particular investors.Regional governments also at the present time can set the rates for the taxes on enterprise property andproperty of physical persons up to a federally-determined maximum. Following federal guidelines, they canalso set the rate, and at times the base of other, often minor, taxes. These include the forest tax, water tax,ecological tax, the resort fee, the transport tax, regional license fees, and advertising tax. Localgovernments also have been free to introduce two turnover taxes on the sale of products; first, the HousingMaintenance Tax with a rate of up to 1.5 percent for housing and social service infrastructure divested byenterprises and, second, the Road Tax, at a rate of up to 2.5 percent. Local governments have also beenfree to introduce an education tax of up to 1 percent of the payroll of enterprises. Some other minor localtaxes are available to local governments.
Regional-Local Fiscal Relations. Despite these changes in revenue assignments between the federaland regional governments, revenue assignments at the regional-local level for the most part continued tobe what they were in 1992-93 and in the previous regime. In most regions, sharing rates between the

Some regions did reform their budgetary relations with local governments along the lines of the47
federal-regional reforms of 1994 (Lavrov et al, 1996). For example, approximately ten regions in 1995were using uniform sharing rates with local governments, but only two of these had a system of transfersbased on formula (Sverdlovsk and Jewish Autonomous Region).
See Igudin (1998) for some variations on how regions structure sharing rates with their local48
governments. Some regional governments have not changed their sharing rates with local governments forsome years. Other regions use standard uniform sharing rates for rayons but “regulate” them for cities.
In fact, the Law on the Financial Foundations was turned down by the Federation Council.49
Subsequently, the Duma introduced several changes and the amended legislation was approved by boththe Duma and the Federation Council.
These standards include 50 percent of PIT revenues, 5 percent of EPT, 10 percent of VAT,50
5 percent for excise duties on alcohol, and 10 percent for excises on other goods.
-40-
regional government and each local government continue to be negotiated and set every year. Although47
most regions still use “regulating” sharing rates, revenue sharing practices vary by region. 48
Since local governments felt that they were completely at the mercy of regional governments, localgovernments lobbied the federal authorities for the introduction of federal legislation imposing minimumsharing standards from the regions to the local governments. Of course, most regional governors opposedthis kind of restriction. The Law on the Financial Foundations of Local Self-Government of49
September 1997 was a compromise between those two positions. This law mandates some minimumsharing rates with local governments, but only as an average for all local governments in the region. 50
The worst consequence of this state of affairs in the regional-local relations is the continued lackof incentives for local governments to raise their own revenues. Even though the Law on the FinancialFoundations of Local Self-Government clearly prohibits the claw-back of local revenues, as did theearlier Law on Fiscal Rights of Regional and Local Governments in 1993, the fact is that regionalgovernments systematically claw back increased local collections by reducing sharing rates and/or transfersin the next period (Zhuravskaya, 1998).
Upcoming Reforms Contained in the Draft Tax Code
Perhaps is it is appropriate to speak of a third phase or period in revenue assignments, which willbegin with implementation of the draft Tax Code. The general part of the draft Tax Code, which deals withtax administration issues and taxpayer rights and obligations and also with the assignment of taxes todifferent levels of government, was approved by the State Duma in 1998. The revenue assignments in theTax Code are summarized in Table 18. All major taxes (VAT, PIT, EPT, and excises) are kept as federaltaxes to be shared with subnational governments the same way it has been done in the past. Regional and

In December 1998, the government sent the State Duma a proposal to increase the regional sales51
tax rate to a maximum of 10 percent. As part of the same proposal, the general rate for the VAT wouldbe reduced from 20 percent to 14 percent. The State Duma voted to postpone discussion of theseproposals to a later date.
-41-
local governments are assigned several new taxes and lose many of the old ones. But whether or not thenew taxes will be implemented depends on the passage of the specific part of the draft Tax Code, foundin the second part of the Code, which develops the structure of all taxes.
The second part of the Code has not been discussed beyond a first reading by the State Duma.Because of the political uncertainty that followed the devaluation of the ruble in August 1998, most of thetaxes developed in the specific part of the Tax Code have yet to be discussed or approved by the StateDuma as of June 1999. Two issues are especially noteworthy in the potential reform contained in the draftTax Code.
First, in the draft Tax Code regional governments are provided with a significant potential increasein revenue autonomy. If the draft Tax Code is adopted, regional governments will be able to introduce afinal sales tax up to a rate of 5 percent for general goods and up to 10 percent on excise goods. Inactuality, a new regional sales tax with a maximum rate of 5 percent and with a narrower base than theregional sales tax outlined in the draft Tax Code was introduced in the second half of 1998 as part of theeconomic emergency measures precipitated by the ruble crisis. Unfortunately, the government is planningto partially substitute the VAT with the higher rate final sales tax, based on the erroneous belief that a retailsales tax would be easier to enforce and that it would bring more cash revenues than the VAT. It is quite51
clear that neither the sharing of federal VAT revenues nor a regional VAT are proper ways to achievevertical balance between the federal and subnational governments or revenue autonomy for subnationalgovernments.
Second, the draft Tax Code also provides for the introduction of a western style real estateproperty tax at the regional level, which is to be shared with local governments. The regions will have thechoice of using the real estate property tax as a substitute for three existing property taxes (land tax,individual property tax, and tax on property of organizations) and will have some discretion on rates. Therevenue potential of the real estate property tax is at this stage in question given the difficulties of setting upits proper administration. Two pilot cities (Novgorod and Tver) have been working on its introduction overthe past three years, but it is not clear that they will not be ready to be introduced in 1999. It is more likelythat only the city of Novgorod will implement the real estate property tax, but just on residential structures(land excluded).
III.2 Trends in Revenue Collections
While throughout the transition the bulk of subnational budgetary revenues has been in the form ofrevenue sharing and transfers, there has been a steady increase in the role of own-revenues in subnationalgovernment budgets. Subnational own source revenues represented just 16.7 percent of subnational

These issues are also discussed in Freinkman et. al. (1998) and World Bank (1996).52
Until recently, at least, Russia has lacked a developed treasury system that would allow the easy53
transfers of funds throughout the national territory. This issue is discussed more fully in Section III.5.
-42-
revenue collections in 1992. By 1997, this figure had increased to 40.5 percent (Table 19). This is areflection of the increased revenue significance of the new taxes that subnational governments were ableto introduce by presidential decree between 1994 and 1996, and also of the poor collection performancefor the major shared taxes with the federal government.
Major Shared Revenue Sources
In the turbulent early years of the transition, not only were revenue shares regulated but there weremultiple budgets in one year and the federal government offloaded numerous expenditure responsibilitiesto subnational governments. In this early period, the subnational governments’ share of overall revenuesjumped from 39.7 percent in 1992 to 54.4 percent in 1993 (Table 20). With the 1994 revenue sharingand transfers reforms, the subnational governments’ share of overall revenues settled close to 50 percentand remained in this neighborhood through 1996. The figures available for 1997 show that the balance ofrevenue distribution moved up to 57.5 in favor of subnational governments.
The actual revenue sharing between the federal and subnational governments has always differedfrom the revenue sharing provisions stated in the annual federal budget law. This is evident from thecomparison of the sharing rates as stated in the budget law, Table 17, and the actual shares of collections,as shown in Table 20. The lack of correspondence is apparent in most taxes, but is most pronounced forthe VAT. There are several reasons for this lack of correspondence between statutory and actual sharingrates. First, regions in 1994 started unilaterally, and in later years were legally allowed, to withhold extra52
amounts of VAT collections in their territories in lieu of budgeted transfers. Second, some regions simply53
refused total or partial remittance of tax collections to the federal government in the earlier years of thetransition. In the later years, a number of regions have been allowed to keep larger shares of revenues onthe basis of the bilateral treaties signed with the federal government. Third, tax arrears have accrued fasterto the federal share than to the regional share of most taxes. Fourth, budget loans outstanding at the endof the year were offset against the transfers due to those regions in the following year.
The reasons for the different profiles for federal and regional tax arrears are also complex. First,as discussed elsewhere in this report, only a fraction of tax payments to the STS is in cash, mainly due tothe pervasiveness of barter and other non-monetary forms of payments among Russian businesses. In thisenvironment, regional governments have been more willing and able to accept tax payments in the form ofoffsets (canceling out of mutual debts between the government and taxpayers) and other non-monetaryforms of payment. The greater rate of collection of the regional component of shared taxes may also be dueto the fact that regional and local tax inspectorates still owe considerable allegiance to subnational bosses.

Unlike in the case of the Russian tax system, under international practices shared revenues are54
virtually never considered as own source revenues. Instead, the regional share of shared revenue sourcesare often considered transfers due to the general lack of influence by subnational governments over eitherthe bases or the rates of these taxes.
-43-
This can mean that regional and local tax offices may be trying harder to collect revenues accruing tosubnational budgets or that cash-strapped businesses are allowed to clear subnational governments’ taxarrears first.
Other (Own Source) Revenues
During the economic transition period, there has been a clear increase over time in the importanceof own source revenue collections (as was shown in Table 19). As mentioned at the beginning of thischapter, own source revenues are broadly considered to be those revenue sources assigned (in whole orin part) to subnational governments, excluding the four major shared revenue sources. The relative54
importance of the various subnational own revenue sources is explored in Table 21. The table enumeratesthe composition of consolidated subnational own source collections, revealing that over 80 percent ofsubnational own revenues comes from three revenue categories. Property taxes make up approximately40 percent of subnational own source revenues, while natural resource taxes contribute roughly onequarter of own revenues. A local tax, the Housing and Militia Maintenance Tax, raises almost 20 percentof subnational own source revenues. The remaining regional and local taxes account for no more than 15percent of own source tax revenues.
While the increased magnitude of these “own source revenues” is not disputed, it is oftenquestioned whether these increases in subnational own source revenues have translated into real increasesin revenue autonomy. Revenue autonomy requires that in addition to receiving the revenues from a tax,subnational governments have a substantial degree of discretion over either the tax base or rate. It is notuncommon in the Russian tax system that while the revenues from a tax are assigned to the regional or locallevel of government, the rates and bases of these own source taxes are actually determined or limited byfederal law or federal authorities.
The degree to which regional and local government are able to exert control over their own revenuesources is explored in Table 22. The table lists which level of government legislated the main subnationaltaxes and who has control over the tax base and the tax rate. As can be seen, regional governments areable to set the rate of the enterprise property tax, albeit within federal limits, which accounts for virtuallyall property tax collections. Similarly, the Housing Maintenance Tax falls clearly within the purview of localgovernments. On the other hand, Table 22 shows that subnational governments have no control over eitherthe tax base or the tax rate for revenues from natural resource taxes. It should be noted that all reviewed

However, during the period from 1993 to 1996, subnational government had been allowed by55
Presidential decree to introduce their own taxes.
-44-
taxes are federally legislated, thereby distancing regions from actively participating in the development ofthe tax system. 55
When the information contained in Table 21 and Table 22 is considered jointly, it is clear thatregional and local governments have some degree of revenue autonomy. In particular, it is the subnationalgovernment’s control over the rates of the enterprise property tax and the housing maintenance taxes thatgives them a good degree of revenue autonomy. At the same time, federally-imposed limits on the tax rateplace an upper-bound on the ability of subnational governments to be more responsive to their specificfiscal needs and wants. Greater revenue autonomy could be accorded not only by allowing regional andlocal governments increased input in determining the tax rates for federally legislated taxes, but by allowingregions greater freedom in legislating their own revenue sources and possibly allowing regions greaterfreedom over the administration of own source revenues. Discretion or autonomy in designing tax basesis less desirable because of the greater compliance costs this practice imposes on taxpayers operating inmore than one jurisdiction.
III.3 How Has the System Performed?
The trends in revenue assignments have had an impact on the performance of the revenue systemin a number of ways. First, compared to pre-transition levels, subnational revenues have increased as ashare of GDP. Second, increased revenue autonomy at the subnational level has resulted in improvementsin the vertical fiscal balance. Third, greater freedom at the subnational level combined with increases inregional economic disparities has resulted in greater horizontal fiscal imbalances. Fourth, distinctive patternshave emerged in the distribution of public resources between regional and local governments.
Revenues as a Share of GDP
The share of overall subnational revenues in GDP has changed over the transition period albeit notdrastically. This share was 13.8 percent of GDP in 1992. It peaked at 18.2 percent in 1994 and stoodat 15.7 percent of GDP in 1997 (Table 23). The share of federal revenues in GDP has remained lowerthan for subnational governments after 1992. The share of federal revenues in GDP in 1997 was 12.4percent. The combined share of revenues from both levels of governments (excluding extra-budgetaryfunds) was 32.6 percent in 1992 and 28.1 percent in 1997.
It is generally perceived in the Western press that poor revenue collections in Russia are a maincause of Russia’s economic problems. Even though Russia’s tax-to-GDP ratio is below the average forOECD countries, an often missed story is that Russia’s share of taxes in GDP (excluding extra-budgetary

Russia’s tax-to-GDP ratio equals 22.0 percent for 1997 (excluding non-tax revenues).56
According to the OECD Revenue Statistics 1965-1996 (1997), the unweighted average of tax revenueto GDP ratios (excluding social security) for all OECD countries in 1993 was 28.5. Russia’s tax ratioexceeds that of Turkey (18.9), Japan (19.3),Switzerland (20.8), the United States (21.0) and Spain (21.7).
Recall that regional governments can reduce their share in the EPT by charging any rate between57
zero and 22 percent.
-45-
funds) exceeds that of several OECD countries, including the Japan, Switzerland and the UnitedStates. 56
Because GDP actually decreased considerably over the transition, a more complete picture of theevolution of real tax revenues for subnational governments is shown in Table 24. In constant 1995 rubles,per capita revenues have declined steadily since 1992-93. The trend improved slightly in 1997, when realper capita revenue collections increased almost 10 percent. But even for 1997, real revenues per capitawere still considerably lower than for 1994. The indices used in Table 24, normalized at 100 for 1994,show that the worst performance in revenue sources in real terms has been for the EPT, in which the indexdropped from 147 in 1993 to 46.9 in 1997. This reflects not only the poor performance of the economyin general and profits in particular, but also the changes in the tax laws which narrowed the base of the EPT(allowing more deductions and eliminating excess-wage taxes). Probably also reflected are the taxincentives and holidays provided by regional governments to enterprises. Although there are no stellar57
performers among the different sources of revenues, VAT and excises performed relatively better than therest. This may help explain the continued strong opposition of subnational governments to reform revenuesharing arrangements, giving them a larger share of direct income taxes (EPT and PIT) and a smaller share,or no share, of the VAT.
Vertical Fiscal Imbalance Improved Over Time
Vertical balance exists when there is a broad correspondence between the expenditureresponsibilities assigned to each level of government and the fiscal resources available to them to carry outthose responsibilities. The most common source of vertical imbalance is the lack of revenue autonomy atthe subnational level. There are several reasons for this type of vertical imbalance, including
C the perceived need for the centralized administration of the most significant taxes;C the assignment of the most elastic sources of revenues to the central government (even though local
governments are assigned responsibility for public services with a more elastic demand with respectto income);
C fear of tax competition or mismanagement among local governments, or;C simply a reflection of the dominant political power of the central government.
These indices were developed by Hunter (1977).58
-46-
Revenue sharing and transfers are typically designed to redress this vertical imbalance. However,both political accountability and economic efficiency require that subnational governments have their ownsources of revenues, meaning taxes and fees over which they have total or almost total control (Boadwayand Shah 1994). An item of specific concern in Russia is that although subnational governments areincreasingly relying on “own source revenues” to fund their budgets, subnational government control overthese revenue sources is often only marginal. In many cases, the base and rate of these taxes is stilldetermined by the federal government.
Conventionally, vertical fiscal imbalances have been measured in two different ways. The first isto look at the surplus or deficit position of each consolidated level of government, before borrowing butafter all revenue sharing and transfers have been implemented. This measure tends to be biased towardcentral or federal government mismatch because in many countries, either by law or by practice, subnationalgovernments operate more conservatively than the national government. In most countries, the centralgovernment is allowed to borrow quite freely to cover current operations. In contrast, local governmentsin many countries are only allowed to borrow for capital investment purposes, if at all. This measure ofvertical imbalance is only meaningful under the assumption that deficits are not the result of mismanagementor waste, or in other words that governments at all levels attempt to provide the services under theirresponsibility in an efficient manner.
Over the transition period in Russia, the federal government has run large (albeit declining) budgetdeficits, while the consolidated subnational government budget has moved from a small surplus to a smalldeficit. These trends are discussed in greater detail in Chapter V. By this deficit measure, therefore, therehas been a lack of vertical fiscal imbalance in Russia during the transition. However, these figures need tobe interpreted carefully. Because of the inability of many regional and local governments to borrow to anysignificant amount especially early in the transition, the early surpluses and minor deficits of subnationalgovernments may be more a reflection of the institutional constraints and the budgetary uncertainty of thepast years than a sign of fiscal health. Early on, regional and local governments may have kept a cushionof resources in extrabudgetary accounts to cover unpostponable expenses; unexpected revenue shortfallswere particularly frequent due to economic instability, poor revenue forecasts and the fact thatintergovernmental transfers were subject to budget sequestering. The increasing use of borrowing tofinance budget deficits at the subnational level, once institutional and market constraints started to beremoved, point at the need to use caution in the interpretation of subnational budget surpluses as a sign ofthe lack of vertical imbalance in Russia during the early transition.
A second way to measure vertical fiscal imbalance is to examine what share of subnationalgovernment expenditures is financed with sources of revenues under the control of regional and localgovernments. The coefficient for vertical imbalance is calculated as one minus the share of the subnationalgovernment expenditures that are financed from sources of revenues not controlled by the subnationalgovernment. There is disagreement on how exactly to define those revenue sources that are controlled bya higher level of government and therefore different versions of the coefficient are typically computed. 58
-47-
Table 25 shows the computation of three different indices corresponding to three differentdefinitions of vertical fiscal imbalance, depending on the revenue sources that are considered to be outsidethe control of subnational governments for 1997. The first definition considers all revenue sources assignedto regional and local governments (excluding shared revenues and transfers) as own source revenues. Thesecond definition also considers revenues from tax sharing as potential own source revenues, and the thirddefinition adds untied equalizing grants to own revenues and shared taxes.
By construction, the coefficients of vertical imbalance take values between zero and one, withvalues closer to zero indicating a larger vertical fiscal imbalance. The small values of the coefficient for thefirst definition (when shared revenues and transfers are not considered part of subnational own sourcerevenues) indicates a significant degree of vertical imbalance. A more proper perspective is given whenthe coefficients of vertical imbalance for Russia are compared with those computed for a selected numberof transitional and Western European countries (Table 26). When compared to these countries, Russiaachieves a relatively high score, suggesting a degree of vertical balance quite similar, for example, to thelevel of vertical fiscal balance present in the German system. Again, these results need to be interpretedwith caution because the comparison in Table 26 does not reveal the degree of discretion that subnationalgovernments have over their “own revenue sources.” As mentioned earlier in this chapter, subnationalgovernments in Russia have limited discretion in setting the rates or defining the base of regional and localtaxes.
Horizontal Disparities in Regional Revenue Collections Have Increased Steadily
Similar to what we saw for per capita expenditures, disparities in per capita revenue collectionsamong regions have increased steadily during the transition. As shown in Table 27, the coefficient ofvariation for revenue collections across regions (inclusive of the federal share for all revenues) increasedby 136 percent from 1993 to 1997. The highest per capita regional revenue in 1993 was 30 times higherthan the lowest. By 1997 this difference tripled to 90 times.
The main reason for these disparities has been the increasing concentration of economic activityin a small number of regions, as discussed in Chapter II. There is, of course a strong correlation betweeneconomic activity and tax bases and revenues. The five highest collection regions represented 40.9 percentof all revenue collections (including the federal share) in 1997, up from 33.7 percent in 1993 (Table 28).Similarly, the twenty highest collection regions represented 70.9 percent of all revenue collections in 1997.When federal shares are removed, as can be seen in Table 29, the degree of concentration decreases,albeit not by much. In 1997, the twenty highest collection regions (exclusive of the federal share)represented 67.3 percent of all subnational revenue collections.
A significant factor contributing to the marked horizontal imbalance in per capita revenue collectionsis the unevenness in the distribution of natural resources in the Russian Federation. Leaving aside excisetaxes on oil products which are assigned 100 percent to the federal government, subnational revenues fromtaxes, fees and charges on natural resources represented on average only 7.7 percent of regional tax

These include subsoil charges for use of mineral deposits, mineral rehabilitation (prospecting)59
charges and other fees for use of natural resources.
These are, in order of natural resource wealth: Khanty-Mansi, Yamalo-Nenets, Tyumen,60
Tatarstan and Yakutia (Sakha). The top three regions hold 2.2 percent of the population of the RussianFederation; the population share of the top five regions is 5.5 percent.
The arrangement between the federal government in Canada and the province of Quebec may61
show a good way to share the VAT between federal and regional authorities. But the administrativecomplexity of the procedure makes it not too relevant to Russia at the present time (McLure, 1998).
-48-
revenues in 1997. However, the unevenness in the distribution of natural resources means that these59
revenues are highly concentrated in a small number of regions. For 1997 the three richest regions in naturalresources collected 46.9 percent of all regional revenues from taxes, fees and charges on natural resources;for the top five regions this percentage was 52.7. 60
Two factors have been at work that multiply the impact of differences in natural resourceendowments on regional revenue disparities. First, the relative importance of natural resource taxes and feesin the regional budgets, on average, has been growing fast over the past four years. Second, there is a highcorrelation between regional collections from natural resources and gross regional product (GRP); thecorrelation coefficient was 0.95 in 1997 (Table 30). Note also that the correlation between naturalresource collections and total regional collections is high as well (0.96 in 1997) and has been increasingover time. These correlations are a reflection of the fact that businesses involved in natural resourceextraction also pay other taxes and that other economic activity (processing, transportation and so on) maybe generated in regions with significant natural resources.
Another factor that may have contributed to the existing disparities among regional governmentsis the manner in which shared taxes are apportioned among subnational governments. The impact ofrevenue apportionment mechanisms is hard to quantify without detailed taxpayer information. But the factthat enterprises pay all their EPT in the region where they are registered, rather than in all regions wherethey have economic activity, has likely contributed to the concentration of collected revenues in fewerregions. More proper apportionment mechanisms would establish a correspondence between the locationof the economic activity (for example, production) and the apportionment of the shared revenue (forexample, the EPT). The lack of proper apportionment of the EPT has worked to the benefit of regionaland national economic centers, especially the City of Moscow. The apportionment of VAT on a derivationbasis probably also has contributed to the concentration of regional revenues. What is certain is thatregional revenue disparities would have been reduced if VAT had been shared with the regions on a percapita basis, such as is done in Germany, or an estimated consumption expenditure basis, such as is donewith the maritime provinces in Canada. The apportionment of PIT by place of work rather than the place61
of residence should also contribute at the margin to the concentration of tax revenues in neighboring regionswith a more industrial economic base.

Ordeshook (1995) argues that many of the political problems in Russia during the transition62
originate in the inability of the entire institutional framework to recognize the significant role played byincentives.
Although the importance of extra-budgetary funds may be on the decline at the subnational level,63
at present there exists no good measure of their importance (Kirkow, 1996; Freinkman et. al., 1998).
-49-
Distribution of revenues between regional and local governments.
The distribution of revenues between the regions and local governments varies significantly by typeof tax (Table 20). Although there are significant variations among regions, the most centralized revenuesources at the regional-local level are the VAT and excises while the most decentralized are property taxesand the personal income tax. Less wealthy regions, which are more dependent on federal transfers, tendto exhibit a higher degree of decentralization. A trend that has developed over the last three years is forregional governments to retain a higher proportion of personal income taxes and compensate localgovernments with higher transfers (Lavrov et al., 1996). However, it should be remembered that revenueassignments within the regions continue to have very little significance given current budgetary practices.Since regional governments have discretion to change revenue sharing rules and the level of transfers in anyway they wish at any time, it is not the composition of funding sources that matters, but the overall level offunding. The latter is often determined prior to any discussion on revenue assignments in negotiationsbetween the regional and local governments.
III.4 The Role of Perverse Incentives and Soft Budget Constraints
A major failure in the framework of intergovernmental fiscal relations in Russia has been the failureof the system to provide the right incentives to subnational governments to increase their own revenuecollections and rationalize their expenditures. During the early transition period (1992-1993) the62
bargained approach to expenditure levels, the regulating revenue sharing rates and the negotiated transfersfailed to provide subnational governments either with a hard budget constraint or with an incentive to raisetheir own revenues and make a more efficient use of the available resources by rationalizing expenditures.The reforms of 1994, which have been in place through the present, took some significant steps toward thegoal of imposing a hard budget constraint, but ultimately fell short of this goal. Both regional and localgovernments still have a powerful incentive to understate and hide their revenues in extra-budgetary funds.63
Overall, several fiscal practices can be identified that cause perverse fiscal incentives. First,subnational governments have responded to incentives (resulting from the reliance on budget expenditurenorms to measure regional expenditure needs) to maintain existing infrastructure capacity rather thanrationalize their expenditures. As a result, regional and local governments have failed to exploit possiblegains in efficiency by improving the mix of inputs and continue to have an incentive to hide funds from theregional authorities in extra-budgetary funds. Consequently, the reform of the system of intergovernmental

See, for example, Freinkman et. al. (1998).64
-50-
fiscal relations needs to explicitly recognize the crucial role incentives can play in mobilizing revenue sourcesand increasing the efficiency of public expenditures. This issue is addressed in greater detail in Section IV.2.
Second, poor design of intergovernmental transfers can also reduce the incentive for subnationalgovernments to collect revenues. For example, equalization transfers in Russia are often provided tosubnational governments in which own and shared revenues were not large enough to fund their minimumexpenditure budgets. By using (current or base year) revenue collections as a proxy for fiscal capacity, this“gap-filling” approach assures that any reduction in local collections due to lower fiscal effort is offset (atleast in part) by an increase in the level of transfers.
Perverse fiscal incentives are even more prominent among local governments, which in most regionsstill negotiate their budget allocations through bargaining and negotiations much the same as was done inthe former Soviet Union. Local governments routinely see a large percentage of any additional revenuesclawed back by regional governments. As a result, subnational governments are still more concerned withhiding their fiscal resources (in particular through all sorts of extra-budgetary funds) and bargaining for moreassistance from the upper-level government than with increasing tax collections. It has also been arguedthat soft budget constraints have led to local governments spending more funds on subsidies to housing andcommunal services, transportation and agriculture subsidies and less funds on health and education.64
Whether this in fact occurred is difficult to determine.
III.5 The Role of Tax Administration
A major difficulty that has plagued the implementation of the system of intergovernmental fiscalrelations in Russia has been the inability of the federal government to exert effective control over theregional branches of he State Tax Service (STS). The lack of a functioning Treasury system during thetransition has also been a significant impediment to the smooth functioning of revenue assignments.
Administrative Structure of the State Tax Service
The Russian Federation government has been struggling with a lack of regional compliance withfederal tax legislation and its inability to enforce these laws. Such difficulties have been present from thebeginning of the transition. For example, the revenue assignments provided in the Law on the Foundationsof the Tax System of the Russian Federation of December 1991 never were implemented because ofthe opposition of regional governments. This only could have been accomplished because the regional andlocal offices of the federal STS took their orders from the regional authorities rather than the federalauthorities.
There are historical reasons for these problems with the system of tax administration. Under theSoviet Union, the system of tax administration consisted of a network of tax divisions of local and regional

To underscore the federal nature of the STS, in 1998 the agency was renamed the Ministry of65
Taxation.
-51-
financial offices with subordination to local, republican, and federal authorities. With independence, theRussian Federation moved quickly to create a national tax administration system solely under federalauthority. The strong motivation was to avoid the repetition of what had happened to the Soviet Union.The refusal of republican authorities to share revenue upwards with the central authorities had led, inpractical terms, to the breakdown of the Soviet Union.
However, while shortly after the establishment of the Russian Federation the State Tax Service(STS) was legally made a federal agency, in many ways the STS has remained a confederation of local65
and regional offices with officials responding to both federal and subnational authorities. This dualsubordination is apparent in many different ways. Regional and local tax administration officials still lookup to and take informal directives from subnational authorities and in many cases they receive housing,office space, and other logistical support from the subnational governments. This de facto dualsubordination has had important implications on how and how much tax revenues get collected in theregions and how much is remitted to the federal government. In substance, the inverted system ofcollections has not changed from what it was under the Soviet Union. In certain cases, local and regionaloffices still remit collections to the center, creating the opportunity for some regional governments towithhold payments to the center. This problem is especially poignant for Tatarstan and Bashkortostan sincethese regions have a so-called single channel arrangement, allowing these regions retain all federal revenuesand to settle the balance of all claims to the federal budget through a single payment. Making fiscalfederalism work, in particular enforcing federal policies, requires the transformation of the STS into a truefederal agency. There are many important pending issues in the reform of the tax administration system,but making it an agency that responds exclusively to federal authorities may be the most important one.So far, there has been no serious attempt to introduce policies that could address this issue, such asproviding all compensation for tax administrators from the federal budget or rotating personnelgeographically.
Many other structural issues remain to be addressed in tax administration in the Russian Federation.First, is there a need for regional and local government tax administrations given the new subnational taxesalready introduced or planned in the draft Tax Code? Second, should the STS and the Tax Police beintegrated as in many other countries? Third, should the STS be in charge of collections for social securitycontributions to the extra-budgetary funds? Fourth, what is the role of the STS with respect to the propertytax? These issues need to be carefully evaluated by the Russian government, and some will require a longtime to solve. In the interim, the best general approach may be to rely on the State Tax Service as muchas possible for the assessment and collection of the new regional and local taxes (with the possibleexception of the property tax). Given the current weakness of the tax administration and limited resources,it might be best to concentrate on improving the current tax administration at the federal level beforeattempting to create new tax administrations at the regional and local levels of government. This must becounter-balanced with the realization that the State Tax Service’s primary mission is to raise revenues forthe federal budget. Therefore, the assessment and collection of solely regional and local taxes will be of

-52-
less importance, and potentially costly in terms of resources. In the longer term, it would be more effectiveto have local and regional tax administrations to administer their own taxes, respectively.
The Ministry of Taxation also needs to play a better role in fostering the development of transparentand fair intergovernmental relations between the federal and regional governments and between the regionaland local governments. The current distrust between the federal and oblast-level governments isexacerbated by the inability of the tax service to collect the budgeted revenues for each level ofgovernment. An example of this distrust is evident in the practice of having taxpayers write separate checksfor the federal and oblast governments for the enterprise profit tax. This “revenue-sharing” responsibilityclearly should be transferred from the taxpayer to the State Tax Service. This simple, but significant,improvement in taxpayer services would require significant coordination and agreement between the federaland subnational governments.
The Lack of an Effective Treasury System
Until very recently, Russia lacked a developed treasury system that would allow the easy transferof funds throughout the national territory. As a result, a powerful force in the design of the system ofintergovernmental fiscal relations historically has been the objective of minimizing the occurrence of financialflows and counterflows, whereby some funds would be sent to Moscow (e.g., collected federal revenues)while other funds would flow to the regions for some other reason (e.g., equalization transfers). Eventhough this would be considered merely an accounting issue in many other countries, in Russia the existenceof counterflows has taken on real significance and not just because of the lack of a developed nationaltreasury function. The regional governments in Russia have developed a mistrust of the ability andwillingness of the federal authorities to re-send funds to the regions once the funds get into the federalbudget accounts. The poor record of the federal government on this account is discussed in greater detailin Chapter IV on transfers.
III.6 Pending Reform Agenda in Revenue Assignments
There is an extensive reform agenda pending in revenue assignments. This reform agenda pertainsto both federal-regional relations and regional-local relations. In the federal-regional area a lot has beenaccomplished, but there are still some important issues that need addressing. These include:
C revenue sharing issues and apportionment problems;C problems with own source revenues;C extent of revenue autonomy; C vertical balance.
Several ongoing reform blueprints, including those in the draft Tax Code and the Concept ofReform of Inter-Government Fiscal Relations in the Russian Federation in 1999-2001, so far haverepresented missed opportunities for squarely addressing these issues. The Tax Code, if implemented,

The arrangement between the Canadian federal government and the province of Quebec may66
be the only example of a workable dual VAT between the national and subnational levels (Bird andGendron, 1998; McLure 1998). This dual system requires a high level of tax administration performance,not existing in Russia at the present time.
The case for non-standard sharing rates determined by formulas has been strongly made by67
Igudin (1998).
For so far as incomes vary within each region (as opposed to between regions), some68
redistribution at the personal level is naturally achieved.
-53-
would help address the issue of revenue autonomy but probably not by enough. The Concept, on the otherhand, is mainly silent on revenue assignment issues, other than recommending the use of stable sharing ratesfor a period of three years. At the regional-local level, the need for reform is even more dramatic sincemany regional governments still continue to use the old approach of bargaining budget levels and“regulating” taxes and transfers with local governments.
Revenue Sharing and Apportionment Issues
In purely technical terms, the VAT is one of the worst taxes to be shared with subnationalgovernments based on the location where the tax is collected because a mismatch frequently arises betweenthe VAT payment made in a region and the actual value added in that region. The crediting and debitingof the VAT in different regions makes the VAT absolutely unsuited for direct revenue sharing on the basisof payment location. Based on this argument, the VAT should be assigned 100 percent to the federallevel. But eliminating revenue sharing for the VAT will be politically difficult or even impossible. It actually66
was tried in 1991-92, in the Law of Basic Principles of Taxation yet regions did not comply with the law.The regions (and the Federation Council) see these shared revenues as their own revenues. As a result, amore appropriate alternative would be to share the VAT with the regions using a different apportionmentmechanism. For example, the VAT could be shared among the regions on a per capita basis, or based onother simple formulas.67
A second problem with revenue sharing is that a progressive PIT as is currently used in the RussianFederation (and as designed in the draft Tax Code) should not be assigned 100 percent at the subnationallevel. The purpose of progressive income taxation is to redistribute resources across the national territory.Given the large fiscal disparities between the regions, the current sharing arrangement accomplishes littleof that. A solution would be to keep the progressive PIT as a federal tax (with lower rates). Subnational68
governments would be granted the right to introduce a piggyback proportional income tax with minimumand maximum rates to be used at the discretion of the subnational governments with the same tax base asthe federal PIT.

A different problem is that an apportionment formula based on payroll and property would hurt69
regions that tend to buy more than they produce (i.e., poorer regions in general). One way to redress thisimbalance would be to introduce a third factor in the formula based on sales, as is common, for example,in the United States. However, the necessary information to implement this change is not available in Russiaat the present time.
The PIT is generally paid to the jurisdiction where the employer is registered. However, when70
individuals have more than one more source of income (and therefore have to file a tax return) the PIT ispaid to the place of residence.
See McLure (1994), McLure et al. (1996) and Mikesell (1998a).71
-54-
A third problem with shared revenues regards the apportionment of EPT revenues. Anapportionment formula that allots EPT revenues based on the average of payroll and property thatenterprises have in different regions already exists in the tax laws, and the draft Tax Code respects thisformula. The problem is, as already discussed, that the formula is not used except on rare occasions.69
Instead, enterprises pay all their taxes in the region where they are registered. The obvious solution to thisproblem is to require multi-regional enterprises to file tax returns in each of the regions where they operate.Clearly this would be viable only if the presently overwhelming filing requirements are simplified. As a resultof the current apportionment problems, the EPT should not be considered a good basis for revenue sharing.
One last issue in revenue apportionment, we have seen, is that in many cases the personal incometax accrues to the “place of work” jurisdiction and not to the “place of residence. ” However, it is more70
likely that individual taxpayers consume and demand public services more in their place of residence thanin their place of work. Internationally, regional income taxes are often based on the place of residence.
Revenue Assignment Issues
An important outstanding issue regarding own source revenues is whether taxes on naturalresources should be assigned to the regions (as is currently the case) or whether these revenues should bereassigned to the federal level. Valid arguments can be made on the side of allowing regions to keep theserevenues and on the side of turning them over to the federal government. The literature on this issue71
suggests that revenues from natural resource exploitation should generally flow to the federal budget, as acountry’s natural resources are often considered to belong to the nation as a whole. Also, accrual ofnatural resources taxes at the regional level could result in gross regional inequities. At the same time, feesthat compensate regions for the actual cost of exploiting natural resources should properly flow to theregions. The final arrangement for the sharing of these taxes will require a balance and national consensusbetween objectives involving economic efficiency and horizontal balance, on the one hand, and the rightfulcompensation to subnational governments for environmental damage and the exploitation of naturalendowments on the other. The discussion of the draft Tax Code at the State Duma and its consideration

However, a dual system can exist, in particular where the VAT is a central government tax and72
the retail sales tax is a subnational (regional) government tax levied at a relatively low rate and on the samebase as the VAT.
See “The Choice Between the VAT and the Retail Sales Tax in the Russian Federation,”73
Georgia State University Fiscal Reform Project, Moscow, November 1998.
-55-
by the Federation Council will provide the right forum to discuss these issues and reach the nationalconsensus and balance between national and regional interests.
A second issue with regard to the draft Tax Code is the assignment of the property tax to theregional level rather than to the local level of government. This assignment has been questioned becauseof international practice, where this tax is often used as a local tax. However, in the Russian Federation,assignment at the regional level may be justified for administration reasons. A reasonable compromise couldperhaps be found by requiring regional governments to share the tax with local governments and giving localgovernments discretion to add to the tax rate of the property tax within given limits. A further advantageof assigning the property tax at the regional level at this time is that local governments may have no incentiveto introduce this or any other tax if the lack of reform of the intra-regional finances implies that the additionalrevenues at the local level will be clawed back by the regional authorities. At this early stage ofdevelopment of the real estate property tax in Russia, the emphasis should be put on successfully finalizingthe pilot work in the cities of Novgorod and Tver and extracting useful lessons from the introduction of thistax in other subnational governments. Even though the property tax should play a very important role inthe financing of Russia’s subnational governments in the future, the reality at the present time is that this isa quite distant future. The lack of real estate markets, land ownership and multiple institutional constraintsare powerful obstacles for the development of an ad valorem real estate property tax in Russia.
Revenue Autonomy Issues
The most critical concern in the assignment of revenues is that subnational governments in Russiacontinue to lack adequate revenue autonomy. Revenue autonomy is the key element of a well functioningsystem of intergovernmental fiscal relations. The draft Tax Code provides a greater degree of revenueautonomy to the regions with the introduction of the regional sales tax. A subnational retail sales tax is intheory an adequate instrument to fulfill the goals of revenue sufficiency and autonomy at the subnationallevel. However, the serious problem with this approach is the high costs of administering and complyingwith a regional retail sales tax when a VAT already exists at the federal level. A move to a nationwide72
retail sales tax at a rate of 5 percent (or even 10 percent, as proposed earlier) and a reduction of the VATrate to 10 percent is neither optimal nor feasible in terms of revenues. Available estimates indicate that acombination of a reduction in the tax rate for the VAT and regional sales tax with a rate of 10 percentwould yield only 60 percent of the revenues now produced by the VAT. One of the important reasons73
for this difference is that the VAT is easier to collect because it is levied at different levels of production.If tax is not paid at some level, it can still be fully recovered at the next level. In contrast, a retail sales taxis only levied on final sales or at the last stage of production where it is most difficult for tax inspectors to

The VAT is generally a more efficient (economically neutral) tax than a retail sales tax. The74
problem with this later is that it is difficult to avoid the taxation of intermediate production without openingserious avenues for evasion.
The real estate property tax is planned as a substitute for three current taxes on property: the75
enterprise asset tax, the land tax and the individual property tax. (Table 21 shows the relative importanceof each of these revenue sources, while Table 22 shows how each of these taxes are shared amongdifferent levels of government.)
A piggy-back personal income tax for subnational governments has gained in acceptance in76
analytical and academic circles in Russia and has been proposed as part of the 1999 budget. Regionalaversion to a regional piggy-back PIT may be due to the fact that the revenues from the federal personalincome tax are currently assigned entirely to the subnational level.
-56-
enforce collections. In addition, the international experience indicates that a retail sales tax with a rate of10 percent will lead to considerable evasion.74
A second avenue of increased revenue autonomy in the draft Tax Code is the proposed regionalproperty tax. As pointed out above, while the real estate property tax has a great potential, it will takeconsiderable time for this tax to be fully functional. Realistically, this tax will not provide subnationalgovernments with added revenue autonomy soon. Meaningful and quicker added revenue autonomy at75
the subnational level could come from a “piggy-back” style regional personal income tax. This tax woulduse the same tax base as the national income tax and give regional governments the discretion to vary a flatrate up to a maximum set by the federal authorities. This is a proposal that has been on the table in Russiasince the beginning of the transition. 76
Vertical Balance and Revenue Assignments.
Among the most difficult problems to address in revenue assignments is whether or not the revenuesources provided to subnational governments are adequate to cover their financing needs. In order toanswer this question, one must first know what the expenditure responsibilities of subnational governmentsare and at which level of expenditures these responsibilities will be actually fulfilled. The second part, atwhich level the responsibilities will be actually fulfilled, is difficult or impossible to ascertain a priori. In factfor a decentralized system to be efficient, this issue should be decided by the electorate of subnationalgovernments. Giving subnational governments sufficient revenue autonomy offers the most practical solutionto the problem of vertical balance. If taxpayers of a subnational jurisdiction consider the level of provisioninadequate they can change this by changing their own taxes. Thus, revenue autonomy is the key not onlyto more efficient expenditures, but also to reaching vertical balance.

-57-
Revenue Assignments to Local Governments
In the revenue assignments between regional and local governments, little has been accomplished.Many regional governments continue to organize their relations with local governments as in the past. Forthese regions, revenue assignments are an afterthought for how a negotiated minimum expenditure budgetshould be financed. Addressing the reform of revenue assignments at the regional-local level in that contextwould be improper and ineffective. On a more positive note, an increasing number of regions are imitatingto some extent the reforms at the federal-regional level. It is clear that a piecemeal approach to revenueassignments at the regional-local level, such as the one followed by the Law of Financial Foundationsof Local Self-Government, has indeed been ineffective. What is needed at the regional-local level is areform of the entire budgeting process that governs the relationships between the two levels of governments.These reforms should not only address revenue assignments, but also expenditure assignments, transfersand the budget process itself. The federal government’s intentions to spearhead comprehensive reform inthis area raises important constitutional issues regarding the extent of federalism in the Russia. These issueshave just started to be addressed, such as was the case with the Law on Financial Foundations. Inessence, but not necessarily in an exact literal way, the steps that will be needed to reform regional-localrelations are the same as those for completing the reform of federal-regional relations. This is true whetherthe federal authorities find the ground to impose these reforms, as in a Subnational Budget Code, or theregions are left on their own to carry out these reforms. It is also clear that reforming regional-localrelations would be helped by having rational, stable and transparent relations between the federalgovernment and the regions.
Mutual settlements, as discussed later in this chapter, form an umbrella category of transfers,77
consisting largely of unbudgeted, non-transparent transfers which get allocated during the process of budgetexecution.
-58-
CHAPTER IVTHE SYSTEM OF TRANSFERS
Intergovernmental transfers in Russia provide a relatively small share of subnational revenues; in1997, the sum of all federal transfers to subnational governments amounted to only 14 percent ofconsolidated subnational revenues. At the same time, transfers are not an insignificant source of fundingfor many individual regions. For an average region, transfers account for 20 percent of the region’s budgetresources; for ten regions, transfers account for 40 percent or more of regional resources.
Intergovernmental transfers in the Russian system can be divided in two general categories:equalization transfers (transfers specifically provided for the purpose of equalizing differences in fiscalcapacities and fiscal needs across regions) and other transfers, including subventions, mutual settlementsand a number of other transfers. Equalization transfers were drastically reformed in 1994, when the77
system of negotiated subventions was replaced with a formula-driven equalization approach. However,the negotiated and non-transparent nature of mutual settlements continues to provide regions with softbudget constraints and presents regions with perverse collection incentives. At the regional-local level, inmany cases transfers are also still negotiated. This presents local governments with the similar problemsof soft budget constraints and perverse tax collection incentives.
This chapter is organized as follows. First, we consider the evolution of the Russian transfer systemduring the transition period. Second, we discuss the current system of transfers. Third, we analyze theperformance and incidence of all transfers during the economic transition period. Fourth, we summarizethe pending policy issues in the area of transfers and offer some policy recommendations.
IV.1 Evolution of the System of Transfers
The system of intergovernmental transfers from the federal government to the regions has gonethrough three distinct periods. These periods parallel the different periods of revenue assignments reviewedin Chapter III.

For 1996 the federal share of the PIT, set at 10 percent, was also excluded from the FFSR78
funds.
-59-
Transfers in the Early Years of the Transition
During 1992-1993 the bulk of all transfers were negotiated “subventions” to those regions forwhich own revenues and shared revenues were not large enough to fund the minimum expenditure budgetthat was negotiated, as a first step, with the Ministry of Finance. The entire budgetary process, and byassociation the determination of these lump-sum subventions, lacked transparency and was subject topolitical manipulation and pressure. Despite these shortcomings, as discussed in greater detail below, thesetransfers had some positive equalization effects. The same methodology of negotiated transfers wasfollowed at the regional-local level. Regions designed gap-filling subventions for those local governmentsin which own and shared revenues were not large enough to fund their minimum expenditure budgets.
The Reform of Transfers in 1994 In 1994 the Russian government introduced a new system of formula-driven equalization transfers
which, with some minor adjustments, was used until 1998. However, the formula was only used in earnestin 1994 and 1995; in later years, the formula's results were subjected to political negotiation. Alongsidethe formula-driven equalization transfers the government continued to use a number of other types oftransfers which were mostly of an ad-hoc and non-transparent nature.
The Fund for Financial Support of the Regions (FFSR), as the new system of equalizationtransfers was called, had two equalization “windows.” The first window (called “Regions in Need ofFinancial Assistance”) attempted to equalize the availability of revenues across regions. The second window( called “Regions in Need of Additional Financial Assistance”) attempted to provide additional funding toregions with unmet expenditure needs. The system first determined the overall level of funding and, second,allocated equalization transfers to the regions using two sets of formulas, one for each window.
The overall level of funding for the FFSR was determined every year in the federal budget. Thefunding rule for the FFSR has been subject to change virtually on an annual basis. In 1994, the funding forthe FFSR was set at 22 percent of the federal share of VAT collections. This was increased to 27 percentof federal VAT collections in 1995. For 1996 and 1997, the funding rule was changed to 15 percent ofall federal tax collections, exclusive of import duties. The 1998 budget lowered overall funding to 1478
percent of federal collections with the same exclusions.
The formula for the first window of the FFSR had three steps (Table 31). Although the basicformula did not change over the years, some of the coefficients did change from year to year. For 1997,the first step used revenues per capita adjusted from a base year (the most recent year for which data wereavailable) to equalize revenues across the regions. Revenue data from an earlier year were used to reducedisincentives to revenue mobilization. For the purpose of determining FFSR transfers, the RussianFederation was divided up into three groups of regions (two groups of regions in the Northern territories

In 1996 and before, the Federation was divided up into 11 groups of regions for this purpose.79
The scaling coefficient was 0.95 for the years from 1994-1996. The coefficient acts to scale80
down the level of equalization.
Until 1996, the base year for the purpose of measuring expenditure needs was 1993. The81
switch to 1991 was based on the belief that this year’s expenditures were more representative of actualexpenditure needs.
-60-
and one for the rest of the Federation) mainly to capture differences in the cost of living. Within each of79
these three groups, regions whose adjusted per capita revenue collection (based on the base year) werebelow 92 percent of the group average were entitled to capacity-equalizing transfers. Steps two and80
three of the first window determined the actual size of the transfer by apportioning the available funds tothose regions with a positive claim in the first step.
The formula for the second window of the FFSR (Table 31), in its 1997 version, was based onexpenditure data for the base year of 1991. These data were adjusted for changes in legislation for the81
years in between in order to approximate the levels of expenditure needs for all regions for 1997. Revenuecapacity for the second window was determined the same as in the first window. Each region’s claim toa transfer in the second window was then computed as the difference between the estimated expenditureneeds and the sum of adjusted revenues and the transfer from the first window (if any). Again, theremaining steps apportioned the funds allocated to the second window to those regions with positiveexpenditure gaps.
The FFSR system had several significant weaknesses:
C after 1995, the transparency and objectiveness of the FFSR approach was compromisedby subjecting the formula's results to political negotiations.
C the equalizing capacity of the system was limited by the fact that the funds available forequalization were a relatively small share of the subnational budget.
C continued changes in the formulas for both windows turned many regions against thesystem when the changes did not hold them harmless against losses of funding.
C there was a widespread perception that the mechanism did not achieve the goal ofequalization of resources between the regions.
C the use of actual revenue collections and actual expenditure per capita data from a baseyear did not accomplish the task of properly measuring fiscal capacity and expenditureneeds. For instance, the assumption that expenditures for 1991 reflected the expenditureneeds of the regions in 1997 was not realistic, especially in light of the sweeping changesin the economic structure of Russia during the transition period.
C the division of regions into geographical groups may have prevented equalization acrossgroups and did not control adequately for differences in the cost of living across regions.
C the formula for the second window essentially followed the “gap filling” philosophy of thesubvention system that was used during 1992-93 and previously in the Soviet Union.

See IEPT (1998), Freinkman et. al. (1998), and Morozov (1998), and Titov (1997).82
In the case of many federal mandates, current budget legislation does not require that these83
expenditures be compensated through mutual settlements. Instead, these expenditures (including theanticipated expenditures associated with federal mandates to be adopted during the year) are included intothe estimate of the expenditure needs of the regions, so equalization transfers should ideally include fundingfor these federal mandates and other expenditures. However, in reality federal mandates do not getcompensated either through mutual settlements or transfers.
Closed cities are part of the military-industrial complex and subject to maximum security. Their84
budgets have been handled directly by the Ministry of Finance and they are reputed to have enjoyed aprivileged standard of living (Campbell, 1996).
Some regions also receive support from the federal government via funds allocated to particular85
sectors or even to enterprises in particular regions, such as those in the coal industry or agriculture. A fewregions also have been granted the special status of tax free zone (IEPT, 1998).
-61-
C the gap-filling approach and the annual adjustment process arguably introduced perverseincentives in the FFSR system, as regions who increased revenue collections had alegitimate concern that their FFSR transfer would be reduced.
Beside the FFSR transfers, several other types of transfers were used during the 1994 to 1998period. None of these transfers were based on formulas or rules, and in many years, the funds allocatedthrough these other transfers exceeded those allocated through the FFSR. The most important of these82
other forms of transfers were “mutual settlements.” Mutual settlements are transfers arranged after theannual budget law has been adopted. However, in actuality mutual settlements form an umbrella categoryof transfers that include transfers to compensate regional governments for mandates or the delivery offederal programs, emergency transfers, and transfers in lieu of financing regional investment programs inthe federal budget. Many different forms of negotiated and discretionary funds were also included in83
mutual settlements. Since 1994, a key component of mutual settlements has been ex-post negotiatedpayments to subnational governments for the maintenance of housing. A key (negative) feature of thesemutual settlement transfers is that these funds were never budgeted. Instead, these transfers weredetermined and negotiated in the process of budget execution. All but a handful of regions were recipientsof mutual settlement funds.
Other transfers used in the Russian system of intergovernmental fiscal relations include grants to thecity of Moscow for performing the role of capital city, to the city of Sochi, to the Northern territories forthe delivery of goods, and grants to “closed” cities. Although not transfers per se, “budget loans” from84
the Ministry of Finance to regional governments often became transfers when they were written off afterthe close of the fiscal year. As in the case of mutual settlements, many of these other transfers have beenassigned on an ad hoc basis and have lacked transparency (Morozov, 1998).85

See Boex and Martinez-Vazquez (1998a) for a complete review of the new equalization formula86
and suggestions for improving the formula.
For 1999, the FFSR is budgeted to receive 14 percent of applicable federal revenues. Based87
on the draft Medium Term Fiscal Plan for the Russian Federation, the FFSR fund is planned to shrinkfurther to 11 percent by 2001.
-62-
The Reforms of 1998
The general dissatisfaction with the FFSR mechanism used since 1994 led to its gradual demise,as the formula’s results were subjected to modification through political negotiations between the StateDuma and the regions from 1996 to 1998. For 1999, the Russian government has introduced a newequalization formula for the FFSR. The new mechanism has only one window and the formula has beensimplified (see Table 32). The crux of the formula consists of the use of index of budget expenditures(or expenditure needs) to “normalize” or adjust per capita revenues. The new formula assigns equalizingtransfers to regions for which the normalized per capita revenue falls below some threshold.
IV.2 The Current System of Transfers
Three elements of the current system of transfers are considered in this section: equalizationtransfers, other transfers (mutual settlements, etc.), and regional-local transfers. While budget loans aresometimes considered transfers due to the high frequency with which they are forgiven by the federalgovernment, they will be considered as part of deficit finance in Chapter V.
Equalization Transfers
The new formula for the FFSR is an improvement over the past formula. It is simpler and it getscloser to the ideal of using “fiscal capacity” and “expenditure needs” rather than actual revenues andexpenditures for a base year as the standards for equalization. Like the original FFSR mechanism, the86
new formula for the FFSR also has two components: the determination of funding and the equalizationformula. The overall level of funding for the FFSR will still be determined in the annual budget as a shareof federal tax revenues exclusive of import duties. This is the first step of the new equalization formula87
(Table 32).
The basis of the new equalization mechanism is formed by a measure of revenue collections (orfiscal capacity; step 2) and a measure of budget expenditures (or expenditure needs, step 3). Themechanism then “normalizes” each region’s level of fiscal capacity by the index of expenditure needs (step4). The normalization of per capita revenues means that regions with higher expenditure needs areconsidered to have lower normalized per capita revenues. Each region that has below-average normalizedper capita revenues could potentially receive a equalization transfer. However, if insufficient funds are

More accurately, the plans call for the possible phasing-in of budget norms during 1999 for88
housing and utilities, health care, education, social welfare, public transportation, culture and publicadministration. For the year 2000 all regional expenditure needs should be solely determined on the basisof norms.
Numerous attempts have been made in the past years to estimate different indices of need.89
Lavrov (1998) discusses these indices, including those developed by the Ministry of Finance, the Ministryof Economy, the Central Research Institute of Economics, the State Committee for Construction and soon. He finds that there are very significant correlations among most of them.
-63-
available to equalize all below-average regions, the equalization threshold is gradually lowered until theneediest regions can be pulled up to the threshold level (steps 5 and 6).
The crucial issue for the performance of the current formula is the specification of the measures offiscal capacity and fiscal need. As currently conceived, the new equalization formula uses per capitarevenues as a proxy for fiscal capacity. For 1999 the measure of per capita revenues will be based on1997 data. For future years, it appears that the plan is to either make annual adjustments to the measureand eventually to substitute per capita revenues with a more appropriate measure of regional fiscal capacity.As a proxy for expenditure needs, the plans are to use a measure of differences in the cost of living acrossgroups of regions for 1999. For future years, the Ministry of Finance expects to develop a comprehensiveset of norms to estimate differences in expenditure needs across regions.
The selected measures of fiscal capacity and fiscal need present two main areas of concern withthe new FFSR formula. With regard to the measure of fiscal capacity, using actual collections data for 1997for the 1999 budget will continue to send the wrong message to the regions regarding their levels of taxeffort. When up-to-date data for tax bases or the composition of gross regional product (GRP) becomeavailable it will be possible to improve on the measure of fiscal capacity.
The second main area of concern is the proposed use of expenditure norms for the purpose ofcalculating regional expenditure needs by the year 2000. Whether the plans are to go back to using88
“physical norms” (as those used in the Soviet era) or more broadly defined per capita norms is not clearat this time. However, it is clear that these norms will be approved by law. While there is no problem89
with the use of cost or funding standards in the formulation of the budget, there are important problemsassociated with the explicit use of norms legislated in the law. Three of these problems are as follows:
Budgeting from Norms Results in Suboptimal Fiscal Management. A conspicuous feature ofbudget preparation in Russia is the philosophy or the overall belief that budgets should be viewed from aperspective of needs rather than from a perspective of feasible public services given the current revenueresources. This perspective has led to a history of unrealistic budgets and poor performance.
It should be understood that all budget practitioners de facto use some form of norms orexpenditure benchmarks to compile a budget. There is inherently nothing wrong with this practice.However, it is problematic when norms or benchmark expenditure levels for different functional expenditure

-64-
categories are established by law or fixed in some other way without considering the attached fundingimplications. This carries the risk of raising the expectation that a certain level of public services will beprovided, while sufficient funds may simply not be available to deliver these services. This is the approachfollowed in the previous regime; it clearly did not work then and it will not work now. In contrast, de factonorms can be used to assist budget practitioners in successfully allocating funds within the relevant budgetconstraint without raising such expectations.
Also, in a decentralized federalist system the role of the federal government in providing forequalization between different regions is often less extensive than in the Soviet tradition. Indeed, a certaindegree of variation in regional expenditures should be considered beneficial as it allows regionalgovernments to adjust spending patterns to region-specific concerns and respond to regional demands forpublic services. In addition, the use of budgetary norms would convert the budgetary process into an input-oriented activity, making it more difficult to focus on budget performance and the level and quality ofservices. In general, budget norms tend to suppress the practice of budget evaluations,
Physical Norms Provide Wrong Fiscal Management Incentives. Perhaps the most importantdrawback of budgetary norms based on physical measurements is the fact that these norms provideincentives that are not compatible with the goal of the efficient allocation of budgetary resources. Forexample, physical norms based on physical infrastructure capacity (number of schools, number of hospitals,etcetera) give subnational governments an incentive to generate excess capacity or preserve obsoletecapacity.
In addition, the use of physical expenditure norms in the assignment of transfers may actually causegreater inequality between the regions. Greater disparities could occur if, under the present regime,wealthier or politically favored regions have been able to enlarge their physical capacity (for example, morehospitals or universities) than poorer or less favored regions with similar public services needs. If physicalexpenditure norms are used to measure expenditure needs, the wealthier regions would be considered tohave greater need and thus receive a greater share of the equalization fund.
It should be noted that such problems can be avoided by setting per capita monetary norms insteadof physical norms. If expenditure need is measured by something other than physical measurements, publicofficials will have an incentive to close up (rather than maintain) excess capacity in schools and clinics andto allocate the available funds to improve the quality of service at the remaining locations.
Norms Are Not Transparent and Are Administratively Costly. A further argument against theadoption of expenditure norms is that the use of a large number of norms causes the budgetary system tobecomes complex and administratively costly while losing its transparency. Especially the practice of settingexpenditure norms in isolation of revenue availability is likely to result in public disenchantment andfrustration. If revenues fall short to fulfill the announced norms, the expenditure norms will have to bereduced through negotiations to achieve budgetary balance. This raises the concern that in the time ofseveral years, the measure of expenditure needs may once again become so convoluted that theequalization system will de facto return to a situation of politically negotiated transfers. In addition, the useof physical norms will result in public frustration and political friction as taxpayers feel cheated when the

-65-
government cannot fulfill its promises and place blame with subnational elected officials who are unable todelivered the level of services established by the norms.
A variety of measures of expenditure need exists which could be used in the allocation ofequalization transfers. One measure that has recently received increased attention from the Russiangovernment is the Representative Expenditure System, a measure of expenditure needs developed by theU.S. Advisory Committee on Intergovernmental Relations (1990). Although this approach is theoreticallysound, it assumes the existence of budgetary discretion and revenue autonomy by subnational governmentsat levels which have not been in place during the transition in Russia.
Mutual Settlements and Other Transfers
Despite the continued reform of the FFSR mechanism, the Russian government has continued torely on mutual settlements and other ad hoc types of transfers. In this category, mutual settlements are thedominant form of these other transfers, accounting for about 25 percent of all transfers (including the FFSR)and 75 percent of non-equalization transfers. Mutual settlements were already in existence before thetransition and they were used to compensate the budgets of lower-level governments for changing in taxlegislation or the adoption of federal laws introducing new expenditure mandates. During the transition,mutual settlements have been mostly a one-way stream of transfers from the federal to regionalgovernments, and their content has been enlarged to include emergency grants, block grants and settlementsto substitute for the financing of regional investment programs (Morozov, 1998).
A final group of transfers consists of block grants to the cities of Moscow, Sochi and the “closedcities” as well as some “subventions.” These subventions are truly earmarked grants which may beallocated for capital expenditures or for current expenditures. The State Duma determines these grants innegotiations with the government and the regions. This group of transfers accounts for approximately 25percent of all non-equalization transfers, but only as 10 percent all transfers.
Two main issues arise with regard to the manner in which these non-equalization transfers havebeen allocated. First, these transfers fail to provide a stable budgetary environment as none of them areallocated based on objective, pre-determined and transparent criteria such as formulas. Earmarkedtransfers continue to be allocated through bargaining and budget negotiations; mutual settlements most oftenare not budgeted at all. Second, in combination with the availability of budget loans and other means offinancing for current expenditures (discussed in Chapter V), mutual settlements continue to provide a softbudget constraint for regional governments.
Regional-Local Transfers
As discussed in Chapter II (expenditure assignments) and Chapter III (revenue issues), to a largeextent regional-local relations continue to mirror the system of intergovernmental relations during the Sovietregime. Often, minimum expenditure budgets are negotiated between the regions and local governments

-66-
supposedly based on a number of expenditure norms. The revenue gap between a locality’s expenditureneeds and own and shared revenue sources is addressed using negotiated gap-filling transfers. Thecontinued reliance on this outdated approach preserves the major incentive problems at the regional-locallevel that were prevalent in the previous system.
Some regions have moved to introduce standard sharing rates for revenue sharing within theregions; this is the case in Sverdlovsk, Penza and some other regions (Igudin, 1998). Most often whenrevenues are shared at a standard rate, the local shares tend to be relatively low to avoid wealthier districtsand municipalities from attaining large fiscal surpluses. This leaves an increased role for transfers at theregional-local level.
The analysis of one specific region may provide some additional insights into the issues surroundingintra-regional relations. Recently, Bahl et al. (1998) provided a comprehensive review ofintergovernmental transfers in Leningrad oblast. Leningrad oblast uses three types of grants for its localgovernments: subventions, paid to local governments as earmarked grants to cover price subsidies formedicines and to partially compensate communications companies for mandated rate reductions forpensioners and others; subsidies, which are paid to local governments essentially as gap-filling transfers tocover the general shortfall between the minimum expenditure budget and the rayon’s other revenue sources;and mutual settlements, which basically serve a similar purpose as they do at the national level of ex-postunbudgeted transfers to lower-level governments. The role that mutual settlement play within Leningradoblast’s system of transfers is more important than at the national level, accounting for about 45 percentof all regional transfers. The gap-filling subsidies account for approximately the same share of regionaltransfers; the earmarked transfers only cover around ten percent of all regional transfers.
IV.3 How Has the Transfer System Performed?
Transfers Have Been Relatively Small And Tended to Decrease over Time
At their peak in 1994, on average transfers represented 35.8 percent of funding for regionalgovernments. As shown in Table 33, by 1997 the significance of transfers and other settlements haddeclined to only 19.8 percent. The decline in the importance of intergovernmental transfers as a subnationalsource of funding has been taken up largely by “other sources of financing,” mainly consisting of budgetloans and different forms of borrowing. The most significant decrease in transfers took place in 1995; whilemutual settlements and other (non-equalization) transfers on average represented 26.4 percent of allregional funds in 1994, this percentage dropped to 5.6 percent in 1995. The relative role of equalizationtransfers in subnational budgets has remained fairly constant over the last three years. In 1997, an averageof 15.6 percent of subnational public funds of all regions consisted of FFSR transfers.
The level of federal transfers to the regions expressed as a share of GDP provides yet anotheruseful perspective on the relatively small significance of these funds (Table 34). In 1997, total federal

Le Houerou and Rutkowski (1996), Stewart (1996), and Martinez-Vazquez and Boex (1997)90
concluded that transfers, for the most part, have not been equalizing. In fact political considerations, inparticular the appeasement of regional troublemakers, have been identified as more important determinantsof the flow of transfers to the regions (Treisman, 1996; 1998a,b).
See Table 10 for the descriptive statistics of these variables.91
-67-
transfers (excluding budget loans) represented 1.92 percent of GDP. When budget credits and loans fromthe federal government to the regions are also taken into consideration, this figure increased to 2.67 percentfor 1997. These figures have been more or less representative of the past five years. The exception was1994, when the introduction of the FFSR and a sharp increase in mutual settlements pushed total federaltransfers and loans to the regions to 4.21 percent of GDP. In real terms (1995 prices) per capita transfershave been up and down over the past years. For an index of 100 for 1994, federal transfers (excludingbudget loans) to the regions had been at 22.7 in 1992 and at 41.4 in 1997 (Table 35).
Although by design the FFSR is supposed to be equalizing, this mechanism has been criticized sinceits introduction in 1994 for failing to accomplish this objective. A different but also important question iswhether all other transfers have had an equalizing effect. If this was not the case, to what extent did thesetransfers offset the equalization obtained through the FFSR? It is important, therefore, to consider theequalizing effect not only of the FFSR, but of the entire system of transfers, and ultimately of the entiresystem of intergovernmental relations.
Have Transfers Been Equalizing?
Whether the FFSR has actually been equalizing has been one of the most analyzed issues in Russianfiscal federalism and, to some extent, the answer to this question depends on how one chooses to answerit. The influence of economic factors on the allocation of transfers is analyzed in Table 36 and 37. In90
Table 36, per capita FFSR transfers are regressed on per capita GRP (a measure of fiscal capacity) andseveral measures of need (cost of living, percent of the population under and over working age, and percentin poverty). For all years the coefficient for per capita GRP is negative, and statistically significant for the91
last three years. Thus, wealthier regions receive fewer FFSR transfers. The positive and statisticallysignificant coefficients in all years for cost of living and young and old population also tell a strongequalization story. On the other hand, the percent of the population living in poverty in a region neveraffected the FFSR transfers in any of the years under consideration.
The regression analysis of per capita “other transfers” for the years 1994 through 1997 (Table 37)tells a similar, but not as compelling, story of equalization. The category “other transfers” is defined toinclude subventions, mutual settlements and some other types of minor transfers, but excludes budget loans.The regression coefficients for per capita GRP are always negative but only statistically significant for twoout of the four years. Regions with higher expenditure needs, as measured by the cost of living and percentof the population under and over working age are also positive, but not always significant for 1994 to

Stewart (1996) also notes that both FFSR and other transfers can be interpreted as equalizing92
vis-a-vis expenditure needs.
The dependent variables in Tables 36 and 37 do not take into account the fact that transfers to93
different regions may actually provide different levels of fiscal support due to regional price differences.All else equal, a federal transfer to a region with a relatively lower price level has a more equalizing effect.Therefore, the regressions contained in Tables 36 and 37 were also estimated using real per capita transferslevels (adjusted for the regional cost of living) as dependent variables. The regression results andconclusions were unaffected by this adjustment.
Disparities in expenditures per capita are discussed more fully in Chapter II.94
-68-
1996. However, in 1997 these transfers became dis-equalizing in terms of “needy” population; the92
regression coefficients for the young and old population became negative and statistically significant. Thissuggests that in 1997 regions with a disproportionally small economically active population receive fewer“other transfers.”93
Thus, what is the conclusion on the question of whether the allocation of transfers has beenequalizing? Probably the right answer is that FFSR transfers overall have been equalizing. The incidenceanalysis in Table 36 suggests that economic factors have been important in determining the allocation ofFFSR transfers and that these transfers have been allocated in an equalizing manner. This is not the casefor the “other transfers” analyzed in Table 37. The explanatory power of the economic variables includedin the regression has steadily declined over time; by 1997, only roughly one-third of the variation in thesetransfers could be explain by economic variables. As far as economic factors do influence the allocationof these transfers, the parameter estimates suggests a much weaker pattern of equalization for “othertransfers” than is the case with the FFSR.
Further analysis suggests that transfers on the whole have had a limited impact on reducing fiscaldisparities. This is shown in the regressions in Tables 38 through 41. These tables analyze the impact ofFFSR transfers and other transfers on per capita expenditure disparities across regions in the context ofthe rest of the fiscal system. This analysis is carried out separately for each year from 1994 to 1997. Foreach year, we define five dependent variables in per capita terms: total collections in the regions (whichincludes the federal share of shared taxes), regional revenues before transfers of any kind, regional revenuesafter FFSR transfers, regional revenues after all transfers, and finally regional expenditures. Comparing theparameter estimates for each step with the previous step allows us to conclude whether or not the step hasbeen equalizing.
With a few exceptions, the impact of transfers has been to reduce the role of fiscal capacity (percapita GRP) in the allocation of subnational resources. In addition, transfers have generally been allocatedto regions with higher expenditure needs (as proxied by cost of living, and percent old and youngpopulation). Ultimately, the equalizing impact of transfers has weakened considerably in later years. And,as the regressions for per capita regional expenditures show, differences in regional fiscal capacity continueto cause substantial disparities in regional expenditure levels. 94

The same set of regressions but with tax effort defined in terms of overall collections (including95
the federal share) are presented in Table 43. The results are virtually similar to those obtained when onlyregional revenues are incorporated in the measure of tax effort.
Other control variables are used in these regression explaining the variation in tax effort across96
regions. These parameters suggest that regions with higher per capita GRP and more dependent onrevenues from the PIT tend to exert a lower effort. Those regions more dependent on business and salestaxes tend to exert higher tax effort
-69-
Have Transfers Discouraged Tax Effort By Regional Governments?
One of the most serious criticisms of the system of equalization transfers in force for the 1994-1997period was that its formulas gave regions the perverse incentive to lower their tax effort. This issue isexplored in the regression in Table 42. In these regressions, the dependent variable, tax effort, is definedas the level of regional tax collections expressed as a percentage of gross regional product (GRP). The95
regression coefficient for FFSR transfers (defined as a percent of total regional expenditures) is negativefor all four years and statistically significant, except for 1997. The negative impact of FFSR transfer on taxeffort is not extremely pronounced but neither is the impact immaterial. For example, in 1996 for every tenpercent increase in FFSR transfers as a share of the regional budget, other things equal, the tax effort ratiodecreased by one-half percent. 96
The empirical evidence indeed appears to suggest that FFSR transfers have discouraged tax effort.However, shortcomings in the way in which tax effort is defined (as the ratio of revenue collections to GRP)allows for alternative explanations. It is possible that GRP is a poor measure of regional fiscal capacity dueto the fact that it does not consider the economic composition of a region. For example, the measure ofGRP may overstate the fiscal capacity of regions that rely heavily on agricultural production. If theseagricultural regions have a more limited ability to raise revenues, then the measure of tax effort (thedependent variable) would understate their actual level of effort; as a result, the regression would reveala negative relationship between tax effort and FFSR transfers. Also, the measure of fiscal effort may alsofail to take into account higher expenditure needs for certain types of regions. If regions for which GRPoverstates their fiscal capacity systematically have greater legitimate expenditure needs (for example, formaintenance of infrastructure), this could again result in an allocation of greater amounts of FFSR transfersto regions with a lower level of measured tax effort.
Discouragement of tax effort has been more pronounced at the local level where negotiatedminimum expenditure budgets, regulating sharing rates and negotiated transfers often still prevail.Zhuravskaya (1998) studied the budgets of 35 large cities in 29 regions from 1992-97 and found that forevery ruble that local government own revenues increased in a given year, about 90 kopeks were clawedback or extracted by reductions in transfers and/or tax sharing by the regional governments.
Many reform proposals have suggested in recent years. See Rafuse (1996), Martinez-Vazquez97
and Boex (1997), Lavrov (1997), IEPT (1998), Morozov (1998), and Boex and Martinez-Vazquez(1998a).
-70-
Budgeted Transfers and Actual Transfers Have Differed Considerably
One important source of dissatisfaction among the regions with the FFSR has been the time lagbetween the crediting of taxes to the federal budget and the final remittance of funds to the regions fromthe FFSR. Indeed, the problems in administering the FFSR have gone beyond delays. The record onactual implementation of budgeted transfers is poor. As Table 44 shows, there have been significantdeviations, in both directions, from the budgeted amounts to the actual amounts received in the executionof the budget. These deviations, present for 1995,1996, and 1997 are hard to explain; anecdotal evidencesuggests these deviations may be the result of political factors. However, these deviations may also havearisen due to the extensive use in recent years of budgetary loans.
IV.4 Pending Policy Agenda for the Reform of Transfers
The overhaul of the entire system of transfers is crucial to the overall success of the reform ofintergovernmental relations in the Russian Federation. Without addressing the current problems with thetransfer system as a whole, subnational governments will continue to face fiscal incentives that rewardirresponsible fiscal behavior.
The Russian government’s reform agenda in the area of transfers is outlined in the “Concept ofReform of Inter-Governmental Fiscal Relations.” The reform agenda with regard to transfers shouldcontain reform proposals in three broad policy areas. First, improvements to the new FFSR equalizationmechanism should be considered. Second, sweeping reforms are needed to replace the current systemof non-transparent and ad-hoc mutual settlements, forgiven loans and special subventions, with a systemof budgeted, objective and transparent transfers that target federal government objectives other thanequalization. Third, the issue of regional-local transfers needs to be redesigned in the context of widerreforms in revenue assignments and the assignment of expenditure responsibilities.
Reforming the System of Equalization Transfers 97
The introduction of the formula-driven equalization mechanism in 1994 and its further improvementin 1998 were two major steps in the direction of a objective, transparent and effective equalizationmechanism. Nonetheless, a number of issues continue to prevent the FFSR from achieving its intendedgoals.
The Funding Rule. The funding rule for the FFSR should be reevaluated in light of a number ofconsiderations. First, the determination of the appropriate funding level for the FFSR is clearly a politicalchoice that requires finding a balance between the objective of equalization and spending on other

-71-
government programs. In this regard, it is also important to realize that the redistribution of funds to poorerregions inevitably requires taxing better-off regions, which in turn, may slow overall economic growth. Asecond consideration in the determination of the funding rule is the trade-off between stability and flexibility.The current approach of deciding the level of funds in each year’s budget provides the federal governmentwith desirable flexibility, but it sacrifices certainty for regional governments. A common internationalpractice is to fix the overall funding as a percent of central government revenues for a period of three years,which can only be altered in the case of an a priori stipulated emergency situation. This may also be aworkable compromise for Russia. A final consideration with regard to the funding rule is the modality forfinancing the equalization mechanism. Equalization can be achieved either through vertical arrangements(using federal sources) or through a horizontal or “fraternal” approach (sharing of regional sources). In thelatter case, better-off regions would have to contribute some of their own revenues to an equalization fund.The “fraternal” approach, common in Scandinavian and some Central European countries, and also partiallyadopted in the Baltic states, is unlikely to be accepted in Russia.
Improving the Equalization Formula. A second set of issues surrounding the equalizationmechanism focuses on improving the equalization formula. Improvement of the formula is suggested in threedirections:
C The measure of fiscal capacity used in the equalization process should be improved toavoid the incentive problems raised by using past actual collection. A number of fiscalcapacity measures that could serve this purpose are discussed Boex and Martinez-Vazquez (1997a) and computed for the regions of the Russian Federation in Boex andMartinez-Vazquez (1997b).
C Similarly, the measure of regional expenditure needs should be reconsidered. Alternativemeasures of expenditure needs are per capita monetary expenditure norms, indices of fiscalneeds based on broad social and economic measures of need and the RepresentativeExpenditure System. The use of monetary norms and expenditure needs indices asmeasures of fiscal need is discussed by Boex and Martinez-Vazquez (1998a). Apreliminary approach and initial estimates for a Representative Expenditure System for theRussian Federation were developed by Rafuse (1996).
C A third, more arguable improvement to the equalization formula would be the introductionof stimuli to increase the level of tax effort by regional governments. The reforms of 1998did not incorporate any such stimulus to tax effort. Instead, in order to increase the taxeffort of regions, each FFSR recipient-region was required to put in place a program toincrease own revenue collections. These programs must be approved by regionallegislative acts as well as by the Ministry of Finance of the Russian Federation. Althougha generally accepted principle in fiscal federalism is that transfer systems should neitherencourage nor discourage tax effort, encouraging tax effort may be temporarily justified ifa problem with subnational collections exists such as in the case of Russia. Introducing astimulus to tax effort in the equalization formula is not complicated and it should prove

See Boex and Martinez-Vazquez (1997a) and Martinez-Vazquez and Boex (1997). The98
provision of incentives to encourage tax effort does raise a number of policy issues. For example, Table42 suggests that over the period 1994-1997, the relative level of tax effort exerted by wealthier regions hasincreased over time. Fiscal incentives to increase tax effort could therefore make the system of transfersless equalizing.
The 1998 Budget of the Russian Federation mandated the distribution of 1.2 billion rubles among99
“depressed regions.” The Budget neither proposed any scheme or formula for the distribution of these fundsnor identified the “depressed regions.” A few other countries besides the Russian Federation set aside aspecial pool of transfer funds for depressed or especially disadvantaged regions. For example, Canada’sTerritorial Formula Financing provides special transfers to disadvantaged regions (Yukon, North WestTerritories and Nunavut Territories).
See, for example, Martinez-Vazquez, Boex and Bahl (1998).100
-72-
more effective and much simpler than signing separate revenue raising agreements with theregions.98
The overriding objective of these reforms would be to arrive at a transparent equalization formula thatachieves its goal of equalization without unnecessarily providing incentives to the regions to lower revenuecollections.
Depressed Regions. A third issue in the design of the equalization mechanism is whether or notthere is a need for special transfers or a special fund for “economically depressed” regions in Russia. This99
option may be quite suited to Russia given the large fiscal and economic disparities between the regions andthe fact that there is a core of regions that is dismally poor. At the same time, the newly introducedequalization formula already focuses much greater attention on the neediest regions than was previously thecase. The implementation of an equalization program for economically depressed regions would call forcriteria to objectively identify depressed regions and require an adapted formula to distribute the availablefunds among the qualifying regions. 100
Holding Harmless. A final consideration with regard to the formulation of equalization transfers iswhether or not regions should be held (partially) harmless for the reform of the equalization system. Theexperience during the discussion of the 1997 and 1998 budgets by the State Duma clearly indicates theimportance of this issue. Reputedly, one main reason for the dissatisfaction of the State Duma with theFFSR allocations for the 1998 budget was that it would harm a number of regions vis-a-vis what theseregions received before. The obvious advantage of holding regions harmless is that reforms become morepolitically acceptable. The disadvantage of holding regions harmless is that it sacrifices funds that wouldbe otherwise available for equalization. Nevertheless, some transition measures should be considered ifthey result in political acceptance for an improved equalization mechanism.

One lesson in grantsmanship design, not yet internalized in Russia, is that the pursuit of multiple101
objectives with one single instrument seldom performs as desired. The use of equalization grants from theFFSR for funding part of the regional health insurance funds in 1997 is an example of this confusion ofobjectives.
The option of matching grants has not been given strong backing in government circles in the102
past because of the lack of an appropriate regulatory and enforcement framework to enforce matchingrequirements (Morozov, 1998)
Morozov (1998) states that all federal transfers have had an anti-capital investment bias.103
However, to the extent that these transfers have been mostly lump-sum, regional governments were inprinciple free to use these funds for capital investment. Perhaps, it would be more appropriate to say thatnone of the transfers had the explicit objective of promoting investment in infrastructure by subnationalgovernments.
-73-
Introduction of Categorical Transfers
While a great deal of attention has been paid to the reform of the FFSR, the reform of theremainder of the transfer system has received insufficient attention. The current myriad of transfers, includingmutual settlements, forgiven loans, and other forms of transfers, provide an unstable and non-transparentsource of funding for regional governments while providing perverse fiscal incentives. The use of mutualsettlements should be discontinued in favor of a system of formula-based, transparent and objectivecategorical transfers.
The public finance literature suggests that, in addition to equalization, intergovernmental transferscan be used to pursue several types of legitimate federal policy objectives. In order to achieve thesemultiple goals, the Russian government should design a system of transfers using separate transfer programsfor each of the separate objectives that it wants to pursue. A general constraint in the design of transfers101
in Russia has been the limited ability of the federal authorities to monitor the actual behavior of regionalgovernments and the lack of enforcement mechanisms. Notwithstanding those problems, the federalgovernment could introduce the following:
C explicit categorical grants, earmarked for programs of national policy significance such asthose in education, health, or the environment;
C direct transfers to compensate subnational governments for federal programs implementedby subnational governments or to compensate regions for previously unfunded mandates;
C a set of matching grants to provide incentives to subnational governments to increaseexpenditures in areas with externalities, such as different forms of infrastructure, or again,those with national significance such as education and health.102
One feature of Russia’s system of transfers has been the lack of focus on capital investmentneeds. This is important not only because of the vast need to rehabilitate and expand social and physical103
infrastructure but also because there exist very significant differences in capital infrastructure among the

A set of proposals for improving on this fund are presented in Morozov (1998). These include104
the canceling out or freezing of the majority of the federal earmarked programs, the reduction in theirnumbers, and the implementation of a smaller number of programs as closed-end matching grants.
-74-
regions with which they were endowed under the former Soviet Union. The “Concept of Reform of Inter-Governmental Fiscal Relations” calls for the creation of a new transfer fund, “Investment Support ofRegional Development,” to address the lack of focus in the past on capital infrastructure at the subnationallevel. This is not, properly speaking, a separate fund, but rather a methodological integration of federal andregional programs and sectoral programs on investment already taking place. The main idea of thisapproach is to create an integrated investment plan for the regions under the coordination of the Ministryof Economy which would provide matching capital investment grants to the regions. This may prove to bethe right approach to the needs for capital infrastructure at the subnational level, presuming the processdoes not become overly bureaucratic.104
The “Concept of Reform” also calls for the creation of the “Regional Finance Development Fund”with the objective of providing incentives to subnational governments to reform their public finances andto encourage revenue raising and expenditure rationalization. This would be accomplished through thegranting of loans with conditionality for reform by the regions. This will also prove to be a useful programif it is used to encourage the implementation of a Regional Budget Code. But this latter has not been yetdeveloped.
Reforming the System of Regional-Local Transfers
As pointed out earlier in this chapter, at the regional-local level transfers are often still used for gap-filling purposes. Indeed, in many regions the entire system of regional-local relations has simply beencarried over from the previous system. Since this system is based on a “minimum expenditure budget,”regulated sharing rates and gap-filling transfers, the mechanism lacks any incentives for local governmentsto collect any own source revenues. Although expressly forbidden in the Law on the FinancialFoundations of Local Self-Government of September 1997, many regions continue the practice ofclawing back increases in local collections by reducing transfers to localities. The heedless use of gap-fillingtransfers at the regional-local level will perpetuate both the poor fiscal incentives as well as the resultingsuboptimal fiscal behavior at the local level.
As concluded in Chapter III, what is truly needed at the regional-local level is a reform of the entirebudgeting process that governs the relationships between the two levels of governments, including theallocation of transfers. However, such an overhaul cannot be simply mandated or imposed from the topdown and will take time to take hold. In the mean time, several improvements can be made within theframework of the current system of transfers at the regional-local level that would greatly reduce theincentive problems associated with the current system. These improvement would rely on using measuresof expenditure needs (as opposed to actual expenditures) and revenue capacity (as opposed to actualrevenue collections) for the determination of local governments’ “minimum expenditure budgets” andintergovernmental transfers (Bahl et al., 1998). In addition, if an adequate Treasury system is put in place
-75-
it will be possible to downplay minimizing financial counterflows as an objective in the design of the systemof regional-local fiscal relations. This will allow regions to focus on the main objective of reaching bothvertical balance and horizontal balance in the allocation of regional resources.
Projects that provide technical assistance to regional government in the reform of intra-regionalfiscal relations in certain pilot regions have the ability to demonstrate to other, more hesitant regions, thatreform of intra-regional fiscal relations can be beneficial to both the regional government and the localgovernments. The federal government could accommodate the sharing of positive reform experiences byholding conferences and seminars on the issue for regional government official and by providing otherregions with documentation on the success stories of regional reform. At the same time, any direct federalinvolvement in any comprehensive reforms in this area would raise constitutional as well as politicalconcerns. Given the antagonistic position of many regions toward federal interference in regional-localrelations, it may be well-advised for the federal government to limit its role in reforming regional-localtransfers to educating regions about the severity of the disincentives, developing and providing legislativesupport for a Subnational Budget Code, promoting the voluntary use of formula-based transfer systemsby the regions, and setting a good example regarding the responsible use of transfers.

-76-
CHAPTER 5SUBNATIONAL BORROWING, DEBT AND FINANCIAL CONTROLS
Reform of the legal framework for subnational borrowing and debt forms the capstone of a solidsystem of intergovernmental fiscal relations in the Russian Federation. Responding to increasing budgetarypressure and a permissive regulatory framework, subnational governments over the transition period haveincreasingly resorted to borrowing and other types of deficit financing to maintain their levels of expenditure.In more recent years, federal authorities have become increasingly concerned about the dangers to nationaleconomic stability and the lack of responsible fiscal management arising from the permissive approach tosubnational borrowing. As a result of these concerns, the Russian government has started to take measuresto limit the borrowing power of subnational governments.
In this chapter, we first discuss the legal framework for subnational borrowing in Russia during thetransition. Second, we present an analysis of the trends in subnational deficit finance and debt levels.Finally, we discuss the pending policy agenda for the reform of subnational borrowing. The three keys toa successful subnational deficit control are imposing legislative limits on borrowing, instituting bankruptcyand financial emergency controls for subnational governments and addressing the underlying fiscalimbalances that are at the root of the problem.
V.1 Evolution of the Legal Framework for Borrowing
During Soviet times, subnational budget resources were fine-tuned to provide sufficient resourcesto finance a negotiated minimum expenditure budget. As a result, subnational governments did not rundeficits and they did not borrow, except from the Ministry of Finance for bridge financing purposes. Theseloans were supposed to be repaid before the end of the fiscal year, and as a rule they were. The earlytransition period saw a continuation of the traditions of the previous regime with regard to borrowing.
Starting in 1993, two basic pieces of legislation were introduced that provided for a much morepermissive framework for subnational borrowing. The Law on the Basis of Budget Rights and Rightsin the Formulation and Execution of Extra-budgetary Funds of 1993 and the Law on the GeneralPrinciples of Organization of Local Government in the Russian Federation of 1995 grantedsubnational governments the right to borrow with very few restrictions. In particular, no explicit limits wereimposed and subnational governments were allowed to borrow for all purposes, including for the financingof current expenditures. These rights were immediately put to use by many subnational governments.
In more recent years, concerns about the lack of responsible fiscal management at the subnationallevel and its impact on national economic stability have caused the Russian government to reverse its

A series of presidential decrees in 1997 and 1998 authorized a small number of governments105
to issue Eurobonds. These decrees had imposed borrowing limits similar to those in the Budget Code; theyrequired registration with the Ministry of Finance and imposed disclosure rules for the subnational finances.Freinkman et. al. (1998) reports that by the end of 1997, 12 regional governments had issued Eurobondsand many more were preparing to do so.
Freinkman et. al. (1998) contains a comprehensive review of borrowing issues at the subnational106
level. This section draws on this study.
-77-
course. More recent legislation and decrees have been trying to reign in the borrowing power ofsubnational governments. The Law on the Securities Market of 1996 required federal authorization andimposed registration disclosure requirements for bonds issued by subnational governments to be publiclytraded securities. More recently, the Law on the Financial Foundations of Local Government in theRussian Federation of September 1997, restricted the amount that local governments may borrow to 15percent of budget expenditures. This law included several other important restrictions: bonds may be issuedonly for investment purposes (as opposed to funding for current expenditures); municipally-owned banksare banned in order to avoid the moral hazard of joint borrowing and lending functions; and local bondsare not guaranteed by the federal government. However, the Law on the Financial Foundations appliesonly to local governments, and not to regional governments.
The new Budget Code approved in 1998 limits the budget deficits of regional governments to 5percent of budget revenues (before transfers and loans) and the budget deficits of local governments to 3percent of budget revenues (before transfers and loans). The overall level of debt for both regional andlocal governments is limited by requiring that expenditures for debt service in any year do not exceed 15percent of budget expenditures. Failure to comply with these limits can result in a budget audit or in theassumption of control over budget execution by the upper-level government. The Budget Code furtherrestricts the purpose of subnational borrowing to capital investment and seems to grant external borrowingprivileges only to the federal government.105
V.2 Analysis of Subnational Deficits and Debts 106
The balance of the trends over the past six years in expenditures, revenues and transfers at thesubnational level has been toward sharp increases in subnational budget deficits. Although there are severalways to measure budgetary balance, any of these measures leads to the same conclusion of growing budgetdeficits at the subnational government level and the beginning of a noticeable accumulation of debt.
Subnational Deficits and Debt Levels
Over the transition period, the consolidated subnational government budget went from a surplus(after transfers and budget loans) of 1.45 percent of GDP in 1992 to a deficit (after transfers and budgetloans) of 1.24 percent of GDP in 1997 (Table 45). If budget loans between governments are included as

In fact, the increased reliance on deficit finance by subnational governments is leveling off over107
time when expressed in real terms. The year-to-year change in the per capita consolidated subnationalbudgetary balance from 1993 to 1997 (before budget loans), expressed in thousands of 1995 rublesevolved in the following manner: Rb. -11.7 (1993), Rb. -121.0 (1994), Rb -68.8 (1995), Rb. -51.3(1996) and Rb. -35.2 (1997).
-78-
a means of deficit finance (as opposed to counting them as a type of transfer), the consolidated subnationalbudget deficit (after transfers) evolved from a surplus of 1.13 percent of GDP in 1992 to a deficit of 1.24percent of GDP by 1997. The consolidated subnational budget deficit, of course, increases when measuredbefore transfers. As reported in Table 45, the subnational surplus before transfers and budget loans wasonly 0.04 percent of GDP in 1992 while this deficit reached 3.10 percent of GDP in 1997.
The true size of the deficit for subnational governments is understated in Table 45. As discussedbelow, not all types of subnational debt are reported in the executed budget accounts. Non-conventionalmeans of financing such as arrears or the use of extra-budgetary funds are not included in the reporteddeficits. Neither are liabilities for loan guarantees to municipal enterprises or suppliers reported in theexecuted budget deficit. When both reported and unreported debts of subnational governments areconsidered (excluding loans by the federal government), the total accumulated amount of subnational debtis estimated to have reached approximately 6 percent of GDP by early 1998 (Freinkman et. al., 1998).Of the subnational debt, most is accumulated at the regional level; the municipal share of the consolidatedsubnational debt is estimated to be around 20 percent.
At 6 percent of GDP the level of indebtedness of subnational governments should not beconsidered high. In fact, it looks quite favorable by international standards in other federal systems. (Table46). Instead, the concern with subnational borrowing in Russia is caused by the characteristics of the debt(high interest costs and short maturities), the purpose of the debt (often used to finance currentexpenditures), and the deteriorating fiscal situation and the growing inability of subnational governments toservice this debt (due to stagnant revenues and persistent budget arrears). Also, subnational debt levelshave recently increased very fast (70 percent in 1997). But, these rapid percentage increases seem to beas much the result of the increase in borrowing as the initial low level of indebtedness.107
How Are Subnational Deficits Financed?
Subnational governments have found multiple ways to finance their budget deficits. These haveincluded both traditional and less conventional methods of financing. The latter do not show up in the budgetaccounts. Here are the main types of financing that have been used:
Budget Loans. Traditionally, the Ministry of Finance lent funds to regional governments for differentpurposes, but mainly to address short-term liquidity problems. The level of federal budget loans providedto subnational governments tended to increase over the transition; what were initially mere loansincreasingly got written off as transfers by the federal government as the fiscal position of regional

-79-
governments deteriorated. As a result, “budget loans” are now commonly counted as a form of transfers.In fact, budget loans have provided subnational governments with a soft budget constraint, and therebynegatively affected the incentives for subnational governments to limit spending or increase revenues.Excessive provision of such loans to subnational governments may have contributed to a furtherdeterioration of the federal financial position leading up to the collapse of the Ruble in August 1998. Asmentioned in Chapter IV, in 1997 budget loans and credits from the federal government amounted to 0.75percent of GDP. Since these loans are often forgiven, they are often not counted towards the size of thesubnational debt.
Commercial Debt. By early 1998, the reported commercial debt of subnational governments (notincluding budget arrears, guarantees, and debts to the federal government) was the equivalent to 1.5% ofGDP.
Commercial bank loans have been the predominant source of commercial deficit finance,especially since the use of veksels (see below) was prohibited in early 1997. Approximately one third ofall the commercial debt of subnational governments is held in the form of loans. The most worrisome aspectof the market for commercial loans to subnational governments is that these transactions are often nottransparent and are subject to abuses and corruption. These concerns are further aggravated by the factthat certain regions actually own commercial banks from which they may be borrowing.
The use of bonds to finance subnational deficits has also grown in importance over the transitionperiod. Since their introduction in 1994, markets for municipal and regional bonds have evolved fromscratch, largely mirroring the growth of the market for federal bonds and government securities. Thepioneer in the domestic market was St. Petersburg in 1994, followed by Moscow and Tatarstan. The useof bonds as a means of finance has increased rapidly; by the end of 1997 more than a quarter of theoutstanding subnational commercial debt held was in the form of bonds. In total, around 70 regions haveissued domestic bonds and a dozen or so have issued Eurobonds. All bond issues are supposed to beregistered with the Ministry of Finance.
Due to the lenient regulatory requirements regarding their issue and circulation, veksels were animportant form of subnational debt until 1996. Veksels are simply bills of exchange or promissory notesissued by regional governments instead of money in return for the provision of goods or services. The useof veksels as a means of finance was banned in early 1997 by the Law on Bills of Exchange andPromissory Notes. Despite this ban, it appears that many subnational governments have continued to issuepromissory notes or have switched to alternative instruments which perform a similar function, such asveksels issued by commercial entities including public companies under control of subnational governments.
Budget Arrears and Other Unreported Methods of Deficit Finance. Budget deficits are calculatedon a cash basis. As a result, the budget accounts do not reflect the accumulation of accrued but unpaidexpenditures. These are arrears in wages to employees or payments to suppliers. Budget arrears ofsubnational governments have become an increasing source of deficit financing. They increased from 1percent of GDP in 1994 to 2.6 percent of GDP in 1997. Due to shortcomings of the methods of debtaccounting, budget arrears and several other alternative debt instruments do not appear to be reflected on

-80-
the budget. These include some forms of external borrowing, borrowing through extra-budgetary funds,and commercial financial instruments (other than veksels).
Why Do Regions Resort to Deficit Financing?
With very few exceptions, Russian regions have been subject to sharp decreases in available realresources during the transition period. The choice has been to either cut expenditures or run a deficit.Although most regions have done a combination of both, some regions have been more prone to runningdeficits and accumulating debt. Have some regions borrowed more because they were poorer, or becausethey have had higher fiscal needs or perhaps simply because they had greater access to financing? Someof these questions are explored in the regression analysis in Table 47. The dependent variable is “othersources of finance” which incorporates both budget loans from federal authorities as well as borrowing fromany other reported source. The results, presented in Table 47, reveal a clear pattern. The resultsunambiguously show (with statistical significance) that in 1996 and 1997 regions with greater fiscal need,as measured by the shares of the population above and below working age, and regions with higher levelsof cost of living, consistently relied more extensively on budget loans and borrowing. The negativecoefficient for per capita GRP would indicate that poorer regions tend to borrow more; however, thesecoefficients are not statistically significant. The increase in the explanatory power of the regressions overtime (from 0.20 in 1994 to 0.60 in 1997) also may be an indication that expenditure need factors arebecoming a more binding determinant of regional budget deficits and the use of debt financing.
What Other Factors May Explain the Growth in Subnational Deficits?
There are several other potential explanations for the continued growth of subnational deficits, mostof which are related in one way or another to the theme of fiscal needs identified above.
Offloading by the federal government. A possible explanation for the increased subnational deficitis the shifting of expenditure responsibilities from the federal government to subnational governments. Thetrend of subnational government deficits during the transition stands in sharp contrast with that of the federaldeficit, which fell from 21 percent of GDP in 1992 to 3.3 percent of GDP in 1997. Over the period from1992-1997, federal expenditures declined from approximately 40 percent of GDP to 20 percent of GDP.However, this offloading took place mostly in the early years of transition (1992-1993) when in theaggregate subnational governments ran surpluses. The shifting of expenditure responsibilities continued after1994 largely in the form of unfunded mandates.
Subnational governments may have lacked fiscal discipline. Regional governments have beenblamed for increasingly resorting to budget loans and borrowing to finance budget expenditures that shouldhave been reduced or cut altogether years ago. Continued high levels of subnational government spendingon the “national economy” sector, which largely consist of subsidies on housing and public utilities, are themost egregious examples of this behavior. Subnational governments also have been blamed for notrationalizing their expenditures by not pursuing more cost effective options to deliver services such as

For example, in 1997 the federal deficit could have been practically eliminated if the federal108
government had kept the funds transferred to subnational governments (Table 45). Naturally, the federaldeficit could also have been eliminated by an equal-sized reduction in spending in any other area of federalgovernment spending.
-81-
closing some facilities with excess capacity or contracting with the private sector for the delivery of someservices. The lack of adaptation may be a reflection of perverse incentives transmitted through the budgetprocess, such as the incentive to keep public facilities open to maximize budgetary allocations.
The system has not provided incentives to increase revenue collections. Poorly designed revenuesharing arrangements and gap-filling transfer schemes, especially at the regional-local level, have contributedto a lack of fiscal effort. Low tax effort at the local level has required higher intergovernmental transfers andpotentially resulted in higher regional government deficits.
Lack of revenue autonomy and vertical fiscal imbalances. The ability of regions to act upon thegrowing deficit has been restricted by the lack of significant own source revenues. This raises the difficultquestion of the degree of vertical imbalance in Russia’s fiscal federalism. Vertical fiscal balance exists whenthere is a broad correspondence between the expenditure responsibilities assigned to each level ofgovernment and the fiscal resources available at their discretion to carry out those responsibilities. Whileboth revenue sharing and transfers can be used to redress vertical imbalances, both political accountabilityand economic efficiency require that regional and local governments have discretion over (some of) theirsources of revenues, meaning taxes and fees which they can expend or contract according to their needsand desires. It appears that subnational governments in Russia have not been given sufficient latitude tocollect their own revenues. Further increases in fiscal autonomy could allow regional and local governmentsto respond to increasing budget pressures by increasing revenue collections, thus giving them an alternativeto increased deficit finance and expenditure cuts.
Has Excessive Subnational Borrowing Contributed to Macroeconomic Instability?
There has been a growing concern about the potential damage that irresponsible borrowingbehavior by subnational governments can inflict on the fiscal stability of the country, if the federalgovernment were to become the lender of last resort. Subnational government borrowing also crowds outother domestic borrowers which may impair economic growth, especially if borrowing by subnationalgovernments is used to finance current expenditures.
And yet, at least on the surface, it has not been the borrowing by subnational governments but, toa large extent, federal government borrowing combined with the rapid accumulation of short term debt atvery high interest rates that brought the financial crisis and ruble devaluation in August 1998. However, thequestion remains whether the federal government actually was forced to shoulder the subnational deficitsthrough budget loans and whether it was the need to indirectly finance these subnational deficits that causedthe federal government to borrow heavily, which ultimately brought about the financial crisis. A different108
explanation is that the attempts of the federal government to transfer its deficit to subnational governments,

-82-
through offloading of responsibilities and expenditure mandates, were only partially successful. In the endthe federal government still had to borrow to finance part of the subnational government expendituresthrough transfers and budget loans.
V.3 Pending Policy Agenda for the Reform of Subnational Borrowing
There are several basic approaches for bringing discipline and responsibility to subnationalgovernment borrowing. The first approach relies on financial markets to self-enforce prudent borrowingbehavior by subnational governments. Excessive or irresponsible borrowing gets punished by higherborrowing costs and ultimately by the refusal of lenders to provide funds to irresponsible governments. Thisapproach only works effectively if there are well developed capital markets and institutions, includingdisclosure of information, ratings agencies and bankruptcy laws. The relative simplicity and self-enforcingproperties of the market approach make it a more attractive and ultimately a superior approach. However,at the present time, clearly the Russian market and institutions are not developed enough to make the capitalmarket a viable alternative. A second approach relies on federal or central government legislation toimpose limits on borrowing for subnational governments and on central or federal government agenciesenforcing these limits. Countries with less well developed capital markets and institutions often rely on thissecond approach. In addition, a successful strategy to impose restraints on subnational borrowing requiresinstituting bankruptcy and financial emergency controls and addressing the fiscal imbalances that underlyingthe fiscal problems of subnational governments.
Imposing Legislative Limits on Borrowing
Given that a legislative approach to subnational government borrowing is the most desirable at thepresent time in Russia, two questions need to be asked. First, have appropriate limits been set onborrowing by regional and local governments? Second, have appropriate monitoring and enforcementmechanisms been put in place?
In response to the first question, it appears that the limits to the overall level of debt for regional andlocal governments imposed by the Budget Code are adequate. Limiting debt service expenditures to nomore than 15 percent of annual expenditures is prudent and falls in line with international practices. Otheraspects of the limits to subnational borrowing in the new Budget Code are more problematic and shouldbe reconsidered.
For example, allowing subnational governments to borrow to finance all kinds of expenditures, inparticular current expenditures, is poor financial management. Borrowing should be limited to capitalinvestment expenditures. The economic rationale for borrowing is that future generations of taxpayersshould contribute to paying for the use of infrastructure that also benefits them. Borrowing allows thesmoothing out or matching of tax payments and users of public services. Clearly, this rationale disappearswhen borrowed funds are used to finance current expenditures. In this case, future generations of taxpayersare made responsible for the consumption of current generations of taxpayers. An additional aspect of

This section draws on Mikesell (1998b), who presents a review of subnational government109
bankruptcy, default, and fiscal crises in the United States.
-83-
subnational borrowing that should be considered is the international dimension. The overriding objectivesof national macroeconomic stability call for the close scrutiny and approval by federal authorities of anyforeign borrowing by subnational governments. However, the outright prohibition of all forms ofinternational borrowing may deprive responsible subnational governments of cheaper and more readilyavailable funds for worthwhile and well thought out infrastructure investment projects.
In response to the second question, it is obvious that the effectiveness of any limits on subnationalgovernment borrowing will depend on the quality and effectiveness of the monitoring and enforcement ofthose limits by the federal authorities. The only enforcement tool incorporated in the Budget Code is therequirement that all bonds issued by regional and local governments be registered with the Ministry ofFinance. This falls dramatically short of what will be needed to monitor and enforce the legislated borrowinglimits. The federal government has announced plans to create a monitoring agency for subnationalgovernments within the Ministry of Finance, but no details have been given on how this agency will operateand how limits will be enforced. Given the inability of federal authorities in the recent past to monitor andcontrol subnational government activities, this is an issue that will require immediate attention and significantfederal government resources.
Subnational Bankruptcy and Financial Emergency Controls 109
Part of a comprehensive strategy to counteract irresponsible fiscal management at the subnationallevel is formed by the implementation of regional or municipal bankruptcy procedures in case regional ormunicipal governments are unable to pay their debts as they come due. In countries where suchprocedures have been implemented, municipal bankruptcy or insolvency laws provide the debtorgovernment with some degree of protection from its creditors in order to develop a plan that allows theinsolvent subnational government to resolve its debts through negotiated debt restructuring, reorganizationand refinancing of its debts, in a way that treats the interests of the creditors with some measure of fairness.When a region or municipality seeks bankruptcy protection, its financial administration may be placed undercourt supervision to ensure implementation of an adequate debt adjustment plan.
A subnational government should be considered insolvent when it is "generally not paying its debtsas they become due unless such debts are the subject of a bona fide dispute" or "unable to pay its debtsas they become due." Failure to pay wages and salaries, to make pension payments, to pay contractors,or to meet debt service payments of principal or interest would make the government insolvent. Under thisdefinition, a large number of regional and local governments in the Russian Federation would qualify forbankruptcy protection. At the same time, a region that is merely experiencing temporary financial difficultyshould not be considered for bankruptcy protection.
The intention of a subnational bankruptcy procedure would be to compel subnational governmentto engage in responsible fiscal behavior. For those subnational governments that are unable to remain

-84-
solvent, bankruptcy provides "breathing room" to make things right and to allow the government unit to berestored to financial health. Unlike bankruptcy legislation for businesses and individuals, bankruptcyprocedures for subnational governments should not provide for liquidation of the assets of the municipalityto satisfy the claims of creditors. Such a liquidation or dissolution would leave the citizenry without a localor regional government, which would clearly be unacceptable. Instead, reorganization of regional ormunicipal debts could be accomplished either by extending debt maturities, reducing the amount of principalor interest, or refinancing the debt by obtaining a new loan. During the reorganization, bondholders aretypically considered superior creditors, so debt service will ordinarily flow on schedule; however, othercontractual obligations may not be met. For instance, wages and salaries may have to be reduced fromtheir previously agreed-to levels in order for the regional or local government to regain its financial health.
Regional or municipal bankruptcy is a drastic measure that should only be used in the mostegregious cases of fiscal mismanagement. An alternative to bankruptcy that would avoid court involvementis the implementation of emergency financial management controls. In this case, a superior-levelgovernment intervenes with extraordinary controls to constrain the financial and economic damage causeby mismanagement of a regional or local government and prevents a bankruptcy filing. For example, inthe United States twenty states have laws for provision of state assistance (and control) for municipalitiesin financial distress. Although each state’s approach has its own features, the general objectives of sucha program are: C To preserve and protect the fiscal solvency or local governmental entities.C To assist local governmental entities in providing essential services without interruption and in
meeting their financial obligations.C To assist local governmental entities through the improvement of local financial management
procedures.
The determination of a financial emergency is made based upon a set of objective criteria, forinstance, when a subnational government fails to pay its obligations (wages, retirement benefits, debtservice, etc.) or when it has insufficient reserves to cover a budget deficit for two successive years. Whena financial emergency arises, the municipality or region is brought under close control of the superior-levelgovernment by establishing a board to oversee the operations of the locality and to provide technicalassistance. The subnational government and the oversight board jointly develop a plan that providespayment for all debt obligations, pension payments, and all other mandatory payments while reducingexpenditures by eliminating low-priority budget items.
Compared with the regional or municipal bankruptcy option, the state emergency boards involvefar greater loss of local control and focus greater effort to reform and educate local officials regardingfiscally responsible practices. At the same time, emergency boards are empowered to change localpriorities and to change fiscal decisions coming from the local political processes and may cause greaterdiscomfort for local officials than would a bankruptcy.
The Need to Address Vertical and Horizontal Fiscal Imbalances.

-85-
A final observation regarding subnational deficits in the Russian Federation is that these deficits willnot disappear without policies that address the existence of vertical and horizontal fiscal imbalances in theRussian Federation. Funding pressures are likely to continue in the medium term at all levels of government.There is therefore a need to reexamine the balance of expenditure needs and available resources at differentlevels of government. This examination should provide some basis for reorienting expenditures towardpriority goals and highlight the need to increase the efficiency of public expenditures at all levels ofgovernment. Although substantial progress has been made in correcting the vertical fiscal imbalance, thereis a continued need for expanding the revenue autonomy of subnational governments. Giving subnationalgovernments the capacity to impose taxes, if so desired, is the most effective, if not the only, way to addressthese vertical imbalances. The fact that those regions with greater expenditure needs are more likely to usedeficit financing is also a clear indication of significant horizontal imbalances and, in particular, that thetransfer system has failed to address these needs. This risks the possibility that critical subnational programsin areas such as health and education may go unfunded. A focus on vertical and horizontal imbalances willprovide the necessary perspective of the “big picture” that has been missing in much of the reform processin the last five years.

-86-
CHAPTER VIIMPLEMENTING REFORM
This chapter focuses on the process through which reforms in intergovernmental fiscal relationsshould be implemented, discussing several important issues which need to be considered by the Russiangovernment in the formulation and implementation of the reforms. These are (i) piece-meal versus unifiedstrategies for reform, (ii) the asymmetric versus uniform treatment of subnational governments, (iii) thecompliance with, and enforcement of, federal legislation among subnational governments, (iv) theimprovement of communications between the federal and regional governments, and (v) the considerationof the appropriate form that federalism should take in Russia (in particular, deciding how much the federalgovernment should intervene and regulate regional-local relations).
VI.1 Piece-meal versus Unified Reform Strategy
One main feature of the Russian government’s approach to the reform in intergovernmental fiscalrelations during the transition has been its piece-meal nature. Put in a different way, the Russian governmenthas lacked a coherent and unified strategy for the reform. A unified strategy would have required anexplicit statement, balance, and implementation of the government’s key objectives underpinning thedecentralization policy. In order to reach an explicit and comprehensive reform strategy, the governmentwould have to address the extent and nature of federalism that it seeks to achieve, the desirable degree ofequalization in the distribution of fiscal resources across regions, the promotion of a more efficient use ofbudgetary resources, the creation of incentives for revenue mobilization and the preservation of fiscaldiscipline and responsibility among subnational governments.
The difficulties involved in reaching a national consensus on the general objectives of fiscaldecentralization policy may, it is clear now with hindsight, help to explain the absence of a unified andexplicit reform strategy. The process of defining an overall strategy for reform, which requires the weightingof the different objectives to be pursued in this reform, will likely continue to be difficult and slow. Theviews of the President's Administration and the Ministry of Finance on the issues surroundingdecentralization tend to differ considerably from those held at the State Duma and especially at theFederation Council. There is also a significant diversity of interests and values held at the FederationCouncil among the "have" and "have not" regions.
As mentioned earlier in this document, the Russian government’s current strategy for reform ofintergovernmental relations is outlined in the “Concept of Reform of Inter-Governmental FiscalRelations” drafted in 1998 by the Working Group on Intergovernmental Fiscal Relations. Even thoughthis document has gone through many versions, every one of them adopting a more comprehensiveapproach than its predecessor, the most recent version of the Concept still falls short of delivering a unified

This is best illustrated in the few articles in the 1993 Constitution dedicated to intergovernmental110
relations. These articles are ambiguous regarding the division of powers between the federal and regionalgovernments (Articles 71 and 72) and the right to local self-government (Articles 12 and 132).
-87-
reform strategy. In particular, policy issues and recommendations in the Concept document are discussedin isolation with no explicit links to other components. This document does not, furthermore, make anyattempt to quantify the impact of the individual elements of the reform agenda nor how they would affectthe current vertical and horizontal balances in intergovernmental fiscal relations.
The legacy of the piecemeal reform strategy during the transition is reflected in a legal frameworkfor intergovernmental fiscal relations that is fragmented, incomplete, and often contradictory or inconsistent.In addition, some parts of the current legislation have never been implemented or have only been partiallyimplemented because regions have simply refused to accept the provisions or because some of the regionshave negotiated with the federal authorities to be exempted from the legislation. Consistent with the lackof unified reform strategy, the most conspicuous feature of the current legal framework forintergovernmental fiscal relation has been its ambiguity and the tendency to postpone addressing basic andfundamental questions. 110
Addressing the wide array of current problems in intergovernmental fiscal relations all at oncewould be a difficult if not impossible task. Rather, what the government needs to consider is how tostrengthen the “Concept of Reform of Inter-Governmental Fiscal Relations” in light of a comprehensiveand unified strategy for reform. As part of this revision process the government should undertake thedifficult task of systematically reviewing all the existing laws and, whenever necessary, to draft amendmentsto ensure that all relevant legislation conforms to the government’s overall strategy and objectives. One wayto make the revision of the reform strategy more meaningful and to improve the chances of success forthese reforms is to get representatives from all three levels of government directly involved in the definitionand implementation of the strategy. Reforms that are imposed in a top-down process are certain to bereceived with suspicion and hostility by subnational governments; this is true anywhere in the world, butespecially in Russia. Regional and local governments should be particularly instrumental in the reform ofregional-local relations, such as the development of a Subnational Budget Code. In this arena, the federalgovernment should play more of a coordinating role rather than relying on its executive power. Althoughthe Federation Council has regional representations and interest at its core, this body is not likely toadequately represent and articulate the views and interests of local governments. A new institutional vehiclemight have to be considered, which could benefit from input from both regional and local governments inthe formulation and implementation of comprehensive reform of intergovernmental fiscal relations.
VI.2 Uniform versus Asymmetric Federalism and Addressing Fiscal Disparities
Asymmetric federalism, the non-uniform treatment and standing of the subjects of the Federation,may have been unavoidable given the historical precedents inherited by the Russian Federation and theneed to accommodate the demands for autonomy from ethnic regions. Asymmetric federalism may also

However, there are still important restrictions to the free flow of people within the country.111
Although declared unconstitutional, several regions (including Moscow City) still require the propiska, aninternal passport permit to reside within its borders.
-88-
have been justified by the need to deal with regions in significantly different circumstances and withsignificantly differing abilities to implement policies and programs. But asymmetric federalism has broughtwith it important risks. Most importantly, asymmetric federalism has undermined national solidarity andimposed a system that lacks “unity of interest” (Igudin, 1998).
As discussed in Chapter I, during much of the transition period the pressure at the federal level hasbeen for granting new privileges to other regions or for expanding existing ones. However, more recentlythere has been a growing awareness at the federal level of the problems associated with the use of bilateraltreaties. As a result, the 1998 budget asked for the reopening of all bilateral treaties to ensure that theyaccord with the provisions in the budget. There is no evidence that any of this has actually taken place.Similar plans for the reconsideration of all bilateral treaties have been proposed at different stages for the1999 budget.
Even though the demands from ethnic regions for autonomy will continue to pose problems in thefuture, in the longer run the most difficult challenge to the reform of fiscal federalism in Russia will most likelycome from the growing fiscal disparities among the regions. Economic and fiscal disparities among Russianregions were already significant at the time of independence. However, large amounts of resources wereexpended by the Soviet regime to equalize fiscal disparities among the regions and to keep afloat unviableregional economies in remote areas of the country. The disparities that existed before independence havegrown significantly over the transition period. The lack of market development outside a few geographicalareas, the lack of labor mobility, and the absence of adequate and universally available social services hasled to a situation in which it seems that these economic and fiscal disparities would need to be addressedby non-market means. However, the government’s failure so far to address this issue squarely has createdincreasing political tensions (Polishchuk 1996).
There are reasons for this policy of neglect. The growing inequality in the distribution of tax baseshas made the federal government more vulnerable to political pressures from richer regions whichincreasingly have opposed the idea of higher federal revenues to redistribute to the poorer regions. At thesame time, the plight of the worse-off regions has deteriorated because their troubles have been increasinglyperceived at the federal level as being self-inflicted due to poor fiscal and economic management.
The growing economic and fiscal disparities among regions have led to a pronounced divergenceof interest among the regions and to a lack of consensus in national policies. This has put the federalgovernment in the crucible of either engaging in more redistribution among the regions or possibly achievingfaster, but geographically uneven, economic growth. In the first paradigm, the federal government wouldhave to tax resources away from those regions that are performing better economically. Under the secondparadigm, equalization (if it happens at all) would come from migration and other market adjustmentmechanisms. There is no evidence that the government has chosen explicitly between these two paradigms,but by default the current direction in federal policies seems better represented by the second paradigm.111

There have been calls for establishing direct federal control for budget formulation and execution112
in those regions that are especially dependent on federal monies, for example those for which FFSRallocations represent more than 50 percent of their budgets (Ingushetia, Dagestan, Tuva, Adygeya,Karachyevo-Cherkeskaya and Kabardino-Balkarskaya and Marii-El) (IEPT,1998).
-89-
The current plans at the federal level would appear to include implementation of further reductionsin the funds available for equalization. In addition, the federal government is proposing a “dual” regime bywhich those regions that are most dependent on federal transfers would be forced to institute reforms ofregional budgeting practices while other regions might even have to completely relinquish their budgetpowers to the federal authorities. These policies may be the most viable politically, but it is questionable112
whether they will sufficiently address the problems of poorer regions, such as the ability of these regionsto provide adequate levels of basic services, including health and education. It also appears that thesefederal policies do not distinguish sufficiently between poor fiscal management and a poor economic base.These two phenomena may be highly correlated, but it is in the interest of the federal authorities to carefullydifferentiate between them and over time to improve the fiscal management of regions that are both poorlymanaged as well as poor. The question needs to be raised whether the proposed policies will create apermanent underclass among regions which will be dependent on federal support and controls and add fuelto fires raised by the practice of asymmetric federalism over the past seven years. Although someasymmetry in intergovernmental fiscal relations has to be accepted as unavoidable in the RussianFederation, future reforms of the system of intergovernmental relations should aim to approach federal-regional relations in a uniform way when possible or, at least to avoid an expansion of the asymmetryalready contained in the system. Further asymmetry would only serve to push the Russian Federationfurther down the path of divisiveness.
VI.3 Compliance with the Federal Laws by the Regions
Fiscal federalism in Russia has been complicated by the open hostility between the federalgovernment and some of the regions. This problem was more severe in the earlier years of the transition,but the issue has not disappeared. Contentious relations in combination with the absence of an institutionalmechanism to monitor subnational governments have seriously inhibited the ability of federal authorities toenforce federal laws throughout the national territory. Perhaps the most egregious form of lack ofcompliance has been the decision by some regions not to remit revenues from federal taxes to the federalgovernment. However, the lack of compliance with federal laws by the regions has taken many other formsas well.
In recent years there have been more open attempts by the federal government to enforce federallaws. The Law on the 1996 Federal Budget contains a number of measures to punish those regionsbreaching federal legislation on issues of taxation and budgetary matters. These measures included thesuspension of funding for all federal programs being implemented in the region; termination of all kinds oftransfers, loans and credits; termination of issuance of export licenses; suspension of centralized productdelivery from government sources; and the retrenchment of credit and cash supplies to the regions by theCentral Bank of Russia. However, it is hard to tell how many, if any, of these measures have actually been

See: Memorandum of the Government of the Russian Federation and the Central Bank113
of the Russian Federation on Economic and Financial Stabilization Policies, July 16, 1998. Since theConstitution does not provide for the possibility of restricting the powers of regional governments due totheir financial status or fiscal performance, control of budget disbursements or even less direct controlscan only be reached by agreement between the regions and the federal government. These agreements canonly be reached by “bribing” the regional governments via transfers. This also means that federal controland enforcement is likely to be limited to poorer regions dependent on transfers.
These policies included the discontinuation of the practice of tax offsets, the elimination of wage114
arrears, bringing subnational government pay scales in line with those of the federal government, andbringing cost recovery for housing and public utilities in line with federal standards.
-90-
implemented. What is known is that the Ministry of Finance did de facto transfer an equivalent amountin expenditure responsibilities for federal programs to those regions where unauthorized shares of revenuecollections were held.
In addition, the federal government has opted for more direct “bribing” to bring regionalgovernments in compliance with federal policies. During the first half of 1998, in accordance with a113
Presidential Decree of May 5, 1997, the Ministry of Finance signed agreements with most of the regionsthat had received budget loans to clear local wage arrears. According to these agreements, the federalgovernment would forgive the budget loans providing the regions agreed to implement a set of federalpolicies which the federal government had heretofore not succeeded in establishing in the regions. To114
enforce these agreements, the federal government is threatening to reduce the amount of equalizationtransfers for any non-compliant region by an amount equal to the scheduled loan repayment by the region.The draft of the 1999 budget provides for a similar mechanism. The draft budget contains provisions thatcall for the withdrawal of equalization transfers and any other grants or loans to regions that fail to complywith a specific set of federal policies. However, some of the federal requirements, such as the eliminationof all non-monetary forms of payments in regional budgets, are unlikely to be fulfilled, since more that halfof all tax receipts by regional governments are non-cash payments. Making pronouncements that later cannot be enforced has weakened the standing of federal authorities in the regions.
It is unclear what the final impact of the August 1998 ruble crisis will be on the relations betweenthe federal and regional governments. Many regions openly defied federal authorities and legislation in anumber of areas in the weeks following the crisis. Gaining the ability to enforce federal laws in the regionswill continue to be a crucial element for a working system of intergovernmental fiscal relations. At one levelthis may require amending the Constitution and using the court system to prosecute regional violations offederal laws. On a day-to-day level, better compliance will require strengthening and reforming existinginstitutions, such as the State Tax Service, or the introduction of new ones, such as the Treasury functionfor the execution of the federal budget. When, and if, the federal authorities gets real control of thecollected federal tax revenues (and how these funds are spent), half the battle would be won. Federalauthorities also need to treat regional governments as partners; cooperation and consensus generally leadto much better regional compliance with federal laws than do conflict and forced imposition.

-91-
VI.4 Communications Between Federal and Regional Governments
An important feature of Russian fiscal federalism has been the lack of communication and exchangebetween the federal and regional authorities on fiscal issues. International practices differ greatly withrespect to this issue, ranging from the practice of "cooperative federalism" in Germany whereby federal andsubnational fiscal strategies and targets are coordinated; to the Premiers' Conferences in Australia, Canadaand New Zealand which provide for an exchange of views, but are more informational in nature; to thecomplete lack of coordination between the fiscal strategies of different levels of government, such as is thecase in the United States.
Given the nature of Russia’s federalism and the history of intergovernmental fiscal relations duringthe transition, it would appear that many of the current conflicts and the lack of smoothness inintergovernmental operations could be helped by increased communications between the federal andsubnational levels of government. This could be accomplished, for example, by replicating some of thefeatures of the approach followed by Australia or Canada. The Ministry of Finance could host a formalannual conference on intergovernmental fiscal relations to which finance directors of all 89 regions wouldbe invited. Without binding powers, this conference should have the objective of allowing for opencommunications and exchange of information and priorities between the Federal Ministry of Finance andtheir counterparts in the regions. As an alternative to the conference of regional finance directors (or inaddition to it), this conference could involve the Prime Minister (or the President) and the governors of the89 regions. On a more permanent basis, the Russian government could establish an advisory council onintergovernmental relations comprising representatives from all three levels of government, similar to theU.S. Advisory Commission on Intergovernmental Relations. Such a non-partisan advisory body couldprove particularly useful in identifying programs that contain unfunded federal mandates and making policyrecommendations to either eliminate, fund, or modify these programs.
In actuality, the Ministry of Finance has already held some annual conferences with the regions todiscuss the rules for the distribution of the fund of support of the regions (FFSR). This annual conferencecould be formalized as part of the budget process and its scope expanded to cover not only equalizationfund issues but also medium-term plans for revenue sharing and expenditure assignment, borrowing, andthe medium-term budgetary strategies from all the regions. Part of this conference could also be used forsharing experiences among regions on regional-local relations issues.
VI.5 Determining the Form of Fiscal Federalism
There are significant differences between the de jure fiscal federalism in Russia and the system offiscal federalism that is actually in place in the Russian Federation. This schism has left several importantquestions unanswered that could greatly affect the performance and efficiency of the system ofintergovernmental fiscal relations. These questions include: How much autonomy should local governmentshave vis-a-vis regional governments? Should the federal government directly address some policy issueswith local governments, thereby entirely bypassing regional governments? How much control can thefederal government exert over regional governments in mandating certain regional government policies

This principle was re-asserted in the Law of Basic Principles of local Self-Government of115
August 1995.
However, these minimum shares were so low (5 percent of total tax collections for the most116
important taxes) that the decree had little substantial effect.
-92-
toward local governments? These are fundamental questions concerning the nature of federalism in Russia.There is no universal model for a federalist structure of government. Federative countries around the worldhave answered those questions in many different ways, depending upon their history and political needs.
In Russia, the 1993 Constitution proclaims the independent right of local governments to managetheir affairs separately from the sovereignty of the state, which includes both the federal government andthe subjects of the federation or regional governments. In reality, local governments have been subject115
to regional dictates in funding and expenditure assignment matters, if not to the outright control of regionalgovernments. Regional governments, for the most part, have been satisfied with these arrangements, or atthe very least see them as a necessary evil given the current economic and financial conditions. From theviewpoint of many local governments, and also increasingly from the viewpoint of the federal government,regional governments have not done a good job in managing their fiscal relations with local governments.The question is whether or not (or to what extent) the federal government should intervene in structuringthe fiscal relations between regional and local governments.
Recently the federal government has started to challenge the status quo in the relationships betweenregional and local governments. The first attempt to structure regional-local relationships came withPresidential Decree No. 685 in 1996 which mandates regional governments to implement minimum sharesfor tax revenues with local governments from January 1997. More recently, the Law on Financial116
Foundations of Local Self-Government in the Russian Federation of September 1997 was only passedby the State Duma and the Federation Council after several changes were made at the insistence of theFederation Council. This law proclaims a prohibition on unfunded mandates and prohibits the clawing backof revenues if local governments raise more revenues than anticipated in the budget plans. It alsoestablishes minimum sharing rates for taxes with local governments, but only on average for all localgovernments within the region. Overall, the Law on Financial Foundations provides few actualconstraints on the way in which regional governments deal with local governments. However, regionalauthorities have opposed these administrative reforms because of the precedent that it sets, which they fearwill eventually result in regional loss of control over local governments. The significance of the Law onFinancial Foundations is that the traditional vertical or hierarchical structure, in which local governmentsat the bottom respond exclusively to regional authorities, may be breaking up in favor of a system thatseparates (or at least regulates) the fiscal relationships between state authorities and local self-governments.
The challenge ahead is how best to structure these relationships. There is no obvious best answerto this complex issue. As pointed out above, international practice in this area covers the entire gamut ofpossibilities. Given the historical context and the lack of institutional development in many regions, a policythat would provide broad federal guidelines and parameters but still leave choice for the regions may bebest suited to Russia at the present time. In this context, federal legislation could provide local governments

-93-
with much more revenue autonomy and budgetary certainty than they have enjoyed until now. This seemsto be the principle inspiring the recent legislation on these issues. However, in order to improve subnationalbudget practices the federal legislation will need to impose actual constraints on regional governmentbehavior vis-a-vis local governments. That could best be accomplished through the enactment of aSubnational Budget Code.

-94-
REFERENCES
Bahl, Roy, Galina Kourliandskaia, John Mikesell, Sally Wallace, Natalia Golovanova, Dmitry Shiskin,Andre Timofeev, Alexander Derugin, Yelena Nikolayenko, Inna Verbina and Natatsha Minkova(1998) “Intergovernmental Fiscal Relations in Leningrad Region,” Georgia State UniversityConsortium Russian Fiscal Reform Project, Moscow.
Berkowitz, Daniel and David N. DeJong (1998) “Russia’s Internal Borders,” mimeograph.
Bird, Richard M., Robert D. Ebel, and Christine I Wallich, editors (1996) Decentralization of theSocialist State: Intergovernmental Finances in Transition Economies. The World Bank,Washington D.C.
Bird, Richard M. and Pierre Pascal Gendron (1998), “Dual VATs and Cross-Border Trade: TwoProblems, One Solution,” International Tax and Public Finance, vol. 5, pp.429-42.
Boadway, R., S. Roberts and A. Shah (1994) “The Reform of Fiscal Systems in Developing andEmerging Economies: A Federalism Perspective,” World Bank Policy Research Working Paper,WPS 726 (February).
Boex, Jameson and Jorge Martinez-Vazquez (1997a) “Fiscal Capacity: An Overview of Concepts andMeasurement Issues and Their Applicability to the Russian Federation,” School of Policy Studies,Georgia State University (June).
Boex, L.F. Jameson and Jorge Martinez-Vazquez (1997b) “An Analysis of Alternative Measures of FiscalCapacity for Regions of the Russian Federation,” School of Policy Studies, Georgia StateUniversity (June).
Boex, Jameson and Jorge Martinez-Vazquez (1998a) “Reforming the Fund for the Financial Support of
the Regions: An Analysis of the New Proposes Equalization Mechanism,” Georgia State UniversityConsortium Russian Fiscal Reform Project, Moscow.
Boex, Jameson and Jorge Martinez-Vazquez (1998b) “A Review of Solutions to Unfunded Mandatesand their Potential Application to the Russian Federation,” Georgia State University ConsortiumRussian Fiscal Reform Project, Moscow.
Campbell, Adrian (1996) “City Government in Russia,” in John Gibson and Philip Hanson, editors,Transformation from Below. Local Power and the Political Economy of Post-CommunistTransition, Edgard Elgar, Cheltenham U.K.
Freinkman, Lev and Michael Haney (1997) “What Affects the Propensity to Subsidize: Determinants ofBudget Subsidies and Transfers Financed by the Russian Regional Governments in 1992-1995,"World Bank: Policy Research Working Paper No. 1818 (August).
-95-
Freinkman, Lev, and Stepan Titov (1994) “The Transformation of the Regional Fiscal System in Russia:The Case of Yaroslavl,” Report No: IDP-143, The World Bank. Washington D.C.
Freinkman, Lev, Stepan Titov and Daniel Treisman (1998) “Russian Federation: Preempting a PotentialDebt Crisis: Fiscal Performance in Russia’s Regions,” The World Bank. Washington D.C.
Hunter, J. S. H. (1977) Federalism and Fiscal Balance: A Comparative Study, Canberra: AustralianNational University Press and Centre for Research on Federal Financial Relations.
Igudin, A.G. (1998) “Analysis and Assessment of the Existing System of Intergovernmental FiscalRelations in the Russian Federation,” Research Institute of Finance, Ministry of Finance of theRussian Federation, Moscow (February).
IEPT (Institute of Economic Problems in the Transition Period) (1998) “Basic Issues of the Concept ofDevelopment of Fiscal Relations between the Federal and Subnational Governments,” Moscow.
Kelly, Janet M. 1995. “Lessons from the States on Unfunded Mandates.” National Civic Review 84(2):p. 133-139.
Kirkow, Peter (1996) “Distributional Coalitions, Budgetary Problems and Fiscal Federalism in Russia,”Communist Economies & Economic Transformation 8 (3): 277-298.
Lavrov, Alexei (1995) “Russian Federation: First Steps, First Results,” (in Russian). Segodnya.
Lavrov, Alexei (1997) “The System of Interbudgetary Relations in Russia in Transition,” BackgroundReport, The World Bank. Washington D.C.
Lavrov, Alexei (1998) “Intergovernmental Fiscal relations in Russia: An Agenda for Reforms,”mimeograph.
Lavrov, A. M., O. V. Kuznetsova, J. W. David, and E. E. Skatershchikova (1996) “The BudgetarySystem of the Subjects of the Russian Federation,” World bank, Moscow, (October).
Le Houerou, Philippe and Michal Rutkowski (1996) “Federal Transfers in Russia: Their Impact onRegional Revenues and Incomes,” Comparative Economic Studies 38 (2/3): 21-44
Martinez-Vazquez, Jorge (1993) “Financing Social Expenditures in the Russian Federation: The Role ofOblast and Rayon Governments,” unpublished report prepared for the Human Resource DivisionEC3 of the World Bank, Georgia State University, Atlanta.
Martinez-Vazquez, Jorge (1994) “Expenditures and Expenditure Assignments,” in C.I. Wallich, editor,Russia and the Challenge of Fiscal Federalism, The World Bank, Washington D.C.

-96-
Martinez-Vazquez, Jorge and Jameson Boex (1997) “A Methodological Note on the Reform ofEqualization Transfers in the Russian Federation,” report funded by the World Bank and USAID,Georgia State University, Atlanta.
Martinez-Vazquez, Jorge, Jameson Boex, and Roy Bahl (1998) “A Methodology for ImplementingTransfers to Depressed Regions in the Russian Federation,” Georgia State University ConsortiumRussian Fiscal Reform Project, Moscow.
McLure, Charles E Jr. (1994) “The Sharing of Taxes on Natural Resources and the Future of the RussianFederation,” in C.I. Wallich, editor, Russia and the Challenge of Fiscal Federalism. The WorldBank. Washington, D.C.
McLure, Charles E. Jr. (1998), “Federal and Oblast Taxation of Sales in Russia: Issues, Solutions andInternational Experience,” Georgia State University Consortium Russian Fiscal Reform Project,Moscow.
McLure, Charles E Jr., Christine I. Wallich, and Jennie I. Litvack (1996) “Special issues in RussianFederal Finance: Ethnic Separatism and Natural Resources,” in Richard M. Bird, Robert D. Ebel,and Christine I Wallich, editors, Decentralization of the Socialist State: IntergovernmentalFinances in Transition Economies. The World Bank, Washington D.C.
Mikesell, John (1998a) “The Distribution of Natural Resource Taxes in the Russian Federation,” GeorgiaState University Consortium Russian Fiscal Reform Project, Moscow.
Mikesell, John (1998b) “Subnational Government Bankruptcy, Default and Fiscal Crisis,” Georgia StateUniversity Consortium Russian Fiscal Reform Project, Moscow.
Morozov, Alexander (1998) “Intergovernmental Transfers Reform in the Russian Federation,” FiscalPolicy Note, the World Bank. Washington D.C.
OECD [Organization for Economic Cooperation and Development] (1997) Economic Surveys:Russian Federation, Paris.
Ordeshook, Peter O. (1995) “Reexamining Russia: Institutions and Incentives,” Journal of Democracy,April: 46-61
Polishchuk, Leonid (1996) “Russian Federalism: Economic Reform and Political Behavior,” SocialScience Working paper No. 972, Division of Humanities and Social Sciences, California Instituteof Technology, Pasadena, (June).
Rafuse, Robert W. (1996) “Fiscal Federalism and Fiscal Disparities among the Regions of the RussianFederation: Some Preliminary Estimates,” Intergovernmental Fiscal Reform Project, RussianFederation , Barents Group LLC.

-97-
Russian Economic Trends (several years) Working Center for Economic Reform. Moscow.
Solnick, Steven L. (1995) “Federal Bargaining in Russia,” East European Constitutional Review 4 (4):52-58
Stewart, Kitty (1996) “Are Intergovernmental Finances in Russia Equalizing?” mimeograph, Departmentof Economics, European University Institute (September).
Sutherland, Douglas and Philip Hanson (1996) “Structural Change in the Economies of Russia's Regions,”Europe-Asia Studies 48 (3): 367-392
Teague, Elizabeth (1996) “Russia and the Regions: The Uses of Ambiguity,” in John Gibson and PhilipHanson, editors, Transformation from Below: Local Power and the Political Economy ofPost-Communist Transition, Edgard Elgar, Cheltenham U.K.
Titov, Stepan (1997) “Different Aspects of Developments in Russia’s Regional Fiscal System inTransition,” IRIS-Institute for the Economy in Transition Project, Moscow (April).
Treisman, Daniel (1996) “The Politics of Intergovernmental Transfers in Post-Soviet Russia,” The BritishJournal of Political Science 26: 299-335
Treisman, Daniel (1998a) “Fiscal Redistribution in a Fragile Federation: Moscow and the Regions in1994," The British Journal of Political Science 28: 185-222.
Treisman, Daniel (1998b) “Deciphering Russia’s Federal Finance: Fiscal Appeasement in 1995 and1996," Europe-Asia Studies 50 (5): 893-906.
United States Advisory Commission on Intergovernmental Relations (1990), RepresentativeExpenditures: Addressing the Neglected Dimension of Fiscal Capacity, Information ReportM-174, Washington DC: ACIR.
United States Advisory Commission on Intergovernmental Relations. 1995. The Role of Federal Mandatesin Intergovernmental Relations: A Preliminary ACIR Report, Washington DC: ACIR.
Wallich, Christine I., editor (1994) Russia and the Challenge of Fiscal Federalism, The World Bank,Washington D.C.
World Bank (1996) Fiscal Management in the Russian Federation, Washington D.C.
Zhuravskaya, Ekatherina (1998) “Incentives to Provide Local Public Goods; Fiscal Federalism

-98-
Table 1Assignment of Expenditure Responsibilities in the Russian Federation in 1997
Expenditure Federal Regional Local
Defense 100 percent (except military Military housing ---housing)
Justice/internal security 100 percent --- ---
Foreign economic relations National programs Some regions maintain their ---own relations
Education All university and research All technical and vocational Wages, operation constructions,institute expenditures schools and maintenance of all primary
and secondary schools
Culture and parks National museums Regional museums ---National theaters
Health Medical research institutes Tertiary hospitals, Secondary hospitalspsychiatric hospitals, veteranhospitals, diagnostic centers, Primary health clinicsand special service hospitals(cardiology, etc.) Medicines
Roads Construction and Construction and Maintenance of rayon and citymaintenance of federal roads maintenance of oblast roads roads
Public transportation -- Most public transportation Some transportation facilities,facilities including subway systems
Fire protection --- Most fire protection services Voluntary, military, andenterprise services possible atthis level
Libraries Special libraries (for example, Special library services Most local library servicesthe Lenin library)
Police services National militia Traffic police and National Local security policemilitia
Sanitation --- --- Garbage Collection(garbage collection)
Sewage --- Infrastructure capital Most of the operationalinvestment expenditures
Public utilities (gas, --- Subsidies to enterprises Subsidies to enterpriseselectricity, and water)
Housing --- Part of housing construction Part of housing construction,and subsidies subsidies, and maintenance
Price subsidies Part of food and medicine --- Fuels, mass transport; foodsubsidies (bread, milk); medicines
Welfare compensation Part central government Part oblast government Managing programs funded byresponsibility responsibility upper-level governments
Environment National environmental issues Local environmental ---problems, (for example, thepreservation of forests)
Public enterprises Federal investment programs, Subsidies to particular sectors Various explicit and implicitsubsidized credits, subsidies to (agriculture), investments, subsidies and benefitsparticular sectors (mining, grants, tax benefitsagriculture, tax benefits)
SOURCE: Updated from Martinez-Vazquez (1994)

-99-
Table 2Distribution of Expenditures Between the Levels of the Government, 1992-1997
(as percent of GDP)
1992 1993 1994 1995 1996 1997
Federal Budget 39.6 23.8 23.4 18.4 19.8 15.7
Consolidated Region Budget 12.3 16.1 18.2 15.1 15.6 17.0
Regional Budgets 6.0 8.0 9.7 7.8 7.8 --
Local Budgets 6.3 8.1 8.5 7.3 7.8 --
Total 51.9 39.9 41.6 33.5 35.4 32.7
Note: Transfers to other levels of government may result in double counting; amounts may not add up due to rounding.Source: Freinkman et al. (1998) and Ministry of Finance.

-100-
Table 3Distribution of Expenditures Between the Levels of the Government, 1992-1997
(as percent of total)
Expenditures
1992 1993 1994 1995 1996 1997
Federal Budget 76.3 59.6 56.3 54.9 56.0 48.0
Consolidated Region Budget 23.7 40.4 43.7 45.1 44.0 52.0
Regional Budgets 11.6 20.1 23.3 23.3 22.0 --
Local Budgets 12.1 20.3 20.4 21.8 22.0 --
Total 100.0 100.0 100.0 100.0 100.0 100.0
Note: Transfers to other levels of government may result in double counting; amounts may not add up due to rounding.Source: Freinkman et al. (1998) and Ministry of Finance.

-101-
Table 4Distribution of Expenditures by Function Between the Levels of Government, 1992-1997
1992 1993 1994 1995 1996 1997
Administration And Justice 100.0 100.0 100.0 100.0 100.0 100.0
Federal Budget 80.5 79.6 81.4 63.1 63.7 62.0
Consolidated Subnational Budget 19.5 20.4 18.6 36.9 36.3 38.0
Regional Budgets 5.5 6.1 6.2 -- 19.0 --
Local Budgets 14.0 14.3 12.4 -- 17.3 --
Defense 100.0 100.0 100.0 100.0 100.0 100.0
Federal Budget 100.0 100.0 100.0 100.0 100.0 100.0
Consolidated Subnational Budget 0.0 0.0 0.0 0.0 0.0 0.0
Regional Budgets 0.0 0.0 0.0 0.0 0.0 0.0
Local Budgets 0.0 0.0 0.0 0.0 0.0 0.0
National Economy 100.0 100.0 100.0 100.0 100.0 100.0
Federal Budget 80.8 48.6 30.4 26.3 27.5 24.0
Consolidated Subnational Budget 19.2 51.4 69.6 73.7 72.5 76.0
Regional Budgets 8.7 24.6 34.8 35.4 32.4 --
Local Budgets 10.5 26.8 34.9 38.2 40.1 --
Education 100.0 100.0 100.0 100.0 100.0 100.0
Federal Budget 33.8 19.5 19.9 15.9 14.5 13.2
Consolidated Subnational Budget 66.2 80.5 80.1 84.1 85.5 86.8
Regional Budgets 14.5 18.9 19.1 19.7 18.0 --
Local Budgets 51.8 61.6 61.0 64.4 67.5 --
Culture and Mass Media 100.0 100.0 100.0 100.0 100.0 100.0
Federal Budget 51.2 34.8 39.6 31.6 34.7 16.5
Consolidated Subnational Budget 48.8 65.2 60.4 68.4 65.3 83.5
Regional Budgets 21.2 30.2 28.9 30.8 29.3 --
Local Budgets 27.6 35.0 31.5 37.6 36.0 --
Health and Phys. Ed. 100.0 100.0 100.0 100.0 100.0 100.0
Federal Budget 11.3 10.5 11.8 9.9 10.2 11.8
Consolidated Subnational Budget 88.7 89.5 88.2 90.1 89.8 88.2
Regional Budgets 28.5 30.2 33.4 33.4 33.1 --
Local Budgets 60.2 59.3 54.8 56.7 56.8 --
Social Protection 100.0 100.0 100.0 100.0 100.0 100.0
Federal Budget 71.8 52.0 50.3 18.5 31.2 41.3
Consolidated Subnational Budget 28.2 48.0 49.7 81.5 68.8 58.7
Regional Budgets 20.4 34.9 34.9 31.1 26.8 --
Local Budgets 7.8 13.2 14.8 50.3 42.0 --

-102-
Source: Freinkman et al. (1998) and Ministry of Finance.

-103-
Table 5Average Regional Expenditures by Category, as Percent of Total Regional Expenditures, 1994-1997
(Coefficient of Variation in Parentheses)
National Housing and of which: of which: Health and SocialEconomy Utilities Agriculture Transportation Education Physical Ed. Protection Other
of which:
1994 36.0 19.9 7.1 2.9 21.7 15.8 6.6 19.0(0.17) (0.35) (0.54) (0.57) (0.17) (0.17) (0.32) (0.25)
1995 34.8 20.4 6.4 3.9 22.6 16.1 8.1 18.3(0.25) (0.34) (0.60) (0.56) (0.22) (0.19) (0.30) (0.49)
1996 41.2 21.9 5.4 4.1 24.0 15.7 8.9 10.3(0.24) (0.38) (0.66) (1.20) (0.23) (0.20) (0.34) (0.18)
1997 32.2 20.9 4.9 3.3 24.4 15.2 7.9 20.4(0.25) (0.34) (0.62) (0.65) (0.21) (0.19) (0.36) (0.29)
Source: Authors’ calculations based on data from the Ministry of Finance.

-104-
Table 6Evaluation of Composition of Expenditures for Subnational Governments in Real Terms, 1992-1997
In Real Terms: Per Capita 1995 Rubles In Real Terms: Index (1994=100)1992 1993 1994 1995 1996 1997 1992 1993 1994 1995 1996 1997
Total Expenditures 1,671.6 2,017.2 2,023.7 1,625.8 1,590.3 1,761.3 82.6 99.7 100.0 80.3 78.6 87.0
National Economy 559.4 662.7 821.7 664.4 735.5 648.9 68.1 80.7 100.0 80.9 89.5 79.0
o/w Housing -- -- 529.9 407.1 409.5 414.9 -- -- 100.0 76.8 77.3 78.3
o/w Agriculture -- -- 120.1 97.0 78.5 76.5 -- -- 100.0 80.7 65.3 63.7
o/w Transport -- -- 57.6 84.7 74.2 77.2 -- -- 100.0 147.2 128.9 134.2
Education 261.2 313.4 401.2 322.0 335.8 372.5 65.1 78.1 100.0 80.3 83.7 92.8
Health and Phys. Ed. 241.6 266.8 320.1 250.2 242.0 252.7 75.5 83.3 100.0 78.2 75.6 78.9
Social Protection 33.5 34.0 120.3 114.8 125.1 128.3 27.8 28.2 100.0 95.4 104.1 106.7
Source: Authors’ calculations based on data from the Ministry of Finance.

-105-
Table 7Regional Economic Disparities in the Russian Federation:
Per Capita Gross Regional Product , Selected Years from 1992-1996(in thousands of Rubles)
Mean Variation Minimum MaximumCoefficient of
1992 124.7 0.87 24.6 786.0
1994 3,725.3 0.74 618.1 20,892.4
1995 9,487.9 0.84 1,881.9 59,004.5
1996 13,554.6 1.04 2,628.0 108,443.5
Source: Authors’ calculations based on data from Goskomstat.

-106-
Table 8Measures of Horizontal Fiscal Imbalance in the Russian Federation:
Per Capita Consolidated Regional Expenditures, 1992-1997 (in thousands of Rubles)
Mean Variation Minimum MaximumCoefficient of
1992 18.9 0.83 7.2 85.15
1993 219.7 0.78 100.7 1,189.2
1994 959.7 1.19 359.8 8,000.7
1995 1,918.2 1.01 720.2 13,004.3
1996 2,861.5 1.06 1,050.3 16,521.1
1997 3,762.6 1.17 1,336.7 30,543.5
Source: Authors’ calculations based on data from the Ministry of Finance.

-107-
Table 9Level of Equalization at Different Stages of Revenue Assignment:
Coefficient of Variation of Cumulative Per Capita Allocation, 1992-1997
Total Revenue Other Regional Revenues after RegionalCollections Revenues FFSR Expenditures 1
Own, Shared and Revenues after all
2 3Transfers and
Settlements 4
1992 -- 0.88 0.88 0.77 0.83
1993 0.68 0.67 0.67 0.79 0.78
1994 0.85 0.89 0.92 1.14 1.19
1995 1.12 0.86 0.89 0.94 1.01
1996 1.33 1.11 1.03 1.00 1.05
1997 1.61 1.39 1.22 1.18 1.17
Defined as all shared and own source tax collections, including the federal share of shared revenues. 1
Excluding transfers and other source of financing. 2
The FFSR was introduced in 1994; in earlier years equalization was achieved through variable 3
sharing rates and other equalizing transfers. Excluding budget loans.4
Source: Authors’ calculations based on data from the Ministry of Finance.

-108-
Table 10Regional Socio-Economic and Demographic Variables: Descriptive Statistics
Cost of Living Index Pct. Pop. Younger Pct. Pop. Older Pct. Pop. inWork Age Work Age Poverty
(1995)
Average 113.3 24.0 18.5 30.64
Coef. of Variation 0.44 0.16 0.29 0.38
Minimum 68.0 18.2 4.4 16.1
Maximum 357.0 35.5 27.1 73.2
Note: Data are for 1996 unless noted otherwise.

-109-
Table 11Determinants of Per Capita Expenditures : 1994-1997 1
Intercept GRP Index Age Age Poverty Transfers Effort RPer Capita Cost of Living Younger Work Older Work Pct. Pop. in Per Capita Tax
Pct. Pop. Pct. Pop.
2 2
1994 -2,516.2 117.9 6.52 37.5 29.0 -1.1 0.84 30.2 0.98
1995 -2,115.7 81.3 17.8 11.6 -7.0 -5.0 0.80 63.4 0.91
1996 -4,607.7 131.0 13.2 53.7 64.1 -9.8 1.86 46.8 0.97
1997 -13,088.3 215.9 28.1 202.4 201.4 -0.0 0.97 44.8 0.95
Bold indicates statistical significance at the 5 percent level. 1
Tax effort is defined as total collections as a percent of gross regional product (GRP). 2
Source: Authors’ calculations based on data from the Ministry of Finance.
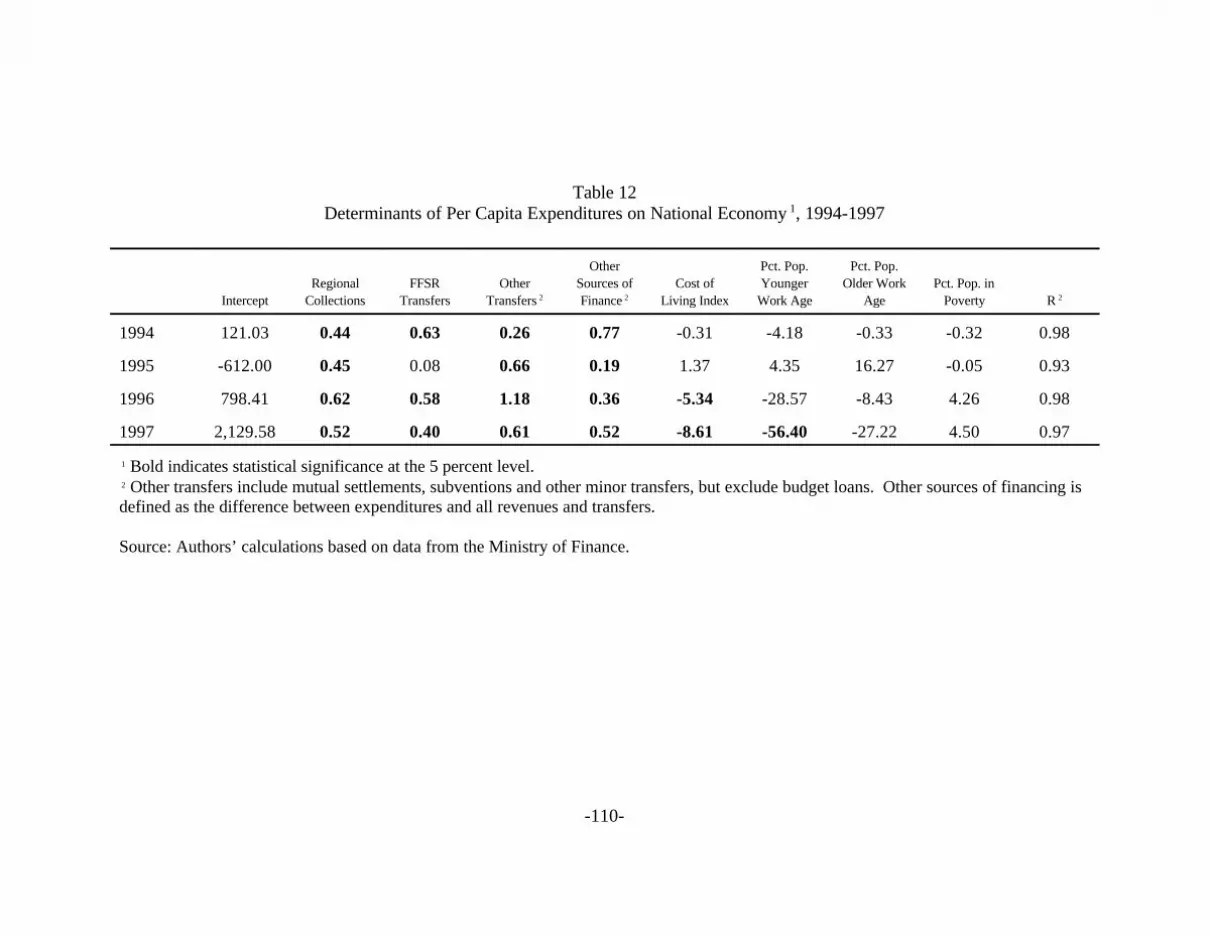
-110-
Table 12Determinants of Per Capita Expenditures on National Economy , 1994-1997 1
Intercept Collections Transfers Transfers Finance Living Index Work Age Age Poverty RRegional FFSR Other Sources of Cost of Younger Older Work Pct. Pop. in
2
Other Pct. Pop. Pct. Pop.
2 2
1994 121.03 0.44 0.63 0.26 0.77 -0.31 -4.18 -0.33 -0.32 0.98
1995 -612.00 0.45 0.08 0.66 0.19 1.37 4.35 16.27 -0.05 0.93
1996 798.41 0.62 0.58 1.18 0.36 -5.34 -28.57 -8.43 4.26 0.98
1997 2,129.58 0.52 0.40 0.61 0.52 -8.61 -56.40 -27.22 4.50 0.97
Bold indicates statistical significance at the 5 percent level. 1
Other transfers include mutual settlements, subventions and other minor transfers, but exclude budget loans. Other sources of financing is 2
defined as the difference between expenditures and all revenues and transfers.
Source: Authors’ calculations based on data from the Ministry of Finance.

-111-
Table 13Determinants of Per Capita Expenditures on Housing and Public Utilities , 1994-1997 1
Intercept Collections Transfers Transfers Finance Living Index Work Age Age Poverty RRegional FFSR Other Sources of Cost of Younger Older Work Pct. Pop. in
2
Other Pct. Pop. Pct. Pop.
2 2
1994 447.14 0.31 0.60 0.22 0.51 -1.11 -12.88 -5.35 0.16 0.94
1995 550.64 0.23 0.32 0.20 0.06 0.24 -23.32 -4.44 0.86 0.86
1996 2,495.37 0.23 0.65 0.98 0.16 -4.98 -57.79 -38.97 -2.68 0.87
1997 4,985.91 0.14 0.39 -0.11 0.36 -5.64 -100.96 -90.99 -5.69 0.86
Bold indicates statistical significance at the 5 percent level. 1
Other transfers include mutual settlements, subventions and other minor transfers, but exclude budget loans. Other sources of financing is 2
defined as the difference between expenditures and all revenues and transfers.
Source: Authors’ calculations based on data from the Ministry of Finance.

-112-
Table 14Determinants of Per Capita Expenditures on Education , 1994-1997 1
Intercept Collections Transfers Transfers Finance Living Index Work Age Age Poverty RRegional FFSR Other Sources of Cost of Younger Older Work Pct. Pop. in
2
Other Pct. Pop. Pct. Pop.
2 2
1994 -318.08 0.15 0.14 0.17 0.06 0.93 8.47 4.20 -0.54 0.99
1995 -510.39 0.13 0.26 -0.05 -0.05 3.04 12.76 5.18 -2.17 0.96
1996 36.14 0.10 0.17 -0.11 0.30 3.53 3.97 -6.64 -3.19 0.94
1997 -723.65 0.08 0.15 -0.07 0.16 7.37 23.94 0.43 -6.23 0.94
Bold indicates statistical significance at the 5 percent level. 1
Other transfers include mutual settlements, subventions and other minor transfers, but exclude budget loans. Other sources of financing is 2
defined as the difference between expenditures and all revenues and transfers.
Source: Authors’ calculations based on data from the Ministry of Finance.

-113-
Table 15Determinants of Per Capita Expenditures on Public Health and Physical Education , 1994-1997 1
Intercept Collections Transfers Transfers Finance Living Index Work Age Age Poverty RRegional FFSR Other Sources of Cost of Younger Older Work Pct. Pop. in
2
Other Pct. Pop. Pct. Pop.
2 2
1994 181.46 0.10 0.08 0.14 -0.13 -0.08 -3.61 -2.68 -0.14 0.97
1995 119.41 0.11 0.18 0.06 -0.01 0.54 -2.34 -2.10 -0.26 0.95
1996 534.25 0.09 0.16 -0.05 0.16 0.37 -9.97 -9.37 -0.79 0.94
1997 534.49 0.06 -0.16 -0.24 0.07 2.24 -6.34 -13.84 -3.10 0.90
Bold indicates statistical significance at the 5 percent level. 1
Other transfers include mutual settlements, subventions and other minor transfers, but exclude budget loans. Other sources of financing is 2
defined as the difference between expenditures and all revenues and transfers.
Source: Authors’ calculations based on data from the Ministry of Finance.

-114-
Table 16Expenditure Assignment in the Budget Code, 1998
A. Expenditures Financed Exclusively from the Federal Regional and/or Local) Subjects of the Russian from Local BudgetsBudget Federation
B. Jointly Financed C. Expenditures FinancedExpenditures (Federal, Exclusively from Budgets of D. Expenditures Financed Exclusively
C support of the activity of the President of the Russian C state support of industries C operation of legislative C operation of local self-governmentFederation, Federal Assembly of the Russian Federation, (save for nuclear power (representative) and authoritiesAccounting Chamber of the Russian Federation, Central generation), construction executive authorities of C formation and management ofElection Commission of the Russian Federation, federal and construction industry, subjects of the Russian municipal propertyexecutive authorities and their regional branches, other agriculture, road and river Federation C organization, maintenance andexpenditures on general government administration in transport, C servicing and repayment of development of education, health care,accordance with the list established in the process of approval communications, roads the sovereign debt of social and physical culture institutionsof the federal law on the federal budget for the next fiscal year and metro systems subjects of the Russian and sports facilities, mass media and
C functioning of the federal judiciary system C law enforcement Federation other institutions owned byC international activities in the interests of the Federation: activities C elections and referenda in municipalities or managed by local self-
financial support of the implementation of inter-state C fire safety activities subjects of the Russian government authoritiesagreements and agreements with international financial C research, design and Federation C operation of municipal lawinstitutions; international cultural, scientific and information surveys in support of C implementation of regional enforcement agenciescooperation of federal executive authorities; quotas of the scientific and targeted programs C organization, maintenance andRussian Federation in international organizations; other technological progress C formation of state property development of municipal housing andexpenditures in the area of international cooperation C social protection of the of subjects of the Russian utilitiesdetermined in the course of approval of the federal law on the population Federation C municipal road construction andfederal budget for the next fiscal year C environmental C international and foreign maintenance
C expenditures on national defense and national security, protection, protection economic relations of C amelioration of municipally-ownedconversion of defense industries and reproduction of subjects of the Russian areas and plantation of trees
C fundamental research and promotion of scientific and natural resources, Federation C organization of domestic wastetechnological progress hydrometeorological C maintenance and utilization and recycling (save for
C state support of railway, air and sea transport activities development of enterprises, radioactive waste)C state support of nuclear power generation C prevention and institutions and C maintenance of burial places managedC liquidation of consequences of emergencies and natural liquidation of organizations subordinate to by municipalities
disasters of federal significance consequences of public authorities of subjects C organization of transport service forC space research and use emergency situations and of the Russian Federation the population and institutions ownedC maintenance of federally-owned institutions or institutions natural disasters of inter- C activities of mass media in by municipalities or managed by local
managed by public authorities of the Russian Federation regional significance subjects of the Russian self-government authoritiesC formation of federal property C development of the Federation C fire safetyC servicing and repayment of sovereign debt of the Russian market infrastructure C financial assistance to local C environmental protection in
Federation C development of federal budgets municipalitiesC compensation of expenditures incurred by state and inter-ethnic relations C execution of individual C implementation of targeted programs
extrabudgetary funds in relation to state pensions, allowances C operation of Election public responsibilities adopted by local self-governmentand other social benefits to be financed from the federal Commissions of subjects delegated to the municipal authoritiesbudget pursuant to the legislation of the Russian Federation of the Russian Federation level C servicing and repayment of municipal
C replenishment of state reserves of precious metals and gems, pursuant to the legislation C compensation of additional debtand state material reserves of the Russian Federation expenditures resulting from C targeted subsidization of households
C elections and referendums in the Russian Federation C support of mass media decisions taken by public C maintenance of municipal archivesC federal investment program C financial assistance to authorities of subjects of the C municipal elections and localC implementation of decisions taken by federal public other budgets Russian Federation, which referendums
authorities, which increased budgetary expenditures or reduced C other expenditures to be increased budgetary C implementation of other decisionsbudgetary revenues of budgets of other levels jointly financed by the expenditures or reduced taken by local self-government
C execution of individual public responsibilities delegated to Russian Federation, budgetary revenues of local authorities and other expendituresother levels of power subjects of the Russian budgets classified as local issues to be
C financial support of subjects of the Russian Federation Federation and C other expenditures determined by representative bodies ofC official statistics municipalities associated with the local self-government in accordanceC miscellaneous execution of responsibilities with budget classification of the Russian
of subjects of the Russian FederatioFederation

-115-
Table 17Legislated Sharing Rates of Major Taxes in the Russian Federation
(Percent of Total)
Law onBasic
Principlesof Taxation,
19911992, Q1 Q2-Q4 1993 1994 Q1 Q2-Q4 1995 1996 1997 1998
1992, 1994
Fed Reg Fed Reg Fed Reg Fed Reg Fed Reg Fed Reg Fed Reg Fed Reg Fed Reg Fed Reg
VATa 100 0 ad hoc 80 20 80- 20- 75 25 75 25 75 25 75 25 75 25 75 25negot. 50 50
Profit tax 0 100 47 53 41 59 31 69 37- 63- 37- 63- 34 66 34 66 34 66 34 66b
34 66 34 66c c c c
Personalincome tax
0 100 0 100 0 100 0 100 0 100 0 100 10 90 10 90 0 100 40 60b
Excise onalcohol
50 50 50 50 50 50 50 50 50 50 50 50 50 50 50 50 50 50 50 50
Energyexcises
--- --- 100 0 100 0 100 0 100 0 100 0 100 0 100 0 100 0 100 0
Excises ondomesticproductions
--- --- n.a. n.a. n.a. n.a. n.a. n.a. 0 100 0 100 0 100 0 100 0 100 0 100
SOURCE: Modified and updated from Fiscal Management in Russia, World Bank,1996
VAT on imports, precious metals and stones in assigned 100 percent at the federal level.a
These taxes could be shared with the federal government.b
The federal profit tax rate is 13 percent; regional profit tax rates range up to 22 (for most enterprises) and 25 (for banks and insurance companies)percent of profits.c
The sharing percentages in the table are calculated based on the 13/22 and 13/25 profit tax rate.

-116-
Table 18Status of Taxes in the Tax Code* (1998)
Federal Taxes Regional Taxes Local Taxes
C Value Added Tax C Tax on Property of C Land TaxC Excises on Specific Goods Organizations C Individual Property TaxC Excises on Raw Materials C Tax on Real Estate C Tax on AdvertisingC Enterprise Profits Tax C Road Tax C Inheritance or Gift TaxC Capital Gains Tax C Transport Tax C Local License FeesC Personal Income Tax C Sales TaxC Contributions to State Off- C Tax on Gambling Enterprises
Budget Funds C Regional License FeesC Customs DutiesC State DutiesC Tax on Subsoil UseC Tax on Rehabilitation of
Minerals Raw Materials BaseC Tax on Additional Income
from HydrocarbonsProduction
C Fee for the Right of Use ofFauna and Water BiologicalResources
C Forest TaxC Water TaxC Ecological TaxC Federal License Fees
* The assignments are in the General Part of the Tax Code which has been approved by the Duma and signed by thePresident. The specific part of the Tax code which develops each of the taxes has not been approved as of June 1999.

-117-
Table 19Own Revenues and Shared Revenues as a Percentage of
Consolidated Subnational Collections (Excluding Transfers and Subventions)
1992 1993 1994 1995 1996 1997
Own Source Revenues 16.7 16.5 27.0 29.3 38.7 40.5
Shared Revenues 83.3 84.5 73.0 70.7 61.3 59.5
Source: Ministry of Finance and Igudin (1998).

-118-
Table 20Distribution of Revenues Between the Levels of Government, 1992-1997
1992 1993 1994 1995 1996 1997
Total Tax Revenues 100.0 100.0 100.0 100.0 100.0 100.0
Federal Budget 60.3 45.6 48.3 48.4 49.8 42.5
Consolidated Subnational Budget 39.7 54.4 51.7 51.6 50.2 57.5
Regional Budgets 19.4 28.3 26.4 26.2 23.7 --
Local Budgets 20.3 26.1 25.3 25.4 26.5 --
Profit Tax 100.0 100.0 100.0 100.0 100.0 100.0
Federal Budget 41.3 32.5 35.1 35.6 36.6 32.4
Consolidated Subnational Budget 58.7 67.5 64.9 64.4 63.4 67.6
Regional Budgets 30.1 39.7 38.9 39.0 38.4 --
Local Budgets 28.6 27.7 26.1 25.4 25.0 --
VAT 100.0 100.0 100.0 100.0 100.0 100.0
Federal Budget 75.1 64.4 67.2 75.4 74.8 68.5
Consolidated Subnational Budget 24.9 35.6 32.8 24.6 25.2 31.5
Regional Budgets 15.1 22.5 21.1 14.0 15.7 --
Local Budgets 9.8 13.1 11.7 10.6 9.5 --
Personal Income Tax 100.0 100.0 100.0 100.0 100.0 100.0
Federal Budget 0 0 0.6 9.0 9.2 2.3
Consolidated Subnational Budget 100.0 100.0 99.4 91.0 90.8 97.7
Regional Budgets 22.8 23.2 25.8 24.2 24.6 --
Local Budgets 77.2 76.8 73.6 66.8 66.3 --
Excise Taxes 100.0 100.0 100.0 100.0 100.0 100.0
Federal Budget 47.9 50.5 60.1 72.8 86.8 80.2
Consolidated Subnational Budget 52.1 49.5 39.9 27.2 13.2 19.8
Regional Budgets 41.9 40.2 32.0 21.3 10.3 --
Local Budgets 10.2 9.3 7.9 5.8 2.9 --
Property Taxes 100.0 100.0 100.0 100.0 100.0 100.0
Federal Budget 0 0 0 5.0 0.8 1.2
Consolidated Subnational Budget 100.0 100.0 100.0 95.0 99.2 98.8
Regional Budgets 52.4 45.5 41.8 42.3 44.1 --
Local Budgets 47.6 54.5 58.2 52.8 55.1 --

-119-
Table 20 (Continued)Distribution of Revenues Between the Levels of Government, 1992-1997
1992 1993 1994 1995 1996 1997
Natural Resources Tax 100.0 100.0 100.0 100.0 100.0 100.0
Federal Budget 0 29.1 15.3 24.4 25.1 19.7
Consolidated Subnational Budget 100.0 70.9 84.7 75.6 74.9 80.3
Regional Budgets 63.9 40.6 44.9 36.4 39.0 --
Local Budgets 36.1 30.3 39.7 39.2 35.9 --
Other Taxes 100.0 100.0 100.0 100.0 100.0 100.0
Federal Budget 91.8 77.8 70.7 61.3 43.1 42.9
Consolidated Subnational Budget 8.2 22.2 29.3 38.7 56.9 57.1
Regional Budgets 2.3 8.9 13.1 17.3 16.6 --
Local Budgets 5.9 13.3 16.2 21.4 40.2 --
Non-Tax Revenues 100.0 100.0 100.0 100.0 100.0 100.0
Federal Budget 59.2 -- 38.0 70.9 75.1 66.4
Consolidated Subnational Budget 40.8 -- 62.0 29.1 24.9 33.6
Regional Budgets 33.6 -- 35.7 22.2 18.8 --
Local Budgets 7.1 -- 26.3 7.0 6.1 --
Intergovernmental Transfers 100.0 100.0 100.0 100.0 100.0 100.0
Federal Budget 6.6 -- 3.5 1.7 0.3 0.2
Consolidated Subnational Budget 93.4 -- 96.5 98.3 99.7 99.7
Regional Budgets 33.1 -- 54.4 42.6 46.4 --
Local Budgets 60.3 -- 42.1 55.7 53.2 --Source: Freinkman et al. (1998) and Ministry of Finance.

-120-
Table 21Russia: Consolidated Subnational Own Source Revenue Collections, 1997
Rb. Trillion of TotalPercent
Property Taxes 46.9 39.0
Individual Property Tax 0.4 0.4
Enterprise Property Tax 46.4 38.6
Other Property Taxes 0.1 0.1
Natural Resource Collections 28.6 23.8
Mineral Resource Payments 11.9 9.9
Tax on Depletion of Mineral Resources 6.9 5.7
Land tax 8.4 7.0
Other Natural Resource Collections 1.4 1.2
Other Taxes 44.8 37.2
Tax on Housing and Militia Maintenance 23.6 19.6
Wage Fund Tax 9.1 7.6
Other Income Taxes 0.4 0.3
Special Sales Tax 0.9 0.7
Other Sales Taxes 6.6 5.5
Other Taxes 4.1 3.4
Subnational Own Source Tax Revenues 120.3 100.0
Memo: Regional Non-tax Revenues 21.0 17.5
Memo: Shared Revenue Collections 208.7 173.4
Source: Authors’ calculations based on data from the Ministry of Finance.

-121-
Table 22Summary of Legislative Control over Subnational Own Source Revenues
Tax Tax Base Tax Rate
Legislative Level Legislative Level Budget(s) To WhichDetermining Determining Tax Revenues Go
Tax on Enterprise Property Fed Reg (Fed limit) Fed / Reg
Tax on Property of Physical Persons Fed Fed Loc 1
Land Tax Fed Fed Fed / Reg / Loc2
Tax on Use of Mineral Resources Fed Fed Fed / Reg / Loc
Tax on Depletion of Mineral Resources Fed Fed Fed / Reg
Transport Tax (incl. Road Users, Vehicle Owners Fed/Reg Fed / Reg Regand Acquisition tax)
Housing and Militia Maintenance Taxes Fed Loc (Fed limit) Loc
Educational Charges Fed Reg (Fed limit) Reg / Loc
Advertising Tax Fed Loc (Fed limit) Loc
Resort Fees Loc Loc Loc
Exchange Transaction Fees Fed Fed Fed / Reg
Tax on Resale of Automobiles and Computers Fed Loc (Fed limit) Loc
Racing and Gambling Charges Loc Loc Loc
Tax on Industrial Construction in National Resort Loc Loc LocAreas
Regional and local governments can lower the rate and add exemptions.1
Regional governments set concrete minimum rate for particular kind of land and local governments can raise 2
the rate.

-122-
Table 23Distribution of Revenues Between the Levels of the Government, 1992-1997
(as percent of GDP)
1992 1993 1994 1995 1996 1997
Federal Budget 18.8 13.1 13.6 14.2 12.8 12.4
Consolidated Region Budget 13.8 16.6 18.2 14.8 14.9 15.7
Regional Budgets 6.8 8.4 9.7 7.5 7.2 --
Local Budgets 7.0 8.2 8.5 7.3 7.7 --
Total 32.6 29.7 31.8 29.0 27.7 28.1
Note: Transfers to other levels of government may result in double counting; amounts may not add up due to rounding.Source: Freinkman et al. (1998) and Ministry of Finance.

-123-
Table 24Evaluation of Composition of Revenues for Subnational Governments in Real Terms, 1992-1997
In Real Terms: Per Capita 1995 Rubles In Real Terms: Index (1994=100)1992 1993 1994 1995 1996 1997 1992 1993 1994 1995 1996 1997
Own and Shared Revenues 1,692.9 1,805.9 1,345.5 1,277.5 1,182.5 1,296.9 125.8 134.2 100.0 94.9 87.9 96.4
o/w EPT 684.3 849.1 576.0 511.4 297.5 270.3 118.8 147.4 100.0 88.8 51.7 46.9
o/w PIT 320.4 329.6 318.6 224.8 239.5 290.2 100.6 103.5 100.0 70.6 75.2 91.1
o/w VAT 369.7 302.0 194.0 164.5 193.9 210.1 190.6 155.7 100.0 84.8 100.0 108.3
o/w Exc 82.4 66.0 54.8 44.6 38.3 49.5 150.4 120.4 100.0 81.4 69.9 90.3
Other & Non Tax Revenues 32.3 19.0 237.1 113.1 102.4 141.6 13.6 8.0 100.0 47.7 43.2 59.7
Transfers (Excl. Loans) 106.0 340.2 468.0 191.8 211.0 193.6 22.7 72.7 100.0 41.0 45.1 41.4
Total Revenues 1,831.2 2,165.1 2,050.6 1,583.9 1,497.1 1,632.9 89.3 105.6 100.0 77.2 73.0 79.6
Source: Authors’ calculations based on data from the Ministry of Finance.
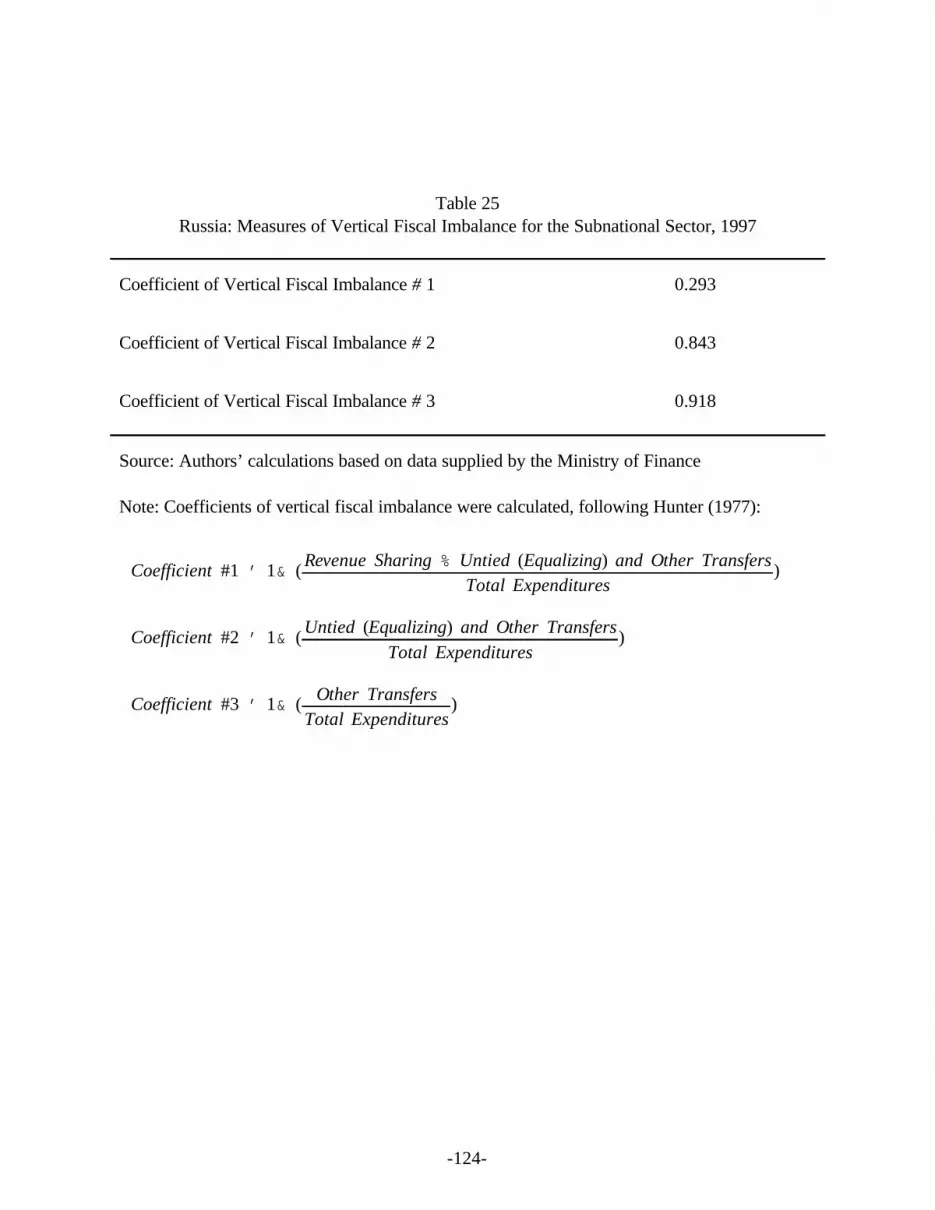
Coefficient #1 ' 1& ( Revenue Sharing % Untied (Equalizing) and Other TransfersTotal Expenditures
)
Coefficient #2 ' 1& ( Untied (Equalizing) and Other TransfersTotal Expenditures
)
Coefficient #3 ' 1& ( Other TransfersTotal Expenditures
)
-124-
Table 25Russia: Measures of Vertical Fiscal Imbalance for the Subnational Sector, 1997
Coefficient of Vertical Fiscal Imbalance # 1 0.293
Coefficient of Vertical Fiscal Imbalance # 2 0.843
Coefficient of Vertical Fiscal Imbalance # 3 0.918
Source: Authors’ calculations based on data supplied by the Ministry of Finance
Note: Coefficients of vertical fiscal imbalance were calculated, following Hunter (1977):

-125-
Table 26Measures of Vertical Fiscal Imbalance for the Subnational Sector:
An International Comparison
Country Coefficient #1 Coefficient #2
Russia 0.293 0.8431
Austria 0.186 0.7172
Belgium 0.156 0.512
Denmark 0.172 0.611
Estonia 0.088 0.6863
Finland 0.191 0.6544
Germany 0.244 0.7942
Latvia 0.069 0.4913
Lithuania 0.111 0.8693
Netherlands 0.288 0.345
Sources: Calculated from data supply by the Ministries of Finance of the Russian Federation,Estonia, Latvia and Lithuania; Revenue Statistics of OECD Member Countries 1965-1992; IMFGovernment Finance Statistics Yearbook 1994.
Note: See Table 25 for definitions of the coefficients. Unless otherwise mentioned, 1991 data used.
Based on 1997 fiscal data.1
Subnational sector includes Länder as well as local governments.2
Based of 1994 fiscal data.3
Coefficients calculated using 1990 local expenditure data.4

-126-
Table 27Measures of Regional Fiscal Disparities in the Russian Federation:
Per Capita Revenue Collections (including Federal Share), 1993-1997(in thousands of Rubles)
Mean Variation Minimum MaximumCoefficient of
1993 251.8 0.68 31.2 943.5
1994 722.0 0.85 24.4 3,878.0
1995 1,950.9 1.12 158.7 15,681.4
1996 2,732.0 1.33 268.9 24,862.2
1997 3,553.9 1.61 477.0 43,881.9
Source: Authors’ calculations based on data from the Ministry of Finance.

-127-
Table 28Concentration of Total Revenue Collections (Including Federal Share) Among Regions:
Share of Total Revenues Collected by Selected Regions, 1993-1997
1993 1994 1995 1996 1997
Five highest collection regions 33.7 32.0 34.5 37.6 40.9
Ten highest collection regions 47.5 45.8 48.0 50.9 54.9
Twenty highest collection regions 64.9 64.6 67.2 68.9 70.9
Coef. of Variation, Per Capita Revenue Collections
0.68 0.85 1.12 1.33 1.61
Source: Authors’ calculations based on data from the Ministry of Finance.

-128-
Table 29Concentration of Regional Revenue Collections Among Regions:
Share of Regional Revenues Collected by Selected Regions, 1992-1997
1992 1993 1994 1995 1996 1997
Five highest collection regions 27.0 28.0 30.2 30.4 31.6 34.1
Ten highest collection regions 42.2 43.1 44.1 45.2 46.5 49.4
Twenty highest collection regions 62.7 62.7 64.1 64.5 65.6 67.3
Coef. of Variation, Per Capita Revenue Collections
0.89 0.67 0.86 0.86 1.14 1.51
Source: Authors’ calculations based on data from the Ministry of Finance.

-129-
Table 30Analysis of Regional Natural Resource Tax (NRT) Collections, 1994-1997
Average, NRT as Variation, Percent of Regional Per Capita NRT
Collections Collections
Coefficient ofCorrelation Per Capita NRT Collections with:
Per Capita GRP Per Capita Regional1
Collections
1994 2.60 3.03 0.81 0.80
1995 5.23 2.35 0.88 0.85
1996 6.55 2.85 0.95 0.94
1997 7.68 3.40 0.95 0.96
Data on 1996 GRP was used for 1997.1
Source: Authors’ calculations based on data from the Ministry of Finance.

Claim byRegion i
' á (
Average revenueper capita in thegroup of regions
( 0.92 &
Per capitarevenues in
Region i(
Population ofRegion i
where á '
Average expenditure per capitain the group of regions
Average revenue per capitain the group of regions
( 0.92
Share of Region iin the pool of funds
for Window I' SIi '
Claim by Region i
Total claims fromall regions
( 100
Actualequalization
grant to region iunder Window I
' SIi(
Pool of fundsavailable for
Window I
-130-
Table 31Fund for Financial Support of the Regions (FFSR)
First Window: Regions in Need of Financial Assistance
(Variables are from base year adjusted for legislation changes since then)
Step 1:
Step 2: (For those regions with a positive claim in Step 1)
Step 3:

Claim byRegion j
'Current expenditures
in Region j&
Revenuesin Region j
%
Equalizationgrant for Region j
in Window I
SharedRegion j in the
pool of fundsfor Window II
' S IIj '
Claim by Region j
Total claims fromall regions
Actualequalization
grant to Region junder Window II
' SIIj (Pool of funds available
for Window II
-131-
Table 31 (Continued)Fund for Financial Support of the Regions (FFSR)
Second Window: Regions in Need of Additional Financial Assistance
(Variables are from base year adjusted for legislation changes since then)
Step 1:
Step 2: (For those regions with a positive claim in Step 1)
Step 3:

R PCi '
Ri
Ni
.
Ki ' js
j'1
Hij / mini js
j'1
Hij .
RPi 'R PC
i
Ki
.
RP
t i ' ( RP & RPi ) @ Ki @ Ni .
RPv '
jm
i'1
RPi @ Ni @ Ki
jm
i'1
@ Ni @ Ki
.
-132-
Table 32Formula for Allocating FFSR Transfers, 1999
Step 1: Determine the amount of funding for the FFSRStep 2: Determine Per Capita Revenue (a measure of fiscal capacity):
Step 3: Determine Index of Budget Expenditures (a measure of expenditure need):
Step 4: Determine Normalized Per Capita Revenue:
Step 5: Assign equalization transfers (t ) for regions for which RP < :i
Step 6: If necessary, only equalize to threshold RP :v
NOTE: In Step 2, R is adjusted revenue collections (a measure of fiscal capacity) and N is population; ini i
Step 3, H is the per capita expenditure norm for region i and expenditure category j. When theij
amount of transfers assigned in Step 5 exceeds the size of the FFSR, the equalization threshold islowered to RP , which is determined in an iterative process that simultaneously determines thev
number of regions eligible for equalization funds(m).

-133-
Table 33Funding Sources for the Regions of the Russian Federation:
Average Regional Funding by Source as Percent of Total Expenditures, 1992-1997
Own, Shared and Other Other Transfers and Other Sources ofRegional Revenues FFSR Transfers Settlements 1
Financing 2
1992 87.2 -- 16.3 -3.5
1993 75.7 -- 30.1 -5.8
1994 66.5 9.4 26.4 -2.3
1995 73.6 17.3 5.6 3.6
1996 68.5 15.0 7.6 9.0
1997 67.9 15.6 4.2 11.5
The FFSR was introduced in 1994; in earlier years equalization was achieved through variable 1
sharing rates and other equalizing transfers. Determined as expenditures minus revenues and transfers; consists mainly of budget loans and 2
borrowing.
Source: Authors’ calculations based on data from the Ministry of Finance.

-134-
Table 34Federal Transfers to the Regions, 1992-1997
(percent of GDP)
1992 1993 1994 1995 1996 1997
Total Fed. Transfers and Loans 1.76 2.71 4.21 1.86 2.37 2.67Total Federal Transfers 1.66 2.66 4.15 1.79 2.11 1.92 “Subventions” 0.79 0.69 0.14 0.06 0.09 0.13 FFSR 0.00 0.00 0.79 1.19 1.07 1.27 Mutual Settlements 0.87 1.95 2.27 0.42 0.83 0.43 Other Transfers 0.00 0.02 0.95 0.12 0.12 0.09
Budget Credits and Loans 0.10 0.05 0.07 0.06 0.26 0.75Source: Ministry of Finance.

-135-
Table 35Evaluation of Composition of Transfers for Subnational Governments in Real Terms, 1992-1997
In Real Terms: Per Capita 1995 Rubles In Real Terms: Index (1994=100)1992 1993 1994 1995 1996 1997 1992 1993 1994 1995 1996 1997
Transfers 106.0 340.2 468.0 191.8 211.0 193.6 22.7 72.7 100.0 41.0 45.1 41.4(excl. Budget Loans)
o/w FFSR -- -- 95.6 128.0 109.1 131.5 -- -- 100.0 133.9 114.1 137.5
o/w Mutual Settlements -- 255.7 307.2 47.1 85.2 44.6 -- 83.3 100.0 15.3 27.7 14.5
Total Revenues 1,831.2 2,165.1 2,050.6 1,583.9 1,497.1 1,632.9 89.3 105.6 100.0 77.2 73.0 79.6(excl.Loans and borrowing)
Source: Ministry of Finance.

-136-
Table 36Regression Analysis: Per Capita FFSR Transfers , 1994-1997 1
Intercept GRP Index Work Age Work Age in Poverty Effort RPer Capita Living Younger Older Pct. Pop. Tax
Cost of Pct. Pop. Pct. Pop.
2 2
1994 -13.0 -1.4 0.68-1,743.0 6.8 26.3 37.3 -8.6
1995 -4.5 -1.0 0.81-4,219.4 -18.6 16.6 72.0 69.8
1996 0.3 -2.3 0.76-3,450.8 -7.6 13.1 65.3 50.7
1997 -1.8 -3.0 0.74-5,000.5 -10.3 18.9 93.8 72.1
Bold indicates statistical significance at the 5 percent level. 1
Tax effort is defined as total collections as a percent of gross regional product (GRP). 2
Source: Authors’ calculations based on data from the Ministry of Finance.

-137-
Table 37Regression Analysis: Per Capita Other Transfers (Excluding Budget Loans) , 1994-1997 1
Intercept GRP Index Work Age Work Age in Poverty Effort RPer Capita Living Younger Older Pct. Pop. Tax
Cost of Pct. Pop. Pct. Pop.
2 2
1994 -2,569.6 -55.2 12.3 37.3 14.629.1 -1.1 0.79
1995 -1,509.4 6.5 24.2-6.7 16.3 0.9 4.9 0.63
1996 -1,306.9 6.1 24.5-0.6 15.0 -1.3 3.0 0.59
1997 -1,498.2 -6.1 -29.4 -35.40.8 -0.8 1.5 0.36
Bold indicates statistical significance at the 5 percent level. 1
Tax effort is defined as total collections as a percent of gross regional product (GRP). 2
Source: Authors’ calculations based on data from the Ministry of Finance.

-138-
Table 38Regression Analysis: Allocation of (Per Capita) Regional Resources , 1994 1
Intercept GRP Index Work Age Work Age in Poverty Effort RPer Capita Living Younger Older Pct. Pop. Tax
Cost of Pct. Pop. Pct. Pop.
2 2
Total Collections -932.9 182.2 -0.4 11.4 -4.7 0.3 44.2 0.98
Regional Rev. -1,746.2 138.8 2.4 30.4 15.1 -0.7 29.3 0.89
After FFSR -3,489.2 125.8 9.2 56.7 52.4 -2.1 20.7 0.94
After All Transfers -6,058.9 70.6 21.6 94.0 81.5 -3.1 35.3 0.90
Reg. Expenditures -6,147.0 60.4 22.7 91.0 84.9 -3.2 35.3 0.89
Bold indicates statistical significance at the 5 percent level. 1
Tax effort is defined as total collections as a percent of gross regional product (GRP). 2
Source: Authors’ calculations based on data from the Ministry of Finance.

-139-
Table 39Regression Analysis: Allocation of (Per Capita) Regional Resources , 1995 1
Intercept GRP Index Work Age Work Age in Poverty Effort RPer Capita Living Younger Older Pct. Pop. Tax
Cost of Pct. Pop. Pct. Pop.
2 2
Total Collections -4,352.6 268.1 -1.6 51.6 39.2 8.5 88.8 0.98
Regional Rev. 120.5 100.6 5.55 16.9 -21.9 -5.6 32.2 0.91
After FFSR -4099.0 82.0 22.1 55.1 47.9 -10.1 31.1 0.91
After All Transfers -5,608.3 72.3 28.7 71.4 72.1 -9.3 36.0 0.90
Reg. Expenditures -6,690.1 61.1 33.2 82.2 68.0 -7.9 66.5 0.88
Bold indicates statistical significance at the 5 percent level. 1
Tax effort is defined as total collections as a percent of gross regional product (GRP). 2
Source: Authors’ calculations based on data from the Ministry of Finance.

-140-
Table 40Regression Analysis: Allocation of (Per Capita) Regional Resources , 1996 1
Intercept GRP Index Work Age Work Age in Poverty Effort RPer Capita Living Younger Older Pct. Pop. Tax
Cost of Pct. Pop. Pct. Pop.
2 2
Total Collections -4,305.9 254.3 -4.4 44.1 38.9 4.6 113.3 0.96
Regional Rev. -878.6 127.5 8.3 -4.4 -2.2 -5.9 24.1 0.92
After FFSR -4329.4 119.9 21.4 61.0 48.4 -5.67 21.8 0.88
After All Transfers -5,636.3 119.3 27.5 76.0 72.9 -6.9 24.8 0.89
Reg. Expenditures -13,435 115.7 48.8 202.8 203.6 -11.7 48.1 0.92
Bold indicates statistical significance at the 5 percent level. 1
Tax effort is defined as total collections as a percent of gross regional product (GRP). 2
Source: Authors’ calculations based on data from the Ministry of Finance.

-141-
Table 41Regression Analysis: Allocation of (Per Capita) Regional Resources , 1997 1
Intercept GRP Index Work Age Work Age in Poverty Effort RPer Capita Living Younger Older Pct. Pop. Tax
Cost of Pct. Pop. Pct. Pop.
2 2
Total Collections -9,363.2 348.0 -4.9 106.5 135.4 17.0 115.2 0.97
Regional Rev. -4,187.1 210.6 3.57 63.0 51.7 -1.0 27.5 0.96
After FFSR -9,192.0 200.3 22.4 156.8 123.8 -2.8 30.2 0.93
After All Transfers -7,693.9 194.2 23.2 127.4 88.3 -3.6 31.7 0.94
Reg. Expenditures -16,465 200.2 48.2 264.8 240.8 -4.22 43.7 0.94
Bold indicates statistical significance at the 5 percent level. 1
Tax effort is defined as total collections as a percent of gross regional product (GRP). 2
Source: Authors’ calculations based on data from the Ministry of Finance.

-142-
Table 42Explaining Tax Effort for Regional Collections , 1994-1997 1
Intercept GRP Index Taxes Tax Taxes (pct. Exp) RPer Capita Living Business Income Sales Transfer
Cost of Personal FFSR
2 2 2 2
1994 6.40 -0.46 0.06 0.08 -0.12 0.14 -0.14 0.48
1995 8.35 -0.06 0.03 0.06 -0.12 0.07 -0.04 0.45
1996 11.36 -0.02 0.02 0.06 -0.09 0.01 -0.05 0.34
1997 6.65 0.05 0.02 0.07 0.00 0.12 -0.03 0.41
Bold indicates statistical significance at the 5 percent level. 1
Expressed as percent of total regional revenues.2
Source: Authors’ calculations based on data from the Ministry of Finance.

-143-
Table 43Explaining Tax Effort for Overall Collections (Including Federal Share) , 1994-1997 1
Intercept GRP Collect. Index Taxes Tax Taxes (% Exp) R
Per Regional Cost of Personal FFSRCapita Share of Living Business Income Sales Transfer
2 2 2 2
1994 28.5 -0.64 -0.25 0.08 0.09 -0.17 0.17 -0.21 0.57
1995 38.3 -0.06 -0.31 0.04 -0.01 -0.10 0.04 -0.10 0.73
1996 47.0 -0.02 -0.40 0.02 -0.01 -0.10 -0.07 -0.09 0.66
1997 36.4 0.09 -0.42 0.03 0.09 0.01 0.23 -0.02 0.51
Bold indicates statistical significance at the 5 percent level. 1
Expressed as percent of total regional revenues.2
Source: Authors’ calculations based on data from the Ministry of Finance.

-144-
Table 44Percent of the Executed Share of a Region in the FFSR
1995 1996 1997 1995 1996 1997
Karelia Republic 50.0 103.7 115.0 Belgorod Oblast 80.9 136.4 80.0Komi Republic 87.6 157.2 111.0 Voronezh Oblast 101.2 104.1 113.0Arhangelsk Oblast 103.0 136.2 74.0 Kursk Oblast 94.6 105.5 96.0Nenetski AO 94.3 90.7 142.0 Lipetsk Oblast Donor Donor DonorVologda Oblast 90.3 122.8 13.0 Tambov Oblast 126.8 82.3 110.0Murmansk Oblast 90.0 25.8 67.0 Kalmykia Oblast 98.0 98.2 120.0a
Saint Petersburg Donor 79.2 94.0 Tatarstan Oblast 0.0 Donor 121.0Leningrad Oblast 104.5 73.6 114.0 Astrakhan Oblast 106.0 106.1 106.0Novgorod Oblast 107.7 98.3 105.0 Volgograd Oblast 83.5 151.2 83.0Pskov Oblast 96.3 113.8 94.0 Penza Oblast 95.4 126.6 106.0
Bryansk Oblast 97.9 134.1 84.0 Samara Oblast Donor Donor DonorVladimir Oblast 92.0 104.6 114.0 Saratov Oblast 95.0 88.8 104.0Ivanovo Oblast 101.7 82.7 113.0 Ulyanovsk Oblast 94.7 117.9 89.0Kaluga Oblast 94.2 120.5 96.0 Adygeya Republic 96.1 115.3 178.0Kostroma Oblast 93.1 132.0 87.0 Dagestan Republic 133.5 87.8 111.0Moscow Donor Donor Donor Ingushetiya Republic 101.0 107.6 216.0Moscow Oblast 74.1 50.1 69.0 Kabardino-Balkariya Rep. 99.0 105.7 138.0Orlov Oblast 102.1 91.6 149.0 Karachayevo-Cherkessia Rep. 94.9 90.0 132.0Ryasan Oblast 70.1 121.1 80.0 North Ossetia Republic 95.2 112.2 99.0Smolensk Oblast 92.9 101.6 119.0 Chechnya Republic 207.9 89.2 17.0Tver Oblast 93.9 109.1 112.0 Krasnodar Krai 93.8 89.2 116.0Tula Oblast 97.8 116.8 114.0 Stavropol Krai 109.8 114.0 100.0Yaroslavi Oblast Donor 25.1 111.0 Rostov Oblast 107.3 88.6 116.0
b
Marii El Oblast 102.2 105.0 109.0 Bashkortostan Republic Donor Donor DonorMordoviya Oblast 101.6 98.9 121.0 Udmurtia Republic 108.0 102.7 38.0Chuvashia Oblast 107.0 101.6 122.0 Kurgan Oblast 91.6 105.5 110.0Kirov Oblast 92.2 96.8 113.0 Orenburg Oblast 97.1 118.4 102.0Nizhny Novgorod Oblast Donor 114.2 94.0 Perm Oblast 81.0 26.4 66.0c
Instead of 0.0 percent, received 25.8 from its 1995 share. Instead of 0.0 percent, received 50.1 from its 1995 share. Instead of 0.0 percent, received 26.4 froma b c
its 1995 share.

-145-
Table 44 (Continued)Percent of the Executed Share of a Region in the FFSR
1995 1996 1997 1995 1996 1997
Komi-Permyatski AO 101.4 89.1 102.0 Irkutsk Oblast 86.2 105.1 73.0Sverdlosk Oblast Donor Donor Donor Ust-Ordynsk Buryat AO 93.3 1.9 111.0Chelabinsk Oblast 72.4 121.4 81.0 Chita Oblast 97.7 87.7 103.0Gorny Altay Republic 111.0 137.6 172.0 Aginskiy Buryat AO 100.4 102.5 110.0Altay Krai 105.9 98.1 112.0 Sakha Republic (Yakutia) 89.8 56.2 68.0Kemerovo Oblast 95.3 136.6 83.0 Everyskaya AO 156.2 100.7 105.0Novosibirsk Oblast 103.1 11240.0 141.0 Chukotka AO 111.7 84.1 128.0
d
Omsk Oblast 94.4 214.3 74.0 Primorsky Krai 90.3 19.0 68.0Tomsk Oblast 98.1 112.8 104.0 Khabarovsk Krai 93.2 123.9 101.0Tyumen Oblast 89.6 46.7 107.0 Amur Oblast 100.5 77.8 116.0Khanty-Mansiyiski AO Donor Donor Donor Kamchatka Oblast 94.5 39.5 74.0Yamalo-Nenetski AO Donor Donor Donor Koryaksky AO 103.3 147.4 95.0Buryatia Republic 101.5 77.4 143.0 Magadan Oblast 101.0 100.6 108.0Tuva Republic 105.6 118.4 178.0 Sakhalin Republic 98.9 93.3 106.0Khakissiya Republic 99.4 91.8 100.0 Kalilingrad Oblast 94.9 73.3 123.0
e
f
Krasnoyarsk Krai Donor Donor DonorTaymyr AO 98.1 103.3 124.0Evenkiyski AO 94.7 129.0 153.0
Instead of 0.0 percent, received 1.9 percent from its share in 1995. Instead of 0.0 percent, received 19.0 percent from its share in 1995. Instead of 0.0 percent,d e f
received 39.5 percent from its share in 1995.

-146-
Table 45Russia: Consolidated Budget Execution as Percent of GDP, 1992-1997
Federal Government 1992 1993 1994 1995 1996 1997
Revenues 18.80 13.13 13.60 14.24 12.82 12.41
Expenditures 39.65 23.77 23.40 18.45 19.80 15.73
Balance, after transfers -20.85 -10.65 -9.80 -4.21 -6.98 -3.32
Balance, before transfers -19.44 -8.08 -6.20 -2.10 -4.64 -0.71
Consol. Regional Government 1992 1993 1994 1995 1996 1997
Revenues 13.78 16.59 18.23 14.83 14.91 15.72
Expenditures 12.34 16.06 18.24 15.15 15.58 16.96
Balance, after transfers 1.45 0.53 -0.01 -0.32 -0.67 -1.24
Balance, before transfers 0.04 -2.04 -3.62 -2.43 -3.01 -3.85
GDP, Rb. trillion 19.0 171.5 610.7 1630.1 2200.0 2602.3
Source: Freinkman et al.(1998) and Ministry of Finance.

-147-
Table 46Relative Size of Subnational Debt: Comparison of Selected Countries
Subnational Debt as Percent Subnational Debt as Percentof Subnat. Expenditures of GDP
Australia (1996) 57 11
Germany (1996p) 91 21
Switzerland (1995) 100 25
United States (1995) 65 13
Russia (Estimate 1997) 40 6Sources: Freinkman et al. (1998) and computed by authors based on data from the IMF.

-148-
Table 47Regression Analysis: Per Capita “Other Sources of Financing” , 1994-19971, 2
Intercept GRP Index Work Age Work Age in Poverty Effort RPer Capita Living Younger Older Pct. Pop. Tax
Cost of Pct. Pop. Pct. Pop.
3 2
1994 -88.2 -10.1 1.1 -2.9 3.4 -0.1 -0.1 0.20
1995 -1081.8 -14.2 4.6 10.7 -4.1 1.4 30.5 0.35
1996 -7798.3 -3.5 21.3 12.7 13.1 -4.8 23.3 0.62
1997 -8541.6 7.7 24.8 136.0 151.4 0.7 0.6 0.60
Defined as expenditures minus revenues and transfers; “other sources of financing” mostly consists 1
of budget loans and borrowing. Bold indicates statistical significance at the 5 percent level. 2
Tax effort is defined as total collections as a percent of gross regional product (GRP).3
Source: Authors’ calculations based on data from the Ministry of Finance.