decentralization in argentina
TRANSCRIPT
ECONOMIC GROWTH CENTER
YALE UNIVERSITY
P.O. Box 208269New Haven, CT 06520-8269
CENTER DISCUSSION PAPER NO. 825
DECENTRALIZATION IN ARGENTINA
Nadir Habibi, Yale UniversityCindy Huang, Yale University
Diego Miranda, Harvard UniversityVictoria Murillo, Yale University
Gustav Ranis, Yale UniversityMainak Sarkar, Yale University
Frances Stewart, Oxford University
May 2001
Note: Center Discussion Papers are preliminary materials circulated to stimulate discussions and criticalcomments.
The authors gratefully acknowledge financial support from the International Labor Organization, theDavid Rockefeller Center for Latin American Studies, the Program on Constitutional Government atHarvard University and the National Science Foundation.
This paper can be downloaded without charge from the Social Science Research Networkelectronic library at: http://papers.ssrn.com/paper.taf?abstract_id=275291
An index to papers in the Economic Growth Center Discussion Paper Series is located at:http://www.econ.yale.edu/~egcenter/research.htm
Decentralization in Argentina
Nadir Habibi, Cindy Huang, Diego Miranda, Victoria Murillo,Gustav Ranis, Mainak Sarkar, Frances Stewart
Abstract
Human development, reflected in the status of people’s levels of health and education,
affects future growth and, in turn, is affected by decentralization. Unlike earlier exclusive
emphasis on budgetary issues, this study focuses on the impact of fiscal decentralization on the
level of human development. It traces the origin and recent development of revenue-sharing
arrangements across Argentina’s provinces over time (1970-94). The study regresses two
indicators of health and educational status on two decentralization measures. It highlights the link
between decentralization and human development outcomes and suggests that devolutionary
decentralization has a positive influence on the effectiveness of public policy directed towards an
improvement in the level of human development. Decentralization is shown to reduce intra-
regional disparities and increase levels of human development. While the paper also recognizes
problems associated with decentralization, including addressing inter-regional disparities, the
positive impact of decentralization schemes on human development is seen to be of relevance in
evaluating the Argentine co-participation regime which is currently under negotiation.
JEL Classification: O18
Key Words: Fiscal Decentralization, Human Development, Argentina
2
DECENTRALIZATION IN ARGENTINA
Nadir Habibi, Cindy Huang, Diego Miranda, Victoria Murillo, Gustav Ranis, Mainak Sarkar
and Frances Stewart *
I. Introduction
The search for sustainable development has triggered broad processes of institutional
innovation aimed at increasing efficiency and equity, while dealing with fiscal crises and their
macroeconomic consequences. These processes have contributed to the spread of political and
fiscal decentralization in Latin America, as well as in much of the developing world.1 As a result,
a strong body of scholarly literature has emerged analyzing different aspects of decentralization.2
Fiscal decentralization is at the core of this literature, as scholars attempt to analyze the politics
and economics underlying the transfer of resources and their collection, as well as the allocation
of authority to lower levels of goverment. Most studies of fiscal decentralization in Latin
America have focused on its budgetary effects because of the implications of budget deficits for
macroeconomic stability. Scholarly attention has consequently focused on the 'softening' effect
fiscal decentralization may have on the budget contraints of sub-national administrations, and the
resulting macro-economic fiscal instability this could generate.
While we recognize the merits of this literature, we focus on a dimension that has
received much less attention. Most studies of fiscal decentralization have overlooked its effects
on the level of human development, or have given it only secondary consideration.3 This
dimension is not only crucial for its own sake, because it measures "bottom line" welfare, but
3
also because it, in turn, affects future growth and equity.4 This article attempts to address this
neglect of human development, focusing on the effect of evolving patterns of fiscal
decentralization in Argentina on the evolution of a series of health and education performance
indicators in Argentine provinces during the period 1970-1994. In this way the study aims to
provide an empirical evaluation of the impact of fiscal decentralization on human development,
highlighting the links between such decentralization and social outcomes over time. It contributes
to the Argentine debate concerning fiscal decentralization by drawing on previously unavailable
data.
This study thus hopes to make two contributions to the decentralization literature.
Firstly, we hope our analysis illuminates the relatively neglected empirical relationship between
fiscal decentralization and human development. We do so by documenting the positive impact of
devolutionary decentralization (in the form of local taxation and a stable revenue sharing
system) on health and education indicators. Secondly, our study informs the current debate on
the effect of Argentina’s federal institutions by using previously unavailable data. These data are
disaggregated to the provincial level over a period of twenty-five years, allowing – for the first
time – an evaluation of the dynamic characteristics of fiscal decentralization across all Argentine
provinces.5 While previous studies on Argentina rely on scattered empirical evidence or suffer
from sample selection bias, our panel data set (with time-series and cross-sectional
observations) corrects for these deficiencies.6 Moreover, this study identifies the evolution of
fiscal decentralization in Argentina over time, rather than the static patterns the previous
literature was forced to highlight due to data limitations.
4
In the context of democratization and structural reforms, federalism and the extent of
fiscal decentralization and its budgetary and overall policy impact have become central issues on
Argentina’s recent political agenda. By examining the impact of different levels of fiscal
decentralization on the enhancement of human development, we hope to contribute to this
debate, shifting its focus away from purely budgetary issues.
The paper is organized into four sections. In section II, we present a brief overview of
the theoretical considerations underlying our study. Section III, advances reasons that make
Argentina an interesting case for testing these ideas, along with providing a political economy
analysis of the origins and recent development of the Argentine decentralization regime. Section
IV presents the empirical test of our central hypothesis, namely that devolutionary
decentralization has a positive impact on human development; Section V summarizes our
findings and provides some conclusions.
II. Theoretical Considerations
Decentralization has been defined in a variety of ways, according to the degree of
delegation and autonomy of local actors, and who these local actors are.7 For the purpose of
this study, we follow a three-stage definition based on the degree of discretion and responsibility
given to local authorities:8
Deconcentration: refers to the dispersion of activities previously carried out by the
central government to local bodies, while the center retains control over decision-making so that
local officials remain accountable to the central administration. As a result, local authorities are
5
able to make very few decisions without referring to the center. This type of decentralization is
often found in unitary systems of government.
Delegation: refers to the transfer of decision-making authority from the central
administration to local authorities for pre-defined activities. It usually involves the distribution of
fiscal resources to the local level accompanied by specific instructions about their allocation.
Since the central administration retains the power of reallocating resources, this form of
decentralization has some of the characteristics of a principal-agent relationship, with the central
government as the principal and the local governments as the agents. Federal governments in
recently independent countries are most likely to choose this type of decentralization.
Devolution: refers to the transfer of significant fiscal and allocative decisions to local
authorities who gain full responsibility for them, with no interference from the central
administration. This may be accomplished by granting substantial tax powers to local
governments—a rare occurrence in the developing world—or by creating relatively
unconditional revenue sharing in the form of block grants to local bodies, as in Argentina. The
issue that is most discussed in the decentralization literature, i.e., the determination of who sets
and collects which taxes, is thus captured by the concept of devolution. But by considering
automatic, conditionality-free transfers as well, devolution also encompasses “softer” forms of
decentralization such as the Argentine revenue sharing regime.9 This type of decentralization is
qualitatively different from the previous two because local authorities gain complete control over
resource allocation and are generally accountable to local constituencies, which should increase
decision-making responsiveness to local needs.
6
In this paper we concentrate our analysis on the comparative characteristics of
devolution and delegation in the Argentine context, assessing the effect of different fiscal “mixes”
of revenue sharing on the generation of health and education outcomes. Therefore, our
exogenous variables are all on the revenue side. We are interested in testing the proposition that
devolutionary decentralization produces an increase in the accountability and responsibility of
policymaking and a consequent positive influence on the “efficiency” of public policy in the
generation of human development. We expect this effect of devolution to be especially strong in
health and education because of their direct impact on the overall level of human development of
the population.
There are many ex ante reasons for expecting devolution to have positive effects on
policy making. More so than other forms of decentralization, devolution enhances the ability of
public administrators to take into account local preferences and information, minimizing costs,
and increasing efficiency (by internalizing and reducing transactions costs).10 It may also improve
equity within the region as a result of the enhanced visibility and accountability to the local
population. Expenditure decisions at the local level are likely to be tied more closely to real
resource costs and, if local governments have significant fiscal powers, we can expect total
revenues to be enhanced according to the benefit principle of taxation.11 Furthermore, when
there are many local authorities providing similar services, we might expect a higher level of
experimentation and innovation in the provision of local public goods, potentially leading to
improvements in overall productivity, employment and economic growth.
Decentralization, even in its devolutionary form, is not a panacea, however. Although
some forms of decentralization may improve equity within regions, they may worsen it across
7
regions. Cross-regional equity can only be addressed by a central government with
redistributive powers. Indeed, decentralization without some type of central government
redistributive formula would be likely to exacerbate existing regional inequalities, a point
nineteenth century Argentina makes painfully clear (Sawers 1996). From an efficiency point of
view, moreover, decentralization risks limiting gains obtained from economies of scale in
technology and information, while the lack of local expertise could offset some of the potential
efficiency gains; excessive trial-and-error experimentation and duplication might, of course, also
result. Equally important, while there may be greater transparency at the local level, we cannot
be certain that corruption is not likely to also be greater, given the frequently substantial power
of local elites.12
The importance of these problems may change over time. One expects, for example,
that, as a result of trial and error experimentation, democratic accountability would improve
efficiency while limiting corruption at the local level. The full impact of devolution on human
development is not likely to occur instantaneously. A single period cross-sectional analysis
therefore cannot capture the true impact of decentralization on human development, since it fails
to endogenize much of the impact that happens only over time.13 Therefore, by examining the
impact of different levels of “devolutionary” decentralization on health and education indicators
in Argentina, over the period 1970-1994 we hope to get better estimates of the underlying
economic model. Although the model we estimate is a static one, the fact that we have
observations over twenty five years allows us to arrive at a better estimate of the true impact of
devolution in Argentina.
8
III. The Argentine Decentralization Debate
Argentina represents a good case for evaluating the effects of fiscal decentralization on
human development. It encompasses nearly three million square kilometers of territory and has a
population of over thirty-two million fairly homogeneous and largely urban people.14 As a
federal state, it is composed of 23 provinces and an autonomous federal district. Argentine
provinces are entitled to central government revenue derived from a revenue-sharing regime and
are also the main locus of spending decisions, making them the appropriate units of analysis
when evaluating the impact of fiscal decentralization.15 Approximately 50 percent of Argentina’s
public spending is at the sub-national level, making it the most decentralized country in Latin
America today in terms of public spending (IADB 1997).
Argentina also qualifies as an upper middle-income country, with its per capita GDP of
8,937 PPP$ in 1994 (UNDP 1997:146). Moreover, the UNDP Human Development Reports
consistently classify it as one of the top 40 countries in terms of human development.16 In fact,
Argentina’s consolidated social spending as a percentage of GDP has reached levels
comparable to those of Western Europe (Flood 1994). Consequently, most current discussion
focuses on enhancing efficiency rather than enlarging the size of existing social programs, and in
this context, the degree and type of decentralization have become central issues.
Argentina's provinces differ substantially in their economic performance. Argentina’s
major industrial and urban areas are highly concentrated in the center of the country, mainly in
the provinces of Buenos Aires, Cordoba and Santa Fe, which have long enjoyed relatively high
9
levels of socio-economic development.17 In contrast, peripheral provinces, such as La Rioja,
Catamarca or Jujuy, in the Northwestern region, have remained at levels of development only
marginally different from those of the poorest countries of Latin America (Sawers 1996). As a
result, the provinces also differ in their capacity to finance provincial spending with local
revenues and federal co-participation funds, and the federal government has often resorted to
additional transfers to cover residual fiscal gaps. Moreover, policy outcomes, as captured by
available human development indicators, are highly differentiated from province to province, as
well as within provinces. These differences make Argentina a good place to explore how
decentralization affects human development.
The origin of differences between regions in levels of socio-economic development
resides in the history of this federal country. Two factors had a particularly strong influence.
First, there is a legacy of forty years of internal struggles among de facto autonomous provinces
which followed independence from Spain in 1816, until the acceptance of a national constitution
by all provinces in 1860. Second, there were significant differences in resource endowments as
well as differential access to the port of Buenos Aires (and thus international markets) between
provinces in the center and the periphery. Many analysts (see in particular Rofman and Romero
1997), looking mainly at economic data, argue that these regional differences have, in fact,
increased over time, almost irrespective of the political regime at the center. However, our data
on the evolution of social indicators show a tendency toward convergence rather than the
usually proclaimed “growing regional disparity”.18 Thus, while we do not deny the existence of
inter-provincial disparities, convergence casts doubt on the assumption that Argentine federalism
is only a “constitutional fiction.”
10
There have, moreover, been significant variations in the decentralization strategy
pursued over time and across regimes, which is especially important for our purposes. If the
arguments we present are correct, as different schemes of decentralization have moved back
and forth from a more “delegative” to a more “devolutionary” emphasis, human development
indicators should also have moved with them, a point our data set will allow us to test.
The Evolution of Argentine Revenue-Sharing Regimes
Revenue-sharing in Argentina began in the 1930s. The 1853 constitution granted the
collection of all direct taxes to provincial governments and provided for the federal government
to subsidize provinces in financial need via National Treasury Contributions (ATNs).19 An
incipient revenue-sharing regime emerged during the Great Depression when Congress
centralized tax collection. Although this regime retained the provincial right to revenue, it lacked
cohesion and a redistributive component (Macon 1963).20 Provinces did not perceive revenue-
sharing arrangements as a transfer of resources from the center, but as a return of these funds to
the entities that were entitled to them but unable to levy them effectively.
Despite the centralization of tax collection, for the most part the provinces did not lose
resources in absolute terms, although their relative share became smaller in the 1930s and
1940s, as shown in Graph 1. By the 1950s the provincial share of revenue was growing in both
absolute and relative terms. However, in 1967, a military government decreed a reduction in the
provincial share, thus opening the door to the widespread use of discretionary transfers, in
particular ATNs, by subsequent authoritarian governments (Cetrangolo and Jimenez
1995:17).21
11
A 1973 reform introduced criteria for the revenue sharing regime for the first time. 22
However, discretionary transfers continued to play an important role, in particular during the
subsequent military rule. In addition, although military rulers had transferred the provision of
primary education to the provinces without granting them tax powers, they reduced provincial
co-participation funds by funneling them to the national social security system in 1980 (Graph
2).23
With the return of democracy in 1984, provincial governments asked not just for a
return to the revenue-sharing formula existing before its de facto reform in 1980, but also
demanded compensation for the transfer of responsibility to them for social services. Since the
governing party did not control the Senate and could not reach an agreement on revenue
sharing, during the 1984-87 period the provincial shares of centrally collected taxes were
channeled as ATNs (Schwartz and Liuksila 1997). Part of this distribution was regularized by
the “Transitory Agreement for the Distribution of Federal Resources to the Provinces” in March
1986, thus making the provincial share more predictable, via a combination of the 1980
distribution with compensation for the decentralization of social services (SAREP, 1996). Yet,
provincial administrations continued to receive federal “compensations,” negotiated on a case-
by-case basis, given a disorganized federal government (Carciofi 1990).
Amidst severe fiscal imbalances, a new revenue-sharing agreement between the federal
and provincial administrations was finally reached in 1988, basically validating the 'transitory'
share obtained by each province in the 1985-87 period by fixing a coefficient that has remained
unexplained, legally or analytically (Porto 1990, Saiegh and Tommassi 1998).24 As such, the
new legislation represented a “victory” for the provinces, which is explained by the fact that the
12
opposition party controlled both Congress and the majority of provincial governors (Sanguinetti
1994, Eaton 1998). Yet, this 'resolution' of the chaotic situation of the 1984-1987 period came
too late to solve the mounting fiscal crisis that characterized the end of the Alfonsín
administration and contributed to hyperinflation by further weakening an already weak federal
administration’s grip on most basic macroeconomic variables.
The second democratic administration, elected in 1989, by contrast, enjoyed a unified
government and controlled most provincial administrations. As a result, between 1992 and
1994 the federal government managed to reduce the overall provincial share of co-participation
payments, by fifteen percent —with the agreement of all provinces except Córdoba, which
decided, appealing to its constitutional right, to retain the existing terms. The fifteen percent
reduction was used to finance the social security deficit (Porto 1997).25 Nevertheless, as shown
in Graph 3, there was an actual increase in the share of resources controlled by provincial
governments, both from co-participation and local tax sources.26 This odd outcome owes much
to an economic boom that benefited both the provinces and the federal tax collection agency, as
well as to a notable improvement in federal and provincial access to credit markets (Eaton
1998, Dillinger and Webb 1999). Discretionary compensations from the executive, the transfer
to provincial control of important earmarked funds, as well as a guaranteed minimum revenue
for each province, facilitated the acceptance by provincial governors of the fifteen percent
reduction (Eaton 1998:8-9). In particular, the guaranteed revenue increased fiscal predictability
and facilitated provincial borrowing. In sum, for all its problems, the decentralization of services,
accompanied by a reduction of the provincial co-participation share, was made up by the
absolute growth of fiscal revenues collected by national and provincial governments.27
13
What these data tell us is that the Argentine decentralization regime today is more
devolutionary in nature than it has ever been since at least 1935. Against claims suggesting
that Argentine federalism has grown more centralized, democratic administrations, in general,
and those of the 1983-1994 period, in particular, actually increased the provincial share of
resources, while also increasing the accountability of elected rather than appointed officials.
Admittedly, co-participation still presents some problems, the “common pool” effect it generates
being just one of them (Sanguinetti 1994; Jones, Sanguinetti, and Tommasi 1997). We also
admit that in many cases provincial taxation uses inefficient mechanisms that may in part deter
private investment (FIEL 1998). Furthermore, we agree with most political analysts that, while
reduced in size, the federal government still commands too many discretionary resources, further
compounding the lack of clarity surrounding the current decentralization regime (Faletti and
Lozano 1996). Argentina’s decentralization regime still implies some short-term macro-
economic inefficiency associated with a soft budget constraint (Saiegh and Tommasi 1998), plus
political inefficiencies impeding needed structural transformations (Calvo and Gibson 1997).
One additional argument that has been advanced against the type of decentralization
adopted in Argentina is the "fiscal illusion" hypothesis. It is argued that the combination of the
decentralization of expenditures to the provincial level and the centralization of tax collection at
the federal level implicit in the revenue-sharing system means that local governments have an
unclear perception of hard budget constraints, which leads them to overspending and
inefficiency.28 While economies of scale and access to new fiscal technologies favor the
centralized collection of revenue, this process nevertheless provides the “wrong” spending
incentives for local administrators. Analyzing the 1985-1995 period, for instance, Saiegh and
14
Tommassi (1998:14) show that an average of only 35 percent of provincial expenditures was
financed by local taxes, and that ten provinces in fact financed less than 15 percent of what they
spent. This local free-riding by individual provinces undoubtedly helps to explain national fiscal
disasters such as the ones experienced in 1974-1976 (Schenone 1989) and 1987-1989
(Sanguinetti 1994).
We recognize the problems created by this ‘fiscal illusion.’ However, we consider that it
is necessary to differentiate revenue sharing—to which provinces are entitled by law—and the
more discretionary ATNs and other conditional transfers—that are controlled by the National
Executive. ATNs are transfers from the central government to the provinces to cover provincial
fiscal emergencies and often come with fairly stringent policy or political strings attached.
Conditional transfers are earmarked resources coming from the national administration and are
centrally defined and controlled (Isuani 1989). Provincial governments have no control over
these resources and cannot count on them in their budgetary and administrative planning.
Especially problematic is the fact that ATNs are often used to bail out troubled administrations,
although provincial administrators do not know their actual magnitude and even their policy
strings ex ante. ATNs, thus, are the main culprits in creating the oft-denounced “fiscal illusion”
that leads provincial administrations to over-spend and borrow or get bailed out (Saiegh and
Tommassi 1998).29
Co-participation or revenue sharing funds are quite different and should not be lumped
together, as they generally are, with ATN’s or other conditional transfers.30 The revenue-sharing
proceeds generated by the Argentine co-participation system are unconditional block grants
pre-defined according to a formula, and automatically distributed via a purely administrative
15
process that precedes even the formulation of the national budget (Porto 1990). Like royalties
paid by national enterprises for provincial resources utilized in their activities (themselves extra-
budgetary), co-participation funds are thus predictable sources of revenue derived from legal
arrangements that cannot be modified without provincial agreement, although most revenue
collection is centralized in the national administration. Therefore, in a constitution consistent
setting, these funds are independent of central government discretion, as their allocation is
decided strictly by the provincial legislature. Provincial administrators can count on these
resources for their budgetary planning, and, although there may be some marginal uncertainty
about their actual size, their rough magnitude can be predicted. Unless they are totally unaware
of how much the central government collects in co-participated taxes, or how many natural
resources it extracts from their territory, local administrators do not suffer from “fiscal illusion”
when they incorporate in their budget planning expected revenues that belong to them by federal
right.
Following this logic, we argue that co-participation and royalty funds resemble more our
definition of "devolution" rather than that of "delegation," although admittedly less so than local
resources based on local taxation. However, this differentiation between "devolution" and
"delegation" becomes blurred when the constitutional letter of the law is not followed. Such
occurrence, while not absent in recent history, is exogenous to the existing de jure
decentralization scheme, and should not be confused with it. In fact, the appearance of such
authoritarian practices not only helped shift the Argentine co-participation regime back from a
devolutionary to a more delegative regime, but also, by preventing competitive politics at the
national and local levels, helped derail the accountability mechanisms that make decentralization
16
an efficiency enhancing policy device. As we show below, it also negatively affected the
progress of human development.
IV. Empirical Analysis
In this section, we investigate empirically the evolution of provincial health and education
indicators and their association with changes in the level and type of decentralization regimes.
We use a panel data set consisting of socio-economic and fiscal indicators for the 23 provinces
of Argentina over a 25-year period (1970-94) and employ a fixed effects model. The sources
of data used for this project are discussed in Appendix A. As in any study of this nature,
measurement biases and the unavailability of certain crucial data potentially bias the results, and
our conclusions should therefore be taken with caution.
Building on our previous analysis, we hypothesized that shifts to more devolutionary
configurations would be accompanied by improvements in human development indicators as
local authorities responded more to the needs and demands of the local population. To
investigate this we selected two indicators of devolution, to use as our independent variables -
the ratio of revenue derived from co-participation, royalties and provincial taxes to total
resources (LOCALRAT) and the ratio of locally generated resources to locally controlled
resources (OWNLOCAL). These indicators reflect the circumstances of Argentinean
decentralization. Detailed justification for the choice of these indicators, which differ slightly from
those used in previous exercises (e.g., FIEL 1993, Porto and Sanguinetti 1993, and Ranis and
Stewart 1994)31, is put forward in the next section of the paper. As for the dependent variables,
we are constrained by data limitations to the consideration of just two human development
17
indicators. For education, we use the ratio of students enrolled in secondary school per one
thousand primary students (EDUC). Although raw enrollment data in primary and secondary
schools present problems, especially because they show repeating a grade as an increase in
enrollment, we expect EDUC to be a rough indicator of educational output. Other things being
equal, higher EDUC will show an educational system more capable of retaining students and
therefore more likely to provide higher levels of human development.32 During our sample
period, primary education was free and compulsory, with enrollments very close to one hundred
percent and so that variations in the ratio of secondary to primary enrolments gives a good
indication of variations in educational output, particularly in the context of rising population33.
This reduces the bias from demographic factors for our estimates. For the other dependent
variable, we use the infant mortality rate (IMR), defined as the number of deaths of children
under one year for every one thousand births, as an indicator of health conditions.
IV-a) Measures of Decentralization and Other Exogenous Variables
True devolution implies expenditure side decentralization accompanied by revenue side
decentralization, i.e. the federal government passes on new responsibilities to the provinces,
along with the fiscal means to achieve these ends. For example, the federal government may
transfer the responsibility for primary education to the provinces, and also allow it to collect and
keep certain taxes which were previously collected and expended by the federal government.
Alternatively, there may be limited devolution, with expenditure decentralization but no revenue
18
decentralization. In this case, the federal government transfers the responsibility for primary
education without any new tax revenue going to the provinces - neither is the fiscal jurisdiction
(tax base) of the provinces increased, which would allow them to impose new taxes, nor are
they given a larger share of co-participated taxes (shared revenue from certain taxes collected
by the federal government). Instead, the federal government uses transfers which are highly
unpredictable to fill the budget deficit of the provinces.
There is some evidence to suggest that the use of such transfers is what happened in
Argentina most of the time under scrutiny. With the provinces not allowed to raise their own
resources to meet the new goals, the efficiency gains from devolution are clearly reduced. Since
the provinces seek to meet their additional expenditure responsibilities but do not have the funds
to do so, increased expenditures on health and education must be accompanied by borrowing
or ATN transfer or spending cuts elsewhere, for example in public housing and infrastructure.
Increasing revenue decentralization in such a situation would allow the provinces to raise
additional resources, undertake additional human development oriented activities, and internalize
the gains from decentralization. Partial devolution, i.e. expenditure decentralization, may
generate additional gains from further revenue decentralization.
The most widely used and intuitively appealing measure of decentralization is the ratio of
provincial expenditures to federal expenditures, in a given province at a particular time. It would,
of course, be preferable to have the breakdown of such expenditures by sector, across
provinces and time. Unfortunately, we do not have data on the federal government’s
expenditure disaggregated by sector and province.34 This makes it impossible for us to measure
19
expenditure decentralization. However, we may still observe the gains from revenue
decentralization.
We therefore construct our measures of decentralization from the revenue side. The
provinces have no say in the allocation of transfers. Therefore, they only have some control over
the three categories of revenue mentioned above which we have pooled as controlled
resources. Since there are explicit revenue sharing agreements for co-participated taxes
periodically agreed upon, the provinces have some idea how much money to expect on this
account. Similarly, royalties are to a certain extent in the provinces’ own control; they observe
and monitor the extraction of natural resources in their territory and can therefore easily estimate
how much revenue in the form of royalties they should, at least de jure, receive. And as with
co-participation funds, provincial administrators are free to determine how to spend these
royalties. However, the greatest degree of control and accountability is over provincial taxes
since they raise them directly. Therefore, we will measure decentralization primarily in terms of
two ratios:
1. Controlled resources / Total resources
2. Provincial taxes / Controlled resources
We call these variables LOCALRAT and OWNLOCAL, respectively. The higher
these ratios are, the higher the degree of fiscal autonomy for the provinces and therefore the
higher is the level of fiscal decentralization and, according to our hypothesis, the higher should
be the level of human development
20
There are other variables, besides the extent of decentralisation, that are likely to affect
levels of human development and therefore need to be included in the empirical investigation.
These include the level of per capita income in the province; the total level of expenditure by the
provinces, whether locally controlled or raised or not, and the total num,ber of public
employees, which provides a measure of total public expenditure. All these would be expected
to be positively related to levels of human development.
The set of exogenous variables we will therefore use is as follows:
1. PGBCAP - Provincial per capita GDP
2. EXPCAP - Total per capita expenditure of the province
3. PUBEPOP - Number of public employees per every thousand of population
4. OWNLOCAL - Provincial taxes over controlled resources
5. LOCALRAT - Controlled resources over total resources
6. ROYRAT - Royalties over controlled resources
7. CONDRAT - Conditional transfers over uncontrolled resources (i.e. ATN and
Conditional transfers)
Thus, by definition:
Controlled Resources + Non-controlled Resources = Total Resources -------- (1)
Provincial Taxes + Co-participated Taxes + Royalties = Controlled Resources ---------(2) and
Conditional Transfers + Discretionary Transfers (ATN) = Uncontrolled Resources --(3)
21
Dividing equation (1) by Total Resources, equation (2) by Controlled Resources, and equation
(3) by Uncontrolled Resources yields:
LOCALRAT + (Non-Controlled Resources / Total Resources) = 1 -----------(4)
OWNLOCAL + (Co-participated Taxes / Controlled Resources) + ROYRAT = 1 ----- (5)
CONDRAT + (ATN / Uncontrolled Resources) = 1 ----------- (6)
For reasons of multicollinearity, we do not use the three ratios in parentheses above;
they are, moreover, unnecessary, since the identities above imply that the variables 4-7 are
sufficient to summarize any changes in the revenue side fiscal structure.35 We may use an
example to clarify this point. If property tax were initially collected and kept by the provinces
but is now transferred to the federal government, which collects and keeps it and does not share
the receipts with the provinces, the resulting shortfall in the provincial budget is partly met by
discretionary federal transfers (ATNs) and partly by some expenditure cutbacks by the
provinces. This is an instance of centralization and our measures of decentralization capture it.
The share of controlled resources out of total resources falls and the share of non-controlled
resources (transfers) increases. This implies that the variable LOCALRAT falls. Similarly the
share of own taxes out of controlled resources falls, and this is captured by a fall in
OWNLOCAL.
Argentina has gone through some tumultuous times during the sample period (1970-
1994), with periods of hyperinflation and negative income growth, for example, during the debt
crisis of the 1980s. In such situations it is extremely difficult to construct price deflators. Our
22
measures avoid this issue, since we use ratios of revenue variables; the deflator enters as a
multiplicative term in both the numerator and the denominator and therefore cancels out. Also, it
is widely believed that in developing countries, expenditure figures are generally extremely
unreliable for a variety of reasons, such as corruption etc. Revenue variables are more reliable;
by using revenue variables for our regressors, we can reduce, if not eliminate, this bias.
IV-b) Econometric Specification
Model: The model that we estimate is a simple linear model as follows:
ititit uxy ++= βα ; for i = 1,2,……,N and t = 1,2, …..,T -----------(7)
Where, α is a scalar and β is a K X 1 vector of coefficients to be estimated. Provinces are
indexed by i and time periods by t; we have data on all twenty-three provinces of Argentina
over the period 1970-1994, a period of twenty-five years. Therefore, for our sample N=23 and
T=25. Note that we assume that the coefficients are fixed and constant, here yit is IMR or
EDUC for province i in period t. Similarly, x it is a vector of exogenous variables for province i
in period t. Specifically:
},,
,,,,,{
ititit
itititititit
AUTOCCONDRATROYRAT
LOCALRATOWNLOCALEXPCAPPUBEPOPPGBCAPx =
(For definitions, see above). AUTOC is a dummy for time periods when Argentina had an
autocratic government. For this model the ordinary least squares estimates will be consistent and
efficient if 0)'( =itit uxE . To take into consideration the possibility of heteroskedasticity and
autocorrelation, we also report the Generalized Least Squares estimates with a heteroskedastic
23
error structure correlated across panels. Also autocorrelation is allowed for, with panel specific
AR(1) coefficients estimated in the GLS estimates. However, given the diversity among
provinces in every sense of the word (as discussed in the next section), a more realistic setup is
one with fixed effects. Specifically, we postulate that;
itiitu νµ += ------(8); for i = 1,…..,N and t = 1,2,….,T
Where iµ is the province specific unobserved fixed effect. Some provinces are naturally more
efficient, and have better access to administrative and technical knowledge etc. 36
We first estimate equation (7) above, using OLS with robust standard errors, GLS with
heteroskedastic and autocorrelated errors and, also the fixed-effects estimator. Note that the
variation in decentralization and human development across provinces and over time is what
identifies the model.
IV-c) Preliminary Data Analysis
Appendix B reports additional information concerning the data. Tables B1 and B2 allow
us to compare the decentralization trends and patterns of human development across low,
medium, and high income provinces. 37 Several important conclusions with respect to regional
disparities and time trends can be drawn from these tables. We observe that both the share of
local resources in total government expenditures (LOCALRAT), and the percent of total
resources that is raised locally (OWNLOCAL), are larger in high income provinces. However,
24
this gap diminishes over time. During the (1970-94) period, the gaps for LOCALRAT and
OWNLOCAL have declined by 36 percent and 43 percent, respectively.
The per capita education and health expenditures, on the other hand, seem to be
negatively correlated with provincial per capita income. Since households in high income
provinces rely more on the private sector for education and health services, the per capita fiscal
expenditure on education and health in high income provinces appear to be less than in low
income ones. The lower income provinces receive larger amounts of per capita federal
assistance, intended to reduce regional disparities in human development. The inter-provincial
disparities in educational achievement and IMR have also declined significantly, as shown in
Table B1.
Figures B2-B5 in appendix B plot the distribution of these variables across provinces
for all years in the sample. This helps us determine, among other things, if there is convergence
over time across provinces. We also plot a cubic spline38 of the mean value of the variable
across provinces, for each year in the sample. This helps us examine if there is a time trend
across provinces.
Several facts need to be mentioned here: first, the infant mortality rate falls dramatically
over the years, from an average of 72 infant deaths for every thousand population in 1970 to
22.5 in 1994, which implies a 70% decline in the course of twenty-five years. Also striking is
the convergence across provinces in IMR, as can be seen from the fact that the standard
deviation declines from 22 in 1970 to 5 in 1994. Health services were improving in Argentina
and improving faster for the less developed provinces, allowing them to catch up. Figure B4 in
appendix B illustrates this phenomenon.
25
Second, we find that secondary enrollment per thousand primary students, EDUC,
steadily increases over the sample period. Overall, it increases by more than one hundred
percent in twenty-five years. However, there is no convergence across provinces, as can be
seen from the standard deviations (table B1) or from figure B5. Figure B5 illustrates the upward
trend in EDUC over the years and, the consistent dispersion in EDUC across provinces, over
the years. The latter shows up, as the width of the band around the mean value which does not
shrink over time.
Third, from table B1 and figures B2 and B3 for our decentralization variables, we find
that OWNLOCAL, our measure of the share of provincial taxes in the provincial budget, was
steady throughout the early and mid-seventies, increased from 1978 until 1984, declined and
then started increasing again in the early nineties. Also, we note the wide variation in
OWNLOCAL across provinces and see no sign of convergence over the sample period. We
find that LOCALRAT has taken a cyclical path over time, i.e. it declined between 1970 and
1975, increased until 1980, and declined again until 1984. From 1985 until 1988 it rose again
and then emerged mostly steady until 1994. Also, the peaks got higher over time, implying a
positive time trend. Throughout the early nineties we find that the role of transfers declined to
less than 20% of the provincial budget, i.e. LOCALRAT had increased to 80% or more, and
also that there is less variation across provinces. This roughly corresponds to different revenue
sharing schemes undertaken by the federal government over the years. Based on this, we claim
that there is considerable variation across provinces and over time in the exogenous
decentralization variables to identify our model.
26
Finally, figures B6 through B9 in appendix B plot our dependent variables, IMR and
EDUC, against our primary exogenous variables measuring decentralization, i.e. OWNLOCAL
and LOCALRAT. Figures are scatter plots, with cubic splines fitted to the entire data. We find
that there is weak evidence that IMR declines with OWNLOCAL (figure B6), and
LOCALRAT (figure B7); the relationship seems approximately linear. For our second human
development indicator, EDUC, we find a clear positive relationship with OWNLOCAL (figure
B8). The decline in EDUC at high levels of OWNLOCAL may or may not imply diminishing
returns, since a few outliers in the data largely cause this. There is a similar positive relationship
with LOCALRAT (figure B9), indicating a decline in EDUC when LOCALRAT increases, at
low levels of LOCALRAT.
It should be noted that the non-parametric plots discussed above implicitly assume a
static model. For example, a negative relationship between IMR and OWNLOCAL can arise if
the former declines and the latter increases over time. We will take this into consideration in the
next section.
IV-d) Econometric Results
Model I: Table 1 reports the results for our first human development indicator, infant mortality
rate, IMR. We find that OWNLOCAL is always significant and negative, i.e. allowing
provinces to raise more of their own resources helps to reduce infant mortality. Similarly, for our
other decentralization variable, LOCALRAT we find it is always negative and significant.
Together, these estimates imply that decentralization is associated with better health services.
27
Moreover, infant mortality rates are shown to be higher during periods of autocracy, i.e. military
governments, with the coefficient on AUTOC always significant and positive. Bigger
government is better, in the sense that infant mortality is lower, as can be seen by the negative
and significant coefficient on the number of public employees for every thousand population.
Does that mean a larger public sector corresponds to more doctors, nurses etc.? We cannot
provide a satisfactory explanation for the large coefficients on the number of public employees.
We also find that the coefficient for per capita income is negative when significant, i.e. richer
provinces have lower IMR on average. Surprisingly, however the coefficient for total provincial
expenditure related to IMR are never significant. It should be noted that the OLS regression
results are highly significant, with the exogenous variables explaining fifty-five percent of the
variation in IMR.
Table 2 summarizes the results for EDUC, our second human development indicator.
OWNLOCAL is always positive, and significant. Similarly, our second variable for
decentralization LOCALRAT is always positive and significant. We can therefore conclude that
decentralization is good for education as well. Allowing provinces to raise more of their own
resources is conducive to improving the educational output, as measured by our indicator
EDUC.
Again EDUC is lower under autocracy and increases with the number of public
employees, perhaps because teachers are counted as public employees. EDUC is higher for
provinces with higher per capita income on average; the coefficients are positive and significant
at the 10% level, except for the fixed effects estimates. Total expenditures improve educational
output, the coefficients are always positive, but significant only for the GLS estimates. The
28
regressions are highly significant (F-values), with the exogenous variables in the OLS estimates
accounting for sixty five percent of the variation in EDUC.
In the models estimated above, we assumed implicitly that only the current values of the
exogenous variables affected human development in that period. In reality, one could expect the
provision of public goods to have a lagged impact on human development. Therefore, the
impact of decentralization on human development is likely to be spread out over several years.
We therefore experimented with several alternative specifications to take this explicitly into
account. We found that lags of more than one period were seldom significant, and that the
results were not significantly different from those reported above.
V. Summary and Conclusions
In this article we have made two contributions to the study of decentralization. First, we
examined the origins and evolution of revenue-sharing arrangements in Argentina, involving the
devolution of resources to provinces that were constitutionally entitled to them, but had
relinquished their collection. Our study found that, while the provincial share of funds was
curtailed by military rulers who also made increasing use of discretionary resources (ATN), with
the return to democratic rule this trend was reversed and the share of provincial governments
reached an all-time high in 1991. Moreover, the effect of democratic accountability for progress
in human development was shown by the significantly negative effect of the dummy for
autocracy with respect to both measures. Overall, during this entire period (1970-94) several
long term trends, including fiscal decentralization and ultimate democratization which
29
empowered provincial administrations in a federal system, have led to a significant reduction in
regional disparities and a sizeable increase in the levels of human development across all regions.
Second, we provided an empirical evaluation of the impact of decentralization on the
generation of human development using previously unavailable data for the Argentine case. Our
empirical analysis relied on a large panel data set to evaluate the possible relationships between
decentralization and human development at the provincial level. Comparing decentralization
patterns across low and high income provinces, we observed that both the ratio of locally
controlled resources to total resources and the percent of controlled resources that is raised
locally are larger in high income provinces. The gap, however, has diminished over time as
locally controlled resources have grown faster in the less developed provinces. We also
observed that the disparity in educational output and in the infant mortality rate between low and
high income provinces has declined significantly over the 1970-94 period. This is partly due to
the faster rise of per capita health and education expenditures in the low income provinces.
In order to gain additional insight into the interactions between decentralization and
human development, we regressed two indicators of human development (infant mortality rate
and the retention from primary to secondary education) on two decentralization indicators
(OWNLOCAL and LOCALRAT) as well as several other control variables. Our estimates
show that infant mortality has a significant and negative association with the percent of revenue
that is raised locally (OWNLOCAL) and with the degree of local control over provincial fiscal
resources (LOCALRAT). Our regression results for educational output also show that both
indicators of decentralization were positively and significantly associated with the dependent
variable.
30
We agree that fiscal and political considerations led to an imperfect implementation of
fiscal decentralization in Argentina. However, our empirical findings indicate the positive effects
of decentralization on human development and the importance of democratic accountability for
the success of decentralization. Insofar as we have observed an evolution toward devolutionary
forms of decentralization, these disadvantages should be analyzed in a dynamic setting and
weighed against other beneficial short and long term effects of Argentina’s decentralization
regime. Our data show that the Argentine fiscal decentralization regime, dominated increasingly
by devolutionary components, has been associated with continued improvements in human
development at the provincial level. This fact cannot be easily dismissed. Insofar as the goal of
public administration is to increase social welfare, the efficiency of a given government strategy
should take into account its fiscal feasibility and simplicity. Yet, it should also take into account
the policy outcomes such a strategy is likely to generate. In particular, knowledge of the effects
that different decentralization schemes have had on the level oGf human development should be
of central concern in evaluating the new Argentine co-participation regime currently under
negotiation. As expected, our positive findings of the effects of decentralization on human
development tend to be stronger for ‘OWNLOCAL’ than for ‘LOCALRAT’.
We have attempted to present a broader view of provincial financing that includes
revenue from ‘co-participation’ and royalties as part of locally generated resources, even if they
are collected at the national level due to presumed economies of scale and greater fiscal
capacity. The provinces clearly have a right to these resources, in addition to the revenues
generated by provincial taxes, implying a certain amount of stability which facilitates budgetary
planning. For that reason, we may consider them as devolutionary. However, we also found
31
that tax revenues collected at the provincial level tend to have a stronger effect on accountability
and, thus, on the performance of our human development indicators. These findings are
particularly important at a time when the provincial delegation of health and education
expenditures to the provinces is moving faster than that of revenue collection which may have a
negative effect on provincial performance. In this, as in other dimensions, the above should be
viewed as work in progress, pointing researcher and policy maker in new directions of analysis
and action.
32
REFERENCES:
Agrawal, Arun and Jessy Ribot. “Making Decentralization Accountable: A Framework forAnalysis and Empirical Studies from South Asia and West Africa,” unpublished manuscript,Yale University and World Resources Institute, 1999.
Agrawal, Arun with Carla Britt and Keshav Kanel. Decentralization in Nepal. A comparativeanalysis. Institute for Contemporary Studies, Oakland, 1999.
Bennett, Robert ed. Decentralization, Local Governments, and Markets, Clarendon Press,Oxford, 1990.
Bertranou, Fabio. Descentralizacin Fiscal en Argentina desde una Perspectiva Local: El Casode la Provincia de Mendoza. Santiago de Chile: CEPAL/GTZ, Serie Political Fiscal 46, 1993.
Birdsall, Nancy, D. Ross and R. Sabot. “Inequality and Growth Reconsidered: Lessons fromEast Asia," World Bank Economic Review, 9, 1994.
Birdsall, Nancy and R. Sabot. “Virtuous Circles: Human Capital Growth and Equity in EastAsia.”
Cavallo, Domingo and Juan Zapata. El Desafio Federal. Buenos Aires, Sudamericana/Planeta,1986
Carciofi, Ricardo. 1990. La desarticulacion del pacto fiscal: una interpretación del sectorpúblico argentino en las últimas décadas”, documento de trabajo No 36, CEPAL, UN.
Cetrangolo, O., J.P. Jimenez, and L. Delfino. Antecedentes Normativos del Regimen deCoparticipacion Federal de Impuestos. CECE Document No. 1. April 1995.
Cetrangolo, Oscar. and Juan P. Jimenez. El Conflicto en Torno a las Relaciones FinancierasEntre La Nacion y Las Provincias: Primera Parte, Antecedentes de la Ley 23548. CECEDocument No. 9, September 1995.
Davoodi, Hamid and Heng-fu Zou, "Fiscal Decentralization and Economic Growth: A Cross-Country Study," Journal of Urban Economics, 43(2), March 1998.
De La Cruz, Rafael ed. Ruta a la eficiencia : descentralización de los servicios sociales.Ediciones IESA, Caracas, 1995.
Dillinger, William and Steven B. Webb. Fiscal Management in Federal Democracies: Argentinaand Brazil. The World Bank, June, 1999.
33
Eaton, K. Party, Province and Coparticipacion: Tax Reform in Argentina. Paper delivered atAnnnual Meeting of APSA, August 29-September 1, 1996._______. Political Obstacles to Decentralization in Argentina and the Phillipines. Paperpresented at the 1998 conference of the Latin American Studies Association, Chicago,September 26-28, 1998.
Peter Evans, “The Eclipse of the State? Reflections on Stateness in an Era of Globalization”World Politics, 1997.
Feletti, R. and C. Lozano. Las Crisis Provinciales. INDEP Working Paper No. 21. September1992.
FIEL (Fundacion de Investigaciones Economicas Latinoamericanas). Hacia Una NuevaOrganizacion del Federalismo Fiscal en la Argentina. Buenos Aires: FIEL, 1993.
Fox, Jonathan and Josefina Aranda. Decentralization and Rural Development in Mexico:Community Participation in Oaxaca’s Municipal Funds Program. Center for US-MexicanStudies, University of California, San Diego, 1996.
Gibson. E, Calvo. E, Falleti, T. Reallocative Federalism: Overrepresentation and PublicSpending in the Western Hemisphere. Paper prepared for the XXI International Congress ofthe Latin American Studies Association, Chicago, September 24-26, 1998.
Gibson, Edward L. and Ernesto Calvo, "Federalism and Low Maintenance Constituencies:Territorial Dimensions of Economic Reform in Argentina," Studies in Comparative InternationalDevelopment, forthcoming
Gouveia, Miguel and Neal A. Masia, "Does the Median Voter Model Explain the Size ofGovernment?: Evidence from the States," Public Choice, 97(1-2), October 98.
Hedges, J. Centre-Provincial Relations in Argentina, 1976-1991. EURAL Buenos AiresWorking Paper No. 60, 1993.
Inter-American Development Bank. Economic and Social Progress in Latin America. 1996Report. Johns Hopkins University Press, 1996.____________________________. Facing Up Inequality. Economic and Social Progress inLatin America. 1997 Report, Johns Hopkins University Press, 1997.
Isuani, Aldo, ed. Estado Democratico y Politica Social. Buenos Aires: EUDEBA, 1989
Klugman, J. "Decentralization: a survey of the literature from a human developmentperspective," Human Development Report Office Occasional Paper #12.
34
Jones, Mark, Pablo Sanguinetti and Mariano Tommasi. "Politics, Institutions and FiscalPerformance in a Federal System: An Analsys of the Argentine Provinces," mimeo, Universidadde San Andrés, Buenos Aires, 1997.
López Murphy and Moskovitz. “Decentralisation, Inter-Governmental Fiscal Relations andMacroeconomic Governance. The Case Of Argentina.” Buenos Aires: FIEL, mimeo, 1997
Lo Vuolo, Ruben. The Welfare State in Contemporary Argentina. CIEPP Democracy andSocial Policy Series Working paper No. 2, Spring 1995.
Macon, J. Aspectos Tributarios Interjurisdiccionales: La Experiencia Argentina, in PoliticaFiscal en la Argentina, Vol. I. Buenos Aires: Consejo Federal de Inversiones, 1963.
Ministry of Economy, Government of Argentina. Presupuestos Provinciales, 1972-1981.Buenos Aires: Subsecretariat of Housing, 1982.
Miranda, Diego. 1998. “Financing Human Development: Assessing The Effect of FiscalFederalism in Argentina.” Harvard University, mimeo, 1998.
Nunez Minana, H. and A. Porto. Comportamiento Comparativo de las ErogacionesProvinciales en la Argentina: 1934, 1960 y 1080. Presented at the XIX Annual Meeting of theArgentine Association of Political Economy, National University of Misiones, November 1984.
Oates, Wallace. Fiscal Federalismo. Harcourt Brace Jovanovich, New York, 1972.
Oates, Wallece ed. The Political Economy of Fiscal Federalism, Lexington Books, Lexington,1977
Ostrom, Elinor, Larry Schroeder and Susan Wynne. Institutional Incentives and SustainableDevelopment: Infrastructure Policies in Perspective. Westview, Boulder, 1993.
Pirez, P. Coparticipacion Federal y Decentralizacion del Estado. Buenos Aires: Centro Editorde America Latina, 1986.
Porto, Alberto and Pablo Sanguinetti. Decentralizacion Fiscal en America Latina: El CasoArgentino. Santiago, Chile. CEPAL Fiscal Policy Series No. 45, November 1993.
Porto, Alberto. Estudio sobre Finanzas Provinciales y el Sistema de Coparticipacion Federalde Impuestos. La Plata, Argentina: Ministerio de Economia de la Provincia de Buenos, 1996
Presman, Jorge and Lucioni, Luis. La evolución de las finanzas públicas provinciales entre 1991y 1996. CECE, Serie de Estudios No.23, Buenos Aires, Octubre 1997.
35
Puryear, Jeffrey. La Educación en América Latina: Problemas y Desafíos, PREAL, WorkingDocument No.7, Santiago, 1997
Ranis,Gustav and Frances Steward. “Growth and Human Development: Comparative LatinAmerican Experience,” paper presented at the conference “Institutional Reforms, Growth andHuman Development in Latin America,” Yale University, Center for International and AreaStudies, April 16-17, 1999.---------------------------------------------."Decentralization in Indonesia," Bulletin ofIndonesian Economic Studies, 30 (3), December 1994.
Rofman, A. and L. Romero. Sistema Socioeconomico y Estructura Regional en la Argentina.Buenos Aires: Amorrortu Editores, 1996 [1973].
Rodden, Jonathan and Susan Rose-Ackerman (1997). “Does Federalism Preserve markets?”University of Virginia Law Review 83, 1997.
Rondinelli, Dennis and James S. McCullough and Ronald W. Johnson. “Analyzingdecentralization policies in developing countries: A Political Economy Approach,”Development and Change 20, 1989.
Rose-Ackerman, Susan. Corruption and Government. Causes, Consequences, and Reform.Cambridge University Press, Cambridge, 1999.
Saiegh, Sebastián and Mariano Tommasi. Argentina’s Federal Fiscal Institutions: A case studyin the transaction-cost theory of politics. Paper prepared for the conference on “Modernizacióny Desarrollo Insitucional en la Argentina,” PNUD, Buenos Aires, May 20-21, 1998.
Samoff, Joel. Decentralization: the politics of interventionism. Development and Change 21,1990.
Sanguinetti, P. Intergovernmental Transfers and Public Sector Expenditures: A Game-TheoreticApproach. Estudios de Economia (Chile) vol. 21, no. 2, December 1994.
Savedoff, William ed. La organización marca la diferencia. Banco Interamericano deDesarrollo, Washington, DC, 1998.
Sawers, L. The Other Argentina. Boulder, Colorado: Westview Press, 1996.
Schenone, Osvaldo. “El Comportamiento del Sector Público en la Argentina. 1970-1985,” in FelipeLarrain and Marcelo Selowsky, eds. El Sector Publico y la Crisis de la América Latina. Mexico, D.F.:Fondo de Cultura Económica, 1990.
Scott, James. Seeing Like a State. Yale University Press, New Haven, 1998.
36
Shahid Javed Burki, Guillermo Perry and William Dillinger. Beyond the Center. Decentralizingthe State. The World Bank, Washington DC 1999.
Tendler, Judith. Good government in the tropics. Johns Hopkins University Press, Baltimore,1997.
Waisman, Carlos. Reversal of Development in Argentina. Princeton: Princeton University Press,1987.
Wallace, T. D. and Ashiq Hussain, "The Use of Error Components Models in Combining CrossSection with Time Series Data," Econometrica, 37(1), January 1969.
Weingast, Barry. “The Economic Role of Political Institutions: Market Preserving Federalismand Economic Institutions,” Journal of Law, Economics and Organization 11, 1995.
Willis, Elisa., Garman, C. and Haggard, S. The Politics of Decentralization in Latin America.Latin America Research Review, vol. 34, No.1, 1999.
World Bank. Argentina: Provincial Government Finances. Washington D.C.: World Bank,1989.
Xie, Danyang., Zou, H. and Davoodi, H., "Fiscal Decentralization and Economic Growth in theUnited States," Journal of Urban Economics, 45(2), March 1999.
Zhang, Tao and Heng-fu Zou, "Fiscal Decentralization, Public Spending and Economic Growthin China," Journal of Public Economics, 67(2), February 1998.
37
FOOTNOTES
1 According to Peter Evans (1997), decentralization results from the failure of developmental states. A recent
World Bank study finds that “out of 75 developing and transitional countries with populations greater than
5 million, all but 12 claim to be embarked on some form of transfer of political power to local units of
government” (W. Dillinger, Decentralization and its Implications for Urban Service Delivery, Urban
Managements Program Discussion Paper 16, World Bank, 1994, cited by Agrawal and Ribot 1999). Shahid et
al. (1999:chapter 1) show that all fourteen Latin American countries with a population of more than 5 million
implemented some decentralization measures.
2 Fiscal decentralization is argued to improve resource allocation through better knowledge of local
preferences and tastes and because of the example set by competition among jurisdictions (Oates, 1972 and
1977, Bennett, 1990). The positive effect of decentralization for the delivery of services in the region is
emphasized by Fox and Aranda (1996), Tendler (1997), De La Cruz (1998), and Savedoff ed. (1998). The
political dimensions of fiscal decentralization in the region are analyzed by Porto (1990), Eaton (1996, 1998
and 1999), Gibson et al. (1998), and Willis et al. (1999). Weingast (1997) and Rose-Ackerman and Rodden
(1997) relate decentralization in the form of federalism to economic growth.
3 Human development measures were only included to measure the determinants of decentralization (Porto
1996, Porto and Sanguinetti 1993), or linked to the decentralized provision of services (IADB 1996: chapter 3;
Puryear 1997; Savedoff ed. 1998; De la Cruz 1995; Tendler 1997).
4 On the positive impact of health and education on economic growth, see Birdsall and Sabot (1994) and
Birsdall et al (1995). Ranis and Stewart (1999) provide an overview of the comparative Latin American
experience and a justification for the use of health and education measures as indicators of human
development.
5 Our data set has been partially complemented by information collected independently by Diego Miranda
with support from the David Rockefeller Center for Latin American Studies and the Program on
Constitutional Government at Harvard University, as well as the National Science Foundation.
38
6 Provincial studies include Bertranou (1993), Sawers (1996), Porto (1997), Nunez Minana and Porto (1984),
Cavallo and Zapata (1986), and the World Bank (1989).
7 Agrawal et al. (1999: chapter 2) provide a complete review of different definitions and their relation with
diverse dimensions involved in the decentralization process.
8 Gustav Ranis and Frances Stewart (1999), J.Klugman (nd), Rondinelli et al.(1989), Ostrom et al. (1993) and
Samoff (1990) discuss the implications and characteristics of these forms of decentralization.
9 The Argentine revenue sharing system is referred to also as ‘co-participation’ and we use both terms
interchangeably in this article.
10 For a thoughtful discussion of the effect of decentralization on the internalization and reduction of costs
as well as its effects on governance, see Agrawal and Ribot (1999). For a powerful argument for the
importance of local knowledge and resources for policy implementation, see Scott (1998).
11 While local collection is not always possible for technical reasons, the link between ‘effort’ and ‘reward’
at the local level can be reinforced even for centrally collected resources in the absence of central bail- outs
of local administrations, so as to ‘harden’ budget constraints (Dillinger and Webb 1999).
12 Susan Rose Ackerman (1999:149) argues that “states and local governments may be under the control of
local elites who use the state apparatus for their personal gain. Although competition between jurisdictions
for investment resources limits corrupt possibilities, it does not eliminate them. The very smallness and
intimacy of local jurisdictions may make corrupt relations possible.” On the other hand, the so-called “gold-
fish bowl effect” of imposed natural transparency at the local level works in the opposite direction.
13 In this situation, as long as the impact of devolution converges fast to the true model, a static model but
one with enough observations over time will be able to identify the true model . As a simple example
consider the case where a level of decentralization x implies a level of human development y. However,
provinces take time to adapt to this new level and therefore in the first year that decentralization is x the level
of human development is actually y1 which is lower than y. From the second year onwards it converges to
the true level y. A static model with T=1 is biased; however, as T increases the estimated coefficient
converges to the true coefficient (since in any linear estimation all observations are weighted equally).
39
14 About 78 percent of the national population lives in tows of more than 50,000 inhabitants and around 91
percent of it lives in towns of more than 10,000 inhabitants (Indec 1998:69).
15 Due to a process of decentralization of social services, elementary education was transferred to provincial
jurisdiction in the late 1970s, while secondary education and health were transferred in the 1990s. The 1994
constitutional reform reinforced political decentralization by establishing direct elections for provincial
Senators and the authorities of the city of Buenos Aires.
16 According to the World Development Report (WB 1996:199-201), the national illiteracy rate was 4 percent
in 1995 and the infant mortality rate was 23/1000 in 1994.
17 While the city of Buenos Aires and its surroundings above account for eleven million people, adding the
provinces of Buenos Aires, Santa Fe, and Córdoba, the central or ‘littoral’ region accounts for 63 percent of
the national population and 73 percent of total industrial production (INDEC 1991 and 1994).
18 Social data generally (across countries as well as within) tend to converge more than economic data.
19 According to the constitutional text in force between 1853 and 1994, this fiscal “division of labor” was
defined by articles 4, 9, 17, 67(1,2,9,18), 104 and 108. The constitutional origins of ATNs can be traced back
to article 67(2).
20 This “emergency” system included three laws: Law 12.143 of 1934, mandating the creation of a national
sales tax; Law 12,147 of 1935, establishing a national income tax (Pirez 1984:14-20); and Law 12,139 of 1935,
instituting the unification of “internal taxes” under national control (FIEL 1991:122). Following the addition
of newly created taxes on capital gains in 1946 and an inheritance tax in 1951 (FIEL 1993: 140), as well as the
partial reform of internal tax administration by law 14,390 in 1954 (Cetrangolo and Jimenez, 1995: 11), this first
“emergency” revenue-sharing scheme remained basically intact until 1958. In 1959, Law 14,788 integrated
income, sales, capital gains, and inheritance taxes into one revenue-sharing system. This law defined a
common distribution pattern for all taxes, i.e. to allocate by 1963, 36 percent of all collected funds to the
center, 6 percent to the MCBA, and 58 percent to the provinces (Cetrangolo, Jimenez, and Delfino 1996:12).
21 According to FIEL, ATN transfers to the provinces were equivalent to 7.5 percent of total co-participation
funds in 1970, 56.8 percent in 1971, and 60.6 percent in 1972 (1993:142).
40
22 Defined by national ‘law” 20221, the new regime divided co-participation tax proceeds equally between the
provinces and the federal government (48.5 percent each), with the remaining 3 percent funding a
“delegative” Regional Development Fund. To a significant degree, the allocation of funds among provinces
was calculated according to the estimated development gap among provinces, and not exclusively in terms
of decentralization, as had been the case in the past (Lopez Murphy and Moscovitch 1997:9)
23 This in part explains the extensive attention subsequent democratic administrations had to pay to
education policy. The relative success of this emphasis on education to compensate for the fiscal squeeze
of the military period can be seen in the rise of primary school enrollments. INDEC (1994:79) reports that
while 10.5 percent of 6-7 year-old children did not attend school in 1980, the percentage dropped to 3.6
percent by 1991.
24 By Law 23,548, the new co-participation regime required that the federal government retain 42.34 percent
of nationally collected taxes, while increasing the share of the provinces to 56.66 percent. The remaining 1
percent consisted of ATN resources, seriously constraining–at least on paper–the discretion of the federal
government.
25 During this period health and secondary education were also transferred to the provinces, increasing their
financial burden.
26 In the graph, we calculate the share of ‘co-participation’ in the period 1984-1988, following the
methodology utilized by the Argentine Ministry of Interior (SAREP, 1996). Due to the partially “defined”
characteristics of these transfers–see text above–although not technically co-participation, we prefer to
characterize them as such, to differentiate them from more ad-hoc transfers. Other studies have often
preferred to consider all transfers in this period as ATNs (e.g., Cetrángolo, Jiménez and Delfino 1996).
27 For example, it has been noted that the absolute increase in revenue sharing represented more than
double the expenses of transferred services between 1992 and 1994 (Sawers 1996: 226).
28 This argument has been most clearly presented in FIEL (1993). Sanguinetti (1994), Saiegh and Tommassi
(1998) and Gibson and Calvo (forthcoming) share a pessimistic view on the effects of fiscal decentralization.
Dillinger and Webb (1999), on the other hand, present a more optimistic perspective for the post-1991 period
41
when a national currency board curtailed the ability of the central government to bail out provincial
governments, thus imposing a harder budget constraint.
29 As an example of the relation between dependence on ATN and provincial overspending, eleven of the
twelve provinces deriving more than 1 percent of their current expenditures from ATN in 1996 have spent
more than 20 percent over their revenues in the 1991-1996 period (the national average of over-spending was
16.4 percent), according to Presman and Lucioni (1997: 23 and 43).
30 Implicitly or explicitly, the criticized “fiscal illusion” is understood in the literature as encompassing the
purely conditional transfers by the federal government to the provinces, as well as the revenue-sharing
proceeds of the Argentine co-participation regime whose origins and development are described here. See in
particular Saiegh and Tommassi (1998) and Jones, Sanguinetti, and Tommasi (1997), Presman and Lucioni
(1997), and FIEL (1993).
31 The common measure of decentralization used in these studies is the ratio of local receipts to total
resources.
32 We would prefer a more accurate indicator of efficiency in education expenditures, but unfortunately none
is available in time series format. Grade repetition rates are unknown for most years and provinces,
standardized tests have not been conducted in a systematic way before 1993, and we have been unable to
find public or other documents reporting literacy rates for the 1970-1994 period.
33 Where school age population is declining, a rising ratio might pick this up, rather than any impovement in
absolute levels of human development.
34 Our enquiries at the Ministry of the Economy, which collects and distributes such data in Argentina, met
with no success.
35 If we have three equations, as follows (in our case identities from national income accounting):
x1+x2=x-----(1) ; x11+x12+ x13= x1 -----(2) and; x21+x22= x2 ----(3)
One needs four ratios to capture any changes in this system, conditional on x (total expenditure) being fixed.
They are r1= x1/x ; r2= x11/ x1 ; r3= x12/ x1 ; and r4= x21/ x2 .
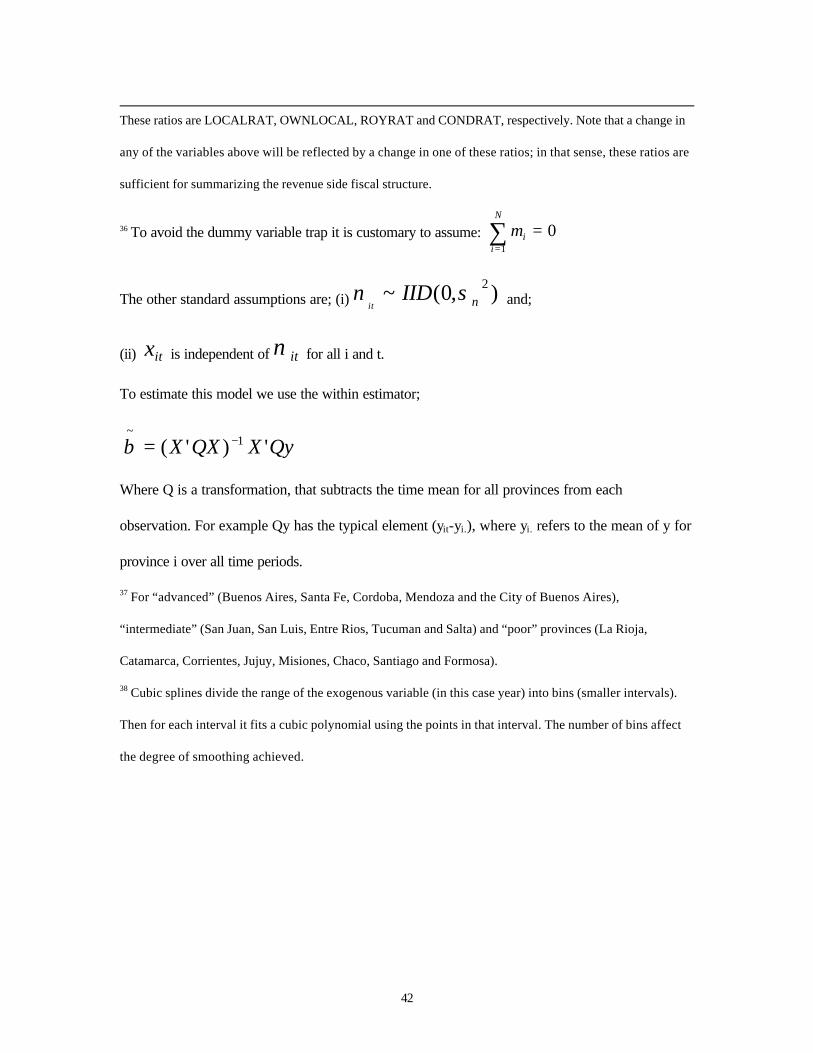
42
These ratios are LOCALRAT, OWNLOCAL, ROYRAT and CONDRAT, respectively. Note that a change in
any of the variables above will be reflected by a change in one of these ratios; in that sense, these ratios are
sufficient for summarizing the revenue side fiscal structure.
36 To avoid the dummy variable trap it is customary to assume: 01
=∑=
N
iiµ
The other standard assumptions are; (i) ),0(~ 2νσν IID
it and;
(ii) itx is independent of itν for all i and t.
To estimate this model we use the within estimator;
QyXQXX ')'( 1~
−=β
Where Q is a transformation, that subtracts the time mean for all provinces from each
observation. For example Qy has the typical element (yit-yi.), where yi. refers to the mean of y for
province i over all time periods.
37 For “advanced” (Buenos Aires, Santa Fe, Cordoba, Mendoza and the City of Buenos Aires),
“intermediate” (San Juan, San Luis, Entre Rios, Tucuman and Salta) and “poor” provinces (La Rioja,
Catamarca, Corrientes, Jujuy, Misiones, Chaco, Santiago and Formosa).
38 Cubic splines divide the range of the exogenous variable (in this case year) into bins (smaller intervals).
Then for each interval it fits a cubic polynomial using the points in that interval. The number of bins affect
the degree of smoothing achieved.
43
Appendix A
To examine the impact of decentralization on human development we needed a consistent
data set on provincial revenue sources and expenditures, as well as human development indicators
disaggregated across provinces, over the years. Unfortunately no such data set existed in the
literature and we set out to build one, using data primarily from two sources of provincial public
finance: SAREP (1996), covering the 1983-94 period and the Federal Council of Investments of
Argentina (henceforth, CFI), covering the 1970-1990 period. The former is widely considered as
more reliable and we used it as an anchor, using the growth rates from the second data set to
extrapolate backwards, with the aim of generating a consistent data set for the years 1970-1994.
The two data sets present a number of inconsistencies making any direct comparisons
problematic. First, the categories used for classifying revenue and expenditure are not always
consistent with each other. Second, the two series use different price deflators, sometimes giving
different values for the same variable. CFI consistently yields higher values for spending and
resources than SAREP. This may be due to different imputation methods for bonds issued by the
provinces and quasi-fiscal support from the Central Bank to the provinces through re-discounts. The
two series are, however, highly correlated over the period when they overlap (1983-1990), yielding
correlation coefficients uniformly over 0.95 for most categories.
Given the high degree of correlation between the two series, we assumed that the
differences between the two series were proportional and used the entire overlapping period 1983-
1990 to calculate the scaling factor, to obtain a higher degree of accuracy. For example, let
SAREP(x)83-90 denote the average value of the variable x in SAREP over the period 1983-1990.
Similarly, let us define CFI(x)83-90 as the average value of x in the CFI series over the period 1983-
1990. We then calculate the value of x for 1982 (the first year for which we use the CFI data), in the
following way:
x82 = CFI(x)82 *{SAREP(x)83-90 / CFI(x)83-90 } -----(1)
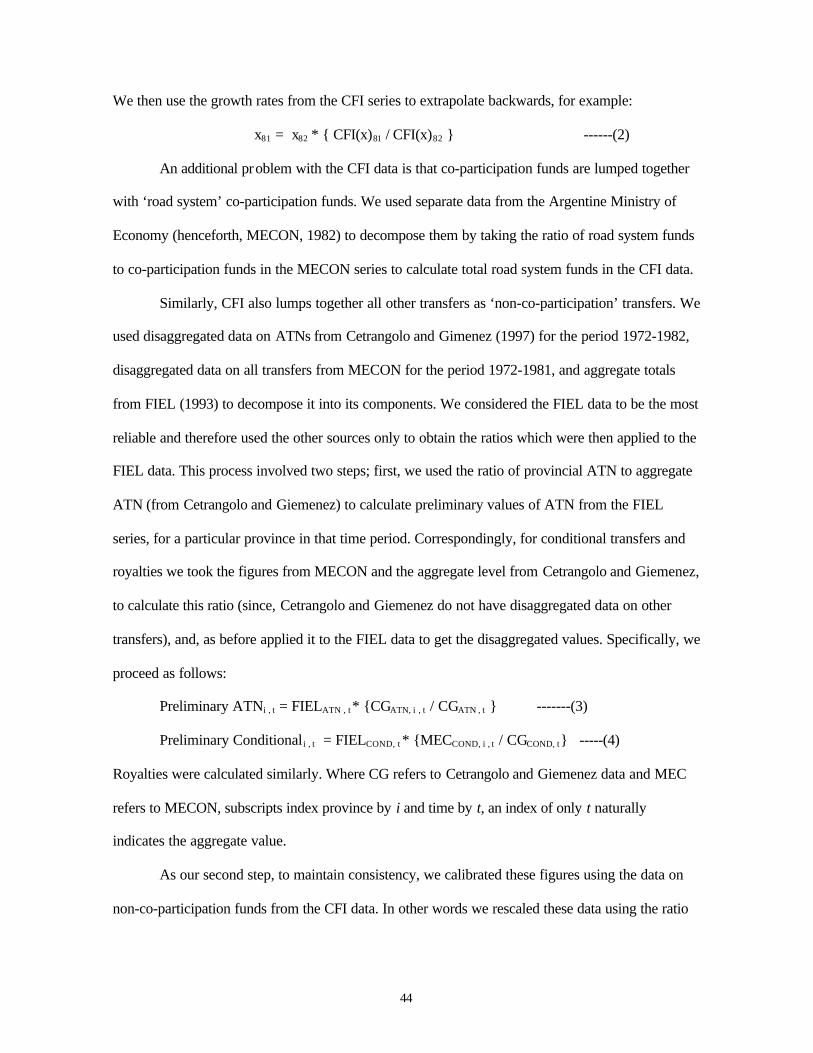
44
We then use the growth rates from the CFI series to extrapolate backwards, for example:
x81 = x82 * { CFI(x)81 / CFI(x)82 } ------(2)
An additional problem with the CFI data is that co-participation funds are lumped together
with ‘road system’ co-participation funds. We used separate data from the Argentine Ministry of
Economy (henceforth, MECON, 1982) to decompose them by taking the ratio of road system funds
to co-participation funds in the MECON series to calculate total road system funds in the CFI data.
Similarly, CFI also lumps together all other transfers as ‘non-co-participation’ transfers. We
used disaggregated data on ATNs from Cetrangolo and Gimenez (1997) for the period 1972-1982,
disaggregated data on all transfers from MECON for the period 1972-1981, and aggregate totals
from FIEL (1993) to decompose it into its components. We considered the FIEL data to be the most
reliable and therefore used the other sources only to obtain the ratios which were then applied to the
FIEL data. This process involved two steps; first, we used the ratio of provincial ATN to aggregate
ATN (from Cetrangolo and Giemenez) to calculate preliminary values of ATN from the FIEL
series, for a particular province in that time period. Correspondingly, for conditional transfers and
royalties we took the figures from MECON and the aggregate level from Cetrangolo and Giemenez,
to calculate this ratio (since, Cetrangolo and Giemenez do not have disaggregated data on other
transfers), and, as before applied it to the FIEL data to get the disaggregated values. Specifically, we
proceed as follows:
Preliminary ATNi , t = FIELATN , t * {CGATN, i , t / CGATN , t } -------(3)
Preliminary Conditional i , t = FIELCOND, t * {MECCOND, i , t / CGCOND, t} -----(4)
Royalties were calculated similarly. Where CG refers to Cetrangolo and Giemenez data and MEC
refers to MECON, subscripts index province by i and time by t, an index of only t naturally
indicates the aggregate value.
As our second step, to maintain consistency, we calibrated these figures using the data on
non-co-participation funds from the CFI data. In other words we rescaled these data using the ratio
45
of the total of preliminary ATN, conditional transfers and royalties calculated above to the
corresponding CFI figure on non-coparticipated funds, for that province in that time period.
Finally for the years 1970-71 and 1982 no such data were available rendering the
construction of ratios impossible. We instead used the average of the ratios calculated earlier for the
period 1972-1981, constrained by the aggregate levels of ATN and royalties from Murphy and
Moscovitch (1997).
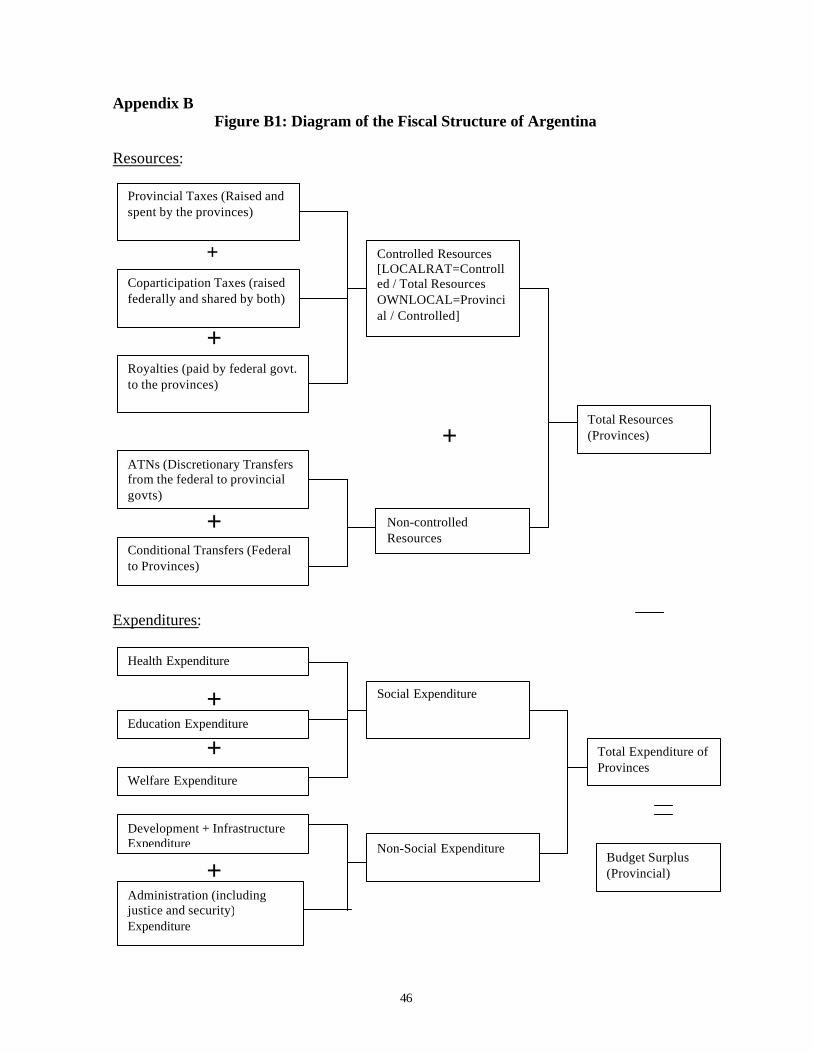
46
Appendix BFigure B1: Diagram of the Fiscal Structure of Argentina
Resources:
+
+
+
+
Expenditures:
+
+
+
Provincial Taxes (Raised andspent by the provinces)
Coparticipation Taxes (raisedfederally and shared by both)
Royalties (paid by federal govt.to the provinces)
Controlled Resources[LOCALRAT=Controlled / Total ResourcesOWNLOCAL=Provincial / Controlled]
ATNs (Discretionary Transfersfrom the federal to provincialgovts)
Conditional Transfers (Federalto Provinces)
Non-controlledResources
Total Resources(Provinces)
Health Expenditure
Education Expenditure
Welfare Expenditure
Social Expenditure
Development + InfrastructureExpenditure
Administration (includingjustice and security)Expenditure
Non-Social Expenditure
Total Expenditure ofProvinces
Budget Surplus(Provincial)
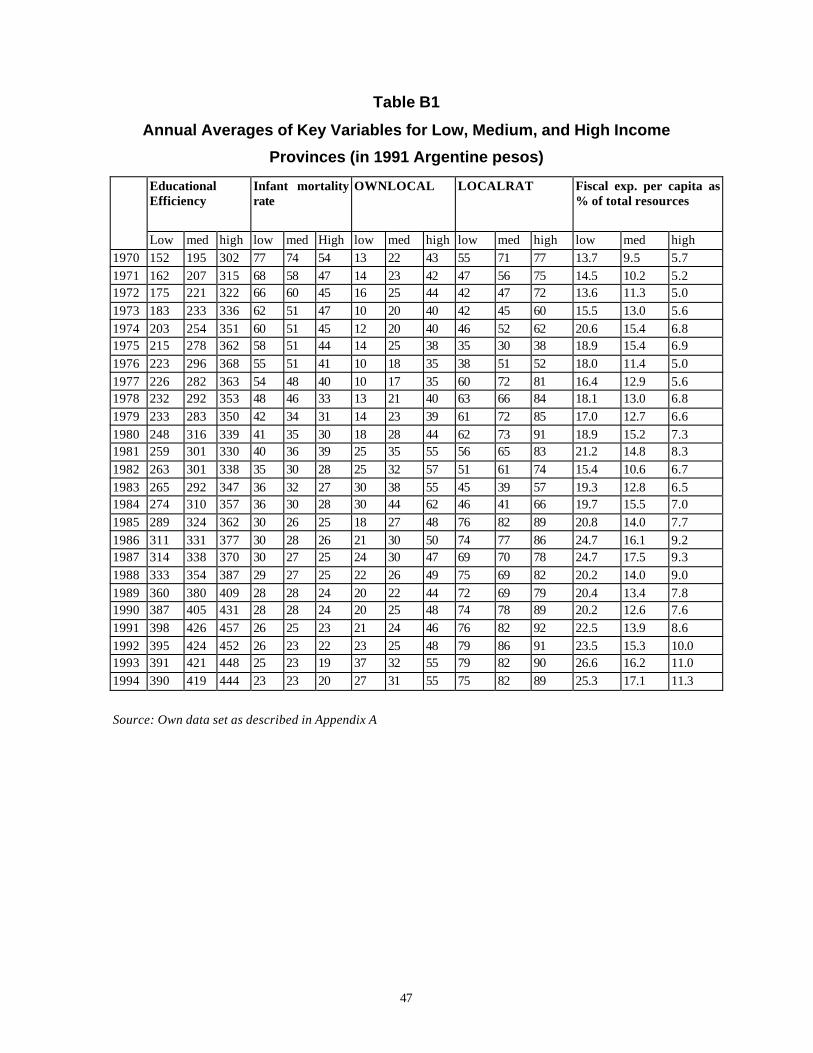
47
Table B1
Annual Averages of Key Variables for Low, Medium, and High Income
Provinces (in 1991 Argentine pesos)
EducationalEfficiency
Infant mortalityrate
OWNLOCAL LOCALRAT Fiscal exp. per capita as% of total resources
Low med high low med High low med high low med high low med high1970 152 195 302 77 74 54 13 22 43 55 71 77 13.7 9.5 5.71971 162 207 315 68 58 47 14 23 42 47 56 75 14.5 10.2 5.21972 175 221 322 66 60 45 16 25 44 42 47 72 13.6 11.3 5.01973 183 233 336 62 51 47 10 20 40 42 45 60 15.5 13.0 5.61974 203 254 351 60 51 45 12 20 40 46 52 62 20.6 15.4 6.81975 215 278 362 58 51 44 14 25 38 35 30 38 18.9 15.4 6.91976 223 296 368 55 51 41 10 18 35 38 51 52 18.0 11.4 5.01977 226 282 363 54 48 40 10 17 35 60 72 81 16.4 12.9 5.61978 232 292 353 48 46 33 13 21 40 63 66 84 18.1 13.0 6.81979 233 283 350 42 34 31 14 23 39 61 72 85 17.0 12.7 6.61980 248 316 339 41 35 30 18 28 44 62 73 91 18.9 15.2 7.31981 259 301 330 40 36 39 25 35 55 56 65 83 21.2 14.8 8.31982 263 301 338 35 30 28 25 32 57 51 61 74 15.4 10.6 6.71983 265 292 347 36 32 27 30 38 55 45 39 57 19.3 12.8 6.51984 274 310 357 36 30 28 30 44 62 46 41 66 19.7 15.5 7.01985 289 324 362 30 26 25 18 27 48 76 82 89 20.8 14.0 7.71986 311 331 377 30 28 26 21 30 50 74 77 86 24.7 16.1 9.21987 314 338 370 30 27 25 24 30 47 69 70 78 24.7 17.5 9.31988 333 354 387 29 27 25 22 26 49 75 69 82 20.2 14.0 9.01989 360 380 409 28 28 24 20 22 44 72 69 79 20.4 13.4 7.81990 387 405 431 28 28 24 20 25 48 74 78 89 20.2 12.6 7.61991 398 426 457 26 25 23 21 24 46 76 82 92 22.5 13.9 8.61992 395 424 452 26 23 22 23 25 48 79 86 91 23.5 15.3 10.01993 391 421 448 25 23 19 37 32 55 79 82 90 26.6 16.2 11.01994 390 419 444 23 23 20 27 31 55 75 82 89 25.3 17.1 11.3
Source: Own data set as described in Appendix A
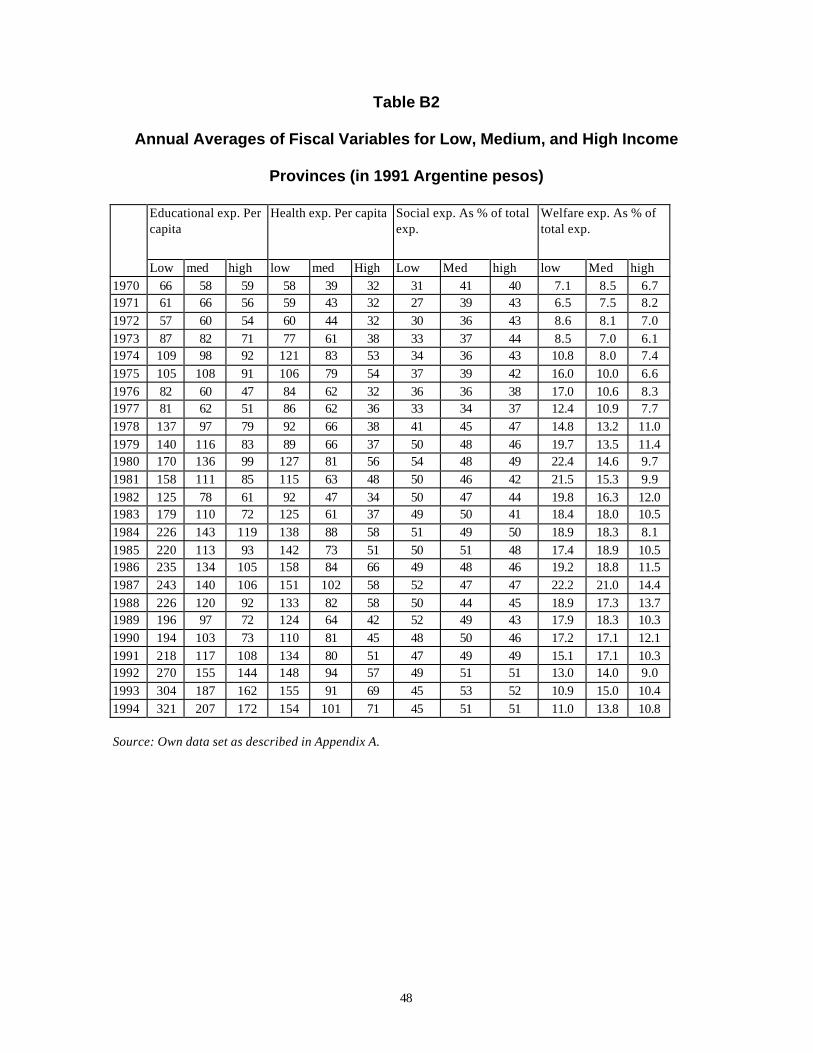
48
Table B2
Annual Averages of Fiscal Variables for Low, Medium, and High Income
Provinces (in 1991 Argentine pesos)
Educational exp. Percapita
Health exp. Per capita Social exp. As % of totalexp.
Welfare exp. As % oftotal exp.
Low med high low med High Low Med high low Med high1970 66 58 59 58 39 32 31 41 40 7.1 8.5 6.71971 61 66 56 59 43 32 27 39 43 6.5 7.5 8.21972 57 60 54 60 44 32 30 36 43 8.6 8.1 7.01973 87 82 71 77 61 38 33 37 44 8.5 7.0 6.11974 109 98 92 121 83 53 34 36 43 10.8 8.0 7.41975 105 108 91 106 79 54 37 39 42 16.0 10.0 6.61976 82 60 47 84 62 32 36 36 38 17.0 10.6 8.31977 81 62 51 86 62 36 33 34 37 12.4 10.9 7.71978 137 97 79 92 66 38 41 45 47 14.8 13.2 11.01979 140 116 83 89 66 37 50 48 46 19.7 13.5 11.41980 170 136 99 127 81 56 54 48 49 22.4 14.6 9.71981 158 111 85 115 63 48 50 46 42 21.5 15.3 9.91982 125 78 61 92 47 34 50 47 44 19.8 16.3 12.01983 179 110 72 125 61 37 49 50 41 18.4 18.0 10.51984 226 143 119 138 88 58 51 49 50 18.9 18.3 8.11985 220 113 93 142 73 51 50 51 48 17.4 18.9 10.51986 235 134 105 158 84 66 49 48 46 19.2 18.8 11.51987 243 140 106 151 102 58 52 47 47 22.2 21.0 14.41988 226 120 92 133 82 58 50 44 45 18.9 17.3 13.71989 196 97 72 124 64 42 52 49 43 17.9 18.3 10.31990 194 103 73 110 81 45 48 50 46 17.2 17.1 12.11991 218 117 108 134 80 51 47 49 49 15.1 17.1 10.31992 270 155 144 148 94 57 49 51 51 13.0 14.0 9.01993 304 187 162 155 91 69 45 53 52 10.9 15.0 10.41994 321 207 172 154 101 71 45 51 51 11.0 13.8 10.8
Source: Own data set as described in Appendix A.
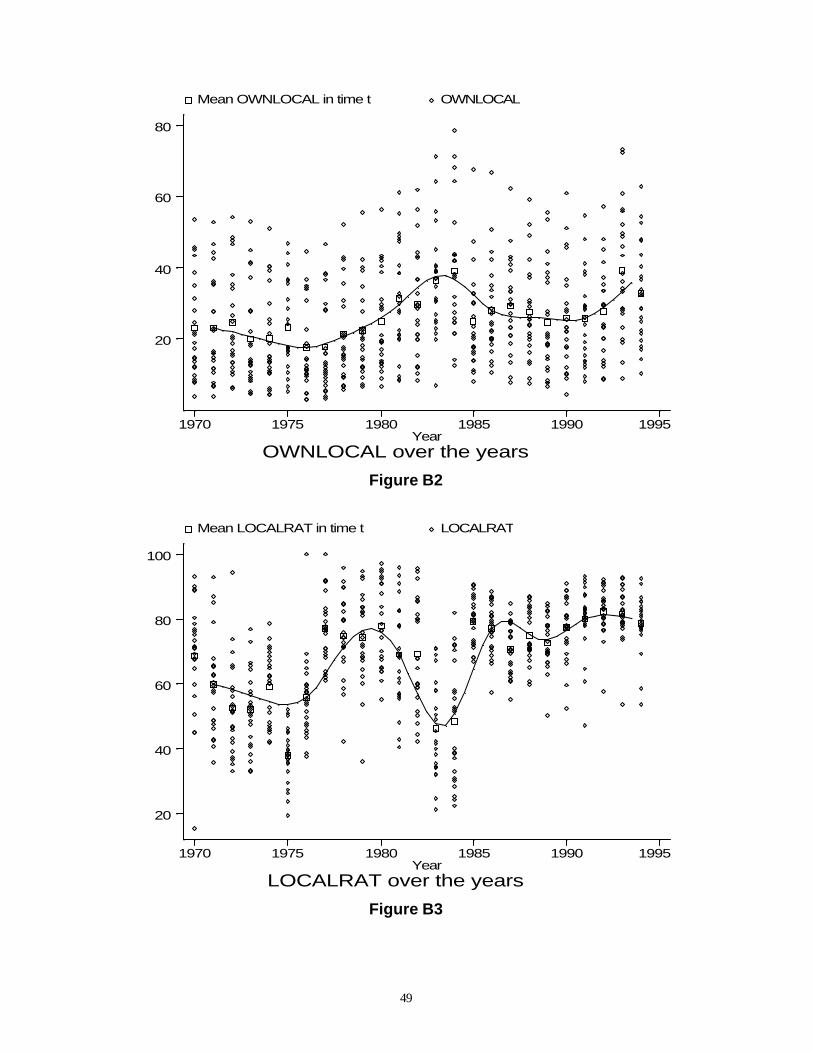
49
OWNLOCAL over the yearsYear
Mean OWNLOCAL in time t OWNLOCAL
1970 1975 1980 1985 1990 1995
20
40
60
80
Figure B2
LOCALRAT over the yearsYear
Mean LOCALRAT in time t LOCALRAT
1970 1975 1980 1985 1990 1995
20
40
60
80
100
Figure B3
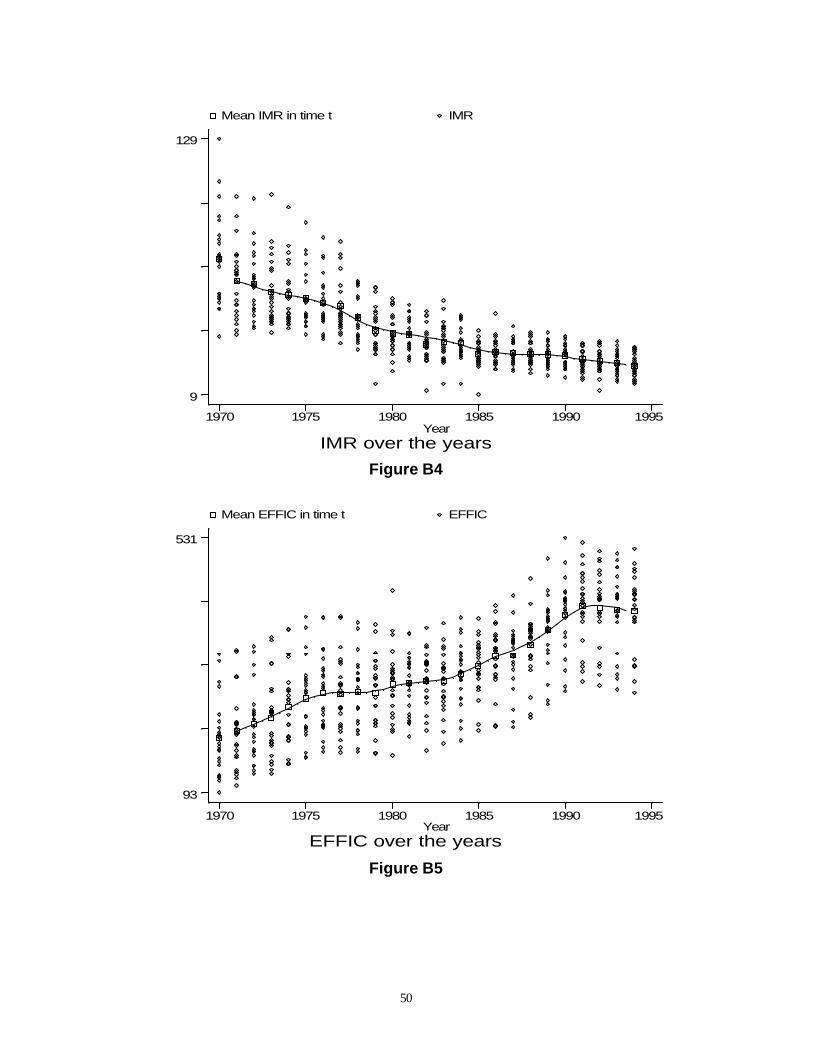
50
IMR over the yearsYear
Mean IMR in time t IMR
1970 1975 1980 1985 1990 1995
9
129
Figure B4
EFFIC over the yearsYear
Mean EFFIC in time t EFFIC
1970 1975 1980 1985 1990 1995
93
531
Figure B5
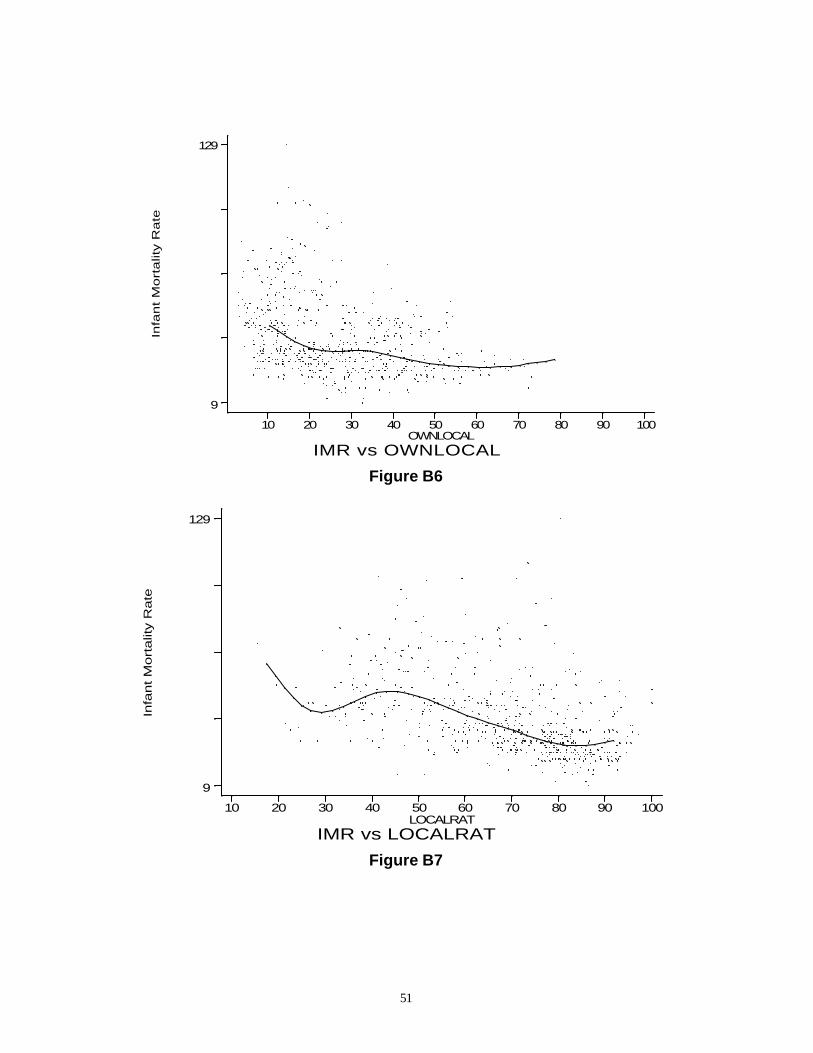
51
Infa
nt
Mo
rta
lity R
ate
IMR vs OWNLOCALOWNLOCAL
10 20 30 40 50 60 70 80 90 100
9
129
Figure B6
Infa
nt M
ort
alit
y R
ate
IMR vs LOCALRATLOCALRAT
10 20 30 40 50 60 70 80 90 100
9
129
Figure B7
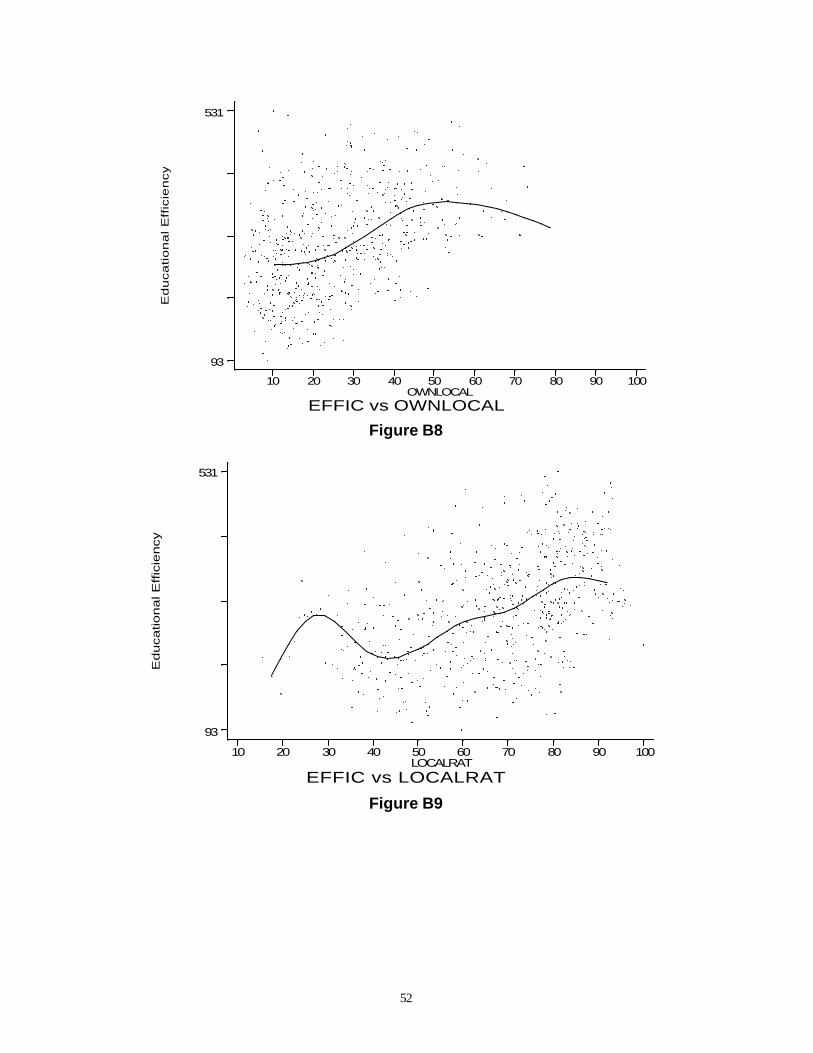
52
Ed
uca
tio
na
l E
ffic
ien
cy
EFFIC vs OWNLOCALOWNLOCAL
10 20 30 40 50 60 70 80 90 100
93
531
Figure B8
Educational E
ffic
iency
EFFIC vs LOCALRATLOCALRAT
10 20 30 40 50 60 70 80 90 100
93
531
Figure B9
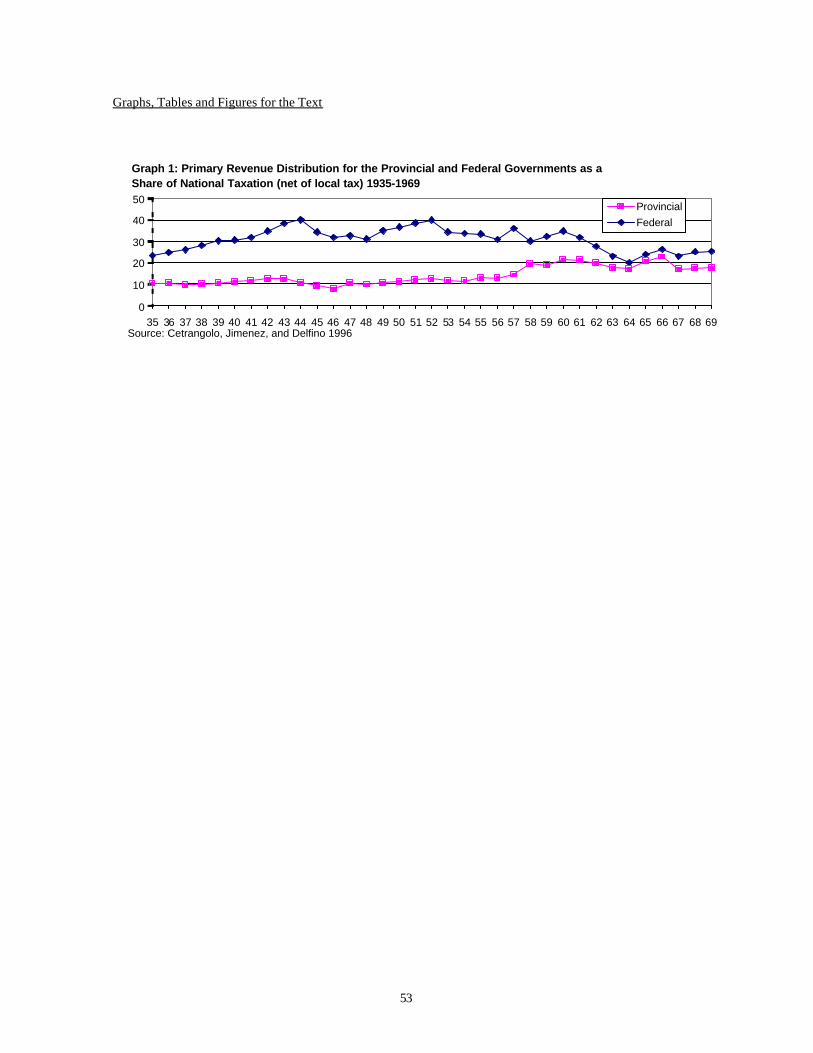
53
Graphs, Tables and Figures for the Text
Graph 1: Primary Revenue Distribution for the Provincial and Federal Governments as a Share of National Taxation (net of local tax) 1935-1969
0
10
20
30
40
50
35 36 37 38 39 40 41 42 43 44 45 46 47 48 49 50 51 52 53 54 55 56 57 58 59 60 61 62 63 64 65 66 67 68 69Source: Cetrangolo, Jimenez, and Delfino 1996
ProvincialFederal
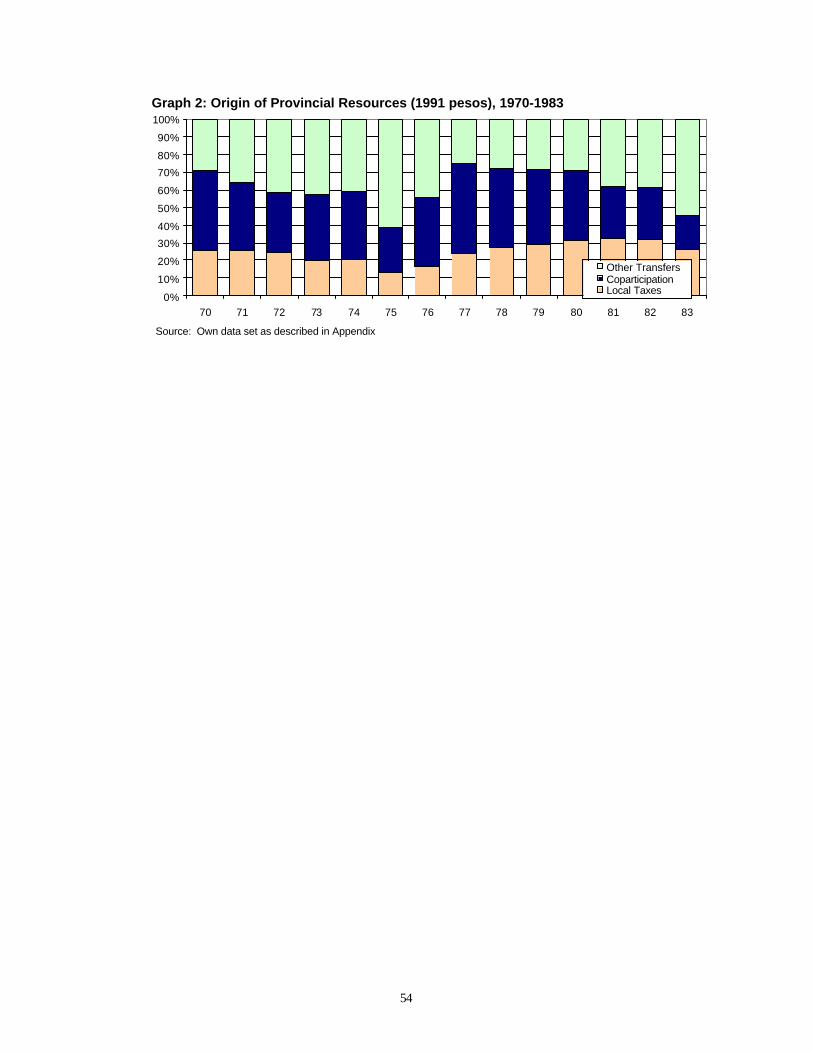
54
Graph 2: Origin of Provincial Resources (1991 pesos), 1970-1983
0%
10%
20%
30%
40%
50%
60%
70%
80%
90%
100%
70 71 72 73 74 75 76 77 78 79 80 81 82 83
Source: Own data set as described in Appendix
Other TransfersCoparticipationLocal Taxes
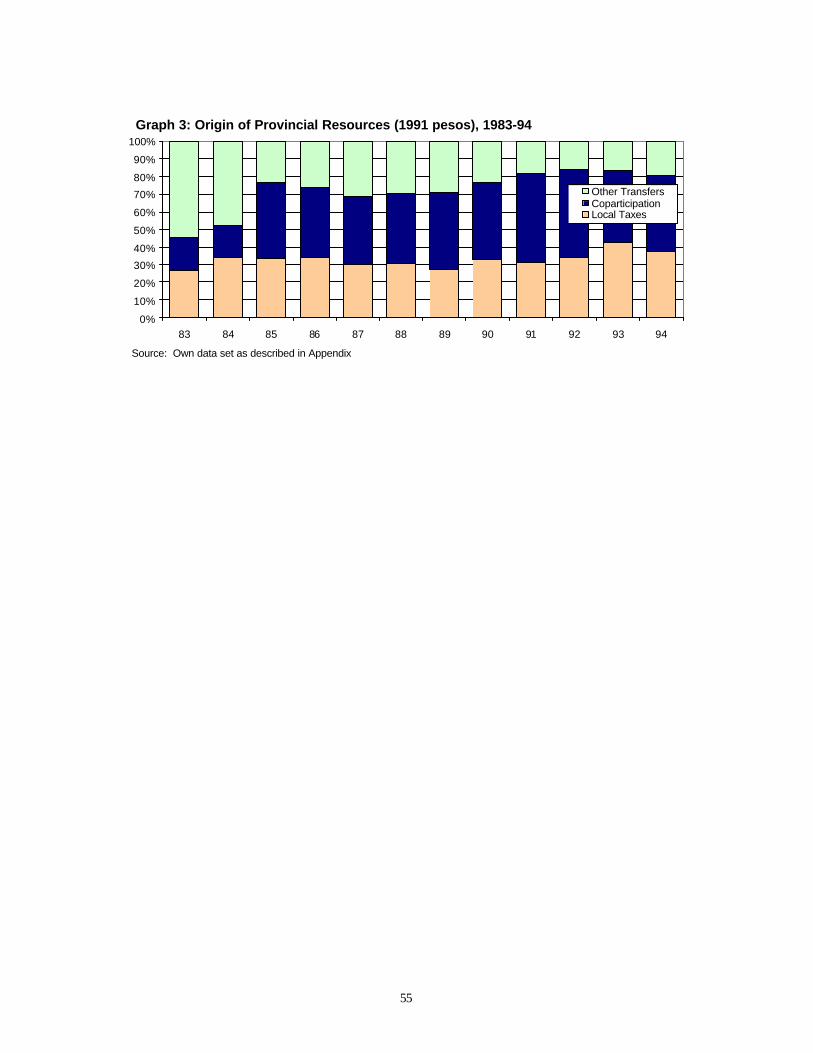
55
Graph 3: Origin of Provincial Resources (1991 pesos), 1983-94
0%
10%
20%
30%
40%
50%
60%
70%
80%
90%
100%
83 84 85 86 87 88 89 90 91 92 93 94
Source: Own data set as described in Appendix
Other TransfersCoparticipationLocal Taxes
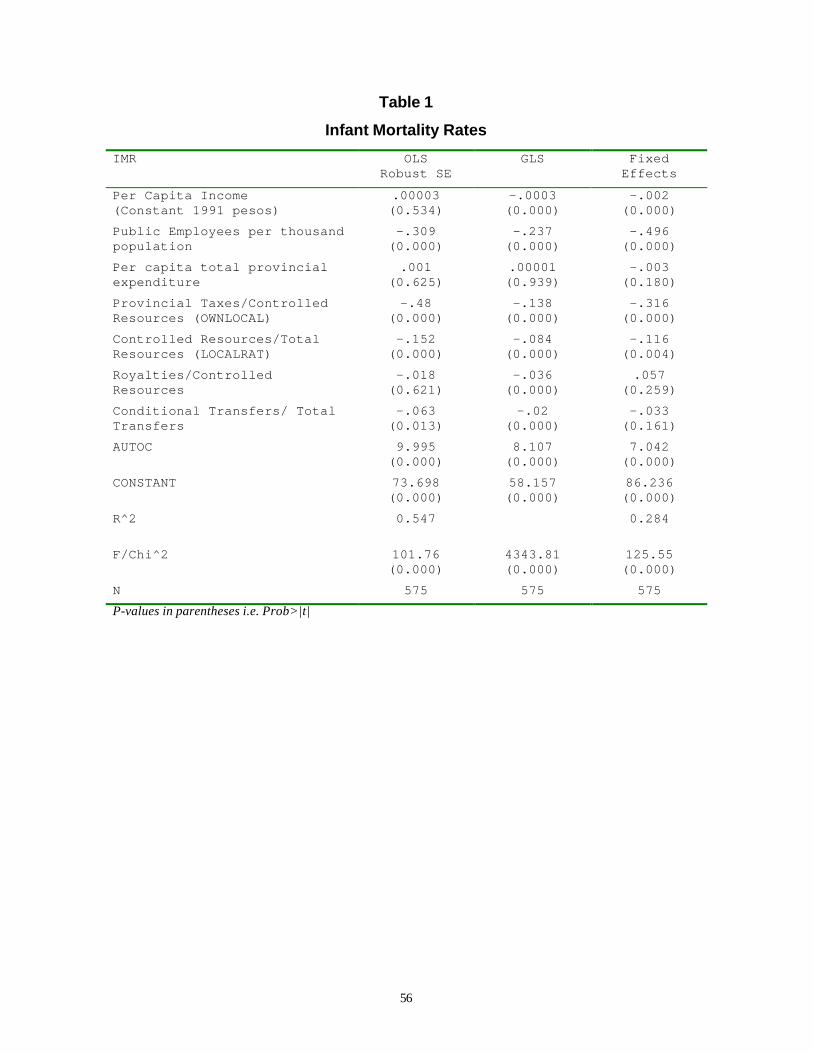
56
Table 1
Infant Mortality Rates
IMR OLSRobust SE
GLS FixedEffects
Per Capita Income(Constant 1991 pesos)
.00003(0.534)
-.0003(0.000)
-.002(0.000)
Public Employees per thousandpopulation
-.309(0.000)
-.237(0.000)
-.496(0.000)
Per capita total provincialexpenditure
.001(0.625)
.00001(0.939)
-.003(0.180)
Provincial Taxes/ControlledResources (OWNLOCAL)
-.48(0.000)
-.138(0.000)
-.316(0.000)
Controlled Resources/TotalResources (LOCALRAT)
-.152(0.000)
-.084(0.000)
-.116(0.004)
Royalties/ControlledResources
-.018(0.621)
-.036(0.000)
.057(0.259)
Conditional Transfers/ TotalTransfers
-.063(0.013)
-.02(0.000)
-.033(0.161)
AUTOC 9.995(0.000)
8.107(0.000)
7.042(0.000)
CONSTANT 73.698(0.000)
58.157(0.000)
86.236(0.000)
R^2 0.547 0.284
F/Chi^2 101.76(0.000)
4343.81(0.000)
125.55(0.000)
N 575 575 575P-values in parentheses i.e. Prob>|t|
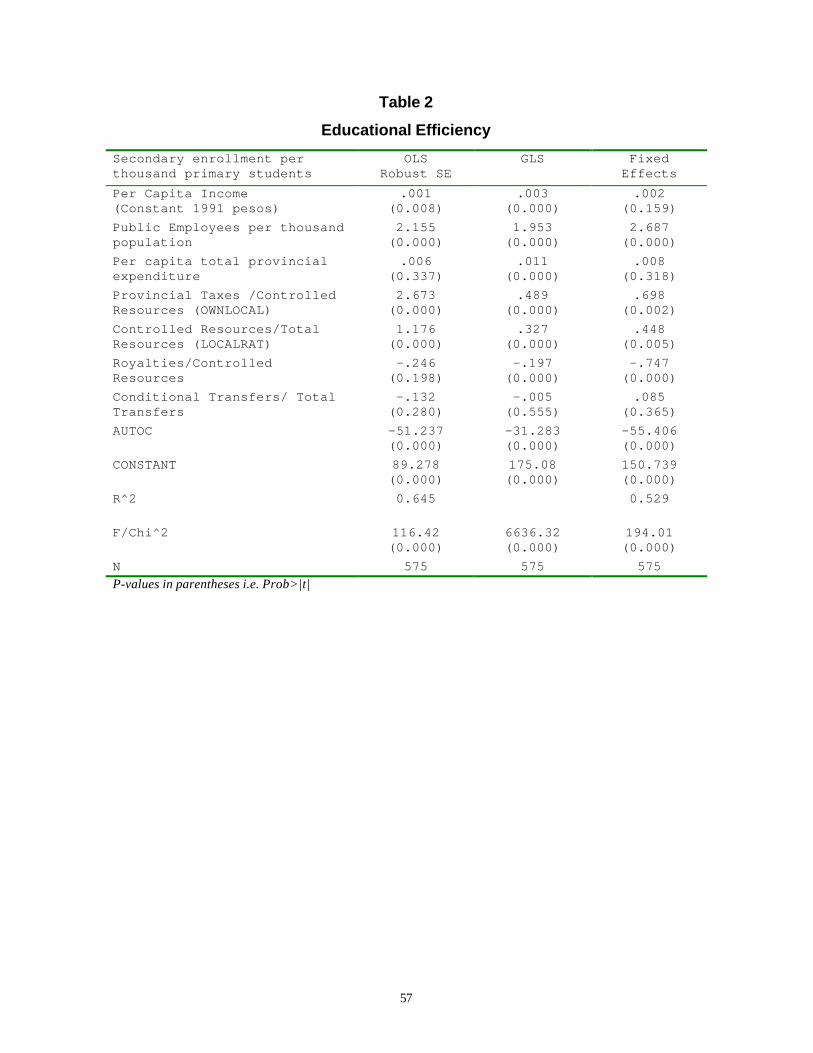
57
Table 2
Educational Efficiency
Secondary enrollment perthousand primary students
OLSRobust SE
GLS FixedEffects
Per Capita Income(Constant 1991 pesos)
.001(0.008)
.003(0.000)
.002(0.159)
Public Employees per thousandpopulation
2.155(0.000)
1.953(0.000)
2.687(0.000)
Per capita total provincialexpenditure
.006(0.337)
.011(0.000)
.008(0.318)
Provincial Taxes /ControlledResources (OWNLOCAL)
2.673(0.000)
.489(0.000)
.698(0.002)
Controlled Resources/TotalResources (LOCALRAT)
1.176(0.000)
.327(0.000)
.448(0.005)
Royalties/ControlledResources
-.246(0.198)
-.197(0.000)
-.747(0.000)
Conditional Transfers/ TotalTransfers
-.132(0.280)
-.005(0.555)
.085(0.365)
AUTOC -51.237(0.000)
-31.283(0.000)
-55.406(0.000)
CONSTANT 89.278(0.000)
175.08(0.000)
150.739(0.000)
R^2 0.645 0.529
F/Chi^2 116.42(0.000)
6636.32(0.000)
194.01(0.000)
N 575 575 575P-values in parentheses i.e. Prob>|t|