decentralization and political institutions
TRANSCRIPT
Decentralization and Political Institutions∗
Ruben Enikolopov∗∗ and Ekaterina Zhuravskaya∗∗∗
March 2004
Abstract:
Does fiscal decentralization lead to more efficient governance, better public goods, and higher economic growth? This paper tests hypotheses of the theoretical literature that results of decentralization depend on features of political institutions. Using data from up to 95 countries for 25 years we show that the effect of fiscal decentralization strongly depends on two aspects of political centralization: 1) strength of national party system (measured by the age of main parties and fractionalization of government parties) and 2) subordination (whether local and state executives are appointed or elected). We find solid support for Riker’s theory (1964): in developing countries, strong parties significantly improve the results of fiscal decentralization for economic growth, quality of government, and public goods provision. There is also some evidence from developing countries that administrative subordination of local to higher-level authorities improves decentralization results.
∗ We thank Alberto Alesina, Scott Gelhbach, Sergei Guriev, James Hines, Rory MacFarquhar, Gérard Roland, Andrei Shleifer, Konstantin Sonin, Barry Weingast, Luigi Zingales, two anonymous referees and seminar participants at the University of Michigan, Center for Economic and Financial Research, New Economic School, London Business School, University of California, Berkeley, Institute for Advance Study in Princeton, Harvard University, Princeton University, and participants of CEPR-WDI 2003 Transition Conference for useful comments. The work of Ruben Enikolopov was in part supported by a program of the Bureau of Educational and Cultural Affairs, U.S. Department of State, administered by the American Council for International Education. The views expressed herein are of the authors and not necessarily shared by ECA or AC. ∗∗ Harvard University and Center for Economic and Financial Research (CEFIR), [email protected]. ∗∗∗ Institute for Advanced Study, Princeton; Center for Economic and Financial Research (CEFIR); and CEPR, [email protected].
1
1. Introduction
Modern economic literature has little doubt that economic decentralization affects
the quality of government, economic growth, and efficiency of public goods provision.
The effect of decentralization depends on economic and political incentives of local
public officials. Economic incentives that help to align politicians’ private interests with
public goals are provided by such mechanisms as interjurisdictional competition
(Tiebout, 1956; Qian and Roland, 1998; Maskin, Qian, and Xu, 2000) and fiscal
autonomy (Jin et al., 1999; Qian and Weingast, 1997; and Zhuravskaya, 2000). Political
incentives, i.e., local governments’ accountability, are provided by political institutions,
which ensure that careers of local politicians depend on whether they pursue efficient
policies. In the absence of accountability, strong economic incentives at the local level
may result in corruption, provincial protectionism, and capture by vested interests (Tanzi,
1996; Sonin, 2003, Cai and Treisman, 2004).
Even though it is a well-established fact that accountability of local public
officials is necessary to prevent inefficient local policies in a decentralized economy,
there is little agreement in the literature about what institutions can effectively ensure
accountability.1 On the one hand, democratic elections with free access to information
and developed civil society may provide local governments with sufficient political
incentives to guarantee efficient decentralization. This argument is based on the view
that local governments are more accountable compared to the central governments
(Seabright, 1996; Persson and Tabellini, 2000); and that they have to compete during
elections on more concrete policy issues compared to the central governments where
1 See Bardhan (2002) for an excellent survey of the literature.
2
many dimensions of policies are bundled together (Besley and Coate, 2003). On the
other hand, democratic mechanisms fail in many developing and transition countries,
leading to corruption and capture of the local governments. In addition, local
governments accountable only to local constituencies in decentralized states have
incentives to pursue policies that have negative externalities on other jurisdictions of the
country, i.e. issuing money surrogates, erecting trade barriers, etc. (Musgrave, 1969;
Oates, 1972; Tanzi, 1996; Besley and Coate, 2003). In these cases, strong administrative
control of local by central authorities may help efficient economic decentralization
(Blanchard and Shleifer, 2000). Beneficial effect of administrative centralization,
however, requires lower probability of capture at the national compared to the local
level.2 Riker (1964) pointed out that the structure of party system is also extremely
important for the effectiveness of local governments. He argued that strong national
party systems mitigate externalities from local policies and are more affective in
disciplining local politicians than administrative or constitutional arrangements. Thus,
decentralization may have the opposite results in countries with different sources of local
governments’ accountability.3
This paper sheds light on this debate by evaluating the effects of fiscal
decentralization on the quality of government, public goods provision, and economic
growth, taking into account the structure of political institutions. In particular, we
analyze how the level of political centralization changes the results of fiscal
decentralization. Previous empirical literature on the effects of decentralization produced
2 Bardhan and Mookherjee (1999) studied determinants of capture in different levels of government. 3 Besley and Case (1995) provide evidence of influence of political parties on accountability using panel data for the US states.
3
mixed results that vary with countries and time periods.4 This can be partly explained by
the fact that it overlooked the importance of political institutions.
Using data from up to 95 countries for 25 years, we show that the effect of
decentralization on economic growth, quality of government, and public goods provision
strongly depends on the following two aspects of political centralization: 1) strength of
the party system (measured by the age of main parties and fractionalization of
government parties) and 2) administrative subordination (whether local and province-
level politicians are appointed or elected). We find solid support for Riker’s theory in
developing and transition countries: strong party systems substantially improve the
results of fiscal decentralization. In contrast, opposite to Riker’s prediction in developed
countries decreased age of main parties increases efficiency of decentralization, while
results based on government fractionalization are unrobust. The negative effect of party
age can be attributed to a decrease in political competition at the national level. In
addition, we find some evidence that subordination of local authorities to higher-level
governments improves the effect of decentralization on growth and public goods
provision both in developing and developed countries and on government quality in
developing countries. Most of the results come from cross-section of countries.
4 Fisman and Gatti (2002) and de Mello and Barenstein (2001) found negative effect of decentralization on corruption; Treisman (2000) reported no relationship. Zhang and Zou (1998) reported negative effect of decentralization on provincial growth in China. Jin et al. (1999) showed that this relationship is positive once one filters out cyclical effects. Lin and Liu (2000) confirmed this result. Akai and Sakata (2002) reported positive effect of decentralization on growth of US states in early 1990s. Xie et al. (1999) showed no long-term relationship between these variables in the US for 50 years. Woller and Phillips (1998) found no link between decentralization and growth in developing countries. In contrast, Davoodi and Zou (1998) reported negative, marginally significant, relationship in developing countries and no effect in developed countries. Robalino et al. (2001) found negative cross-country relationship between decentralization and infant mortality. Zhuravskaya (2000) reported positive effect of decentralization on healthcare and education outcomes in Russian municipalities.
4
Therefore, we cannot rule out the possibility that unobserved cross-country heterogeneity
accounts for the results.
The remainder of the paper is organized as follows. Section 2 presents
hypotheses. Section 3 describes the data. Section 4 describes the methodology. In
section 5, we present the results and discuss their robustness. In section 6, we summarize
and interpret our empirical findings. Conclusions follow in section 7.
2. Hypotheses and the measures of political institutions
The theoretical argument first made by Riker (1964) that party systems - the
strength of national parties and the relationship between the national and subnational
parties – are important determinants of political incentives of the local governments, is
behind our first hypothesis. In the case of strong political parties, career of politicians in
the local government depends on their party’s political and financial support to get
reelected, as well as on the possibility of promotion to the national government. National
governing parties, in turn, are interested in supporting local politicians whose policies do
not impose significant negative externalities on other jurisdictions in the country, and,
thus, on overall national performance. Therefore, strong parties provide political
incentives for local politicians to conduct efficient policies and help to internalize
externalities of local policies.5 Moreover, strong national party systems provide political
incentives for local governments irrespective of whether local politicians are appointed or
elected. Even when local politicians do not need support during elections, career
concerns play an important role (Maskin, Qian, and Xu, 2000).
5 This effect, however, may be attenuated by a weak link between national and regional parties when national parties do not have much influence over regional politicians. Uslaner (2000) argues that Canada provides an example of weak link between national and regional parties. The data available do not allow us to take into account the relationship between national and regional parties.
5
The best available proxies for the strength of party systems are the age of main
parties (the average age of the two main governmental parties and the main opposition
party) and fractionalization of governing parties (the probability that two members of
parliament picked at random from governing parties belong to different parties). An
assumption behind the first measure is that older parties are stronger than younger ones
(Huntington, 1968). Higher age of main parties indicates more stable party system
important for career concerns because local politicians take the stability of their party into
account when making decisions on effort allocation to career advancement. An
assumption behind the second measure is that low fractionalization of government parties
indicates that government consists of a small number of strong parties each having
substantial weight in policy decisions, while high fractionalization is an indicator of
many relatively weak parties each having small impact on policies. The motivation
behind this measure is that the relative political weight of local politician’s party in
national policy-making is an important factor in his career decisions.6
Both of these measures are highly imperfect. The age of main parties may reflect
institution building processes in young countries (that can affect decentralization
outcomes) rather than the party strength. Fractionalization of government parties as a
measure of party strength has even more serious drawbacks. First, the differences in
fractionalization of parties across countries depend on differences in the degree of
geographical segregation of voters with different political preferences (for instance,
ethnic groups). Efficiency of fiscal decentralization may also be affected by geographical 6 We take fractionalization of governing parties rather than fractionalization of parliament as one of the two main proxies for the party strength because it is more closely related to career concerns. Fractionalization in small opposition parties and the number of independent members of parliament has little effect on local politicians’ career concerns determined by political weights of their parties. Nonetheless, the results are robust to using fractionalization of parliament as an alternative proxy.
6
voter segregation because in countries with high regional segregation decentralization is
partly driven by central government’s attempts to appease secessionist tendencies.
Second, government fractionalization depends on the electoral rule and government
system, both of which can have an independent effect on the efficiency of
decentralization. Empirical strategies used to do make sure that our results are not driven
by these alternative explanations are described in the sensitivity section 5.1.
To the best of our knowledge there is little quantitative comparative analysis of
the strength of party systems, thus, it is hard to check whether the average age of main
parties and fractionalization of government parties serve as good measures of party-
system strength across countries. Literature, however, provides some estimates of over-
time changes in the strength of parties for several countries. Therefore, we are able to
check whether reported changes in the strength of party systems are reflected in behavior
of our measures. For example, Mexico and Peru in 1990’s experienced a substantial
decline in party strength. A large number of independent candidates and candidates from
recently formed new parties were elected as mayors, governors, and legislators (Camp,
1998; Carrion, 1998). Our data shows a significant decrease in the average age of main
parties and a significant increase in the fractionalization of government parties in both
countries at that time. Thus, in these cases our measures adequately capture the change
in party strength. As is usual for cross-country comparisons, there are few countries for
which the two measures perform very poorly as proxies of party strength, however.7
7 Colombia, for example, has relatively low level of fractionalization and the highest average age of parties in the world. Under our assumptions this indicates a very strong party system. In reality, Colombia has one of the weakest party systems, since parties do not have control over their own party label which allows existence of different lists with the same party label. This is, however, a unique phenomenon to Colombia and neighboring Ecuador (Roland and Zapata, 2000).
7
We formulate testable prediction of Riker’s theory: Young age of main parties
and high fractionalization of government parties reduce efficiency of decentralization
affecting economic growth, quality of government, and public goods provision outcomes.
An excessively strong party system can, however, be an indication of low political
competition. In this case few parties (in the extreme case, only one party) dominate
elections and constituencies have lower influence on the election outcome. In particular,
when political competition is low, national parties become less concerned about the
negative externalities of local policies pursued by party members. As a result, under
certain conditions efficiency of fiscal decentralization may be reduced in a system with
excessively strong parties. Diaz-Cayeros et al. (2003) argue that Mexico between 1930s
and early 1990s provides an example of inefficiently small political competition.8 This
logic points to the alternative hypothesis that the age of main parties and low government
fractionalization may undermine the efficiency of decentralization.
Argentina and Chile provide a good case study: both counties experienced fiscal
decentralization with a substantial difference in outcomes. In the 1980s and 1990s, about
10% of total government revenues and expenditures were shifted from central to
subnational budgets in Chile and 15% in Argentina. The level of decentralization, of
course, has been substantially higher in federal Argentina that in unitary Chile. It is well
documented that in Chile transfer of expenditure responsibilities and financial resources
from the central to municipal governments helped to improve provision of public health
(Bossert et al., 2003) and education (Winkler and Rounds, 1996; Parry, 1997). In
8 High age of parties may also indicate reduced accountability because it may reflect extremely loyal electorate that votes for the party regardless of its actual policies. Shachar (2003) studies the party loyalty of electorate.
8
contrast, Argentine decentralization is viewed as one of the main reasons for
macroeconomic destabilization and a large-scale economic crisis (Tommasi et al., 2001).
This difference in the results of decentralization can be explained by the difference in
levels of political centralization and national party strength of the two countries. Chile
has strong party system with parties that are national in scope and have clear ideological
distinctions (Londregan, 2000). National party affiliation in Chile is important not only
for elections and career concerns of government officials at all levels, but it also plays an
important role in NGOs such as universities and labor unions. In contrast, Argentine
national political parties are weak and provincial parties dominate political arena both at
the national and provincial level (Corrales, 2002). Thus, in Argentina, national political
parties do not serve as a mechanism for disciplining subnational authorities and aligning
incentives of local politicians with national objectives, while in Chile they do.
A basic premise of the representative democracy paradigm is that public officials
should be elected. There are different views in the literature, however, on whether
elections of local officials help the outcomes of decentralization. Seabright (1996) shows
that under certain assumptions elected officials at the local level are more accountable
compared to the central level. His conjecture motivates a testable proposition that the
effect of decentralization on economic growth, quality of government, and public goods
provision is better in the case of elected provincial and municipal executives compared to
the case when they are appointed.
Blanchard and Shleifer (2000) built a model to illustrate that in transition
economies the results of economic decentralization may conversely depend on presence
of local elections. An assumption behind their argument is that central governments have
9
higher incentives to promote economic growth than local governments, as the latter are
more likely to be captured.9 In addition, direct administrative subordination internalizes
externalities from local policies. This logic implies that the outcomes of decentralization
would be better in the case of appointed provincial and municipal executives compared to
the case when they are elected. Blanchard and Shleifer argued that the reason for why
decentralization has become a major growth-promoting factor in China and an obstacle to
growth in Russia is the difference in political centralization of these countries: In China
decentralization has taken place under a tight administrative control of the communist
party, while in Yeltsin’s Russia economic decentralization was accompanied by large-
scale political decentralization.
We test Seabright’s and Blanchard and Shleifer’s theories against each other
using dummy variables that tell whether municipal and provincial executives are elected
or appointed as measures of the administrative side of political centralization.10
3. Data
We use data on political institutions, fiscal decentralization, government
performance, economic growth, outcomes of public goods provision, and various control
variables for up to 95 countries for the years 1975-2000.11 Not all the variables are
available for all countries and all years: some regressions cover as few as 50 countries.
The definitions and the sources of all variables are given in Table A2 in appendix.
9 This is a strong assumption (see discussion in Bardhan, 2002). Nonetheless, one can argue that competition for influence on authorities under certain distributions of wealth between and within federal jurisdictions may be much tougher at the central level than at the local level. This means that competition on the national market for capture can substantially reduce captors’ rents leading to breakdown of capture market at the national level, while monopolistic rents of local captors remain intact. 10 Choice between appointing and electing a local public official is a special case of choosing between delegating tasks to bureaucrat or politician (Alesina and Tabellini, 2003). 11 The list of countries that constitute our sample is given in Table A1 in appendix.
10
Summary statistics and correlations between the variables are also presented in appendix
(Tables A3 and A4).
As the main measure of fiscal decentralization we use the share of subnational
revenues in total government revenues. Robustness of results to using the share of
subnational expenditures in total government expenditures as an alternative measure of
fiscal decentralization was verified. The data come from the IMF’s Government Finance
Statistics. These measures are the most commonly used in the empirical literature on the
effects of fiscal decentralization. Although they are highly imperfect and do not reflect
information on the distribution of decision-making authority between the levels of
government, they provide a useful proxy for the relative level of countries’ fiscal
decentralization.12
All measures of political centralization (described in the previous section) were
taken from the Database on Political Institutions (Beck et al., 2001). To check
robustness of results we use the fractionalization of parliament (the probability that any
two members of parliament picked at random belong to different parties) as an alternative
measure of party strength.
As measures of the quality of government we use an index of corruption by
Transparency International and the World Bank indices of control over corruption,
quality of governance, regulatory quality, and rule of law (Kaufmann et al., 2002). To
measure the quality of public goods provision we use data on the DPT immunization,
infant mortality, illiteracy rate, and pupil-to-teacher ratio level from World Development 12 An important shortcoming of these data is that they do not distinguish between state and municipal expenditures and revenues; this breakdown is available only for a very limited number of countries. The share of subnational expenditures is a better measure of fiscal decentralization “on average,” while the subnational revenue share is a better measure of “marginal” fiscal decentralization because in many countries marginal retention rates do not change and are equal to the average share of revenues.
11
Indicators by the World Bank.13 To measure economic growth, changes in GDP per
capita PPP are used.
4. Methodology
We use standard methodology for growth regressions and regressions of the
quality of government (Barro and Sala-i-Martin, 1995; Barro, 1997; Sala-i-Martin, 1997;
La Porta et al., 1999; and Treisman, 2000) and add explanatory variables that describe the
level of fiscal decentralization, political institutions and - in our focus - their interaction
term.
Influence of political institutions on the results of fiscal decentralization, as well
as the quality of our data, may differ for developing and transition countries, on the one
hand, and developed countries, on the other hand. Therefore, we split the sample into
two subsamples: developed countries (the members of the Development Assistance
Committee of OECD and Iceland) and developing and transition countries (all other
countries). Regression analysis is done separately for the two subsamples.14
To analyze the influence of political institutions on the effect of fiscal
decentralization on indices of corruption and governance quality we use the following
cross-section regression model:
iiiiiii еControlбDecentrPolit бDecentrбPolitббY +++++= 54321 * (1)
13 Unlike the other measures of public goods, pupil-to-teacher ratio is not an outcome, but a characteristic of the process that might reflect inefficiencies of resource use rather than quality. For many developing countries, however, number of teachers reflects a binding constraint. We considered and rejected enrollment in schools as another possible measure of the quality of education. It has a nonlinear relationship to the level of education in the country: for countries with high quality of education, it takes values around 100%, while for countries with lower level of education it takes values either lower or higher than 100%. The values are above 100% when adults go to school. 14 Pooling the two subsamples together and allowing only the coefficients of interest to differ between the subsamples is rejected by econometric tests.
12
where Yi is an index of corruption and governance quality for country in year 2001.
Polit
i
i and Decentri denote the variables that describe political institutions and fiscal
decentralization in country i respectively (average for the period 1995-2000). Controli is
the set of control variables that includes logarithm of GDP per capita PPP in 1995,
logarithm of population in 1995, share of Protestants, ethnolinguistic fractionalization,
latitude, legal origin, democratic traditions by the year 1995, and current level of
democracy (average for the period 1995-2000). In these regressions, observations are
weighted by the inverse of the standard errors of indices of corruption and governance
quality, which are provided along with the indices.
To analyze the influence of political institutions on the effect of fiscal
decentralization on economic growth and outcomes of public goods provision we take
two approaches: 1) we study cross-country differences in economic growth and public
goods with cross-section regressions and 2) short-run changes in public goods within
countries with panel-data regressions.15
In cross-section specifications, we use the same regression model (1) in which Yi
stands for the logarithm of change in GDP per capita PPP between 2000 and 1975 or
average measure of public goods for years 1975-2000 in country i; Politi and Decentri
denote the same variables as in (1) but averaged for the period 1975-2000; and Controli is
the set of control variables. Regressions with measures of public goods as dependent
variables include the same control variables as in the regressions for indices of
governance quality where averages taken for the period 1975-2000 and initial values
taken in 1975 or the year closest to it. In the regression for economic growth we add the 15 We were unable to use panel regressions for the analysis of economic growth due to the insufficient number of observations in five-year averaged regressions.
13
level of fixed investments, openness of economy (measured as a share of exports and
imports in GDP filtered for size of country and population), and logarithm of fertility as
control variables. All of these control variables were also measured in 1975 or the year
closest to it.16 In this set of cross-country regressions the weighting was done by the
square root of the number of non-missing observations in the interaction term.
For the subsample of the developing and transition countries in addition to OLS
specification (1), we estimate 2SLS specification that uses the geographical area of
countries as an instrument for fiscal decentralization. We were not able to use the same
instrument for the subsample of developed countries because of insufficiently strong
correlation between the instrument and fiscal decentralization (see discussion in the
section 5.2).
The subsample of developing countries is rather small. To allow for a sufficient
number of degrees of freedom, as a baseline we report results from cross-section
regressions for developed countries that exclude several most insignificant control
variables. As discussed in section 5.1, the results are robust to the choice of control
variables.
We also use panel regressions with fixed effects to estimate short-run changes in
public goods provision:
itttitititititiit dControlDecentrPolitDecentrPolitY ερββββα ++++++= 4321 (2)
where Yit is a measure of an outcome of public goods provision in country and year t .
Polit
i
it and Decentrit denote variables that describe political institutions and fiscal
16 We did not include measures of human development or corruption as control variables in these regressions because, otherwise, possible channels of influence of fiscal decentralization on economic growth would be blocked.
14
decentralization in country i and year ; dt t is a year dummy; iα is a country-specific
fixed effect. Controlit is the set of control variables that includes PPP GDP per capita for
the previous year, logarithm of fertility, and current level of democracy. To eliminate
possible endogeneity we instrument democracy, political institutions, fiscal
decentralization, and their interaction term with lagged values.
In all regressions for developing and transition countries we exclude observations
for socialist countries before the beginning of transition because economic institutions in
these countries (i.e., central planning systems) seem to have different nature.
5. Results
Figures 1 and 2 illustrate our empirical results. The figures present plots of the
residual values from regressions of dependent variables on control variables either as a
function of interaction term of decentralization and party strength (Figure 1) or as a
function of decentralization separately for elected and appointed executives (Figure 2).
Age of main parties
Table 1 presents results for the age of main parties. In the subsample of
developing and transition countries it improves the effect of decentralization on all
indices of government quality except for Transparency International index of corruption.
A 10% increase in decentralization at a level of party age lower than the mean by one
half of its standard deviation leads to a decrease in government quality indices of
approximately one half of their standard deviations, while at a level of age of parties
higher than the mean by the same amount the effect of decentralization is close to zero.
At the mean age of parties, a 10% increase in decentralization leads to a decrease in
indices by quarter of their standard deviations. A threshold level of party age above
15
which decentralization has a positive effect on indices of government quality is such that
about 80% of the developing countries have parties younger than this level. Party age
also improves the effect of decentralization on immunization, infant mortality, and
economic growth in the cross-section regressions.17 From 70% to 90% of the developing
countries have party age above a threshold that makes decentralization beneficial for
public goods provision and economic growth. Results of the panel regressions indicate
that in developing countries the age of parties improves the short run effect of
decentralization on immunization and pupil-to-teacher ratio also.
In the subsample of developed countries, the age of main parties has the opposite
effect to the one in developing countries. We suggest an explanation for this in the
section 6 below. Older parties significantly hamper the effect of decentralization on all
government quality indices (except for the regulatory quality which is insignificant).18
To this date 90% of the developed countries have party age sufficiently young for
revenue decentralization not to have a negative effect on the quality of government.
17 A 10% increase in decentralization at the age of main parties lower than the mean by one half of its standard deviation leads to a decrease in immunization of 11 percentage points, an increase in infant mortality of 0.6 percentage points, and a decrease in 25 years’ economic growth of more than 30%. The same size increase in decentralization at age of main parties higher than the mean by one half of its standard deviation leads to a decrease in immunization of five percentage points, a decrease in infant mortality of 0.2 percentage points, and a decrease in economic growth of 2%. At the mean age of parties, a 10% increase in decentralization decreases immunization by eight percentage points, increases infant mortality by 0.2 percentage points, and decreases long-term growth by 17%. Additional ten years of age of the main parties at the mean level of decentralization lead to an increase in economic growth of 3% and immunization of one percentage point and a decrease in infant mortality of 0.2 percentage points. 18 At a level of age of parties lower than the mean by one half of its standard deviation, a 10% increase in decentralization leads to an increase in the government quality indices of almost one half of their standard deviations. In contrast, at age of parties higher than the mean by one half of its standard deviation, a 10% increase in decentralization leads to a less than 20% of SDs increase in the indices on average. At the mean level of party age, a 10% increase in decentralization leads to a 30% of SDs increase in the indices.
16
In addition, cross-country regressions for developed countries show that party age
hampers the effect of decentralization on infant mortality and economic growth.19 A
threshold level of party age above which decentralization has a negative effect on public
goods and growth is such that more than 80% of the developed countries fall below the
threshold. The only significant result in panel regressions for developed countries is that
party age hampers the effect of revenue decentralization on immunization level.
Fractionalization of government parties
Table 2 presents results for the fractionalization of government parties. In the
subsample of developing and transition countries, fractionalization of government parties
significantly hampers the effect of decentralization on all indices of government quality
(except for Transparency International index of corruption which is insignificant).20
Almost sixty percent of the developing countries in our sample have higher
fractionalization than needed for decentralization to have a positive effect on the quality
of government.
Fractionalization also hampers the effect of decentralization on provision of all
public goods considered and economic growth.21 Almost half of the developing countries
19 A 10% increase in decentralization at age of parties lower than the mean by one half of its standard deviation decreases infant mortality by 0.1 percentage points and increases economic growth by 4%. At age of parties higher than the mean by the same amount, it decreases infant mortality by 0.05 of a percentage point and increases economic growth by less than 1%. 20 A 10% increase in decentralization, at a level of fractionalization lower than the mean by one half of its standard deviation, leads to an increase in government effectiveness of one third of its standard deviation and almost no change in other indices of government quality. In contrast, at a level of fractionalization higher than the mean by one half of its standard deviation, a 10% increase in decentralization leads to no change in government effectiveness and a decrease in other indices of approximately one third of their standard deviations. At the mean level of fractionalization, a 10% increase in decentralization increases the index of government effectiveness and decreases other indices of government quality by approximately 15% of their standard deviations. 21 A 10% increase in decentralization at a level of fractionalization lower than the mean by one half of its standard deviation leads to a 40% increase in 25 years’ economic growth, an increase in the level of immunization of one percentage point, a decrease in infant mortality of 0.6 percentage points, no change in illiteracy level, and a 10% decrease in pupil to teacher ratio. In contrast, at a level of fractionalization
17
have fractionalization above a threshold which makes the effect of decentralization on
immunization, infant mortality, and illiteracy negative, while for the pupil to teacher ratio
and economic growth this share is only 10%. Panel regressions for developing countries
do not contain any significant results.
Cross-section results for developed countries are unrobust to the choice of control
variables and are subject to alternative explanations (see section 5.1 below). Panel results
for developed countries indicate that increased fractionalization hampers the short run
effect of decentralization on infant mortality and pupil to teacher ratio.
State executives appointed/elected
Table 3 presents results for the effect of elections of state executives. The effect
of decentralization on the indices of government effectiveness, regulatory quality, and
rule of law in developing and transition countries is negative and insignificant in the case
of elected state executives and positive insignificant in the case of appointed executives
with a significant difference between them. About 40% of the developing countries have
decentralization below a threshold which makes the quality of government higher in the
case of elected state executives.22
Cross-country regressions show that the effect of decentralization on infant
mortality, illiteracy, and economic growth is negative and insignificant in the case of
higher than the mean by one half of its standard deviation, it leads to a 20% increase in economic growth, a decrease in the level of immunization of three percentage points, a decrease in infant mortality of 0.1 percentage points, a decrease in illiteracy of two percentage points, and a 5% decrease in pupil to teacher ratio. At the mean level of fractionalization, an increase in decentralization by 10% decreases immunization and increases illiteracy by two and one percentage points, respectively, but also decreases infant mortality by 0.3 percentage points and pupil to teacher ratio by 9%, while economic growth increases by 30%. 22 A 10% increase in decentralization in the case of elected state executives decreases these indices by approximately one half of their standard deviations. A comparison of the quality of government for elected and appointed state executives at the mean value of decentralization shows that in the case of elected executives the indices are lower by more than one half of their standard deviations.
18
elected state executives and positive insignificant in the case of appointed executives with
a significant difference between them. More than one half of the developing countries
have decentralization below a threshold which makes the public goods provision and
economic growth higher in the case of elected state executives.23 As discussed in the
section 5.1 below, all panel results for the administrative subordination measures turn out
to be unrobust because of insufficient over-time variation.
In the developed countries, elections of state executives do not significantly affect
decentralization outcomes in the quality of government. The effect of decentralization on
economic growth and alleviation of infant mortality, in the case of appointed state
executives, is significantly positive and, in the case of elected executives, - insignificant
and close to zero, with a statistically significant difference in slopes.24 A threshold level
below which infant mortality is better in the case of elected state executives is such that
about one half of the developed countries are below the threshold. For growth this
proportion is more than 80%.
Municipal executives appointed/elected
Results for subordination of municipal executives are presented in Table 4. The
only significant results for the subsample of developing and transition countries are that
local elections worsen the effect of decentralization on regulation quality, economic
growth and immunization. The effect is positive and insignificant for appointed 23 A 10% increase in revenue decentralization in the case of elected state executives decreases infant mortality by one percentage point and economic growth by 75%. The effect for expenditure decentralization is twice as low. At the mean level of expenditure decentralization in the case of elected state executives infant mortality is higher by 0.6 percentage points and economic growth is higher by 15%. At the mean level of revenue decentralization in the case of elected state executives infant mortality is higher by 0.1 percentage points and economic growth is lower by 6%. 24 In the case of appointed state executives, a 10% increase in subnational revenue share leads to a decrease in infant mortality of 0.2 percentage points and 10% increase in growth. Overall, countries with elected state executives have better outcomes due to sufficiently low mean decentralization: infant mortality is 0.7 percentage points lower and growth rate is 13% higher at the mean level of decentralization.
19
municipal executives and negative and insignificant for the elected local executives with
a significant difference in slopes.25 A threshold level above which immunization and
growth is higher in countries with elected (compared to appointed) municipal executives
is such that more than one half of the developing countries fall below the threshold. For
the regulation quality around 80% of the countries are below the threshold.
The only statistically significant result for developed countries about government
quality is for the government effectiveness index. In the case of elected municipal
executives, the effect of decentralization on government effectiveness is very small,
positive, and insignificant. In the case of appointed executives, it is negative, much larger
in absolute value and also insignificant. The difference between slopes of these effects is
statistically significant. Government effectiveness is better in countries with elected
municipal executives when revenue decentralization is above 26%, leaving more than one
half of the developed countries below the threshold level.26 The cross-section results
about public goods provision are the opposite: local elections worsen the decentralization
outcomes. The effect of decentralization on immunization, infant mortality, and pupil to
teacher ratio in cross-section of developed countries is positive for appointed and elected
executives, but the difference in slopes is significant. The threshold level of
decentralization above which the outcomes for infant mortality and pupil to teacher ratio
are worse in the case of elected municipal executives is such that more than one half of
25 With elected municipal executives, a 10% increase in decentralization leads to a decrease in regulation quality of 15% of standard deviation, 14% drop in immunization level and a 40% fall in growth. At the mean level of decentralization, regulation quality if higher by 75% of standard deviation, immunization level is 8% lower and economic growth is 15% higher in the cash of elected municipal executives. 26 The overall effect of municipal elections on the government effectiveness at the mean of decentralization is negative: the index is more than one half of its standard deviation lower in the case of elected municipal executives.
20
the developed countries fall below the threshold. For immunization almost all the
developed countries are above the threshold.
The next two sections (5.1 and 5.2) discuss robustness of our results with regard
to alternative explanations, influential observations, choice of specifications,
measurement error, sample selection, and endogeneity. Readers not interested in
methodological technicalities can directly skip to section 6 that discusses the results.
5.1. Sensitivity analysis
To check sensitivity of the results with respect to influential observations in cross-
country regressions, we estimated the same model using robust regressions and excluding
China - the most influential observation in cross-section regressions. The results of the
robust regressions in most cases are the same as of the baseline regressions. Several
results become insignificant while preserving the sign of coefficients. Few results -
insignificant in the baseline setting - become significant. All of these results are in line
with the pattern of the baseline estimation. The effect of excluding China is similar.
The results of panel regressions were also tested for presence of influential
observations. By and large, in regressions for the measures of party strength exclusion of
any single country does not lead to significant changes in the magnitude of estimated
coefficients and leaves them inside the initial confidence intervals. In cases when
exclusion of one country made coefficients insignificant, the loss of significance can be
attributed to reduced number of observations and not to the presence of influential
observations.
There is a dichotomy between results for public goods provision in cross-section
and panel regressions for the measures of subordination of subnational authorities. It is
21
particularly striking for elections of state executives: all panel results suggest that
elections lead to better outcomes of decentralization; cross-section results state the
opposite. As it turns out, panel results for subordination are unrobust, have poor
explanatory power, and are subject to reverse causality. First, most of the results about
the effect of decentralization on public goods provision in panel regressions (that indicate
better effect of decentralization in case of elected executives) change sign after the
exclusion of Sweden for developed countries and Iran, Argentina, or Israel for developing
countries. Second, between 97 and 99.99 percent of total explained variation in
dependent variables is accounted for by country fixed effects, in other words, is
essentially left unexplained in the panel regressions for subordination. Yet about 60 to 80
percent of variation in point estimates of country fixed effects is explained by the right
hand side variables from cross-country regressions and the contribution of the cross-term
of political centralization and fiscal decentralization is in range between 1 and 9
percentage points. Note that in panel regressions for party strength, about 12 percent of
explained variation is due to changes in explanatory variables rather than fixed effects
and results of cross-section and panel regressions for party strength are consistent.
Finally, panel results for subordination may be driven by reverse causation as very small
(compared to overall variation) short run changes in dependent variable can influence the
explanatory variables. This situation can occur if national government provides more
financial assistance to the regions that have temporary troubles with public goods
provision in the case of appointed local executives and less assistance in the case when
they are elected. This story produces negative correlation between the short run changes
in fiscal decentralization and public goods in the case of appointed local executives and
22
no significant correlation in the case of elected executives just as panel results suggest.
All the pieces of evidence indicate that we should put emphasis on the cross-section
results for subordination.27
The results proved to be robust to the addition of the following control variables:
initial GDP per capita squared, federation dummy (Treisman, 2000), regional dummies
(Central and Eastern Europe, former Soviet Union, Asia, Africa, Middle East, Latin
America), colonial dummies (British, Spanish, French, and other colonies), average size
of jurisdictions in cross-section regressions, logarithm of population in panel regressions
and interaction term of population and measures of fiscal decentralization in both cross-
country and panel regressions. In addition, results are robust to replacing the across-time
average level of democracy by its initial level in cross-country regressions. After
exclusion of countries with authoritarian regimes from the sample some results lost
significance while most remain significant and consistent with the baseline results.
To check whether the strength of the party system provides political incentives
even in case of appointed executives, we ran the same regressions for the subsample of
developing and transition countries with appointed state executives (other possible
subsamples did not contain sufficient number of observations). Cross-section results in
regressions without instruments for government effectiveness, control over corruption,
rule of law, immunization, and infant mortality remain significant. All other results
become insignificant, while preserving the sign. In the regressions with instruments all
27 If, despite of all said, one takes panel results seriously, the difference between the panel and cross-section results can arise because of a bias in cross-section estimation as a result of unobserved heterogeneity. If this is the case, the true results are produced by the panel regressions. It is, however, hard to believe that local elections provide weaker political incentives in developed countries compared to developing: panel results suggest that decentralization brings inferior outcomes of immunization and infant mortality when subnational officials are elected in the developed countries and superior outcomes in developing countries.
23
the results become insignificant. But since the bias in uninstrumented regressions
attenuates coefficients towards zero (see section 5.2), the loss of significance can be
attributed to insufficient number of observations.
In the beginning of transition, many post-communist countries experienced
“initial” output fall, deterioration in quality of public goods, and economic
decentralization (Roland, 2000). Since we cannot account for the nature of these
processes, we verified that the exclusion of observations for the transition countries
before 1995 does not affect the results.
To make sure that results of panel regressions do not just reflect global trends in
decentralization and its effectiveness for instance, due to better information and
monitoring technologies (De Figueiredo and Weingast, 2002), in addition to year
dummies, we included interaction term of year dummies and decentralization to control
for these trends and got the same results as in the baseline regressions.
The age of parties may reflect the country age or the age of democracy. In this
case institution-building processes that may affect decentralization outcomes could drive
our results based on party age. In order to rule this story out, we included direct
measures of the country age since independence and the age of democracy together with
their interaction terms with fiscal decentralization for all regressions with the party age in
the subsample of developing countries.28 The results proved to be robust.
A potential drawback of fractionalization of government parties as a measure of
party strength is that it may reflect the effects of other political institutions that affect
28 As a proxy for the age of democracy we take the number of years since the democratic regime has been established for the last time as reported in Polity IV data base. The age of democracy takes zero value if the current or any future value of Polity IV measure of democracy is zero. This measure of the age of democracy is only weakly correlated with the age of main parties.
24
both the fractionalization and the results of decentralization. Literature on comparative
politics stresses the systematic differences between party structures – fractionalization, in
particular – in presidential and parliamentary systems (Shugart and Carey, 1992) and
majoritarian and proportional electoral rules (see Duverger, 1972 and Myerson, 1999);
these differences likely but not necessarily reflect party strength (Duverger, 1972).
Moreover, electoral rules and government systems may directly affect corruption
(Myerson, 1999; Persson, Tabellini, and Trebbi, 2003) and public goods provision
(Persson and Tabellini, 1999; Persson, Roland, and Tabellini, 2000). To make sure that
fractionalization of governing parties measures the party strength rather than the effect of
these other institutions we tried each of the following three options. First, we included
dummies for electoral rule and government system as well as their interaction term with
the measures of fiscal decentralization in the set of control variables. Second, we used
the residuals from the regression of government parties’ fractionalization on these
dummy variables as an alternative measure of party strength. Third, for developing
countries we had sufficient number of observations to re-estimate regressions on the
subsample of countries with proportional representation. Each approach produced results
very similar to the baseline.
Another potential drawback of fractionalization of government parties as a
measure of party strength is that high fractionalization may reflect high geographical
segregation of voters with different political preferences. In this case fractionalization of
government parties may capture the existence of secessionist tendencies that can lead to
inefficient fiscal decentralization aimed at appeasing secessionist tendencies. To rule this
explanation out, we, first, control for a dummy variable that tells whether a country has
25
autonomous or self-governing regions and its interaction term with measures of fiscal
decentralization (the Database on Political Institutions, Version 3, Beck et al., 2001).
Our results proved to be robust. Second, we construct a measure of heterogeneity of
voting patterns on national elections across regions and control for it along with its
interaction with fiscal decentralization.29 The results for developing countries again
proved to be robust; while the results for the subsample of developed countries turn out to
be unrobust. After controlling for voting heterogeneity, in developed countries,
government fractionalization impairs the effect of decentralization on public goods
provision, but improves its effect on government quality.
The number of developed countries is small. Thus, the number of degrees of
freedom in cross-country regressions for developed countries may be insufficient if we
include the full set of controls used in the regressions for the subsample of developing
countries. We use the following two alternative strategies to check robustness of the
results for developed countries with respect to the choice of control variables: 1) one-by-
one exclusion of the least statistically significant control variables (with t-statistics less
than unity) from regressions with the full set of controls and 2) one-by-one inclusion of
the most economically and statistically significant control variables to the regressions
starting with no controls. Regardless of the strategy, we get the same results as in
29 The data on regional voting patterns on national elections come from counties’ official electoral committees. The measure of heterogeneity of voting patterns is constructed for each country as
∑∑
∑
= =
⎟⎟⎟⎟⎟
⎠
⎞
⎜⎜⎜⎜⎜
⎝
⎛
−
=n
i
m
j
n
kkj
ij
nm
n
vv
h1 1
2
, where is the percentage of votes for party j in region i, n is the number of regions,
m is the number of parties in a particular country.
ijv
26
regressions with the full set of controls with the only difference that exclusion of
insignificant control variables in some cases makes the results more significant.30
Overall, sensitivity analysis suggests that our results are generally stable with the
exception of cross-section results based on government fractionalization measure in
developed countries and panel results for administrative subordination. All results from
panel and cross-section specifications that proved to be robust are consistent with each
other.
5.2. Endogeneity issues
The most important source of endogeneity is that the quality of government,
economic growth and public goods provision may affect popularity of existing parties
and the strength of country’s party system. Unfortunately, we do not have valid
instruments for political institutions in cross-section regressions. To account for possible
endogeneity we used the initial levels of the age of main parties and government
fractionalization instead of across-time averages in the cross-section analysis. The results
using initial values of political institutions are very similar to those in the baseline
regressions (few results lost significance, however). Still, the initial levels are not a very
good instrument; and possible endogeneity of the strength of political parties is the main
concern for our cross-section results.
Since fiscal decentralization may also be endogenous (Strumpf and Oberholzer-
Gee, 2002 and Fisman and Gatti, 2002), in cross-country regressions we use geographical
area of countries and its interaction term with measures of political centralization as
30 All the results (from the estimation with the full set of controls) preserve their sign and most remain significant with no control variables included into regressions (except for growth regressions where the initial GDP per capita is an important control). All the results become significant after adding two most significant control variables.
27
instruments for fiscal decentralization and the interaction of decentralization and political
institutions.31 The intuition behind this instrument is that, ceteris paribus, costs of
centralized governance increase with geographical size of the country which leads to
higher economic decentralization in countries with larger area. In the subsample of
developing and transition countries geographical area is strongly correlated with fiscal
decentralization. In the subsample of developed countries, however, the correlation is
weaker. As shown in Table A5 in appendix (which reports F-statistics from all the first
stage regressions), residual correlation of our instrument with decentralization in OECD
countries is prohibitively weak in regressions for measures of party strength. Thus, we
report uninstrumented results for the subsample of developed countries. For geographical
area to be a valid instrument, it should be uncorrelated with the independent variables
other than through its effect on fiscal decentralization. Yet, in the long run, geographical
area can be endogenous (Alesina and Spolaore, 1997; Alesina 2003). We assume that 25
years is sufficiently short horizon to treat the area of countries as exogenous.32
Comparison of the results with and without instruments for decentralization shows that
the signs of coefficients are the same and the magnitudes increase considerably (by one
and a half - two times on average). Some of the results that are insignificant in
regressions without instruments become significant with instrumentation. The Hausman
31 Other studies (Fisman and Gatti, 2002; de Mello and Barenstein, 2001) used country legal origin as an instrument. It is not an appropriate choice of instrument in our case because legal origin can affect our dependent variables not through fiscal decentralization but through other channels (La Porta et al., 1999). Our results support this notion because legal origin is significant in regressions that include measures of fiscal decentralization. 32 This assumption is supported by the fact that geographical area is insignificant if added in regressions that include fiscal decentralization. We should note, however, that almost all the countries in our sample for which the area changed since 1975 emerged after the brake up of the former socialist states (Soviet Union, Yugoslavia, and Czechoslovakia). Although their resultant size was historically predetermined, there is a possibility that the brake up and performance of these countries during transition are related in a way that introduces correlation between the geographical area and our dependent variables.
28
test, however, does not reject the hypothesis that both specifications are consistent with
the exception of one regression for GDP growth and party age where the null hypothesis
is rejected. In the regressions for the subsample of developed countries that use
subordination as a measure of political centralization, the results of regressions with and
without instruments are almost identical. (F-statistics are sufficiently high to make this
comparison.) Therefore, we conclude that 1) in developing countries there may be a bias
that attenuates coefficients towards zero, probably, as a result of a measurement error and
2) results for developed countries are unbiased.
Lags are used as instruments in panel regressions for fiscal decentralization,
political centralization, their interaction term, and democracy. For the most part,
instrumentation increases the magnitude of coefficients while preserving their signs. This
is also consistent with the measurement error explanation of the bias. The only exception
is regressions with government fractionalization as a measure of party strength. Use of
instruments in these regressions leads to a negative shift in point estimates of coefficients
(we observe occasional alteration of the sign when coefficients are positive in
uninstrumented regressions). A possible explanation of this bias is as follows. An
increase in economic performance can have different effect on fractionalization of
governing parties in economically centralized and decentralized states. In countries with
low level of decentralization, better performance leads to relative strengthening of the
national governing parties because the success is attributed to national policies. In highly
decentralized countries, voters attribute economic success to regional policies that may
lead to a relative increase in fractionalization of national government parties due to
strengthening of local political organizations. Then, uninstrumented regressions should
29
produce an upward bias in the coefficient of the interaction term between government
fractionalization and fiscal decentralization. This is consistent with our findings.
6. Summary and discussion of empirical results
First we discuss the results about strength of political parties.33 We find very
strong evidence that in developing countries low age of main parties and high
fractionalization of government parties worsen the effect of fiscal decentralization on
economic growth, government quality, and public goods.34 This evidence is a solid
support for Riker’s theory that strong political parties increase political accountability of
subnational governments improving the results of decentralization. In contrast, in
developed countries party age has a negative effect on decentralization results, while
effect of government fractionalization is unrobust. The difference in results for party age
in two subsamples highlights the importance of the level of civic development and
democratic tradition for functioning of political institutions.35 Generally speaking,
political centralization has two effects on political incentives: a beneficial effect of
strengthening career concerns and a possible adverse effect of decreased political
competition. In the two groups of countries the age of main parties captures different
aspects of political centralization. Developed countries are characterized by presence of
a priori strong political incentives compared to developing countries. At this level of
development, an increase in party age primarily reflects a relative decrease in political
competition because it is a sign of insufficient political turnover. In this case, career
33 Table A6 in appendix summarizes all results: it presents signs and significance of coefficients at cross-terms of fiscal decentralization and political institutions. 34 The fact that political institutions affect results of decentralization in the same way for all the outcomes is remarkable because in many contexts there exist a tradeoff between growth and government quality, on the one hand, and public goods provision, on the other hand (Besley and Coate, 2003; Roland 2000). 35 Note that this difference can not be explained by presence of nonlinear effect because the ranges of values of the party age variable in developed and developing countries significantly overlap.
30
concerns effect is also present, but is dominated.36 Under the conditions of low level of
civic capital and absence of long democratic tradition, party strength turns out to have a
much smaller effect on political competition compared to developed countries because
even very weak parties can eliminate political competition by capturing electoral
institutions and media. Russia in the 1990s provides a good example of how local and
regional-level politicians can manage to eliminate political competition altogether with
the help of control over local media and courts. We test validity of this explanation for
the difference in party age results in developed and developing countries by re-estimating
party age regressions separately for subsamples of developing countries with high and
low level of media independence. The results of the text are consistent with our
explanation.37 Thus, an increase in party age in developed countries has an adverse
effect on political incentives because the marginal cost of a decrease in political
competition overweighs the marginal benefit of an increase in career concerns. In
contrast, in developing countries political competition plays little role in disciplining
politicians and career concerns become the source of local political incentives. Overall,
Riker’s theory is confirmed by the evidence from developing countries.
36 Government fractionalization captures both career concerns and political competition effects because it reflects political weight of an average governing party. Note that fractionalization may reflect both an increase and a decrease in political competition. The latter could happen when the largest governing party retains the same-size fraction in parliament and the other parties get more fractionalized. 37 In the subsample of developing countries with freedom of press below the median (measured by the Freedom House index, www.freedomhouse.com), we find some evidence in line with the overall results for developing countries: higher party age improves the effect of decentralization for TI index of corruption and immunization level. In contrast, the evidence from the subsample of developing countries with press freedom above the median resembles the results for developed countries: party age worsens the effect of decentralization on TI corruption index, regulatory quality, and pupil to teacher ratio. The results of this test at best should be viewed as weak tentative evidence in favor of our explanation because the number of degrees of freedom in these regressions is very small. Press freedom index included directly or as interaction in the regressions is insignificant, which may be explained by the unreliable cardinal properties of the index.
31

Let us turn to the discussion of results about the effect of subnational elections.
The cross-section results for developing countries sharply contrast with the view that
local elections provide sufficient political accountability. Elections of state executive
officials worsen the effect of decentralization on quality of government, public goods
provision, and economic growth in developing countries. Municipal elections also
significantly hurt decentralization results for economic growth and provision of some
public goods. The net effect of elections, however, is positive for almost one half of the
developing countries that have sufficiently low decentralization.38 Subnational elections
do not result in better decentralization outcomes in developing countries because of
localism, relatively high capture, and provincial protectionism (Bardhan, 2002).
The results for developed countries are mixed. There is evidence of a negative
effect of subnational elections on the decentralization outcomes for growth,
immunization, and infant mortality. Yet, there is a small positive effect of
decentralization on quality of governance: municipal elections significantly improve the
results of revenue decentralization for government effectiveness (in all other regressions,
cross-terms of government quality indices with municipal elections have positive
insignificant coefficients). Overall, we find that elections have a better effect on
accountability in developed compared to developing and transition countries.39
38 Local elections have independent of decentralization effect on governance. First, they help the government to gather and aggregate information about people’s preferences. Second, they have an important influence on development of civil society. 39 Besley and Coate (2003) compare performance of elected to appointed regulators in the US electricity sector and find that elected regulators ensure lower consumer prices but not necessarily better quality of service.
32
7. Conclusions
Our key finding is that political institutions - in particular, political centralization
- play an important role in determining the results of fiscal decentralization. In line with
the theory of Riker (1964) we find that strong national party system is a very effective
way of securing political accountability needed for efficient decentralization in
developing countries. There is no straightforward relationship between party strength
and results of decentralization in developed countries; political centralization has two
effects that work in opposite directions: weakening of political competition and
strengthening of career concerns.
Constitutional and administrative arrangements that make local executives
directly subordinate to the higher-level authorities also were found to improve political
incentives in decentralization (Blanchard and Shleifer, 2000). This, however, does not
mean that a policy prescription for a large inherently decentralized country should be to
get rid of subnational elections. First, local elections have a substantial (independent of
decentralization) positive effect on many economic outcomes. Second, they are a
necessary prerequisite to developing democratic tradition, civil society, and other
components of civic capital accumulation. Third, politicians at all levels of government
may be subject to capture, and therefore, administrative control of local by central
officials does not necessarily align interest of local bureaucrats with the public (Bardhan
and Mookherjee, 1999).
Thus, a better remedy to poor governance in inherently decentralized countries is
building strong national political parties. Strong parties help to provide elected local
officials with efficient political incentives because their chances of reelection depend
33
both on the national party support (i.e., national objectives) and the satisfaction of local
constituency (i.e., local accountability).
Fiscal decentralization and political institutions affect one another and are
influenced by many other factors. Accounting for the determinants of fiscal
decentralization and political institutions is the task for future research.
References 1. Aghion, P, Alesina, A., Trebbi, F. (2002) “Endogenous Political Institutions,” NBER
Working Paper #9006,
2. Akai, N., Sakata M. (2002) “Fiscal Decentralization Contributes to Economic Growth: Evidence from State-level Cross-section Data for the United States,” Journal of Urban Economics, 52(1), 93-108.
3. Alesina, A. (2003) “The Size of Countries: Does It Matter?” Journal of the European Economic Association, 1, 301-316.
4. Alesina, A., Devleeschauwer, A., Easterly, W., Kurlat, S., Wacziarg, R. (2003) “Fractionalization,” Journal of Economic Growth, 8, 155-94.
5. Alesina, A., Tabellini, G. (2003) “Bureaucrats of Politicians?” Harvard University, Mimeo.
6. Alesina, A., Spolaore, E. (1997) “On the Number and Size of Nations,” Quarterly Journal of Economics, 112, 1027-56.
7. Bardhan, P., Mookherjee, D. (1999) “Relative Capture of Local and Central Governments,” Mimeo.
8. Bardhan, P. (2002) “Decentralization of Governance and Development,” Journal of Economic Perspectives, 16(4), 185-205.
9. Barro, R. (1997) Determinants of economic growth: a cross-country empirical study. MIT Press, Cambridge, MA.
10. Barro, R., Sala-i-Martin, X. (1995) “Economic Growth,” McGraw Hill.
11. Beck, T., Clarke, G., Groff, A., Keefer, P., Walsh, P. (2001). "New Tools in Comparative Political Economy: The Database of Political Institutions," World Bank Economic Review, 15(1), 165-176.
12. Besley, T., Case, A. (1995) “Does Political Accountability Affect Economic Policy Choices? Evidence from Gubernatorial Term Limits,” Quarterly Journal of Economics, 110, 769-798.
13. Besley, T., Coate, S. (2003) “Elected versus Appointed Regulators: Theory and Evidence,” Journal of the European Economic Association, forthcoming.
34
14. Blanchard, O., Shleifer, A. (2000) “Fiscal Federalism with and without Political Centralization. China versus Russia,” NBER Working Paper #7616.
15. Bossert, T., Larranaga, O., Giedion, U., Arbelaez, J., Bowser, D. (2003) “Decentralization and equity of resource allocation: evidence from Colombia and Chile,” Bulletin of the World Health Organization, 81(2), 95-100.
16. Cai, H., Treisman, D. (2004) “State Corroding Federalism,” Journal of Public Economics, forthcoming.
17. Camp, R. (1998) “Battling for the Voters: Elections, Parties, and Democracy in Mexico.” In Kurt Von Mettenheim and James Malloy (eds.), Deepening of Democracy in Latin America. Pittsburgh: University of Pittsburgh Press.
18. Carrion, J. F. (1998) “Partisan Decline and Presidential Popularity: The Politics & Economics of Representation in Peru, 1980-1993,” In Kurt Von Mettenheim and James Malloy (eds.), Deepening of Democracy in Latin America. Pittsburgh: University of Pittsburgh Press.
19. Corrales, J. (2002) Presidents Without Parties: the Politics of Economic Reform in Argentina and Venezuela in the 1990s. Pennsylvania State University Press, University Park.
20. Davodi, H., Zou, H. (1998) “Fiscal Decentralization and Economic Growth: A Cross-Country Study,” Journal of Urban Economics, 43, 244-257.
21. Diaz-Cayeros, A., Magaloni, B., Weingast, B.R. (2003) “Democratization and the Economy in Mexico: Equilibrium (PRI) Hegemony and its Demise,” Mimeo.
22. Duverger, M. (1972) “Factors in a Two-Party and Multiparty System,” in Party Politics and Pressure Groups, New York: Thomas Y. Crowell, pp. 23-32.
23. de Figueiredo, Jr., R., Weingast, B. (2002) “Self-Enforcing Federalism,” Working Paper, Hoover Institution, Stanford University.
24. Fisman, R., Gatti, R. (2002) “Decentralization and Corruption: Evidence across Countries,” Journal of Public Economics, 83(3), 325-346.
25. Jin, H., Qian, Y., Weingast, B. (1999) “Regional Decentralization and Fiscal Incentives: Federalism Chinese Style,” Mimeo.
26. Huntington, S. P. (1968) “Political Order in Changing Societies,” Yale University Press, New Haven.
27. Kaufmann, D., Kraay, A., Zoido-Lobaton, P. (2002) “Governance Matters II: Updated Indicators for 2000-01,” World Bank, Policy Research Working Paper #2772.
28. La Porta, R., Lopez-de-Silanes F., Shleifer, A., Vishny, R. (1999) “The Quality of Government,” Journal of Law, Economics, and Organization.
29. Lin, J.Y., Liu, Z. (2000) “Fiscal Decentralization and Economic Growth in China,” Economic Development and Cultural Change, 49 (1), 1-22.
35
30. Londregan, J. (2000) Legislative Institutions and Ideology in Chile’s Democratic Tradition. Cambridge University Press, New York.
31. Maskin, E., Qian, Y., Xu, C. (2000) “Incentives, Information, and Organizational Form,” Review of Economic Studies, 67(2), 359-378.
32. de Mello, L., Barenstein, M. (2001) “Fiscal Decentralization and Governance: a Cross-Country Analysis,” IMF Working Paper, WP/01/71.
33. Myerson, R. (1999) “Theoretical Comparison of Electoral Systems: 1998 Schumpeter Lecture,” European Economic Review 43: 671-697.
34. Musgrave, R.A. (1969) “Theories of Fiscal Federalism,” Public Finances/Finances Publiques, 4, no. 24, 521-532.
35. Nickson, R.A. (1995) “Local Government in Latin America,” Boulder, Colo., Lynne Rienner.
36. Oates, W. (1972) Fiscal Federalism. Harcourt, New York.
37. Parry, T. (1997) “Achieving Balance in Decentralization: A Case Study of Education Decentralization in Chile,” World Development, 25(2), 211-225.
38. Persson, T., Tabellini, G. (1999) “The Size and Scope of Government: Comparative Politics with Rational Politicians: 1998 Marshall Lecture,” European Economic Review 43: 699-735.
39. Persson, T., Tabellini, G. (2000) Political Economics: Explaining Economic Policy, MIT Press, Cambridge, MA.
40. Persson, T., Tabellini, G., Trebbi, F. (2003) “Electoral Rules and Corruption,” Journal of the European Economic Association, 1, 958-989.
41. Persson, T., Roland, G., Tabellini, G. (2000) "Comparative Politics and Public Finance," Journal of Political Economy. 108: 1121-1161.
42. Qian, Y., Roland, G. (1998), "Federalism and the Soft Budget Constraint," American Economic Review, 88(5), 1143-1162.
43. Qian, Y., Weingast, В. (1996) “China's Transition to Markets: Market-Preserving Federalism, Chinese Style,” Journal of Policy Reform, 1, 149-185.
44. Riker, W. (1964) “Federalism: Origins, Operation, Significance,” Little, Brown and Co, Boston, MA.
45. Robalino, D., Picazo, O., Voetberg, A. (2001) “Does Fiscal Decentralization Improve Health Outcomes? Evidence from Cross-Country Analysis,” World Bank: Policy Research Working Paper #2565.
46. Roland, G. (2000) Transition and Economics: Politics, Markets, and Firms. MIT Press, Cambridge, MA.
47. Roland, G., Zapata, J.G. (2000) “Colombia’s Electoral and Party System: Proposal for Reforms,” Mimeo.
36
48. Sala-i-Martin, X. (1997) “I Just Ran Two Million Regressions,” The American Economic Review, 87:2, 178-183.
49. Seabright, P. (1996) “Accountability and Decentralization in Government: An Incomplete Contract Model,” European Economic Review, 40, 61-89.
50. Shachar, R. (2003) "Party Loyalty as Habit Formation," Journal of Applied Econometrics, forthcoming 18 (3).
51. Shugart, M. S., and Carey, J.M. (1992) Presidents and Assemblies: Constitutional Design and Electoral Dynamics. New York: Cambridge University Press.
52. Sonin, K. (2003) “Provincial Protectionism,” CEFIR Mimeo.
53. Strumpf, K., Oberholzer-Gee, F. (2002), "Endogenous Policy Decentralization: Testing the Central Tenet of Economic Federalism," Journal of Political Economy, 110 (1), 1-36.
54. Tanzi, V. (1996) “Fiscal Federalism and Decentralization: A Review of some Efficiency and Macroeconomic Aspects,” Annual World Bank Conference on Development Economics, 1995. World Bank, Washington, DC, 295-316.
55. Tiebout, C. (1956) “A Pure Theory of Local Expenditures,” Journal of Political Economy, 64 (5), 416-424.
56. Tommasi, M., Saiegh, S., Sanguinetti, P. (2001) “Fiscal Federalism in Argentina: Policies, Politics, and Institutional Reform,” Economia, 1(2), 157-211.
57. Treisman, D. (2000) “Decentralization and the Quality of Government,” Mimeo, UCLA.
58. Uslaner, E. (2000) “Strong Institutions, Weak Parties: The Paradox of Canadian Political Parties,” Mimeo, University of Maryland–College Park.
59. Winkler, R.W., Rounds, T. (1996) “Municipal and Private Sector Response to Decentralization and School Choice – Chile,” Economics of Education Review, 15 (4), 365-376.
60. Woller, G.M., Phillips, K. (1998) “Fiscal Decentralization and LDC Economic Growth: An Empirical Investigation,” Journal of Development Studies, 34(4), 139-148.
61. Xie, D., Zou, H., Davoodi, H. (1999) “Fiscal Decentralization and Economic Growth in the United States,” Journal of Urban Economics, 45,228-239.
62. Zhang, T., Zou, H. (1998) “Fiscal Decentralization, Public Spending, and Economic Growth in China,” Journal of Public Economics, 67, 221-240.
63. Zhuravskaya, E. (2000) “Incentives to Provide Local Public Goods: Fiscal Federalism Russian Style,” Journal of Public Economics, 76 (3).
37
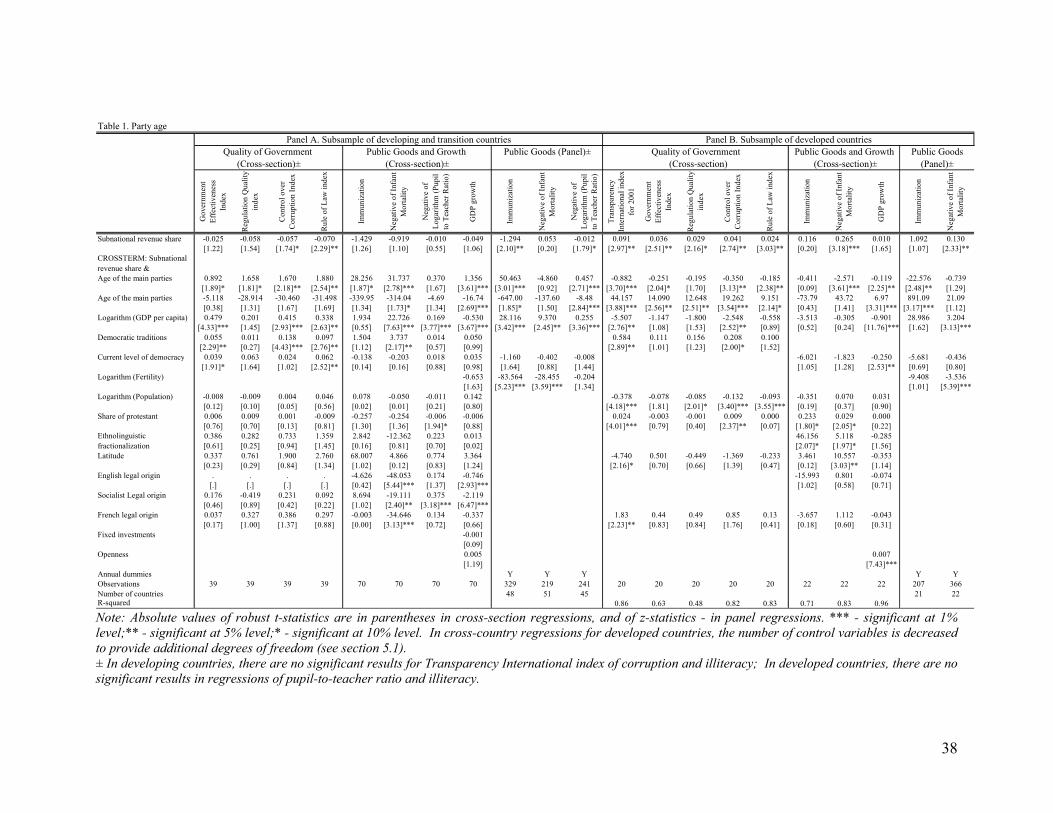
Table 1. Party age
Gov
ernm
ent
Effe
ctiv
enes
s In
dex
Reg
ulat
ion
Qua
lity
inde
x
Con
trol o
ver
Cor
rupt
ion
Inde
x
Rul
e of
Law
inde
x
Imm
uniz
atio
n
Neg
ativ
e of
Infa
nt
Mor
talit
y
Neg
ativ
e of
Lo
garit
hm (P
upil
to
Tea
cher
Rat
io)
GD
P gr
owth
Imm
uniz
atio
n
Neg
ativ
e of
Infa
nt
Mor
talit
y
Neg
ativ
e of
Lo
garit
hm (P
upil
to T
each
er R
atio
)
Tran
spar
ency
In
tern
atio
nal i
ndex
fo
r 200
1
Gov
ernm
ent
Effe
ctiv
enes
s In
dex
Reg
ulat
ion
Qua
lity
inde
x
Con
trol o
ver
Cor
rupt
ion
Inde
x
Rul
e of
Law
inde
x
Imm
uniz
atio
n
Neg
ativ
e of
Infa
nt
Mor
talit
y
GD
P gr
owth
Imm
uniz
atio
n
Neg
ativ
e of
Infa
nt
Mor
talit
y
Subnational revenue share -0.025 -0.058 -0.057 -0.070 -1.429 -0.919 -0.010 -0.049 -1.294 0.053 -0.012 0.091 0.036 0.029 0.041 0.024 0.116 0.265 0.010 1.092 0.130[1.22] [1.54] [1.74]* [2.29]** [1.26] [1.10] [0.55] [1.06] [2.10]** [0.20] [1.79]* [2.97]** [2.51]** [2.16]* [2.74]** [3.03]** [0.20] [3.18]*** [1.65] [1.07] [2.33]**
CROSSTERM: Subnational revenue share &Age of the main parties 0.892 1.658 1.670 1.880 28.256 31.737 0.370 1.356 50.463 -4.860 0.457 -0.882 -0.251 -0.195 -0.350 -0.185 -0.411 -2.571 -0.119 -22.576 -0.739
[1.89]* [1.81]* [2.18]** [2.54]** [1.87]* [2.78]*** [1.67] [3.61]*** [3.01]*** [0.92] [2.71]*** [3.70]*** [2.04]* [1.70] [3.13]** [2.38]** [0.09] [3.61]*** [2.25]** [2.48]** [1.29]Age of the main parties -5.118 -28.914 -30.460 -31.498 -339.95 -314.04 -4.69 -16.74 -647.00 -137.60 -8.48 44.157 14.090 12.648 19.262 9.151 -73.79 43.72 6.97 891.09 21.09
[0.38] [1.31] [1.67] [1.69] [1.34] [1.73]* [1.34] [2.69]*** [1.85]* [1.50] [2.84]*** [3.88]*** [2.56]** [2.51]** [3.54]*** [2.14]* [0.43] [1.41] [3.31]*** [3.17]*** [1.12]Logarithm (GDP per capita) 0.479 0.201 0.415 0.338 1.934 22.726 0.169 -0.530 28.116 9.370 0.255 -5.507 -1.147 -1.800 -2.548 -0.558 -3.513 -0.305 -0.901 28.986 3.204
[4.33]*** [1.45] [2.93]*** [2.63]** [0.55] [7.63]*** [3.77]*** [3.67]*** [3.42]*** [2.45]** [3.36]*** [2.76]** [1.08] [1.53] [2.52]** [0.89] [0.52] [0.24] [11.76]*** [1.62] [3.13]***Democratic traditions 0.055 0.011 0.138 0.097 1.504 3.737 0.014 0.050 0.584 0.111 0.156 0.208 0.100
[2.29]** [0.27] [4.43]*** [2.76]** [1.12] [2.17]** [0.57] [0.99] [2.89]** [1.01] [1.23] [2.00]* [1.52]Current level of democracy 0.039 0.063 0.024 0.062 -0.138 -0.203 0.018 0.035 -1.160 -0.402 -0.008 -6.021 -1.823 -0.250 -5.681 -0.436
[1.91]* [1.64] [1.02] [2.52]** [0.14] [0.16] [0.88] [0.98] [1.64] [0.88] [1.44] [1.05] [1.28] [2.53]** [0.69] [0.80]Logarithm (Fertility) -0.653 -83.564 -28.455 -0.204 -9.408 -3.536
[1.63] [5.23]*** [3.59]*** [1.34] [1.01] [5.39]***Logarithm (Population) -0.008 -0.009 0.004 0.046 0.078 -0.050 -0.011 0.142 -0.378 -0.078 -0.085 -0.132 -0.093 -0.351 0.070 0.031
[0.12] [0.10] [0.05] [0.56] [0.02] [0.01] [0.21] [0.80] [4.18]*** [1.81] [2.01]* [3.40]*** [3.55]*** [0.19] [0.37] [0.90]Share of protestant 0.006 0.009 0.001 -0.009 -0.257 -0.254 -0.006 -0.006 0.024 -0.003 -0.001 0.009 0.000 0.233 0.029 0.000
[0.76] [0.70] [0.13] [0.81] [1.30] [1.36] [1.94]* [0.88] [4.01]*** [0.79] [0.40] [2.37]** [0.07] [1.80]* [2.05]* [0.22]0.386 0.282 0.733 1.359 2.842 -12.362 0.223 0.013 46.156 5.118 -0.285[0.61] [0.25] [0.94] [1.45] [0.16] [0.81] [0.70] [0.02] [2.07]* [1.97]* [1.56]
Latitude 0.337 0.761 1.900 2.760 68.007 4.866 0.774 3.364 -4.740 0.501 -0.449 -1.369 -0.233 3.461 10.557 -0.353[0.23] [0.29] [0.84] [1.34] [1.02] [0.12] [0.83] [1.24] [2.16]* [0.70] [0.66] [1.39] [0.47] [0.12] [3.03]** [1.14]
English legal origin . . . . -4.626 -48.053 0.174 -0.746 -15.993 0.801 -0.074[.] [.] [.] [.] [0.42] [5.44]*** [1.37] [2.93]*** [1.02] [0.58] [0.71]
Socialist Legal origin 0.176 -0.419 0.231 0.092 8.694 -19.111 0.375 -2.119[0.46] [0.89] [0.42] [0.22] [1.02] [2.40]** [3.18]*** [6.47]***
French legal origin 0.037 0.327 0.386 0.297 -0.003 -34.646 0.134 -0.337 1.83 0.44 0.49 0.85 0.13 -3.657 1.112 -0.043[0.17] [1.00] [1.37] [0.88] [0.00] [3.13]*** [0.72] [0.66] [2.23]** [0.83] [0.84] [1.76] [0.41] [0.18] [0.60] [0.31]
Fixed investments -0.001[0.09]
Openness 0.005 0.007[1.19] [7.43]***
Annual dummies Y Y Y Y YObservations 39 39 39 39 70 70 70 70 329 219 241 20 20 20 20 20 22 22 22 207 366Number of countries 48 51 45 21 22R-squared 0.86 0.63 0.48 0.82 0.83 0.71 0.83 0.96
Panel B. Subsample of developed countriesQuality of Government
(Cross-section)±Public Goods and Growth Public Goods (Panel)± Quality of Government
(Cross-section)Public Goods and Growth
Ethnolinguistic fractionalization
Panel A. Subsample of developing and transition countries
(Cross-section)±Public Goods
(Cross-section)± (Panel)±
Note: Absolute values of robust t-statistics are in parentheses in cross-section regressions, and of z-statistics - in panel regressions. *** - significant at 1% level;** - significant at 5% level;* - significant at 10% level. In cross-country regressions for developed countries, the number of control variables is decreased to provide additional degrees of freedom (see section 5.1). ± In developing countries, there are no significant results for Transparency International index of corruption and illiteracy; In developed countries, there are no significant results in regressions of pupil-to-teacher ratio and illiteracy.
38
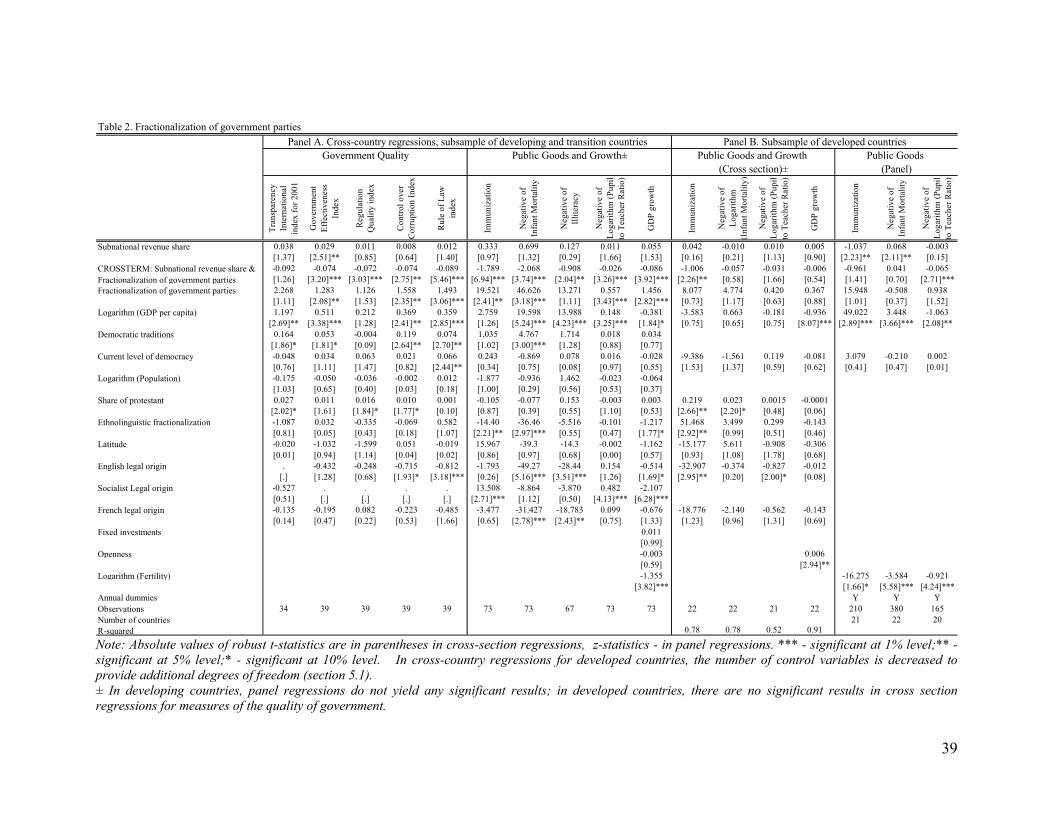
Table 2. Fractionalization of government parties
Tran
spar
ency
In
tern
atio
nal
inde
x fo
r 200
1
Gov
ernm
ent
Effe
ctiv
enes
s In
dex
Reg
ulat
ion
Qua
lity
inde
x
Con
trol o
ver
Cor
rupt
ion
Inde
x
Rul
e of
Law
in
dex
Imm
uniz
atio
n
Neg
ativ
e of
In
fant
Mor
talit
y
Neg
ativ
e of
Ill
itera
cy
Neg
ativ
e of
Lo
garit
hm (P
upil
to T
each
er R
atio
)
GD
P gr
owth
Imm
uniz
atio
n
Neg
ativ
e of
Lo
garit
hm
(Inf
ant M
orta
lity)
Neg
ativ
e of
Lo
garit
hm (P
upil
to T
each
er R
atio
)
GD
P gr
owth
Imm
uniz
atio
n
Neg
ativ
e of
In
fant
Mor
talit
y
Neg
ativ
e of
Lo
garit
hm (P
upil
to T
each
er R
atio
)
Subnational revenue share 0.038 0.029 0.011 0.008 0.012 0.333 0.699 0.127 0.011 0.055 0.042 -0.010 0.010 0.005 -1.037 0.068 -0.003[1.37] [2.51]** [0.85] [0.64] [1.40] [0.97] [1.32] [0.29] [1.66] [1.53] [0.16] [0.21] [1.13] [0.90] [2.23]** [2.11]** [0.15]-0.092 -0.074 -0.072 -0.074 -0.089 -1.789 -2.068 -0.908 -0.026 -0.086 -1.006 -0.057 -0.031 -0.006 -0.961 0.041 -0.065[1.26] [3.20]*** [3.03]*** [2.75]** [5.46]*** [6.94]*** [3.74]*** [2.04]** [3.26]*** [3.92]*** [2.26]** [0.58] [1.66] [0.54] [1.41] [0.70] [2.71]***2.268 1.283 1.126 1.558 1.493 19.521 46.626 13.271 0.557 1.456 8.077 4.774 0.420 0.367 15.948 -0.508 0.938[1.11] [2.08]** [1.53] [2.35]** [3.06]*** [2.41]** [3.18]*** [1.11] [3.43]*** [2.82]*** [0.73] [1.17] [0.63] [0.88] [1.01] [0.37] [1.52]
Logarithm (GDP per capita) 1.197 0.511 0.212 0.369 0.359 2.759 19.598 13.988 0.148 -0.381 -3.583 0.663 -0.181 -0.936 49.022 3.448 -1.063[2.69]** [3.38]*** [1.28] [2.41]** [2.85]*** [1.26] [5.24]*** [4.23]*** [3.25]*** [1.84]* [0.75] [0.65] [0.75] [8.07]*** [2.89]*** [3.66]*** [2.08]**
Democratic traditions 0.164 0.053 -0.004 0.119 0.074 1.035 4.767 1.714 0.018 0.034[1.86]* [1.81]* [0.09] [2.64]** [2.70]** [1.02] [3.00]*** [1.28] [0.88] [0.77]
Current level of democracy -0.048 0.034 0.063 0.021 0.066 0.243 -0.869 0.078 0.016 -0.028 -9.386 -1.561 0.119 -0.081 3.079 -0.210 0.002[0.76] [1.11] [1.47] [0.82] [2.44]** [0.34] [0.75] [0.08] [0.97] [0.55] [1.53] [1.37] [0.59] [0.62] [0.41] [0.47] [0.01]
Logarithm (Population) -0.175 -0.050 -0.036 -0.002 0.012 -1.877 -0.936 1.462 -0.023 -0.064[1.03] [0.65] [0.40] [0.03] [0.18] [1.00] [0.29] [0.56] [0.53] [0.37]
Share of protestant 0.027 0.011 0.016 0.010 0.001 -0.105 -0.077 0.153 -0.003 0.003 0.219 0.023 0.0015 -0.0001[2.02]* [1.61] [1.84]* [1.77]* [0.10] [0.87] [0.39] [0.55] [1.10] [0.53] [2.66]** [2.20]* [0.48] [0.06]
Ethnolinguistic fractionalization -1.087 0.032 -0.335 -0.069 0.582 -14.40 -36.46 -5.516 -0.101 -1.217 51.468 3.499 0.299 -0.143[0.81] [0.05] [0.43] [0.18] [1.07] [2.21]** [2.97]*** [0.55] [0.47] [1.77]* [2.92]** [0.99] [0.51] [0.46]
Latitude -0.020 -1.032 -1.599 0.051 -0.019 15.967 -39.3 -14.3 -0.002 -1.162 -15.177 5.611 -0.908 -0.306[0.01] [0.94] [1.14] [0.04] [0.02] [0.86] [0.97] [0.68] [0.00] [0.57] [0.93] [1.08] [1.78] [0.68]
English legal origin . -0.432 -0.248 -0.715 -0.812 -1.793 -49.27 -28.44 0.154 -0.514 -32.907 -0.374 -0.827 -0.012[.] [1.28] [0.68] [1.93]* [3.18]*** [0.26] [5.16]*** [3.51]*** [1.26] [1.69]* [2.95]** [0.20] [2.00]* [0.08]
Socialist Legal origin -0.527 . . . . 13.508 -8.864 -3.870 0.482 -2.107[0.51] [.] [.] [.] [.] [2.71]*** [1.12] [0.50] [4.13]*** [6.28]***
French legal origin -0.135 -0.195 0.082 -0.223 -0.485 -3.477 -31.427 -18.783 0.099 -0.676 -18.776 -2.140 -0.562 -0.143[0.14] [0.47] [0.22] [0.53] [1.66] [0.65] [2.78]*** [2.43]** [0.75] [1.33] [1.23] [0.96] [1.31] [0.69]
Fixed investments 0.011[0.99]
Openness -0.003 0.006[0.59] [2.94]**
Logarithm (Fertility) -1.355 -16.275 -3.584 -0.921[3.82]*** [1.66]* [5.58]*** [4.24]***
Annual dummies Y Y YObservations 34 39 39 39 39 73 73 67 73 73 22 22 21 22 210 380 165Number of countries 21 22 20R-squared 0.78 0.78 0.52 0.91
Panel A. Cross-country regressions, subsample of developing and transition countries Panel B. Subsample of developed countriesPublic Goods and Growth
(Cross section)±Public Goods
(Panel)Public Goods and Growth±Government Quality
Fractionalization of government parties
CROSSTERM: Subnational revenue share & Fractionalization of government parties
Note: Absolute values of robust t-statistics are in parentheses in cross-section regressions, z-statistics - in panel regressions. *** - significant at 1% level;** - significant at 5% level;* - significant at 10% level. In cross-country regressions for developed countries, the number of control variables is decreased to provide additional degrees of freedom (section 5.1). ± In developing countries, panel regressions do not yield any significant results; in developed countries, there are no significant results in cross section regressions for measures of the quality of government.
39
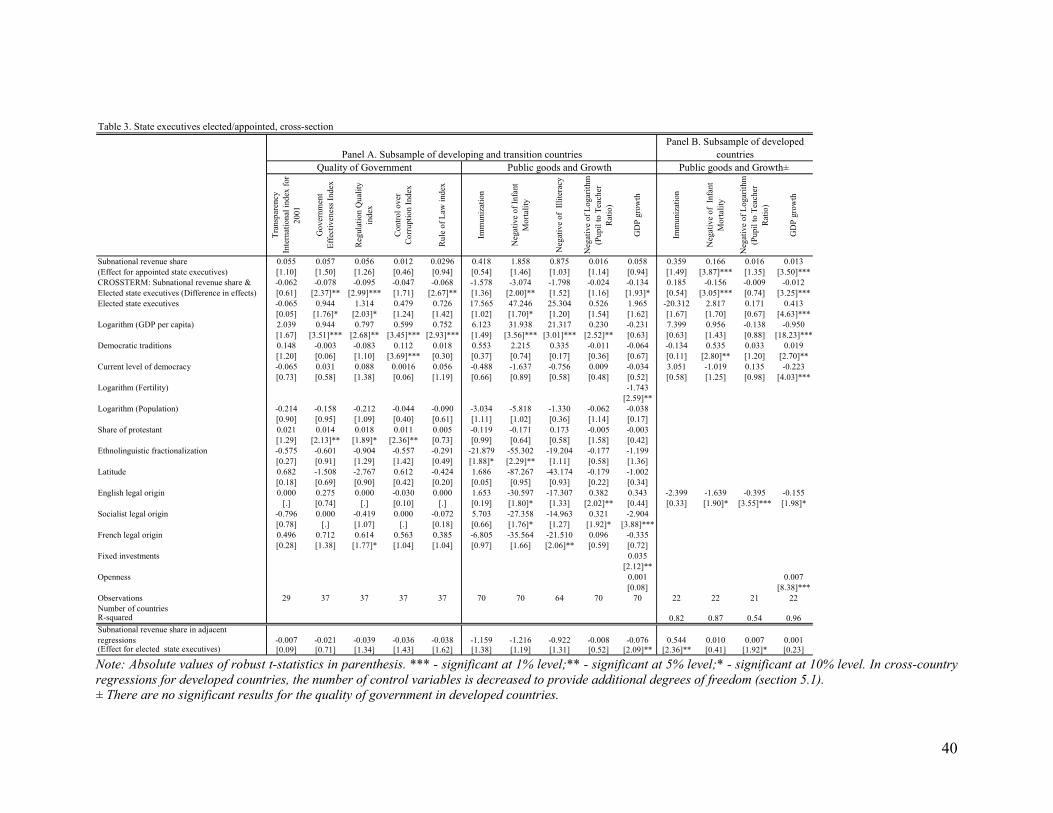
Table 3. State executives elected/appointed, cross-section
Tran
spar
ency
In
tern
atio
nal i
ndex
for
2001
Gov
ernm
ent
Effe
ctiv
enes
s Ind
ex
Reg
ulat
ion
Qua
lity
inde
x
Con
trol o
ver
Cor
rupt
ion
Inde
x
Rul
e of
Law
inde
x
Imm
uniz
atio
n
Neg
ativ
e of
Infa
nt
Mor
talit
y
Neg
ativ
e of
Illi
tera
cy
Neg
ativ
e of
Log
arith
m
(Pup
il to
Tea
cher
R
atio
)
GD
P gr
owth
Imm
uniz
atio
n
Neg
ativ
e of
Inf
ant
Mor
talit
y
Neg
ativ
e of
Log
arith
m
(Pup
il to
Tea
cher
R
atio
)
GD
P gr
owth
Subnational revenue share 0.055 0.057 0.056 0.012 0.0296 0.418 1.858 0.875 0.016 0.058 0.359 0.166 0.016 0.013(Effect for appointed state executives) [1.10] [1.50] [1.26] [0.46] [0.94] [0.54] [1.46] [1.03] [1.14] [0.94] [1.49] [3.87]*** [1.35] [3.50]***CROSSTERM: Subnational revenue share & -0.062 -0.078 -0.095 -0.047 -0.068 -1.578 -3.074 -1.798 -0.024 -0.134 0.185 -0.156 -0.009 -0.012Elected state executives (Difference in effects) [0.61] [2.37]** [2.99]*** [1.71] [2.67]** [1.36] [2.00]** [1.52] [1.16] [1.93]* [0.54] [3.05]*** [0.74] [3.25]***Elected state executives -0.065 0.944 1.314 0.479 0.726 17.565 47.246 25.304 0.526 1.965 -20.312 2.817 0.171 0.413
[0.05] [1.76]* [2.03]* [1.24] [1.42] [1.02] [1.70]* [1.20] [1.54] [1.62] [1.67] [1.70] [0.67] [4.63]***Logarithm (GDP per capita) 2.039 0.944 0.797 0.599 0.752 6.123 31.938 21.317 0.230 -0.231 7.399 0.956 -0.138 -0.950
[1.67] [3.51]*** [2.68]** [3.45]*** [2.93]*** [1.49] [3.56]*** [3.01]*** [2.52]** [0.63] [0.63] [1.43] [0.88] [18.23]***Democratic traditions 0.148 -0.003 -0.083 0.112 0.018 0.553 2.215 0.335 -0.011 -0.064 -0.134 0.535 0.033 0.019
[1.20] [0.06] [1.10] [3.69]*** [0.30] [0.37] [0.74] [0.17] [0.36] [0.67] [0.11] [2.80]** [1.20] [2.70]**Current level of democracy -0.065 0.031 0.088 0.0016 0.056 -0.488 -1.637 -0.756 0.009 -0.034 3.051 -1.019 0.135 -0.223
[0.73] [0.58] [1.38] [0.06] [1.19] [0.66] [0.89] [0.58] [0.48] [0.52] [0.58] [1.25] [0.98] [4.03]***Logarithm (Fertility) -1.743
[2.59]**Logarithm (Population) -0.214 -0.158 -0.212 -0.044 -0.090 -3.034 -5.818 -1.330 -0.062 -0.038
[0.90] [0.95] [1.09] [0.40] [0.61] [1.11] [1.02] [0.36] [1.14] [0.17]Share of protestant 0.021 0.014 0.018 0.011 0.005 -0.119 -0.171 0.173 -0.005 -0.003
[1.29] [2.13]** [1.89]* [2.36]** [0.73] [0.99] [0.64] [0.58] [1.58] [0.42]Ethnolinguistic fractionalization -0.575 -0.601 -0.904 -0.557 -0.291 -21.879 -55.302 -19.204 -0.177 -1.199
[0.27] [0.91] [1.29] [1.42] [0.49] [1.88]* [2.29]** [1.11] [0.58] [1.36]Latitude 0.682 -1.508 -2.767 0.612 -0.424 1.686 -87.267 -43.174 -0.179 -1.002
[0.18] [0.69] [0.90] [0.42] [0.20] [0.05] [0.95] [0.93] [0.22] [0.34]English legal origin 0.000 0.275 0.000 -0.030 0.000 1.653 -30.597 -17.307 0.382 0.343 -2.399 -1.639 -0.395 -0.155
[.] [0.74] [.] [0.10] [.] [0.19] [1.80]* [1.33] [2.02]** [0.44] [0.33] [1.90]* [3.55]*** [1.98]*Socialist legal origin -0.796 0.000 -0.419 0.000 -0.072 5.703 -27.358 -14.963 0.321 -2.904
[0.78] [.] [1.07] [.] [0.18] [0.66] [1.76]* [1.27] [1.92]* [3.88]***French legal origin 0.496 0.712 0.614 0.563 0.385 -6.805 -35.564 -21.510 0.096 -0.335
[0.28] [1.38] [1.77]* [1.04] [1.04] [0.97] [1.66] [2.06]** [0.59] [0.72]Fixed investments 0.035
[2.12]**Openness 0.001 0.007
[0.08] [8.38]***Observations 29 37 37 37 37 70 70 64 70 70 22 22 21 22Number of countriesR-squared 0.82 0.87 0.54 0.96Subnational revenue share in adjacent regressions -0.007 -0.021 -0.039 -0.036 -0.038 -1.159 -1.216 -0.922 -0.008 -0.076 0.544 0.010 0.007 0.001(Effect for elected state executives) [0.09] [0.71] [1.34] [1.43] [1.62] [1.38] [1.19] [1.31] [0.52] [2.09]** [2.36]** [0.41] [1.92]* [0.23]
Panel A. Subsample of developing and transition countriesPanel B. Subsample of developed
countriesPublic goods and Growth± Public goods and GrowthQuality of Government
Note: Absolute values of robust t-statistics in parenthesis. *** - significant at 1% level;** - significant at 5% level;* - significant at 10% level. In cross-country regressions for developed countries, the number of control variables is decreased to provide additional degrees of freedom (section 5.1). ± There are no significant results for the quality of government in developed countries.
40
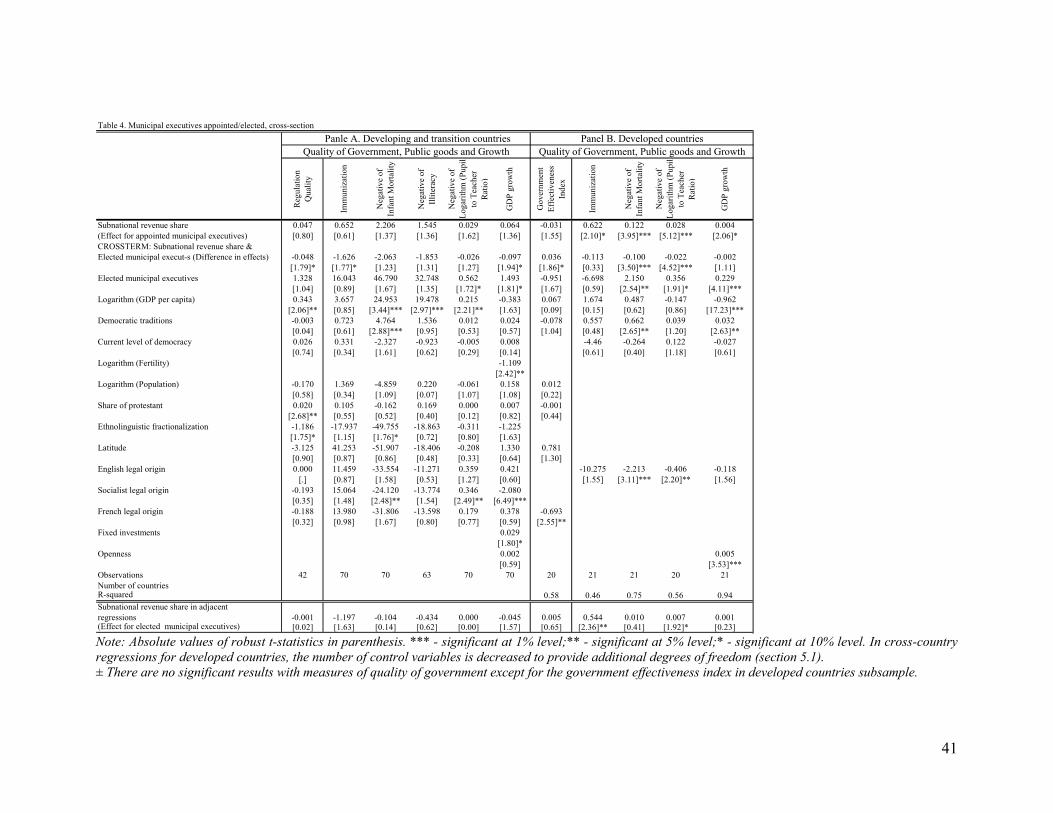
Table 4. Municipal executives appointed/elected, cross-sectionPanle A. Developing and transition countries
Reg
ulat
ion
Qua
lity
Imm
uniz
atio
n
Neg
ativ
e of
In
fant
Mor
talit
y
Neg
ativ
e of
Ill
itera
cy
Neg
ativ
e of
Lo
garit
hm (P
upil
to T
each
er
Rat
io)
GD
P gr
owth
Gov
ernm
ent
Effe
ctiv
enes
s In
dex
Imm
uniz
atio
n
Neg
ativ
e of
In
fant
Mor
talit
y
Neg
ativ
e of
Lo
garit
hm (P
upil
to T
each
er
Rat
io)
GD
P gr
owth
Subnational revenue share 0.047 0.652 2.206 1.545 0.029 0.064 -0.031 0.622 0.122 0.028 0.004(Effect for appointed municipal executives) [0.80] [0.61] [1.37] [1.36] [1.62] [1.36] [1.55] [2.10]* [3.95]*** [5.12]*** [2.06]*CROSSTERM: Subnational revenue share &Elected municipal execut-s (Difference in effects) -0.048 -1.626 -2.063 -1.853 -0.026 -0.097 0.036 -0.113 -0.100 -0.022 -0.002
[1.79]* [1.77]* [1.23] [1.31] [1.27] [1.94]* [1.86]* [0.33] [3.50]*** [4.52]*** [1.11]Elected municipal executives 1.328 16.043 46.790 32.748 0.562 1.493 -0.951 -6.698 2.150 0.356 0.229
[1.04] [0.89] [1.67] [1.35] [1.72]* [1.81]* [1.67] [0.59] [2.54]** [1.91]* [4.11]***Logarithm (GDP per capita) 0.343 3.657 24.953 19.478 0.215 -0.383 0.067 1.674 0.487 -0.147 -0.962
[2.06]** [0.85] [3.44]*** [2.97]*** [2.21]** [1.63] [0.09] [0.15] [0.62] [0.86] [17.23]***Democratic traditions -0.003 0.723 4.764 1.536 0.012 0.024 -0.078 0.557 0.662 0.039 0.032
[0.04] [0.61] [2.88]*** [0.95] [0.53] [0.57] [1.04] [0.48] [2.65]** [1.20] [2.63]**Current level of democracy 0.026 0.331 -2.327 -0.923 -0.005 0.008 -4.46 -0.264 0.122 -0.027
[0.74] [0.34] [1.61] [0.62] [0.29] [0.14] [0.61] [0.40] [1.18] [0.61]Logarithm (Fertility) -1.109
[2.42]**Logarithm (Population) -0.170 1.369 -4.859 0.220 -0.061 0.158 0.012
[0.58] [0.34] [1.09] [0.07] [1.07] [1.08] [0.22]Share of protestant 0.020 0.105 -0.162 0.169 0.000 0.007 -0.001
[2.68]** [0.55] [0.52] [0.40] [0.12] [0.82] [0.44]Ethnolinguistic fractionalization -1.186 -17.937 -49.755 -18.863 -0.311 -1.225
[1.75]* [1.15] [1.76]* [0.72] [0.80] [1.63]Latitude -3.125 41.253 -51.907 -18.406 -0.208 1.330 0.781
[0.90] [0.87] [0.86] [0.48] [0.33] [0.64] [1.30]English legal origin 0.000 11.459 -33.554 -11.271 0.359 0.421 -10.275 -2.213 -0.406 -0.118
[.] [0.87] [1.58] [0.53] [1.27] [0.60] [1.55] [3.11]*** [2.20]** [1.56]Socialist legal origin -0.193 15.064 -24.120 -13.774 0.346 -2.080
[0.35] [1.48] [2.48]** [1.54] [2.49]** [6.49]***French legal origin -0.188 13.980 -31.806 -13.598 0.179 0.378 -0.693
[0.32] [0.98] [1.67] [0.80] [0.77] [0.59] [2.55]**Fixed investments 0.029
[1.80]*Openness 0.002 0.005
[0.59] [3.53]***Observations 42 70 70 63 70 70 20 21 21 20 21Number of countriesR-squared 0.58 0.46 0.75 0.56 0.94Subnational revenue share in adjacent regressions -0.001 -1.197 -0.104 -0.434 0.000 -0.045 0.005 0.544 0.010 0.007 0.001(Effect for elected municipal executives) [0.02] [1.63] [0.14] [0.62] [0.00] [1.57] [0.65] [2.36]** [0.41] [1.92]* [0.23]
Panel B. Developed countriesQuality of Government, Public goods and GrowthQuality of Government, Public goods and Growth
Note: Absolute values of robust t-statistics in parenthesis. *** - significant at 1% level;** - significant at 5% level;* - significant at 10% level. In cross-country regressions for developed countries, the number of control variables is decreased to provide additional degrees of freedom (section 5.1). ± There are no significant results with measures of quality of government except for the government effectiveness index in developed countries subsample.
41
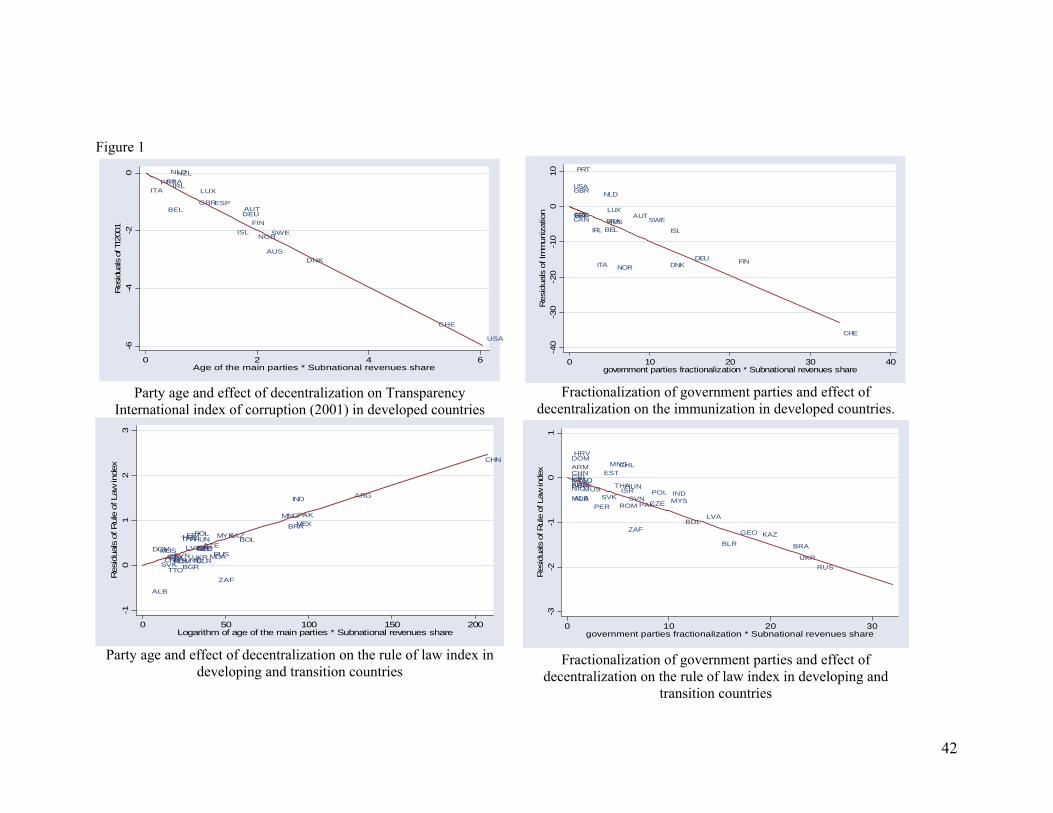
Figure 1
AUS
AUTBEL
CHE
DEU
DNK
ESP
FIN
FRA
GBR
IRL
ISL
ITA LUX
NLD
NOR
NZLPRT
SWE
USA
-6-4
-20
Res
idua
ls o
f TI2
001
0 2 4 6Age of the main parties * Subnational revenues share
Party age and effect of decentralization on Transparency
International index of corruption (2001) in developed countries
AUSAUT
BELCAN
DNK FIN
FRA
DEU
GRC
ISLIRL
ITA
LUX
NLD
NZL
NOR
PRT
ESPSWE
CHE
GBRUSA
-40
-30
-20
-10
010
Res
idua
ls o
f Im
mun
izat
ion
0 10 20 30 40government parties fractionalization * Subnational revenues share
Fractionalization of government parties and effect of
decentralization on the immunization in developed countries.
ALB
ARG
ARM
AZE
BLR
BOL
BRA
BGR
CHN
CRI
HRV
CZEDOM
EST
GEOHUN
IND
IDNISR
KAZ
LVA
MYS
MUS
MEX
MDA
MNG
NIC
PAK
PER
POL
ROMRUS
SVKSVN
ZAF
TJKTHA
TTO
UKR
-10
12
3R
esid
uals
of R
ule
of L
aw in
dex
0 50 100 150 200Logarithm of age of the main parties * Subnational revenues share
Party age and effect of decentralization on the rule of law index in
developing and transition countries
ALB
ARG
ARM
AZEBGR
BLR
BOL
BRA
CHLCHNCRI
CZE
DOM
EST
GEO
HRV
HUNIDN
INDISR
KAZ
LVA
MDA
MEX
MNG
MUS
MYS
NIC
PAKPER
POL
ROM
RUS
SVK SVN
THATTO
UKR
ZAF
-3-2
-10
1R
esid
uals
of R
ule
of L
aw in
dex
0 10 20 30government parties fractionalization * Subnational revenues share
Fractionalization of government parties and effect of
decentralization on the rule of law index in developing and transition countries
42
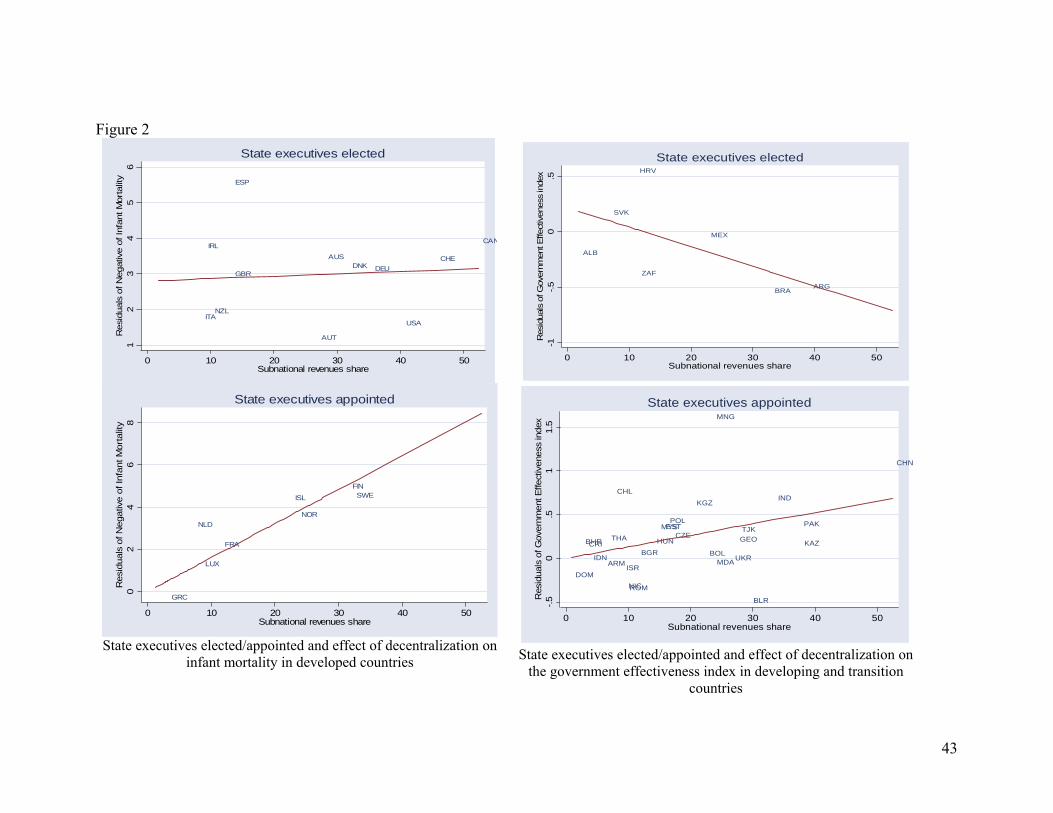
Figure 2
AUS
AUT
CAN
DNK DEU
IRL
ITANZL
ESP
CHE
GBR
USA
12
34
56
Res
idua
ls o
f Neg
ativ
e of
Infa
nt M
orta
lity
0 10 20 30 40 50Subnational revenues share
State executives elected
ALB
ARGBRA
HRV
MEX
SVK
ZAF
-1-.5
0.5
Res
idua
ls o
f Gov
ernm
ent E
ffect
iven
ess
inde
x
0 10 20 30 40 50Subnational revenues share
State executives elected
FIN
FRA
GRC
ISL
LUX
NLDNOR
SWE
02
46
8R
esid
uals
of N
egat
ive
of In
fant
Mor
talit
y
0 10 20 30 40 50Subnational revenues share
State executives appointed
State executives elected/appointed and effect of decentralization on
infant mortality in developed countries
ARMBGR
BHR
BLR
BOL
CHL
CHN
CRICZE
DOM
EST
GEOHUN
IDN
IND
ISR
KAZ
KGZ
MDA
MNG
MYS
NIC
PAKPOL
ROM
THATJK
UKR-.5
0.5
11.
5R
esid
uals
of G
over
nmen
t Effe
ctiv
enes
s in
dex
0 10 20 30 40 50Subnational revenues share
State executives appointed
State executives elected/appointed and effect of decentralization on
the government effectiveness index in developing and transition countries
43
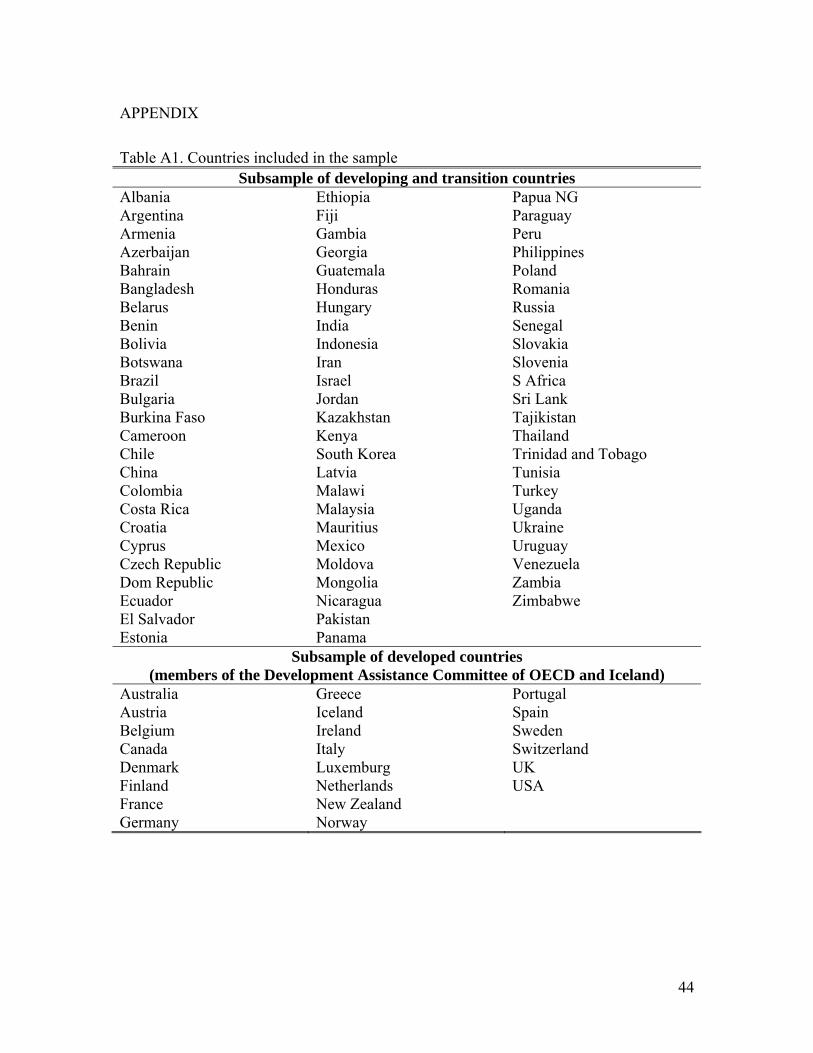
APPENDIX
Table A1. Countries included in the sample Subsample of developing and transition countries
Albania Argentina Armenia Azerbaijan Bahrain Bangladesh Belarus Benin Bolivia Botswana Brazil Bulgaria Burkina Faso Cameroon Chile China Colombia Costa Rica Croatia Cyprus Czech Republic Dom Republic Ecuador El Salvador Estonia
Ethiopia Fiji Gambia Georgia Guatemala Honduras Hungary India Indonesia Iran Israel Jordan Kazakhstan Kenya South Korea Latvia Malawi Malaysia Mauritius Mexico Moldova Mongolia Nicaragua Pakistan Panama
Papua NG Paraguay Peru Philippines Poland Romania Russia Senegal Slovakia Slovenia S Africa Sri Lank Tajikistan Thailand Trinidad and Tobago Tunisia Turkey Uganda Ukraine Uruguay Venezuela Zambia Zimbabwe
Subsample of developed countries (members of the Development Assistance Committee of OECD and Iceland)
Australia Austria Belgium Canada Denmark Finland France Germany
Greece Iceland Ireland Italy Luxemburg Netherlands New Zealand Norway
Portugal Spain Sweden Switzerland UK USA
44
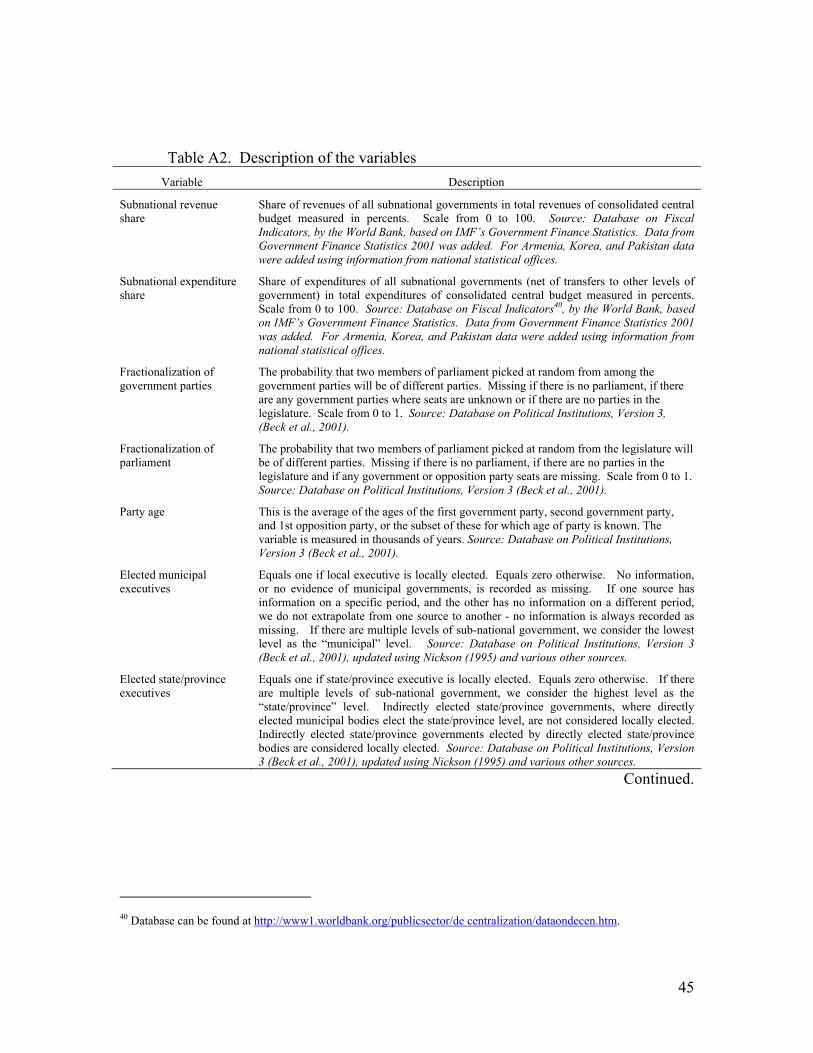
Table A2. Description of the variables Variable Description
Subnational revenue share
Share of revenues of all subnational governments in total revenues of consolidated central budget measured in percents. Scale from 0 to 100. Source: Database on Fiscal Indicators, by the World Bank, based on IMF’s Government Finance Statistics. Data from Government Finance Statistics 2001 was added. For Armenia, Korea, and Pakistan data were added using information from national statistical offices.
Subnational expenditure share
Share of expenditures of all subnational governments (net of transfers to other levels of government) in total expenditures of consolidated central budget measured in percents. Scale from 0 to 100. Source: Database on Fiscal Indicators40, by the World Bank, based on IMF’s Government Finance Statistics. Data from Government Finance Statistics 2001 was added. For Armenia, Korea, and Pakistan data were added using information from national statistical offices.
Fractionalization of government parties
The probability that two members of parliament picked at random from among the government parties will be of different parties. Missing if there is no parliament, if there are any government parties where seats are unknown or if there are no parties in the legislature. Scale from 0 to 1. Source: Database on Political Institutions, Version 3, (Beck et al., 2001).
Fractionalization of parliament
The probability that two members of parliament picked at random from the legislature will be of different parties. Missing if there is no parliament, if there are no parties in the legislature and if any government or opposition party seats are missing. Scale from 0 to 1. Source: Database on Political Institutions, Version 3 (Beck et al., 2001).
Party age This is the average of the ages of the first government party, second government party, and 1st opposition party, or the subset of these for which age of party is known. The variable is measured in thousands of years. Source: Database on Political Institutions, Version 3 (Beck et al., 2001).
Elected municipal executives
Equals one if local executive is locally elected. Equals zero otherwise. No information, or no evidence of municipal governments, is recorded as missing. If one source has information on a specific period, and the other has no information on a different period, we do not extrapolate from one source to another - no information is always recorded as missing. If there are multiple levels of sub-national government, we consider the lowest level as the “municipal” level. Source: Database on Political Institutions, Version 3 (Beck et al., 2001), updated using Nickson (1995) and various other sources.
Elected state/province executives
Equals one if state/province executive is locally elected. Equals zero otherwise. If there are multiple levels of sub-national government, we consider the highest level as the “state/province” level. Indirectly elected state/province governments, where directly elected municipal bodies elect the state/province level, are not considered locally elected. Indirectly elected state/province governments elected by directly elected state/province bodies are considered locally elected. Source: Database on Political Institutions, Version 3 (Beck et al., 2001), updated using Nickson (1995) and various other sources.
Continued.
40 Database can be found at http://www1.worldbank.org/publicsector/de centralization/dataondecen.htm.
45
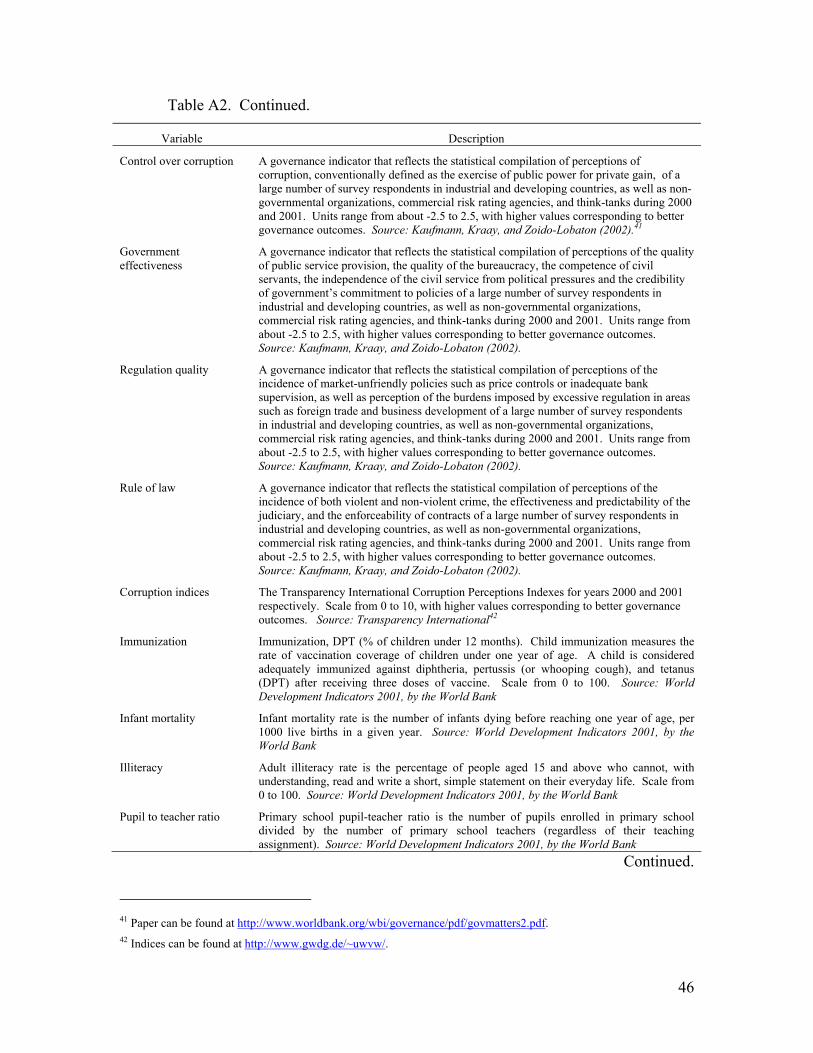
Table A2. Continued.
Variable Description
Control over corruption A governance indicator that reflects the statistical compilation of perceptions of corruption, conventionally defined as the exercise of public power for private gain, of a large number of survey respondents in industrial and developing countries, as well as non-governmental organizations, commercial risk rating agencies, and think-tanks during 2000 and 2001. Units range from about -2.5 to 2.5, with higher values corresponding to better governance outcomes. Source: Kaufmann, Kraay, and Zoido-Lobaton (2002).41
Government effectiveness
A governance indicator that reflects the statistical compilation of perceptions of the quality of public service provision, the quality of the bureaucracy, the competence of civil servants, the independence of the civil service from political pressures and the credibility of government’s commitment to policies of a large number of survey respondents in industrial and developing countries, as well as non-governmental organizations, commercial risk rating agencies, and think-tanks during 2000 and 2001. Units range from about -2.5 to 2.5, with higher values corresponding to better governance outcomes. Source: Kaufmann, Kraay, and Zoido-Lobaton (2002).
Regulation quality A governance indicator that reflects the statistical compilation of perceptions of the incidence of market-unfriendly policies such as price controls or inadequate bank supervision, as well as perception of the burdens imposed by excessive regulation in areas such as foreign trade and business development of a large number of survey respondents in industrial and developing countries, as well as non-governmental organizations, commercial risk rating agencies, and think-tanks during 2000 and 2001. Units range from about -2.5 to 2.5, with higher values corresponding to better governance outcomes. Source: Kaufmann, Kraay, and Zoido-Lobaton (2002).
Rule of law A governance indicator that reflects the statistical compilation of perceptions of the incidence of both violent and non-violent crime, the effectiveness and predictability of the judiciary, and the enforceability of contracts of a large number of survey respondents in industrial and developing countries, as well as non-governmental organizations, commercial risk rating agencies, and think-tanks during 2000 and 2001. Units range from about -2.5 to 2.5, with higher values corresponding to better governance outcomes. Source: Kaufmann, Kraay, and Zoido-Lobaton (2002).
Corruption indices The Transparency International Corruption Perceptions Indexes for years 2000 and 2001 respectively. Scale from 0 to 10, with higher values corresponding to better governance outcomes. Source: Transparency International42
Immunization Immunization, DPT (% of children under 12 months). Child immunization measures the rate of vaccination coverage of children under one year of age. A child is considered adequately immunized against diphtheria, pertussis (or whooping cough), and tetanus (DPT) after receiving three doses of vaccine. Scale from 0 to 100. Source: World Development Indicators 2001, by the World Bank
Infant mortality Infant mortality rate is the number of infants dying before reaching one year of age, per 1000 live births in a given year. Source: World Development Indicators 2001, by the World Bank
Illiteracy Adult illiteracy rate is the percentage of people aged 15 and above who cannot, with understanding, read and write a short, simple statement on their everyday life. Scale from 0 to 100. Source: World Development Indicators 2001, by the World Bank
Pupil to teacher ratio Primary school pupil-teacher ratio is the number of pupils enrolled in primary school divided by the number of primary school teachers (regardless of their teaching assignment). Source: World Development Indicators 2001, by the World Bank
Continued.
41 Paper can be found at http://www.worldbank.org/wbi/governance/pdf/govmatters2.pdf. 42 Indices can be found at http://www.gwdg.de/~uwvw/.
46
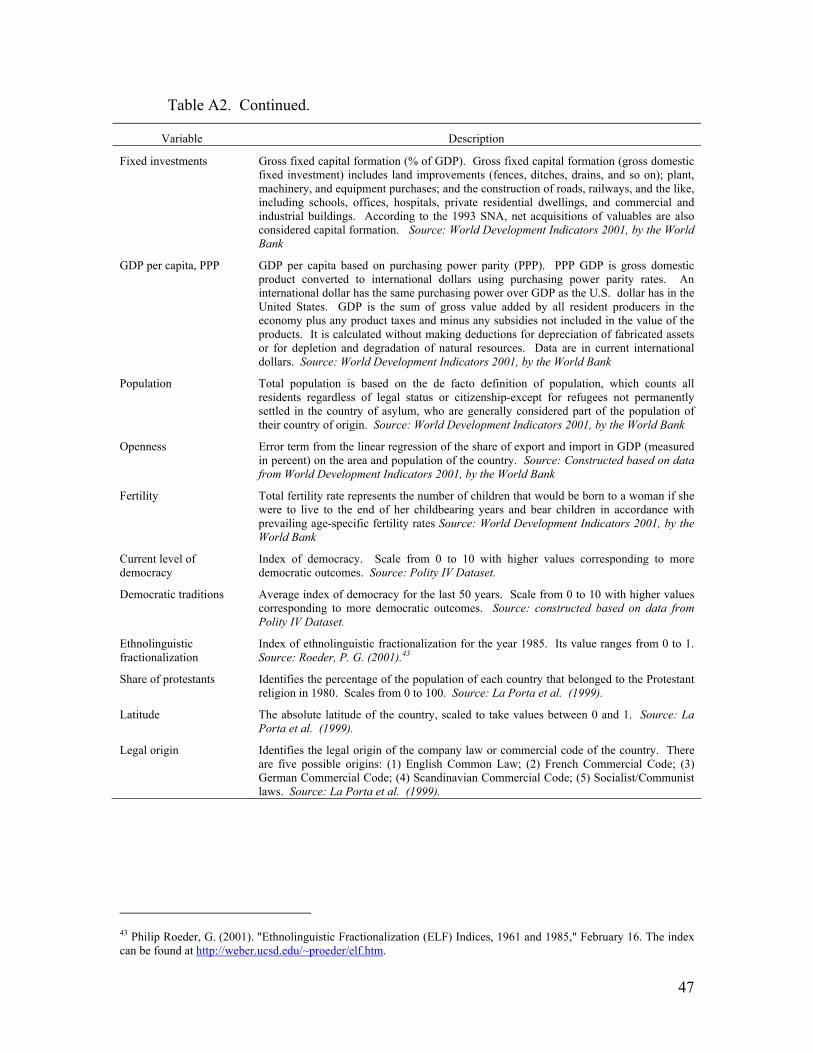
Table A2. Continued.
Variable Description
Fixed investments Gross fixed capital formation (% of GDP). Gross fixed capital formation (gross domestic fixed investment) includes land improvements (fences, ditches, drains, and so on); plant, machinery, and equipment purchases; and the construction of roads, railways, and the like, including schools, offices, hospitals, private residential dwellings, and commercial and industrial buildings. According to the 1993 SNA, net acquisitions of valuables are also considered capital formation. Source: World Development Indicators 2001, by the World Bank
GDP per capita, PPP GDP per capita based on purchasing power parity (PPP). PPP GDP is gross domestic product converted to international dollars using purchasing power parity rates. An international dollar has the same purchasing power over GDP as the U.S. dollar has in the United States. GDP is the sum of gross value added by all resident producers in the economy plus any product taxes and minus any subsidies not included in the value of the products. It is calculated without making deductions for depreciation of fabricated assets or for depletion and degradation of natural resources. Data are in current international dollars. Source: World Development Indicators 2001, by the World Bank
Population Total population is based on the de facto definition of population, which counts all residents regardless of legal status or citizenship-except for refugees not permanently settled in the country of asylum, who are generally considered part of the population of their country of origin. Source: World Development Indicators 2001, by the World Bank
Openness Error term from the linear regression of the share of export and import in GDP (measured in percent) on the area and population of the country. Source: Constructed based on data from World Development Indicators 2001, by the World Bank
Fertility Total fertility rate represents the number of children that would be born to a woman if she were to live to the end of her childbearing years and bear children in accordance with prevailing age-specific fertility rates Source: World Development Indicators 2001, by the World Bank
Current level of democracy
Index of democracy. Scale from 0 to 10 with higher values corresponding to more democratic outcomes. Source: Polity IV Dataset.
Democratic traditions Average index of democracy for the last 50 years. Scale from 0 to 10 with higher values corresponding to more democratic outcomes. Source: constructed based on data from Polity IV Dataset.
Ethnolinguistic fractionalization
Index of ethnolinguistic fractionalization for the year 1985. Its value ranges from 0 to 1. Source: Roeder, P. G. (2001).43
Share of protestants Identifies the percentage of the population of each country that belonged to the Protestant religion in 1980. Scales from 0 to 100. Source: La Porta et al. (1999).
Latitude The absolute latitude of the country, scaled to take values between 0 and 1. Source: La Porta et al. (1999).
Legal origin Identifies the legal origin of the company law or commercial code of the country. There are five possible origins: (1) English Common Law; (2) French Commercial Code; (3) German Commercial Code; (4) Scandinavian Commercial Code; (5) Socialist/Communist laws. Source: La Porta et al. (1999).
43 Philip Roeder, G. (2001). "Ethnolinguistic Fractionalization (ELF) Indices, 1961 and 1985," February 16. The index can be found at http://weber.ucsd.edu/~proeder/elf.htm.
47
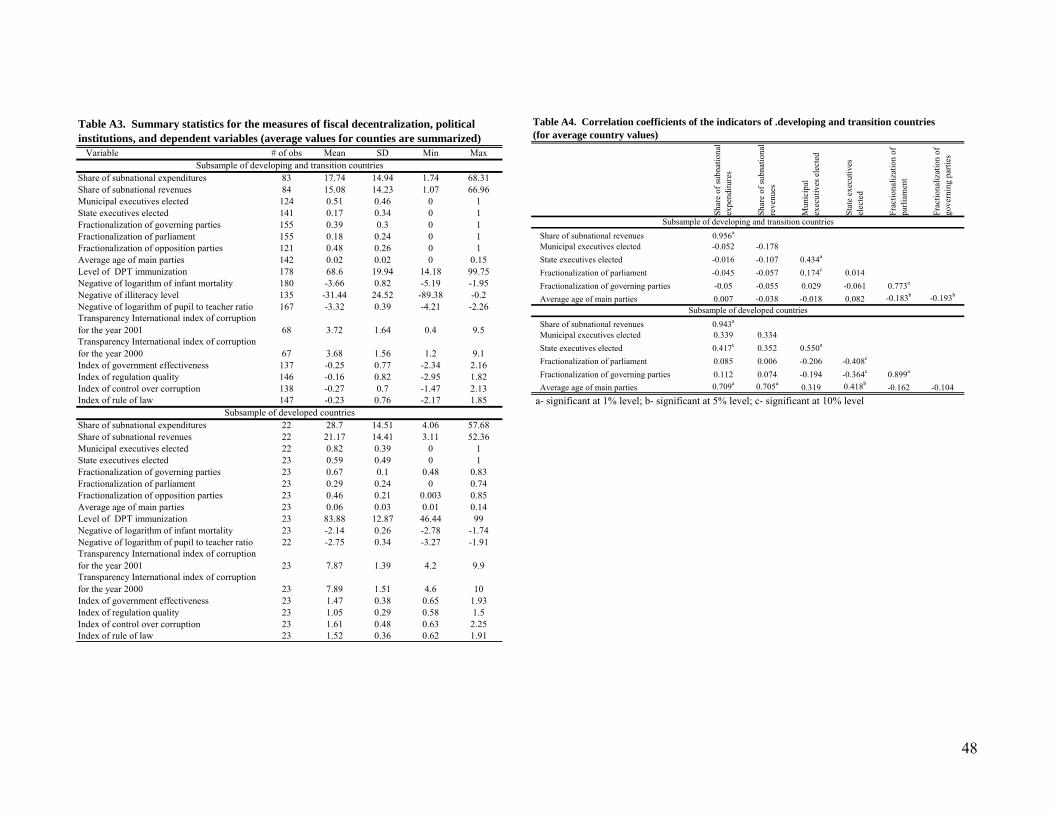
Variable # of obs Mean SD Min Max
Share of subnational expenditures 83 17.74 14.94 1.74 68.31Share of subnational revenues 84 15.08 14.23 1.07 66.96Municipal executives elected 124 0.51 0.46 0 1State executives elected 141 0.17 0.34 0 1Fractionalization of governing parties 155 0.39 0.3 0 1Fractionalization of parliament 155 0.18 0.24 0 1Fractionalization of opposition parties 121 0.48 0.26 0 1Average age of main parties 142 0.02 0.02 0 0.15Level of DPT immunization 178 68.6 19.94 14.18 99.75Negative of logarithm of infant mortality 180 -3.66 0.82 -5.19 -1.95Negative of illiteracy level 135 -31.44 24.52 -89.38 -0.2Negative of logarithm of pupil to teacher ratio 167 -3.32 0.39 -4.21 -2.26Transparency International index of corruption for the year 2001 68 3.72 1.64 0.4 9.5Transparency International index of corruption for the year 2000 67 3.68 1.56 1.2 9.1Index of government effectiveness 137 -0.25 0.77 -2.34 2.16Index of regulation quality 146 -0.16 0.82 -2.95 1.82Index of control over corruption 138 -0.27 0.7 -1.47 2.13Index of rule of law 147 -0.23 0.76 -2.17 1.85
Share of subnational expenditures 22 28.7 14.51 4.06 57.68Share of subnational revenues 22 21.17 14.41 3.11 52.36Municipal executives elected 22 0.82 0.39 0 1State executives elected 23 0.59 0.49 0 1Fractionalization of governing parties 23 0.67 0.1 0.48 0.83Fractionalization of parliament 23 0.29 0.24 0 0.74Fractionalization of opposition parties 23 0.46 0.21 0.003 0.85Average age of main parties 23 0.06 0.03 0.01 0.14Level of DPT immunization 23 83.88 12.87 46.44 99Negative of logarithm of infant mortality 23 -2.14 0.26 -2.78 -1.74Negative of logarithm of pupil to teacher ratio 22 -2.75 0.34 -3.27 -1.91Transparency International index of corruption for the year 2001 23 7.87 1.39 4.2 9.9Transparency International index of corruption for the year 2000 23 7.89 1.51 4.6 10Index of government effectiveness 23 1.47 0.38 0.65 1.93Index of regulation quality 23 1.05 0.29 0.58 1.5Index of control over corruption 23 1.61 0.48 0.63 2.25Index of rule of law 23 1.52 0.36 0.62 1.91
Table A3. Summary statistics for the measures of fiscal decentralization, political institutions, and dependent variables (average values for counties are summarized)
Subsample of developing and transition countries
Subsample of developed countries
Shar
e of
subn
atio
nal
expe
nditu
res
Shar
e of
subn
atio
nal
reve
nues
Mun
icip
al
exec
utiv
es e
lect
ed
Stat
e ex
ecut
ives
el
ecte
d
Frac
tiona
lizat
ion
of
parli
amen
t
Frac
tiona
lizat
ion
of
gove
rnin
g pa
rties
Share of subnational revenues 0.956a
Municipal executives elected -0.052 -0.178State executives elected -0.016 -0.107 0.434a
Fractionalization of parliament -0.045 -0.057 0.174c 0.014Fractionalization of governing parties -0.05 -0.055 0.029 -0.061 0.773a
Average age of main parties 0.007 -0.038 -0.018 0.082 -0.183b -0.193b
Share of subnational revenues 0.943a
Municipal executives elected 0.339 0.334State executives elected 0.417c 0.352 0.550a
Fractionalization of parliament 0.085 0.006 -0.206 -0.408c
Fractionalization of governing parties 0.112 0.074 -0.194 -0.364c 0.899a
Average age of main parties 0.709a 0.705a 0.319 0.418b -0.162 -0.104
Table A4. Correlation coefficients of the indicators of .developing and transition countries (for average country values)
a- significant at 1% level; b- significant at 5% level; c- significant at 10% level
Subsample of developing and transition countries
Subsample of developed countries
48
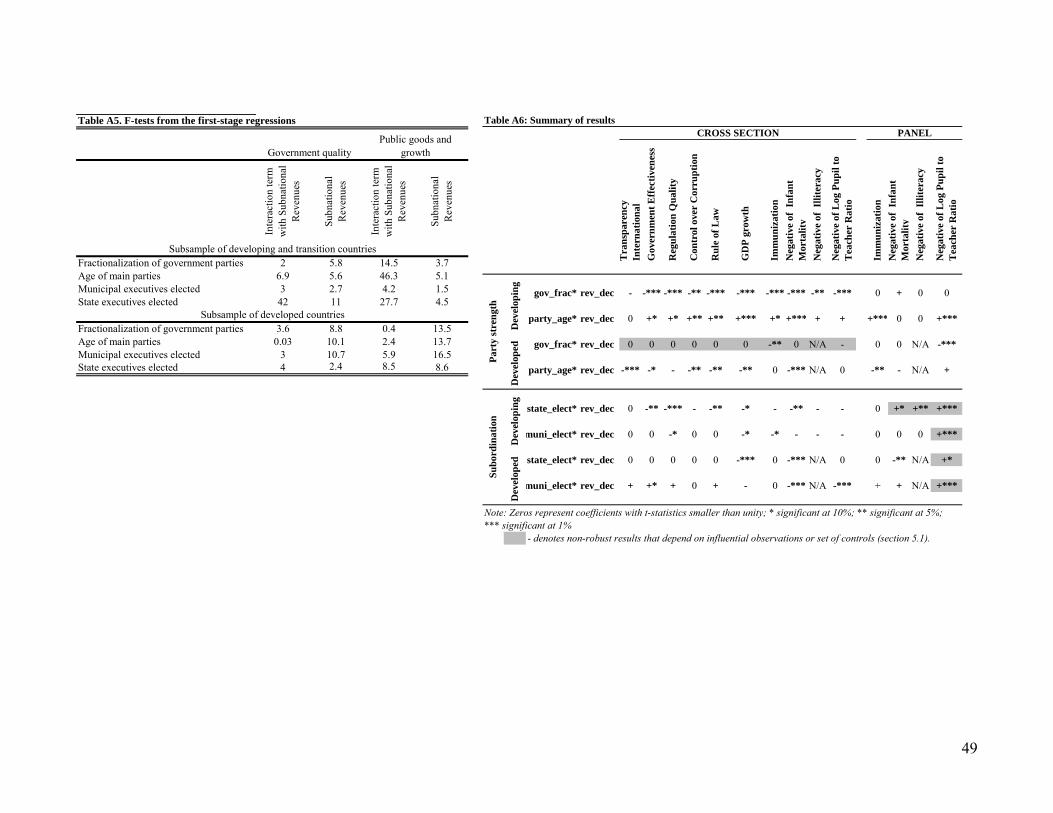
Table A5. F-tests from the first-stage regressions
Inte
ract
ion
term
w
ith S
ubna
tiona
l R
even
ues
Subn
atio
nal
Rev
enue
s
Inte
ract
ion
term
w
ith S
ubna
tiona
l R
even
ues
Subn
atio
nal
Rev
enue
s
Fractionalization of government parties 2 5.8 14.5 3.7Age of main parties 6.9 5.6 46.3 5.1Municipal executives elected 3 2.7 4.2 1.5State executives elected 42 11 27.7 4.5
Fractionalization of government parties 3.6 8.8 0.4 13.5Age of main parties 0.03 10.1 2.4 13.7Municipal executives elected 3 10.7 5.9 16.5State executives elected 4 2.4 8.5 8.6
Government qualityPublic goods and
growth
Subsample of developing and transition countries
Subsample of developed countries
Table A6: Summary of results
Tra
nspa
renc
y In
tern
atio
nal
Gov
ernm
ent E
ffec
tiven
ess
Reg
ulat
ion
Qua
lity
Con
trol
ove
r C
orru
ptio
n
Rul
e of
Law
GD
P gr
owth
Imm
uniz
atio
nN
egat
ive
of I
nfan
t M
orta
lity
Neg
ativ
e of
Illi
tera
cy
Neg
ativ
e of
Log
Pup
il to
T
each
er R
atio
Imm
uniz
atio
nN
egat
ive
of I
nfan
t M
orta
lity
Neg
ativ
e of
Illi
tera
cy
Neg
ativ
e of
Log
Pup
il to
T
each
er R
atio
gov_frac* rev_dec - -*** -*** -** -*** -*** -*** -*** -** -*** 0 + 0 0
party_age* rev_dec 0 +* +* +** +** +*** +* +*** + + +*** 0 0 +***
gov_frac* rev_dec 0 0 0 0 0 0 -** 0 N/A - 0 0 N/A -***
party_age* rev_dec -*** -* - -** -** -** 0 -*** N/A 0 -** - N/A +
state_elect* rev_dec 0 -** -*** - -** -* - -** - - 0 +* +** +***
muni_elect* rev_dec 0 0 -* 0 0 -* -* - - - 0 0 0 +***
state_elect* rev_dec 0 0 0 0 0 -*** 0 -*** N/A 0 0 -** N/A +*
muni_elect* rev_dec + +* + 0 + - 0 -*** N/A -*** + + N/A +***
- denotes non-robust results that depend on influential observations or set of controls (section 5.1).
CROSS SECTION PANEL
Part
y st
reng
th
Dev
elop
ing
Dev
elop
ed
Subo
rdin
atio
n
Dev
elop
ing
Dev
elop
edNote: Zeros represent coefficients with t-statistics smaller than unity; * significant at 10%; ** significant at 5%; *** significant at 1%
49