decentralization and regional economic disparities
TRANSCRIPT
1
DECENTRALISATION AND REGIONAL ECONOMIC
DISPARITIES
Carlos Gil Canaleta(1), Pedro Pascual Arzoz(1) Manuel Rapún Gárate(1) and Roberto
Ezcurra Orayen(1)
Postal Address:
Carlos Gil
Departamento de Economía, Campus de Arrosadia
Universidad Pública de Navarra
31006 Pamplona (SPAIN)
Telephone: 00 34 948 169 346
Fax: 00 34 948 169 721
e-mail: [email protected], [email protected], [email protected]
(1) Affiliation: Departamento de Economía, Universidad Pública de Navarra, Spain. The
main part of this article was written when Carlos Gil was visiting the Centre for Urban
and Regional Development Studies, CURDS, University of Newcastle upon Tyne (UK).
Decentralisation and Regional Economic Disparities. C. Gil, P. Pascual and M. Rapún
2
DECENTRALISATION AND REGIONAL ECONOMIC
DISPARITIES
Abstract: This paper analyses the impact of both fiscal and political decentralisation on
regional productivity inequalities. The study of the influence of decentralisation on
economic growth has received some attention in recent years, but very few studies deal
with its impact on regional inequalities. We analyse the relationship between different
measures of regional inequalities in productivity, and several measures of political and
fiscal decentralisation for a sample of fifteen OECD countries. In order to check for
other possible influences, the analysis also includes measures of public sector size and
the type of party government. The results suggest a strong negative correlation between
decentralisation, mainly fiscal decentralisation, and regional inequalities.
Decentralisation and Regional Economic Disparities. C. Gil, P. Pascual and M. Rapún
3
1. Introduction
Over the last twenty years there has been an increasing interest in decentralisation all
around the world. Many developing countries have embarked, or intend to embark, on
some form of transfer of political power to local government (see, for example,
Dillinger, 1994). Furthermore, decentralisation has become a central issue in the
political agenda of developed countries with more consolidated political systems.
Belgium became a federal state in 1993 (Oates, 1999). In the UK and Spain
decentralisation is an ongoing process, though not without a degree of controversy. In
the EU the regions are increasingly perceived to be the relevant units for implementing
political decisions 1. It is not by chance that the constant growth of regional and local
participation in regional policy delivery has coincided with the rapid expansion of the
EU's regional policy, and the commitment of the EU to the principle of subsidiarity.
There are numerous reasons that might explain this increasing interest in
decentralisation (Armstrong and Taylor, 2000). The first of these is belief in
decentralisation as an effective tool for increasing the efficiency of public expenditure.
The second is reaction against large centralised bureaucracies not only in developing
countries, but also in areas such as the EU. The third has to do with the influences of the
changes over the last decades in the way private corporations are managed. The fourth
relates to changes in the type of regional policy implemented in the EU. Policies
designed to stimulate endogenous growth (through the encouragement of small firms,
for example) are very difficult to run from the centre. Fifth, and last is the demand for a
closer democracy which could promote public participation in social policy and
administration.
Decentralisation and Regional Economic Disparities. C. Gil, P. Pascual and M. Rapún
4
Within the main line of comparative political research with an interest in the
consequences of federalism and decentralisation there is agreement that decentralisation
matters important when it comes to issues of policy. Some authors have claimed
federalism to be superior to other democratic systems, because it provides a better
safeguard for the democratic rights of citizens in general and minorities in particular
(Elazar, 1995). Neo- institutionalist economists have also made the case that certain
institutional arrangements encourage individuals to engage in some economic activities
more than in others, thereby giving rise to more successful economies (North, 1990).
While there has been much discussion over the application and influence of
decentralisation, the empirical work quantifying the economic effects of
decentralisation is fairly limited, and most of it focuses on issues such as the growth of
the welfare state and public expenditure. The ‘hypothesis of decentralisation’, proposed
by Brennan and Buchanan (1980), suggests that decentralisation increases
competitiveness among local governments and restrains the growth of the public sector.
This hypothesis has been tested by Cameron (1978) Oates (1985), Heil (1991), Pierson
(1995) and Lane and Ersson (2000) among others. Most of them have found a positive
relationship between decentralisation and public sector size when the analysis includes
only developed countries, but this relationship fades when a wider sample, including
developing countries, is studied.
The article is structured as follows. Section 2 presents a review of the literature dealing
with decentralisation, economic performance and regional inequalities. In section 3 we
introduce and discuss the different measures of inequality and decentralisation used in
the study. Empirical results are given in section 4. Finally, there is a brief presentation
of the main conclusions.
Decentralisation and Regional Economic Disparities. C. Gil, P. Pascual and M. Rapún
5
2. Theoretical and empirical background
It is widely accepted that the three main objectives of the public sector are those initially
stated by Musgrave (1959): efficiency in the allocation of resources, income
redistribution and macroeconomic stability. Traditionally, most public economists have
agreed that while the first of these functions can be assigned to lower levels of
government, the latter two should more appropriately be assigned to the national level.
Decentralisation may generate more efficiency, but may also reduce economic stability
and aggravate regional inequality. Thus, in recent years these assumptions have
provoked considerable controversy.
Emanating from the public choice theory, with roots in the neo-classical school of
thought, there is a suggestion that decentralisation could improve efficiency in the
allocation of resources by better satisfying the needs and preferences of local citizens,
through better knowledge of these preferences (Oates, 1972). These gains in efficiency
would be enhanced with mobility of citizens who could choose to live in the jurisdiction
that best matched their preferences. Regions would also have incentives to compete
with one another by attracting migrants, making more efficient use of their resources
and increasing economic welfare. Tiebout (1956) argued that the ability of individuals
to move among jurisdictions produces a market- like solution to the local public goods
problem. The individuals vote with their feet and locate in the community that offers the
bundle of public services and taxes that best suits them.
However, some authors (Prudhomme, 1995, Tanzi, 1996) think that preferences among
individuals living in a country are quite similar, and that lack of co-ordination among
regional governments could reduce efficiency in the provision of some public services.
Decentralisation and Regional Economic Disparities. C. Gil, P. Pascual and M. Rapún
6
The existence of regional ‘spillovers’ in the provision of some public goods could also
generate an inadequate level of provision2.
There are several reasons why the stabilisation function was considered inappropriate
for sub-national assignment. Firstly, it could increase debt at local level if
decentralisation were poorly designed (with central government covering regional and
local defaults, for example). The benefits of stabilisation would spill over regional
borders and result in inadequate stabilisation and excessive debt. Secondly, the increase
in local debt will create inflationary pressures and pose a threat to price stability.
Monetary stability requires good co-ordination between monetary and fiscal policy
functions, which should be undertaken by the centre alone. Thirdly, cyclical shocks are
usually national in scope (i.e. symmetrical across all regions) and therefore require a
national response.
Keynesian thought supports these arguments. Decentralisation reduces the capacity of
central government to use demand policies to alleviate the effects of fluctuations in
production and employment. Federal and highly decentralised states would therefore
perform worse. Greater centralisation also permits more efficient determination of
macro-economic objectives, less diffusion in the utilisation of policy instruments, and a
higher degree of co-ordination.
There are fewer empirical studies that discuss the possible relationship between
economic outcomes and political and fiscal decentralisation, perhaps because this topic
lies on the borderline between political science and economics. Some of them are
national studies, which yielded mixed results. Zhang and Zou (1997), Freinkman and
Yossifov (1999) and Lin and Liu (2000) find decentralisation to have had a positive
Decentralisation and Regional Economic Disparities. C. Gil, P. Pascual and M. Rapún
7
effect on economic growth in India, Russia and China, whereas Zhang and Zou (1998),
and Xie, Zou and Davoodi (1999) have concluded the opposite for China and the USA.
A second group of studies found high correlation between fiscal and political
decentralisation and GDP per capita. For example, Oates (1985) shows the average
share of central government spending and revenues to be much higher for developing
countries than for developed ones. Lane and Errson (2000) also find much higher
average GDP per capita for federal countries, and a highly significant correlation
between federalism and fiscal decentralisation. But the implications of this relationship
are not clear. To repeat the question posed by Oates (1993), is fiscal decentralisation a
‘cause’ or a ‘result’ of economic development? Or is it perhaps the result of a complex
interplay of a variety of forces related to development?
Recently, several authors have used international data to study the impact of different
measures of decentralisation on economic performance, though with different outcomes.
The results of this type of studies are probably less affected by the inverse causality
problem. Davoodi and Zou (1998) find fiscal decentralisation to be associated with
slower growth in both developing and developed countries. Woller and Phillips (1998)
fail to find any statistically significant relationship between fiscal decentralisation and
economic growth for a panel of developing countries.
However, other studies, focusing on advanced democracies, obtain a very different
result. Castles (1999), in an exploratory analysis of a wide range of policy outcomes
using cross-national data for 21 OECD nations, suggests that a low level of fiscal
centralisation appears to have restrained post-war inflationary pressures and to have
been accompanied by higher rates of post-war economic growth. His regression
includes a catch-up term, as this has proved to be an essential explanatory variable in
Decentralisation and Regional Economic Disparities. C. Gil, P. Pascual and M. Rapún
8
the literature dealing with ‘convergence’ among countries. Lancaster and Hicks (2000)
also found the impact of federalism on GDP growth to be statistically significant when
neo-corporativism is simultaneously considered and a catch-up is term included. The
results of Keman (2000) indicate that the socio-economic performance of decentralised
countries appears to be better than that of others.
Although these studies can be criticised for the lack of variability in the samples used, it
is also true that these countries share a similar socio-economic background 3, and that
the definitions of the different measures of decentralisation are more comparable. This,
however, is not the only reason for which they might be criticised. First of all, there are
so many potential variables that might influence the different growth rates and wealth
among countries, some of which (such as public sector size) could be correlated to
decentralisation measures, that it is very difficult to assess whether the apparent
superiority of federal systems is actually true. As Levine and Renelt (1992) have stated,
there is a real danger of omitting some necessary control variables and thereby of
reaching the false conclusion that a statistically significant relationship exists between
growth and decentralisation. Furthermore, given our poor understanding of how
decentralisation influences economic growth, there is a risk of accepting the product of
spurious relationships (see Martinez-Vazquez and McNab (2001) for an example).
Finally, the measurement of decentralisation also has its problems. Not only because
there are different kinds of decentralisation, such as ‘political decentralisation’ or ‘fiscal
decentralisation’ (related to what Keman (2000) calls ‘the right to decide’ and ‘the right
to act’), but also how to measure these different types of decentralisation.
In short, we might say that there are two opposing lines of argument linking political
and fiscal decentralisation and economic performance. Emanating from the public
Decentralisation and Regional Economic Disparities. C. Gil, P. Pascual and M. Rapún
9
choice theory, with its roots in neo-classical thought, there is a suggestion that in
centralised states revenue maximisation is not restrained as efficiently as in
decentralised states. Decentralised states would be more efficient in economic terms,
not only because the dispersion of fiscal authority would restrain overall growth of the
public sector, but also because it would promote competition at regional level. The
counter-argument, with its origins in Keynesian thought, argues that decentralisation
limits the capacity of central government to use demand policies to reduce fluctuations
in production and employment. Federal and highly decentralised states would perform
worse. Greater centralisation also permits more efficient determination of macro-
economic objectives, less diffusion in the utilisation of policy instruments, and a higher
degree of co-ordination.
Regional inequalities and decentralisation
The second main drawback traditionally attributed to decentralisation is an unbalanced
distribution of resources across regions that would generate increasing economic
differences among them. There are several issues that might influence the final
outcome. The first is whether or not decentralisation results in more unequal distribution
of public resources. Prudhomme (1995) argues that centralised public sectors will
attempt to produce a more balanced distribution by channelling resources from richer
areas to poorer ones. Conversely, centralised systems may create unequal distributions
of public resources by favouring politically important jurisdictions. The second issue
relates to whether centralisation could lead to a higher concentration of private
investment. Investors seeking closer ties with politicians and the administration might
tend to choose capital regions. The third point is that decentralisation can provide sub-
national officials with the power to actively pursue economic development policies.
Decentralisation and Regional Economic Disparities. C. Gil, P. Pascual and M. Rapún
10
This will not only include policies better suited to local needs or capabilities, but also
several forms of competition among regional and local governments, which may
include granting tax privileges and offering other forms of assistance to businesses
willing to locate in a particular jurisdiction (Martinez and McNab, 2001). It is difficult
to assess whether or not they will contribute to reduce regional disparities.
Both lines of argument linking political and fiscal decentralisation and economic
performance could also be applied to the level of regional disparities. On the basis of
the public choice theory, we might expect less regional disparity in decentralised states.
In the first place, the power to control most of the public budget locally could generate
more competitiveness among regions, forcing regional governments to deliver services
at minimum cost, thus enhancing efficiency. Besides, local governments could be
removed if they failed to achieve standards of wealth and economic growth similar to
those in the rest of the country. The power to design regional policies tailored to local
needs, in an effort to promote employment and productivity, would give local officials
the power to achieve economic goals. Furthermore, as central government would be
more reduced in size, the concentration of political and economic power around the
capital region would also be less relevant.
From a Keynesian approach, however, the weaker central state would play a less crucial
role in redistributing income among regions, and could not use demand side policies,
such as public investment, to promote economic growth in the poorer regions. More
diffusion in policies such as education or health could also lead to an increase in
disparities among decentralised countries. Related to this is the fact that the benefits of
regional policies spill over into other areas. For example, the creation of extra jobs in an
assisted region will reduce the amount of unemployment transfers and raise tax revenue,
Decentralisation and Regional Economic Disparities. C. Gil, P. Pascual and M. Rapún
11
to the benefit of the inhabitants of non-assisted regions (Armstrong and Taylor, 2000).
Other less tangible benefits, such as those of a social or environmental nature, could
also spill over the regional boundary. Since there are effects that spread beyond regional
borders, totally isolated development policies are likely to produce inefficient levels of
regional policy and equalisation among regions.
An important issue in the evolution of regional inequalities in decentralised states is the
existence of equalisation programs, and of course, the size of their budgets and the way
they are distributed. Most developed federal states have formal equalisation programs,
whilst in a large number of developing countries explicit equalisation programs still
remain untried, although equalisation objectives are implicitly attempted in the general
revenue sharing mechanisms used in some of them (Shah, 1998, Jun Ma, 1997). Shah
(1998) also argues that intergovernmental transfers in developing countries undermine
fiscal discipline and accountability while building transfer dependencies that cause the
slow economic strangulation of fiscally underprivileged regions. On the other hand,
properly designed intergovernmental transfers may enhance competition for the supply
of public goods, fiscal harmonisation, sub-national government accountability and
regional equity.
Under formal programs, there is less risk of a decentralised system generating
increasing economic differences. This suggests that if there is any positive relationship
between decentralisation and reduction of regional inequalities, it may be of the
‘inverted U’ type. If decentralisation means almost total fiscal and political
independence, without equalisation programmes, there would be little chance of
regional disparities in economic welfare being reduced, because there would be no
compensating mechanism, and the variables that determine affluence levels would be
Decentralisation and Regional Economic Disparities. C. Gil, P. Pascual and M. Rapún
12
more likely to diverge. Underprivileged regions would be unable to compete for mobile
private investment with the most prosperous ones who will be able to offer even more
advantages to investors, or to properly fund policies designed to assist indigenous firms.
A certain degree of co-ordination, and funding, would need to come from the central
government to achieve the maximum degree of equalisation. On the other hand, a
degree of decentralisation may generate more equalisation among regions, as long as
there is a compensation mechanism, and local authorities are allowed to design policies
better adjusted to their own developing needs.
The two opposing arguments about the impact of decentralisation on regional
inequalities sheds no light on the issue that provides the focus of this study: are regional
inequalities in decentralised countries greater than, smaller than, or more or less the
same as in centralised countries?
We should seek the answer to this question in practical studies. There are hardly any
that address this question directly, however. Tsui (1996) analyses the relation between
regional inequalities and decentralisation in China. He finds fiscal decentralisation to be
related to the rise in disparities in the 1980s. Again though, very special circumstances
prevailed during this period of analysis, such as the great amount of foreign direct
investment in the Special Economic Zones, which are to be found in the richest areas4.
Also, the devolution process in China is an asymmetric one, with some regions having
more political and fiscal autonomy than others.
Decentralisation and Regional Economic Disparities. C. Gil, P. Pascual and M. Rapún
13
3. Measures of regional inequality and decentralisation
Measures of inequality
We will use measures of regional disparities in GDP per worker (GDPpw). Other
measures of affluence, such as the more commonly used GDP per capita (GDPpc), are
less appropriate for this type of study, because the existence of commuters produces
great distortion in some regions. Clear examples of this are Hamburg and Bremen in
Germany, or the District of Columbia in the USA. Another disadvantage of GDP per
capita is that it is influenced by the age structure of the population, and activity rates.
Using GDP per employed worker also presents some drawbacks. Due to different
unemployment rates among countries, we might introduce a bias in the relevant measure
of inequality. For example, differences in unemployment rates in Italy or Spain are
much greater than in the USA. Thus, inequality in GDP per worker employed may
underestimate the true level of economic inequality in some countries. On the whole,
however, we feel this to be the best alternative for measuring the economic capability of
a region.
Because of the methodology used in some countries (and Eurostat) to report GDPpw
data, additional adjustments have been made in Austria, Belgium and Japan. In these
countries GDPpw is not corrected to account for the influence of commuters to the
capital region, and because of the reduced surface of the capital, the number of
commuters from outside the region is indeed relevant. The inequality indices for these
countries have been calculated using an aggregate region including the capital and
surrounding regions.
Decentralisation and Regional Economic Disparities. C. Gil, P. Pascual and M. Rapún
14
In some countries, mainly federal states, such as Germany or the USA, the relevant
level of regional aggregation is quite clear. In others, such as France or the UK, this
could pose a problem. In these countries, the use of NUTS1 or NUTS25 levels, giving
the same weight to all regions, could lead to widely differing results. We will use
inequality indices weighted by employment, so that the level of aggregation does not
heavily influence the results. Furthermore, the considerable differences in size among
regions led us to use ‘weighted’ measures of inequality, as did Esteban (1994) in his
analysis of regional disparities in the EU.
It is well known that compact measures of inequality might not always provide an
unambiguous ranking of countries. Different indices of inequality are based on
alternative ethical assessments, as was shown in the seminal articles by Atkinson (1970)
and Sen (1973). By calculating alternative indices and using them in the analysis, it is
possible to ensure that differences between countries are real and the results robust.
In this article we will not only use ‘sigma’, the standard deviation of the natural
logarithms of the GDP per worker, a measure that has become widespread in the
analysis of regional disparities in the convergence literature, but also alternative
measures, such as the Gini, Theil and Atkinson indices. These are more common in the
analysis of interpersonal income disparities, but they have been employed in the studies
dealing with regional inequalities (Tsui, 1996, and Esteban, 1994).
The indices have different degrees of sensitivity with respect to transfers at different
parts of income distribution6. All of them satisfy the Dalton transfer principle, that is, a
transfer from a richer to a poorer region reduces inequality. They are also homogeneous
of degree 0.
Decentralisation and Regional Economic Disparities. C. Gil, P. Pascual and M. Rapún
15
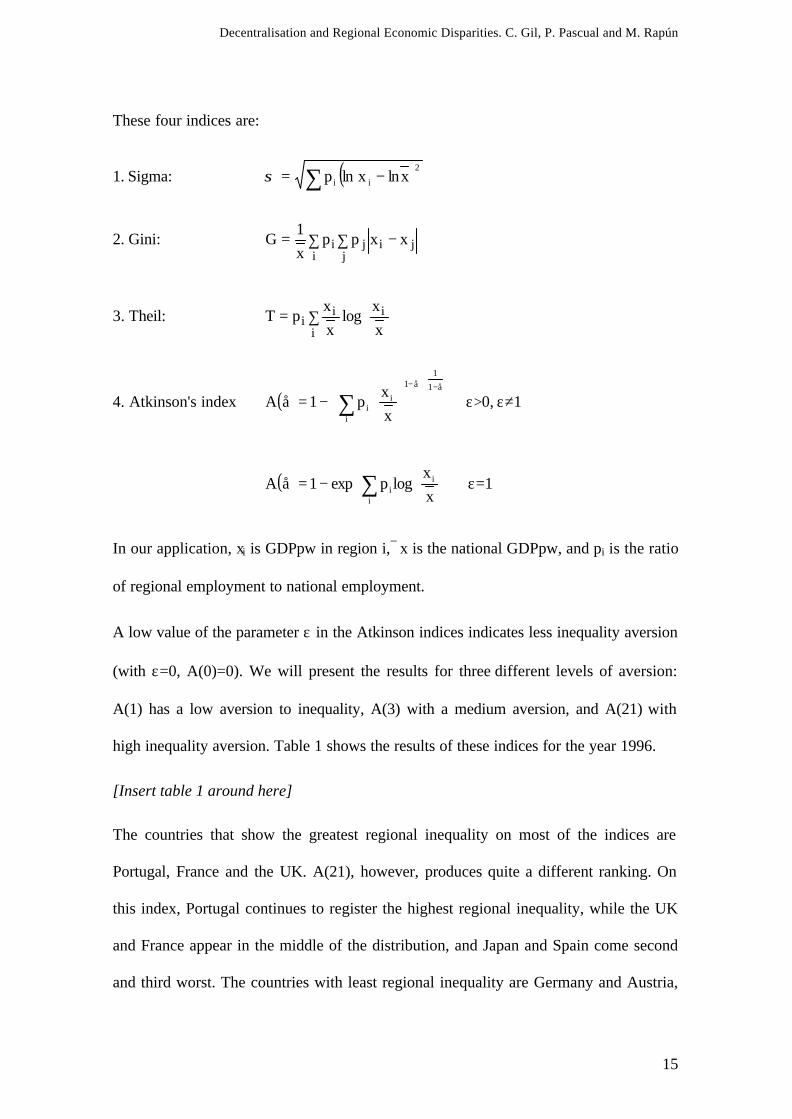
These four indices are:
1. Sigma: ( )∑ −=2
ii xlnxlnpσ
2. Gini: jij
ji
i xxppx
1G −∑∑=
3. Theil:
∑=
x
xlog
x
xpT i
i
ii
4. Atkinson's index ( )å1
1
i
å1
ii
x
xp1åA
−−
−= ∑ ε>0, ε≠1
( )
−= ∑
i
ii x
xlogpexp1åA ε=1
In our application, xi is GDPpw in region i,x is the national GDPpw, and pi is the ratio
of regional employment to national employment.
A low value of the parameter ε in the Atkinson indices indicates less inequality aversion
(with ε=0, A(0)=0). We will present the results for three different levels of aversion:
A(1) has a low aversion to inequality, A(3) with a medium aversion, and A(21) with
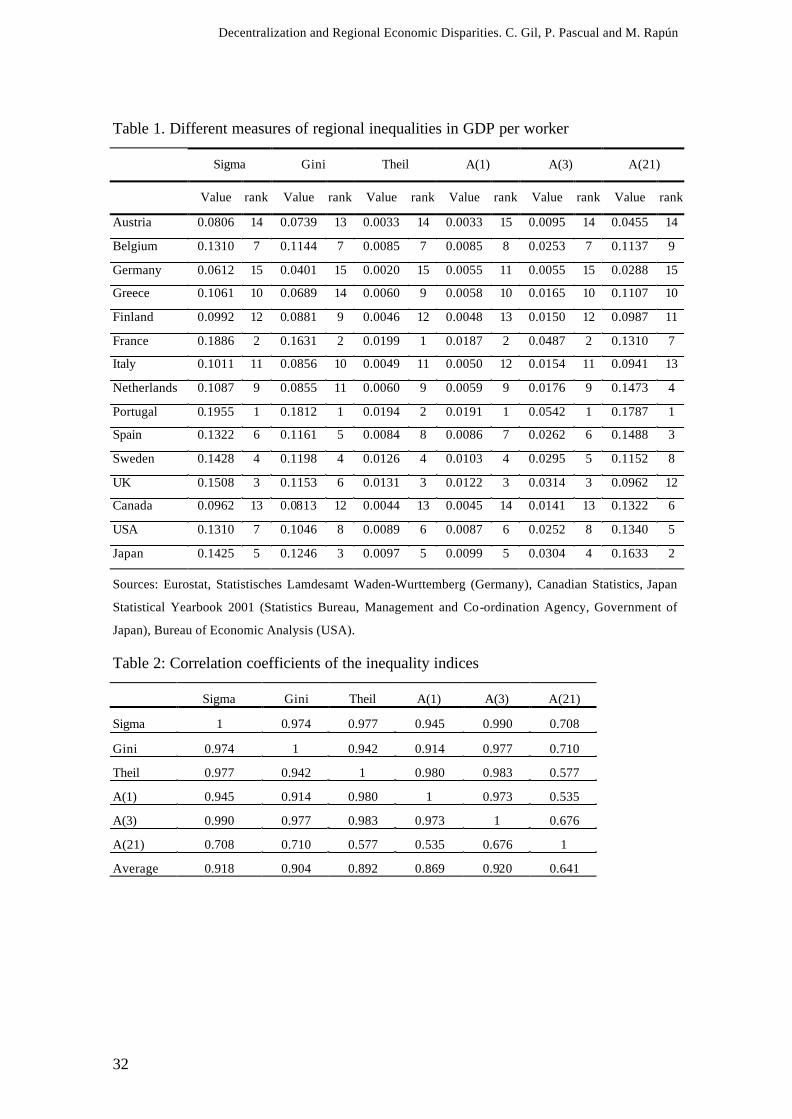
high inequality aversion. Table 1 shows the results of these indices for the year 1996.
[Insert table 1 around here]
The countries that show the greatest regional inequality on most of the indices are
Portugal, France and the UK. A(21), however, produces quite a different ranking. On
this index, Portugal continues to register the highest regional inequality, while the UK
and France appear in the middle of the distribution, and Japan and Spain come second
and third worst. The countries with least regional inequality are Germany and Austria,
Decentralisation and Regional Economic Disparities. C. Gil, P. Pascual and M. Rapún
16
with Finland, Canada and Italy also obtaining good scores on most of the indices. These
indices suggest a relationship between federalism and regional inequalities that we will
attempt to confirm in section 4.
On the whole, the ranking is quite similar on all the indices, with the exception of
A(21). This is further confirmed idea by the correlation coefficients for these indices
which are shown in table 2. All are very high, except those that include A(21), an index
which is highly sensitive to small incomes, regardless of the size of the region. A(1) is
the one with the second weakest correlation to the rest, in this case because it is less
sensitive to low values of labour productivity. Obviously, correlation between A(1) and
A(21) is the lowest. We can expect similar results to these when using Sigma, Theil,
Gini or A(3), but they could differ substantially when using A(1) or A(21).
[Insert table 2 around here]
It is also worth mentioning that none of the indices produces significant correlation to
variables such as the number of regions, the size of the country (in terms of its
economy, population, or surface) or the average size of the regions.
Measures of decentralisation
Next we present a group of variables that can be used to measure decentralisation. As
Martinez-Vazquez and McNab (2001) have stated, this is a problematic issue, because
there is no single or best measure of decentralisation. A country may allocate an
important fraction of the public budget at regional level but regions may lack sufficient
autonomy to make decisions on expenditure. It is therefore important to test several
alternative measures of decentralisation.
Decentralisation and Regional Economic Disparities. C. Gil, P. Pascual and M. Rapún
17
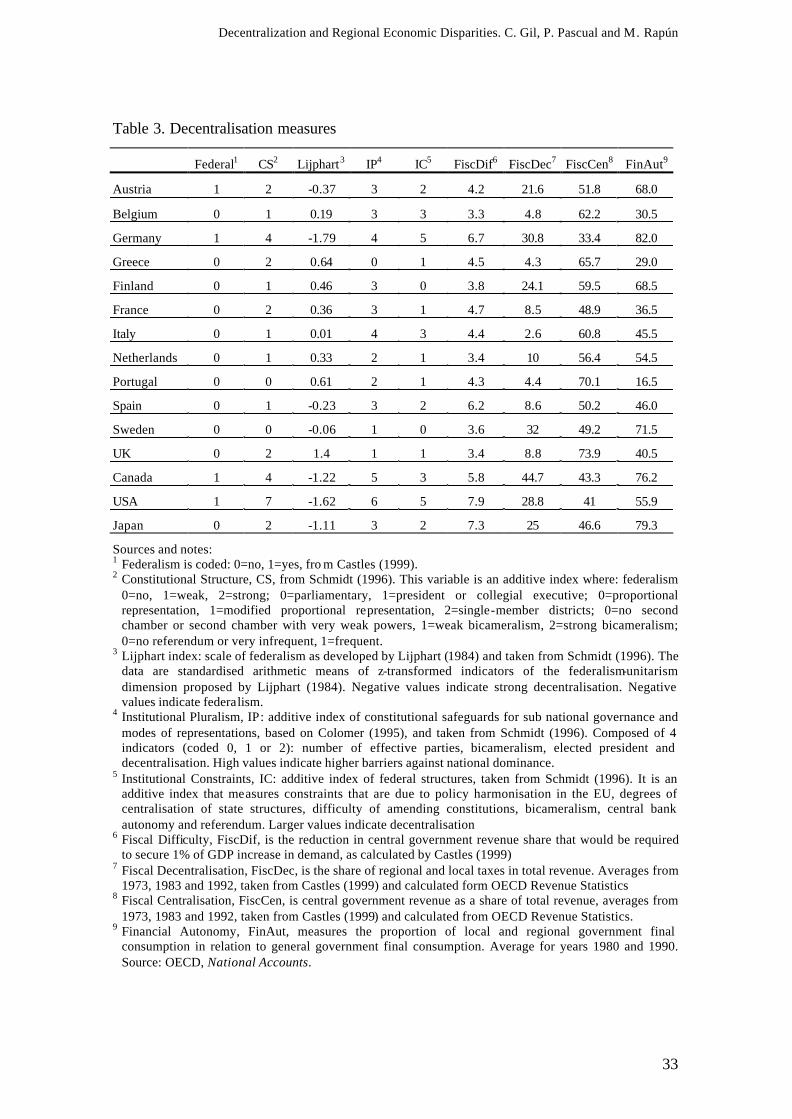
Nine measures of decentralisation are featured in table 3. Sources and notes to this table
provide precise detail of each variable. The presentation here provided highlights some
of the implications resulting from each of the different measures. Since the first five
variables focus on political issues, we consider them to be indices of political
decentralisation. The last four concentrate on revenues or expenses, thus we consider
them to be indices of fiscal decentralisation.
The first measure, Federalism, is a dummy variable that takes the value 1 when the
country has a federal constitut ion. Only four countries have been federations for a
relevant period of time. Belgium became federal in 1993, but this is too late for it to
have had any impact on regional disparities.
The next four variables (Constitutional Structure, Lijphart index, Institutional Pluralism,
and Institutional Constraints) measure levels of political restraint to central government
intervention, and are taken from Schmidt (1996). The Lijphart indices are standardised
arithmetic means of z-transformed indicators of the federalism-unitarism dimension.
The other three variables are additive indices. Some of the constraints used in the
calculus are federalism, the existence of an strong second chamber, or the form of
government (presidential or not).
Fiscal Difficulty measures the capacity of central government to influence economic
performance. Fiscal Decentralisation measures the share of regional and local taxes in
total revenue. Fiscal Centralisation measures the share of central government revenue in
total revenue, excluding supranational and social security taxes, so it is not the mirror
image of Fiscal Decentralisation. The reason for excluding these taxes is that central
government experiences more difficulty in manipulating these revenues than other taxes
under its direct control. The last variable, Financial Autonomy, measures the proportion
Decentralisation and Regional Economic Disparities. C. Gil, P. Pascual and M. Rapún
18
of local and regional government final consumption in relation to general government
final consumption. This variable focuses on expenses, whilst the previous two focus on
the revenue side.
[Insert table 3 around here]
4. The results
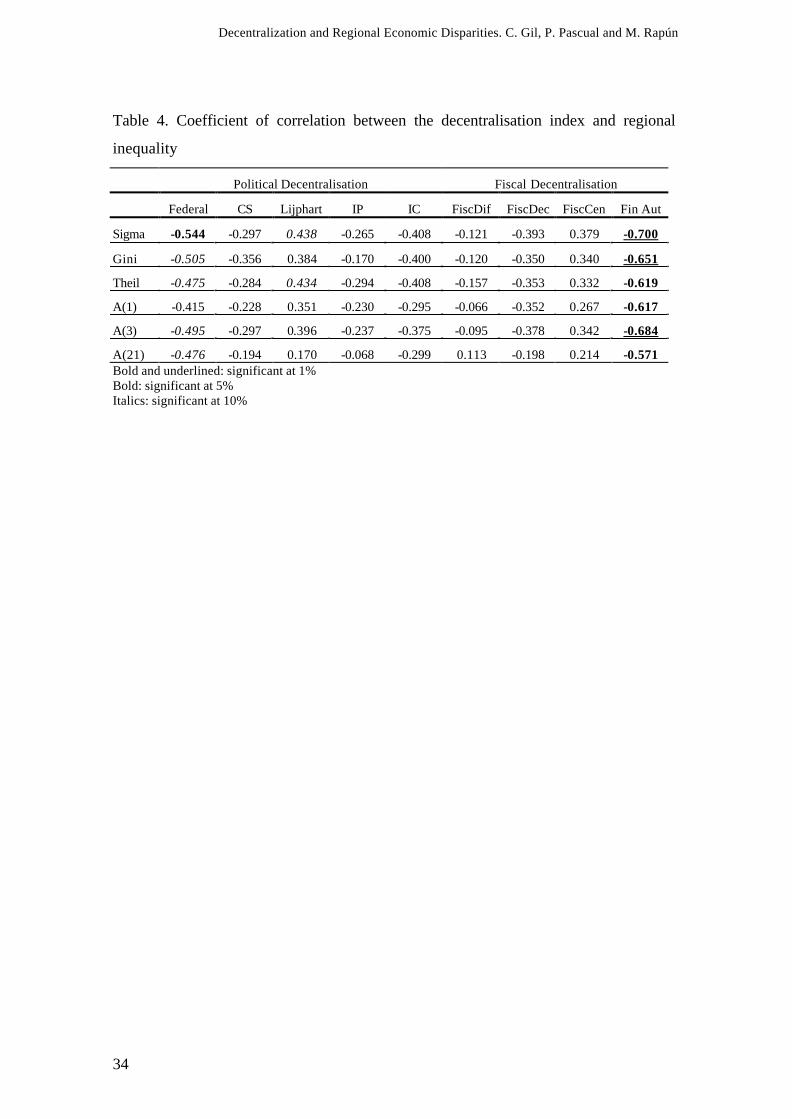
We begin our research with the analysis of correlation between the different measures
of decentralisation and the alternative indices of regional inequality. As can be seen in
table 4, there is a negative correlation between decentralisation and regional inequality,
although in most of the cases it is not significant. Only the relationships between
Financial Autonomy (% of local and regional government consumption in relation to
general government consumption) and the inequality indices are highly significant.
These results may indicate that federalism and decentralisation matter, but only if they
lead to more decentralised expenses. In the following pages we will try to confirm this
first result by introducing new variables into the analysis.
[Insert table 4 around here]
Mention has already been made of previous studies that have found a positive
correlation between public sector size and centralisation (at least for developed
countries). The detected relationship between regional inequalities and decentralisation
may be a spurious correlation, while the significant one is the relationship between
public sector size and productivity inequalities, though it is not clear why there should
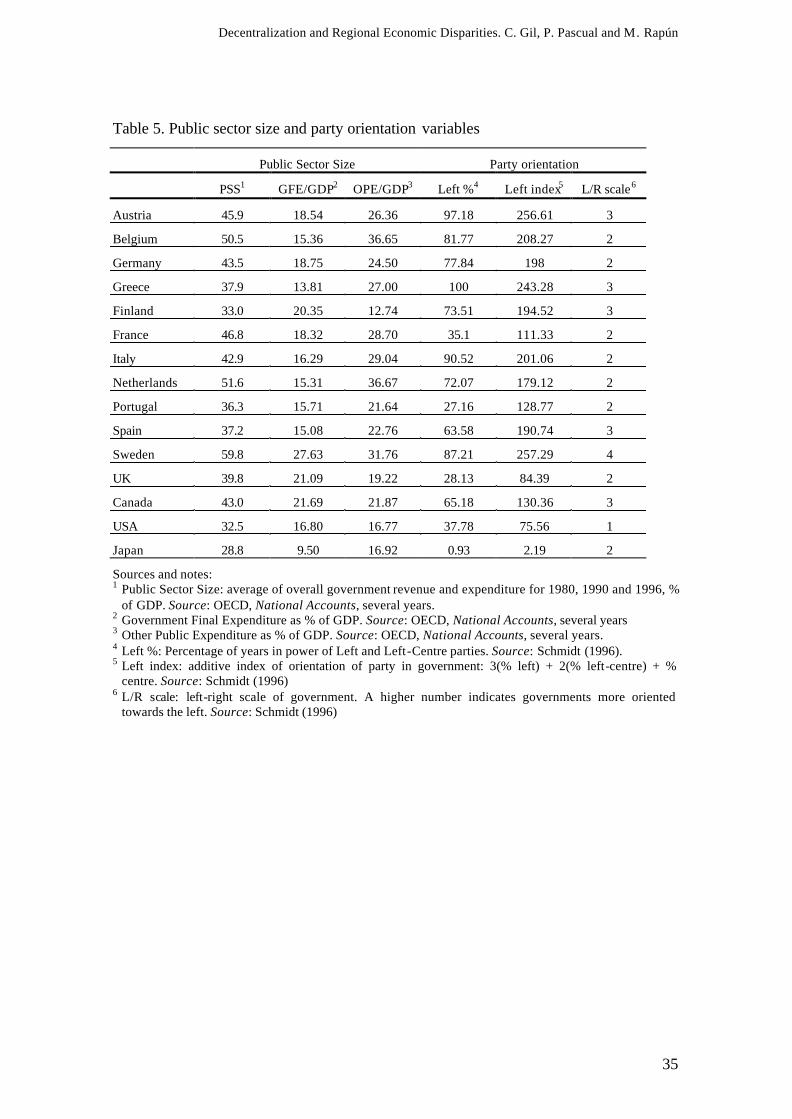
be a positive relationship in this direction. There are also other structural variables that
could be behind this result. Countries that have been traditionally governed by left-wing
parties may have been more concerned about regional disparities, and have promoted
Decentralisation and Regional Economic Disparities. C. Gil, P. Pascual and M. Rapún
19
the poorer regions either through public policies, such as direct funding or tax credits to
firms willing to produce in deprived areas, or through public investment. Table 5
includes 3 variables that measure public sector size, and three others that measure the
government profiles.
[Insert table 5 around here]
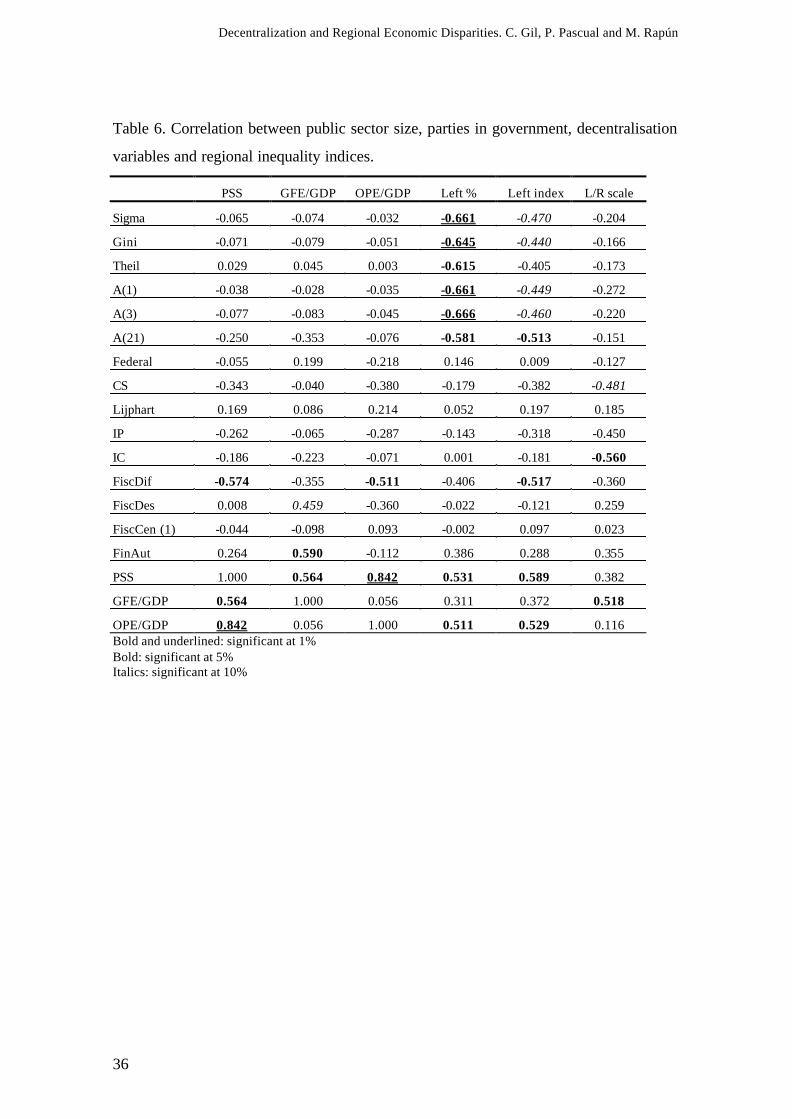
Table 6 shows the correlation of these variables with the inequality indices and with the
decentralisation variables. Correlation coefficients between variables related to public
sector size and those that measure regional inequality is lower than those previously
reported between decentralisation measures and regional inequality. Furthermore,
correlation between public sector size and decentralisation is also lower than might have
been expected. The preliminary conclusion of this survey is that the relationship
between decentralisation and regional inequality does not appear to be a spurious
correlation resulting from the omission of variables controlling for the size of the public
sector. We have also found high, significant correlation between two of the measures of
parties in power and regional inequality. The presence of left-wing parties in
government is, as expected, positive and significantly correlated with public sector size,
but not with most of the measures of decentralisation.
These results support the hypothesis that both decentralisation and the presence of left-
wing parties in government, probably with more active regional policies, could play an
important role in reducing regional inequalities in GDP per worker employed. In the
following pages we will continue the analysis of this relationship, using the multiple
regression technique.
[Insert table 6 around here]
Decentralisation and Regional Economic Disparities. C. Gil, P. Pascual and M. Rapún
20
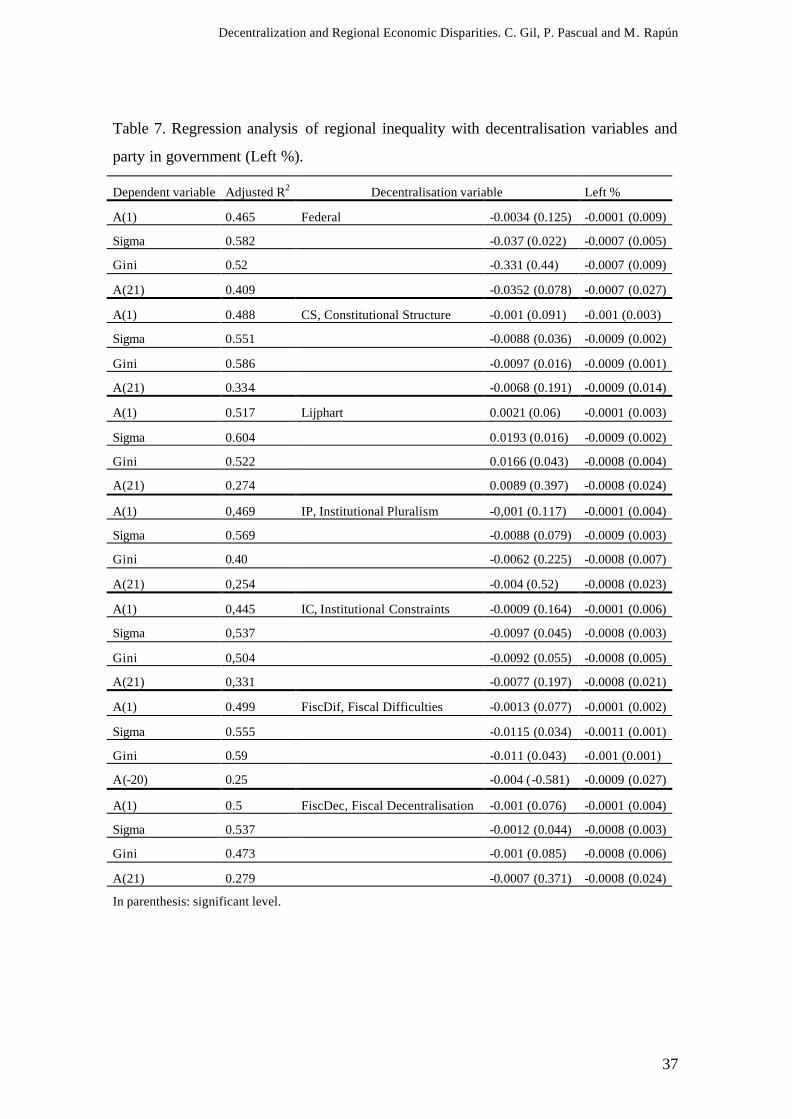
Multivariate analysis is restricted because of the small size of the sample. Neverthele ss,
it is worth testing to see if the previous relationships are still valid when more than one
variable is included at a time. We have regressed the different measures of regional
inequality as dependent variables, and two types of independent variables. First, party
government measured as the percentage of government years held by left-wing and left
of left-wing parties, because its correlation with regional inequalities is much higher
than the other two indices of party in government. And second, the nine variables
measuring decentralisation and Public Sector Size. Table 7 shows the results of these
regressions.
[Insert table 7 around here]
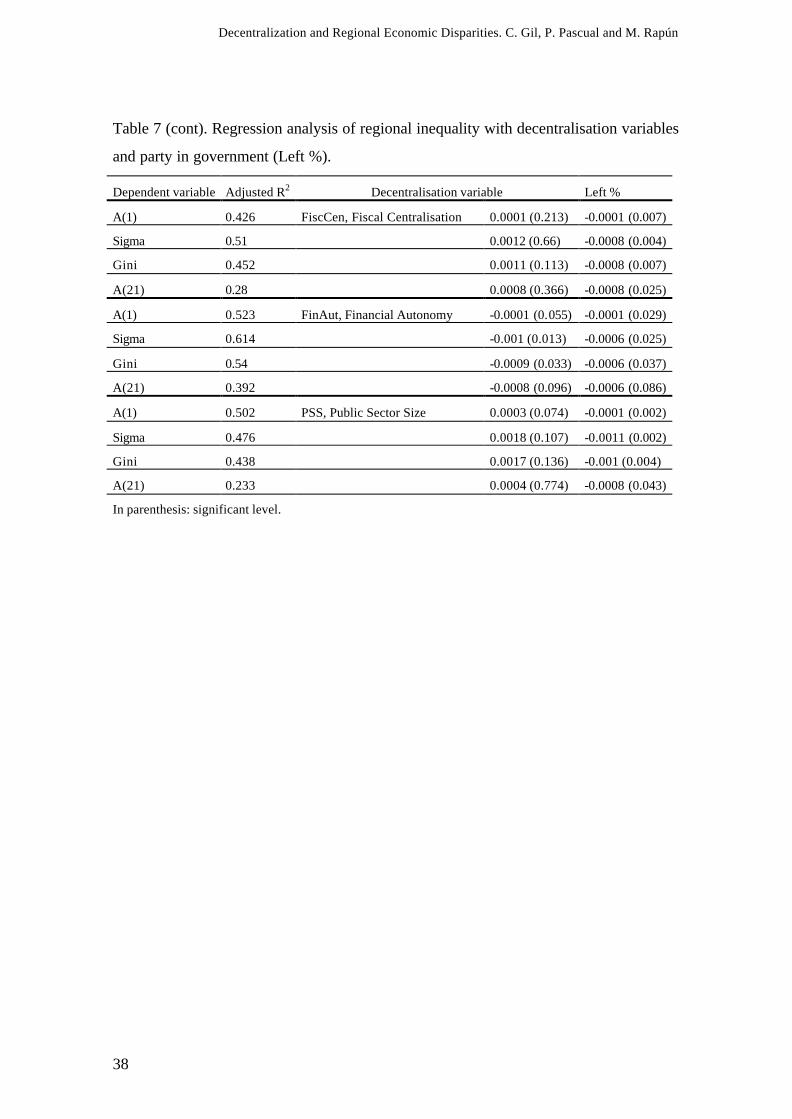
Results are quite encouraging. Both variables are significant when the dependent
variables used are Sigma or Gini, though Left % is the most relevant. Among the
variables that we have used as a proxy for decentralisation, the best result on average is
obtained with Financial Autonomy. This variable, with Sigma as the independent
variable, produces the highest R2 adjusted. The best result for A(1) as independent is
also when using Financial Autonomy, whereas for Gini the best results are obtained
with Fiscal Difficulties and Constitutional Structure, and for A(21) with Federal. Note
that for this variable, with a very high inequality aversion, the fit of the regressions is
much lower than for the rest.
We have also tested the relevance of public sector size together with political parties7.
This variable is less significant than the different measures of decentralisation, thereby
suggesting that, for regional equality in productivity, the amount governments spend is
not as relevant as the decision-making level at which spending and political decisions
take place.
Decentralisation and Regional Economic Disparities. C. Gil, P. Pascual and M. Rapún
21
Although we have few degrees of freedom, and correlated explanatory variables, we
have continued our study regressing the indices of inequality using independent
variables taken from three categories: decentralisation, public sector size, and parties in
government. We will present the results of the regression with sigma as the dependent
variable, because they are very similar to those obtained for the Gini, Theil and A(3),
though slightly more significant in most cases, with an implicit aversion to risk that is
neither too high nor too low. We alternately introduce all the measures of
decentralisation, Left % as measure of political orientation of governments, and two of
the variables that measure public sector size: total size, and GFE/GDP. Results are
shown in table 8.
[Insert table 8 around here]
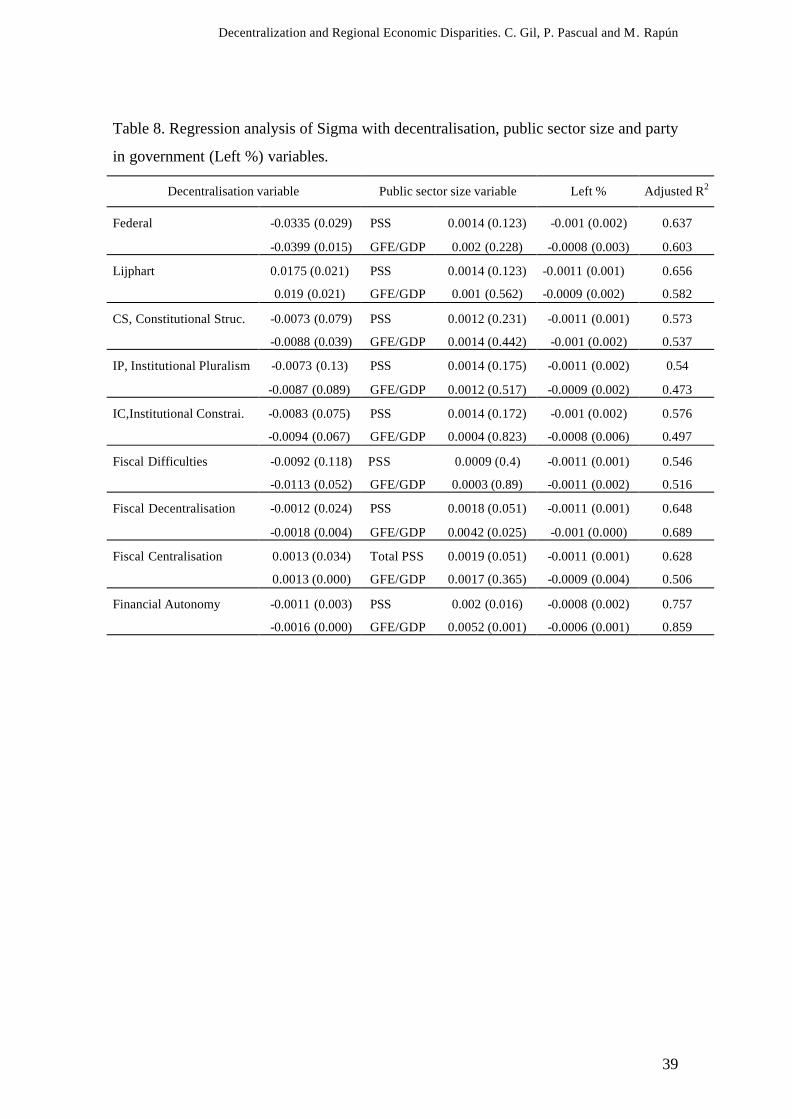
Again, we have obtained some remarkable results. The adjustment of the regressions
when using Financial Autonomy and Fiscal Decentralisation has increased substantially,
which is unusually good for this kind of study, especially with Financial Autonomy and
GFE as percentage of GDP. Adjustment is also quite good when using the other fiscal
variables.
The measure of decentralisation is significant in most of the estimation. As in most of
the previous regressions, the presence of left-wing parties in government is highly
significant. The results for public sector size are not as conclusive. With Financial
Autonomy and Fiscal Decentralisation GFE is also highly significant.
There is still, of course, the possibility that the previous study is omitting relevant
variables. But this problem would not appear to be as important as it is in studies of
comparative growth among countries. As a recent review of regional growth
Decentralisation and Regional Economic Disparities. C. Gil, P. Pascual and M. Rapún
22
performance in Europe has concluded, economic, social and political indicators are
largely determined by national dimension, which is basic for understanding regional
growth (Rodriguez-Pose, 1998). There is a multitude of variables that might affect
differences in wealth and economic performance among countries, but it seems to us
that there are fewer that might play a relevant role in explaining regional differences
within countries. One possible candidate might be investment in public and human
capital. There is good reason to expect some correlation between decentralisation and
investment in human capital and R&D. Countries that are more decentralised are more
likely to promote local higher education and research centres8. Of course, according to
the counter-argument of Prudhomme (1995), a centralised public sector could produce a
more balanced distribution of these resources9. Nevertheless, if such a correlation exists,
be it positive or negative, it is also reasonable to expect the main direction of causality
to run from decentralisation to the investment pattern.
5. Conclusion
The main conclusion that may be drawn is that decentralisation, and especially fiscal
decentralisation, does indeed seem to matter when analysing regional disparities in
labour productivity. The strong relationship between decentralisation and regional
equality does not weaken when other explanatory variables related to public sector size
and parties in government are included; quite the contrary, in fact. The composition of
government is also highly significant. Left and centre- left parties seem to create the
right conditions for equalising regional productivity.
The influence of public sector size is not so clear, but our result suggests a positive
relationship between public sector size and regional inequalities. In the best regression,
redistribution of government expenditure increases inequality. The reason for this could
Decentralisation and Regional Economic Disparities. C. Gil, P. Pascual and M. Rapún
23
be that it discourages private saving and investment in the areas where net transfers are
positive.
It is also remarkable the different results that we obtain with different measures of
decentralisation. The most significant, which also produces the highest adjusted R2, is
the one most closely related to fiscal decentralisation. Castles (1999), in his analysis of
the link between decentralisation and economic performance in a sample similar to ours,
also found evidence to support the hypothesis that it is fiscal decentralisation rather than
political structure that matters. Of course, it could be that what really matters is the size
of the budget in regional and local governments hands, but also that this variable is a
better proxy for real decentralisation of the power to decide about spending than other
measures, even those aimed at controlling for this feature.
The consequences of political and fiscal decentralisation are not merely a question of
academic concern. Reduction of regional inequalities is one of the most important issues
in the regional policy of the EU. If changes in the administrative level at which certain
political and budgetary decisions are taken can help to reduce inequalities, it would
matter, not merely in the sense that we would know more, but in the sense that we could
do more.
Unfortunately, the findings here are not adequate to demonstrate the existence of such a
relationship to a degree that would fully satisfy academics or policy-makers. There are
several issues that cast doubts over our results. The first is whether a result that appears
strong with a limited sample of countries, over one year, would hold with more
countries, in a time series analysis. There could also be problems with the comparability
of the data and the selection of indicators. Finally, it is still possible that other variables,
Decentralisation and Regional Economic Disparities. C. Gil, P. Pascual and M. Rapún
24
correlated with both decentralisation and regional dispersion of productivity, may
influence the results.
The main conclusion of this paper is that further research is needed into the link
between regional inequalities and political and fiscal decentralisation. This first step
suggests that such a relationship exists. Empirical work faces the problem of the
scarcity of regional data for a large number of countries, with existing databases being
difficult to access. However, it would be worth the effort to build up a more complete
database, in order to perform a more complex analysis. Nor is theoretical work a lesser
priority. The mechanism by which decentralisation may impact regional inequalities in
productivity (or any other measure of outcomes) is even less well known than that
relating decentralisation and economic performance at country level. If the relationship
detected here survives the scrutiny of a more detailed empirical analysis, we will need a
theoretical answer to the question of how decentralisation matters. Only with this theory
to give us a true understanding of the process will we be able to take political decisions
to reduce regional inequalities.
Decentralisation and Regional Economic Disparities. C. Gil, P. Pascual and M. Rapún
25
NOTES
1. See, for example Tomaney and Ward (2000), and Danson, Halkier and Cameron (2000)
2. The effects of spillovers in public capital are not usually considered in studies of the impact of
infrastructure on economic growth. But some authors have addressed this important issue in "network"
type of public capital, such as roads, with non-conclusive results. See for example Holtz-Eakin and
Schwartz (1995) and Kelejian and Robinson (1997).
3. One of the variables that may be relevant in making decentralisation effective is a low level of
corruption. There is evidence that level of corruption is negatively associated with affluence (Fisman and
Gratti (2000), Huther and Shah (1998)). If we do not control for this variable (as none of the mentioned
studies relating economic growth and decentralization does), decentralization, also correlated with
affluence, may capture part of this effect in samples including both developed and developing countries.
4. Zhao and Tong (2000) argues that the "get rich first" policy and "coastal development strategy" has
contributed largely to the increase in spatial disparities.
5. Defined by the Nomenclature of the Territorial Units for Statistics, established by the European
Communities Statistics Office. NUTS1 is the larger aggregation. In some countries, like Germany, they
correspond to the different Federal States, thus they are the relevant units for analysis. In others, such as
Spain, the Autonomous Communities are NUTS2, which are the relevant units. But in countries with no
regional governments is not clear which is the relevant division.
6. For a detailed analysis of the properties of the various measures of inequality, see, for example,
Champernowne and Cowel (1998).
7. We only show the results for total public sector size, because results for GFE/GDP are much worse,
and for OPE/GDP (highly correlated to total public sector size) very similar to the ones shown.
8. A good example of the positive influence of decentralisation on the promotion of human capital and
research in non-central regions may be the Spanish case. After the dictatorship, and between the late
seventies and the end of the century, Spain initiated a process of decentralisation. Prior to this process,
there were 23 public universities in Spain, six of which were located in Madrid and Barcelona. During the

Decentralisation and Regional Economic Disparities. C. Gil, P. Pascual and M. Rapún
26
decentralising process, 22 new public universities were created, some of them with faculties in different
cities. 17 of them are located in regions previously without a public university. The total number of
scholars in the new universities is now around 23% of the total, with a higher participation in technical
studies (around 30%). The percentage of students is roughly the same. In our opinion, the new
universities have contributed to a more equal distribution of human capital and investment. The fact that
interregional mobility of Spanish students (before enrolling at universities and after obtaining their
degrees) is very low supports this argument.
9. And perhaps also at the expense of efficiency in the system, because too many centres could not attain
scale economies.
Decentralisation and Regional Economic Disparities. C. Gil, P. Pascual and M. Rapún
27
REFERENCES
Armstrong, H. and Taylor, J. (2000). Regional Economics and Policy. Oxford:
Blackwell Publishers.
Atkinson, A. (1970). On the Measurement of Inequality. Journal of Economic Theory 3:
244-263.
Brennan, G. And Buchanan, J.M. (1980). The power to tax. Analytical foundations of a
fiscal constitution. Cambridge: Cambridge University Press.
Cameron, D. (1978). The Expansion of the Public Economy: A Comparative Analysis.
American Political Science Review 72-4: 1243-61.
Castles, F. (1999). Decentralisation and the Post-war Political Economy. European
Journal of Political Research 36-1: 1-26.
Champernowne C. and Cowel F. (1998). Economic inequality and income distribution.
Cambridge: Cambridge University Press.
Colomer, J. (1995). Int roducción. In J.M. Colomer (ed.) La política en Europa, 7-25.
Barcelona: Ariel.
Cukierman, A. Webb, S. and Neyapti, B. (1992). Measuring the Independence of
Central Banks and Its Effect on Policy Outcomes. The World Bank Economic Review 6-
3: 353-398.
Dillinger, W. (1994). Decentralisation and its Implication for Urban Service Delivery.
Urban Management Programme Discussion Paper No. 16, World Bank.
Danson, M, Halkier, H. Cameron, G (2000) Regional governance, institutional change
and regional development. In Danson, M, Halkier, H. Cameron (Eds) Governance,
Institutional Change and Regional Development. Aldershot: Ashgate.
Decentralisation and Regional Economic Disparities. C. Gil, P. Pascual and M. Rapún
28
Davoodi, H. and Zou, H. (1998). Fiscal Decentralisation and Economic Growth: A
Cross-Country Study. Journal of Urban Economics 43-2: 244-257.
Elazar, D.J. (1995) Federalism, in S.M. Lipset (ed.) The Encyclopedia of Democracy.
London: Routledge.
Esteban, J. (1994). La desigualdad interrregional en Europa y en España: descripcion y
analisis. In J. Esteban and X. Vives (eds) Crecimiento y convergencia regional en
España y Europa. Barcelona: Instituto de Análisis Económico and Fundación de
Economía Analítica.
Fisman, R. and Gratti, R. (2000). Decentralization and Corruption: Evidence Across
Countries. Working Paper 2290, World Bank.
Heil (1991). The Search for Leviathan Revised. Public Finance Quarterly 19: 334-346.
Holtz-Eakin, D. and Schwartz, A.E. (1995). Spatial Productivity Spillovers from Public
Infrastructure: Evidence from State Highways. International Tax and Public Finance 2:
459-468.
Huther, J. and Shah, A. (1998). Applying a simple measure of good governance to the
debate on fiscal decentralization, Working Paper 1894, World Bank.
Kelejian, H. And Robinson, D. (1997). Infrastructure productivity estimation and its
undelying econometric specifications: a sensitivity analysis. Papers in Regional Science
76(1): 115-131.
Freinkman, L. and Yossifov, P. (1999). Decentralisation in Regional Fiscal Systems in
Russia: Trends and Links to Economic Performance. Woking Paper 2100, World Bank.
Keman H. (2000). Federalism and policy performance. A conceptual and empirical
inquiry. In Ute Wachendorfer-Scmidt (ed.) Federalism and Political Performance,
London: Routledge
Decentralisation and Regional Economic Disparities. C. Gil, P. Pascual and M. Rapún
29
Lancaster T. and Hicks A. (2000). The impact of federalism and neo-corporatism on
economic performance. In Ute Wachendorfer-Scmidt (ed.) Federalism and Political
Performance, London: Routledge.
Lane, J.E. and Ersson, S. (2000). The New Institutional Politics. Performance and
Outcomes. London and New York: Routledge.
Levine R. and Renelt D. (1992). A Sensitivity Analysis of Cross-Country Growth
Regressions. American Economic Review 82-4: 942-963.
Lin, J. Y. and Liu, Z. (2000). Fiscal Decentralisation and Economic Growth in China.
Economic Development and Cultural Change 49-1: 1-22.
Lijphart, A. (1984). Democracies. New Haven and London: Yale University Press.
Ma, J. (1997). Intergovernmental Fiscal Transfer: A Comparison of Nine Countries.
World Bank Working Paper 1822.
Martinez-Vazquez J. and McNab R. (2001). Fiscal Decentralisation and Economic
Growth. Working Paper 01-1, Andrew Young School of Policy Studies, Georgia State
University.
Musgrave, R. (1959). The theory of Pubic Finance. New York: McGraw-Hill.
North, D.C. (1990). Institutions, Institutional Change, and Economic Performance.
New York: Cambridge University Press.
Oates, W.E. (1972). Fiscal Federalism. New York: Hascourt Brace Jovanovich.
Oates, W.E. (1985). Searching for Leviathan: an Empirical Study. American Economic
Review 75: 748-757.
Oates, W.E. (1993). Fiscal Decentralisation and Economic Development. National tax
Journal 2: 237-243.
Decentralisation and Regional Economic Disparities. C. Gil, P. Pascual and M. Rapún
30
Oates, W.E. (1993). Fiscal Decentralisation and Economic Development. National tax
Journal 2: 237-243.
Oates, W.E. (1999). An Essay on Fiscal federalism. Journal of Economic Literature 37:
1120-1149.
Pierson, P. (1995). Fragmented Welfare States: Federal Institutions and the
Development of Social Policy. Governance 8: 449-78.
Prudhomme, R. (1995). On the Dangers of Decentralisation. World Bank Economic
Review 9.
Rodriguez-Pose, A. (1999). The Dynamics of Growth in Regional Europe: Social and
Political Factors. Oxford: Oxford University Press.
Schmidt, M.G (1996). When parties matter: A review of the possibilities and limits of
partisan influence on public policy. European Journal of Political Research 30: 155-
183.
Sen, A. (1973). On Economic Inequality. Oxford: Oxford University Press.
Shah, A. (1998). Fiscal federalism and Macroeconomic Governance: for Better or for
Worse? World Bank Working Paper 2005, Washington
Tanzi, V. (1996). Fiscal federalism and Decentralisation: a review of Some Efficiency
and Macroeconomic Aspects, Annual World bank Conference on Development
Economics, M. Bruno and B. Pleskovic (eds.) 295-316. Washington: World Bank.
Tiebout C.H. (1956). A pure theory of local Expenditures. Journal of Political Economy
64: 416-424.
Tomaney, J and Ward, N. (2000). England and the 'new regionalism'. Regional Studies
34-5: 471-478.
Decentralisation and Regional Economic Disparities. C. Gil, P. Pascual and M. Rapún
31
Tsui, K (1996). Economic Reform and Inter-provincial Inequalities in China. Journal of
Development Economics 50: 353-368.
Woller, G. and Phillips, K. (1998). Fiscal Decentralisation and LDC Economic Growth:
an Empirical Investigation. Journal of Development Studies 34(4): 139-148.
Xie, D., Zou H., and Davoodi, H. (1999). Fiscal Decentralisation and Economic Growth
in the United States. Journal of Urban Economics 45: 228–39
Zhang, T and Zou H. (1997). Fiscal Decentralisation, the Composition of Public
Spending, and Regional Growth in India. Development Research Group Working
Paper, World Bank, Washington.
Zhang, T. and Zou, H. (1998). Fiscal Decentralisation, Public Spending, and Economic
Growth in China. Journal of Public Economics 67-2: 221–40.
Zhao, X. and Tong, S. (2000). Unequal Economic Development in China: Spatial
Disparities and Regional Policy Reconsideration, 1985-1995. Regional Studies 34(6):
549-561.
Decentralization and Regional Economic Disparities. C. Gil, P. Pascual and M. Rapún
32
Table 1. Different measures of regional inequalities in GDP per worker
Sigma Gini Theil A(1) A(3) A(21)
Value rank Value rank Value rank Value rank Value rank Value rank
Austria 0.0806 14 0.0739 13 0.0033 14 0.0033 15 0.0095 14 0.0455 14
Belgium 0.1310 7 0.1144 7 0.0085 7 0.0085 8 0.0253 7 0.1137 9
Germany 0.0612 15 0.0401 15 0.0020 15 0.0055 11 0.0055 15 0.0288 15
Greece 0.1061 10 0.0689 14 0.0060 9 0.0058 10 0.0165 10 0.1107 10
Finland 0.0992 12 0.0881 9 0.0046 12 0.0048 13 0.0150 12 0.0987 11
France 0.1886 2 0.1631 2 0.0199 1 0.0187 2 0.0487 2 0.1310 7
Italy 0.1011 11 0.0856 10 0.0049 11 0.0050 12 0.0154 11 0.0941 13
Netherlands 0.1087 9 0.0855 11 0.0060 9 0.0059 9 0.0176 9 0.1473 4
Portugal 0.1955 1 0.1812 1 0.0194 2 0.0191 1 0.0542 1 0.1787 1
Spain 0.1322 6 0.1161 5 0.0084 8 0.0086 7 0.0262 6 0.1488 3
Sweden 0.1428 4 0.1198 4 0.0126 4 0.0103 4 0.0295 5 0.1152 8
UK 0.1508 3 0.1153 6 0.0131 3 0.0122 3 0.0314 3 0.0962 12
Canada 0.0962 13 0.0813 12 0.0044 13 0.0045 14 0.0141 13 0.1322 6
USA 0.1310 7 0.1046 8 0.0089 6 0.0087 6 0.0252 8 0.1340 5
Japan 0.1425 5 0.1246 3 0.0097 5 0.0099 5 0.0304 4 0.1633 2
Sources: Eurostat, Statistisches Lamdesamt Waden-Wurttemberg (Germany), Canadian Statistics, Japan
Statistical Yearbook 2001 (Statistics Bureau, Management and Co-ordination Agency, Government of
Japan), Bureau of Economic Analysis (USA).
Table 2: Correlation coefficients of the inequality indices
Sigma Gini Theil A(1) A(3) A(21)
Sigma 1 0.974 0.977 0.945 0.990 0.708
Gini 0.974 1 0.942 0.914 0.977 0.710
Theil 0.977 0.942 1 0.980 0.983 0.577
A(1) 0.945 0.914 0.980 1 0.973 0.535
A(3) 0.990 0.977 0.983 0.973 1 0.676
A(21) 0.708 0.710 0.577 0.535 0.676 1
Average 0.918 0.904 0.892 0.869 0.920 0.641
Decentralization and Regional Economic Disparities. C. Gil, P. Pascual and M. Rapún
33
Table 3. Decentralisation measures
Federal1 CS2 Lijphart3 IP4 IC5 FiscDif6 FiscDec7 FiscCen8 FinAut9
Austria 1 2 -0.37 3 2 4.2 21.6 51.8 68.0
Belgium 0 1 0.19 3 3 3.3 4.8 62.2 30.5
Germany 1 4 -1.79 4 5 6.7 30.8 33.4 82.0
Greece 0 2 0.64 0 1 4.5 4.3 65.7 29.0
Finland 0 1 0.46 3 0 3.8 24.1 59.5 68.5
France 0 2 0.36 3 1 4.7 8.5 48.9 36.5
Italy 0 1 0.01 4 3 4.4 2.6 60.8 45.5
Netherlands 0 1 0.33 2 1 3.4 10 56.4 54.5
Portugal 0 0 0.61 2 1 4.3 4.4 70.1 16.5
Spain 0 1 -0.23 3 2 6.2 8.6 50.2 46.0
Sweden 0 0 -0.06 1 0 3.6 32 49.2 71.5
UK 0 2 1.4 1 1 3.4 8.8 73.9 40.5
Canada 1 4 -1.22 5 3 5.8 44.7 43.3 76.2
USA 1 7 -1.62 6 5 7.9 28.8 41 55.9
Japan 0 2 -1.11 3 2 7.3 25 46.6 79.3
Sources and notes: 1 Federalism is coded: 0=no, 1=yes, fro m Castles (1999). 2 Constitutional Structure, CS, from Schmidt (1996). This variable is an additive index where: federalism
0=no, 1=weak, 2=strong; 0=parliamentary, 1=president or collegial executive; 0=proportional representation, 1=modified proportional representation, 2=single-member districts; 0=no second chamber or second chamber with very weak powers, 1=weak bicameralism, 2=strong bicameralism; 0=no referendum or very infrequent, 1=frequent.
3 Lijphart index: scale of federalism as developed by Lijphart (1984) and taken from Schmidt (1996). The data are standardised arithmetic means of z-transformed indicators of the federalism-unitarism dimension proposed by Lijphart (1984). Negative values indicate strong decentralisation. Negative values indicate federalism.
4 Institutional Pluralism, IP: additive index of constitutional safeguards for sub national governance and modes of representations, based on Colomer (1995), and taken from Schmidt (1996). Composed of 4 indicators (coded 0, 1 or 2): number of effective parties, bicameralism, elected president and decentralisation. High values indicate higher barriers against national dominance.
5 Institutional Constraints, IC: additive index of federal structures, taken from Schmidt (1996). It is an additive index that measures constraints that are due to policy harmonisation in the EU, degrees of centralisation of state structures, difficulty of amending constitutions, bicameralism, central bank autonomy and referendum. Larger values indicate decentralisation
6 Fiscal Difficulty, FiscDif, is the reduction in central government revenue share that would be required to secure 1% of GDP increase in demand, as calculated by Castles (1999)
7 Fiscal Decentralisation, FiscDec, is the share of regional and local taxes in total revenue. Averages from 1973, 1983 and 1992, taken from Castles (1999) and calculated form OECD Revenue Statistics
8 Fiscal Centralisation, FiscCen, is central government revenue as a share of total revenue, averages from 1973, 1983 and 1992, taken from Castles (1999) and calculated from OECD Revenue Statistics.
9 Financial Autonomy, FinAut, measures the proportion of local and regional government final consumption in relation to general government final consumption. Average for years 1980 and 1990. Source: OECD, National Accounts.
Decentralization and Regional Economic Disparities. C. Gil, P. Pascual and M. Rapún
34
Table 4. Coefficient of correlation between the decentralisation index and regional
inequality
Political Decentralisation Fiscal Decentralisation
Federal CS Lijphart IP IC FiscDif FiscDec FiscCen Fin Aut
Sigma -0.544 -0.297 0.438 -0.265 -0.408 -0.121 -0.393 0.379 -0.700
Gini -0.505 -0.356 0.384 -0.170 -0.400 -0.120 -0.350 0.340 -0.651
Theil -0.475 -0.284 0.434 -0.294 -0.408 -0.157 -0.353 0.332 -0.619
A(1) -0.415 -0.228 0.351 -0.230 -0.295 -0.066 -0.352 0.267 -0.617
A(3) -0.495 -0.297 0.396 -0.237 -0.375 -0.095 -0.378 0.342 -0.684
A(21) -0.476 -0.194 0.170 -0.068 -0.299 0.113 -0.198 0.214 -0.571 Bold and underlined: significant at 1% Bold: significant at 5% Italics: significant at 10%
Decentralization and Regional Economic Disparities. C. Gil, P. Pascual and M. Rapún
35
Table 5. Public sector size and party orientation variables
Public Sector Size Party orientation
PSS1 GFE/GDP2 OPE/GDP3 Left %4 Left index5 L/R scale6
Austria 45.9 18.54 26.36 97.18 256.61 3
Belgium 50.5 15.36 36.65 81.77 208.27 2
Germany 43.5 18.75 24.50 77.84 198 2
Greece 37.9 13.81 27.00 100 243.28 3
Finland 33.0 20.35 12.74 73.51 194.52 3
France 46.8 18.32 28.70 35.1 111.33 2
Italy 42.9 16.29 29.04 90.52 201.06 2
Netherlands 51.6 15.31 36.67 72.07 179.12 2
Portugal 36.3 15.71 21.64 27.16 128.77 2
Spain 37.2 15.08 22.76 63.58 190.74 3
Sweden 59.8 27.63 31.76 87.21 257.29 4
UK 39.8 21.09 19.22 28.13 84.39 2
Canada 43.0 21.69 21.87 65.18 130.36 3
USA 32.5 16.80 16.77 37.78 75.56 1
Japan 28.8 9.50 16.92 0.93 2.19 2
Sources and notes: 1 Public Sector Size: average of overall government revenue and expenditure for 1980, 1990 and 1996, %
of GDP. Source: OECD, National Accounts, several years. 2 Government Final Expenditure as % of GDP. Source: OECD, National Accounts, several years 3 Other Public Expenditure as % of GDP. Source: OECD, National Accounts, several years. 4 Left %: Percentage of years in power of Left and Left-Centre parties. Source: Schmidt (1996). 5 Left index: additive index of orientation of party in government: 3(% left) + 2(% left-centre) + %
centre. Source: Schmidt (1996) 6 L/R scale: left-right scale of government. A higher number indicates governments more oriented
towards the left. Source: Schmidt (1996)
Decentralization and Regional Economic Disparities. C. Gil, P. Pascual and M. Rapún
36
Table 6. Correlation between public sector size, parties in government, decentralisation
variables and regional inequality indices.
PSS GFE/GDP OPE/GDP Left % Left index L/R scale
Sigma -0.065 -0.074 -0.032 -0.661 -0.470 -0.204
Gini -0.071 -0.079 -0.051 -0.645 -0.440 -0.166
Theil 0.029 0.045 0.003 -0.615 -0.405 -0.173
A(1) -0.038 -0.028 -0.035 -0.661 -0.449 -0.272
A(3) -0.077 -0.083 -0.045 -0.666 -0.460 -0.220
A(21) -0.250 -0.353 -0.076 -0.581 -0.513 -0.151
Federal -0.055 0.199 -0.218 0.146 0.009 -0.127
CS -0.343 -0.040 -0.380 -0.179 -0.382 -0.481
Lijphart 0.169 0.086 0.214 0.052 0.197 0.185
IP -0.262 -0.065 -0.287 -0.143 -0.318 -0.450
IC -0.186 -0.223 -0.071 0.001 -0.181 -0.560
FiscDif -0.574 -0.355 -0.511 -0.406 -0.517 -0.360
FiscDes 0.008 0.459 -0.360 -0.022 -0.121 0.259
FiscCen (1) -0.044 -0.098 0.093 -0.002 0.097 0.023
FinAut 0.264 0.590 -0.112 0.386 0.288 0.355
PSS 1.000 0.564 0.842 0.531 0.589 0.382
GFE/GDP 0.564 1.000 0.056 0.311 0.372 0.518
OPE/GDP 0.842 0.056 1.000 0.511 0.529 0.116 Bold and underlined: significant at 1% Bold: significant at 5% Italics: significant at 10%
Decentralization and Regional Economic Disparities. C. Gil, P. Pascual and M. Rapún
37
Table 7. Regression analysis of regional inequality with decentralisation variables and
party in government (Left %).
Dependent variable Adjusted R2 Decentralisation variable Left %
A(1) 0.465 Federal -0.0034 (0.125) -0.0001 (0.009)
Sigma 0.582 -0.037 (0.022) -0.0007 (0.005)
Gini 0.52 -0.331 (0.44) -0.0007 (0.009)
A(21) 0.409 -0.0352 (0.078) -0.0007 (0.027)
A(1) 0.488 CS, Constitutional Structure -0.001 (0.091) -0.001 (0.003)
Sigma 0.551 -0.0088 (0.036) -0.0009 (0.002)
Gini 0.586 -0.0097 (0.016) -0.0009 (0.001)
A(21) 0.334 -0.0068 (0.191) -0.0009 (0.014)
A(1) 0.517 Lijphart 0.0021 (0.06) -0.0001 (0.003)
Sigma 0.604 0.0193 (0.016) -0.0009 (0.002)
Gini 0.522 0.0166 (0.043) -0.0008 (0.004)
A(21) 0.274 0.0089 (0.397) -0.0008 (0.024)
A(1) 0,469 IP, Institutional Pluralism -0,001 (0.117) -0.0001 (0.004)
Sigma 0.569 -0.0088 (0.079) -0.0009 (0.003)
Gini 0.40 -0.0062 (0.225) -0.0008 (0.007)
A(21) 0,254 -0.004 (0.52) -0.0008 (0.023)
A(1) 0,445 IC, Institutional Constraints -0.0009 (0.164) -0.0001 (0.006)
Sigma 0,537 -0.0097 (0.045) -0.0008 (0.003)
Gini 0,504 -0.0092 (0.055) -0.0008 (0.005)
A(21) 0,331 -0.0077 (0.197) -0.0008 (0.021)
A(1) 0.499 FiscDif, Fiscal Difficulties -0.0013 (0.077) -0.0001 (0.002)
Sigma 0.555 -0.0115 (0.034) -0.0011 (0.001)
Gini 0.59 -0.011 (0.043) -0.001 (0.001)
A(-20) 0.25 -0.004 (-0.581) -0.0009 (0.027)
A(1) 0.5 FiscDec, Fiscal Decentralisation -0.001 (0.076) -0.0001 (0.004)
Sigma 0.537 -0.0012 (0.044) -0.0008 (0.003)
Gini 0.473 -0.001 (0.085) -0.0008 (0.006)
A(21) 0.279 -0.0007 (0.371) -0.0008 (0.024)
In parenthesis: significant level.
Decentralization and Regional Economic Disparities. C. Gil, P. Pascual and M. Rapún
38
Table 7 (cont). Regression analysis of regional inequality with decentralisation variables
and party in government (Left %).
Dependent variable Adjusted R2 Decentralisation variable Left %
A(1) 0.426 FiscCen, Fiscal Centralisation 0.0001 (0.213) -0.0001 (0.007)
Sigma 0.51 0.0012 (0.66) -0.0008 (0.004)
Gini 0.452 0.0011 (0.113) -0.0008 (0.007)
A(21) 0.28 0.0008 (0.366) -0.0008 (0.025)
A(1) 0.523 FinAut, Financial Autonomy -0.0001 (0.055) -0.0001 (0.029)
Sigma 0.614 -0.001 (0.013) -0.0006 (0.025)
Gini 0.54 -0.0009 (0.033) -0.0006 (0.037)
A(21) 0.392 -0.0008 (0.096) -0.0006 (0.086)
A(1) 0.502 PSS, Public Sector Size 0.0003 (0.074) -0.0001 (0.002)
Sigma 0.476 0.0018 (0.107) -0.0011 (0.002)
Gini 0.438 0.0017 (0.136) -0.001 (0.004)
A(21) 0.233 0.0004 (0.774) -0.0008 (0.043)
In parenthesis: significant level.
Decentralization and Regional Economic Disparities. C. Gil, P. Pascual and M. Rapún
39
Table 8. Regression analysis of Sigma with decentralisation, public sector size and party
in government (Left %) variables.
Decentralisation variable Public sector size variable Left % Adjusted R2
Federal -0.0335 (0.029) PSS 0.0014 (0.123) -0.001 (0.002) 0.637
-0.0399 (0.015) GFE/GDP 0.002 (0.228) -0.0008 (0.003) 0.603
Lijphart 0.0175 (0.021) PSS 0.0014 (0.123) -0.0011 (0.001) 0.656
0.019 (0.021) GFE/GDP 0.001 (0.562) -0.0009 (0.002) 0.582
CS, Constitutional Struc. -0.0073 (0.079) PSS 0.0012 (0.231) -0.0011 (0.001) 0.573
-0.0088 (0.039) GFE/GDP 0.0014 (0.442) -0.001 (0.002) 0.537
IP, Institutional Pluralism -0.0073 (0.13) PSS 0.0014 (0.175) -0.0011 (0.002) 0.54
-0.0087 (0.089) GFE/GDP 0.0012 (0.517) -0.0009 (0.002) 0.473
IC,Institutional Constrai. -0.0083 (0.075) PSS 0.0014 (0.172) -0.001 (0.002) 0.576
-0.0094 (0.067) GFE/GDP 0.0004 (0.823) -0.0008 (0.006) 0.497
Fiscal Difficulties -0.0092 (0.118) PSS 0.0009 (0.4) -0.0011 (0.001) 0.546
-0.0113 (0.052) GFE/GDP 0.0003 (0.89) -0.0011 (0.002) 0.516
Fiscal Decentralisation -0.0012 (0.024) PSS 0.0018 (0.051) -0.0011 (0.001) 0.648
-0.0018 (0.004) GFE/GDP 0.0042 (0.025) -0.001 (0.000) 0.689
Fiscal Centralisation 0.0013 (0.034) Total PSS 0.0019 (0.051) -0.0011 (0.001) 0.628
0.0013 (0.000) GFE/GDP 0.0017 (0.365) -0.0009 (0.004) 0.506
Financial Autonomy -0.0011 (0.003) PSS 0.002 (0.016) -0.0008 (0.002) 0.757
-0.0016 (0.000) GFE/GDP 0.0052 (0.001) -0.0006 (0.001) 0.859