the kerala regime and regional disparities in health
TRANSCRIPT
Full Terms & Conditions of access and use can be found athttp://www.tandfonline.com/action/journalInformation?journalCode=find20
India Review
ISSN: 1473-6489 (Print) 1557-3036 (Online) Journal homepage: http://www.tandfonline.com/loi/find20
The Kerala Regime and Regional Disparities inHealth Infrastructure Versus Outcomes
Suraj Jacob
To cite this article: Suraj Jacob (2014) The Kerala Regime and Regional Disparities in HealthInfrastructure Versus Outcomes, India Review, 13:1, 58-77, DOI: 10.1080/14736489.2014.873680
To link to this article: https://doi.org/10.1080/14736489.2014.873680
Published online: 20 Feb 2014.
Submit your article to this journal
Article views: 203
View Crossmark data
Citing articles: 1 View citing articles
India Review, vol. 13, no. 1, 2014, pp. 58–76Copyright © Taylor & Francis Group, LLCISSN 1473-6489 print/1557-3036 onlineDOI: 10.1080/14736489.2014.873680
The Kerala Regime and Regional Disparities inHealth Infrastructure Versus Outcomes
SURAJ JACOB
Kerala’s development trajectory has attracted considerable attention because of thestate’s human development achievements.1 A 1975 report issued under the aegis of theUnited Nations underlined these achievements, and a 1985 report by the RockefellerFoundation singled out Kerala’s health achievements from a global perspective.2 Theliterature holds that a key aspect of the “Kerala model” was the reduction of inter-regional disparities in development infrastructure and outcomes between relativelybackward Malabar in the north and relatively developed Travancore-Cochin in thesouth.3 Furthermore, the reduction of regional disparity in human development out-comes is typically attributed to reduction in regional disparity in development infras-tructure put in place by Kerala’s social democratic policy regime from 1957 onward.V. K. Ramachandran summarized the conventional wisdom about this thusly:4
A highlight of Kerala’s development experience is that public action after1957 helped close the gap in important respects between Malabar and the southerndistricts of Kerala. The disparities in health and education facilities in Travancoreand Malabar have been usefully discussed in Kabir and Krishnan (1992).5 In respectof literacy, it is clear that the literacy gap between Malabar and the princely stateswidened substantially during the period that Malabar was part of British India, andit narrowed only after mass schooling was established in Malabar after 1957. Thereduction of differences between the north and south in respect of literacy, medicalfacilities, infant mortality, immunization, and fertility and death rates, and in infras-tructural and general cultural development is a standing example of the achievementof people and governments in recent decades.
The present study revisits the argument of reduced regional disparities attributedto Kerala’s social democratic regime.6 Although the Kerala literature sometimes con-flates development outcomes and infrastructure—as seen from the aforementionedquotation—the distinction is important both from a conceptual and a policy-makingperspective. A seminal report by the World Health Organization distinguishes betweengoal “attainment” (outcomes such as life expectancy) and “resource availability” (inputsrepresenting health infrastructure and services).7 Based on this distinction, I re-evaluatethe empirical evidence for regional development in Kerala. I find that while there
Suraj Jacob is an Assistant Professor of Justice Studies at James Madison University.
The Kerala Regime and Regional Disparities 59
was indeed a reduction in regional disparity in development outcomes, there was nocorresponding reduction of disparity in development infrastructure. Further, since theconventional wisdom emphasizes the role of Kerala’s vaunted regime in infrastructuredisparity reduction, I reappraise the role of the regime on the basis of the finding thatinfrastructure disparity did not reduce.
In the following section, I begin by revisiting evidence presented in key stud-ies of the relative health trajectories of Travancore-Cochin and Malabar. I show thatthe extant literature implicitly uses a ratio measure for disparity to show that infras-tructure disparity reduced; for instance, the ratio of hospital beds (per capita) inTravancore-Cochin and Malabar became closer to unity over time. However, infras-tructure disparity did not reduce if the difference measure is used instead; for instance,the raw difference between hospital beds (per capita) in the two regions did not reduce.Over time, the ratio can become closer to unity even when the difference is constant orincreasing. I argue that from a welfare perspective the difference measure is more usefulin understanding the comparative development trajectories of the two regions. Indeed,in the previous literature the intuition regarding regional development disparity is artic-ulated in difference terms even though interpretation of the empirical evidence has beenimplicitly in ratio terms.
After establishing that health infrastructure disparity did not reduce even thoughhealth outcome disparity did reduce, I turn to two questions implied by this finding.First, what explains this puzzle? If infrastructure is an important input in determiningoutcomes, how is it possible that outcome disparity reduced without correspondingreduction in infrastructure disparity? I argue that a potential, simple explanation liesin the phenomenon of “diminishing returns.” That is, the “production function” forhealth may be such that as infrastructure increases, additional infrastructure producessmaller improvements in health outcomes. I briefly survey the global literature onhealth production functions to show that this is indeed possible and likely. The exis-tence of a diminishing returns production function would account for the puzzle ofconstant infrastructure disparity yielding reduced outcome disparity. That is, such aproduction function would imply that starting at different levels of both health infras-tructure and outcomes, as both regions underwent similar increases in infrastructure theincrease in infrastructure produced smaller improvement in outcomes in Travancore-Cochin than in Malabar, thus reducing the disparity in outcomes. As paucity of data donot currently allow for estimation of a health production function at different points intime for the regions of Kerala, I am not arguing that the diminishing returns argumentdefinitively explains the puzzle. Instead, I simply advance the possibility, based on areading of the larger literature, both from developed and developing countries, that thiscould explain the puzzle.
Second, does the Kerala regime factor hold explanatory value if in fact there wasno reduction in input disparity between Travancore-Cochin and Malabar? I argue thatit does, but not in the way envisaged by the Kerala literature on regional disparities.The Kerala literature focuses on the regime’s ability to disproportionately favor thelagging Malabar region. However, regional disparity in inputs—including disparity inpublicly provided goods—did not reduce. Instead, the argument advanced here is thatthe potency of the regime lay in increasing development inputs throughout the state
60 India Review
(albeit without favoring the lagging region), and consolidating the conditions for “pub-lic action” to effectively demand and utilize these inputs, which ultimately resulted inreduction in outcome disparity between the regions.
The Literature on Regional Disparities in KeralaThe literature on regional disparities in Kerala consistently states that there was a reduc-tion in disparities in both development inputs and outcomes over time, and arguesthat Kerala’s post-1956 welfare policy regime played a major role in this. Kerala’scomprehensive Human Development Report notes:
At the time of Independence, there existed wide regional differences within Kerala,in terms of the broad indicators of human development. . . . These differences nar-rowed down in the subsequent period and within the next 30 years, Malabar caughtup with Travancore in terms not only of facilities for health care and education, butalso in health and educational outcomes . . . ”8
Similarly, T. N. Krishnan notes:
After the formation of the State, the government placed greater emphasis on theexpansion of health-care facilities in the Malabar region in order to reduce theinequality in the availability of health care between the two regions. The reductionin death rate and in infant mortality in the Malabar region must be partly attributedto this factor.”9
The literature typically cites a study by M. Kabir and T. N. Krishnan regarding the tra-jectory of regional disparities in Kerala.10 This study and related work by the authors,particularly T. N. Krishnan, has been rightly seen as foundational in analyzing Kerala’sdevelopment trajectory. Kabir–Krishnan explicitly focus on regional health disparities,and in turn, they draw from, and expand, the data and the insights from another foun-dational study published under the aegis of the United Nations.11 In the followingsections, I revisit the evidence provided by these studies.
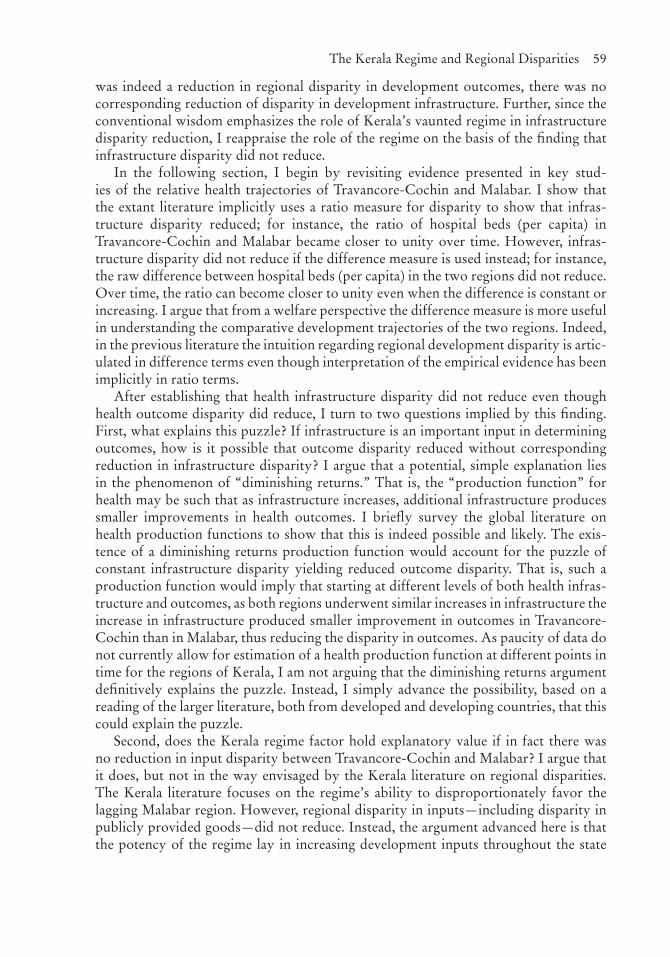
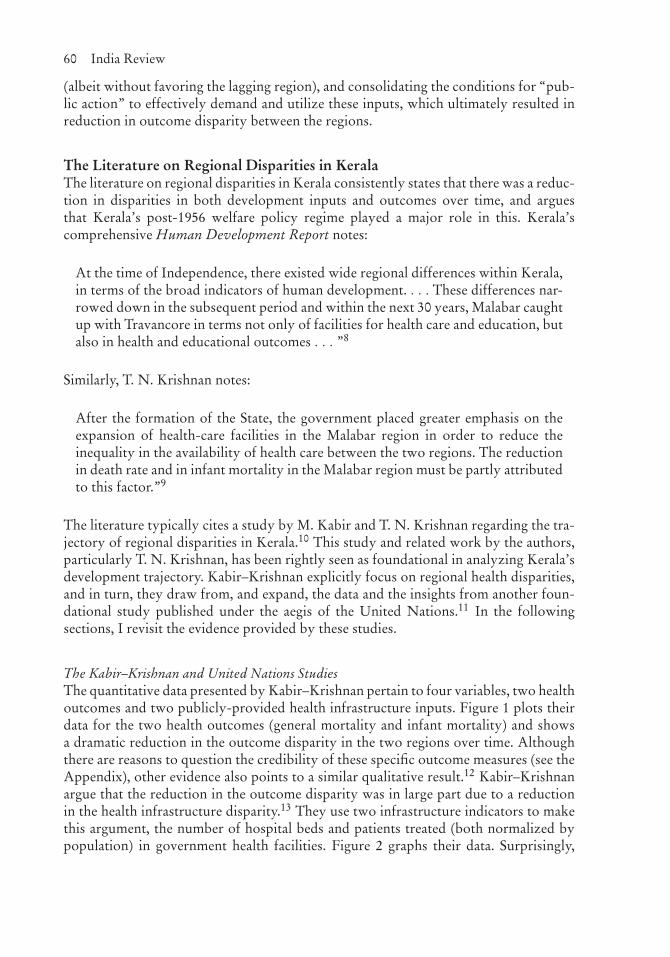
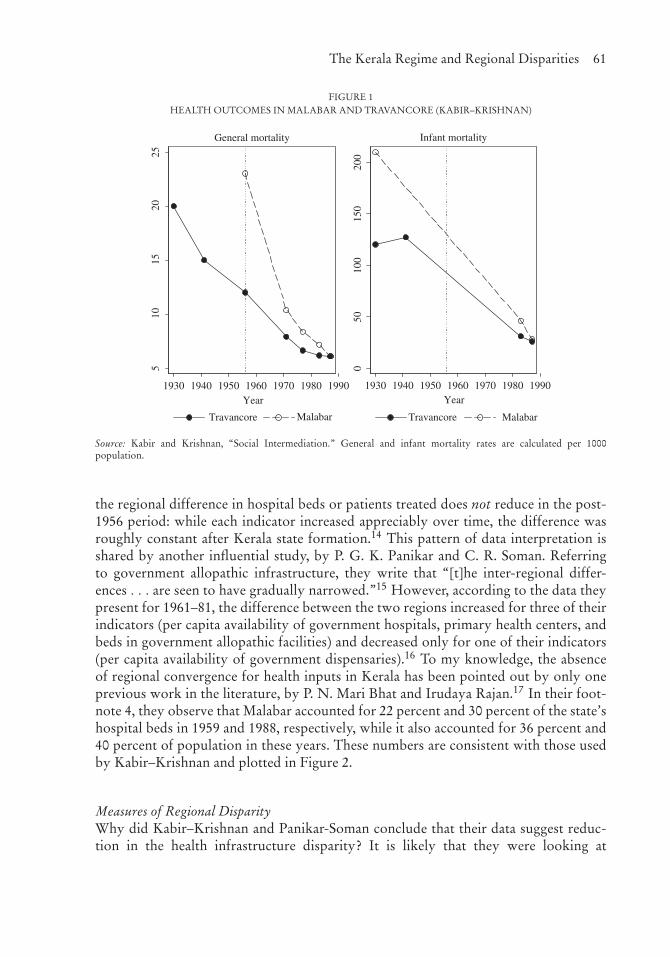
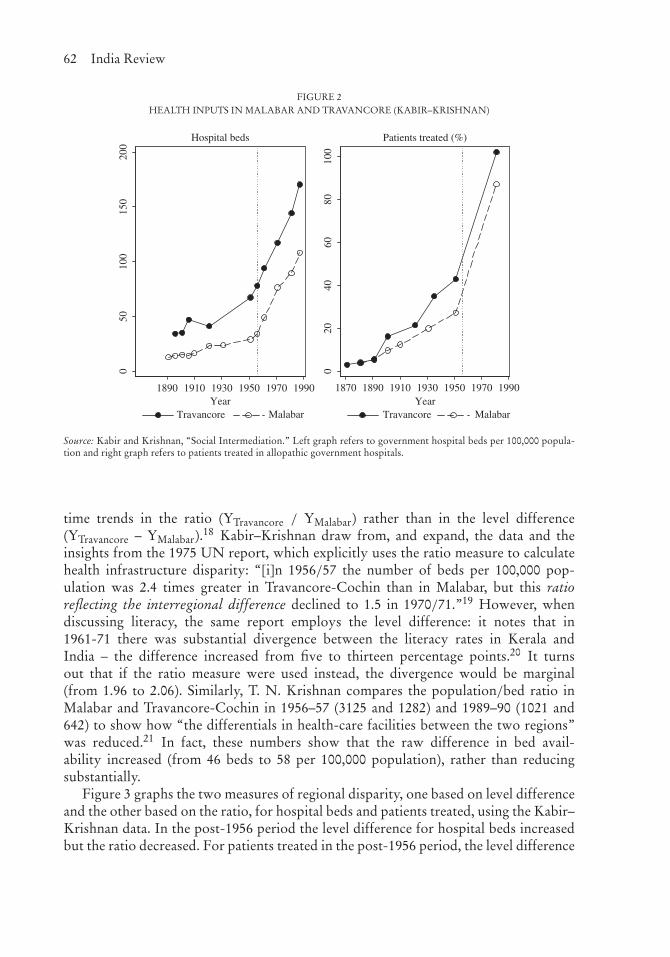
The Kabir–Krishnan and United Nations StudiesThe quantitative data presented by Kabir–Krishnan pertain to four variables, two healthoutcomes and two publicly-provided health infrastructure inputs. Figure 1 plots theirdata for the two health outcomes (general mortality and infant mortality) and showsa dramatic reduction in the outcome disparity in the two regions over time. Althoughthere are reasons to question the credibility of these specific outcome measures (see theAppendix), other evidence also points to a similar qualitative result.12 Kabir–Krishnanargue that the reduction in the outcome disparity was in large part due to a reductionin the health infrastructure disparity.13 They use two infrastructure indicators to makethis argument, the number of hospital beds and patients treated (both normalized bypopulation) in government health facilities. Figure 2 graphs their data. Surprisingly,
The Kerala Regime and Regional Disparities 61
FIGURE 1HEALTH OUTCOMES IN MALABAR AND TRAVANCORE (KABIR–KRISHNAN)
510
1520
25
1930 1940 1950 1960 1970 1980 1990Year
Travancore Malabar Travancore Malabar
General mortality
050
100
150
200
1930 1940 1950 1960 1970 1980 1990Year
Infant mortality
Source: Kabir and Krishnan, “Social Intermediation.” General and infant mortality rates are calculated per 1000population.
the regional difference in hospital beds or patients treated does not reduce in the post-1956 period: while each indicator increased appreciably over time, the difference wasroughly constant after Kerala state formation.14 This pattern of data interpretation isshared by another influential study, by P. G. K. Panikar and C. R. Soman. Referringto government allopathic infrastructure, they write that “[t]he inter-regional differ-ences . . . are seen to have gradually narrowed.”15 However, according to the data theypresent for 1961–81, the difference between the two regions increased for three of theirindicators (per capita availability of government hospitals, primary health centers, andbeds in government allopathic facilities) and decreased only for one of their indicators(per capita availability of government dispensaries).16 To my knowledge, the absenceof regional convergence for health inputs in Kerala has been pointed out by only oneprevious work in the literature, by P. N. Mari Bhat and Irudaya Rajan.17 In their foot-note 4, they observe that Malabar accounted for 22 percent and 30 percent of the state’shospital beds in 1959 and 1988, respectively, while it also accounted for 36 percent and40 percent of population in these years. These numbers are consistent with those usedby Kabir–Krishnan and plotted in Figure 2.
Measures of Regional DisparityWhy did Kabir–Krishnan and Panikar-Soman conclude that their data suggest reduc-tion in the health infrastructure disparity? It is likely that they were looking at
62 India Review
FIGURE 2HEALTH INPUTS IN MALABAR AND TRAVANCORE (KABIR–KRISHNAN)
050
100
150
200
1890 1910 1930 1950 1970 1990Year
Travancore Malabar Travancore Malabar
Hospital beds
020
4060
8010
0
1870 1890 1910 1930 1950 1970 1990Year
Patients treated (%)
Source: Kabir and Krishnan, “Social Intermediation.” Left graph refers to government hospital beds per 100,000 popula-tion and right graph refers to patients treated in allopathic government hospitals.
time trends in the ratio (YTravancore / YMalabar) rather than in the level difference(YTravancore – YMalabar).18 Kabir–Krishnan draw from, and expand, the data and theinsights from the 1975 UN report, which explicitly uses the ratio measure to calculatehealth infrastructure disparity: “[i]n 1956/57 the number of beds per 100,000 pop-ulation was 2.4 times greater in Travancore-Cochin than in Malabar, but this ratioreflecting the interregional difference declined to 1.5 in 1970/71.”19 However, whendiscussing literacy, the same report employs the level difference: it notes that in1961-71 there was substantial divergence between the literacy rates in Kerala andIndia – the difference increased from five to thirteen percentage points.20 It turnsout that if the ratio measure were used instead, the divergence would be marginal(from 1.96 to 2.06). Similarly, T. N. Krishnan compares the population/bed ratio inMalabar and Travancore-Cochin in 1956–57 (3125 and 1282) and 1989–90 (1021 and642) to show how “the differentials in health-care facilities between the two regions”was reduced.21 In fact, these numbers show that the raw difference in bed avail-ability increased (from 46 beds to 58 per 100,000 population), rather than reducingsubstantially.
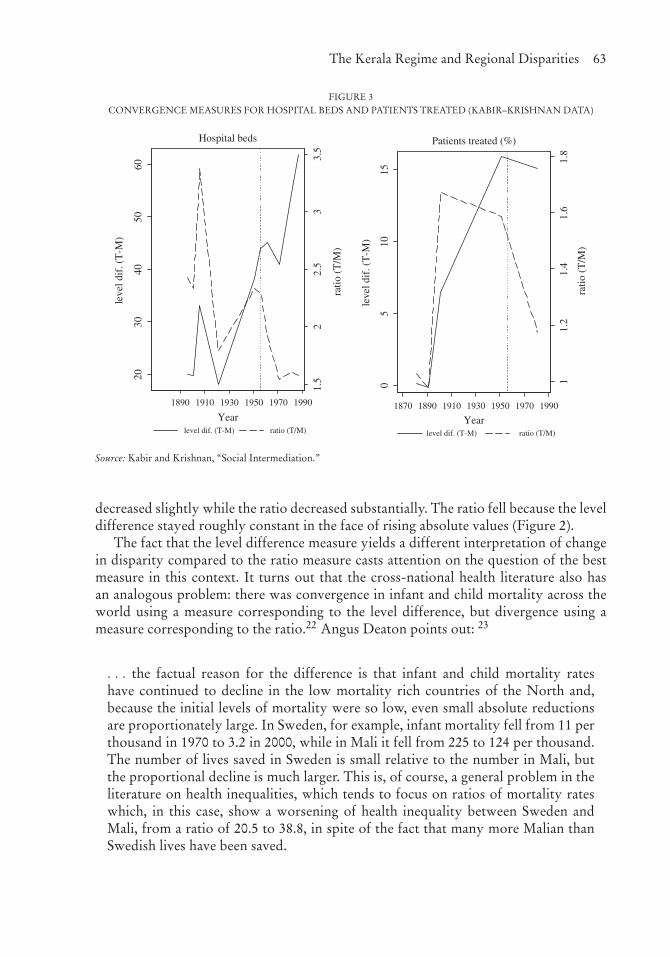
Figure 3 graphs the two measures of regional disparity, one based on level differenceand the other based on the ratio, for hospital beds and patients treated, using the Kabir–Krishnan data. In the post-1956 period the level difference for hospital beds increasedbut the ratio decreased. For patients treated in the post-1956 period, the level difference
The Kerala Regime and Regional Disparities 63
FIGURE 3CONVERGENCE MEASURES FOR HOSPITAL BEDS AND PATIENTS TREATED (KABIR–KRISHNAN DATA)
1.5
22.
53
3.5
2030
4050
60
leve
l dif
. (T
-M)
1890 1910 1930 1950 1970 1990
Yearlevel dif. (T-M) ratio (T/M)
Hospital beds
ratio
(T
/M)
11.
21.
41.
61.
8
ratio
(T
/M)
05
1015
leve
l dif
. (T
-M)
1870 1890 1910 1930 1950 1970 1990
Yearlevel dif. (T-M) ratio (T/M)
Patients treated (%)
Source: Kabir and Krishnan, “Social Intermediation.”
decreased slightly while the ratio decreased substantially. The ratio fell because the leveldifference stayed roughly constant in the face of rising absolute values (Figure 2).
The fact that the level difference measure yields a different interpretation of changein disparity compared to the ratio measure casts attention on the question of the bestmeasure in this context. It turns out that the cross-national health literature also hasan analogous problem: there was convergence in infant and child mortality across theworld using a measure corresponding to the level difference, but divergence using ameasure corresponding to the ratio.22 Angus Deaton points out: 23
. . . the factual reason for the difference is that infant and child mortality rateshave continued to decline in the low mortality rich countries of the North and,because the initial levels of mortality were so low, even small absolute reductionsare proportionately large. In Sweden, for example, infant mortality fell from 11 perthousand in 1970 to 3.2 in 2000, while in Mali it fell from 225 to 124 per thousand.The number of lives saved in Sweden is small relative to the number in Mali, butthe proportional decline is much larger. This is, of course, a general problem in theliterature on health inequalities, which tends to focus on ratios of mortality rateswhich, in this case, show a worsening of health inequality between Sweden andMali, from a ratio of 20.5 to 38.8, in spite of the fact that many more Malian thanSwedish lives have been saved.
64 India Review
Deaton’s argument indicates that from a welfare perspective what matters more is thenumber of lives saved, for which the level difference is the more appropriate mea-sure. The difference measure is also the standard measure used in much of the recentempirical literature on development.24
Other Evidence on Regional Disparities in Health Inputs Versus OutcomesIn addition to the data on mortality rates (Figure 1) and hospital beds and patientstreated in government facilities (Figure 2), other data are also consistent with the notionthat there was considerable reduction in health outcome disparities without a corre-sponding reduction in input disparities. In the following, I outline some additionalevidence.
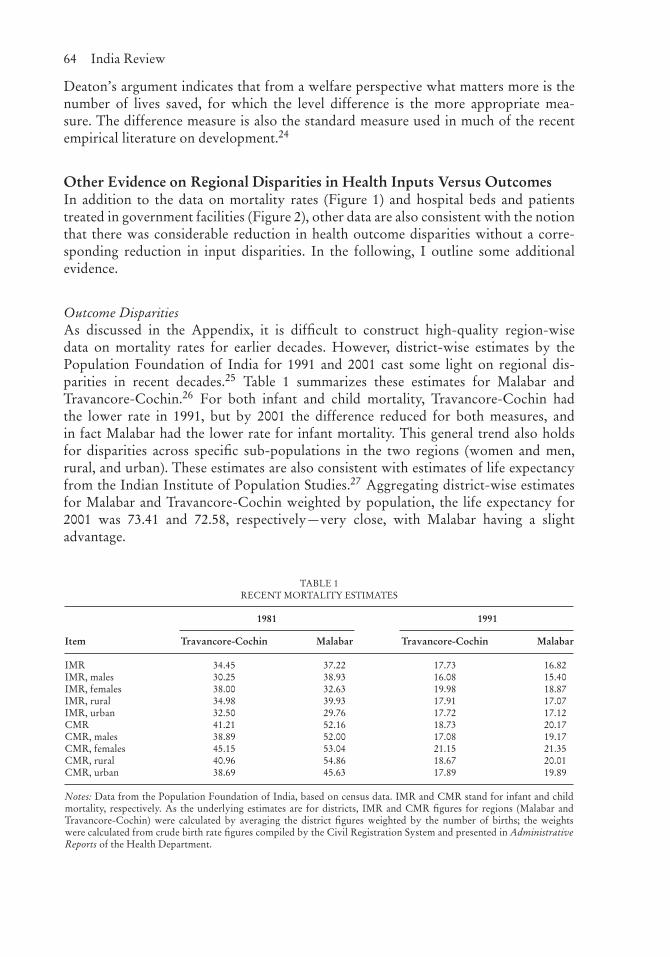
Outcome DisparitiesAs discussed in the Appendix, it is difficult to construct high-quality region-wisedata on mortality rates for earlier decades. However, district-wise estimates by thePopulation Foundation of India for 1991 and 2001 cast some light on regional dis-parities in recent decades.25 Table 1 summarizes these estimates for Malabar andTravancore-Cochin.26 For both infant and child mortality, Travancore-Cochin hadthe lower rate in 1991, but by 2001 the difference reduced for both measures, andin fact Malabar had the lower rate for infant mortality. This general trend also holdsfor disparities across specific sub-populations in the two regions (women and men,rural, and urban). These estimates are also consistent with estimates of life expectancyfrom the Indian Institute of Population Studies.27 Aggregating district-wise estimatesfor Malabar and Travancore-Cochin weighted by population, the life expectancy for2001 was 73.41 and 72.58, respectively—very close, with Malabar having a slightadvantage.
TABLE 1RECENT MORTALITY ESTIMATES
1981 1991
Item Travancore-Cochin Malabar Travancore-Cochin Malabar
IMR 34.45 37.22 17.73 16.82IMR, males 30.25 38.93 16.08 15.40IMR, females 38.00 32.63 19.98 18.87IMR, rural 34.98 39.93 17.91 17.07IMR, urban 32.50 29.76 17.72 17.12CMR 41.21 52.16 18.73 20.17CMR, males 38.89 52.00 17.08 19.17CMR, females 45.15 53.04 21.15 21.35CMR, rural 40.96 54.86 18.67 20.01CMR, urban 38.69 45.63 17.89 19.89
Notes: Data from the Population Foundation of India, based on census data. IMR and CMR stand for infant and childmortality, respectively. As the underlying estimates are for districts, IMR and CMR figures for regions (Malabar andTravancore-Cochin) were calculated by averaging the district figures weighted by the number of births; the weightswere calculated from crude birth rate figures compiled by the Civil Registration System and presented in AdministrativeReports of the Health Department.
The Kerala Regime and Regional Disparities 65
TABLE 2FERTILITY ESTIMATES USING CHILD-WOMAN RATIO
CWR1 CWR2
Census year Period TC M Dif.(TC-M)
Ratio(TC/M)
Period TC M Dif.(TC-M)
Ratio(TC/M)
1951 1946–51 590 501 89 1.18 1941–46 576 481 95 1.201961 1956–61 647 622 25 1.04 1951–56 722 657 65 1.101971 1966–71 526 591 −65 0.89 1961–66 656 682 −26 0.961981 1976–81 360 482 −122 0.75 1971–76 475 605 −130 0.791991 1986–91 293 384 −91 0.76 1981–86 423 599 −176 0.712001 1996–01 281 333 −52 0.84 1991–96 346 432 −86 0.80
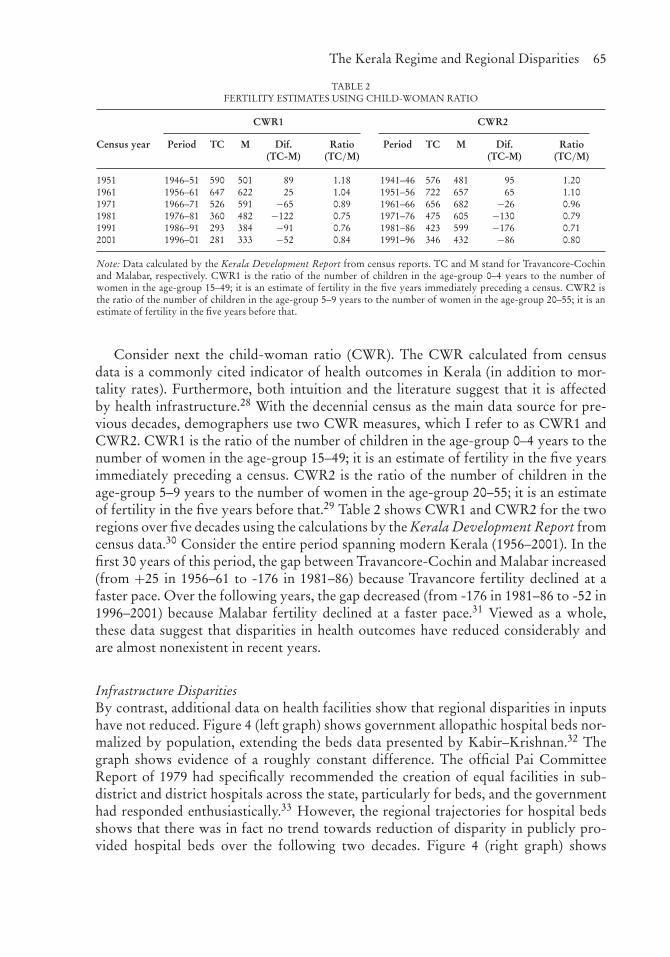
Note: Data calculated by the Kerala Development Report from census reports. TC and M stand for Travancore-Cochinand Malabar, respectively. CWR1 is the ratio of the number of children in the age-group 0–4 years to the number ofwomen in the age-group 15–49; it is an estimate of fertility in the five years immediately preceding a census. CWR2 isthe ratio of the number of children in the age-group 5–9 years to the number of women in the age-group 20–55; it is anestimate of fertility in the five years before that.
Consider next the child-woman ratio (CWR). The CWR calculated from censusdata is a commonly cited indicator of health outcomes in Kerala (in addition to mor-tality rates). Furthermore, both intuition and the literature suggest that it is affectedby health infrastructure.28 With the decennial census as the main data source for pre-vious decades, demographers use two CWR measures, which I refer to as CWR1 andCWR2. CWR1 is the ratio of the number of children in the age-group 0–4 years to thenumber of women in the age-group 15–49; it is an estimate of fertility in the five yearsimmediately preceding a census. CWR2 is the ratio of the number of children in theage-group 5–9 years to the number of women in the age-group 20–55; it is an estimateof fertility in the five years before that.29 Table 2 shows CWR1 and CWR2 for the tworegions over five decades using the calculations by the Kerala Development Report fromcensus data.30 Consider the entire period spanning modern Kerala (1956–2001). In thefirst 30 years of this period, the gap between Travancore-Cochin and Malabar increased(from +25 in 1956–61 to -176 in 1981–86) because Travancore fertility declined at afaster pace. Over the following years, the gap decreased (from -176 in 1981–86 to -52 in1996–2001) because Malabar fertility declined at a faster pace.31 Viewed as a whole,these data suggest that disparities in health outcomes have reduced considerably andare almost nonexistent in recent years.
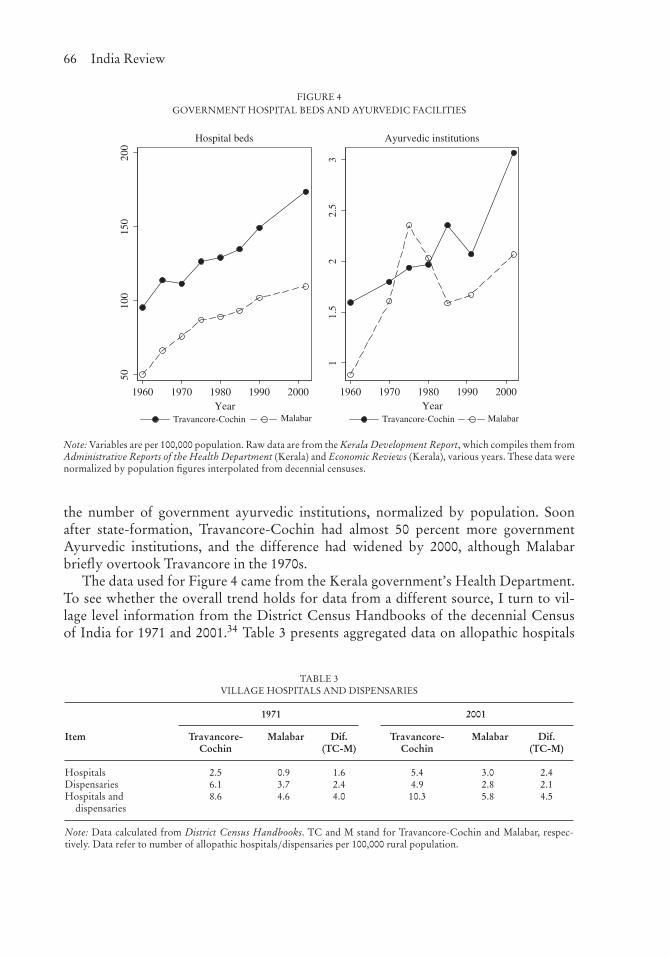
Infrastructure DisparitiesBy contrast, additional data on health facilities show that regional disparities in inputshave not reduced. Figure 4 (left graph) shows government allopathic hospital beds nor-malized by population, extending the beds data presented by Kabir–Krishnan.32 Thegraph shows evidence of a roughly constant difference. The official Pai CommitteeReport of 1979 had specifically recommended the creation of equal facilities in sub-district and district hospitals across the state, particularly for beds, and the governmenthad responded enthusiastically.33 However, the regional trajectories for hospital bedsshows that there was in fact no trend towards reduction of disparity in publicly pro-vided hospital beds over the following two decades. Figure 4 (right graph) shows
66 India Review
FIGURE 4GOVERNMENT HOSPITAL BEDS AND AYURVEDIC FACILITIES
5010
015
020
0
1960 1970 1980 1990 2000Year
Travancore-Cochin Malabar
Hospital beds
11.
52
2.5
3
1960 1970 1980 1990 2000Year
Travancore-Cochin Malabar
Ayurvedic institutions
Note: Variables are per 100,000 population. Raw data are from the Kerala Development Report, which compiles them fromAdministrative Reports of the Health Department (Kerala) and Economic Reviews (Kerala), various years. These data werenormalized by population figures interpolated from decennial censuses.
the number of government ayurvedic institutions, normalized by population. Soonafter state-formation, Travancore-Cochin had almost 50 percent more governmentAyurvedic institutions, and the difference had widened by 2000, although Malabarbriefly overtook Travancore in the 1970s.
The data used for Figure 4 came from the Kerala government’s Health Department.To see whether the overall trend holds for data from a different source, I turn to vil-lage level information from the District Census Handbooks of the decennial Censusof India for 1971 and 2001.34 Table 3 presents aggregated data on allopathic hospitals
TABLE 3VILLAGE HOSPITALS AND DISPENSARIES
1971 2001
Item Travancore-Cochin
Malabar Dif.(TC-M)
Travancore-Cochin
Malabar Dif.(TC-M)
Hospitals 2.5 0.9 1.6 5.4 3.0 2.4Dispensaries 6.1 3.7 2.4 4.9 2.8 2.1Hospitals and
dispensaries8.6 4.6 4.0 10.3 5.8 4.5
Note: Data calculated from District Census Handbooks. TC and M stand for Travancore-Cochin and Malabar, respec-tively. Data refer to number of allopathic hospitals/dispensaries per 100,000 rural population.
The Kerala Regime and Regional Disparities 67
and dispensaries (per 100,000 rural population) in the two regions. The regional differ-ence for village hospitals increased between 1971 and 2001 while the regional differencefor village dispensaries decreased. It is possible that there were changes in categoriza-tion of hospitals and dispensaries over time through upgrades or changing definitions.35
The table also provides data for hospitals and dispensaries combined; there was a smallincrease in the regional difference over the three decades.36 Overall, the data presentedin Table 3 do not suggest a marked reduction in regional infrastructure differences.
Regional Disparities and the Health Production FunctionThe evidence presented so far suggests an intriguing pattern that is different for healthoutcomes and health infrastructure inputs. The outcome disparity between the regionsseems to have narrowed over time while the input disparity has not narrowed. Whatexplains the puzzle of reduction in the mortality disparity and lack of reduction in thehealth infrastructure disparity?
One possibility is that the indicators of health infrastructure presented in previoussections are not the appropriate ones for operationalizing the concept of health infras-tructure in Kerala.37 While this possibility cannot be completely ruled out, the evidenceI have presented is for indicators that are standard in the literature. For instance,T. N. Krishnan explicitly notes that bed availability is “a good indicator of the over-all availability of health care,” as does V. Raman Kutty.38 A second possibility is thatsome factor other than health infrastructure caused the outcome disparity to narrowover time. For instance, the land reforms movement, and the communist movement ingeneral—which were arguably more potent in Malabar than in Travancore-Cochin—may have had indirect positive effects on health outcomes.39 While this possibilitycannot be ruled out, the literature explicitly argues that health infrastructure was a keyfactor.40
Another possibility is that the relationship between health infrastructure andmortality—that is, improvement in health infrastructure causing reduction inmortality—was stronger in the case of Malabar. This could be the case if Malabarstarted out with a lower level of health inputs, and the provision of improved healthinfrastructure substituted for the relative absence of other health inputs there. Such a“diminishing returns” argument could explain why the outcome disparity narrowedover time despite the infrastructure disparity not doing so. Apoorva Shah speculates onthe possibility of a diminishing returns mechanism producing convergence in outcomesbetween Malabar and Travancore.41 To my knowledge, no other scholar has advancedthis argument for these regions.42
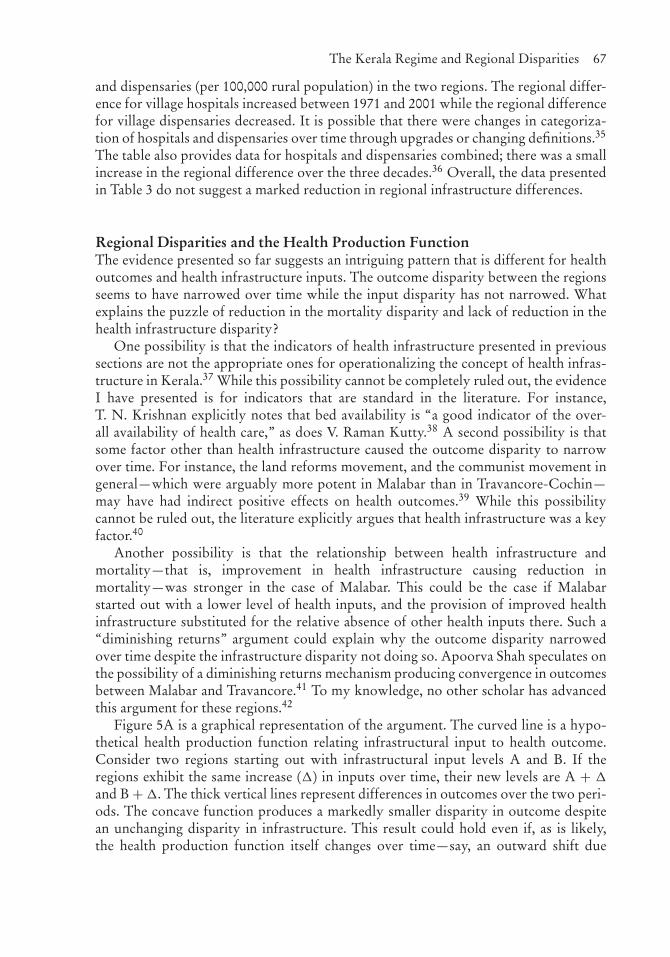
Figure 5A is a graphical representation of the argument. The curved line is a hypo-thetical health production function relating infrastructural input to health outcome.Consider two regions starting out with infrastructural input levels A and B. If theregions exhibit the same increase (�) in inputs over time, their new levels are A + �
and B + �. The thick vertical lines represent differences in outcomes over the two peri-ods. The concave function produces a markedly smaller disparity in outcome despitean unchanging disparity in infrastructure. This result could hold even if, as is likely,the health production function itself changes over time—say, an outward shift due
68 India Review
FIGURE 5REGIONAL DISPARITIES AND DIMINISHING RETURNS
Infrastructure input
Out
com
e
A A + Δ B B + Δ
Graph (b)
Infrastructure input
Out
com
e
A A + Δ B B + Δ
Graph (a)
to technological and organizational improvements—if it continues to have a concaveshape. As the shape of the production function determines whether outcome dispar-ity decreases, other shapes can yield other results. For instance, Figure 5B introducesconvexity for a portion of the production function such that the outcome disparitynow increases for specific infrastructure distributions. The analysis of health history byKabir and Krishnan suggests that in the second half of the nineteenth century and earlytwentieth century, the relationship between health infrastructure inputs and outcomeswas indeed convex, but that it changed to a concave relationship in later decades.
Related LiteratureThe aforementioned argument—that diminishing returns can account for inter-temporal change in regional disparities in Kerala—is consistent with the larger literatureon health inputs and outcomes. In exploring the impact of health facilities on healthoutcomes, economists typically estimate health production functions, which can be atthe level of the individual or economy-wide. In addition to health facilities, other inputsinclude environmental, socioeconomic, and lifestyle factors. Using per capita healthexpenditure as a proxy for health inputs and denoting health outcomes by mortalityrates or life expectancy, the literature (national and cross-national) finds strong dimin-ishing returns, suggesting a situation of “flat of the curve medicine.”43 Similar resultshold for the public sector component of healthcare expenditure, both for developedand developing countries.44
Kerala in National and International PerspectiveThe evidence for health outcomes in Kerala when compared with India and othercountries is also consistent with a diminishing returns argument. Figure 6 (left graph)
The Kerala Regime and Regional Disparities 69
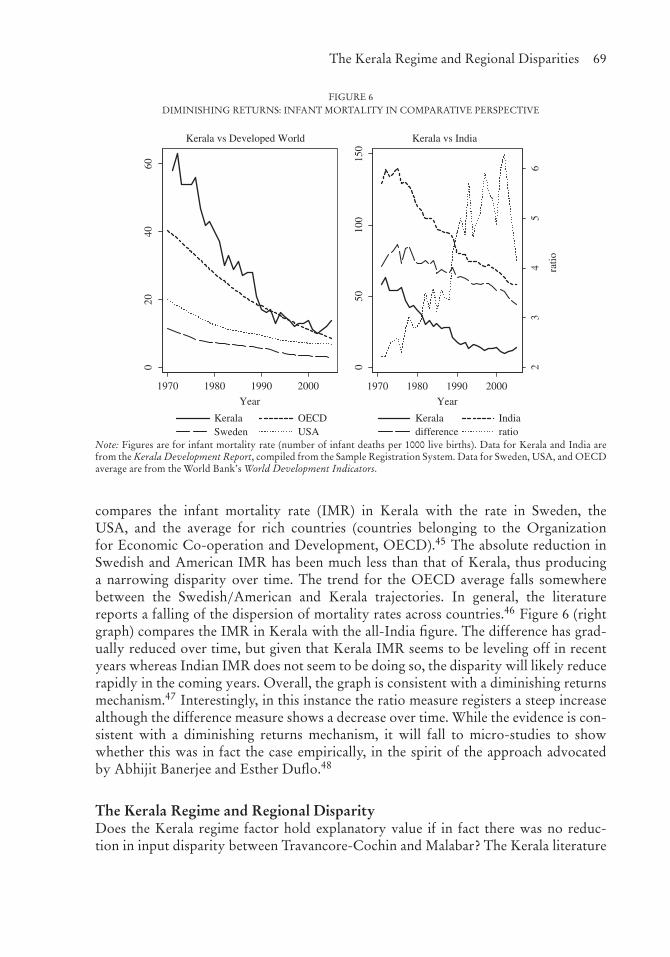
FIGURE 6DIMINISHING RETURNS: INFANT MORTALITY IN COMPARATIVE PERSPECTIVE
020
4060
1970 1980 1990 2000
Year
Kerala vs Developed World
23
45
6
ratio
050
100
150
1970 1980 1990 2000
Year
Kerala OECDSweden USA
Kerala Indiadifference ratio
Kerala vs India
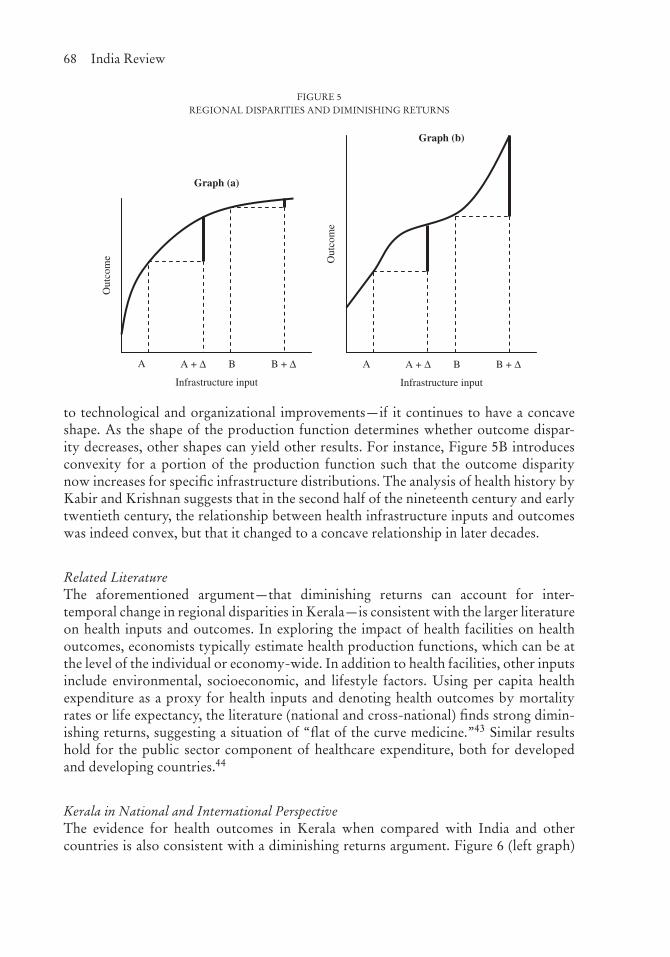
Note: Figures are for infant mortality rate (number of infant deaths per 1000 live births). Data for Kerala and India arefrom the Kerala Development Report, compiled from the Sample Registration System. Data for Sweden, USA, and OECDaverage are from the World Bank’s World Development Indicators.
compares the infant mortality rate (IMR) in Kerala with the rate in Sweden, theUSA, and the average for rich countries (countries belonging to the Organizationfor Economic Co-operation and Development, OECD).45 The absolute reduction inSwedish and American IMR has been much less than that of Kerala, thus producinga narrowing disparity over time. The trend for the OECD average falls somewherebetween the Swedish/American and Kerala trajectories. In general, the literaturereports a falling of the dispersion of mortality rates across countries.46 Figure 6 (rightgraph) compares the IMR in Kerala with the all-India figure. The difference has grad-ually reduced over time, but given that Kerala IMR seems to be leveling off in recentyears whereas Indian IMR does not seem to be doing so, the disparity will likely reducerapidly in the coming years. Overall, the graph is consistent with a diminishing returnsmechanism.47 Interestingly, in this instance the ratio measure registers a steep increasealthough the difference measure shows a decrease over time. While the evidence is con-sistent with a diminishing returns mechanism, it will fall to micro-studies to showwhether this was in fact the case empirically, in the spirit of the approach advocatedby Abhijit Banerjee and Esther Duflo.48
The Kerala Regime and Regional DisparityDoes the Kerala regime factor hold explanatory value if in fact there was no reduc-tion in input disparity between Travancore-Cochin and Malabar? The Kerala literature
70 India Review
focuses on the regime’s ability to disproportionately favor the lagging Malabarregion. However, regional disparity in inputs—including disparity in publicly providedgoods—did not reduce. This suggests that the regime did not disproportionately favorMalabar, despite its intentions or political claims to the contrary. Instead, the potencyof the regime lay in increasing development inputs throughout the state (albeit withoutfavoring the lagging region), and consolidating the conditions for “public action” toeffectively demand and utilize these inputs, which ultimately resulted in reduction inoutcome disparity between the regions. I sketch out this argument as follows.
Compared to the rest of India, Kerala’s policy regime was an outlier with regardto policies focused on the social sector, particularly health and education.49 Until the1990s, the share of health and education in total public expenditure in Kerala exceededthe Indian average by over 10 percentage points, and this can be attributed specificallyto the post-1956 regime.50 Kerala’s social sector expenditures were also more efficientlyutilized in providing healthcare and education facilities for underserved populations.For instance, in the early 1990s, 92 percent of births occurred in medical institutionsand 89 percent of children aged 12–23 months received vaccinations, compared with24 percent and 70 percent for India as a whole; and in 2006, Kerala’s rate of child malnu-trition was almost half the all-India figure.51 Further, the greater public fiscal and policycommitment to the social sector went alongside greater public awareness and demand—described as “public action” in the Kerala context—which led to better utilization aswell as improved equity.52 Kerala’s success in improving health outcomes was one offive worldwide cases to be singled out in a seminal 1985 report commissioned by theRockefeller Foundation, Good Health at Low Cost.
Especially at the time, other regimes—in other parts of India and elsewhere—wereless able to commit and implement healthcare and education policies, or consolidatethe conditions for public action. Accompanying these developments was a reduction inregional disparities, likely through a diminishing returns mechanism. Thus, while theimpact of the Kerala regime on overall development outcomes was direct, its impact onregional outcome disparity was indirect. It is even possible that the impact on outcomedisparity was a largely unintended consequence of the working of the regime, despitepolitical claims and intentions to directly favor Malabar (in terms of developmentinputs) over Travancore-Cochin.
ConclusionThis study has explored the comparative health trajectories of Malabar and Travancore-Cochin. To better explore change in regional disparity over time, and the possibleassociation with the Kerala regime, I distinguished between regional disparity in healthinfrastructure and health outcomes. I showed that different convergence measures—ratio versus difference—can yield different conclusions, and argued that the differencemeasure is more meaningful for understanding the developing world. Whereas the dis-tinction is a technical one, it produces a significantly different implication regardingregional disparity, and in Kerala’s case, the role of political and policy regimes as well.Therefore, the analysis presented here has larger methodological implications for thestudy of time trajectories of regional disparity.
The Kerala Regime and Regional Disparities 71
The re-evaluation of the evidence for disparity yielded the puzzle of reducing out-come disparity without reducing infrastructure disparity. I argued that the puzzle iseasily explained if the production function shows diminishing returns, and that this isin fact quite plausible. However, for lack of adequate data I did not establish conclu-sively that Kerala’s regions actually do conform to a diminishing returns productionfunction. More research is needed on this issue, both for Kerala and other states ofIndia.
However, the fact that infrastructure disparity did not reduce in the manner that theextant literature has described, suggests the need for reappraising the role of Kerala’ssocial democratic regime, which has been celebrated, among other things, for reducinginfrastructure disparity. I have suggested that the success of Kerala’s regime lay notin pro-actively promoting healthcare in Malabar over Travancore-Cochin, but rather inpromoting healthcare equally across both regions in a more potent manner than regimesin other parts of India and much of the developing world. In the presence of diminishingreturns, the potency of such a keen—but largely region-neutral—development policyregime is a plausible explanation for Kerala’s impressive human development outcomes.
NOTES
I thank Ashok Chandran, Joseph John, K. Narayanan Nair, and V. Santhakumar for insightful comments on earlierdrafts of the article.
1. For instance, see P. N. Mari Bhat and S. Irudaya Rajan, “Demographic Transition in Kerala Revisited,”Economic and Political Weekly Vol. 25, No. 35/36 (1990), pp. 1957–1980; Barbara H. Chasin and RichardW. Franke, Kerala: Radical Reform as Development in an Indian State (San Francisco: Institute for Food andDevelopment Policy, 1989); Manali Desai, “Indirect British Rule, State Formation, and Welfarism in Kerala,India, 1860–1957,” Social Science History Vol. 29, No. 3 (2005), pp. 457–488; Government of Kerala, KeralaHuman Development Report (Trivandrum: State Planning Board, Government of Kerala, 2005); PatrickHeller, “Social Capital as a Product of Class Mobilization and State Intervention: Industrial Workers inKerala, India,” World Development Vol. 24, No. 6 (1996), pp. 1055–1071; Ronald J. Herring, Land to theTiller: The Political Economy of Agrarian Reform in South Asia (New Haven: Yale University Press, 1983);Robin Jeffrey, Politics, Women and Well-Being: How Kerala Became a "Model" (Houndmills, UK: MacmillanPress, 1992); M. Kabir and T. N. Krishnan, “Social Intermediation and Health Change: Lessons from Kerala,”in Monica Das Gupta, Lincoln C. Chen and T. N. Krishnan, eds., Health, Poverty and Development inIndia (New Delhi: Oxford University Press, 1996), pp. 239–269; K. P. Kannan, “Public Intervention andPoverty Alleviation: A Study of the Declining Incidence of Rural Poverty in Kerala, India,” Developmentand Change Vol. 26 (1995), pp. 701–727; T. N. Krishnan, “The Route to Social Development in Kerala:Social Intermediation and Public Action,” in Santosh Mehrotra and Richard Jolly, eds., Development witha Human Face: Experiences in Social Achievement and Economic Growth (New York: Oxford UniversityPress, 2000), pp. 204–234; Georges K. Lieten, “The Human Development Puzzle in Kerala,” Journal ofContemporary Asia Vol. 32, No. 1 (2002), pp. 47–68; P. G. K. Panikar and C. R. Soman, Health Status ofKerala: The Paradox of Economic Backwardness and Health Development (Thiruvananthapuram: Centrefor Development Studies, 1985); Govindan Parayil, “The ‘Kerala Model’ of Development: Development andSustainability in the Third World,” Third World Quarterly Vol. 17, No. 5 (1996), pp. 941–958; PlanningCommission, Kerala Development Report (New Delhi: Academic Foundation for Government of India,2008); V. K. Ramachandran, “On Kerala’s Development Achievements,” in Jean Dreze and Amartya Sen,eds., Indian Development: Selected Regional Perspectives (New Delhi: Oxford University Press, 1997),pp. 205–356; K. Ravi Raman, ed., Development, Democracy and the State: Critiquing the Kerala Model ofDevelopment (London: Routledge, 2010); Amartya Sen, “Radical Needs and Moderate Reforms,” in JeanDreze and Amartya Sen, eds., Indian Development: Selected Regional Perspectives (New Delhi: OxfordUniversity Press, 1997), pp. 1–32; Prerna Singh, “We-Ness and Welfare: A Longitudinal Analysis of SocialDevelopment in Kerala, India,” World Development Vol. 39, No. 2 (2011), pp. 282–293; Michael Tharakan,“History as Development Experience, Disaggregated and Deconstructed Analysis of Kerala,” PhD thesis,Mahatma Gandhi University, 1998.
2. United Nations, ed., Poverty, Unemployment and Development Policy. A Case Study of Selected Issues withReference to Kerala (New York: United Nations, 1975); Scott B. Halstead, Julia A. Walsh, and Kenneth S.Warren, eds. Good Health at Low Cost (Bellagio: Rockefeller Foundation, 1985).
72 India Review
3. Kabir and Krishnan, “Social Intermediation”; the Kerala Development Report; Ramachandran, “On Kerala’sDevelopment Achievements”; Tharakan, “History”; UN, Poverty (see note 1 above)
4. Ramachandran, “On Kerala’s Development Achievements” (see note 1 above), p. 324.5. Here, Ramachandran refers to an earlier version of the study by Kabir and Krishnan, but with the same title,
presented at a conference in 1992, and available as a working paper (M. Kabir and T. N. Krishnan, “SocialIntermediation and Health Change: Lessons from Kerala,” Working Paper No. 251 (Thiruvananthapuram:Center for Development Studies, 1992)).
6. I use the term “regime” to denote a set of policies and the institutional arrangements that lend it coher-ence; this is in keeping with a larger literature on policy and political regimes (for instance, see Paul Pierson,Politics in Time: History, Institutions, and Social Analysis (Princeton: Princeton University Press, 2004); andCarter A. Wilson, “Policy Regimes and Policy Change,” Journal of Public Policy Vol. 20, No. 3 (2000),pp. 247–274). Social democratic regimes—characterized by the Scandinavian model—emphasize social jus-tice and welfare provision (Gøsta Esping-Anderson, The Three Worlds of Welfare Capitalism (Princeton:Princeton University Press, 1993)). Patrick Heller explicitly notes that Kerala’s regime was social democraticin nature (“Degrees of Democracy: Some Comparative Lessons from India,” World Politics Vol. 52, No. 4,2000, pp. 484–519). The Kerala literature sometimes uses the term “public action” to denote, as PrabhatPatnaik summarizes Amartya Sen’s use of the term, “action by the state under pressure from citizens in civilsociety” (Prabhat Patnaik, “Amartya Sen and the Theory of Public Action,” Economic and Political Weekly,Vol. 33, No. 45 (1998), p. 2857). I prefer the term “regime” because it emphasizes state action, although inKerala’s case this was integrated with action from civil society.
7. WHO, The World Health Report 2000 (Geneva: Author, 2000). The report uses the distinction between attain-ment and resource availability to estimate country-level “performance” in healthcare (efficiency in usinginputs to produce outcomes). In a later section I briefly survey the related literature on health productionfunctions.
8. Government of Kerala, Kerala Human Development Report (see note 1 above), p. 9.9. T. N. Krishnan, “Route to Social Development” (see note 1 above), p. 200. Other studies also come to similar
conclusions. The Kerala Development Report (see note 1 above), p. 52) notes: “ . . . since the formation ofthe present State, the governments which came into power have pursued policies aimed at bringing a conver-gence of the levels of development across all the regions through a series of progressive legislations such asthe one on agrarian reforms and on education, healthcare and social security. Differences in land tenure havecome down, vital rates have become comparable across districts, school and college enrolment has becomehigh in all areas and across all communities (except the outliers) and healthcare and infrastructural facil-ities have become widespread.” Michael Tharakan writes: “The difference between Malabar in the Northand Travancore-Cochin in the South in education and subsequently in other services, were bridged throughdeliberate post-independence policies of the government” (Tharakan,“History” (see note 1 above), p. 252).The UN report notes that “the major factor that brought about the decline in mortality rates in Kerala wasthe expansion and spread of health facilities [directly linked to the Kerala regime]” (UN, Poverty (see note2 above), p. 138). P. G. K. Panikar and C. R. Soman note that “since the integration of the two parts in 1956,the inter-regional disparity has been considerably reduced . . . as a result of the improvement in medical carefacilities in the Malabar region” (Panikar and Soman, Health Status of Kerala (see note 1 above), p. 37). Thedistinction between development inputs and outcomes, and their implications for regional disparity, is alsonot apparent in the work of a prominent Nobel Prize-winning scholar of Kerala’s development trajectory,Amartya Sen. Jean Dreze and Amartya Sen observe (Dreze and Sen, India (see note 1 above), pp. 200—201):“The Malabar region, transferred from the Raj, was very much behind Travancore and Cochin in terms ofliteracy, life expectancy, and other achievements that make Kerala so special. But by the eighties, Malabar had‘caught up’ . . . The initiatives that the state governments of Kerala took, under different ‘managements’ (ledby the Communist Party as well as by the Congress), succeeded in bringing Malabar rather at par with therest of Kerala over a short period of time.” Amartya Sen has also mentioned this state-fueled developmentconvergence elsewhere, although it is not clear whether the reference is to inputs or outcomes (for instanceAmartya Sen, Bina Agarwal, Jane Humphries, and Ingrid Robeyns, “Continuing the Conversation,” FeministEconomics Vol. 9, No. 2-3 (2003), pp. 319–232).
10. Kabir and Krishnan, “Social Intermediation” (see note 1 above).11. UN, Poverty (see note 2 above).12. The Appendix discusses Kabir–Krishnan’s outcome measures. In the following section, I present additional
outcome measures supporting their general point.13. Kabir and Krishnan argue that by 1956 Malabar had caught up with Travancore-Cochin regarding other
pre-conditions for improved health outcomes, namely sufficiently progressive “social attitudes” as well as asufficiently conducive “social environment.” The fact that social attitudes and social environment were notso conducive in the first half of the twentieth century is their key explanation for poorer health outcomes inMalabar in those earlier decades.
14. In principle, it is possible that mortality rate affects the number of patients who are treated, althoughthe Kabir–Krishnan data suggest that this was not the case for the two regions in the time period underconsideration.
15. Panikar and Soman, Health Status of Kerala (see note 1 above), p. 114.
The Kerala Regime and Regional Disparities 73
16. I make this claim based on calculations using the data presented in Table IV.25 of Panikar and Soman, HealthStatus of Kerala (see note 1 above).
17. Bhat and Rajan, “Demographic Transition” (see note 1 above).18. As Kabir–Krishnan, or indeed any other comparative work on Malabar and Travancore trajectories, do not
use an explicit disparity measure, it is difficult to pin this down. They may also have been looking at arelated measure, the percentage difference (100 × (YTravancore – YMalabar)/YMalabar), used by some scholarsof Kerala demography, such as Bhat and Rajan, “Demographic Transition” (see note 1 above); and S. IrudayaRajan and Sabu Aliyar, “Fertility Change in Kerala,” in Christophe Z. Guilmoto and S. Irudaya Rajan, eds.,Fertility Transition in South India (New Delhi: Sage Publications, 2005), pp. 239–269. This is simply a lineartransformation of the ratio.
19. UN, Poverty (see note 2 above), p. 141. In fact, p. xi of the report notes that the chapter on health (ChapterX, “Health indicators and demographic trends”) was drafted by T. N. Krishnan, who co-authored the Kabir–Krishnan study.
20. UN, Poverty (see note 2 above), footnote 3, p. 12121. T. N. Krishnan, “Route to Social Development” (see note 1 above), p. 200.22. The literature typically uses (cross-sectional) standard deviation and log standard deviation instead of level
difference and ratio, respectively. The latter set of measures is convenient when there are only two regions.23. Angus Deaton, “Global Patterns of Income and Health: Facts, Interpretations, and Policies” (Helsinki: UNU-
WIDER Annual Lecture 7, 2006).24. This literature typically uses raw values—the number of people using malaria bednets or the amount of cash
delivered through a conditional cash transfer program—and looks at the program impact on these raw values,that is, the difference. For instance, see the discussion of such studies in Abhijit V. Banerjee and Esther Duflo,Poor Economics: A Radical Rethinking of the Way to Fight Global Poverty (New York: Public Affairs, 2011).However, to the extent that the raw values are transformed logarithmically, as is more common in studies ofincome, the underlying measure is the ratio.
25. S. Irudaya Rajan, P. Mohanachandran Nair, K. L. Sheela, Lalitendu Jagatdeb, and Nihar Ranjan Mishra, Infantand Child Mortality in India: District Level Estimates (New Delhi: Population Foundation of India, 2008).
26. I computed regional figures by aggregating the district-wise estimates for Malabar and Travancore-Cochin,weighted by the number of births using crude birth rate figures compiled by the Civil Registration System(CRS), described in the Appendix.
27. F. Ram, Chander Shekhar and S. K. Mohanty, Human Development: Strengthening District Level VitalStatistics in India (Bombay: Indian Institute of Population Studies, 2007).
28. For a recent study of the impact of health infrastructure on fertility rate, see Ali Hashemi and Djavad Salehi-Isfahani, “From Health Service Delivery to Family Planning: The Changing Impact of Health Clinics onFertility in Rural Iran,” Economic Development and Cultural Change Vol. 61, No. 2 (2013), pp. 281–309.
29. For a discussion of the CWR index, see Christophe Z. Guilmoto and S. lrudaya Rajan, “Spatial Patternsof Fertility Transition in Indian Districts,” Population and Development Review Vol. 27, No. 4 (2001),pp. 713–738. The fertility rate is also affected by changes in mortality among children and women overtime, but CWR does not incorporate this (Bhat and Rajan, “Demographic Transition”; note 1 above). Theinterpretations of the data in this paragraph follow Bhat and Rajan, “Demographic Transition;” others whoreport these data (Planning Commission, Kerala Development Report (note 1 above); K. C. Zachariah, S.Irudaya Rajan, P. S. Sarma, K. Navaneetham, P. S. Gopinathan Nair, and U.S. Mishra, Demographic Transitionin Kerala in the 1980s (Thiruvananthapuram: Center for Development Studies, 1994)) do the same.
30. The CWR numbers in the Kerala Development Report (Table 2.5) contain mistakes in labeling some columnsand rows. Table 2 corrects for these mistakes.
31. Table 2 also presents ratios for CWR in Travancore-Cochin and Malabar, which tell a similar story. After stateformation in 1956, the ratio continuously fell as Travancore-Cochin underwent faster-paced fertility decline,reaching 0.71 in 1981–1986. The ratio then started increasing as Malabar went through a similar process,reaching 0.84 in 1996–2001.
32. Both sets of graphs in Figure 4 use raw data from Administrative Reports of the Health Department andannual Economic Reviews, compiled by the Kerala Development Report (note 1 above). Note that thereare some discrepancies between the beds data in the Kerala Development Report and Kabir–Krishnan,particularly for Travancore-Cochin in the 1980s.
33. Government of Kerala, Subject Committee VI Social Sciences, Report (Trivandrum: Secretariat of the Keralalegislature, 1981); cited by the Kerala Development Report (see note 1 above).
34. Registrar General of India, District Census Handbook (New Delhi: Office of the Registrar General of India,various years).
35. Rohini Nayyar, Rural Poverty in India: An Analysis of Inter-State Differences (Bombay: Oxford UniversityPress, 1991).
36. Part of the increase was likely due to the disproportionately greater growth of privately provided infrastruc-ture in Travancore-Cochin. See T. R. Dilip, “Role of Private Hospitals in Kerala: An Exploration,” WorkingPaper No. 400 (Thiruvananthapuram: Center for Development Studies, 2008).
37. Specifically, it is possible that the disparity in health services—such as programs for improving hygiene andvaccination—provided to the two regions reduced over time. However, lack of systematic data for suchservices for the two regions over time precludes the empirical analysis of such a possibility.
74 India Review
38. T. N. Krishnan, “Route to Social Development” (see note 1 above), p. 200; V. Raman Kutty, “HistoricalAnalysis of the Development of Health Care Facilities in Kerala State, India,” Health Policy and PlanningVol. 15, No. 1 (2000), pp. 103–109.
39. Tharakan, “History” (see note 1 above).40. However, the expansion of health infrastructure could itself have been driven by these other factors such as
the communist movement.41. Apoorva Shah, “Putting the ‘Kerala Model’ to Rest: Lessons for a New Era of Development in India,” The
American Enterprise Institute Working Paper Series on Development Policy, Number 4 (Washington, DC:The American Enterprise Institute, 2010).
42. A recent popular piece on Kerala development by Arvind Panagariya (“Cracking the Kerala Myth,” TheTimes of India, January 2, 2012) involves some specious reasoning because it ignores the diminishing returnsargument: “Life expectancy during 1970–75 was 62 in Kerala, 50 in India and 54 in Maharashtra. By 2002–06,the three entities had added 12, 14 and 13 years, respectively, to these life expectancies. Among the largestates, Tamil Nadu and UP made the most impressive gains: 17 years each. In a similar vein, whereas Keralalowered its infant mortality rate by 46 deaths per 1,000 live births between 1971 and 2009, Gujarat achieved areduction of 96, Tamil Nadu of 85 and Maharashtra of 74.” R. Ramakumar (“Lies, Damned Lies, and Statistics:On Arvind Panagariya’s Kerala Adventure,” January 3, 2012, http://ramakumarr.blogspot.com/2012/01/lies-damned-lies-and-statistics-on.html) criticizes this argument effectively: “In 1971, Kerala’s IMR was 61 per1000 live births. To be on par with Gujarat in 2009, Kerala should have had an IMR of -35!”
43. Victor R. Fuchs, “More Variation in Use of Care, More Flat-of-the-Curve Medicine,” Health AffairsVol. 23 (2004), pp. 104–107; Shao-Hsun Keng and Yang Li, “Decomposition of Total Factor Productivityin World Health Production: A Stochastic Frontier Approach,” Applied Economics Vol. 42, No. 23 (2010),pp. 3011–3021; James Thornton, “Does More Medical Care Improve Population Health? New Evidencefor an Old Controversy,” Applied Economics Vol. 43, No. 24 (2011), pp. 3325–3336. In the Indian con-text, see Vinish Kathuria and Deepa Sankar, “Inter-State Disparities in Health Outcomes in Rural India: AnAnalysis Using a Stochastic Production Frontier Approach,” Development Policy Review Vol. 23, No. 2(2005), pp. 145–163. For a critique of the health production function approach, see Jean Spinks andBruce Hollingsworth, “Cross-Country Comparisons of Technical Efficiency of Health Production: ADemonstration of Pitfalls,” Applied Economics Vol. 41, No. 4 (2009), pp. 417–427.
44. Sharmistha Self and Richard Grabowski, “How Effective is Public Health Expenditure in Improving OverallHealth? A Cross-Country Analysis,” Applied Economics Vol. 35, No. 7 (2003), pp. 835–845. At a broaderlevel, these arguments are also consistent with general economy-wide arguments, such as Tyler Cowen’sargument that America’s “great stagnation” from the mid-1970s onward can be explained by the fact that“lowhanging fruit” (such as free land and immigrant labor) has largely been plucked (Tyler Cowen, TheGreat Stagnation: How America Ate All the Low-Hanging Fruit of Modern History, Got Sick and Will(Eventually) Feel Better, Penguin (ebook), 2011). For the case of India, separate studies by Sonia Bhalotraand Mansour Farahani et al. estimate the elasticity between state health expenditure and mortality to be –0.24 and –0.2, respectively; both estimates are consistent with a diminishing returns argument (Sonia Bhalotra,“Spending to Save? State Health Expenditure and Infant Mortality in India,” Health Economics Vol. 16, No. 9(2007), pp. 911–928; Mansour Farahani, S. V. Subramanian, and David Canning, “Effects of State-LevelPublic Spending on Health on the Mortality Probability in India,” Health Economics Vol. 19, No. 11 (2010),pp. 1361–1376). The two studies focus on infant mortality and general mortality, respectively. However, nei-ther study explicitly considers diminishing returns, although Bhalotra brings this up in the case of urbanversus rural areas, where she identifies diminishing returns “because better-off groups can afford to pro-tect themselves against infant mortality even when state health services are weak” (p. 926). By contrast, AnilDeolalikar estimates a statistically insignificant relationship between health expenditure and mortality rate(Attaining the Millennium Development Goals in India: How Likely and What Will it Take to Reduce InfantMortality, Child Malnutrition, Gender Disparities and Hunger-Poverty and to Increase School Enrollmentand Completion? (New Delhi: Oxford University Press, 2005)).
45. The Kerala figures are derived from the Sample Registration System (SRS) and the international figures arefrom the World Development Indicators (WDI).
46. Deaton, “Global Patterns” (see note 23 above).47. In general, the literature reports a falling of the dispersion of mortality rates across India’s regions—
for instance, see Nandita Saikia, Domantas Jasilionis, Faujdar Ram, and Vladimir Shkolnikov, “Trends inGeographical Mortality Differentials in India,” Working Paper WP 2009-013 (Rostock, Germany: MaxPlanck Institute for Demographic Research, 2010).
48. Banerjee and Duflo, Poor Economics (see note 24 above).49. Two other sets of policies are of indirect relevance to the story of the Kerala policy regime. The first addressed
land relations. Through a series of legislative procedures coupled with cadre involvement, tenancy was abol-ished and some land redistributed from the rural rich to the landless; see Herring, Land to the Tiller. Themovement underlying these reforms is likely to have positively influenced health and education (Tharakan,“History” (see note 1 above)). A second set of policies addressed economic security. The Kerala govern-ment undertook several labor market interventions for labor welfare, for instance legislating work conditionsand hiring practices, improving maternity benefits, and increasing wages more generally (Kannan, “Public
The Kerala Regime and Regional Disparities 75
Intervention” (see note 1 above)). To address food security for the poor, a large and effective subsidized pub-lic distribution network was instituted, as were low-cost housing policies and pension funds (Chasin andFranke, Kerala (see note 1 above). Such measures, too, are likely to have positively influenced health andeducation.
50. While the share of health in total expenditure was 5 percent in the 1920s, 1930s, and early 1940s (inTravancore), it averaged 10 percent in the years following adoption of the new policy regime in Kerala.Similarly, while the share of education in total expenditure was 15 percent in 1947 in Travancore and21 percent in 1954 in Travancore-Cochin, it averaged 35 percent (and consistently stayed above 30 percent)from 1957 onwards. The health figures for Travancore are from Ramachandran, “On Kerala’s DevelopmentAchievements” (see note 1 above), Table 29. The education figures for Travancore and Travancore-Cochin arefrom Jeffrey, Politics (see note 1 above), Table 9.1. The post-1956 figures are from various bulletins issuedby the Reserve Bank of India (http://www.bulletin.rbi.org.in); see also Philip Keefer and Stuti Khemani,“Democracy, Public Expenditures, and the Poor: Understanding Political Incentives for Providing PublicServices,” The World Bank Research Observer Vol. 20, No. 1 (2005), pp. 804–821.
51. The figures for the 1990s are from Dreze and Sen, India (see note 1 above), Table A.3. The figures for2006 are from Benjamin Palafox, “Further Insights from China, Costa Rica, Kerala and Sri Lanka,” in DinaBalabanova, Martin McKee and Anne Mills, eds., ‘Good Health at Low Cost’ 25 Years On: What Makes aSuccessful Health System? (London: London School of Hygiene & Tropical Medicine, 2011), pp. 235–268.
52. Heller, “Social Capital;” Joan Mencher, “The Lessons and Non-Lessons of Kerala: Agricultural Labourersand Poverty,” Economic and Political Weekly Vol. 15, No. 41/43 (1980), pp. 1781–1802.
53. Bhat and Rajan, “Demographic Transition” (see note 1 above).54. Further, general mortality rates are sensitive to the demographic transition (Deaton, “Global Patterns” (note
23 above)), and the literature indicates that Malabar and Travancore-Cochin were at different stages of thedemographic transition during the 1970s and 1980s (Bhat and Rajan, “Demographic Transition” (see note1 above); Zachariah et al., Demographic Transition (see note 28 above)). General mortality rate is a weightedaverage of age-specific mortality rates, where the weights are given by relative sizes of the different age-groupsin the population. When two regions are at different stages in the demographic transition, the weights will besignificantly different. For Kerala’s regions, this makes the general mortality rate a questionable indicator ofcomparative health outcomes in this period. The demographic transition does not affect the infant mortalityrate, making it a potentially better indicator.
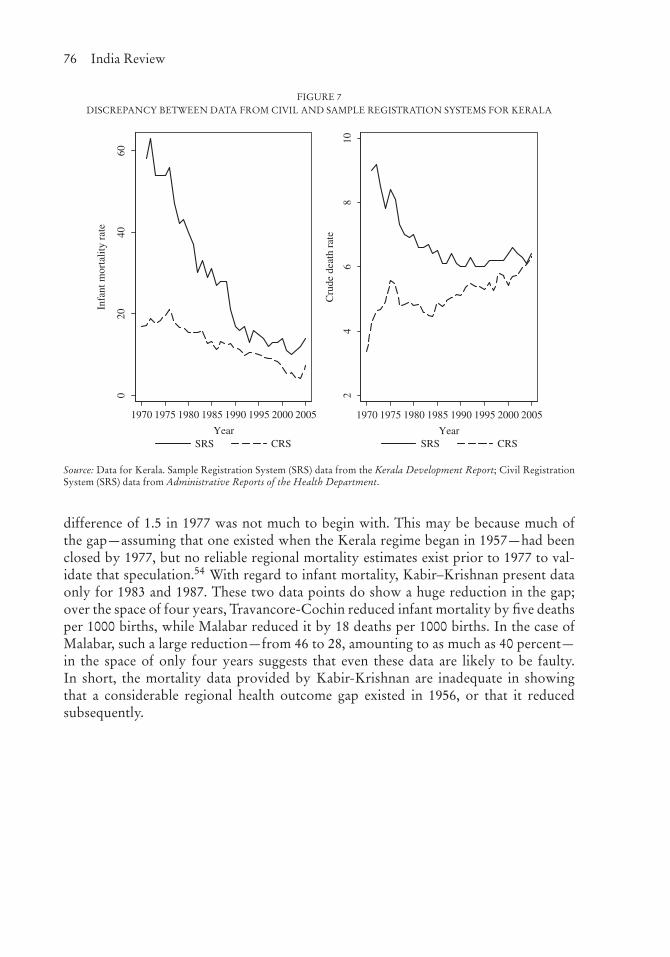
Appendix: Health Outcomes in the Kabir–Krishnan StudyFigure 1 plots the data used by Kabir–Krishnan for two health outcomes (general mor-tality and infant mortality) and shows a dramatic reduction in the mortality gap in thetwo regions over time. However, only a part of the mortality data presented by Kabir–Krishnan comes from the Sample Registration System (SRS), which is generally held tobe the most reliable data source for the 1970s and 1980s. For the period prior to the1970s, the mortality estimates are based on census data, and these estimates are sensi-tive to age misreporting and assumptions about infant and child mortality, and were notfully comprehensive in population coverage.53 A second alternative data source is theCivil Registration System (CRS), the official mechanism of collecting data on all birthsand deaths sanctioned by the Registration of Births and Deaths Act of 1969. However,CRS mortality numbers are very different from the SRS mortality estimates, especiallyprior to the 1990s, and the gap varies over time, as shown in Figure 7. For these reasons,the only reliable data source for mortality data for the 1970s and 1980s is the SRS.
Unfortunately, SRS mortality data for Kerala are available only from the 1970s.Further, the SRS is geared towards state-level data, so it does not provide data fordistricts or regions (Malabar and Travancore-Cochin) on an annual basis. Thus, of theregional mortality data presented by Kabir–Krishnan and plotted in Figure 1, only threeobservations are reliable: those based on SRS for the years 1977, 1983, and 1987. Forgeneral mortality, the difference between the regions in 1977 was only 1.8 deaths perthousand population, and this gap became 0 over the ensuing ten years. While theseare more credible numbers, and they show a reduction and elimination of the gap, the
76 India Review
FIGURE 7DISCREPANCY BETWEEN DATA FROM CIVIL AND SAMPLE REGISTRATION SYSTEMS FOR KERALA
020
4060
Infa
nt m
orta
lity
rate
1970 1975 1980 1985 1990 1995 2000 2005
YearSRS CRS
24
68
10
Cru
de d
eath
rat
e
1970 1975 1980 1985 1990 1995 2000 2005
YearSRS CRS
Source: Data for Kerala. Sample Registration System (SRS) data from the Kerala Development Report; Civil RegistrationSystem (SRS) data from Administrative Reports of the Health Department.
difference of 1.5 in 1977 was not much to begin with. This may be because much ofthe gap—assuming that one existed when the Kerala regime began in 1957—had beenclosed by 1977, but no reliable regional mortality estimates exist prior to 1977 to val-idate that speculation.54 With regard to infant mortality, Kabir–Krishnan present dataonly for 1983 and 1987. These two data points do show a huge reduction in the gap;over the space of four years, Travancore-Cochin reduced infant mortality by five deathsper 1000 births, while Malabar reduced it by 18 deaths per 1000 births. In the case ofMalabar, such a large reduction—from 46 to 28, amounting to as much as 40 percent—in the space of only four years suggests that even these data are likely to be faulty.In short, the mortality data provided by Kabir-Krishnan are inadequate in showingthat a considerable regional health outcome gap existed in 1956, or that it reducedsubsequently.