fiscal federalism in south africa - core
TRANSCRIPT

'.,
FISCAL FEDERALISM IN SOUTH AFRICA
JOACHIM HANS-GEORG WEHNER
, .\
. // J

FISCAL FEDERALISM IN SOUTH AFRICA
JOACHIM HANS-GEORG WEHNER
Thesis presented in partial fulfilment of the requirements for the
degree of Master of Arts 'at the University of Stellenbosch
Supervised by
Professor Hennie Kotze
Department of Political Science
University of Stellenbosch
South Mrica
Professor Richard Simeon
Department of Political Science
University of Toronto
Canada
December 1999
DECLARATION
I, the undersigned, hereby declare that the work contained in this thesis is my own origi
nal work and that I have not previously in its entirety or in part submitted it at any uni
versity for a degree.
Signature:
~<c.J¥2S Joachim Hans-Georg Wehner
Date: 3 August 1999
VERKLARING
Ek, die ondergetekende, verklaar hiermee dat die werk in hierdie tesis vervat, my eie oor
spronklike werk is en dat ek dit nie vantevore in die geheel of gedeeltelik by enige univer- .
siteit ter verkryging van 'n graad voorgele het nie.
Handtekening:
~~ Joachim Hans-Georg Wehner
Datum: 3 Augustus 1999
iii
Stellenbosch University https://scholar.sun.ac.za
ABSTRACT
This thesis captures the assignment of functions and resources to the national, provincial
and local spheres of government in South Africa, and provides an assessment of the
functionality of this assignment. The perspective of fiscal federalism is used as the ana
lytical tool for this assessment. The discussion, in the second chapter, of considerations
in the design of fiscal federalism generates the conceptual reference frameworks neces
sary for the assessment of the South African system. It also outlines the impact of con
stitutional provisions on fiscal arrangements in a country, an aspect that is further ex
plored in the third chapter. This chapter highlights some of the key choices, relating to
fiscal design, that negotiators were faced with during the deliberations on the new South
Mrican Constitution. A detailed analysis of fiscal federalism in South Africa follows in
the fourth chapter. The fifth chapter concludes that there is substantial congruence be
tween the expenditure assignment recommended by economic theory and that outlined
in the South African Constitution of 1996. Revenue assignment, on the other hand, re
mains centralised although the theoretical framework indicates a number of sources suit
able for decentralisation. While the South African Constitution allows for provincial
taxation powers, these have yet to be implemented. The analysis indicates that further
developments of the system of intergovernmental transfers and grants should be con
cerned with ensuring revenue adequacy for all spheres, providing incentives for sound
financial management, and maximising predictability. The conclusion also argues in fa
vour of activating the constitutional borrowing powers of provinces to enable a greater
focus on developmental expenditures. Corruption and a lack of administrative capacity in
some subnational authorities, national mandates imposed on provinces without detailed
costing and impact analysis, and rising provincial personnel costs all impede the smooth
running of decentralised government in South Africa. Nevertheless, economic theory
indicates that the constitutional assignment of responsibilities and resources to the dif
ferent spheres in South Africa should not be adjusted for the sake of greater efficiency.
Instead, the challenge remains to implement the system fully and to manage transitional
difficulties proactively. Decentralisation includes a learning process, and newly created
structures and institutions need to be developed and strengthened before they can deliver
the full benefits of decentralisation.
iv
Stellenbosch University https://scholar.sun.ac.za
OPSOMMING
Hierdie tesis analiseer die toedeling van funksies en hulpbronne aan die nasionale,
provinsiale en plaaslike sfere van regering in Suid-Afrika. Die bespreking van die oor
wegings in die ontwerp van fiskale federalisme in hoofstuk twee genereer die nodige kon
septuele verwysingsraamwerke vir die waardering van die Suid-Afrikaanse sisteem. Hier
die hoofstuk oorweeg ook die impak van grondwetlike bepalings op fiskale reelings, 'n
aspek wat verder verken word in die derde hoofstuk. Hierdie hoofstuk bring van die
sleutel besluite na vore waardeur die onderhandelaars gekonfrontreer is tydens die
beraadslaging oor die nuwe Suid-Afrikaanse grondwet. 'n Gedetaileerde analise van
fiskale federalisme in Suid-Afrika volg in die vierde hoofstuk. Die vyfde hoofstuk kom
tot die gevolgtrekking dat daar wesentlike kongruensie is tussen die toedeling van
funksies soos omskryf in ekonomiese teorie en die Suid-Afrikaanse grondwet van 1996.
Die toedeling van inkomste, daarenteen, is gesentraliseerd selfs al wys die teoretiese
raamwerk op heelparty inkomstebronne wat gepas is vir desentralisasie. Terwyl die Suid
Afrikaanse grondwet voorsiening maak vir provinsiale belastingsmagte, moet daar nog
hiervoor voorsiening gemaak word deur wetgewing. Die analise dui aan dat verdere
ontwikkeling van die sis teem van tussen regeringsoordragte en -toewysings voorsiening
moet maak vir inkomstetoereikendheid vir alle sfere, aansporings moet voorsien vir be
troubare finansiele bestuur, en voorspelbaarheid moet maksimaliseer. Die slotsom argu
menteer ook ten gunste van die aktivering van grondwetlike leenmagte van provinsies ten
einde 'n groter fokus op ontwikkelings-uitgawes moontlik te maak. Korrupsie en die af-«
wesigheid van administratiewe kapasiteit in sekere subnasionale owerhede, nasionale ver-
pligtings wat aan provinsies opgedring word sonder gedetaileerde kosteberekening en
uitwerkingsanalise, en die groei in provinsiale personneeluitgawes belemmer almal die
gladde funksionering van gedesentraliseerde regering in Suid-Afrika. Desnieteenstaande
dui ekonomiese teorie aan dat die konstitusionele toedeling van verantwoordelikhede en
hulpbronne aan die verskillende sfere in Suid-Afrika nie verander behoort te word ten
gunste van groter effektiwiteit nie. Die uitdaging is eerder om die sisteem ten volle te im
plimenteer en om oorgangprobleme proaktief te bestuur. Desentralisasie sluit 'n leerpro
ses in en nuut-geskepde strukture en instellings moet ontwikkel en vesterk word sodat
hulle die volle voordele van desentralisasie kan lewer.
v
Stellenbosch University https://scholar.sun.ac.za

For Penelope
vi
Stellenbosch University https://scholar.sun.ac.za

ACKNOWLEDGEMENTS
The research for this thesis would not have been possible, in this form, without support
from several organisations. I am indebted to the Applied Fiscal Research Centre
(AFReC) at the University of Cape Town for supporting my research efforts over the
past two years. Similarly, I have benefited from my association, since May 1997, with the
Budget Information Service at the Institute for Democracy in South Africa (Idasa). The
Financial and Fiscal Commission (FFC) kindly hosted me during a visit to Gauteng in
April 1999. I wish to thank: Tania Ajam for raising my interest in the topic; John Stuart
for ensuring that I was able to explore some initial ideas related to this thesis in three dis
cussion papers written for AFReC; my supervisors Prof. Hennie Kotze and Prof. Richard
Simeon for their encouragement and guidance; and Albert van Zyl for comments, proof
reading, the translation of the abstract into Afrikaans, and supplying valuable materials.
vii
Stellenbosch University https://scholar.sun.ac.za

TABLE OF CONTENTS
CHAP'I'ER 1: IN'I'RODUCTION ................................................................................................ 1
1.1 BACKGROUND ................................................................................................................................................ 1 1.2 RESEARCH PROBLEM ..................................................................................................................................... 7 1.3 PROPOSITION ................................................................................................................................................. 8
(1.4 DEFINING FISCAL FEDERALISM .................................................................................................................. 8 1.5 STRUCTURE OF INQUIRY ........................................................................................................................... 10 1.6 RELEVANCE OF INQUIRY .......................................................................................................................... 11 1.7 SCOPE OF INQUIRY ..................................................................................................................................... 11 1.8 CHAPTER CONCLUSION ............................................................................................................................. 12
CHAP'I'ER 2: CONSIDERATIONS IN TIlE DESIGN OF FISCAL FEDERALISM .............. 13
2.1 CONSTITUTIONAL CONSIDERATIONS ..................................................................................................... 13 2.1.1 Unitary Systems ............................................... ........................................................................................... 13 2.1.2 Federaf Systems .......................................................................................................................................... 13
2.1.2.1 Political Rationales for Regional Government ........................................................................ 14 2.1.2.2 Models of Regional Government .............................................................................................. 16
2.1.3 Implications ................................................................................................................................................ 18 2.2 EcONOMIC CONSIDERATIONS ................................................................................................................. 18
2.2.1 Expenditure Assignment ..................... : ...................................................................................................... 18 2.2.1.1 Expenditure Decentralisation ..................................................................................................... 19---2.2.1.2 Expenditure Centralisation ......................................................................................................... 20 2.2.1.3 Framework for Expenditure Assignment. ................................................................................ (ii/~/
2.2.2 Revenue Assignment ................................................................................................................................... 24 2.2.2.1 Revenue Centralisation ................................................................................................................ 24 2.2.2.2 Revenue Decentralisation ............................................................................................................ 25....__ 2.2.2.3 Framework for Revenue Assignment ....................................................................................... 26
2.2.3 IntergovemmentafTranifers and Grants ..................................................................................................... 28 2.2.3.1 The Need for Transfers and Grants .......................................................................................... 28 2.2.3.2 Objectives of Transfers and Grants .......................................................................................... 28 2.2.3.3 The Design of Transfers and Grants ........................................................................................ 29 2.2.3.4 Institutional Arrangements ......................................................................................................... 31 2.2.3.5 Framework for Transfers and Grants ....................................................................................... 32
2.2.4 BOTTVlI/ingArrangements ............................................................................................................................ 34 2.2.4.1 The Need for Subnational Government Borrowing .............................................................. 34 2.2.4.2 Possible Approaches to Subnational Government Borrowing ............................................ 34
2.3 CHAPTER CONCLUSION ............................................................................................................................. 35
CHAP'I'ER 3: FISCAL FEDERALISM IN COMPARATIVE PERSPECTIVE ........................ 36
3.1 ExPENDITURE ASSIGNMENT .................................................................................................................... 37 3.1.1 Canada ....................................................................................................................................................... 37 3.1.2 Genna'!} ..................................................................................................................................................... 38
3.2 REVENUE ASSIGNMENT ............................................................................................................................ 39 3.2.1 Canada ....................................................................................................................................................... 39 3.2.2 Genna'!} ...................................................................................................................................................... 40
3.3 INTERGOVERNMENTAL TRANSFERS AND GRANTS .............................................................................. 41 3.3.1 Canada .......................................................................... ............................................................................. 41 3.3.2 Genna1!} ........................................................................................................... : ......................................... 42
3.4 BORROWING ARRANGEMENTS ................................................................................................................ 43 3.4.1 Canada .................................................................. ..................................................................................... 43 3.4.2 Genna1!} ..................................................................................................................................................... 44
3.5 CHAPTER CONCLUSION ............................................................................................................................. 44
viii
Stellenbosch University https://scholar.sun.ac.za

CHAPTER 4: FISCAL FEDERALISM IN soum AFRICA ................................................... 46
4.1 EXPENDITURE ASSIGNMENT .................................................................................................................... 47 v'
4.1.1 Assignme1lt of Legislative Powers .. .............................................................................................................. 48 4.1.1} National, Provincial and Local Legislative Powers ................................................................. 48 4.1.1.2 Conflict Between Legislation ...................................................................................................... 49 4.1.1.3 Provincial Participation in the National Law-Making Process ............................................. 50
4.1.2 Asszgnme1lt of Executive Responsibilities .................................................................................................... 52 4.1.2.1 National, Provincial and Local Executive Responsibilities ................................................... 52 4.1.2.2 General Expenditure Trends ...................................................................................................... 53 4.1.2.3 Provincial Expenditure Trends .................................................................................................. 55
4.1.2.3.1 Mandotes ..................................................................................................................................... 57 4.1.2.3.2 Personnel Expenditure ................................................................................................................. 58 4.1.2.3.3 Capital Expenditure .................................................................................................................... 59
4.1.3 Mom'toring and Interoention ........................................................................................................ : ............... 60 4.1.3.1 Ensuring the Fulfilment of an Executive Obligation ........................................................... ,. 60 4.1.3.2 Intervention in Practice ............................................................................................................... 61 4.1.3.3 Corruption ...................................................................................................................................... 62 ....... 4.1.3.4 Capacity .......................................................................................................................................... 64 ~ 4.1.3.5 Intervention and Co-operative Govemment ........................................................................... 65
4.1.4 The Controver[Y S umJunding the Assignment of the We!fare Function ....................................................... 66 v 4.1.4.1 Administrative Problems ............................................................................................................. 66 v 4.1.4.2 Possible Solutions ......................................................................................................................... 67
42:~tg§~07ji) 4.3 INTERGOVERNMENTAL TRANSFERS AND GRANTS .............................................................................. 72
4.3.1 The Concept ofEquitabie Shares ................................................................................................................ 72 . 4.3.1.1 The Role of the Financial and Fiscal Commission ................................................................. 73 4.3.1.2 The Role of the National Council of Provinces ...................................................................... 73 4.3.1.3 The Role of the Budget Council ................................................................................................ 74
4.3.2 The Recommendations I!J the Financial and Fiscal Commission ................................................................. 74 4.3.2.1 Vertical Division ........................................................................................................................... 74 4.3.2.2 Provincial Equitable Share and Conditional Grants ............................................................... 75 4.3.2.3 Local Government Equitable Share and Conditional Grants ............................................... 78
4.3.3 Actual Developments .................................................................................................................................. 79 4.3.3.1 Vertical Division ........................................................................................................................... 79 4.3.3.2 Provincial Equitable Share and Conditional Grants ............................................................... 82 4.3.3.3 Local Government Equitable Share and Conditional Grants ............................................... 87
4.3.4 RevieJv of Recomme1ldations and Practices ................................................................................................... 88 4.4 BORROWING ARRANGEMENTS ................................................................................................................ 90
4.4.1 Provincial Borrowing ................................................................................................................................... 90 4.4.2 ucal Borrowing ......................................................................................................................................... 91
4.5 CHAPTER CONCLUSION ............................................................................................................................. 92
CHAPTER 5: CONCLUSION ................................................................................................... 95
BIBUOGRAPHY .......................................................................................................................... 103
A) LITERATURE ................................................................................................................................................... 103 B) SOUTH AFRICAN LEGISLATION .................................................................................................................. 122 c) JUDGEMENTS OF TIlE CONSTITUTIONAL COURT OF SOUTH AFRICA ................................................. 122 D) REFERENCED CONSTITUTIONS OF OTIlER COUNTRIES ........................................................................ 123 E) REFERENCED NEWSPAPERS AND MAGAZINES ........................................................................................ 123 F) INTERVIEWS AND DISCUSSIONS., ................................................................................................................ 124 G) USEFUL INTERNET RESOURCES .................................................................................................................. 125
ix
Stellenbosch University https://scholar.sun.ac.za
LIST OF TABLES
Table 1: Theoretical Framework for Expenditure Assignment ............................................................................ 23 Table 2: Distribution of Government Expenditure in Selected Countries ......................................................... 23 Table 3: Theoretical Framework for Revenue Assignment ................................................................................... 27 Table 4: Distribution of Tax Revenue in Selected Countries ................................................................................ 27 Table 5: Theoretical Framework for Intergovernmental Transfers and Grants ................................................ 33 Table 6: Tax Sharing in Germany (1997) .................................................................................................................. 40 Table 7: Major Federal Transfers to Provinces in Canada (1997-8) .................................................................... 42 Table 8: Effects of Equalisation in Germany (1996) .............................................................................................. 43 Table 9: Models of Regional Government and their Fiscal Arrangements ........................................................ 45 Table 10: Constitutional Assignment of Legislative and Executive Powers in South Africa .......................... 47 Table 11: Total Provincial Budgets ............................................................................................................................ 55 Table 12: Budgeted Provincial Capital and Personnel Expenditure .................................................................... 60 Table 13: Corruption Cases by Province .................................................................................................................. 62 Table 14: Provincial Profiles According to the 1996 Census ................................................................................ 64 Table 16: Recommended Vertical Division of Nationally Collected Revenues, plus Provincial Revenues
from a Surcharge on the Personal Income Tax Base, Phased in from 1 per cent to 7 per cent. ........... 75 Table 17: Recommended Vertical Division of Nationally Collected Revenues, plus Provincial Revenues
from a Surcharge on the Personal Income Tax Base, Phased in from 1 per cent to 7 per cent ............ 75 Table 18: Recommended Total Allocation per Province ....................................................................................... 77 Table 19: Recommended Total Formula Allocation per Province ...................................................................... 77 Table 20: Recommended Total Grants per Province per Capita ......................................................................... 78 Table 21: Actual Vertical Division of Resources ..................................................................................................... 81 Table 22: Budgeted Transfers to Provinces for 1996-7 and 1997-8 .................................................................... 82 Table 23: Provincial Population Shares ..................................................................................................................... 82 Table 24: Actual Formula for the Distribution of the Provincial Equitable Share ........................................... 83 Table 25: Conditional Grants to Provinces .............................................................................................................. 87 Table 26: Consolidated Provincial Revenue and Expenditure .............................................................................. 93 Table 27: Composition of Consolidated Provincial Revenue and Expenditure ..................................... : .......... 93 Table 28: Local Government Revenue and Expenditure ...................................................................................... 94 Table 29: Composition of Local Government Revenue and Expenditure ......................................................... 94 Table 30: Expenditure Assignment in Theory and in South Africa ..................................................................... 96 Table 31: Revenue Assignment in Theory and in South Africa. ........................................................................... 98 Table 32: Proposed Rating of Intergovernmental Transfers and Grants in South Africa ............................... 99
LIST OF FIGURES
Figure 1: Regional Fiscal Dependency in Selected Countries ............................................................................... 33 Figure 2: Consolidated National and Provincial Expenditure Trends (1990-2000) .......................................... 54 FigUre 3: Consolidated Provincial Expenditure Trends (1995-2001) .......................... : ....................................... 56 Figure 4: Social Spending in 1999-0 Provincial Budgets ........................................................................................ 56 Figure 5: Provincial Allocations from Nationally Collected Revenue (1995-1999) ........................................... 81
x
Stellenbosch University https://scholar.sun.ac.za
CHAPTER 1:
INTRODUCTION
1.1 Background
A world-wide trend towards fiscaJ decentralisation1 has emerged over the past decades.
This development has not only occurred in federal countries, but also in unitary states
with a previous record of centralisation (fer-Minassian 1997a, Tanzi 1996: 296-297).2
In South Africa, there is a history of dispute over decentralisation. The 1910 Union of
South Africa was negotiated in the aftermath of the Anglo-Boer war. Representatives
from the former independent Boer republics demanded substantial autonomy for pro
vincial structures, while delegates from the two British colonies argued for a strong cen
tral government. 3 For much of this century, the four provinces4 on the territory of white
South Africa acted mainly as administrative extensions of the national government. The
constitutionally weak status of these entities was underlined when the Provincial Govern
ment Act (1986) replaced elected provincial legislatures with executive authorities ap
pointed by the state president and headed by an administrator (Dollery 1998: 129).
The National Party (NP) government, which came to power in 1948, introduced the
philosophy of apartheid. State partition became the declared aim as its policies unfolded.
The nationalists pursued the regional concentration of the black majority, based on a se
ries of conso.lidation plans. Land set aside for blacks was developed into a system of ten
"homelands" along ethnic lines in the 1970s. Of these structures the Transkei, Bophut-
1 Decentralisation describes a shift of functional responsibilities and / or resources to lower levels of government. Wolman (1990: 37) notes four operational definitions: (1) the range and importance of functions performed by subnational governments, (2) the autonomy given to subnational units through the legal relationship between national and subnatipnal government, (3) the extent to which subnational governments are able to capture public sector resources, and (4) the degree of dependence of subnational governments on national government finance. Summary indicators, made up of all four elements, are most comprehensive as the definitions Wolman offers also reflect different aspects of decentralisation. 2 While in a unitary state ultimate political control rests with the central government, a federal state is based on the (usually constitutional) assignment of powers to different levels of government. The distinction will be discussed further in the second chapter. 3 For the purpose of this analysis, the terms "provinces", "states" and "Under" all describe governments at a regional level, between national and local government, since such regional authorities are named differendy across countries. Throughout the text, the term "subnational governments" is used as a summary term describing all governments within a country other than the central, federal or national government, whichever of the latter names is applicable in a given case. 4 Namely the Cape Province, the Free State, Natal and Transvaal.
1
Stellenbosch University https://scholar.sun.ac.za

hatswana, Venda and the Ciskei (the so-called "TBVC states") were given "independ
ence" that was not recognised beyond South Africa. Under an elaborate resettlement
scheme, an estimated 1.7 million people were displaced between 1960 and 1983 alone to
"whiten" the territory of the republic, comprising all areas that did not form part of the
homeland territories. The numbers of those "removed" from the white republic under
resettlement programmes were swollen by those who were displaced from the urban ar
eas under various influx control measures and forced to move to the homelands (Chris-
topher 1994: 65-102).
The constitutional negotiations in the early 1990s signalled the end of this system of
apartheid, and sought to achieve a peaceful transition to democracy and majority rule (De
Villiers 1994a). One fundamental question that had to be addressed was what form of
state the future South Africa should have, unitary or federal.
Party positions on the question of federalism in the initial negotiating forum, the Con
vention for a Democratic South Africa (CODESA), varied greatly. The governing NP,
which had previously centralised the apartheid state by scrapping elected provincial leg
islatures, reversed to a decentralised strategy hoping to retain some political power at
subnationallevel. The regionally-based Inkatha Freedom Party (IFF), too, was a strong
supporter of federalism (e.g. IFF et aI1993).5 The liberation alliance of the African Na
tional Congress (ANC), to the contrary, feared that autonomous provinces would de
crease its ability to govern, entrench existing disparities and could form the basis for divi
sive tribal politics. The party supported provinces as a vehicle for greater participation in
democratic and developmental processes, rather than opposing centres of political power
(Besdziek 1998).
The interim Constitution6 of 1993 reflected the compromises reached during the initial
rounds of negotiations.? Its schedule 4 contained 34 constitutional principles which pro-
5 Although the IFP boycotted much of the negotiating process, the party ended up participating in the founding elections at the eleventh hour. The party's recently proposed constitutional amendments seek to, inter alia, increase provincial autonomy (IFP 1998). The IFP proposes eliminating perceived constraints hindering policy formulation by provinces, giving provinces the power to settle boundary disputes, strengthening the role of provincial constitutions, and extending exclusive provincial powers to such areas as policing, land affairs, ports and harbours. 6 In the following analysis Act 108 of 1996 is referred to as "the Constitution", or as the "new" or "/inal Constitution", as distinct to the so-called "interim Constitution" (Act 200 of 1993) which governed the country for a transitional period of three years. 7 For a description of South Africa's "negotiated revolution", see Sparks (1994).
2
Stellenbosch University https://scholar.sun.ac.za
vided a set of constraints and guidelines for the writers of the final Constitution. The in
terim Constitution empowered a Constitutional Assembly, consisting of both houses of a
democratically elected Parliament, to draw up a final Constitution for the country (sec
tion 68). With regard to the structures, functions and powers of provinces, this assembly
would be informed by a Commission on Provincial Government (sections 163 and 164).
A return to a system with four provinces, now incorporating the former homeland terri
tories, had little support. The NP and the ANC both focused on the nine "development
regions" outlined by the Development Bank of South Africa (DBSA) in 1982 as the basis
for demarcation proposals (Welsh 1994, Urban Foundation 1993, McCarthy 1993). The
territorial boundaries of today's nine provinces - the Eastern Cape, Free State, Gauteng,
KwaZulu-Natal, Mpumalanga, Northern Cape, Northern Province, North West and the
Western Cape - in essence resemble this demarcation.s All homeland structures were
abolished and incorporated into these nine provinces. Several border disputes remain9,
but the demarcation has not been challenged in any fundamental way.
The first democratic elections for the national Parliament and nine provincial legislatures
were held on 27-29 April 1994 (Lodge 1995, Mattes 1995, Sout;halI1994). Local govern
ment elections were held as from November 1995 (Lodge 1999: 40-55, Rapdall 1998). In
1994 the ANC won 252 out of 400 seats in the National Assembly, a majority of 63 per
cent. The party also gained the most votes in seven of the nine provinces, obtaining its
best result in the Northern Province with a 92 per cent share of the provincial vote. The
NP won in the Western Cape with 53 per cent of the vote, while the IFP gained a narrow
50 per cent majority in KwaZulu-Natal, a province that was and continues to be plagued
by high levels of conflict (Ch~rry 1994).10
8 In summary, the former Transvaal was broken up into four separate entities (Gauteng, Mpumalanga, Northern Province and North West). The territory of the former Cape Province was divided into three new structures (Eastern Cape, Northern Cape and Western Cape). The boundaries of the Free State and Natal were retained to some degree. 9 For example, the residents of Bushbuckridge in the Northern Province have been demanding incorporation into Mpumalanga (Griggs 1997). 10 The electoral dominance of the ANC was consolidated in the second democratic elections held on 2 June 1999. The party gained 66 per cent of the national vote, translating into 266 out of 400 seats in the National Assembly, one seat short of a two-thirds majority. The ANC also won outright majorities in seven of the nine provinces, but fell short in KwaZulu-Natal and the Western Cape, where no party gained a majority of votes (Business Dty, 8 June 1999). Due to the hung legislatures in the Western Cape and KwaZulu-Natal, coalition governments became necessary at provincial level (Chothia 1998). The ANC attempted to counter the "provincialisation" of its party structures (Sindane 1997) by centralising the appointment of premiers in the ANC-governed provinces for the 1999 elections (Business Dty, 23 April 1999).
3
Stellenbosch University https://scholar.sun.ac.za

A version of the new Constitution was adopted by the Constitutional Assembly on 8
May 1996. However, the Constitutional Court found that parts of the text did not com
ply with the constitutional principles contained in the interim Constitution. With regard
to provinces, the court noted that their powers over policing, education, traditional lead
ership and local government had been substantially diminished.ll After its first certifica
tion judgemene2, delivered on 6 September 1996, the text was referred back to the Con
stitutional Assembly. The-assembly amended the text to comply with the court's re
quirements, and the final Constitution was adopted on 11 October 1996. It was subse
quently approved by the Constitutional Court in its second certification judgement.13
The process of drafting the Constitution involved many South Africans through arguably
the largest public participation programme ever carried out in South Africa. Two years of
intensive consultations attempted to int~grate, as far as possible, the views of ordinary
citizens, civil society and political parties. It is not often that deep-rooted conflict in a
society is successfully channelled through a constitution-making process (Banting and
Simeon 1985). South Africa is an example of where this was the case.
The Constitution shapes the overall structure of government in the country, and captures
the compromise over decentralised governance. Most notably, the founding provisions
stipulate that the Republic of South Africa is "one sovereign democratic state" (section
1), rather than a grouping of independent territorial entities, for which the Constitution is
the supreme law (section 2). However, the Constitution also prescribes that government
be constituted as national, provincial and local "spheres of government", which are de
scribed as "distinctive, interdependent and interrelated" (section 40). The term spheres of
government, rather than tiers or levels, has been interpreted as implying a non
hierarchical relationship and "some equality in status of national, provincial and local
government" (Department of Constitutional Development 1999: 10). The Constitution
accordingly provides for the unity of the country, while at the same time providing for
provincial and local structures.
Different positions are often taken on the question of whether post-apartheid South Af
rica is a federal state or not. Some argue that it is a unitary state with some federal ar-
11 In the latter case the decrease of provincial powers was balanced out by increased local autonomy, which the court regarded as a positive advance. 12 Certificatioll of the C011StitUtiOll of the Republic of South Africa, 1996, 1996 (4) SA 744 (eq.
4
Stellenbosch University https://scholar.sun.ac.za
rangements, or "a figleaf for federalism" (O'Malley 1994). Others call it a federal state
(e.g. Kriek 1996 and 1994). The final Constitution does not use the terms "federal" or
"unitary", nor did the interim Constitution. The concept of federalism is highly contro
versial in South Africa, because it is frequently associated with apartheid's homeland
system and its deeply racist ideological justification. As a result, some people may reject
the word "federalism", but be comfortable with terms such as "decentralised govern
ance", "regionalism" or "provincial system". Southall (1994: 649) remarks that "there
seems to be an unwritten agreement amongst politicians of all stripes and the media to
avoid explicit use of that term [i.e. federalism]". Although this debate is interesting from
a purely academic angle, it seems to have little practical relevance. As Tapscott (1998: 27)
notes, labels such as "federal" and "unitary" are of less importance than the manner in
which intergovernmental relation.s are structured and function in practice.
According to the final Constitution, provincial governments are now responsible for the
administration of such vital areas as welfare, public health, primary and secondary educa
. tion. In 1997, for the first time, the nine provinces that had been created in 1994 were
responsible for drawing up their own budgets, within an overall resource envelopel\
rather than managing centrally determined allocations for each spending area.
The structure of local government, too, has been subject to substantial revisions.ls The
final Constitution requires a "wall-to-wall" system of local government, covering the en
tire territory of the country (section 151(1)).16 However, many local authorities, especially
those that were newly created, have experienced great difficulty in fulfilling their func
tions (Solomon 1998). In a joint report on the state of municipal finance, the Depart
ments of Constitutional Development and Finance (1997: 48) acknowledge that restruc-
13 CertzJicotioll of the Amended Text of the COllStitUtiOll of the Republic of South Africa, 1996,1997 (1) BCLR 1 (CC). 14 The term "resource envelope" describes the total amount of money that is available to cover the expenditure of a department, government, or level of government. 15 The Local Government Transition Act (1993) represented the first attempt to introduce a unified system for local government throughout the country. The end of apartheid left the country with a system that was fragmented along racial lines (Ismail and Mphaisha 1997: 3-9, Tapscott 1996: 13). Shack settlements had become a cornmon feature in urban areas by the end of apartheid, due to a mixture of population growth, migration from rural areas, inadequate housing and government policy not to provide rented houses in the townships (Mashabela 1990). The task was to transform local government into viable entities capable of facilitating development (see: Reddy 1996, Simon 1996). 16 Several pieces oflegislation aim at the reorganisation of the local sphere. The Municipal Stmctures Act (1998) provided for the restructuring of the different categories and types of municipalities outlined in the Constitution (section 155), and the division of powers and functions between them. The MUllicipal Demarcatioll Act (1998) initiated a process of re'drawing municipal boundaries in order to create more viable and sustainable structures. In addition, a Municipal Systems Bill and a Mullicipal Property Ratillg Bill are expected to be tabled in Padiament in the near future.
5
Stellenbosch University https://scholar.sun.ac.za

turing has caused the newly formed municipalities to experience a dramatic increase in
service responsibility, paired with an insignificant increase of the revenue base and exten
sive non-payment of municipal accounts.
Administrative problems are also being experienced at the provincial level. The previous
Director-General of the Public Service, Paseka Ncholo, who was responsible for the
"Provincial Review Report,,17, called the administration in the provinces chaotic. He be
lieved that provincial government "is not affordable and needs a rethink" (Business DCf)',
14 August 1997).18 A few months later, the Presidential Review Commissionl9 was re
ported to have recommended a take-over of the Eastern Cape by the national govern
ment in response to a breakdown of delivery structures in the province (Financial Mail, 1
May 1998).
The administrative ability of the provinces has been cast into doubt by a string of events.
For instance, in January 1998 the Eastern Cape provincial government failed to pay pen
sions to about 632000 pensioners, due to a lack of funds (Business DCf)', 9 January 1998).
Soon afterwards the national government had to provide a "bailout" (in the form of an
advance totalling R 1.5 billion) to the Eastern Cape and KwaZulu-Natal governments
towards covering their budget deficits for the 1997-8 financial year20• At the beginning of
1999 pupils were left waiting for books and stationery in several provinces despite
promises that study material would be delivered in time (Sowetan, 21 January 1999). Such
events have brought disrepute to the provincial system, and comments such as the fol
lowing are not uncommon: "It once saved bloodshed but now South Africa's constitu
tion is wasting money" (Economist, 28 February 1998). This perception has led to calls
from senior ANC politicians to take a fresh look at the structure of government in the
country (e.g. Ramatlhodi 1998). The former Minister of Provincial Affairs and Constitu
tional Development, Valli Moosa:', recommended a review of the constitutional powers of
the three spheres of government in the interest of greater efficiency (Business DCf)', 20 May
17 Also known as the Ncholo Report (Ministry for the Public Service and Administration 1997). 18 The report was based on a review of the administration of every department in the nine provinces. In roughly 350 structured interviews, over 950 provincial staff were asked for their views of how well they were performing their jobs. 19 The commission had been appointed by a presidential proclamation in April 1996, officially tided the "Commission of Inquiry Regarding the Transfonnation and Refonn of the Public Service". Amongst its mandates was to conduct an internal audit of each provincial administration, including planning, budgeting and financial execution (presidential Review Commission 1998: 2). A widely respected academic, VIncent Maphai, was the chairperson of the commission.
6
Stellenbosch University https://scholar.sun.ac.za
1999). President Thabo Mbeki, the successor of Nelson Mandela, has hinted that local
government will soon receive greater attention (Sunday Independent, 23 May 1999). This
would include the "deployment" of prominent ANC politicians to this sphere of gov
ernment, in conjunction with a reallocation of resources. At a conference in March 1999
Mbeki (1999: 6-7) remarked:
"The proximity of our second democratic elections provides an opportunity for
us to review the performance of the nine provinces we established in 1994. The
future of the nine provinces has become a topic of public debate, with calls for
changes to the structure and powers of the provincial sphere, and even the num
ber of provinces. It is true that the establishment of nine provinces has brought
government closer to the people, created more space for regional diversity and
provided a mechanism for the implementation of national policies. At the same
time serious concerns have been raised about the state of provincial governance,
underscored by the instances of financial crisis and the failure of delivery institu
tions, which we have experienced during the last five years. The strength and
weaknesses of the provinces highlighted by a number of reports and audits of
provincial government should be dealt with in a forthright manner. We shall have
to address such critical issues as: Rooting out corruption in all spheres of gov
ernment; Addressing cap~city deficiencies in our provinces; Reducing and con
taining personnel costs in our provincial budgets; Adopting alternative methods
of service delivery, to reduce costs and improve the quality of service to the peo
ple."
1.2 Research Problem
South Africa's Constitution has assigned functions and resources to different spheres of
government. At the same time it has been a challenge to ensure the smooth running of
the new system, and calls for adjustments have been made. There is thus a need for an
objective assessment of the functionality of the governmental structure in South Africa.
The purposes of this study are: (1) to capture the assignment of functions and resources
to the different spheres of government in South Africa and (2) to provide an assessment
20 A financial year does not necessarily coincide with the calendar year, although it does so in many coun-
7
Stellenbosch University https://scholar.sun.ac.za

of the functionality of this assignment. Such an assessment should indicate whether the
constitutional assignment of functions and resources is to blame for the problems that
have been encountered during the process of decentralisation, and whether adjustments
to the assignment are necessary to achieve greater efficiency.
1.3 Proposition
This above discussion generates the following proposition: "The assignment of functions
and resources to the different spheres of government in South Africa needs to be ad
justed to achieve greater efficiency."
1.4 Defining Fiscal Federalism
The theory of fiscal federalism, or intergovernmental fiscal relations, provides guidance
with regard to the assignment of expenditure functions and sources of revenue to various
tiers in a de centralised system of government.21 This perspective, with its focus on func
tionality and efficiency, offers an analytical tool for the assessment intended in this thesis.
In a groundbreaking contribution building on the limited framework provided by Mus
grave (1959: 179-183), Oates (1993: 17) describes the economic meaning of federal gov
ernment as "[a] public sector with both centralized and decentralized levels of decision
making in which choices made at.~ach level concerning the provisions of public services
are determined largely by the demands for these services of the residents of (and perhaps
others who carry on activities in) the respective jurisdiction". Oates adds the following
distinction: "In contrast to the conception of federalism in political science, it makes little
difference to the economist whether or not decision-making at a particular level of gov
ernment is based on delegated or constitUtionally guaranteed authority." From this func
tional perspeaive, it is not important whether a particular rystem is federal from a constitutional per spec-
tries. The financial year in South Africa runs from 1 April until 31 March of the following calendar year. 21 For this analysis the following definitions are employed, as put forward by the International Monetary Fund (IMF 1997: 8), unless otherwise indicated: The term revenue covers all non-repayable government receipts other than grants; grants are defined as unrequited, non-repayable, non-compulsory receipts from other governments. I refer to transfers as payments to which the recipient is legally (often constitutionally) entitled. Often, however, the terms transfers and grants are used interchangeably in the literature.
8
Stellenbosch University https://scholar.sun.ac.za
tive. Rather, economists tend to treat all governmental [Jstems as federal in character, to varying extents,
in the sense that budgetary decisions are made at different levels (Heyns 1995: 150, Shah 1994b: 9-
10).22 Thus, fiscal federalism is studied across a range of constitutional systems (e.g. Ter
Minassian 1997a).
The theory of fiscal federalism is concerned with assigning expenditure functions and
revenue sources to the economically appropriate level of government. Guiding principles
are proposed to govern the assignment of expenditure functions (e.g. Ahmad et a11997,
Oates 1993: 31-63) as well as the assignment of revenue sources (e.g. Norregaard 1997,
Spahn 1995, Oates 1993: 119-180). When resources do not match the assigned expendi
ture functions, imbalances can be addressed through intergovernmental transfers and grants
(e.g. Ahmad and Craig 1997, Oates 1993: 65-118). Some guidance on borrowing arrange
ments has also been proposed (e.g. Ter-Minassian and Craig 1997).
However, while a certain fiscal design may be desirable according to economic theory,
socio-political circumstances and constitutional provisions can limit the design options
(Bird 1993). Bird and Chen (1998: 52) explain that jurisdictional boundaries and the as
signment of functions and finances may often have been fixed at some earlier (e.g. con
stitutional) stage. The implication is that any policy recommendations concerning fiscal
design should take the constitutional framework of a country into consideration (unless,
of course, these parameters can easily be changed).
The literature on the practice of intergovernmental fiscal relations has grown substan
tially over the past years. Ter-Minassian (1997a) provides the most recent and compre
hensive review of fiscal federalism in theory and practice. Unfortunately, the impressive
collection of case studies does not include an analysis of the South African system. In
fact, there are only a few examples of academic writing on South Africa's. new fiscal fed
eralism. Acting as a consultant to. the World Bank during a mission to South Africa in
1993, McLure (1994) generated a basic set of recommendations. Heyns (1994) has of
fered an interesting conceptual discussion of equity and redistribution from a fiscal fed
eralism perspective, with reference to the interim Constitution. Based on the text of the
new Constitution and some initial developments, Abedian et al (1997) produced a first
description of South Africa's emerging fiscal structures. More recently, Dollery (1998)
22 Exceptions may occur in geographically extremely small countries or "mini states".
9
• II. S. •
Stellenbosch University https://scholar.sun.ac.za
suggested an initial evaluation of South Africa's revenue:"sharing arrangements under the
current Constitution. While providing interesting and important snapshots, the rapid
changes to the South African system have outdated substantial parts of these analyses. In
addition, the work of the advisory Financial and Fiscal Commission (FFC) has contrib
uted towards developing fiscal federal theory and practice within the South African con
text (FFC 1998a, 1997, 1996, 1995). The work of the commission will be dealt with in
detail in the discussion of the South African system.
1.5 Structure of Inquiry
The second chapter reviews considerations in the design of fiscal federalism by exploring
the various theoretical aspects pertaining to the assignment of functions and sources of
revenue. The purpose of the chapter is to generate a reference framework for the de
scription and assessment of the South African system.
The third chapter contains a comparison of two countries which served as prominent ref
erence models for the structure of government during the constitutional negotiations in
South Africa. The chapter tracks some of the key options that constitutional designers
were faced with, and their impact on fiscal arrangements. Its purposes are to demonstrate
the practical relevance of the theoretical considerations outlined in the previous chapter,
and to provide a comparative context, from a fiscal perspective, for the description and
analysis of the South African system.
The existing structures in South Africa are discussed in the fourth chapter. It draws mainly
on the final Constitution and relevant legislation, budgetary data, and a discussion of
suggested and actual practices. The purposes of this chapter are to provide an in-depth
analysis of the South African system, enabling a comparison to the reference framework
developed earlier, and to highlight key issues relating to its· practical functioning.
Thefifth chapter contains the conclusion. Its purposes are to summarise the main findings
and to come to an assessment oLthe functionality of the South African system. Based on
this analysis, the necessity of adjusting the current assignment of functions and resources
, will be investigated.
10
Stellenbosch University https://scholar.sun.ac.za

1.6 Relevance of Inquiry
Actors outside government have not yet undertaken a comprehensive functional assess
ment of the structure of government in South Africa. This inquiry is aimed at contribut
ing towards filling this research gap. In addition, political scientists have not yet thor
oughly analysed South Africa's fiscal structures. This may partially be due to the fact that
public finance is often regarded as a "technical" or "economics-driven" field, unsuitable
for the analytical tools of the political scientist. On the other hand, political scientists are
highly regarded contributors to the development of fiscal arrangements in many other
countries. This inquiry is an attempt to bring the fiscal aspects of multi-level governance
into the debate amongst political scientists over the future of the three-sphere system in
South Africa.
1. 7 Scope of Inquiry
Provincial government is at the centre of this analYsis, since the purpose oflocal government as a
separate sphere is generally not disputed. The analysis does, however, include local gov
ernment, and refers to national government were contextually necessary. A comprehen
sive assessment of the role of provincial government requires an understanding of its in
teraction with the other spheres of government.
It is not the purpose of this analYsis to provide a description of the constitutional negotiations. The ne
gotiating phase has been captured elsewhere (e.g. Sparks 1994). Rather, the focus of this
analysis is on the fiscal structures outlined in the new Constitution and developments
that have taken place within these structures.
Due to the rapid changes to the South African [lstem, this analYsis is necessarilY a snapshot. Apart
from minor details, the research towards this thesis was concluded in June 1999. The
analysis thus seeks to capture the relevant developments between the taking effect of the
new Constitution as from 1997 and the second democratic elections.
11
Stellenbosch University https://scholar.sun.ac.za

1.8 Chapter Conclusion
The negotiated transition to democracy brought with it a new structure of government
for South Africa, consisting of the national, provincial and local spheres. The functional
ity of this new structure is increasingly being questioned, and calls for reform have been
made. The inquiry sets out to capture the assignment of functions and resources to the
different spheres of government in South Africa and to provide an assessment of the
functionality of this assignment. The ~erspective of fiscal federalism focuses on the as
signment of functions and resources within the context of a decentralised system of gov
ernment. This perspective, with its focus on functionality and efficiency, offers an ana
lytical tool for the intended assessment. The study draws on theoretical considerations, a
comparative background, and an in-depth analysis of intergovernmental fiscal relations in
South Africa.
12
Stellenbosch University https://scholar.sun.ac.za

CHAPTER 2:
CONSIDERATIONS IN THE DESIGN OF FISCAL FEDERALISM
This chapter reviews considerations in the design of fiscal federalism by exploring the
various theoretical aspects pertaining to the assignment of functions and sources of
revenue. The purpose of the chapter is to generate a reference framework for the de
scription and assessment of the South African system. The chapter discusses constitu
tional models which have a bearing on the design of fiscal structures, and the criteria
provided by the theory of public fmance.
2.1 Constitutional Considerations
The division of powers and functions to various levels of government varies across
countries. With regard to the form of state, constitutions may be seen to fall into two
broad categories (Kriek 1996).
2.1.1 Unitary SYftemf
In a unitary system of government, the iffective overall control of all governmental functions rests
with the centralgovernment (Shah 19?4b: 5). Until the recently initiated process of decentrali
sation2.3, the United Kingdom was a classic example of a unitary state (Kendle 1997).
Other examples are France, Turkey and Japan. In a unitary system, the central govern
ment is free do decide which functions and resources are to be assigned to its regional
and local administrative branches, and it can adjust this assignment at its discretion.
2.1.2 Federal Systems
In a federal system, decision-making is divided between levels of government usually
based on a constitutional assignment of powers (Schultze 1996: 157, Nathan and Bal
maceda 1990: 60). Federalism can enable a balance between unity and diversity by medi-
23 Scodand and Wales have recendy voted in favour of regional assembles which will regulate areas oflocal concern. In the case of Scodand the electorate also voted in favour of giving its assembly the power to tax (DailY Telegraph, 25 February 1998). Elections to the newly created assemblies took place in May 1999.
13
Stellenbosch University https://scholar.sun.ac.za

ating between diverging ideas about the nature of political communities. Although this
category is diverse, a common feature in these systems is the existence of elected regional
governments in addition to national and local governments.24 Prominent examples of fed
eral countries are Germany, Canada, the United States, Switzerland, India and Brazil.25
Unlike in unitary states, the constitutional division of powers in federal states makes it
more difficult to affect adjustments to the fiscal structures, as this would require amend
ments to the constitution.
2.1.2.1 Political Rationales for Regional Government
The following are some central political rationales for regional go~ernment:
Enhancing Democrary. Every democratic order relies on the broad support of its citizens.
The more interfaces a political system offers, the more opportunities to express prefer
ences exist, and the greater the potential for overall satisfaction. In a federal state, the
most common form of participatlon, voting, can be practised more frequently than in a
state without regional governments.26 In other words, regional government offers more
opportunities for participation. Although this does not automatically make participation
more meaningful, it encourages a closer link between decision-makers and citizens, and
24 The concept of federalism is "a classic example of concept overstretch" (Bulpitt 1996: 180), and there is a lack of a generally accepted definition (Verney 1995: 81, Burgess and Gagnon 1993, Nathan and Balmaceda 1990: 59). Wheare (1946) identified only a handful of states that he claimed could be called federal. His work is based on a definition of federalism as a situation where the citizen is a citizen of two governments, a general and a regional one. Since then, some writers have emphasised that national and regional polities in a federal system are or should be equal (Elazar 1995 and 1991). In practice, however, regional governments are often regarded as middle tiers or levels of government, implying a hierarchy of governments covering the same geographical area. Nathan and Balmaceda (1990: 60) conclude: "As we see it, the acid test of federalism is not whether the general and local government are co-equal. The test of whether a political system is federal is whether it has regional governments with consequential [emphasis in the original] power." They suggest a framework for ~alysis to compare the role and character of elected regional governments in contemporary federalism. This framework includes an assessment of (1) legal powers; (2) revenue powers; (3) functional-area authority and responsibilities; (4) the role of the regional governments in the affairs of the central government; (5) historical, social and cultural identification; and (6) the power of local units. Given the dispute over the definition of the teon, and the variety of systems it is associated with, such a flexible framework seems adequate. While constitutions are important indicators, federalism can easily develop differently to constitutional intentions (Hodgins et 011989). 2S A third category may be cOlifederal systems of government, where a centralgovernment aas as an agent Jor independent member units. Examples of this latter group are the European Union (EU) and the Conunonwealth of Independent States (CIS) consisting of the fooner Soviet Republics. A number of regional structures for economic co-operation, such as the Southern African Development Conununity (SADC), also bear some characteristics of a confederation. For the purpose of this analysis, this option is regarded as an extreme form of federalism, although some authors consider it to be a separate, albeit less prominent, category (e.g. Shah 1994b: 6).
14
Stellenbosch University https://scholar.sun.ac.za
helps to "bring government closer to the people". The empowerment aspect of regional
government is based on the principle of subsidiarity, which prescribes that any commu
nity shall only fulfil those tasks that cannot be fulfilled equally well, or better, by a smaller
constituent community (Isensee 1968).
Protecting Democrary. There is also a line of thought that presents regional government as a
tool to prevent tyranny by means of "parcelling off" and, to an extent, fragmenting state
power along a vertical axis (Laufer and Munch 1997: 24-25). This makes regional gov
ernment especially attractive to c0untries emerging from authoritarian rule or dictator
ship and facing the task of constitutional redesign, such as Spain after the death of
Franco or Germany after the demise of Nazi rule.
Cotiflict Management. Especially in ethnically divided societies, regional government offers a
chance to national minorities to gain a majority at subnationallevel. According to
Horowitz (1991: 217), for instance, such representation at subnationallevel may ensure
that minorities will not resort to extra-legal, violent and destabilising means to pursue
their aims. Rather, the possibility to gain political majorities, at a subnationallevel, acts as
an incentive to remain within the overall system. Federalism can therefore act as political
glue to ethnically divided societies (Smith 1995). This was the idea behind propagating
the "federal solution" in the context of decolonisation, albeit without success in many
cases due to a complex set of factors (Kendle 1997: 123-149).27 The relationship between
territoriality and ethnicity is pivotal for conflict to be managed through federal arrange
ments (Schultze 1995: 158). This requires that ethnic minorities be concentrated in spe
cific regions, as for instance in Canada but unlike in the United States.
While it is recognised that regional government has the potential to achieve these goals, it
is also recognised that federalism is Janus-headed, which means that its advantages may,
under certain circumstances, tum into its disadvantages (Simeon 1998: 47, Laufer and
Munch 1997: 28). For instance, federalism may contribute to a perception that the wishes
of minority communities are valued over those of national majorities. If the overwhelm-
26 This effect is weakened in cases where national and regional elections are held at the same time, as currendy in South Africa, as national issues often dominate the regional election agenda. Regional elections tend to receive more attention when the regions have varying election dates. 27 Notably, many post-colonial constitutions were based on the recommendations of foreign advisors and
. supposed experts in their fields, rather than the result of an indigenous negotiating process. The latter, however, is important to promote ownership of the new dispensation, and to ensure that a constitution addresses the particular social and political needs of a country.
15
Stellenbosch University https://scholar.sun.ac.za

ing wish of the majority were repeatedly frustrated and hindered by a small minority, this
would be undemocratic. With regard to the ethnic management goal of regional govern
ment, the dilemma is that by giving institutional recognition to such cleavages, they may
also be perpetuated and even augmented. This may ultimately reinforce centrifugal ten
dencies. As Simeon (1998: 50) concludes: "All regional and autonomist movements are a
combination of 'we want out' and 'we want in'. The trick is to find the right balance."
2.1.2.2 Models of Regional Government
Constitutional arrangements in federal systems are diverse (Saunders 1995, Elazar 1991).
One basic distinction is between divided (dual and competitive) systems on the one
hand, and shared (integrated and co-operative) models of regional government on the
other (Simeon 1998, Laufer and Munch 1997: 157, Schultze 1995: 160, Shah 1994b: 7).
In the divided model, the idea is that national and regional institutions should be as inde
pendent as possible. Responsibilities are assigned to national and regional governments
according to policy areas such as health, education or defence. As far as possible, the re
sponsibilities of government are divided into distinct lists and each is assigned to one
specific tier. The aim is to create "watertight compartments" by eliminating overlapping
responsibility. In practice, this ,means that if a government is responsible for health, it
regulates and implements policy in this sector.
The shared model, on the other hand, integrates and unites governments at different lev
els by emphasising co-operation and joint functions. Responsibilities are assigned ac
cording to governmental functions such as regulation by rn"eans oflegislation on the one
hand, and implementation and administration on the other. This means that one level
formulates policy and monitors implementation, usually the national level, while another
is responsible for actual implementation.
Several factors may impact on the choice between these two basic options (De Villiers
1994b: 269-270): .
Approach to Federation. The far-reaching separation of functions pursued by the divided
model is most likely to emerge from a "bottom up" approach to federation, i.e. one in
16
Stellenbosch University https://scholar.sun.ac.za
which formerly separate units come together for a limited purpose (e.g. United States,
Canada). In such a case, the necessary infrastructure to provide essential services will al
ready existwithin member units, which logically limits the involvement that is required
by the central government in many important areas such as policing, health and educa
tion. If certain functions are already provided satisfactory at subnationallevel, there is no
reason to facilitate central involv~ment in these areas. The shared model, to the contrary,
is most likely to emerge from a "top down" approach to federation, where regional units
are assigned some of the functions which were previously exercised at the central level.
The constitutional changes taking place in Spain since 1978 are one example of such a
top down process towards federalism, involving a transfer of functions from the centre
to the regions (Newton 1997: 120). In this case, the centre is likely to retain some influ
ence over regional functions, drawing on its experience and infrastructure.
Increasing Complexity ofGove17lmental Funaions. The two models are also tied to the devel
opment of the modem welfare-oriented state. From a historical perspective, the general
direction seems to be from dual (or divided) to co-operative (or shared) systems of re
gional government. De Villiers (1994b: 270) explains: "The practical circumstances asso
ciated with modem government brought the realization that the respective levels of gov
ernment could not operate in isolation from each other ... The consequence is a new style
of government and a different culture of intergovernmental relations, based on co
operation, co-ordination, and interdependency."
Political Culture. It has been argued that the divided model is more compatible with the
Anglo American majoritarian and competitive nature of politics, while the shared model
is more compatible with the consensual and co-operative style of governance that is
prevalent in the political systems of continental Europe (Schultze 1995: 159).
There may be a .range of other political factors influencing the choice between the di
vided and shared models. As Simeon (1998: 58-59) points out, the choice between these
two alternative models is based on trade-offs. The divided model seems to maximise re
gional autonomy. It also simplifies transparency by providing for undivided lines of ac
countability; accountability is clearly assigned to the different levels of government by
avoiding shared responsibilities. Furthermore, the divided model seems to promote
competitive and adversarial federalism. The shared model, on the other hand, seems to
17
Stellenbosch University https://scholar.sun.ac.za

maximise harmony, consistency and consensual policy making. It also requires ongoing
co-operation and interaction. Accordingly, the shared model may tend to display more
inherent centralised tendencies than the divided mode\.
2. 1.3 Implicatiotls
In a unitary system the central government has a rather free hand in the design of fiscal
structures, which makes it easy to follow the economic considerations to be discussed
below. Federal systems, however, circumscribe the power of the centre. Thus, the latter
deserve special consideration in qrder to understand the particular limits federal consti
tutions impose on fiscal design. As constitutional redesign is likely to be a controversial
and lengthy process (Banting and Simeon 1985), the implication is that policy recom
mendations relating to the design of fiscal structures have a better chance of being im
plemented when this is possible within an existing constitutional framework.
2.2 Economic Considerations
The theory of public finance offers some guidelines with respect to the assignment of
revenue and expenditure responsibilities to various levels of government in a decentral
ised system. This section considets the theoretical frameworks for expenditure and reve
nue assignment, and intergovernmental transfers and grants. A brief discussion of bor
rowing arrangements - as a means of enhancing the total income derived from revenue,
transfers and grants - is also provided.
2.2.1 Expenditure Assignment
The as~.ignIJlent of expenditure functions is guided by the "decentralisation theorem" put
forward by Oates (1993: 31-63). The theorem proposes that each public service should
be provided by the jurisdiction having control over the minimum geographic area that
would internalise the benefits and costs of such provision. This rule is a rephrasing of the
principle of subsidiarity. In other words, responsibilities should be assigned to the lowest
level possible without compromising the effective provision of a service.
18
Stellenbosch University https://scholar.sun.ac.za

2.2.1.1 Expenditure Decentralisation
It is argued that the local provision of goods and services has the following benefits
(Shah 1994a: 3, Oates 1993: 11-13):
Local provision enhances ifficienry by reflecting local needs. A centralised or uniform provision - -
often results in a "one size fits all" provision that may not satisfy specific local needs.
Since preferences vary between localities, government would be wasting resources on
services that may not be desired by some communities. The local provision of services
allows communities to set their individual priorities, and allocate resources accordingly. If
mobility is not otherwise restricted, citizens can "vote with their feet" by comparing
service packages between jurisdictions and choosing according to their preferences. The
overall result would be a more efficient allocation of resources, as allocations match the
various sets of local preferences ..
&ocal provision eliminates multiple lqyers q/jurisdiction. If a service can be provided at a lower
level of government, this eliminates the need to have a central administration with sub
national branches. As a result the central government is able to focus its attention and
resources on those areas that require its involvement. This argument gains in strength
with increasing geographical size or population of a country. The larger a country in
terms of size or population, the more complex governmental functions become, and the
more difficult it will be to administer public affairs through one centrally steered admini
stration with agencies in the various regions.
Decentralised decision-making results 11i healthy competition between authorities, which encour
ages innovations in the provision of public services. Innovative new programmes can be
pioneered at the subnationallevel before they are implemented on a broader scale.
Should such new programmes fail, it would be less costly than if they had been imple
mented on a nation-wide scale. Thus, while creating space for innovations, decentralised
decision-making also limits possible financial losses due to policy failure.
Stellenbosch University https://scholar.sun.ac.za

2.2.1.2 Expenditure Centralisation
Despite arguments in favour of decentralis~tion, centralisation is warranted when the
following considerations apply (Ahmad et aL 1997: 28, Shah 1994a: 4, Oates 1993: 4-11):
Imperfect mobility limits the possibility that citizens express their preferences by voting with
their feet (i.e. moving between jurisdictions). As a result, the decentralised provision of
services might not match local preferences.
SpatiaL externalities occur when the geographical boundaries of a jurisdiction diverge sig
nificantly from the geographical concentration of people who utilise its services. In the
case of benifit spiLLoverr, the authority may not realise that substantial benefits accrue to
non-residents. This would result in the lmder-provision of such a service. The reverse is
the case with cost spiLLovers, where the costs for a service can be "exported" to other juris
dictions.28 The rule is that where the benefits of a service are national in scope, it should
be assigned to the national government. Most prominently, this is the case with defence
and foreign affairs.
Economies of scaLe exist with regard to certain services. If a service cannot be provided in a
cost effective manner by a local jurisdiction, this service should be assigned to the next
higher level of government where this would be the case. The need to provide transpor
tation services, water and sewerage in a metropolitan area, for example, may justify a
two-tier system of local government (e.g. Ahmad 1996, Shah 1994b: 12-15).
Furthermore, there is general agreement that certain policy functions simply cannot be
successfully managed by subnational governments (Ahmad et aL 1997: 28-30). Macro
economic stabilisation and monetary policies are instances where firm control and undivided ac
tions are required (Gupta et aL 1994). This is unlikely to be possible if these functions
were assigned to various subnatiorial actors. Effective redistribution is only possible
through programmes that are national in scope. Finally, equalisation between jurisdictions
requires centralisation (Ladd and Yinger 1994, Bramley 1990).
28 For example, if a local authority closed health clinics for the poor, they may utilise the services of a neighbouring jurisdiction. Spillover grants may help to compensate jurisdictions that are adversely affected.
20
Stellenbosch University https://scholar.sun.ac.za

There is a need for a model that fakes into account not only the assignment of expendi
ture functions to one or another level, but also provides principles to decide when and to
what extent responsibilities should be shared. The theory of fiscal federalism provides
little or no guidance to determine where centralised regulation with decentralised imple
mentation may be advisable (Oates 1994: 143-147). However, the theoretical framework
for expenditure assignment hinges on the distinction between national public goods on
the one hand, and regional and local public goods with geographically more limited bene
fit areas on the other. Ahmad et al (1997: 25-26) concede:
"Most goods that governments supply, however, do not fit neatly into either one
of these two categories. ~or these mixed goods some degree of decentralization
coupled with some centralized coordination of policy is both feasible and desir
able, owing to unclear benefit r~gions, externalities, or national redistributional
implications ... When conflicting goals arise, the analysis of which level should be
assigned expenditure responsibility can become quite complicated and subject to
normative bias."
2.2.1.3 Framework for Expenditure Assignment
Oates (1993: 3-30) describes the benefits of federal government as enabling a compro
mise between the economic case for centralised government on the one hand, and the
economic case for decentralised government on the other. Shah (1994a: Table 1.1 and
1994b: Table 2) proposes a conceptual framework for the assignment of expenditure
functions that expresses this compromise. The benefits and costs of a number of func
tions are national in scope (e.g. defence and foreign affairs).29 Due to their primarily local
benefits, basic services (e.g. water, sewerage and refuse) are assigned to local government.
However, the framework does not resolve the above-mentioned problem with mixed
goods. This is partially due to the complexity of some sectors. For instance, while there
are advantages to the local provision of primary education and preventative health care,
such as allowing communities to express cultural and curative preferences, economies of
scale and externalities imply that more centralised control of tertiary education and hos-
This would require that the extent that non-residents use a certain service, as well as their origin, be known to the providing authority. 29 For example, frontier regions may be more concerned with national defence issues, while interior communities might simply depend on the border regions to protect them. Therefore, if defence was a subnational function, this assignment would lead to the under-supply of a national good (Ahmed et at 1997: 29).
21
Stellenbosch University https://scholar.sun.ac.za

pitals may be war~anted (Ahmad et at 1997: 25). Other factors may further influence ex
penditure assignment. Commenting on the "dangers of decentralisation", Prud'homme
(1995: 215) notes that subnational capacity needs to be considered to determine the ex
tent to which responsibilities are to be decentralised: "For decentralized units to be effi
cient and achieve the potential benefits of decentralization, they must be sufficiently large
in terms of population, activities, and income. This efficiency can be increased by per
sonal training and institution building, but decentralizing taxes and even expenditures to
small and weak local governments is unlikely to be successful." The comparative data
below show the distribution of governmen~al expenditure in selected countries, which is
a summary indicator of expenditure decentralisation. The variations indicate that there is
no single model that is empirically dominant, and that careful consideration needs to be
given as to why certain variations occur in individual countries.
22
Stellenbosch University https://scholar.sun.ac.za

Table 1: Theoretical Framework for Expenditure Assignment Expenditure category Regulation Administration Comments Defence N N Foreign affairs N N International trade N N Currency and banking N N Immigration N N Unemployment insurance N N Airlines and railways N N Natural resources N N, R, L Environment N, R, L R, L Industry and agriculture N, R, L R, L Education N, R, L R, L Health N, R, L R, L Social welfare N, R, L •. R, L Highways and roads N, R, L R, L Police R, L R, L Fire protection L L Water, sewerage, refuse L L
Benefits and costs national in scope. Benefits and costs national in scope. Benefits and costs national in scope. Benefits and costs national in scope. Benefits and costs national in scope. Benefits and costs national in scope. Benefits and costs national in scope.
Promotes a common market. Benefits and costs may vary in scope.
Significant interjurisdictional spillovers. Varying benefit regions. Varying benefit regions. Unclear benefit regions.
Some roads with significant spillovers. Primarily local benefits. Primarily local benefits. Primarily local benefits.
Source: Adapted from Shah (1994a: Table 1.1 and 1994b: Table 2). Notes: N = national government, R = regional government, L = local government.
Table 2: Distribution of Government EXEenditure in Selected Countries Total general government expenditure*
As % of total Country Year As %of Central gov- Regional gov- Local govern-
GDP ernment ernment ment
IndustriaL countries
Australia 1995 46.5 59.0 36.0 5.0 Belgium 1994 56.5 88.5 n.a. 11.5 Canada 1993 60.1 41.7 41.2 17.1 France 1995 56.5 82.3 n.a. 17.7 Germany 1995 57.2 59.2 24.1 16.7 Netherlands 1995 66.5 76.4 n.a. 23.6 Norway 1994 60.2 68.4 n.a. 31.6 Spain 1993 55.9 70.4 18.2 11.3 United Kingdom 1995 54.1 77.3 n.a. 22.7 United States 1994 41.3 53.4 25.6 21.0
Developing and transition countries
Argentina 1992 21.8 55.1 44.9 u. Brazil 1993 56.6 65.7 24.8 9.5 India 1993 30.8 54.7 45.3 u. Kenya 1994 30.0 96.1 n.a. 3.9 Mexico 1993 19.1 78.3 21.7 u. Poland 1995 51.8 83.8 n.a. 16.2 Russian Federation 1995 38.5 62.4 u. 37.6 South Africa 1994 50.1 66.3 25.4 8.3 Thailand 1995 17.3 92.6 n.a. 7.4 Source: International Monetary Fund (1997). Notes: n.a. stands for not applicable; u. stands for data unavailable. * General government is defined to include the central government; the social security system; and regional and local governments. Expenditure covers all non-repayable payments (whether capital or current, requited or not) by government.
23
Stellenbosch University https://scholar.sun.ac.za

2.2.2 Revenue Assignment
The expendtture requirements of the different levels of government should inform the
assignment of revenue sources to ensure that each level has sufficient revenues to fulfil
its respective functions (Wiltshire 1989: 181).30 The following principles indicate which
sources of revenue are suitable for subnational governments (e.g. Norregaard 1997,
Spahn 1995, Shah 1994a: 13 and 1994b: 18-21). The argument is usually presented in re
verse order compared with expenditure assignment, where the assumption tends to be in
favour of decentralisation.
2.2.2.1 Revenue Centralisation
Progressive taxes with redistribution obJectivel1 should be centralised, because a decentralised
redistribution policy may easily become self-defeating. For example, if a local jurisdiction
decided to redistribute income to poor residents, rich residents may simply move on to
other jurisdictions where this is not the case. The authority attempting redistribution
would be left with a population that is on average less wealthy, which in tum would leave
fewer resources for the purpose of redistribution.
Taxes suitable for macro-economic management or stabilisation, such as company taxes, should be
centralised to avoid distortions within the country. In addition, the usefulness of these
taxes to influence the direction of the overall economy is likely to be weakened or even
lost when different jurisdictions i!llpose differential rates.
Taxes that have widelY differential tax bases between jurisdictions, for instance those linked to
natural resource exploitation, should be centralised to avoid extreme inequalities. As
natural resources tend to be subject to price volatility, they also constitute an unreliable
source of revenue for subnational authorities.
30 The decentralisation of expenditure functions should be accompanied by an equivalent decentralisation of resources, and vice versa. In practice, two types of mismatches have been noted (Shah 1994b: 43): (1) Federal deficits have been passed on to subnational governments by expenditure decentralisation without a concomitant increase in revenue for subnational governments. This is referred to as "unfunded mandates". A good country example for this problem is the Russian Federation (Craig et aI1997). (2) The opposite happened in Brazil as a result of the implementation of the Constitution of the Federal Republic ofBra:d1 (1988), which devolved revenues without a concomitant transfer of functions. This constrained the federal government and provided perverse incentives for fiscal management at subnationallevel (pablos 1997, TerMinassian 1997b, Oliveira and Velloso 1994, Campbell 1991: 28-30).
24
Stellenbosch University https://scholar.sun.ac.za

Taxes on mobile factors, such as income, should remain with the central government. A high
local tax rate on corporate profit, for example, may lead a business to move to a jurisdic
tion with a lower rate. In addition, competition between jurisdictions may erode the tax
base. The more mobile a tax base, the greater the case for centralisation.
Taxes with economies of scale in tax administration should be administered by the national gov
ernment. For example, if a value-added tax (V A1) were to be levied by the subnational
jurisdiction in which consumption takes place32, implementation would require border
controls between different jurisdictions. Such a system would not only be costly to ad
minister, but may also impede the free movement of goods and services.
2.2.2.2 Revenue Decentralisation
Taxes on completelY immobile foctors, such as property and land, are most suited for the local
level. Since the tax base cannot move in a physical sense, differences in tax rates between
jurisdictions are unlikely to cause serious problems. With taxes on immobile factors it is
also always clear which authority is entitled to the revenue they yield.
Single-stage sales taxel3 are suitable to be levied by subnational governments, provided that
they do not levy these taxes with highly different rates. Otherwise, residents will be en
couraged to shop in other jurisdictions. The extent to which "this is likely to occur de
pends on factors such as the vicinity of jurisdictions with differential rates, the cost of
travel, and the value of the goods purchased.
User charges and licensefees can be used by all levels of government. They are especially suit
able for local governments to the.extent that costs and benefits are "internalised" to the
local taxpayer.
31 Progressive taxation is associated with an income tax system which levies a proportionately higher tax rate on those with higher incomes. 32 The destination Pril1ciple implies that the tax is levied by the jurisdiction in which consumption takes place, independent of the origin of the goods. The on"gin principle requires the tax to be levied by the jurisdiction in which produaion takes place. Norregaard (1997: 65) notes that the need to make the VAT neutral with regard to the spatial allocation of production and consumption implies that it should generally conform with the destination principle. 33 A distinction is made between single-stage sales taxes (e.g. excises and retail taxes) and multi-stage sales taxes (e.g. turnover taxes and VATs). Excises are taxes on specific goods (e.g. tobacco and alcohol) or services manufactured, sold or consumed in a jurisdiction.
25
Stellenbosch University https://scholar.sun.ac.za
2.2.2.3 Framework for Revenue Assignment
Based on the arguments outlined above, Shah (1994a: Table 1.4 and 1994b: Table 6)
proposes a conceptual basis for tax assignment. It is clear that economic theory favours
the centralisation of the main sources of revenue used by modem governments (e.g. in
come taxes and VAl). Spahn (1995: 221) further observes: "Although guidelines to local
taxation can be found in the theory of federalism, their impact on actual arrangements is
remarkably weak." The comparative data below show the distribution of tax revenue in
selected countries, indicating various degrees of revenue decentralisation. A range of
factors may influence these revenue patterns. For instance, local revenue bases tend to be
more substantial in developed countries. The existence of a regional tier of government,
which may claim certain tax bases, also impacts on tax assignment. Nonetheless, in most
cases the revenue shares of subnational governments are smaller than their expenditure
needs require. This is sometimes addressed through tax-sharing, where the central gov
ernment shares the revenue from a particular tax, or through general revenue-sharing.
Alternatively, subnational governments are dependent on income from intergovernmen
tal transfers and grants, which are discussed in detail in the following section.
26
Stellenbosch University https://scholar.sun.ac.za

Table 3: Theoretical Framework for Revenue Assignment Determinf1tion of
Revenue source Base Rate Collection and administration
Comments
Customs N N •. N International trade. Corporate income N N N Mobile factor, stabilisation tool. Natural resources N N N Unequally distributed tax bases. VAT N N N Economies of scale in administration. Personal income N N, R N Redistributive, mobile factor. Retail sales R R, L R, L Higher compliance cost. or N R N Lower compliance cost. Property, land R L L Completely immobile factors. Fees, user charges N, R, L N, R, L N, R., L Payment for services received. Excises R, L R, L R, L Relatively immobile factors, residence-based. SOUfW. Adapted from Shah (1994a: Table 1.4 and 1994b: Table 6). Notes: N = national government, R = regional government, L = local government.
Table 4: Distribution of Tax Revenue in Selected Countries Total general government tax revenue*
As % of total Country Year As %of Central gov- Regional gov- Local govern-
GDP ernment ernment ment
Industrial countries
Australia 1995 28.9 76.6 19.9 3.5 Belgium 1994 45.7 94.8 n.a. 5.2 Canada 1993 38.7 53.5 36.5 10.0 France 1995 42.4 89.8 n.a. 10.2 Germany 1995 41.1 73.0 21.0 6.0 Netherlands 1995 44.7 96.3 n.a. 3.7 Norway 1994 40.3 78.6 n.a. 21.4 Spain 1993 33.2 86.6 4.6 8.8 United Kingdom 1995 34.8 96.4 n.a. 3.6 United States 1994 27.0 65.7 20.6 13.7
Developing and transition countries
Argentina 1992 19.8 57.2 42.8 u. Brazil 1993 25.7 71.4 26.0 2.6 India 1993 14.9 61.8 38.2 u. Kenya 1994 21.1 97.8 n.a. 2.2 Mexico 1993 .. 16.3 84.6 15.4 u. Poland 1995 40.0 92.1 n.a. 7.9 Russian Federation 1995 29.0 60.0 u. 40.0 South Africa 1994 27.6 91.4 3.1 5.5 Thailand 1995 18.2 94.9 ri.a. 5.1 Sourc([. International Monetary Fund (1997). Notes: n.a. stands for not applicable; u. stands for data unovoiloble. * General government is defined to include the central government; the social security system; and regional and local governments. Tax revenue is defined as unrequited, compulsory payments to government, excluding non-tax categories (e.g. fees, sales and fines).
27
Stellenbosch University https://scholar.sun.ac.za

2.2.3 Intergovernmental Transfers and Grants
2.2.3.1 The Need for Transfers and Grants
Imbalances or "fiscal gaps" occur when expenditure needs are not covered by available
revenue. There are two types of such fiscal imbalances:34 Horizontal imbalances arise when
resources, in relation to expenditlJ.re functions, are unevenly spread between jurisdictions
within the same level of government. Vertical Imbalances are due to a mismatch between
the assignment of expenditure functions and revenue sources to different levels of gov
ernment, in which case one level may find that its expenditure needs are not covered by
the revenue at its disposal. To ensure that governments are able to fulfil the functions
assigned to them, there is a need to address horizontal and vertical imbalances.
Vertical imbalances can be addressed by sharing the yield of a particular tax, or a general
pool of revenues, between different levels of government. An entitlement to receive a
percentage of the proceeds of a shared tax can make the income derived from constitu
tionally shared taxes very close to own revenue35 (Biehl 1994: 88). The greater the fiscal
gap, after the sharing of revenue if this is practised, the more important are intergovern
mental transfers and grants (Ahmad and Craig 1997, Shah 1994a: 22-51 and 1994b: 24-
39, Oates 1993: 65-118). Apart from ensuring that governments have sufficient revenue
to fulfil their functions, there are various other objectives of transfers and grants.
2.2.3.2 Objectives of Transfers and Grants
Stabilisation can be achieved through adjusting the total level of transfers, as well as their
distribution. This may be the case when some regions are more heavily affected than
others by economic downturns. A decline in demand for natural resources, for instance,
directly affects those regions were mining operations provide a substantial share of em
ployment opportunities. Shah (1994a: 32) outlines the counter-cyclical effect that can be
achieved: "Grants could increase in periods of slack economic activity to encourage local
expenditure and diminish during the upswing of the economic cycle."
34 The indicator of "fiscal dependency" is used to measure such imbalances (e.g. Rao and Vaillancourt 1994: 104, Wolman 1990: 40, Nathan and Balmaceda 1990: 62). The share of regional or local expenditure that is not covered by own revenue indicates the extent of fiscal dependency of subnational governments.
28
Stellenbosch University https://scholar.sun.ac.za
Equity between the various regions of a country often requires that those authorities with
insufficient fiscal capacities receive additional funds to provide a basic level of service~ to
the public (Heyns 1995, Ladd and Yinger 1994). While some countries accept differential
benefits, others emphasise the need to provide equivalent services. Equalisation may be
aimed at equalising the actual performances (outputs) of different jurisdictions in order
to achieve uniformity. Alt~rnatively, the goal may be to equalise fiscal capacities (inputs)
without influencing the specific configuration of services (Wehner 1997a: 4).
Minimum or national standards aim at ensuring a minimum of service delivery to be
achieved by subnational units. Such standards are often thought to be in the national in
terest, to insure social and economic unity, or to further social justice. This objective is
closely linked to the concept of output equity.36
EJlicienry in the provision of a service is threatened by spillovers: "In such circumstances,
regional governments may consider only benefits to their own citizens and underprovide
public services, hence yielding a case for supplementary central government grants for
the given purpose" (Ahmad and Craig 1997: 82).
Sometimes these objectives are in conflict with each other (Ahmad and Craig 1997: 84-
86). For instance, stabilisation and equity goals may be in conflict when the activities of
the national government have a differential effect on subnational authorities. The objec
tives of equity and efficiency maybe in conflict where the extent of equalisation rewards
regions with a low fiscal capacity.
2.2.3.3 The Design of Transfers and Grants
The question remains as to which design of transfers and grants can be applied for
achieving such objectives. Several basic choices have to be made by the policy-maker.
Conditionality versus Non-Conditionality. The contributing government can increase its con
trol over the spending activities of the recipient government by attaching conditions to
any payments that are made. Thi~.may be necessary to ensure that certain minimum
35 Own revenue is the revenue derived from taxation that is levied directly by a jurisdiction.
29
Stellenbosch University https://scholar.sun.ac.za

standards are met or that a specific expenditure is effected: "The main justification for
conditional grants over unconditional grants, however, must be that local decision mak
ing fails to produce the socially optimal outcome, as in the case of interjurisdictional
spillovers ... " (Ahmad and Craig 1997: 87). The specific design of conditionality also
needs to be considered (Wehner 1997a: 4). Input-based conditions restrict the use of a
, grant to a specific sector or programme. Output-based conditions, on the other hand,
requires certain targets to be achieved by the recipient. In the latter case, there is a strong
incentive to provide a service at the least possible cost, as the recipient authority would
be free to use the remainder of a grant on its own priorities. Problems arise where there
is a lack of capacity to enforce conditions.
Matching versus Non-Matching Conditional Grants. A Matching requirement forces the recipi
ent government to supplement a granted amount for a specific purpose with own funds
equivalent to an agreed percentage of the grant. The national government is thereby able
to influence the spending of the recipient government by providing an incentive to pri
oritise certain services. Problems may arise when some regions are able to exercise more
influence on the total size of a matching grant, simply due to their fiscal capacity.
The Extent of Equalisation. The more weight is assigned to indicators of fiscal need, the
greater the equalising effect of such transfers or grants across regions.
Open-Ended versus Capped.37 Open-ended matching grants can serve to fully acknowledge
detectable spillovers, thereby ensuring that the desired level of services is provided.
However, it is often necessary to cap the total amount available for such 'purposes due to
budgetary constraints. Without caps, national spending may be determined in part by
subnational decisions, which would blur accountability.
Grant design should take into account the objectives that are to be achieved, as different
scenarios require different designs (Shah 1994b: 24-27). For example:
36 In some countries, such as Canada, the tenn "national" standards is often used instead of "minimum" standards, to denote the idea that some common level of services, wherever one lives, is an aspect of 110-
tionol citizenship. 37 An open-ended payment is not subject to a maximum total amount To the contrary, if a payment is capped, a limit is set with regard to the total amount
30
Stellenbosch University https://scholar.sun.ac.za
Vertical fiscal imbalances, due to expenditure needs being greater than revenue-raising ca
pacity, may be addressed through general transfers (or revenue-sharing). Should this not
suffice, changes to the assignment of functions and revenue sources may be necessary.
Horizontal fiscal imbalances, due to different revenue-raising capacities, may call for general
equalisation transfers. These would protect the general ability of recipient governments
to fulfil their functions, while not distorting their expenditure decisions.
Benifit spillovers may be fully compensated through open-ended matching transfers, with
the matching rate determined by the benefit-spillout ratio (i.e. the cost incurred by the
use of a particular service by non-residents).
Ensuring minimum or national standards may be effected by conditional grants. The recipient
would be bound to fulfil the requirements the grantor attaches to such funds, with the
result that national priorities are reflected in subnational expenditures.
In practice, numerous problems are encountered. These include confusion about transfer
and grant objectives, and the appropriate design to achieve such an objective, a lack of
transparency with regard to allocations, or the absence of explicit standards.38 In other
instances, especially in developing countries, a lack of reliable data is an obstacle to the
design of an appropriate formula.39
2.2.3.4 Institutional Arrangements
There are at least four possible models for assigning institutional responsibility for the
guidance of a system of transfers and grants. First, the task could be delegated to an in
dependent panel of experts. This would place emphasis on depoliticising the process, but
the use of non-elected specialists raises questions of accountability. The Australian
Commonwealth Grants Commission (Craig 1997: 184-185) and the Indian Finance
Commissions (Hemming et al 1997: 531-532) are examples of this option. Second, the
38 These problems have been well documented in the Indian case (Hemming et al1997: 531-533, Cashin and Sahay 1995, Chelliah 1994). Increasingly larger amounts of the Union Budget have been earmarked for the states over the past two decades (Economic Times, 27January 1999). The Tenth Finance Commission
. proposed to guarantee the states a definite share in the total central pool of taxes to ensure greater predictability, stability and transparency (Andhra Pradesh DailY News, 1 March 1997). 39 The case of Ethiopia is instructive in this regard (Brosio and Gupta 1997).
31
Stellenbosch University https://scholar.sun.ac.za
central government could be responsible for determining subnational shares. This would
allow greater control by the centre, but undermines the autonomy of subnational gov
ernments. For instance, federal grants in the United States, in relation to state and local
expenditures, have fluctuated substantially over the past decades (Stotsky and Sunley
1997: 368-372). Third, the process could be finalised by agreement in an intergovern
mental body, based on bargaining. This may help to build consensus amongst the par
ticipants, but may also favour a few participants with strong bargaining positions. This
has been a characteristic feature in Canada (Krelove et a11997: 213-220). FinallY, a system
of transfers and grants may be outlined in detail in a constitution, which greatly reduces
the need to assign responsibility for the design of transfers and grants according to one
of the above options. Such arrangements produce predictability, but reduce the flexibility
to adapt a system in line with ch~ging needs and circumstances. For instance, the Basic
Low for the Federal Republic ofGerma1!J (1949) outlines the revenue shares from particular
taxes accruing to the different levels of government, and the way in which these are to be
distributed (Spahn and F6ttinger 1997: 228-230).
2.2.3.5 Framework for Transfers and Grants
A specific design of intergovernmental transfers and grants should attempt to reconcile a
number of criteria (Shah 1994a: 33-34): subnational autonomy, revenue adequacy, equity,
predictability, efficiency, simplicity, incentive for sound fiscal management, and safe
guarding the grantor's objectives. Clearly, these criteria can be in conflict with each other.
For example, there is a trade-off between protecting the autonomy of sub national gov
ernments and the desire to safeguard the grantor's objectives. In practice, value judge
ments determine which of these principles will be maximised.
32
Stellenbosch University https://scholar.sun.ac.za
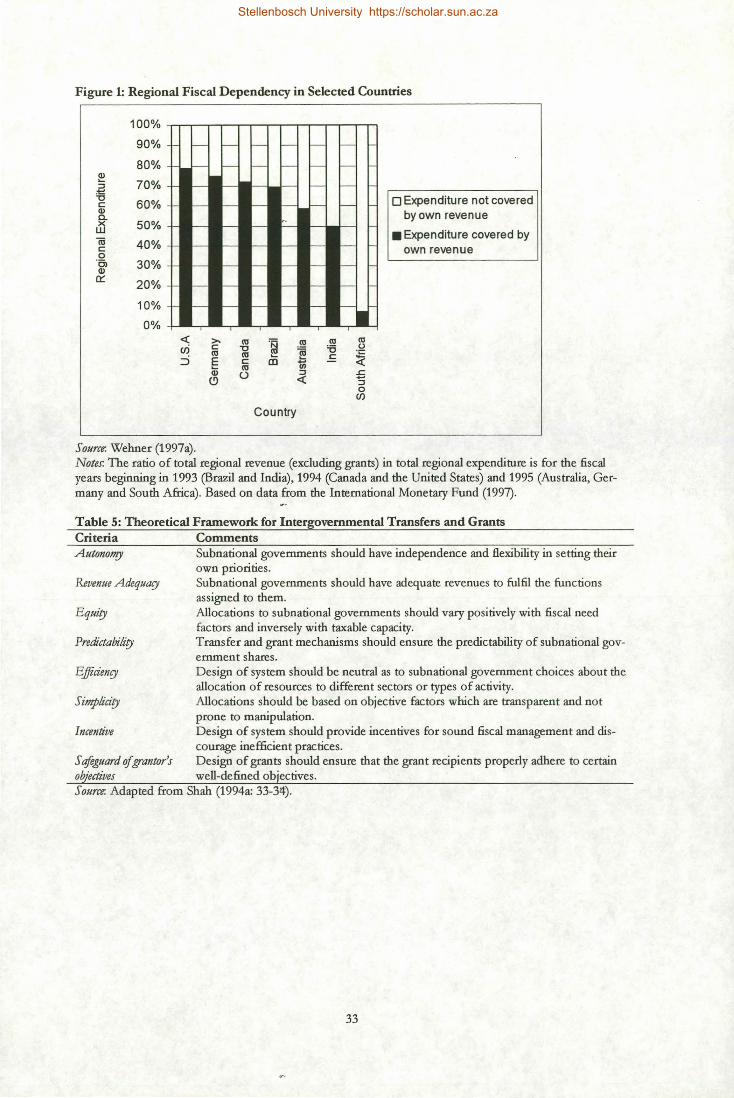
Figure 1: Regional Fiscal Dependency in Selected Countries
100%
90% r- r-
80% t-- t--
~ 70% :J
~ r- r-
-0 60% c:
Q) - t--
0-x 50% w - t--
ro 40% c: - r-0 '51 30% Q)
- t--
0::: 20% t-- t--
10% t-- t--
0% ~ >- IU rn c: -0
:j IU IU E c: Cii IU
0 C>
Source: Wehner (1997a).
r- r- f---
t-- - f---
r- - r-
t-- - t--
t-- - t--
r- - r-
t-- - t--
t-- - t--
t-- t-- t--
~ .!!! ~
CD iii :J ~
Country
-
-
-
-
-
-
-
--. IU IU '6 (,)
.f: ~ .s:;
"5 0 rn
o Expenditure not covered by own revenue
• Expenditure covered by own revenue
Notes: The ratio of total regional revenue (excluding grants) in total regional expenditure is for the fiscal years beginning in 1993 (Brazil and India), 1994 (Canada and the United States) and 1995 (Australia, Germany and South Africa). Based on data from the International Monetary Fund (1997).
Table 5: Theoretical Framework for Intergovernmental Transfers and Grants Criteria Comments Auton0"!Y Subnational governments should have independence and flexibility in setting their
own priorities. Revenue Adequary Subnational governments should have adequate revenues to fulfil the functions
assigned to them. EquifY Allocations to subnational governments should vary positively with fiscal need
factors and inversely with taxable capacity. Predictabilzty Transfer and grant mechanisms should ensure the predictability of subnational gov
ernment shares. Efficimry Design of system should be neutral as to subnational government choices about the
allocation of resources to different sectors or types of activity. Simplz'cifY Allocations should be based on objective factors which are transparent and not
prone to manipulation. Incentive Design of system should provide incentives for sound fiscal management and dis
courage inefficient practices. Safeguard of graTltor's Design of grants should ensure that the grant recipients properly adhere to certain objeaives well-defined objectives. Source: Adapted from Shah (1994a: 33-3lf).
33
Stellenbosch University https://scholar.sun.ac.za

2.2.4 Borrowing Arrangements
2.2.4.1 The Need for Subnational Government Borrowing
The income of a government is in many cases insufficient to finance all its spending,
which results in a deficit.40 Although a government may decide to raise taxes to cover the
deficit, it may also resort to borrowing.
Subnational government borrowing is required to fmance substantial capital41 spending
(Oates 1993: 153). Equity considerations support the argument that the cost of an in
vestment project should be spread across a number of years to coincide more closely
with the stream of future benefits. However, if the returns 'from an investment do not
cover the costs of debt repayment, future generations are likely to have to pay higher
taxes to payoff debt that was accumulated in the past. High costs of debt repayment, in
tum, restrict the ability of the government to fund needed programmes (Abedian et a!
1997: 25-29). In addition, it might also be argued that access to borrowing fosters effi
ciency. Financial markets would penalise poor performance by raising interest rates or
blocking access to further funds.
2.2.4.2 Possible Approaches to );ubnational Government Borrowing
The following are the main possible approaches to subnational borrowing (Ter
Minassian and Craig 1997):
Tota! reliance on market discipline forfeits any legal constraints on the borrowing activities of
subnational governments (e.g. Canada, Finland and Russia).
A co-operative approach to debt controls arrives at limits on the indebtedness of sub national
governments through a negotiating process between the central and lower levels of gov
ernment (e.g. Australia and Denmark).
40 A deficit is the amount of money by which planned government expenditures are more than the revenue . expected to be available.
41 Capital goods are goods that are used in the production of other goods or services, for instance machinery, vehicles, buildings etc.
34
Stellenbosch University https://scholar.sun.ac.za
A rules-based approach controls sub national borrowing through standing legal rules (e.g.
Germany, Switzerland and the United States). For instance, borrowing may be restricted
to investment purposes (the so-called "golden rule"), or required not to exceed a certain
level of indebtedness.
Direct centralised control over sub national borrowing (e.g. Chile and Spain) may take a num
ber of forms. The central government may set annual limits on the overall debt of indi
vidual subnational jurisdictions, authorise individual borrowing activities, or undertake all
government borrowing with subsequent on-lending to sub national authorities.
Ter-Minassian and Craig (1997: 169-171) conclude that no standard pattern can be ob
served with regard to the regulation of subnational government borrowing. They note
that the nature and coverage of controls on subnational government borrowing reflects ~.
the individual country's history, the balance of power between various levels of govern-
ment, macro-economic conditions and the development of financial markets.
2.3 Chapter Conclusion
This chapter reviewed considerations in the design of intergovernmental fiscal relations.
The discussion generated economic reference frameworks with regard to the assignment
of expenditure responsibilities, sources of revenue, and the design of a system of inter
governmental transfers and grants. These frameworks can be utilised for the assessment
of the South African system. However, the analysis also indicated that constitutions can
impose limits on fiscal design. The implication is that any policy recommendations con
cerning fiscal design cannot ignore an existing constitutional framework. This notion will
be developed further in the following chapter.
35
Stellenbosch University https://scholar.sun.ac.za

CHAPTER 3:
FISCAL FEDERALISM IN COMPARATIVE PERSPECTIVE
This chapter contains a comparison of two countries which served as prominent refer
ence models for the structure of government during the constitutional negotiations in
South Africa. The chapter tracks 'Some of the key options that constitutional designers
were faced with, and which have a bearing on fiscal arrangements. The purposes of the
chapter are to demonstrate the practical relevance of the theoretical considerations out
lined in the previous chapter, and to provide a comparative context, from a fiscal per
spective, for the description and analysis of the South African system.
During the constitutional negotiations in South Africa, Canada and Germany were re
peatedly used as reference models for the design of the country's provincial system (e.g.
Constitutional Assembly 1995, De Villiers 1994b).42 Canada and Germany exemplify
diametrically opposed visions of a system of regional government: the divided and the
shared model respectively. Canada is perhaps the most decentralised federation in the
world, whereas the German syste'.:n is characterised by a strong central government.
While the Canadian model appealed to supporters of substantial autonomy for the re
gions, the German "unitary federation" (Hesse 1962) served as a model for those fa
vouring a system of regional government that complements the role of the centre.43
Canada is a federation of ten provinces and three territories characterised by differences
in territorial size, economic development, population and ethnic composition. The British
North America Act of 1867 and its subsequent amendments laid the basis for today's fed
eralism (Simeon and Robinson 1990: 19_30).44
42 Simeon (1998: 50-51) summarises: "Among the models which South Africa considered were those of Canada and Germany - Canada perhaps because of the Commonwealth link, and its marriage of federalism with a parliamentary system of government; Germany perhaps because of other cultural affinities, and its quite different model: The United States, India and Australia have also been sources of ideas, in the latter two cases in large part because they are relatively centralised models." 43 The German system appealed to a group of ANC strategists who visited the country as part of a study tour in 1992. Its integrated design is favoured in the 1993 "ANC Regional Policy" (Besdziek 1998). 44 The Constitution Aa (1982) attempted to modernise the Constitution. It added a Charter of Rights, the recognition of Aboriginal rights, a commitment to the principle of equalisation and an amending formula, among other things. The British North Amen·ca Aa (1867) was renamed the Constitution Aa (1867).
36
Stellenbosch University https://scholar.sun.ac.za

Gennany is a federation of 16 provinces (Lander), five of which were incorporated from
the territory of the fonner Gennan Democratic Republic with unification on 3 October
1990 (Burgess and Gress 1993). The Basic Law for the Federal Republic ofGerma1fY (Grundge
set:(j of 1949 regulates the relationship between the levels of government.45
3.1 Expenditure Assignment
A key issue in the assignment of expenditure functions is to what extent functions should
be shared or divided. Shared functions usually involve one level setting nonns and stan
dards, while delegating implementation to lower levels of government. The clear division
of functions, on the other hand, relies on the furthest possible separation of responsibili
ties. If one level is responsible for setting nonns and standards that are administered by
another level, the question follows whether and how the latter can participate in the for
mulation of policy.
3.1.1 Canada
The Constitution Act (sections 91 and 92) lists exclusive federal and provincial functions.46
The federal government regulates the provision of goods and services with national
scope, such as defence and international affairs. The provinces are assigned the right to
regulate "generally all matters of a merely local or private nature in the province", which
includes health care and education. Local governments in Canada are creatures of their
provincial government (Bird and Chen 1998).47 Fonnal concurrency is limited to agri
culture and immigration. In the case of conflict in the areas of concurrent federal and
provincial powers, federal law supersedes.48 Apart from these cases, the Canadian Con-
45 For overviews of Gennany's fiscal Constitution, refer to Laufer and Miinch (1997: 150-185) and Bundesministerium der Finanzen (1998 and 1996: 93-108). 46 The Canawan Supreme Court plays a pivotal role in detennining into whose area of competence a particular piece oflegislation falls (Coder 1~96). For an analysis of the impact of Supreme Court on federalism in the United States, see Wise (1998). 47 There are approximately 8000 local units, including agencies, commissions, special-purpose boards, municipal governments and school authorities. 48 In 1949 old age pensions was added as an area of concurrent juriswction in which provinces retain paramountcy (Simeon 1998: 51).
37
Stellenbosch University https://scholar.sun.ac.za
stitution emphasises exclusive functional responsibility.49 There is no unified public serv
ice, and the levels of government rely on separate administrations to implement policies.
The role of the Senate as a repreSJ!ntative of the provinces in the national law-making
process is largely symbolic (Verney 1995: 95). Despite formal powers, the regional cham
ber rarely refuses the passage of a bill. Since it is an appointed bodyso, the Senate is not
considered to have the political mandate to obstruct the democratically elected House of
Commons. The failure of the Senate as an effective provincial representative has
strengthened the role of "federal-provincial diplomacy" (Simeon 1972) through negotia
tions by the executives of the different governments (Watts 1990: 3).
3.1.2 Germaf!Y
The Grundgesetz assigns specific legislative competencies to the federal government (Bund)
(Art. 71 and 73), such as defence;foreign affairs, immigration and currency matters. The
residual competencies are left to the Lander (Art. 70), including education, police and in
ternal administration (Fuhr 1997: 28-58, Hesse and Ellwein 1992: 78-81). A substantial
list of concurrent competencies (Art. 72, 74 and 74a) names those areas in which the
Lander may exercise legislative authority as long as the Bund does not do so (e.g. welfare
and public health). The Bund also has a framework legislation authority that allows it to
legislate basic norms and standards, but no details, in seven areas (Art. 75) (e.g. the public
service, tertiary education, and the media). Furthermore, article 91a provides for a num
ber of shared responsibilities (e.g. the construction of universities and coastal protection).
In case of conflict between legislation, federal law supersedes if the federal government
has jurisdiction (Art. 31). Federal norms and standards are encouraged by the constitu
tional demand for the creation of equal living conditions throughout the country (Art.
72(2»). The functions of local governments are mostly delegated, relating to public health
and basic services (water, electricity, gas, public transport and fire protection).Sl Charac-
49 Some exclusively assigned areas have been subject to increased co-operation between the levels of government. For example, innovative health care programmes were pioneered in the western provinces, but later promoted jointly by the federal and provincial levels (Gray and White 1989). Defacto concurrency also occurs when both levels move into new areas of activity that are not assigned in the Constitution, as they were not matters of concern in the previous century when it was drafted (Simeon 1998: 52). 50 It consists of 24 senators for each of the four divisions of Ontario, Quebec, the three maritime provinces and the four western provinces. The senators are appointed by the federal government, and once appointed hold office until age 75. Party alignment plays the major role in the appointment process. 51 Gennany has a two-tier system of local government (De Villiers 1997a: 6, Hesse and Ellwein 1992: 68-70).
38
Stellenbosch University https://scholar.sun.ac.za
teristic of German federalism is the integration of Bund and Under tasks. While the Bund
has broad legislative authority to set unifonn standards, the Under provide most of the
administrative infrastructure. The Bund has few executive organs (e.g. the foreign service,
army and border control). Scharpf's (1988) concept of "policy interlacing" (Politikverjlech
tung) summarises this mutual dependency (see also: Rudzio 1991: 352-359).
As the federal Parliament sets policy standards in many areas that are administered by the
Under, the regional chamber of P.arliament, the Bundesrat, acts as a powerful direct repre
sentative of the governments of the Under.52 The consent of the Bundesrat is required for
bills that affect the Under. The Bundesrat may object to all other legislation, which can be
overruled by the Bundestag, the lower house of Parliament (Art. 77). In case of conflict
between the two houses, a mediation committee is fonned of 16 members from each
house. In the overwhelming majority of cases, the mediation committee is able to facili
tate an agreement (Hesse and Ellwein 1997: 318-319).
3.2 Revenue Assignment
With regard to the assignment ofrevenue sources, a central question is whether levels of
government should have independent access to tax bases, or whether revenues should be
shared. While the first option maximises the autonomy and independence of different
governments, the latter option allows for a unifonn tax regime across the country.
3.2.1 Canada
The Constitution Act (section 91(3)) grants the federal Parliament the power to levy indi
rect as well as direct taxes, while the provinces are confined to direct taxation.53 In prac
tice both levels have a wide range of revenue-raising powers. The federal government
mainly relies on revenue from personal and corporate income taxes, as well as the Goods
and Services Tax (GS1) levied since the beginning of 1991 (Krelove et a11997: 209). The
provinces impose both personal and corporate income taxes, the collection of which is
administered by the federal government (with the exception of Quebec's) on the basis of
52 The Prime Minister of each Landis a member of the Btlnriesrat, in addition to other delegates. The deIe. gates of a particular Land always vote as a block, not individually.
39
Stellenbosch University https://scholar.sun.ac.za
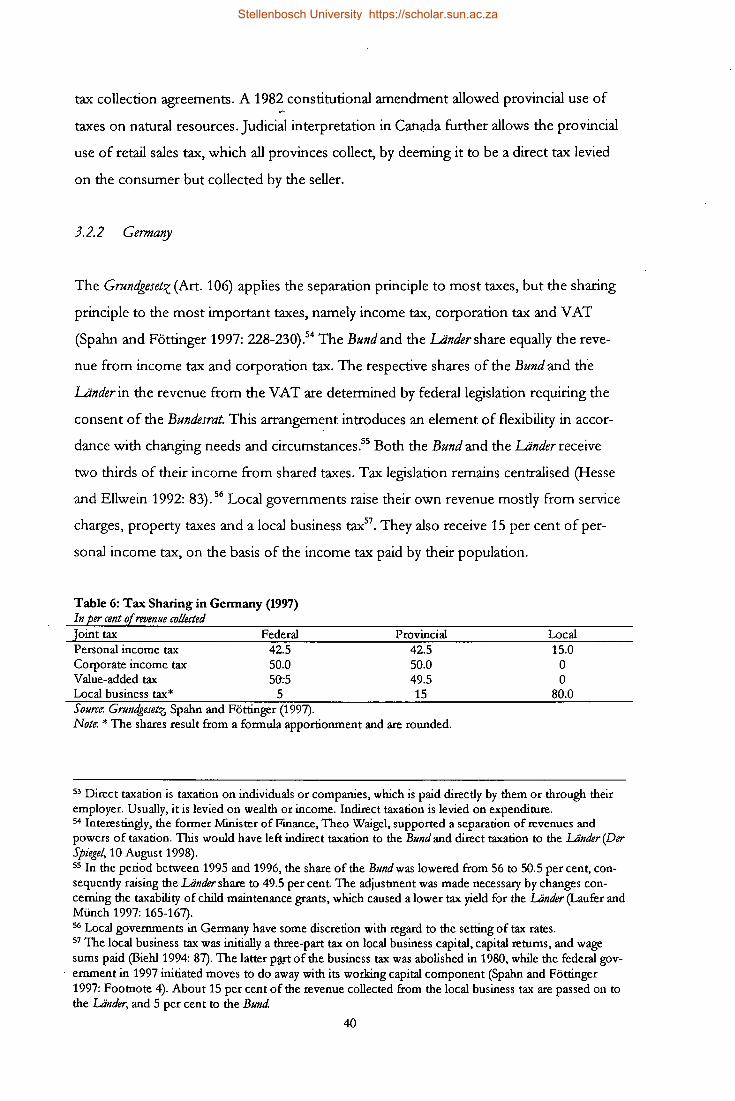
tax collection agreements. A 1982 constitutional amendment allowed provincial use of
taxes on natural resources. Judicial interpretation in Can~da further allows the provincial
use of retail sales tax, which all provinces collect, by deeming it to be a direct tax levied
on the consumer but collected by the seller.
3.2.2 Germa1!)l
The Grundgesetz (Art. 106) applies the separation principle to most taxes, but the sharing
principle to the most important taxes, namely income tax, corporation tax and VAT
(Spahn and F6ttinger 1997: 228-230).54 The Bund and the Under share equally the reve
nue from income tax and corporation tax. The respective shares of the Bund and th"e
Under in the revenue from the VAT are determined by federal legislation requiring the
consent of the Bundesrat. This arrangement introduces an element of flexibility in accor
dance with changing needs and circumstances.55 Both the Bund and the Under receive
two thirds of their income from shared taxes. Tax legislation remains centralised (Hesse
and Ellwein 1992: 83).56 Local governments raise their own revenue mostly from service
charges, property taxes and a local business tax5? They also receive 15 per cent of per
sonal income tax, on the basis of the income tax paid by their population.
Table 6: Tax Sharing in Gennany (1997) In per cent of revenue co!leaed Joint tax Federal Personal income tax 42.5 Corporate income tax 50.0 Value-added tax 50":5 Local business tax* 5 Source: Gf'I.Indgeset~ Spahn and Fottinger (1997).
Provincial 42.5 50.0 49.5 15
Note: * The shares result from a formula apportionment and are rounded.
Local 15.0 o o
80.0
53 Direct taxation is taxation on individuals or companies, which is paid direcdy by them or through their employer. Usually, it is levied on wealth or income. Indirect taxation is levied on expenditure. 54 Interestingly, the former Minister of Finance, Theo Waigel, supported a separation of revenues and powers of taxation. This would have left indirect taxation to the Bund and direct taxation to the Under (Der Spiegel, 10 August 1998). 55 In the period between 1995 and 1996, the share of the Bundwas lowered from 56 to 50.5 per cent, consequendy raising the Under share to 49.5 per cent The adjustment was made necessary by changes concerning the taxability of child maintenance grants, which caused a lower tax yield for the Under (Laufer and Miinch 1997: 165-167). 56 Local governments in Germany have some discretion with regard to the setting of tax rates. 5? The local business tax was initially a three-part tax on local business capital, capital returns, and wage sums paid (Biehl 1994: 87). The latter p~ of the business tax was abolished in 1980, while the federal government in 1997 initiated moves to do away with its working capital component (Spahn and Fottinger 1997: Footnote 4). About 15 per cent of the revenue collected from the local business tax are passed on to the Under, and 5 per cent to the Bund
40
Stellenbosch University https://scholar.sun.ac.za

3.3 Intergovernmental Transfers and Grants
The design of intergovernmental transfers and grants requires the following choices: To
what extent should differences in~:wealth between regions be equalised? Should equalisa
tion include a redistribution process from rich to poor regions? To what extent should
the central government influence subnational expenditure through conditional grants?
3.3.1 Canada
The Constitution Act (1982) commits the federal government to equalisation "to ensure
that provincial governments have sufficient revenues to provide reasonably comparable
levels of public services at reasonably comparable levels of taxation" (section 36). These
federal grants are based on a formula that compares the tax capacity of each province to
a representative standard.s8 If a province's total revenue-raising ability falls short of this
standard, its per capita revenue i~raised to the standard level through federal equalisation
payments. Only Alberta, British Columbia wd Ontario do not receive equalisation grants
under this system. French-speaking Quebec is the single largest recipient of equalisation
payments in absolute terms (Hobson and St-Hilaire 1993).
Inter-provincial redistribution outside the equalisation programme but through the
"spending power"S9 of the federal government includes the Canada Health and Social
Transfer (CHS1) in support of health care, post-secondary education and social assis
tance programs.60 One condition attached to the CHST is that there be no period of
minimum residency with respect to social assistance. In the area of public health the only
other condition is provincial maintenance of the criteria and conditions spelled out in the
Canada Health Act (1984).61 The "Framework to Improve the Social Union for Canadi-
58 First, the amount of revenue that each province could raise (at national average tax rates) is calculated for each kind of revenue that provinces and their local governments typically levy. Second, each province's overall ability to raise revenues from these sources is compared to that of the five provinces making up a representative standard: Quebec, Ontario, Manitoba, Saskatchewan and British Columbia. For details on the formula, see: Krelove et 01 (1997: 215-220) and Shah (1994b: 49-50). 59 Its "spending power" allows the federal government to spend money in areas assigned to provinces. 60 The Canada Health and Social Transfer replaced federal transfers for social assistance under the Canada Assistance Plan (CAP), and for health and post-secondary education under Established Programs Financing (EPF) on 1 April 1996 .
. 61 Health is a provincial competence in Canada. However, broad political consensus made it possible for the federal Parliament to pass this act, which established some essential criteria for the entire country. Due to this consensus, the act has not been challenged in the constitutional court, although the federal Parlia-
41
Stellenbosch University https://scholar.sun.ac.za
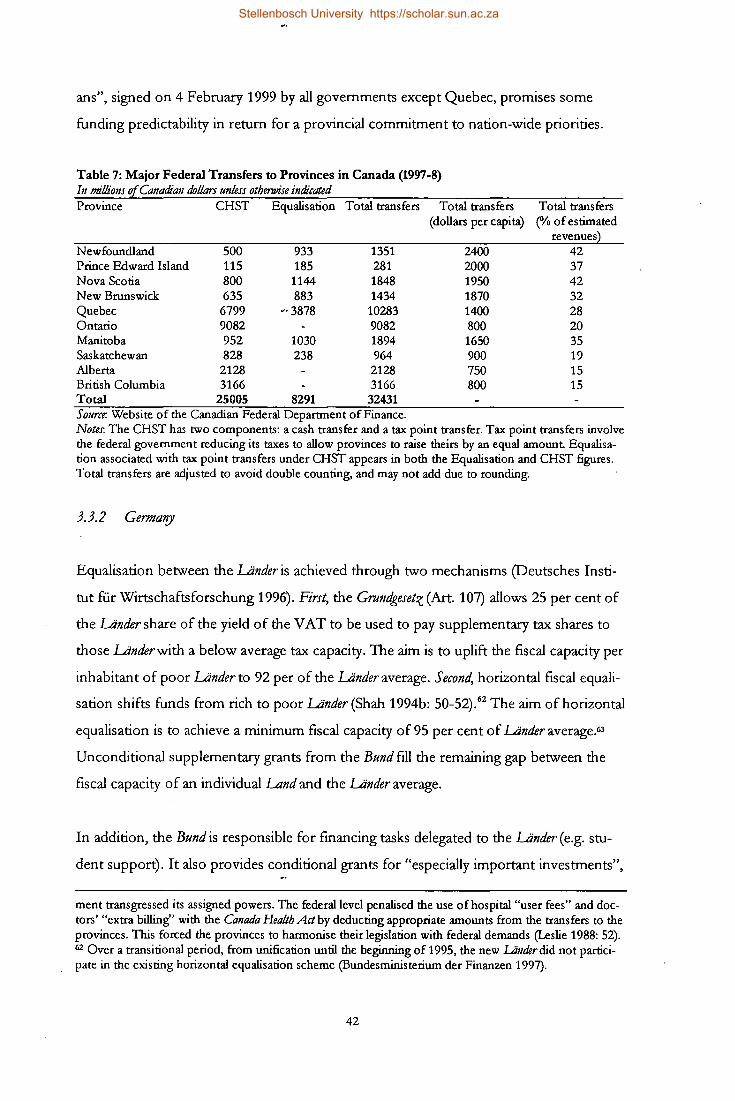
ans", signed on 4 February 1999 by all governments except Quebec, promises some
funding predictability in return for a provincial commitment to nation-wide priorities.
Table 7: Major Federal Transfers to Provinces in Canada (1997-8) In millions o£.Canadian dollars unless otherwise indicated Province CHST Equalisation Total transfers Total transfers Total transfers
(dollars per capita) (% of estimated revenues}
Newfoundland 500 933 1351 2400 42 Prince Edward Island 115 185 281 2000 37 Nova Scotia 800 1144 1848 1950 42 New Brunswick 635 883 1434 1870 32 Quebec 6799 '·3878 10283 1400 28 Ontario 9082 9082 800 20 Manitoba 952 1030 1894 1650 35 Saskatchewan 828 238 964 900 19 Alberta 2128 2128 750 15 British Columbia 3166 3166 800 15 Total 25005 8291 32431 Source: Website of the Canadian Federal Department of Finance. Note.r. The CHST has two components: a cash transfer and a tax point transfer. Tax point transfers involve the federal government reducing its taxes to allow provinces to raise theirs by an equal amount. Equalisation associated with tax point transfers under CHST appears in both the Equalisation and CHST figures. Total transfers are adjusted to avoid double counting, and may not add due to rounding.
3.3.2 Germa1[Y
Equalisation between the Lander is achieved through two mechanisms (Deutsches Insti
tut fur Wirtschaftsforschung 1996). First, the Grnndgesetz (Art. 107) allows 25 per cent of
the Lander share of the yield of the VAT to be used to pay supplementary tax shares to
those Landerwith a below average tax capacity. The aim is to uplift the fiscal capacity per
inhabitant of poor Lander to 92 per of the Lander average. Second, horizontal fiscal equali
sation shifts funds from rich to poor Lander (Shah 1994b: 50-52).62 The aim of horizontal
equalisation is to achieve a minimum fiscal capacity of95 per cent of Landeraverage.63
Unconditional supplementary grants from the Bund fill the remaining gap between the
fiscal capacity of an individual LAnd and the Lander average.
In addition, the Bund is responsible for financing tasks delegated to the Lander (e.g. stu
dent support). It also provides conditional grants for "especially important investments",
ment transgressed its assigned powers. The federal level penalised the use of hospital "user fees" and doctors' "extra billing" with the Canada Health Act by deducting appropriate amounts from the transfers to the provinces. This forced the provinces to harmonise their legislation with federal demands (Leslie 1988: 52). 62 Over a transitional period, from unification until the beginning of 1995, the new .L!imferdid not participate in the existing horizontal equalisation scheme (Bundesministerium der Finanzen 1997).
42
Stellenbosch University https://scholar.sun.ac.za

such as the construction of roads, social housing and hospitals (Art. 104a), and towards
the financing of the shared responsibilities (Art. 91a and 91b).
Table 8: Effects of Equalisation in Gennany (1996) Fiscal capaci!J per capita in per cent of Under average
Hessen Baden-Wiirtemberg Bayem Hamburg Nordrhein-Westfalen Schleswig-Hols tein Rheinland-Pfalz Niedersachsen Saarland Brandenburg Sachsen Thiiringen Sachsen-Anhalt Mecklenburg-Vorpommem Bremen Berlin
Before equalisation
117.2 108.8 108.6 107.9 106.4 99.6 96.2 95.4 89.7 85.1 84.5 84.0 ~S3.9
83.5 79.2 72.3
Source: Bundesministerium der Finanzen (1998: 34-35).
After horizontal equalisation
104.1 102.9 102.8 102.8 102.2 99.8 97.6 97.1 95.0 95.0 95.0 95.0 95.0 95.0 96.4 95.0
After additional federal grants*
104.1 102.9 102.8 102.8 102.2 103.3 103.6 101.1 104.5 120.0 119.0 120.6 120.6 121.4 105.0 114.6
Note: * Excluding budget consolidation grants to Bremen (OM 1.8 billion) and Saarland (OM 1.6 billion).
3.4 Borrowing Arrangements
Finally, governments require access to borrowing to finance capital projects. But the
question remains how subnational access to borrowing should be regulated: Should there
be rules, co-ordinating procedures or centralised control? Or should subnational bor
rowing be subject to market discipline only?
3.4.1 Canada
Both the federal and provincial governments can borrow funds for current and capital
purposes without constitutional or other legal restrictions. They are also not required to
balance their budgets annually and are only subject to market discipline, since one or
more international investment firms rate their debt. In recent years, some of these ratings
have been downgraded, reflecting increasing public concern about the accumulation of
debt. Debt targets are now used as part of consolidation efforts. Municipal governments
63 The population figures of cities with Landerstatus are weighed 35 per cent higher than those of "normal" Under to compensate for the expenses incurred due to their small size. For instance, substantial spillovers
43
Stellenbosch University https://scholar.sun.ac.za
are required by the provinces to balance their current account budgets, while capital ex
penditure is subject to varying restrictions imposed by the different provinces (Krelove et
a11997: 220-222).
3.4.2 Germany
The Grundgesetz (Art. 115(1» restricts the Bund to borrowing for capital expenditure,
which is referred to as the "golden rule". Similar restrictions are enshrined in the consti
tutions of the Lander. Local capital expenditure may also be financed through loans, sub
ject to Lander supervision (Spahn and Fottinger 1997: 236-239).
3.5 Chapter Conclusion
This chapter demonstrated the impact that the choice for a particular model of regional
government has on fiscal arrangements in a country. In the divided model (as in Canada),
national and regional governments pursue their functions as independentlY as possible and
directlY access sources of revenue. In the shared model (as in Germany), the emphasis is on
concurrent responsibility and shared sources of revenue. It is possible to explain the choice
between these models by factors such as the approach to federation ("bottom up" versus
"top down" approach to federation), the age of the constitutional framework (older versus
recent federations) and the prevalence of ethnic cleavages (ethnically heterogeneous versus
ethnically homogeneous federations). Nonetheless, economic considerations are to some
extent reflected in both cases. For example, there is congruence with regard to the as
signment of some expenditure functions with a natiorlaL~cope (e.g. defence and foreign
affairs). However, the extent of decentralisation is greater in Canada, on both the expen
diture and revenue side. It is an iQ.teresting question whether, in general, divided models
are associated with a higher degree of (expenditure and revenue) decentralisation than
shared models. This issue deserves further research.
which occur when these cities provide services for residents of surrounding Liil1der.
44
Stellenbosch University https://scholar.sun.ac.za

Table 9: Models of Regional Government and their Fiscal Arrangements Divided modeL' Canada Shared modeL' Germany
FundamentaL pn'nciples Diversity, dualism and competition. Uniformity, integration and cooperation.
Expenditure assignment
Revenue assignment
Equalisation
Borrowing
Possible explanatory variables
According to policy areas (e.g. health, education, defence).
Concurrency and joint responsibilities minimised: Norms and standards determined by level of government to which policy area is assigned. Separate federal and provincial administrations.
No meaningful provincial representation in national Parliament
Direct access to own revenue for levels of government
Vertical: Equalisation the sole responsibility of the federal government (paternal settlement). Regional disparities and diversity accepted.
Separate responsibility.
Ethnically heterogeneous. Bottom up approach to federation. Older constitutional framework (1867).
45
According to governmental functions (regulation and implementation).
Concurrency and joint responsibility emphasised: Federal government sets norms and standards in many areas, but depends on subnational administrations.
Strong provincial representation in national Parliament
S~aring of revenue sources between levels of government.
Horizontal: Equalisation based on the principle of interregional solidarity (fraternal settlement). Goal to achieve uniformity of living conditions.
Common rules.
Ethnically homogeneous. Top down approach to federation. More recent constitutional framework (1949).
Stellenbosch University https://scholar.sun.ac.za

CHAPTER 4:
FISCAL FEDERALISM IN SOUTH AFRICA
This chapter outlines the design of fiscal federalism in South Africa. It draws mainly on
the final Constitution and relevant legislation, budgetary data, as well as a discussion of
suggested and actual practices. It also highlights key issues relating to the functioning of
the structure of government in the country. Since South Mrica's fiscal structures are still
evolving, the following analysis is necessarily a snapshot. Nonetheless, it draws together
some of the central trends that have emerged since the implementation of the new con
stitutional framework as from 1997.
In 1997, for the first time, the nine provinces that had been created in 1994 were respon
sible for drawing up their own budgets, within an overall resource envelope, rather than
merely managing centrally determined allocations for each spending area. Prior to the
1997-8 financial year, provincial budgets were the sum of centrally determined allocations
for various functions. Allocations for specific functions were consolidated in aggregate
transfers from the budget vote of the national Department of Finance to each province,
supplemented with specific project funds from other national departments or the Recon
struction and Development Programme (RDP) fund.64 This process involved a system of
centrally steered function committees according to expenditure areas (Hartzenberg 1995).
The 1997-8 budget introduced a system of block grants distributed to the provinces by
formula. Conditional grants were introduced in the following year, in conjunction with a
more detailed formula for the distribution of funds between provinces. Local govern
ment was included in the new system of transfers and grants in 1998. Both local and
provincial governments now receive a share of nationally collected revenue, in line with
the provisions of the new Constitution. Fundamental adjustments have thus been af
fected over the past three years, while a number of details remain to be finalised.
64 The RDP was the socio-economic policy framework published by the ANC in 1994. The programme emphasised two aims: the alleviation of poverty and the reconstruction of the economy (see Lodge 1999: 27-39). The fund financed related projects across the provinces. The effectiveness of this spending has
. been subject to controversy. In KwaZulu-Natal, for example, a row erupted in October 1998 when it emerged that about R 28 million of RDP funds spent during the 1995-6 and 1996-7 financial years could not be fully accounted for (Business D'!},} October 1998).
46
\
Stellenbosch University https://scholar.sun.ac.za
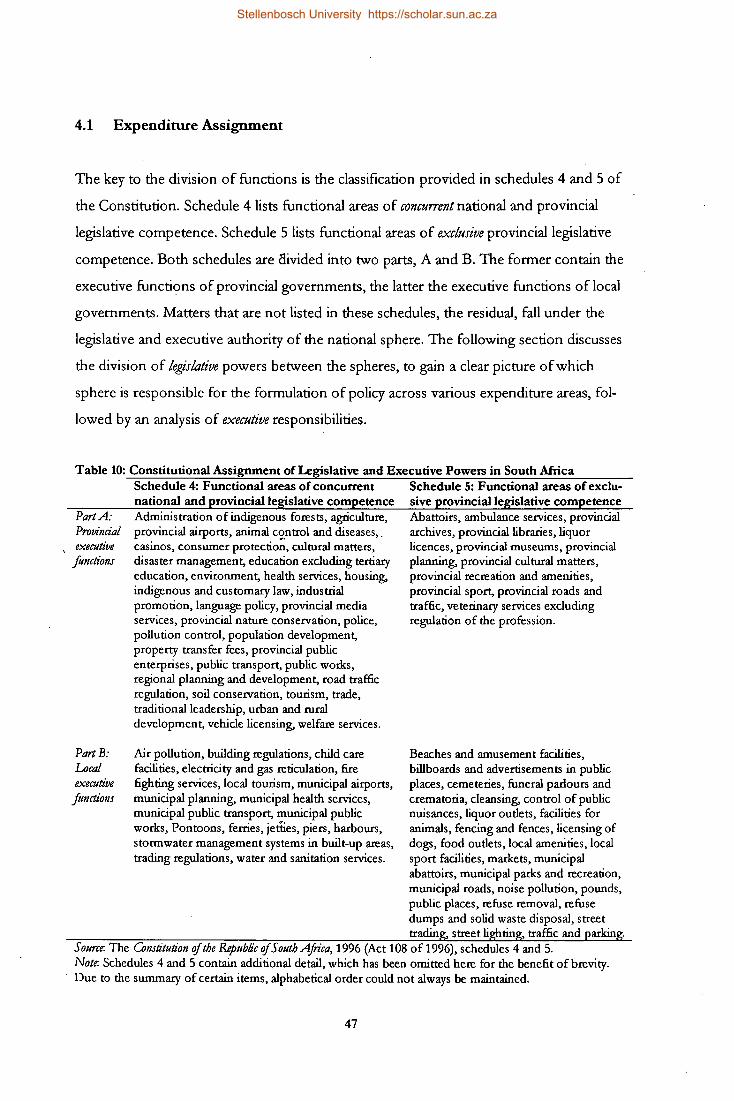
4.1 Expenditure Assignment
The key to the division of functions is the classification provided in schedules 4 and 5 of
the Constitution. Schedule 4 lists functional areas of concurrent national and provincial
legislative competence. Schedule 5 lists functional areas of exclusive provincial legislative
competence. Both schedules are Ciivided into two parts, A and B. The former contain the
executive functions of provincial governments, the latter the executive functions of local
governments. Matters that are not listed in these schedules, the residual, fall under the
legislative and executive authority of the national sphere. The following section discusses
the division of legislative powers between the spheres, to gain a clear picture of which
sphere is responsible for the formulation of policy across various expenditure areas, fol
lowed by an analysis of executive responsibilities.
Table 10: Constitutional Assignment of Legislative and Executive Powers in South Mrica
Part A: Provincial executive junctions
Part B: Local executive junctions
Schedule 4: Functional areas of concurrent Schedule 5: Functional areas of exclu-national and provincial legislative competence Administration of indigenous forests, agriculture, provincial airports, animal control and diseases, . casinos, consumer protectio~, cultural matters, disaster management, education excluding tertiary education, environment, health services, housing, indigenous and customary law, industrial promotion, language policy, provincial media services, provincial nature conservation, police, pollution control, population development, property transfer fees, provincial public enterprises, public transport, public works, regional planning and development, road traffic regulation, soil conservation, tourism, trade, traditional leadership, urban and rural development, vehicle licensing, welfare services.
Air pollution, building regulations, child care facilities, electricity and gas reticulation, fire fighting services, local tourism, municipal airports, municipal planning, municipal health services, municipal public transport, municipal public works, Pontoons, ferries, jetties, piers, harbours, stormwater management systems in built-up areas, trading regulations, water and sanitation services.
sive provincial legislative competence Abattoirs, ambulance services, provincial archives, provincial libraries, liquor licences, provincial museums, provincial planning, provincial cultural matters, provincial recreation and amenities, provincial sport, provincial roads and traffic, veterinary services excluding regulation of the profession.
Beaches and amusement facilities, billboards and advertisements in public places, cemeteries, funeral parlours and crematoria, cleansing, control of public nuisances, liquor outlets, facilities for animals, fencing and fences, licensing of dogs, food outlets, local amenities, local sport facilities, markets, municipal abattoirs, municipal parks and recreation, municipal roads, noise pollution, pounds, public places, refuse removal, refuse dumps and solid waste disposal, street trading, street lighting, traffic and parking.
Source: The C01utitution of the Republic of South Ajn·ca, 1996 (Act 108 of 1996), schedules 4 and 5. Note: Schedules 4 and 5 contain additional detail, which has been omitted here for the benefit of brevity. Due to the summary of certain items, alphabetical order could not always be maintained.
47
Stellenbosch University https://scholar.sun.ac.za

4.1.1 Assignment of Legislative Powers
4.1.1.1 National, Provincial and Local Legislative Powers
The national Parliament has the right to pass legislation in any matter, excluding, under
normal circumstances, those relating to exclusive provincial competencies (section 44). A
provincial legislature may pass a provincial Constitution, in accordance with the national
Constitution, pass legislation in those areas that are listed in schedules 4 and 5, and per
taining to matters that have been delegated to a province through national legislation.
Furthermore, a province may delegate a legislative power to a municipal council and rec
ommend legislation to the lower house of the national Parliament, the National Assem
bly (section 104). Legislating is not a main function of municipalities. A municipality is
restricted to passing by-laws when this is necessary for the "effective administration" of
its executive functions, i.e. those listed in parts B of schedules 4 and 5 or delegated to it
(section 156). A by-law that conflicts with national or provincial legislation is invalid.
Although provinces have substantial law-making powers, they have so far tended not to
utilise their legislative "space" to the fullest.65 There are two explanations for this. First,
many provincial legislatures struggle to legislate beyond the necessary annual appropria
tions.66 This may be due to the fact that the consideration of national legislation and the
negotiating of mandates for provincial delegates to the national Parliament are time
consuming (see section on the participation of provinces in the national law-making pro
cess). Hindering factors also include a lack of skilled staff to draft legislation, and the
need for provinces to wait for national legislation to be passed so that their legislation
would be compatible with it. Second, national norms and standards in the concurrent areas
are rather detailed, leaving little to be regulated by provincial legislation (see section on
65 The provincial legislatures of Mpumalanga and the Northern Cape passed only two bills in 1997, while sitting for 33 and 36 days respectively. The Western Cape legislature passed the most bills, 13 in.55 days, followed by KwaZulu-Natal, North West and Gauteng with 11 bills each. The Gauteng legislature sat for 34 days, while the KwaZulu-Natal and North West legislatures sat for 22 days each. The Eastern Cape legislature sat for the 60 days in 1997, the highest number across provinces, and passed nine bills. The Free State and Northern Province legislatures passed seven bills each, while sitting for 32 and 22 days respectively (Business Dtg, 24 March 1998). By now one may have expected consolidating legislation in areas of provincial competence, and more progress in repealing legislation inherited from the apartheid era. 66 Some provinces still rely on the assis~ce of the national Department of Finance for drafting their budgets (Interview: Donian, 8 April 1999). The review of budgets often stretches the ability of provincial legislatures (e.g. Newham 1997). The lack of capacity in some provinces to conduct an efficient legislative process was highlighted when all provincial expenditure in the Eastern Cape from April to August 1998 turned out to have been illegal. The office of Premier Makhenkesi Stofile had omitted to publish the 1998-9 Appropn'atioll BiU in the Government Gazette due to an "oversight" (Busilless Dtg, 30 September 1998).
48
Stellenbosch University https://scholar.sun.ac.za
mandates). Welfare is a case in point. Since entitlements are determined at national level,
no variation of entitlements can occur across provinces. Provinces are bound to comply
administratively with these national requirements.
Only two provinces, in which the ANC did not obtain a majority in the 1994 elections,
have so far drawn up their own Constitutions, the Western Cape and KwaZulu:-Natal.
The Constitutional Court ruled that the Constitution oj the Western Cape required some
technical adjustments to comply with the national Constitution, which were effected.67
Premier Hernu~ Kriel signed the Constitution oJthe Western Cape into law on lS January
1998. Amongst other items~ it marked the end of three years of compulsory power
sharing between the NP and the ANC in the province (Business Dqy, 16 January 1998).
The Constitution oJKwaZulu-Nata/was rejected by the Constitutional Court after being
drafted in 1996. It was found to usurp powers not accruing to the province according to
the national Constitution.68 After the 1999 elections, and the formation of a coalition
government between the IFP and ANC in the province, the parties agreed to resume
talks on the provincial Constitution (Business Dqy, 21 June 1999).69
4.1.1.2 Conflict Between Legislation
In case of conflict between national and provincial legislation falling within a concurrent
area, national legislation prevails under certain conditions, for instance if it deals with a
matter that cannot be regulated effectively at the provincial sphere or that requires uni
formity across the nation. Such uniformity must be achieved by prescribing norms and
standards, frameworks or national policies. National legislation relating to a concurrent
matter also prevails if it is necessary f~r the maintenance of national security or economic
unity, the protection of the common market, the promotion of economic activities across
provincial boundaries, to promote equal opportunity or equal access to government
services, or the protection of the environment (section 146(2)). National legislation fur
ther prevails if it is to prevent unreasonable action by a province that is prejudicial to an
other or the country as a whole or impedes the implementation of national economic
policy (section 146(3)).
67 Certification of the Co11stitution of the Western Cope, 1997,1997 (4) SA 794 (cq and 1997 (9) BCLR 1167 (cq. 68 Certification of the Constitution of the Province ofKwaZulu-Nata~ 1996,1996 (11) BCLR 1419 (cq. 69 Issues to be raised include the extension of the provincial cabinet, the role and powers of the Zulu monarchy, and traditional leaders.
49
Stellenbosch University https://scholar.sun.ac.za

While national legislation in the concurrent areas is only to prevail if certain conditions
are fulfilled, it is questionable how much legislative power these provisions leave to
provinces. While the list of conditions in sections 146(2) and (3) is extensive, it suffices if
only one of them is met in order for national legislation to prevail. Nonetheless, the Con
stitutional Court found that this did not presume in favour of national legislation, as
these factors were "objectively justiciable" in a court (Certification Judgement II, para. 155).
The national Parliament may also intervene in exclusive provincial areas by passing legis
lation if this is required in order to: maintain national security, economic unity or essen
tial national standards; establish minimum standards required for the rendering of serv
ices; or prevent unreasonable action by a province which is prejudicial to the interests of
another province or to the country as a whole (section 44(2)). The Uquor Bill (1998) was
an attempt by the national Department of Trade and Industry to regulate an area that is
exclusively assigned to the provinces by the Constitution. This test case has been referred
to the Constitutional Court for clarification (Business Dqy, 17 February 1999).
4.1.1.3 Provincial Participation in the National Law-Making Process
While the national Parliament has very broad legislative powers, the Constitution also
provides for the participation of provinces in the national law-making process. The Na
tional Council of Provinces (NCOP) represents the provinces to ensure that provincial
interests are taken into account in the national sphere of government. It participates in
the national legislative process and provides a forum for issues affecting the provinces
(section 42(4)). The NCOP plays an important role in approving national legislation that
affects the provinces (section 76). Although it does not have an absolute veto, the vote
of the NCOP in case of section 76 legislation represents the composite result of a vote of
each provincial legislature. To over-ride an NCOP decision on such legislation, the Na
tional Assembly requires a two-thirds majority. Legislation deemed not to affect the
provinces (section 75) and money bills (section 77)70 require only a non-binding recom
mendation from the NCOP to the National Assembly (Wehner 1997b), as the assembly
can choose to overrule the council's vote with a simple majority.
70 A money bill is defined as a "bill that appropriates money or imposes taxes, levies or duties".
50
Stellenbosch University https://scholar.sun.ac.za
The Constitution (section 78) proyides for a mediation committee in case of conflict
between the National Assembly and the NCOP with regard to section 76 legislation. This
body is closely modelled on the German example.71 In contrast with the frequent use of
the mediation committee in Germany, however, the South African conflict-resolution
mechanism has not been utilised so far. This may be largely due to the fact that the same
party, the ANC, enjoys a substantial majority in both houses. So far, the closest a situa
tion has come to necessitating the use of the mediation committee was in November
1998. Changes to the Liquor Bill (1998) by the Select Committee on Trade and Industry
were endorsed by the NCOP, across party lines, and to the dismay of the national Min
ister of Trade and Industry, Alec Erwin. The Portfolio Committee on Trade and Industry
in the National Assembly subsequently voted to concur with the council's amendments,
thus avoiding the possibility of mediation being needed to resolve differences over the
bill between the two houses (Business Dqy, 6 November 1998).
The Constitution also envisages the participation, when necessary, of organised local
government in the proceedings of the NCOP (sections 67 and 163). Up to ten part-time
representatives designated by organised local government may participate, but not vote
(Bhabha 1997). The South African Local Government Association (SALGA) has partici
pated in discussions on matters affecting local government.72
The NCOP has only been in existence since 1997, and it has been a challenge to ensure
the smooth running of its affairs .£Murray and Simeon 1998, Sehurutshe and Newham
1998, Van Heerden 1997). The effective co-ordination of various role-players and com
munication processes had to be achieved (NCOP 1999a, b and c). Provinces had to re
spond to the demands of participating in the national Parliament, by attempting to rec
oncile the tension between their own legislative activities and the requirement to develop
mandates for national legislation. The complexity of national bills often does not allow
members of provincial legislatures to give their NCOP delegates a considered mandate
(Friedman 1999: 46). Nonetheless, the NCOP passed 108 bills in 1997,27 of which were
bills affecting the provinces. The council amended nine section 75 bills and 12 section 76
71 The mediation committee consists of nine members of the National Assembly and one delegate from each of the nine provincial delegations in the NCOP. Agreement on a version of a bill is reached when at least five members of each set of representatives agree .
. 72 For instance in the negotiations leading up to the approval of the intervention by the government of the Eastern Cape in the municipality of Butterworth. This case is dealt with in detail in the section on monitoring and intervention.
51
Stellenbosch University https://scholar.sun.ac.za

bills (NeOp 1998). The NeOp also used its right to initiate legislation with the Organised
Local Government Bill (1997). It remains to be seen whether such initiatives will become
more commonplace in the future.
Friedman (1999: 46) concludes that the NeOp "might become a dynamic part of our
political process if parties would relax their internal discipline and allow delegates to vote
according to their perceived provincial interests rather than the party line. They do not.
So, instead of becoming a site for shifting alliances and bargaining between politicians
with constituencies, the NeOp becomes another rubber stamp, as wasteful and irrele
vant as the old Senate."
4.1.2 Assignment of Executive Responsibilities
4.1.2.1 National, Provincial and Local Executive Responsibilities
While the national Parliament haS" broad powers to set policy standards, the provinces
have extensive executive responsibilities. They are not only the principle agents for im
plementing provincial legislation, but also national legislation within the concurrent areas"
The administration of matters outside the functional areas listed in schedules 4 and 5 can
be delegated to a province through national legislation (section 125). Any other functions
fall under the responsibility of the national government. Municipalities are assigned to
administer the local government matters listed in part B of schedules 4 and 5, as well as
any matter delegated to them by national or provincial legislation (section 156). This sec
tion also stipulates that the national and provincial governments must assign to a munici
pality, by agreement and subject to any conditions, any of the functions listed in parts A
of schedules 4 and 5 if local provision would enhance efficiency.
In practice the national government is mainly responsible for economic services (finance,
trade and industry, labour), protection services (police, defence, justice, prisons), housing
and general administration. The responsibilities of provinces include primary and secon
dary education, health and welfare services, as well as provincial roads and local eco
nomic development. Municipalities provide essential basic services, such as electricity,
water and refuse removal. Even though there is a lack of complete data, available docu
mentation indicates that the bulk of local authority expenditure is undertaken by the four
52
Stellenbosch University https://scholar.sun.ac.za

metropolitan areas in Gauteng, greater Cape Town and Durban (Siebrits 1997: 36-40).
While the focus of local government expenditure remains on the provision of basic
services, overall expenditure reprioritisation has had a substantial impact on provincial
expenditure patterns. The interaction between general expenditure trends and provincial
expenditures is explored further in the following sections.
4.1.2.2 General Expenditure Trends
General government expenditure-has been subject to reprioritisation since the demo
cratic elections in 1994. These developments have been made more explicit with the in
troduction of the Medium Term Expenditure Framework (MTEF).73 An overview of
consolidated national and provincial expenditure during this decade reveals that defence
spending has been subject to drastic cuts, offsetting increases for policing and prisons.
The "icon of oppression" (Walker 1999: 8) during the apartheid years is projected to
consume only 5.2 per cent of budgeted expenditure at the beginning of the new millen
nium, down from 11.3 per cent at the beginning of this decade. Declining defence ex
penditure is reflected in the national budget, since defence is the executive responsibility
of the national government. Social expenditure - comprising education, health and wel
fare - will receive increasing shares of the budget. As provinces have administrative re
spunsibility in these areas, this tre'nd highlights the important role of provinces in social
development. The seeming dip in housing expenditure is misleading, as until 1997 the
poorer provinces were not able to fully disburse the money allocated by the national de
partment, which resulted in substantial rollovers of unspent funds. Expenditures on
smaller functions are projected to decline over the next financial years. The most dis
turbing trend is that debt-servicing costs are projected to take up 21.4 per cent of the
budget in the 2000-1 financial year, up from 12.5 per cent in 1990-1. The rising debt
servicing costs are a constraint on social spending and developmental expenditures. At
the same time, some expenditures cannot be reduced any further without threatening the
viability of certain departments. This reduces the possibility for further reprioritisation by
shifting funds between functions (Department of Finance (1999: 133):
73 The MTEF brought about a system of three-year rolling budgets, in line with identified priorities and commitments. Under the new system, the broad spending intentions and the underlying economic and policy framework are outlined annually in the "Medium Term Budget Policy Statement", which was published for the first time in December 1997 (Department of Finance 1997b and 1998c). Three-year estimates for each department and summaries by function are now included in the budget, and the policy priorities and objectives of government are outlined for the next three years (Walker 1999).
53
Stellenbosch University https://scholar.sun.ac.za

"Shifts in the distribution~of spending will be more moderate over the next few
years. Infrastructure and development programmes have gained considerable
momentum and spending trends now closely match budgeted allocations. The
emphasis in extending and improving service delivery will increasingly fallon
better organisation and management within departments and gains through im
proved efficiency and more effective delivery of services. In taking forward the
nation's economic and social development commitments, the emphasis is now on
improved service delivery within the broad structure of spending priorities ... "
Figure 2: Consolidated National and Provincial Expenditure Trends (1990-2000)
Q) .... :::I :t:
" c: Q) Co X
UJ
" $ ro :2 "0 rJ) c: o ()
25% ~----~----~----~----r-----r---~----~----~----~----~
20% +-----+-----+-----~~I~-----r----~----~----+--;ll.~----~ ..... ~----_r----~----+_----+__jr- :1:[.-+----==---1 15% +-----+_----+_----r
10% +-II_--+r-
5% ::.',
Gen
---+---1::;:;
Illi
Def Saf& Sec
t ~ .~:!. 1:1~~ ~ .!.:l-+------+------+-----_+_
~~1j~ t :::l·t-+----~--~n---I---
Iii il! I Edu Health Wei
Trans Hous
& Com Int
--
Other
.1990-1 12.0% 11 .3% 8.0% 19.1% 9.3% 7.7% 4.3% 5.4% 12.5% 10.8%
01995-6 9.3% 6.7% 8.7% 20.4% 9.2% 8.3% 1.0% 5.2% 16.5% 14.6%
002000-1 5.3% 5.2% 10.8% 22.1% 11.3% 8.9% 4.2% 3.8% 21.4% 5.8%
Functional Classification
Sources: Department of Finance (1998a: Table 3.11 and 1999: Table 5.8). Notes: Data for 1990-1 and 1995-6 is based on the Auditor-Generals reports for the national and provincial governments . Data for 2000-1 is based on medium term expenditure estimates. The following abbreviations are used: Gen = General, Def = Defence, Saf & Sec = Safety and Security, Edu = Education, Wel = Welfare, Hous = Housing, Trans & Com = Transport and Communications, Int = Interest.
54
Stellenbosch University https://scholar.sun.ac.za

4.1.2.3 Provincial Expenditure Trends
Provincial expenditure data reveals several trends.74 Most notably, budgeted provincial
expenditure has been subject to a 2.9 per cent real decrease between 1996-7 and 1999-0.
As the following sections will show, this is a result of decreasing shares transferred from
the national revenue pool, and der<;:reases in the collection of own revenue.
Table 11: Total Provincial Budgets 1996 Rands
1996-7 1999-0 % change
Eastern Cape 14208923 12939023 -8.9% Free State 5700379 5413871 -5.0% Gauteng 11982019 12765335 6.5% KwaZulu-Natal 15330797 15280652 -0.3% Mpumalanga 4769589 4869431 2.1% Northern Cape 1834298 1829724 -0.2% Northern Province 10052725 9734178 -3.2% North West 6906958 6383986 -7.6% Western Cape 8882160 8157878 -8.2% Total 79667848 77374078 -2.9% Source: Data provided by the Idasa: Budget Information Service. Note: The substantial increase in Gauten$. is a result of conditional grants for academic hospitals.
The share of social expenditures (on health, education and welfare) in provincial budgets
has risen steadily, and now makes up more than 80 per cent. According to an executive
agreement reached in the Budget Council75 provinces pledge to spend 85 per cent of
their budgets on social expenditures. Most provinces, however, have not reached this
standard. The introduction of provincial finance reserves in order to budget for contin
gencies squeezes the resources that are left over for exclusive provincial concerns. Over
all, little provincial expenditure is directed to areas where provinces have full control over
how money is spent. Differences in the composition of spending across provinces indi
cate varying needs. For instance, the share of the welfare budget is lowest in Gauteng, the
economic centre of the country, with a younger population than the rural provinces
where recipients of welfare grants are concentrated. Differences in the composition of
provincial spending may also arise from varying costs of providing a service, or differing
levels of ejficienf)' between or within provinces (Walker 1999: 11).
74 For independent microanalyses of provincial budgets, please refer to the annual overviews published by the Budget Information Service at Idasa. The following are the overviews of the 1998-9 provincial budgets:
. Hopley (1998), Makhanya (1998), Msimango (1998), Steyn (1998), Van der Merwe and Van Rensburg (1998), Van Zyl (1998b,c and d), Walker (1998). 75 This body is dealt with in the section on transfers and grants below.
55
Stellenbosch University https://scholar.sun.ac.za

Figure 3: Consolidated Provincial Expenditure Trends (1995-2001)
45% ~
40% ..-35%
30%
25% -----20% ~ .... ~ - -
15%
10%
5%
0% .---1995 1996 1997 1998 1999 2000 2001
-+- Education 38.7% 40.0% 40.6% 41.1% 41 .1% 41.2% 41.3%
--e-Health 20.8% 22.3% 23.5% 24.0% 24.2% 24.4% 24.3%
--.- Welfare 19.0% 17.4% 18.6% 19.5% 19.1% 18.8% 18.8%
-o-Other 21.3% 20.2% 17.4% 15.4% 13.8% 13.4% 13.5%
--*- Reserve 0.0% 0.0% 0.0% 0.0% 1.9% 2.0% 2.1%
Fiscal Year
Source: Calculations based on data from the Department of Finance (1999: Table 4.1).
Figure 4: Social Spending in 1999-0 Provincial Budgets
Q) (J c: .:; o ... a..
I I I I E:::;;::::<;;:·i@~";Mi::::::·:::::::::::::::';·::::·:.::::"::<;::;:::;'::;;;;:::::::
I I I I I;:::;:';:::;;:::::;::;:;:::;:;;:;:::::;;:::::;:;:::::;:::;::::::::;:::;::::::::;:::::;:::;:;:;;,:,:::
0% 10% 20% 30% 40% 50% 60% 70% 80% 90% 100%
EC FS G KZN M NC NP NW WC
mEducation 43.8% 40.9% 39.7% 38.2% 44.6% 39.9% 45.9% 41.6% 36.5%
o Health 18.5% 22.1% 29.5% 23.4% 17.8% 16.1% 16.7% 18.2% 22.7%
• Welfare 24.6% 18.3% 15.1% 20.2% 17.7% 26.7% 17.5% 17.8% 21.8%
Pro'.1ncial Expenditure
Source: Provincial budgets, compiled by the Idasa: Budget Information Service.
56
Stellenbosch University https://scholar.sun.ac.za

4.1.2.3.1 Mandates
In the social expenditure areas, ptovincial discretion is limited through national norms
and standards. In order for this system to work optimally, it is important that the national
sphere takes into account the fmancial and administrative ability of the provinces to im
plement national legislation. The Ncholo Report pointed out (Ministry for the Public
Service and Administration 1997: 14): "Many National departments create new policies
without considering how they are to be implemented. The unwritten expectation is that
the provinces will make the necessary financial and organisational arrangements. There
appears to be an assumption at national level that policy will automatically become activ
ity." Examples cited include free health care for nursing mothers and infants and the
provision of abortion on demand. One provincial health administrator comments that
these policies were implemented "overnight", and that a definite increase in the use of
health care services has been rec6tded as a result (Interview: Abdullah, 17 June 1998).
The exact impact of such legislation is, however, difficult to ascertain in most provinces
due to the lack of adequate and consistent patient records.
The recent Public Finance Management Act (1999), as amended, contains a section dealing
with "unfunded mandates" (section 35). The act prescribes that draft national legislation
that assigns any obligation to a provincial government must project the financial implica
tions for the province in an accompanying memorandum. This is the first time that un
funded mandates are given legal recognition (Wehner 1999b). The act does not require
that the respective national department cover the cost imposed on provincial depart
ments. Nonetheless, the provision should enhance the information available to the ~
NeOp for its deliberations. In practice much will depend on the detail and accuracy of
such costing. Other observers have noted that the NeOp has no access to independent
bodies which could review such costing, and mediate in case of conflicting opinions (In
terview: Donian, 8 April 1999). Unlike in some other countries (e.g. Gullo and Kelley
. 1998), Parliament in South Africa lacks research capacity in budgetary matters (Krafchik
and Wehner 1998b). Although provinces raised the issue, a review of financial mandates
contained in existing legislation is not foreseen by the act.76 The example of the health
sector indicates that this would be a valuable area for further research.
57
Stellenbosch University https://scholar.sun.ac.za
4.1.2.3.2 Personnel Expenditure
Apart from reprioritisation, increased social expenditure reflects rising personnel expen
diture across the provinces. Provinces employ about 60 per cent of all civil servants.
While personnel expenditure comprised 53 per cent of total provincial expenditure in
1995-6, budgeted expenditure for the 1999-0 financial year projects this share at almost
60 per cent. The ability of provinces to control their personnel expenditure, however, is
limited: First, provincial wages are subject to decisions in the Central Bargaining Cham
ber. Second, it is the obligation of the national government to finalise an affordable re
trenchment tool that would enable provinces to cut their number of civil servants.
Provinces have increasingly shown discontent with the delays in the formulation of a na
tional policy on retrenchments. The former Premier of the Free State, Ivy Matsepe
Casaburri, noted that the issue "is a big problem because we have to abide by national
policy and there is no national policy" (Business Dqy, 18 September 1998). Skills audits in
the provinces and national departments are hoped to ensure that service delivery will not
be affected by any retrenchments (Business Dqy, 10 February 1999). A process involving
voluntary severance packages proved costly and was characterised by a disproportion-r·
ately high number of much needed experienced personnel, with private sector prospects,
leaving the civil service (see also: MacGregor et aI1998).
A question mark has been over the number of excess civil servants. While in 1995 this
figure had been put at 55000 (Business Dqy, 2 October 1998), the number of redundant
public servants was estimated to total 35000 in May 1999 (Business Dqy, 13 May 1999).77
The then Director-General for the Public Service, Paseka Ncholo, reported that the
overall size of the public service had decreased by 10 per cent since 1994 due to the vol
untary severance packages scheme, natural attrition and resignations.
The example of the health sectorrillustrates the personnel problems of provinces. About
90 per cent of provincial budgets for primary and secondary education are taken up by
personnel expenditure (mainly on teachers' salaries). This leaves few resources to main-
76 The author observed the deliberations of the NCOP's Select Committee on Finance on the bill. 77 By 1999 audits had been completed in a number of provinces. These identified 8000 "supernumaries" in the Northern Province, 3000 in the North West, 22000 in the Eastern Cape, 12 in the Northern Cape and none in the Western Cape. In the case of the Eastern Cape, the filling of about 8000 vacancies could reduce the total number to 14000.
58
Stellenbosch University https://scholar.sun.ac.za

tain schools, pay telephone and etectricity bills, or purchase learning materials (Sundqy
Independent, 6 June 1998). The national Department of Education decided that "there
were enough teachers but they were in the wrong places" (Van Niekerk and Ludman
1999: 64). The department prescribed student-teacher ratios (40-1 for primary schools
and 35-1 for high schools) and in 1996 announced a "rightsizing" strategy. This required
each province to compile a list of "excess" teachers and offer them either retrenchment
packages or redeployment to other schools where there was a shortage. The department
prescribed that hiring was to draw on this list of excess teachers. One of the many set
backs occurred when Grove Primary School in Cape Town successfully took the minister
to court in 1997 over the requirement to hire teachers from the list. By the end of 1997
the department abandoned the exercise and announced that provinces would from now
on work out their own ratios. A new redeployment process entailed provincial education
departments dividing their personnel expenditure budgets by the average teacher salary
to determine the number of teachers they could afford (Business DC!)', 18 November
1998). Redeployment has since proceeded at various speeds across the provinces.78
After several years of increasing shares of personnel expenditure in the provinces, a sta
bilisation at just below 60 per cent of consolidated provincial expenditure has been pre
dicted for the following years (Department of Finance 1999: Table 4.1). To halt the ex
isting trend, however, provinces require mechanisms to control their wage bills. An ef
fective retrenchment tool may provide such action space, as may decentralised wage bar
gaining structures. Without empo.wering provinces to control their personnel expenditure
the projected stabilisation of the wage bill may tum out to be over-optimistic.
4.1.2.3.3 Capital Expenditure
As a direct result of the need to finance rising personnel expenditure, the average budg
eted capital expenditure share of provincial budgets has decreased by almost half since
1996. Decreasing capital expenditure, especially in health and education, represents a
threat to strategies that aim to extend services to communities in historically disadvan
taged areas and bring about a more equitable access to services (Interview: Abdullah, 17
78 In KwaZulu-NataI, for example, the reacher and student numbers changed as "ghost" teachers and learners were discovered. Different interpretations of the process by department officials and schools also led to problems. Finally, it was detected late in the process that the provincial education department had
59
Stellenbosch University https://scholar.sun.ac.za

June 1998). Thus, as Simkins (1997) remarks, the control of provincial service numbers
and wage levels is central to ensuring more rapid growth in delivery.
Table 12: Budgeted Provincial Capital and Personnel Expenditure Per cent of total provinrial budget
Capital Expenditure Personnel Expenditure 1996-7 1997-8 1998-9 1999-0 1996-7 1997-8 1998-9 1999-0
BC 7.1% 6.0% 2.8% 3.2% 52.3% 50.7% 58.5% 57.9% FS 8.2% 9.6% 5.7% 1.9% 53.2% 53.2% 58.2% 64.3% G 8.4% 7.5% 7.3% 7.6% 52.3% 50.7% 60.0% 58.5% KZN 10.9% 7.2% 2.5% 5.9% 50.1% 54.9% 58.8% 57.7% M 13.4% 8.0% 4.9% 4.9% 47.2% 54.0% 60.0% 60.0% NC 8.0% 4.9% 5.5% 3.6% 45.4% 46.0% 49.8% 49.2% NP 7.9% 8.7% 4.4% 3.1% 55.6% 60.0% 65.4% 65.2% NW 9.1% 10.7% 6.0% 5.2% 43.3% 52.6% 58.2% 60.6% WC 5.0% 5.0% 4.5% 3.4% 51.6% 52.7% 55.1% 56.3% Average 8.7% 7.5% 4.9% 4.7% 50.1% 52.8% 57.4% 58.3% Source: Provincial budgets. Note: Data provided by the Idasa: Budget Information Service.
4.1.3 Monitoring and Intervention
4.1.3.1 Ensuring the Fulfilment of an Executive Obligation
The Constitution (section 125) stipulates that a province has executive authority only to
the extent that it has the administrative capacity to assume effective responsibility. The
national government is required to assist provinces to develop the necessary capacity.
Any dispute concerning the administrative capacity must be referred to the NCOP for
resolution within 30 days. When a province cannot or does not fulfil an executive obliga
tion, the national executive may intervene "by taking any appropriate steps to ensure ful
filment of that obligation" (section 100). This may include issuing a directive, or assum
ing direct responsibility for the re).evant obligation. The latter is only allowed to the ex
tent that it is necessary to maintain or enforce national minimum standards, to maintain
economic unity or national security, or to prevent unreasonable action by a province. In
the case of direct intervention the NCOP must be notified and approve any such action.
The council has the duty to review the intervention regularly and advise the national ex
ecutive accordingly.
used a computer model which erroneously allocated extra teachers to primary schools, instead of secondary and technical schools (Business D~, 13 April 1999).
60
Stellenbosch University https://scholar.sun.ac.za
The Constitution also allows a provincial executive to intervene in local government af
fairs should this be necessary to ensure the fulfilment of an executive obligation (section
139). The NCOP is required to approve and monitor such interventions, and to make
recommendations to the relevant provincial executive. National legislation that may
regulate the process established by these sections is still outstanding. The Department of
Constitutional Development has been conducting research into this matter (Department
of Constitutional Development 1999: 7).
4.1.3.2 Intervention in Practice-
So far, only the national Department of Finance has utilised the provisions of section
100. When the Eastern Cape and KwaZulu-Natal recorded considerable budget overruns
in the 1997-8 financial year, a R 1.5 billion "life-line" in form of an advance was granted
under this section, which allowed conditions to be attached (Business Day, 2 April 1998,
Department of Finance 1999: 94).79 These conditions included a provincial undertaking
to remain within budget, providing a detailed spending plan and supplying monthly prog
ress reports. Early in 1999 the national Department of Finance invoked section 100 for a
third time when it emerged that the Free State expected to run a deficit of about R 170
million for the 1998-9 financial y~ar.
Section 139 enabled the Eastern Cape provincial government to take over the municipal
ity of Butterworth in March 1998 by dispatching administrators to take charge of local
authority functions (Business Day, 21 April 1998). Lessons still have to be drawn from this
precedent. For instance, the process revealed the need for formalised procedures to
regulate the consideration and approval of intervention by the NCOP (Franks 1998). The
previous Chairperson of the NCOP, Patrick Lekota, subsequently announced that a new
unit is to be set up within the council to oversee interventions, and to ensure their effec
tiveness (Business Day, 9 April 1999).80 Another question is whether intervention can en
sure delivery. In the case of Butterworth, the municipality continues to be plagued by
leadership battles similar to thosei:hat led to intervention (Cullinan 1999: 7-9). Mean-
79 Wh.i.Ie provincial expenditure overruns in the 1997-8 financial year occurred not only in these two provinces, KwaZulu-Natal and the Eastern Cape were the only ones that applied for additional funds from the national government. 80 The likelihood of increased intervention in local government affairs due to the executive failure of a number of authorities was confirmed in interviews conducted by the author with the Heath Special Investigating Unit (Interview: Rich and Visagie, 29 March 1999) and the FFC (Interview: Donian, 8 April 1999).
61
Stellenbosch University https://scholar.sun.ac.za
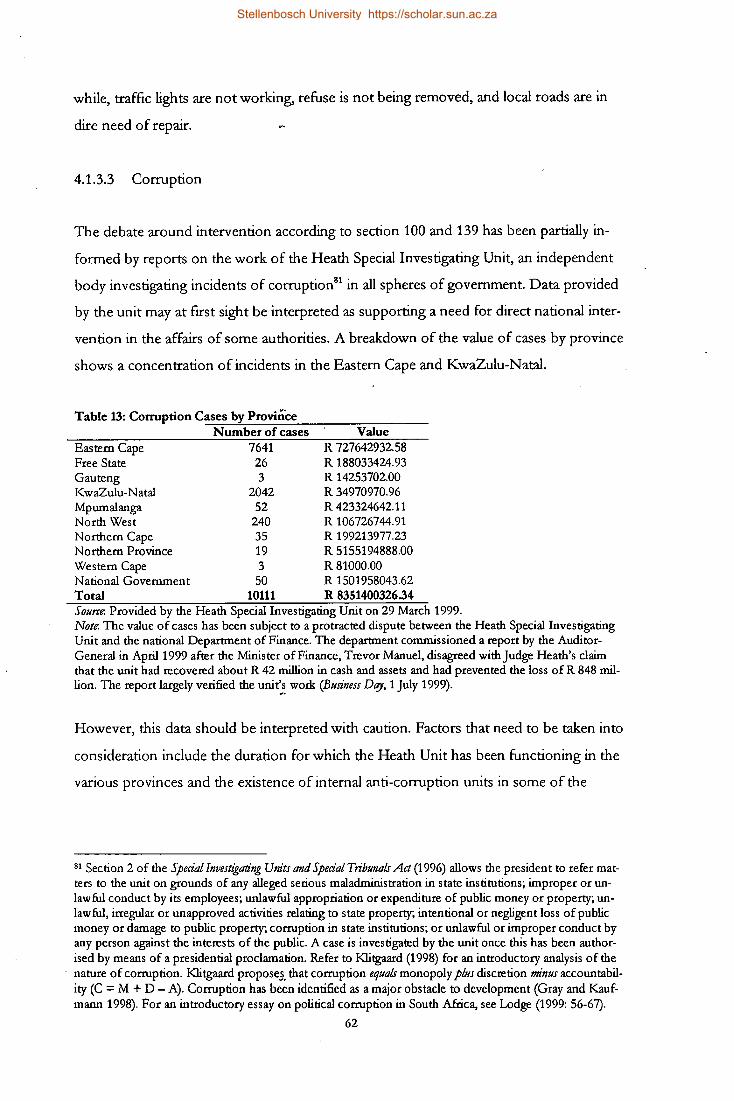
while, traffic lights are not working, refuse is not being removed, and local roads are in
dire need of repair.
4.1.3.3 Corruption
The debate around intervention according to section 100 and 139 has been partially in
formed by reports on the work of the Heath Special Investigating Unit, an independent
body investigating incidents of corruptionS1 in all spheres of government. Data provided
by the unit may at first sight be interpreted as supporting a need for direct national inter
vention in the affairs of some authorities. A breakdown of the value of cases by province
shows a concentration of incidents in the Eastern Cape and KwaZulu-Natal.
Table 13: Corruption Cases by Province ----~-----------------------
Eastern Cape Free State Gauteng KwaZulu-Natai Mpwnalanga North West Northern Cape Northern Province Western Cape National Government Total
Number of cases 7641
26 3
2042 52
240 35 19 3
50 10111
Value R 727642932.58 R 188033424.93 R 14253702.00 R 34970970.96 R 423324642.11 R 106726744.91 R 199213977.23 R 5155194888.00 R 81000.00 R 1501958043.62 R 8351400326.34
SOIlrw: Provided by the Heath Special Investigating Unit on 29 March 1999. Note: The value of cases has been subject to a protracted dispute between the Heath Special Investigating Unit and the national Department of Finance. The department commissioned a report by the AuditorGeneral in April 1999 after the Minister of Finance, Trevor Manuel, disagreed with Judge Heath's claim that the unit had recovered about R 42 million in cash and assets and had prevented the loss of R 848 million. The report largely verified the unit:~ work (Business Df!J, 1 July 1999).
However, this data should be interpreted with caution. Factors that need to be taken into
consideration include the duration for which the Heath Unit has been functioning in the
various provinces and the existence of internal anti-corruption units in some of the
81 Section 2 of the Special Investigating Um'ts and Special Tribunals Aa (1996) allows the president to refer matters to the unit on grounds of any alleged serious maladministration in state institutions; improper or unlawful conduct by its employees; unlawful appropriation or expenditure of public money or property; unlawful, irregular or unapproved activities relating to state property; intentional or negligent loss of public money or damage to public property; corruption in state institutions; or unlawful or improper conduct by any person against the interests of the public. A case is investigated by the unit once this has been authorised by means of a presidential proclamation. Refer to Klitgaard (1998) for an introductory analysis of the nature of corruption. Klitgaard propose§. that corruption equals monopoly plus discretion minus accountability (C = M + D - A). Corruption has been identified as a major obstacle to development (Gray and Kaufmann 1998). For an introductory essay on political corruption in South Africa, see Lodge (1999: 56-67).
62
Stellenbosch University https://scholar.sun.ac.za
provinces.82 Judge Willem Heath has also noted the varying quality of the working rela
tionships his unit has been able to establish with the provinces. For instance, he criticised
the Western Cape for being "extremely slow" in referring corruption cases to his unit
(Business Dqy, 12 January 1999). Indicating a will to uncover corruption, the North West
province has installed a "Hotline on Fraud and Corruption", situated in the office of the
Premier, Popo Molefe (S owetan, cYMay 1998). These examples illustrate the different ways
with which corruption is dealt with by individual provincial governments.
Due to such factors, the Heath Unit itself has rejected suggestions that the breakdown of
cases is a reflection of the actual incidence of corruption. Instead, the unit points to the
fact that its investigating teams for the different provinces are roughly of equal size, indi
cating that investigators consider corruption to be an omnipresent problem. When asked
whether the unit considered corruption to be a greater problem at subnational than at
national level, the representatives noted the link between corruption and procurement
procedures. As procurement procedures are multiplied at subnationallevel, there are also
more opportunities for corruption (Interview: Rich and Visagie, 29 March 1999).
In other provinces, such as Mpumalanga, the existence of provincial press agencies may
contribute to a disproportionately high media coverage of corruption. Thus, the descrip
tion as "Mamparalanga,,83 (Mail & Guardian, 16 October 1998), in recognition of a ~uc
cession of scandals hitting the province, may be misleading if construed to imply that
corruption is a more serious problem here than elsewhere.
Lodge (1999: 59) further suggests that by the 1980s corruption was wide-spread in the
central government as well as the homeland administrations, and thus cannot be de
scribed as a new phenomenon: "From 1948 ethnic favouritism characterised all civil
service recruitment and promotio~n. Government loans and resources were equally in
voked by ethic and political considerations."
82 For instance, the high number of corruption cases in the Eastern Cape reflect the fact that the unit was active in this province since 1995, before its mandate was extended to the national level. Many of the cases attributed to the Eastern Cape, therefore, were carried over from the unit's previous mandate. 83 According to the Oxford Dictionary 0/ South African English, a "mampara" or "mompara" describes "a fool, greenhorn or incompetent also a mode of address (abusive)".
63
Stellenbosch University https://scholar.sun.ac.za

4.1.3.4 Capacity
Some commentators have expressed concerns about the capacity of some provinces to
address basic needs (e.g. Rapoo 1995: 9-11, Walker and Van ZyI1999).84
Table 14: Provincial Profiles According to the 1996 Census Popula- % of total % living in % without %unem % of house- % of house-
tion (thou- population urban ar- schooling ployed holds with holds using sands) eas tap inside wood for
dwelling cooking
EC 6303 15.5% 36.6% 20.9% 48.5% 24.7% 38.0% FS 2634 6.5% ~68.6% 16.1% 30.0% 40.6% 9.3% G 7348 18.1% 97.0% 9.5% 28.2% 67.7% 0.9% KZN 8417 20.7% 43.1% 22.9% 39.1% 39.8% 29.7% M 2801 6.9% 39.1% 29.4% 32.9% 37.3% 26.0% NC 840 2.1% 70.1% 21.7% 28.5% 50.0% 18.5% NP 4929 12.1% 11.0% 36.9% 46.0% 17.8% 63.6% NW 3355 8.3% 34.9% 22.7% 37.9% 30.6% 20.7% WC 3957 9.7% 88.9% 6.7% 17.9% 76.4% 4.5% SA 40584 100% 53.7% 19.3% 33.9% 44.7% 23.0% Source: Statistics South Africa (1998).
1994 saw the amalgamation of the various administrations inherited form the former
South African government, self-governing territories and the "independent" homelands.
As employers of roughly 60 per cent of civil servants, the newly created provinces bore
the brunt of this challenge. The former homeland structures are unevenly distributed
across the nine provinces, which has contributed to the polarisation of provincial admin
istrative abilities.85 Wehner (1998b: 23) comments: "The absurdity of such demarcation
lies in the fact that those provinces which are historically advantaged by apartheid's sys
tem of geographical resource allocation, especially the Western Cape and Gauteng, were
spared large-scale incorporation of ailing homelands with a surplus of unskilled and often
incompetent civil servants." As a result, underdeveloped and rural provinces not only
display the greatest needs, but are also expected to operate within disproportionate ca
pacity constraints due to their inherited personnel and administrative infrastructure. The
Premier of the Northern Province, Ngoako Ramatlhodi (1998) summarises the chal
lenges faced by his province:
84 Stuart (1997) notes that available analYtical tools to measure public sector efficiency in South Africa cannot be utilised yet, as the necessary public sector output data is not yet being generated. It is thus difficult to objectively assess the efficiency of certain departments and governments. 85 The former Transkei and Ciskei are now part of the Eastern Cape; KwaZulu part of KwaZulu-Natal; Qwa Qwa and a part of Bophuthatswana incorporated in the Free State; Venda, Gazankulu and Lebowa part of the Northern Province; four blocs of Bophuthatswana incorporated in North West; KwaNdebele part of Gauteng; and Kangwane and a small section of Lebowa included in Mpumalanga (Welsh 1994).
64
Stellenbosch University https://scholar.sun.ac.za

"We inherited three homelands and bits and pieces of a so-called "white prov
ince", which for all practi£al purposes could have been situated on four different
planets. We have to merge four systems of bookkeeping, four sets of personnel
records and four different standard operating procedures, and our critics expect
of us to undo five decades of bad administration and disregard for the needs of
the majority of the population within four years."
4.1.3.5 Intervention and Co-operative Government
Whether increased intervention or a determined exercise in capacity building is the an
swer to these challenges is open to debate. Comparative evidence suggests that interven
tion powers are not unique to South Africa, but that their use has often been accompa
nied by controversy.86 However, these powers must be considered in conjunction with
other constitutional provisions. Most notably, chapter 3 binds all spheres of government
to the "principles of co-operative government and intergovernmental relations" (section
41). Under these provisions, all spheres of government and their organs must: preserve
the peace, national unity and the indivisibility of the republic; respect the constitutional
status, institutions, powers and functions of the other spheres; not usurp powers or
functions; not encroach on the geographical, functional or institutional integrity of gov
ernment in another sphere; and co-operate with one another. They are even obliged to
avoid legal proceedings against one another by exhausting all other possible avenues of
conflict resolution before approaching a court. If a court is not satisfied that this re
quirement was fulfilled, it may refer a dispute back to the organs of state involved.
Placed early in the text, before the allocation of powers and functions to the different
spheres is outlined, the provisions of chapter 3 represent a set of overarching guiding
principles for the conduct of governmental activities. The Department of Constitutional
Developmen t (1999: 10) interprets these provisions "to place an obligation on the three
86 The Constitution of the Federal Republic ofBra~t (1988) contains an entire chapter dealing with intervention (chapter Vl). Article 355 of the Constitution of India (1950) obliges the central government to protect the states against external aggression and "internal disturbance". The following article 356 outlines provisions in case of failure of the "constitutional machinery" in the states. The central government view has been that the Constitution allows it to act "according to its own perception of the situation", as noted in a recent speech by the Union Home Minister, L. K Advani (Hindu, 23 January 1999). As intervention is a common but highly controversial feature in India, the states are in favour of incorporating more detailed advice as to
65
Stellenbosch University https://scholar.sun.ac.za

spheres of government to put the national interest first and to co-operate with each
other, to support each other and to avoid destructive competition over the political and
economic resources of the country".87 This notion indicates that the Constitution envis
ages a collaborative partnership between the spheres, which limits the possibility of in
tervention in a manner that would not be conducive to restoring the capacity of authority
in question to effectively comply with its executive obligations
4.1.4 The Controverry Surrounding the Assignment 0/ the We/are Function
The We/are Laws Amendment Act (1997) provides the national Minister of Welfare with
the exclusive power to set standards for welfare grants. As a result, provinces act as
agents of the central government. While they have no real jurisdiction over the function,
welfare grants are reflected in provincial budgets. The provinces spend more that 95 per
cent of the total national and provincial expenditure on welfare, and more than 91 per
cent of provincial welfare expenditure is used to provide social security (Fitschen 1999).
4.1.4.1 Administrative Problems ....--
In January 1998 the Eastern Cape failed to pay social security grants to 632000 pension
ers, leaving them and their dependants without money to buy food. The national gov
ernment "rescued" the province with an advance of R 801 million, to which stringent
conditions were attached. It has been convincingly argued that the root cause for the
Eastern Cape welfare crisis was that the allocation to the province was not sufficient to
allow it to meet growing social security commitments88 - a nationally determined entitle
ment (Van Zyl 1998a). Nonetheless, the experience of the "Eastern Cape pensions crisis"
has given rise to a debate around the assignment of the welfare function.
how the centre should determine when the government of a state could not function in accordance with the Constitution. Also refer to Wehner (1999a: 9-10). 87 The department has been working on a White Paper on Intergovernmental Relations for the past two years in order to flesh out the practical meaning of chapter 3. This policy framework will have to avoid overly rigid requirements that may become a long-term straigh~acket, but should create conditions that encourage and facilitate mutual trust and co-operation (Watts 1997: 28). 88 For the previous fiscal year, when the welfare budget was still administered by the national department, the provincial department had submitted an estimate of R 3,2 billion based on the number of beneficiaries (630 000) at that stage. However, the department had received only R 2,2 billion, less than in the preceding year. The 1996-7 under-funding resulted in overspending by the national welfare department and not by
.. the provincial government. The increase of 1.7 per cent in provincial spending on welfare in the 1997-8
66
Stellenbosch University https://scholar.sun.ac.za
A related problem has hindered the effective planning and control of the function, as
"ghost" beneficiaries have inflated provincial welfare expenditure. The "ghosts" are typi
cally deceased pensioners whose relatives continue to draw their welfare benefits.89 At
one stage, the then Minister of Welfare, Geraldine Fraser-Moleketi, estimated that about
20 per cent of the three million welfare beneficiaries were "associated with irregularities"
(Business Dqy, 10 February 1998). Data irregularities are increasingly being detected by
checking the names of beneficiaries against the population register of the Department of
Home Affairs. Some provinces have attempted to reregister all pensioners and benefici
aries to eliminate fraud and irregularities.9o
4.1.4.2 Possible Solutions
The Public Service Commission released its "Report on an Investigation into the Ren
dering of Social Security" in February 1998. The commission endorsed the status quo: a
system in which the national department is responsible for developing norms and stan
dards, while the provincial departments would be responsible for day-to-day administra
tion. However, the report left open where the responsibility for budgeting should be lo
cated, with the national or provincial departments (Barberton 1998).
The former Minister for Provincial Affairs and Constitutional Development, Valli
Moosa, favoured the centralisation of the welfare function. Welfare grants would be re
flected in the national budget (BUsiness Dqy, 9 February 1999).
To the contrary, the FFC has argued that centralisation is only one of the available op
tions. The commission (FFC 1998b: 15) recommends that provinces be responsible for
all aspects of social security grants, which would result in the possibility of different rates
or eligibility rules, in order to ensure fiscal autonomy and accountability.
provincial budget, an adjustment made by the province after welfare became its responsibility, was not sufficient to cover the existing gap between resource allocation and actual expenditure need. 89 More than 70000 of these were eliminated from the social security grant system during the 1998-9 financial year alone, resulting in savings of close to R 282 million (Business Dqy, 19 February 1999). Cases of teenage "pensioners" have also been reported (Mail & Guardian, 19 February 1999). Other irregularities include the duplication of names and names with multiple identity numbers. 90 The Western Cape, for example, revived such a process in October 1998 after a similar initiative two
. years earlier had not been completed (Cape Argus, 12 October 1998). In the Northern Province, a number of lawsuits forced the provincial department to abandon an attempt to reregister recipients of pensions and disability grants (Mail & Guardian, 15 January 1999).
67
Stellenbosch University https://scholar.sun.ac.za

A middle path has also been suggested (Barberton 1998). This would see the national
department developing a welfare formula to determine each province's share of the total
welfare budget according to cleaned-up beneficiary data. The resources would be taken
out of the pool of nationally collected revenue before revenue-sharing, a practice referred ~
to as "top-slicing".9t Provinces would then have access to the savings from efficiency
gains, or pay for poor performance.
It would seem that the current disjuncture between policy-making and financial respon
sibility has caused inefficiency. Any changes should ensure that budgeted amounts are
fully aligned with the expenditure requirements for welfare grants in each province, on
the basis of cleaned-up beneficiary data.
4.2 Revenue Assignment
4.2.1 National Revenue
The main sources of tax revenue in 1998-9 were personal income tax (42 per cent of to
tal), VAT (24 per cent) and company92 tax (11 per cent) (Department of Finance 1999:
Table 6.15). As tax assignment in South Africa remains centralised, these constitute the
main contributions to the national revenue pool.
4.2.2 Provincial Revenue
Although the Constitution allows provincial legislatures to impose taxes, levies and du
ties, this does not apply to income tax, VAT, general sales tax, rates on property or cus
toms duties (section 228). The Constitution requires that provincial taxation powers be
regulated in terms of national legislation, taking into account any recommendations by
the FFC. This legislation is still outstanding.
The collection of provincial revenue, mainly derived from fees, has declined in recent
years, from 5.6 per cent of total provincial revenue in 1995-6 to 3.8 per cent in 1999-0.
91 This practice will be further discussed in the discussion of the vertical division of revenue.
68
Stellenbosch University https://scholar.sun.ac.za

One reason for this decline is a lower collection rate for user fees in hospitals due to
poor accounting and billing systems. Hospitals have limited incentive to improve the
collection of user fees, as these funds accrue to the province rather than the contributing
hospital. The national Department of Health and the Budget Council have initiated steps
to improve provincial revenue collection (Department of Finance 1999: 93). Provincial
initiatives have also been announced. For example, the KwaZulu-Natal Member of Ex
ecutive Council (MEC)93 for Finance, Peter Miller, has appointed a team to bolster reve
nue collection in the province .and outlined plans to provide an incentive for agencies to
collect more revenue than was budgeted, by allowing them to keep any excess revenue
(Business Dqy, 19 March 1999).
One possibility for provinces to increase their own revenue is to find new revenue bases.
Despite the fact that the constitutionally required national framework legislation is still
outstanding, two provinces have recently introduced new taxes. These initiatives may in
dicate frustration with the slow process of implementing the provincial revenue-raising
powers contained in the Constitution. The Gauteng MEC for Finance, Jabu Moleketi,
caused some controversy with the announcement, in his 1999-0 budget speech, of the
introduction of a 5 per cent bed levy in the province in October 1999. The levy will be
based on bed nights sold in the p.rovince (Business Dqy, 26 February 1999). Similarly, the
North West MEC for Finance, Martin Kuscus, announced the introduction of a 5 per
cent levy on the gross income of bookmakers and totalisators (Business Dqy, 25 February
1999). The possibility for additional revenue from gambling activities, however, has been
hampered by irregularities in provincial casino licensing processes.94
The Constitution also allows for flat-rate provincial surcharges on the base of any tax,
levy or duty imposed by national legislation, other than corporate income tax, VAT, rates
on property or customs duties. This leaves the possibility of a provincial surcharge on the
national personal income tax base. Necessary national enabling legislation is still out-
92 Gold mines and other mines are taxed separately. While tax on gold and other mines constituted 8 per cent of tax revenue in 1984-5, this share shrank to less than one per cent by 1998-9. This is due to depressed commoctity markets, as well as tax allowances in the system (Department of Finance 1999: 169). 93 MECs are the provincial equivalents of ministers in the national cabinet. 94 Corruption allegations against senior provincial politicians and relating to the licensing process were muted, amongst others, in Gauteng (Financial Mail, 19 February 1999) and the Western Cape (Mail & Guardian, 12 March 1999). As a result, it has been speculated that the national Ministry for Trade and Industry has plans to exercise more central control over gambling due to "the perception that provincial gaming boards were too susceptible to political influence" (Busifzess Dt!J, 19 May 1999).
69
Stellenbosch University https://scholar.sun.ac.za
standing. In 1998 the Katz Commission95 questioned the capacity of the South African
Revenue Service (SARS) to administer a system of provi~cial surcharges on personal in
come tax. Instead, it favoured a provincial surcharge on the national fuel levy. The FFC
(1998: 25-36), on the other hand, has been recommending the implementation of a sur
charge on personal income tax to promote democratic and fiscally accountable govern
ment in the provinces. The provincial surcharge would be "piggy-backed" on the na
tional personal income tax. The FFC suggests the creation of tax room96 by the national
government in order to ensure that there is no increase in the overall tax burden, to be
phased in over a period of six years, up to seven percentage points of the personal in
come tax base. Such a system would increase provincial own revenue while reducing the
envelope of intergovernmental transfers and grants. Thus, there would be no decrease of
revenue accruing to the national ~overnment. Contrary to the Katz Commission, the
FFC was confident that sufficient collection capacity exists at the centrallevel97 to suc
cessfully implement a surcharge. The introduction of the surcharge would reduce the ex
isting imbalance between provincial expenditure and revenue assignment.
4.2.3 Local Revenue
The Constitution allows municipalities to levy rates on property and surcharges on fees
for services (section 229). Service charges are the main sources of operating income for
local governments, followed by property rates. Most authorities buy goods and services
in bulk from public entities or private companies and derive income from reselling these
goods and services to households-: The Constitution further allows that, if authorised by
national legislation, a municipality may impose other taxes, levies and duties that may be
appropriate. This possibility is constrained by the prohibition of a local income tax, VAT,
general sales tax or customs duty. However, the "establishment levy" of the former re
gional services councils, now a source of revenue for metropolitan and district councils,
is in essence and despite its name a general sales tax based on the turnover (gross income
generated by sales) of business enterprises. The constitutionality of this tax has yet to be
tested (Gildenhuys 1997: 89).
95 The official name of the commission is the "Commission of Inquiry into certain Aspects of the Tax Structure of South Africa". 96 Creating tax room defines the process by which the national government reduces its share of a tax in order to make it available to subnational jurisdictions in the form of own revenues. It is an attempt to prevent an increase in the overall tax burden while allowing subnational governments to increase own revenues. 97 The FFC envisages the centralised collection of revenue derived from a provincial surcharge.
70
Stellenbosch University https://scholar.sun.ac.za

Currently about 95 per cent of budgeted local operating expenditure is covered by own
revenue. This average ,figure, which includes the metropolitan spending centres, hides
enonnous discrepancies. Many small rural councils have no viable tax base, for instance
due to the absence of property tax revenue. (Wehner 1998a: 6). The Katz Commission
recommended framework legislation to enable local governments to impose property tax
in a coherent fashion, wherever they may be situated (Business Dqy, 30 November 1998).
A Municipal Properry Rating Bill is expected to be tabled in the near future.
An issue of continuous concern has been the revenue collection ability at local level. The
"Masakhane" campaign was launched by President Nelson Mandela in 1995 with the
goal of improving payment for services.98 To monitor payment levels, arrears and the
effectiveness of credit control (collection) efforts on a continuous basis the Department
of Constitutional Development launched "Project Viability" in the same year.99 Despite
these initiatives, local government was owed R 12 billion by March 1999, a figure grow
ing by between R 500 million an~.R 1 billion a month (Business Dqy, 18 March 1999).100
Redemarcation efforts have been initiated in line with the policy framework for local
government (Ministry for Provincial Affairs and Constitutional Development 1997 and
1998). It is expected that the number of municipalities will be reduced substantially. This
may even out disparities between the revenue bases of local authorities.lOl The drive to
wards the creation of "megacities" in metropolitan areas, by unifying separate substruc
tures into one central administration, is infonned by such arguments.l02 The evening out
of revenue bases, however, cannot address the problem of non-payment.
98 By the end of apartheid, most municipalities in black areas were ungovernable and bankrupt. Since they were regarded as illegitimate structures by the people under their jurisdiction, a widespread boycott of payments for services prevailed: "While local authorities are now legitimate, they have to reverse the antagonistic rules engraved by decades of struggle" (Wehner 1998a: 4). 99 This information is derived from questionnaires that are sent out to the chief executive officers of municipalities. In 1997 responses were made compulsory. Nonetheless, there are still non-responding municipalities, most of them rural councils with limited capacity to respond to the questionnaires. 100 Gauteng topped the list of debtors with R 6 billion, followed by the Western Cape, KwaZulu-Natal, the Eastern Cape and the Northern Province, with R 1.9 billion, 1.1 billion, 1 billion and 109 million respectively 101 The existing local boundaries were in many instances the outcome of a highly politicised demarcation process. Cameron (1996), in his analysis of the Western Cape metropolitan area substructures, highlights how the current demarcation was driven by electoral concerns rather than developmental considerations. 102 Some commentators have argued in favour of maintaining a two-tier structure for urban areas (Cape Metropolitan Council et af 1997, Ahmad 1996).
71
Stellenbosch University https://scholar.sun.ac.za

4.3 Intergovernmental Transfers and Grants
Because the assignment of revenue sources remains centralised, the Constitution estab
lishes an elaborate system of intergovernmental transfers and grants. Local government
and each province are entitled to a share of revenue raised nationally to enable them to
provide basic services and perform their functions (section 227). They may also receive
grants from the national government, either conditionally or unconditionally. The Con
stitution prohibits the deduction of additional revenue raised by provinces or municipali
ties from their share. Equally, there is no obligation on the national government to com
pensate provinces or municipalities that do not fully utilise their revenue bases.
4.3.1 The Concept qfEquitable Shares
Central to the South African revenue-sharing regime is the "equitable share" concept es
tablished in the Constitution (section 214). The Constitution requires that national legis
lation must determine the equitable division of revenue raised nationally among the na
tional, provincial and local spheres of government. Such legislation must also determine
each province's equitable share of the provincial share of that revenue; any other alloca
tions to provinces, local governm!nt or municipalities from the national government's
share of that revenue; and any conditions on which those allocations may be made. Sec
tion 214 goes further in that it demands that this legislation must take into account: the
national interest; provisions for the national debt and other national obligations; the ob
jective needs and interests of the national government; the need to ensure that subna
tional governments are able to provide basic services and perform their functions; the
fiscal capacity and efficiency of subnational governments; their developmental and other
needs; economic disparities within and among the provinces; obligations of sub national
governments in terms of national legislation; the desirability of stable and predictable al
locations of revenue shares; the need for flexibility in responding to emergencies or other
temporary needs, and other factors based on similar objective criteria. The Constitution
requires that this legislation may only be enacted after the nine provincial governments,
organised local government and the FFC have been consulted. Any recommendations by
the FFC have to be considered.
72
Stellenbosch University https://scholar.sun.ac.za

4.3.1.1 The Role of the Financial and Fiscal Commission
These provisions envisage an im~ortant role for the FFc03, which reflects a desire to
depoliticise the revenue-sharing process (Mokgoro 1994, Dollery 1998). The Constitution
establishes the FFC to make recommendations envisaged in the Constitution or national
legislation to Parliament, provincial legislatures and any other authorities determined by
national legislation (section 220). The Commission is independent and subject only to the
Constitution and the law, and must be impartial. The commissioners are appointed by
the President, and include a chairperson and a deputy chairperson104 who are full-time
members, nine persons nominated by the provinces, two persons nominated by organ
ised local government and nine other persons (section 221). The FFC must report regu
larly to Parliament and the provincial legislatures (section 222). The Financial and Fiscal
Commission Act (1997) supplements these provisions. It regulates the affairs and day-to
day running of the commission. Amongst others, the act (section 27) guarantees the FFC
free access, upon request, to any information it requires for the performance of its func
tions and which is available to an organ of state or related institutions.
In some instances, the Department of Finance (e.g. 1998b) has criticised the commis
sions "fairly high level of abstraction", and has tended to describe its own approach as
characterised "by a keener concern for the practical implications". It is true that the
FFC's documents are not easily accessible to the broader public, which has been subject
to criticism (e.g. Wehner 1997c). However, the theoretical grounding of the commission
can be attributed to its concern with developing impartial standards.
4.3.1.2 The Role of the National Council of Provinces
The division of revenue between and within the spheres is dealt with annually in the Divi
sion of Revenue Bill This bill is classified as a bill affecting the provinces subject to section
76 of the Constitution, which reserves a potentially important role for the NCOP
(Murray 1998). However, in practice, the role of the NCOP in the budgetary process has
been limited. A lack of research capacity, limited time, and insufficient access to expen
diture information constrain its ability to engage with the budget (Krafchik and Wehner
1998a and 1998b). Other observers have noted that the Division of Revenue Bill is tabled
103 The Australian Commonwealth Grants Commission (Craig 1997: 184-185) and the Indian Finance Commissions (Hemming et 0/1997: 531-532) fulfil similar functions.
73
Stellenbosch University https://scholar.sun.ac.za
too late in the process to afford a proactive role to the council, as it has by then been
subject to extensive executive negotiations (Ajam 1998).
4.3.1.3 The Role of the Budget Council
Instead, the Budget Council has emerged as perhaps the major new player in the provin
cial budget process (Ajam 1997) .1~S This body is not set up in terms of the Constitution,
but was formalised with the Intergovernmental Fiscal Relations Aa (1997). The Budget Coun
cil meets regularly throughout the year to discuss provincial financial matters. It brings
together the Minister of Finance, who chairs the council, as well as the nine provincial
MECs for Finance. The same act also establishes the Budget Forum, which consists of
the Minister of Finance, the nine MECs for Finance, five representatives from the na
tionallocal government body, as well as one representative nominated by each provincial
local government organisation. The Budget Forum deliberates on matters pertaining to
local government finance. Any decisions taken by these bodies with regard to the divi
sion of revenue has to be approved by the cabinet. The Intergovernmental Fiscal Relations Aa
stipulates that a Division of Revenue Bill must be accompanied by a memorandum, explain
ing the extent to which account was taken of any recommendations by the FFC.106
4.3.2 The Recommendations I?Y the Financial and Fiscal Commission
The allocation of transfers from the pool of nationally collected revenues entails,first, a
vertical division of resources between the spheres of government and, second, a horizontal
division amongst different governments within the same sphere.10?
4.3.2.1 Vertical Division
The FFC's initial recommendations related to the 1997-8 financial year, before local gov--ernment was included into this re~enue-sharing process (FFC 1996). The FFC recom-
mended that provincial allocations be increased gradually as provinces assume their con-
104 This position is currently vacant. lOS South Africa has seen a proliferation of executive and administrative intergovernmental bodies (De Villiers 1997b), indicating an emphasis on "executive federalism" (Watts 1990). 106 This memorandum is included in annexure E of the "Budget Review", which is tabled together with the national budget each year.
74
Stellenbosch University https://scholar.sun.ac.za

stitutionally designated functions, and as security and defence spending at national level
decreases and thus frees up extra resources. The FFC (1996: 2) also argued that provin
cial expenditure required more growth than national expenditure as it was more sensitive
to population growth, due to the administrative responsibility of provinces for social
services such as health and education.
Table 15: Recommended Vertical Division of NationaUy Collected Revenues, plus Provincial Revenues from a Surcharge on the Personal Income Tax Base, Phased in from 1 per cent to 7 per cent Shore per sphm in per cent
1996-7* 1997-8 1998-9 1999-0 2000-1 2001-2 2002-3 Provincial 51.85 52.35 52.85 53.35 53.85 54.35 54.85 National 48.15 47.65 47.15 46.65 46.15 45.65 45.15 Total 100 100 WO 100 100 100 100 Source: Financial and Fiscal Commission (1996: Table lC). NoteJ: Improvements in conditions of service are included in the national share. * The base year figures derived from budgeted expenditures presented to Parliament on 13 March 1996.
Table 16: Recommended Vertical Division of Nationally Collected Revenues, plus Provincial Revenues from a Surcharge on the Personal Income Tax Base, Phased in from 1 per cent to 7 per cent Shore per sphm in 1996 R miflions
1996-7* 1997-8 1998-9 1999-0 Provincial 75229 78306 81425 84661 National 69919 71269 72636 74022 Total 145218 149575 154062 158684
Source: Financial and Fiscal Commission (1996: Table 10).
2000-1 88019 75426 163444
2001-2 91501 76847 168347
NoteJ: Improvements in conditions of service are include9 in the national share.
2002-3 95113 78285 173398
* The base year figures derived from budgeted expenditures presented to Parliament on 13 March 1996.
The FFC recommended that total annual transfers to local governments be kept equal to -their historical volume. The commission proposed the identification of a time period in
which backlogs would be addressed, and that the implications of increasing the transfers
to local government in order to eliminate backlogs be considered (FFC 1997).
4.3.2.2 Provincial Equitable Share and Conditional Grants
The FFC proposed a foi:mula for the horizontal division of resources among the nine
provinces, as it considered a formula more objective and less prone to manipulation by
politicians and civil servants. A formula would enable provinces to predict revenues with
greater certainty, which in tum would allow them to plan ahead. In order to address his
torical funding imbalances, the p~oposed formula aimed to achieve equity in public ex-
107 In the following analysis, the descriptions of formulas and their components mirror closely those found in the indicated source documents. Due to the technical nature of the content, rephrasing might have distorted the meaning of these descriptions in some instances.
75
Stellenbosch University https://scholar.sun.ac.za
penditure, in per capita tenus, over a period of five years. This would allow all provinces
to adjust to the new funding arrangements. Provinces with a shrinking resource envelope
would have the necessary time to reprioritise, while those with expanding allocations
would have a period in which to build their capacity to handle resources efficiently. Pre
viously over-funded provinces like the Western Cape and Northern Cape would experi
ence a real decrease in funding, i.e. after inflation is taken into account. Other provinces
would experience real increases, especially the Northern Province, North West and
Mpumalanga. For the 1997-8 fiscal year, provinces would receive unconditional sums
which they could all?cate as they saw fit. The FFC recommended a review of the fonuula
after three years (Abedian et al 1997: 44-51, FFC 1996). The recommended fonuula con
sisted of five components, making up the total allocation to a particular province (P):
P=S+m+T+I+B
The national standards grant (S) aimed to supply provinces with sufficient funds to provide a
minimum standard of services in primary and secondary education and primary and dis
trict-level health care. A province's allocation would be dependent on the size of its
population eligible for these services and the average cost of providing them at the
minimum standard (for instance, in education, the amount of school-aged children and
the cost of teaching with a target pupil-teacher ratio of 1:38).
The spillover component (m) was intended to finance those services which are subject to in
ter-provincial spillover effects. It would be allocated to those provinces with academic
hospitals to compensate for the costs of medical training and the provision of specialised
health services such as heart transplants, services which benefit other jurisdictions. ~
The fiscal capaciry equalisation grant (I) was based on the notion that each province must be
accountable for any spending which would require raising additional revenue. The T
grant would complement provincial taxation powers to equalise for varying fiscal capaci
ties (i.e. tax bases). In the absence of the necessary enabling legislation for provincial
taxati6.n, a transitionally assigned surcharge (TAS) would act as a proxy for own revenue
equal to the tax room created.
76
Stellenbosch University https://scholar.sun.ac.za

The institutional grant (I) was to cover the cost of running a basic administration in each of
the provinces, such as a legislature and provincial executives.
Finally, the basic grant (B) would allow provinces to establish and maintain the institutions
necessary to fulfil their constitutional obligations according to their own priorities. Pro
vincial shares were calculated on the basis of the weighted population figures for each
province. People living in rural areas were given aweight of 1.25. "Ruralness" was cho
sen as a proxy for differences in wealth and as an indicator of deprivation with few data-
related problems.
Table 17: Recommended Total Allocation per Province RmiUiom
1996-7 Budget 1997-8 1998-9 1999-0 2000-1 2001-2 2002-3 (Base Year}
Western Cape 8378 8753 9163 9605 10078 10441 10830 Eastern Cape 13901 15162 16584 18184 19981 21847 23952 Northern Cape 1769 1847 1930 2017 2108 2178 2249 KwaZulu-Natai 14546 16239 18158 20360 22883 25563 28644 Free State 5195 5680 6233 6860 7573 8307 9144 North West 6450 7151 7950 8863 9904 11009 . 12273 Gauteng 11108 12284 13671 15302 17218 19143 21422 Mpumalanga 4610 5124 5714 6393 7173 7992 8936 Northern Province 9324 10439 11711 13163 14820 16607 18651
Provincial govt. 75299- 82678 91114 100747 111737 123086 136101 . National govt. 69919 77150 85120 93902 103578 114329 125981
Source: FFC (1996: Table 8-7a).
Table 18: Recommended Total Fonnula Allocation per Province Per cent oj totaL
1996-7 1997-8 1998-9 1999-0 2000-1 2001-2 2002-3 Budget Target
(Base Year) Western Cape 11.13 10.58 10.03 9.48 8.92 8.31 7.69 Eastern Cape 18.46 18.38 18.30 18.22 18.15 18.16 18.18 Northern Cape 2.35 2.23 2.12 2.00 1.88 1.76 1.64 KwaZulu-Natai 19.34 19.67 20.00 20.33 20.66 21.04 21.42 Free State 6.90 6.86 6.82 6.78 6.74 6.71 6.68 North West 8.57 8.63 8.70 8.77 8.84 8.94 9.06 Gauteng 14.75 14.79 14.81 14.84 14.85 14.68 14.49 Mpumalanga 6.12 6.19 6.25 6.31 6.38 6.44 6.50 Northern Province 12.38 12.68 12.98 13.28 13.58 13.96 14.35 Total 100.00 100.00 100.00 100.00 100.00 100.00 100.00 Source: FFC (1996: Table 19C).
77
Stellenbosch University https://scholar.sun.ac.za
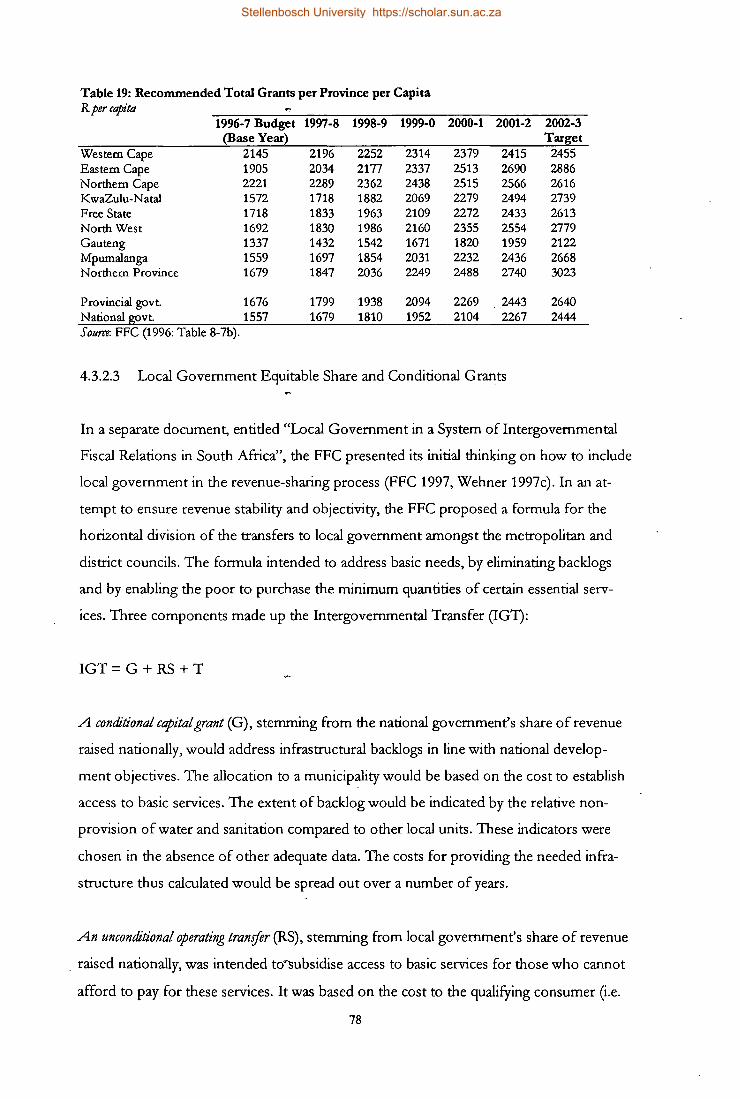
Table 19: Recommended Total Grants per Province per Capita Rpercapita
1996-7 Budget 1997-8 1998-9 1999-0 2000-1 2001-2 2002-3 (Base Year) Target
Western Cape 2145 2196 2252 2314 2379 2415 2455 Eastern Cape 1905 2034 2177 2337 2513 2690 2886 Northern Cape 2221 2289 2362 2438 2515 2566 2616 KwaZulu-Natal 1572 1718 1882 2069 2279 2494 2739 Free State 1718 1833 1963 2109 2272 2433 2613 North West 1692 1830 1986 2160 2355 2554 2779 Gauteng 1337 1432 1542 1671 1820 1959 2122 Mpumalanga 1559 1697 1854 2031 2232 2436 2668 Northern Province 1679 1847 2036 2249 2488 2740 3023
Provincial govt. 1676 1799 1938 2094 2269 2443 2640 National govt. 1557 1679 1810 1952 2104 2267 2444 Sourw: FFC (1996: Table 8-7b).
4.3.2.3 Local Government Equitable Share and Conditional Grants
In a separate document, entitled "Local Government in a System of Intergovernmental
Fiscal Relations in South Africa", the FFC presented its initial thinking on how to include
local government in the revenue-sharing process (FFC 1997, Wehner 1997c). In an at
tempt to ensure revenue stability and objectivity, the FFC proposed a formula for the
horizontal division of the transfers to local government amongst the metropolitan and
district councils. The formula intended to address basic needs, by eliminating backlogs
and by enabling the poor to purchase the minimum quantities of certain essential serv
ices. Three components made up the Intergovernmental Transfer (IG1):
IGT= G + RS +T
A conditional capitalgrant (G), stemming from the national government's share of revenue
raised nationally, would address infrastructural backlogs in line with national develop
ment objectives. The allocation to a municipality would be based on the cost to establish
access to basic services. The extent of backlog would be indicated by the relative non
provision of water and sanitation compared to other local units. These indicators were
chosen in the absence of other adequate data. The costs for providing the needed infra
structure thus calculated would be spread out over a number of years.
An unconditional operating transfer (RS), stemming from local government's share of revenue
. raised nationally, was intended to~subsidise access to basic services for those who cannot
afford to pay for these services. It was based on the cost to the qualifying consumer (i.e.
78
Stellenbosch University https://scholar.sun.ac.za
household below the poverty line) of a minimum annual water supply and a basic level of
sanitation.
A tax capacity (equalisation) . component (I) considered the relative ability of the municipal or
district council to subsidise the poor under its jurisdiction. If the aggregate wealth of a
jurisdiction is equal or more than its aggregate need, it was expected to provide for its
own needs.
4.3.3 ActuaL DeveLopments
The recommendations by the FFC are not legally binding. The national government de
cided not to adopt the commission's recommendations without adjustments.
4.3.3.1 Vertical Division
The Budget Council decided to "rop-slice" (subtract) a number of items from the total
available government revenue before the vertical split. These amounts are made up of
the interest on government debt, projected improvements in the conditions of service
(wage increases for civil servants), and carry-through costs for social pensions etc. In
1997-8 the Budget Council recommended that the remainder be divided between the na
tional and provincial spheres in the same ratio as applied in the 1996-7 budget (Abedian
et a/1997: 52). As from 1999-0 the top slice also includes an amount set aside as a con
tingency reserve for the national government.
The analysis of the vertical division is obscured by the fact that the Department of Fi
nance often uses expenditure data when elaborating on the vertical division, rather than
nationally collected revenue. The practice of top-slicing further blurs the picture. Since the
overwhelming share of government debt was incurred at the national level, this raises the
question why debt should be top-sliced, rather than serviced directly from the national
government share of revenue.10S The following figure shows that the provincial share of
nationally collected revenue has been substantially decreased, from 57.6 per cent in 1996-
108 A process of incorporating a debt of R 14.8 billion incurred by the former TBVC states and selfgoverning territories into the national government's debt portfolio has largely been completed. R 13.9 bil
. lion of debt of the former regional authorities also reverted to the national government in 1994, and a further R 5.3 billion are yet to be incorporated (Department of Finance 1999: 78). However, these amounts are relatively small compared with the total government debt, which stood at R 377.4 billion in 1999.
79
Stellenbosch University https://scholar.sun.ac.za
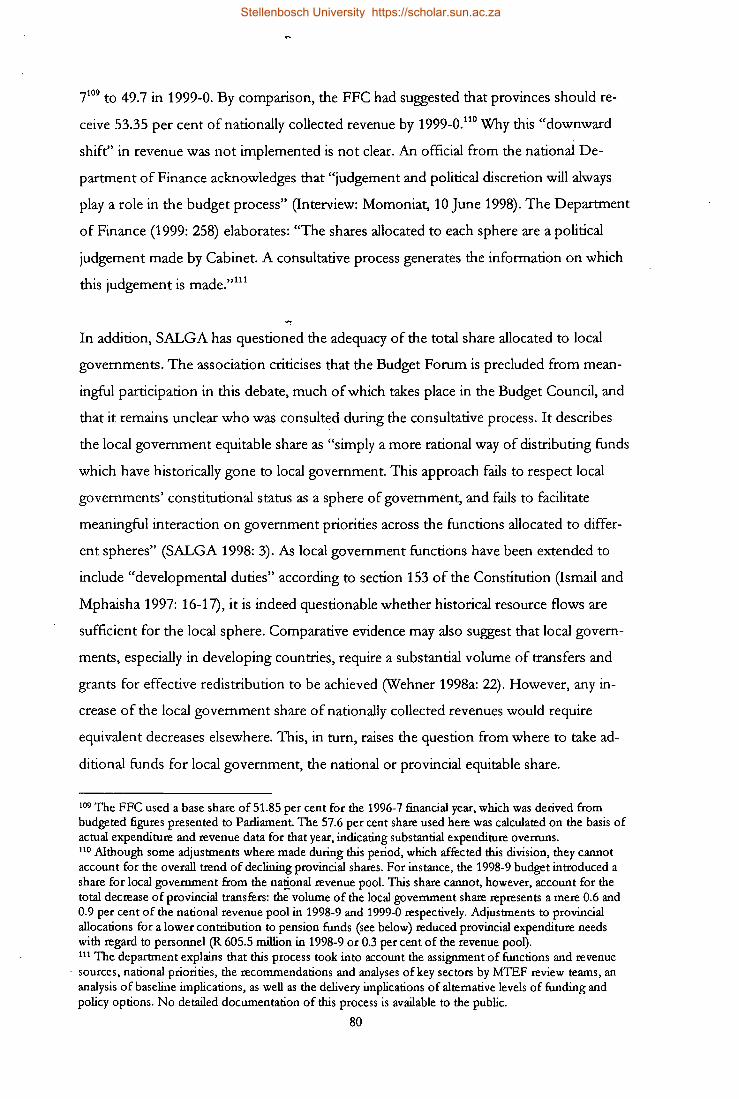
7109 to 49.7 in 1999-0. By comparison, the FFC had suggested that provinces should re
ceive 53.35 per cent of nationally collected revenue by 1999-0.110 Why this "downward
shift" in revenue was not implemented is not clear. An official from the national De
partment of Finance acknowledges that "judgement and political discretion will always
playa role in the budget process" (Interview: Momoniat, 10 June 1998). The Department
of Finance (1999: 258) elaborates: "The shares allocated to each sphere are a political
judgement made by Cabinet. A consultative process generates the information on which
th o • d . d ,,111 is jU gement is rna e.
In addition, SALGA has questioned the adequacy of the total share allocated to local
governments. The association criticises that the Budget Forum is precluded from mean
ingful participation in this debate, much of which takes place in the Budget Council, and
that it remains unclear who was consulted during the consultative process. It describes
the local government equitable share as "simply a more rational way of distributing funds
which have historically gone to local government. This approach fails to respect local
governments' constitutional status as a sphere of government, and fails to facilitate
meaningful interaction on government priorities across the functions allocated to differ
ent spheres" (SALGA 1998: 3). As local government functions have been extended to
include "developmental duties" according to section 153 of the Constitution (Ismail and
Mphaisha 1997: 16-17), it is indeed questionable whether historical resource flows are
sufficient for the local sphere. Comparative evidence may also suggest that local govern
ments, especially in developing countries, require a substantial volume of transfers and
grants for effective redistribution to be achieved (Wehner 1998a: 22). However, any in
crease of the local government share of nationally collected revenues would require
equivalent decreases elsewhere. This, in tum, raises the question from where to take ad
ditional funds for local government, the national or provincial equitable share.
109 The FFC used a base share of 51.85 per cent for the 1996-7 financial year, which was derived from budgeted figures presented to Parliament The 57.6 per cent share used here was calculated on the basis of actual expenditure and revenue data for that year, indicating substantial expenditure overruns. 110 Although some adjustments where made during this period, which affected this division, they cannot account for the overall trend of declining provincial shares. For instance, the 1998-9 budget introduced a share for local government from the na~onal revenue pool. This share cannot, however, account for the total decrease of provincial transfers: the volume of the local government share represents a mere 0.6 and 0.9 per cent of the national revenue pool in 1998-9 and 1999-0 respectively. Adjustments to provincial allocations for a lower contribution to pension funds (see below) reduced provincial expenditure needs with regard to persolUlel (R 605.5 million in 1998-9 or OJ per cent of the revenue pool). 111 The department explains that this process took into account the assignment of functions and revenue
. sources, national priorities, the recommendations and analyses of key sectors by MTEF review teams, an analysis of baseline implications, as well as the delivery implications of alternative levels of funding and policy options. No detailed documentation of this process is available to the public.
80
Stellenbosch University https://scholar.sun.ac.za

Figure 5: Provincial Allocations from Nationally Collected Revenue (1995-1999)
::J 70% c: Q)
60% > Q)
0:: 50% "0 Q) - 40% u ~ a 30% (J
~ 20% ttl c:
10% a +=' ttl Z 0%
1995-6 1996-7 1997-8 1998-9 1999-0
o Conditional grants 5.3% 4.3%
• Equitable share 45.2% 45.4%
I1llTransfers 57.2% 57.6% 51.7%
Fiscal Year
Source: Department of Finance (1999: Annexure B and Table 4.7). Note: Calculations based on total ordinary national revenue and expenditure data. Total ordinary revenue figures reflect final outcome (1995-6 and 1996-7), preliminary outcome (1997-8), revised estimate (1998-9) and budget estimates after tax proposals (1999-0). Expenditure data represent audited expenditure (1995-6 and 1996-7), preliminary expenditure estimate (1997-8), projected total expenditure after adjustments for the lower 15 per cent employer's contribution to pension funds (1998-9), and budget estimate plus projected improvements in conditions of service (1999-0). Grants to provinces for local government from the Department of Constitutional Development were excluded for the calculation of the share of conditional grants from national departments to provinces .
. Table 20: Actual Vertical Division of Resources 1998-9* 1999-0 2000-1 2001-2
Rmil- %of Rmil- %of Rmil- %of Rmil- %of lion total lion total lion total lion total
Total budget expenditure 204293 100% 216780 100% 230722 100% 247250 100% Less 'top-sliced' amounts:
Debt service costs 43413 21.3% 48222 22.2% 49820 21.6% 52609 21.3%
Contingen~ reserve 1100 0.5% 3500 1.5% 8000 3.2%
S kiUs development /e1(Y grant scheme - 1000 0.4% 2000 0.8% ~
Donorjinanced spending 651 0.3% 750 0.3% 750 0.3% 750 0.3% Resources to be divided 160228 78.4% 166708 76.9% 175652 76.1% 183891 74.4%
National equitable share 78273 38.3% 78733 36.3% 81100 35.2% 84489 34.2% Of which:
National departments 67573 33.1% 69972 32.3% 72739 31.5% 76232 30.8% Conditionafgrants to subnationafgovem- 10700 5.2% 8761 4.0% 8361 3.6% 8257 3.3%
ments Provincial equitable share 80931 39.6% 86302 39.8% 92071 39.9% 96822 39.2%
Incl. conditional grants 90499 44.3% 94420 43.6% 100432 43.5% 105079 42.5%
Local government equitable share 1024 0.5% 1673 0.8% 2480 1.1% 2580 1.0%
Incl. conditional grants 2156 1.1% 2316 1.1% 2480 1.1% 2580 1.0%
Source: Data from Department of Finance (1999: Table 4.2). Notes: Equitable shares include estimates of improvements in conditions of service. * The national and provincial shares of expenditure in 1998-9 are adjusted for the reduction in the employ-ers' contribution to pension funds from 17 per cent to 15 per cent.
81
Stellenbosch University https://scholar.sun.ac.za

A quantification of the cost of mandates assigned to the different spheres of government
may be of value to ascertain the adequacy of the current :vertical division. To what extent.
such an assessment is feasible remains an issue for further debate.
4.3.3.2 Provincial Equitable Share and Conditional Grants
To split up the provincial pool of revenues among the nine provinces for 1997-8, the
Budget Council used a percentage distribution calculated by the FFC (1996: Table 20C).
This basic allocation, provincial shares of the "top-sliced" amounts and other adjust
ments for shifts in functions comprised the total provincial allocation in 1997-8. For the
1998-9 fiscal year the Department of Finance introduced a formula for the horizontal
division of revenue.
Table 21: Budgeted Transfers to Provinces for 1996-7 and 1997-8 R miUion unless otherwise indicated
1996-7 1997-8 Budget % of total Basic share Function Carry Increases in Budget % of total
of revenue shifts through costs social grants EC 14001 18.5% 12173 17 1389 191 13770 17.0% FS 5196 6.9% 4767 71 650 57 5545 6.9% G 11108 14.7% 10959 141 1700 111 12911 16.0% KZN 14664 19.4% 13560 7 1711 214 15492 19.2% M 4610 6.1% 4192 113 449 48 4802 5.9% NC 1769 2.3% 1529 219 194 32 1974 2.4% NP 9324 12.3% 8669 6 1598 96 10369 12.8% NW 6450 8.5% 5956 145 615 68 6784 8.4% WC 8378 11.1% 7375 92 1170 120 8757 10.8% Supple- 402 0.5% mentary
Total 75499 100.0% 69180 811 9476 937 80806 100.0% Sourre: Department of Finance (1997a: 6.5).·
Table 22: Provincial Po~ulation Shares Demographic Infor- Preliminary 1996 Cen- Final 1996 Census re-mati on Bureau data sus results (used in suits (used for 1999-0
{used in 1997-8} 1998-9} and be~ond} Thousands % bftotal Thousands % of total Thousands % of total
Eastern Cape 7454 16.2% 5865 15.5% 6303 15.5% Free State 3098 6.7% 2470 6.5% 2634 6.5% Gauteng 8580 18.7% 7171 18.9% 7348 18.1% KwaZulu-Natal 9453 20.6% 7672 20.3% 8417 20.7% Mpumalanga 3019 6.6% 2646 7.0% 2801 6.9% Northern Cape 807 1.8% 746 2.0% 840 2.1% Northern Province 5652 12.3% 4128 10.9% 4929 12.1% North West 3907 8.5% 3043 8.0% 3355 8.3% Western Cape 3987 8.7% 4118 10.9% 3957 9.7%
. Total 45957 100% 37859 100% 40584 100% Sourres: Financial and Fiscal Commission (1996: Table 7.2) and Department of Finance (1999: Table 4.5).
82
Stellenbosch University https://scholar.sun.ac.za
Table 23: Actual Fonnula for the Distribution of the Provincial Equitable Share Component share I!.er province in I!.er cent
Education Health Welfare Basic Economic Institu- Backlogs Target share activi!I tional shares
Year 1998 1999 1998 1999 1998 1999 1998 1999 1998 1999 1998 1999 1998 1999 1998 1999
Weighting 39.0 40.0 18.0 18.0 16.0 17.0 15.0 9.0 8.0 8.0 4.0 5.0 3.0 100.0 100.0
BC 18.5 18.5 17.3 17.0 18.7 19.6 16.6 15.5 7.6 5.9 11.1 11.1 20.7 16.9 16.8 FS 6.3 6.3 6.7 6.5 6.6 7.1 6.1 6.5 6.2 5.1 11.1 11.1 5.6 6.6 6.6
G 13.8 12.3 15.6 14.7 13.3 13.9 15.8 18.1 37.7 43.2 11.1 11.1 5.0 16.2 15.7 KZN 21.3 22.1 21.1 21.7 21.0 19.6 21.2 20.7 14.9 18.9 11.1 11.1 23.0 20.3 20.7 M 7.5 7.3 7.0 7.2 7.2 6.5 7.5 6.9 8.1 4.7 11.1 11.1 8.5 7.6 7.1 NC 1.8 1.9 2.0 2.0 2.0 2.2 1.8 2.1 2.1 1.6 11.1 11.1 1.3 2.3 2.4 NP 14.3 15.7 11.8 13.3 13.2 13.7 12.8 12.1 3.7 1.7 11.1 11.1 22.9 12.5 13.5 NW 8.0 8.0 8.3 8.6 8.8 8.7 8.7 8.3 5.6 5.1 11.1 11.1 9.5 8.2 8.2 WC 8.5 7.9 10.3 8.9 9.1 8.8 9.3 9.7 14.1 13.7 11.1 11.1 3.6 9.6 8.9 Total 100.0 100.0 100.0 100.0 100J) 100.0 100.0 100.0 100.0 100.0 100.0 100.0 100.0 100.0 100.0 Source: Department of Finance (1998b: E23 and 1999: 263). Note: Totals may not add due to rounding.
For 1999-0 the weightings of the different component were adjusted "to reflect actual
expenditure trends in the provinces" (Department of Finance 1999: 101).112 The incorpo-
ration of the final 1996 Census figures in 1999-0 also impacted on provincial allocations,
given the formula's sensitivity to demographic factors (Donian and Rip-Botha 1997). The
final population figures show a different distribution than the preliminary estimates,
which were used to calculate equitable share allocations in the 1998 budget.ll3 Provinces
such as the Northern Province and KwaZulu-Natal gained from the revised census data.
The most notable loser of the adjusted census figures, compared with the preliminary
results, is the Western Cape. It is-the only province whose population figure was de
creased in the adjustment process, and its target share has been subject to the biggest de-
d ·th th th . 114 crease compare WI e 0 er provinces.
To enable provinces to adjust to increases or decreases as a result of the new process, the
formula will be phased in over a period of five years. Based on the final equitable share
allocations for 1998-9, provincial allocations will be subject to five equal moves towards
112 The weightings attached to the education, welfare and institutional components were increased. The previous basic component was split into a basic share imd a backlog component The combined weighting of these components was reduced from 15 to 12 per cent to accommodate increases elsewhere. These changes are discussed in detail below. 113 However, the available documentation does not isolate the impact of the final census data from that of the formula changes. The impact of thenew data alone would be made explicit by the distribution outcome of the new formula, but calculated with the population data used in the previous year. The difference between this calculation and the current share for each province would equal the effect of data changes. 114 The provincial government of the Western Cape has questioned the credibility of the adjusted figures (Business Dqy, 22 October 1998). It commissioned a report from independent consultants, which disputed the census data (Business Dqy, 10 December 1998).
83
Stellenbosch University https://scholar.sun.ac.za
the target share. The further development of the formula has to be carefully balanced
with the benefits of a predictable revenue allocation process. Walker (1999: 7) comments:
"Continual changes introduce instability and uncertainty into the system, making it more
difficult for provinces to plan their expenditures and manage adjustments required."
The formula is currently made up of seven components, which are not intended to indi
cate how provinces should allocate their resources. Rather, they represent estimates of
the distribution of demands for services (Department of Finance 1999: 262-268):
The education component targets primary and secondary schooling, which accounts for
roughly 90 per cent of provincial education spending. Both the school-age population
and the numbers of pupils enrolled are relevant to funding needs. The distribution of
children of school-going age does not reflect repeater rates and the numbers of under or
over-age pupils in the system. But using the number of enrolled pupils only would create
perverse incentives.115 For 1998-9 a simple average of the two was used. From 1999-0 the
education component double weights the school-age cohort, as an incentive for prov
inces to reduce the number of over and under-age learners.
The health component addresses the need for provinces to deliver primary and secondary
health services. As all citizens are eligible for health services, the provincial shares of the
total population form the basis for the health share. A distinction is made between those
with access to medical insurance and those without. Contrary to 1998-9, people with pri
vate medical insurance were not removed from the base population in 1999-0, to reflect
that they are eligible to use public health facilities should they choose so. However, peo
ple without medical aid are weighled four times higher, assuming that the uninsured ac
count for 95 per cent of public health facilities usage. 116
The we!fare component captures the responsibility of provinces to provide social security
grants. The target populations of social security payments are weighted by the historical
distribution of each type of grant. The base populations for the old age and childcare
sub-components are those proportions of the population that are eligible for grants:
males over age sixty-five, females over sixty and children under six. The base population
liS Such a funding system would provide no incentive for provincial departments to improve passing rates, but reward poor performance by not penalising high repeater rates.
84
Stellenbosch University https://scholar.sun.ac.za
for the disability sub-component is the total population, based on an assumed symmetri
cal distribution of the disabled across the provinces. An income factor is incorporated to
capture the impact of the means test for old age and child support grants, considering the
provincial share of the population that falls in the lowest two quintiles of the income
distribution. The final welfare share is a combination of the income factor, weighted
twenty-five per cent, and the weighted average of grant populations.
The basic component was in 1998-9 weighted in favour of the rural population as a proxy for
poverty. The newly introduced backlog component now incorporates the rural weighting,
while the basic component is distributed by percentage share of the total population.
The economic activity component, in the absence of effective provincial taxation powers, acts
as a proxy for provincial tax revenue. It directs a proportion of nationally collected reve
nues back to source. It also reflects the costs associated with economic activity, such as
th · f· ·al d 117 e malOtenance 0 provlOcl roa s.
The institutional component is targeted at covering the costs associated with running a basic
structure for government. It is evenly distributed between provinces in an attempt to take
into account certain fixed costs that all provinces must incur, irrespective of their size or
state of development.
The backlog component was introduced in 1999-0 to address criticisms that the formula had
failed to take into account the developmental backlogs in some provinces. Its three sub
components recognise the need for capital spending on rural infrastructure and facilities
in the health and education sectors. The health and education sub-components are
weighted as in the main formula, according to aggregate provincial spending on these
functions, 18 and 40 per cent respectively. The health and education distributions are
based on the distribution of capital needs identified in the audit of hospital facilities and
schools register of needs. Provincjal shares of the rural population inform the distribu
tion of the remaining 42 per cent.
116 The proportions of the population with and without access to medical aid were taken from the i 995 October Household Survey and applied to the census figures. 117 Gross Geographical Product (GGP) figures for 1994 were used in 1998-9 to estimate the distribution of economic activity across the provinces. Because updated GGP figures are unavailable, they were replaced in 1999-0 by the distribution of remuneration of employees. Remuneration data are the largest component of provincial GGP.
85
Stellenbosch University https://scholar.sun.ac.za

Two personnel related deductions from the provincial equitable shares, as calculated by
the formula explained above, were made in 1999-0. The estimated distribution of im
provements in conditions of service was removed from the equitable share, to be allo
cated as a conditional grant once wage negotiations have been concluded. Second, the
employers' contribution to the Government Employees Pension Fund was reduced from
17 per cent to 15 per cent. The adjustment was distributed to reflect lower expenditure
commitments rather than a reduction in services.lls
In addition to the equitable share, which is unconditional, a number of conditional grants
were introduced with the 1998 budget, which are channelled through various national
departments (Department of Finance 1999: 103-106). The largest conditional grants are
found on the vote of the national Department of Health and relate mainly to specialised
health services that are not provided by all the provinces (Van den Heever 1998). The
conditional grant for education seeks to improve the quality of education and support
various initiatives. The conditional grant from the Department of Finance was intro
duced in response to financial difficulties in certain provinces in 1997-8. Provinces also
receive conditional grants for local government (see following section). In 1999-0, condi
tional grants comprise about 10 per cent of the total volume of transfers and grants to
provinces, with the equitable share making up the remainder.
118 In 1998-9 the savings of lower pension fund contributions were deducted from total expenditure, rather than allocated to provincial and national departments.
86
Stellenbosch University https://scholar.sun.ac.za

Table 24: Conditional Grants to Provinces· Rmi!.lions
1998-9'" 1999-0 2000-1 2001-2 Health Central hospitals 3021 3075 3112 3221 Training and research 1060 1118 1174 1215 Redistribution of specialised services 53 112 176 182 Hospital rehabilitation programme 200 400 500 Durban Academic Hospital 200 247 273 103 Umtata Regional Hospital 100 64 Primary school nutrition programme 526 555 582 603 Finance Supplementary grant 2800 2500 2212 2000 Contingency transfer to provinces for debt relief 1000 Education Financial management and quality enhancement 200 111 272 283 Classroom backlogs 50 KwaZulu-Natal peace initiative 81 Textbook grant 200 Housing Capacity building 10 10 10 10 State Expenditure Financial and personnel management 100 20 100 140 Welfare Financial management of social security systems 100 50 50 Labour Training centres in former Bophuthatswana 52 56 Other conditional grants 15 Sub-total 9568 8118 8361 8257 Department of Constitutional Development Grants to provinces for local government R293 staff 951 463 R293 transfer cost assistance grant 40 Local government support grant'" 181 140 Sub-total 1132 643 Total 10700 8761 8361 8257 Source: Department of Finance (1999: Table 4.7). Notes: • Improvements in condition of service are appropriated as a conditional grant in 1998-9 and 1999-0 but will become part of the equitable share in 2000-1. The amounts to provinces for 1998-9 and 1999-0 are R 2419 million and R 2100 respectively. ~ .
•• Some conditional grants had not yet been allocated to provinces . ••• This grant was called the local government transition grant in 1998-9.
4.3.3.3 Local Government Equitable Share and Conditional Grants
The fonnula used by the Department of Finance for the distribution of the local gov
ernment share differs from that recommended by the FFC. Most notably, it consists of
only two components (Department of Finance 1998b and 1999: 113-115):
A municipal basic services transfer aims to enable poor residents in all local government juris
dictions to access basic municipal services. The basic approach involves estimating the
87
Stellenbosch University https://scholar.sun.ac.za
number of people in poverty (household income less than R 800 per month in 1998
prices) and the current annual cost of providing basic services for each person.
A municipal institutions transfer is earmarked for those jurisdictions currently lacking the
administrative capacity to raise their own revenue or lacking the basic infrastructure nec
essary to function as local authorities. This transfer pays for a minimum level of re
sources to provide and maintain basic facilities for the operation of local government
(such as a community centre and an office for elected officials).
A number of historically privileged municipalities will receive lower subsidies in the fu
ture. A once-off transitional grant ofR 181 million was introduced in 1998-9 to assist in
this adjustment. For the 1999-0 fiscal year, the equitable share also includes R 447 mil
lion, which will be given directly to former so-called R293 towns119 for functions that
were previously paid for by provinces. It is expected that these funds will be fully incor
porated into the local government equitable share from 2000-1.
In addition to the local government equitable share, local governments also receive con
ditional grants and agency payments from national and provincial governments for both
capital and recurrent expenditure. Grants for recurrent expenditure cover R293 staff and
assist in the transfer process and in rationalising local administrations. The main capital
transfer to local government is the Consolidated Municipal Infrastructure Programme.
This is a medium to long-term capital grant programme administered by the Department
of Constitutional Development. Municipalities are requested to forward business plans to
the department for the funds to be released.
4.3.4 Review of Recommendations and Practices
Current practice diverts substantially in some important aspects from the original rec
ommendations made by the FFC. Most notably, there has been a decrease in the provin
cial share of nationally collected revenues instead of the increase recommended by the
119 R293 towns are largely local authorities which were operated by the former homeland authorities. Allocations for services and staff in R293 towns have been channelled through the provinces in previous years, but it was planned to incorporate these funds into the equitable share during 1999-0. 1bis was dependent
. on the progress with transferring staff from the provinces to these local authorities. Due to this process being slower than expected, service subsidies in 1999-0 are going directly to these towns through the equitable share, while a conditional grant covers staff costs until provinces are able to transfer the staff.
88
Stellenbosch University https://scholar.sun.ac.za
FFC. The Department of Finance describes the vertical division as a "political judgement
made by Cabinet". This description stands in stark contrast to the process and role
players outlined in the Constitution, which awards a substantial role to the FFC and re
quires the consultation of provincial governments and organised local government.
The FFC has argued for the implementation of provincial taxation powers, in conjunc
tion with an equalisation component in the formula, to introduce accountability on the
revenue side. The Department of Finance has been reluctant to follow this approach.
Several adjustments were made to the provincial formula for the 1999-0 financial year to
accommodate a backlog component. However, in the light of decreasing budgets in real
terms and dwindling capital expenditures, it is doubtful that provinces "should be able to
include amounts in their budgets to address these backlogs over the medium term" (De
partment of Finance 1999: 101). The FFC has argued that backlogs should rather be ad
dressed through ad hoc grants from the national government (FFC 1996: 3). In addition,
as noted in chapter 2 (see section on borrowing arrangements), effective borrowing pow
ers for provinces are likely to be required to finance developmental expenditure.12o
The formula used by the Department of Finance for the horizontal distribution of the
local government share also excludes the tax capacity (equalisation) component sug
gested by the commission, which would be an incentive to improve revenue collection.
The local government formula also excludes the capital grant suggested by the FFC.
Whereas the FFC proposed an automatic grant system, the current arrangement under
the auspices of the Department of Constitutional Development is application-driven.
The FFC is presently working on "Project 2001". The objectives of the project are "to
test the original and subsequent recommendation of the FFC against current practice and
to prepare comprehensive recommendations for 2001-2 and subsequent fiscal years"
(FFC 1999: 1). Such a review will be a valuable resource, as definitional inconsistencies
120 The backlog component is also the smallest component of the fonnula, accounting for the distribution of merely 3 per cent of the provincial equitable share. The basic component was previously weighted in favour of the rural population as a proxy for poverty. With the introduction of the backlog component, the rural weighting was removed, and the basic share is being distributed according to provincial percentage shares of the total population. Therefore, the redistributing effect of the basic component was weakened, which to some extent neutralised the actual impact of the backlog component The backlog component has accordingly been described as "notional" (Interview: Donian, 8 April 1999).
89
Stellenbosch University https://scholar.sun.ac.za

and a range of continuous adjustments currently obscure a definite quantitative assess
ment of the discrepancies outline.d above. The prevailing perception inside the FFC is
that the commission has been sidelined, most likely because its recommendations are re
garded as too much in favour of decentralisation (Interview: Donian, 8 April 1999). The
commission hopes to improve its impact by working more closely with Parliament
through a liaison office to be established in Cape Town. Otherwise, the demoralisation
and exodus of qualified staff may wellieave the commission as a constitutional ruin. In a
system where revenues are almost totally centralised, the sidelining of the FFC is a threat
to the impartiality of the revenue-sharing process.
4.4 Borrowing Arrangements
While the Constitution does not limit the borrowing activities of the national sphere, it
prescribes that provincial and local governments may raise loans for capital or current
expenditure in accordance with reasonable conditions determined by national legislation
(section 230). Loans for current expenditure may only be raised for bridging purposes
duririg a fiscal year, and must be repaid within twelve months. l2l
4.4.1 Provincial Borrowing
The Borrowing Powers q/Provincial Governments Act (1996) allows for the Budget Council to
function as a Loan Co-ordinating Committee (LCC). The act requires the committee to
co-ordinate the annual borrowing requirements of the provinces, considering the aggre
gate demand for capital market funds. The LCC would consider overall debt levels in the
provinces, their contingent liabilities and ability to service their debt. The committee is
required to report to the FFC on these matters. However, these provisions have never
been fully functional since, at a Budget Council meeting on 5 January 1997, the majority
of provinces agreed not to borrow. The first requests were submitted to the LCC only
towards the end of the 1998-9 fiscal year (Interview: Donian, 8 April 1999).
121 These restrictions must be seen against the experience with borrowing in the former homelands. Commitments of R 14,8 billion due to the indebtedness of the former TBVC states and self-governing territories had to be converted to national debt after the dismantling of apartheid (Department of Finance 1999: 78).
90
Stellenbosch University https://scholar.sun.ac.za

Most provinces have instead resorted to drawing down deposits and utilising overdraft
facilities with banks to finance unanticipated expenditure needs. The provinces' com
bined bank overdrafts stood at R 2.8 and 1.6 billion in December 1997 and 1998 respec
tively (Business Dqy, 15 February 1999). Other means of implicit borrowing include rolling
over debtors' accounts, withholding payments to the receiver, withholding employer
contributions from the pension fund and withholding pay progression for public servants
despite wage agreements (Folscher 1999: 2).122
The Public Finance Management Act (1999) further prohibits provinces from entering com
mitments in foreign currency (section 67). This follows a scandal revolving around secret
funding deals with state assets by the Mpumalanga Parks Board, which issued six illegal
promissory notes valued at about R 1.3 billion without cabinet or Reserve Bank approval.
The promissory notes used the assets of the board as collateral for intemationalloans
(Business Dqy, 25 September 1998). The Department of Finance is currently working to
wards a new and consolidated framework for provincial borrowing (Folscher 1999).
4.4.2 Local Borrowing
Separate legislation pertaining to local financial management is expected in the near fu
ture. A general constraint on local borrowing is the fact that a mere 150 out of 843 mu
nicipalities in the country are estimated to be credit-worthy. The largest of these can be
found in the well-developed urban areas (Business Dqy, 14 September 1998). Adjustments
to the existing municipal boundaries and amalgamations may facilitate a more even ac
cess to the borrowing market. However, it is also possible that the ratings of municipali
ties with high credit-ratings could drop if they were to merge with other local authorities
burdened by debt. These ratings could rise again as a result of savings due to economies
of scale and the elimination of dttplication (Business Dqy, 5 June 1998).
122 For example, after signing the 1996 wage agreement at national level, the Eastern Cape government failed to put the relevant personnel onto the new salary system which would have ensured various promotions, affecting about 60 per cent of public servants in the province (Business Drg, 11 May 1999).
91
Stellenbosch University https://scholar.sun.ac.za

4.5 Chapter Conclusion
This chapter provided an in-depth analysis of intergovernmental fiscal relations in South
Africa. The Constitution sets out a pattern that gives the national Parliament broad Legis
Lative powers, while relying heavily on the provinces for the implementation of national pol
icy, especially with regard to the social expenditure areas. Provinces currently do not have
effective taxation powers, and rely almost totally on transfers and grants from the na
tional pool of revenue. The degree of provincial fiscal dependency requires a well
balanced and sizeable system of transfers and grants to address both vertical as well as
horizontal imbalances. The design of such a system has been one of the foremost chal
lenges that came with the new constitutional order. Local governments, on the other
hand, have been expected to cover the overwhelming share of expenditure with own
revenues. However, varied collection abilities and revenue bases make for a substantial
asymmetry within the local sphere. Subnational Expenditure and Revenue data is sum
marised in the following tables.
92
Stellenbosch University https://scholar.sun.ac.za

Table 25: Consolidated Provincial Revenue and Expenditure R billion
Actual Preliminary Medium .term estimates estimate
1995-6 1996-7 1997-8 1998-9 1999-0 2000-1 2001-2
Transfers * 72.9 84.7 86 91.7 94.3 99.4 104 Own revenue 4.3 4.2 3.5 3.3 3.7 4 4.2 Total revenue 772- 88.9 89.4 95 98.1 103.5 1082-
per cent increase 15.1% 0.6% 62% 3.3% 5.5% 4.6%
Education 29.4 36.6 38.7 38.8 40.3 42.6 44.7 Health 15.8 20.4 22.4 22.7 23.7 25.3 26.3 Welfare 14.4 15.9 17.7 18.4 18.7 19.5 20.3 Other 16.2 18.5 16.6 14.5 13.5 13.9 14.6 Finance reserve 1.9 2.1 2.3 Total expenditure 75.9 91.4 95.3 94.4 98.1 103.5 108.2
per cent increase 20.4% 4.3% -1.0% 3.9% 5.5% 4.6%
Personnel spending 40.3 49.2 54.5 55.9 58.3 61.2 63.9 Surplus / deficit 1.3 -2.5 -5.9 0.6
per cent of GDP 0.3% -0.5% -1.0% 0.1% Source: Department of Finance (1999: T3l:Jle 4.1). Notes: Totals may not add due to rounding. * From nationally collected revenue, excluding conditional grants.
Table 26: Composition of Consolidated Provincial Revenue and Expenditure Per cent of total
Actual Preliminary Medium term estimates estimate
1995-6 1996-7 1997-8 1998-9 1999-0 2000-1 2001-2 Trans fers * 94.4% 95.3% 96.2% 96.5% 96.1% 96.0% 96.1% Own revenue 5.6% 4.7% 3.9% 3.5% 3.8% 3.9% 3.9% Total revenue 100.0% 100.0% 100.0% 100.0% 100.0% 100.0% 100.0%
Education 38.7% 40.0% 40.6% 41.1% 41.1% 41.2% 41.3% Health 20.8% 22.3% 23.5% 24.0% 24.2% 24.4% 24.3% Welfare 19.0% 17.4% 18.6% 19.5% 19.1% 18.8% 18.8% Other 21.3% 20.2% 17.4% 15.4% 13.8% 13.4% 13.5% Finance reserve 1.9% 2.0% 2.1% Total expenditure 100.0% 100.0% 100.0% 100.0% 100.0% 100.0% 100.0%
~.
Personnel spending 53.1% 53.8% 57.2% 59.2% 59.4% 59.1% 59.1% Source: Own calculations based on data in Department of Finance (1999: Table 4.1). Notes: Totals may not add due to rounding. * From nationally collected revenue, excluding conditional grants.
93
Stellenbosch University https://scholar.sun.ac.za

Table 27: Local Government Revenue and Expenditure RmiUion
Estimated Projected 1995-6 1996-7 1997-8 1998-9 1999-0 2000-1 2001-2
Tax revenue 6701 7508 8264 9142 9707 11054 11924 Non-tax revenue 9385 10136 9394 9954 10891 12092 12961 Capital revenue 625 384 • 434 450 499 539 583 Total grants 4089 6067 6350 5324 6Q77 6377 6931
of which equitable share 1024 1673 2480 2580 Revenue 20800 24095 24442 24870 27174 29062* 32399
~
Current Goods and services 14124 17502 17563 16885 17982 18763 20538 Interest 1704 1030 1245 1382 1477 1598 1728 Subsidies and transfers 314 636 506 440 400 400 450
Capital Acquisition of fixed assets 4105 4547 4742 5197 5934 6467 7043 Capital transfers 492 498 454 778 900 1000 1150 Net lending 590 649 714 694 795 860 930 Expenditure 21329 24862 25233 25376 27488 29088 31839
Surplus / deficit -529 -767 . -791 -506 -314 -26 560 Source: Department of Finance (1999: Table 4.10). Notes: The estimates reflect South African Reserve Bank data, based on a sample survey by Statistics South Africa covering 60 local authorities. The Department of Finance prepared the projections beginning with 1998-9. * Total reflects inconsistencies in the Department of Finance data.
94
Stellenbosch University https://scholar.sun.ac.za

CHAPTERS:
CONCLUSION
This thesis set out to capture the assignment of functions and resources to the different
spheres of government in South Africa and to provide an assessment of the functionality
of this assignment. The purposes of this chapter are to summarise the main findings and
to come to an assessment of the functionality of the South African system. Based on this
assessment, the necessity of adjusting the current assignment of functions and resources
for the sake of greater efficiency will be investigated.
The second chapter reviewed considerations in the design of fiscal federalism. The discus
sion generated economic reference frameworks for the assignment of expenditure re
sponsibilities, sources of revenue, and the design of a system of intergovernmental trans
fers and grants. The analysis also indicated that constitutions can impose limits on fiscal
design. The implication is that any policy recommendations concerning the assignment
of functions and revenues cannot ignore an existing constitutional framework.
The third chapter demonstrated the impact of constitutional models for regional govern
ment on fiscal arrangements in a country. In the divided model (as in Canada), national
and regional governments pursu~their functions as independentlY as possible and directlY
access sources of revenue. In the shared mO,del (as in Germany), the emphasis is on concur
rent responsibility and shared sources of revenue. An issue for further research is whether,
in general, divided models are associated with a higher degree of (expenditure and reve
nue) decentralisation than shared models.
The fourth chapter provided an in-depth analysis of the South African system. It shows that
the new Constitution sets out a pattern that gives the national Parliament broad legisla
tive powers, while relying heavily on the provinces for the implementation of national
policy. In return, provinces have a potentially powerful say in the national policy-making
process. Provinces do not yet have effective taxation powers, and receive the over
whelming share of their income from intergovernmental transfers and grants. Local gov
ernments, however, are expected to cover most of their expenditure with own revenues.
95
Stellenbosch University https://scholar.sun.ac.za
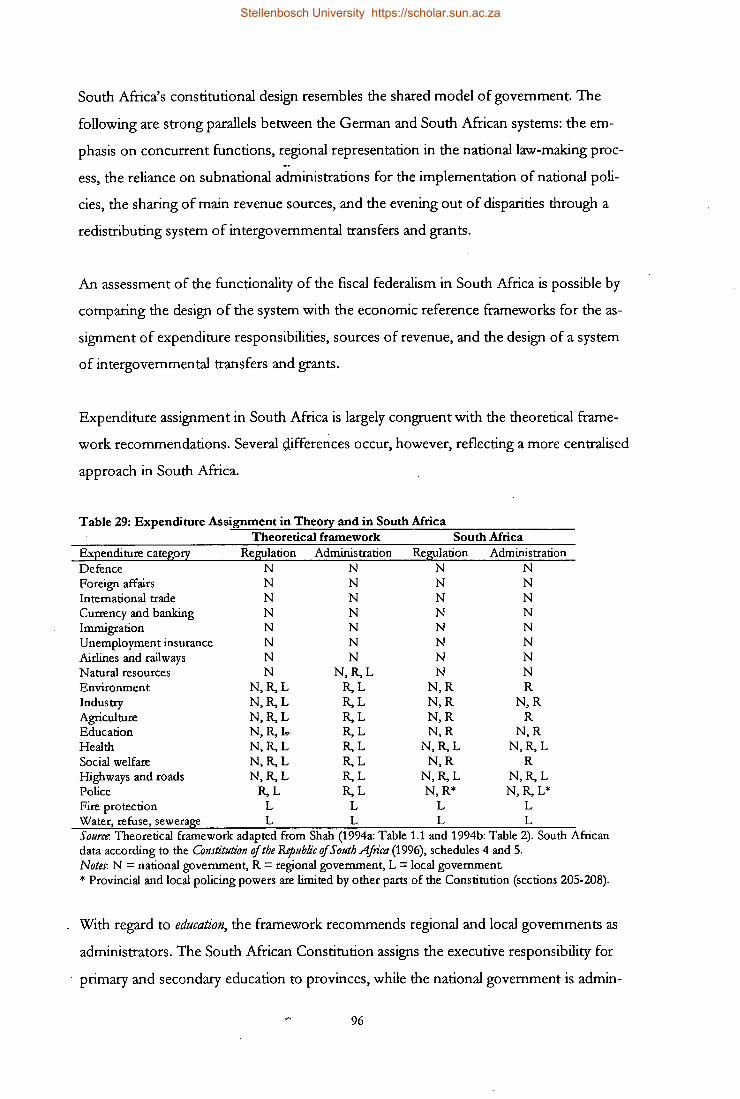
South Africa's constitutional design resembles the shared model of government. The
following are strong parallels between the German and South African systems: the em
phasis on concurrent functions, regional representation in the national law-making proc-~.
ess, the reliance on subnational administrations for the implementation of national poli-
cies, the sharing of main revenue sources, and the evening out of disparities through a
redistributing system of intergovernmental transfers and grants.
An assessment of the functionality of the fiscal federalism in South Africa is possible by
comparing the design of the system with the economic reference frameworks for the as
signment of expenditure responsibilities, sources of revenue, and the design of a system
of intergovernmental transfers and grants.
Expenditure assignment in South Africa is largely congruent with the theoretical frame
work recommendations. Several differences occur, however, reflecting a more centralised
approach in South Africa.
Table 29: Expenditure Assignment in Theory and in South Mrica Theoretical framework South Mrica
Expenditure category Regulation Administration Regulation Administration Defence N N N N Foreign affairs N N N N International trade N N N N Currency and banking N N N N Immigration N N N N Unemployment insurance N N N N Airlines and railways N N N N Natural resources N N, R, L N N Environment N, R, L R, L N, R R Industry N, R, L R, L N, R N, R Agriculture N, R, L R, L N, R R Education N, R, l". R, L N, R N, R Health N, R, L R, L N, R, L N, R, L Social welfare N, R, L R, L N, R R Highways and roads N, R, L R, L N, R, L N, R, L Police R, L R, L N, R* N, R, L* Fire protection L L L L Water, refuse, sewerage L L L L Source: Theoretical framework adapted from Shah (1994a: Table 1.1 and 1994b: Table 2). South African data according to the Constitution of the Republic of South Africa (1996), schedules 4 and 5. Notes: N = national government, R = regional government, L = local government * Provincial and local policing powers are limited by other parts of the Constitution (sections 205-208).
With regard to education, the framework recommends regional and local governments as
administrators. The South African Constitution assigns the executive responsibility for
primary and secondary education to provinces, while the national government is admin-
96
Stellenbosch University https://scholar.sun.ac.za
istratively responsible for tertiary institutions. This divergence is understandable from a
historical perspective. The development of the former white universities was ensured by
their historical funding privileges and the wealth of the constituency for which they were
reserved. Many institutions in the former homelands, to the contrary, were creatures of
apartheid and its ·notion of separate development. Many of the latter suffer from student
debts, which are crippling administrations. There is also a distortion in the distribution of
tertiary institutions across the country. The Northern Cape, for instance, has no univer
sity of its own (Van Niekerk and Ludman 1999: 67-68). In recognition of these circum
stances, tertiary education has to be regarded as a national, rather than a regional, asset.
This does not preclude the possibility of devolving authority at some later stage once the
landscape of tertiary education has been reformed. As local structures have been subject
to a challenging restructuring process over the past years, and many have a long way to
go before they fulfil their role as providers of essential services, it is not advisable to bur
den them with responsibility for primary education at this stage.
Perhaps the most notable divergence between the framework and South African practice
is in the area of policing. Although schedule 4 of the Constitution lists policing as a con
current matter, the activity of prQ.yinces is de/acto limited largely to an oversight role in
other parts of the document (sections 205-208). Municipal policing, subject to section
206(7) of the Constitution, awaits comprehensive development (Committee Appointed
by the Minister for Safety and Security 1997). In favour of continued centralisation is the
task of transforming the South African Police Service (SAPS). The policy service served
to sustain a system of oppression during apartheid. Dealing with the post-1994 challenge
of fighting crime and lawlessness, howev~r, requires an efficient and transformed police
service that is trusted by all communities (Van Niekerk and Ludman 1999: 273-276). It
can be argued that such a challenge demands central guidance.
With regard to wetfore the comparison does not generate an answer as to where the budg
eting function for social entitlements should be located. This analysis noted three possi
ble developments: reflecting welfare grants in the budget vote of the national depart
ment, "top-slicing" the cost for such entitlements before revenue-sharing, or giving
provinces greater autonomy in determining welfare entitlements. Whichever option is
chosen, it is recommended that budgeted amounts be fully aligned with expenditure re
quirements according to cleaned-up beneficiary data.
97
Stellenbosch University https://scholar.sun.ac.za

It is on the revenue side that the most fundamental difference must be noted, as tax as
signment remains centralised. The political accountability of provincial governments is
hampered in the current situation. The provinces cannot finance their own priorities
through additional taxation, for which a provincial authority would be accountable to it~
electorate. Rapoo (1995: 13-14) points out that an arrangement without effective provin
cial taxation powers "creates a situation not unlike that in the former 'homelands' system
in which, because allocations are decided by the centre, provinces are not responsible to
their electorates for spending - shortfalls can simply be blamed on central government."
Table 30: Revenue Assignment in Theory and in South Mrica Theoretical framework SouthMrica
DeterminrJtion f!! Revenue source Base Rate Collection and
administration Customs N N N Corporate income N N N Natural resources N N N VAT N N N Personal income N N, R N Retail sales R R, L R, L or N R N
DeterminrJtion of Base Rate
N N N N N N
N N N N
N,R* N
Collection and administration
N N N N N N
Property R L L N, L L L Fees, user charges N, R, L N, R, L N, R, L N, R, L N, R, L N, R, L Excises R, L R, L R, L N N N Source: Theoretical framework adapted from Shah (1994a: Table 1.4 and 1994b: Table 6). South African data according to the Constitution of the Republic of South Africa (1996), sections 228 and 229. Notes: N = national government, R = regional government, L = local government * Provincial taxation powers are not effective yet, as national regulatory legislation is required (section 228 (2) (b)). This legislation is still outstanding at the time of writing.
The importance of intergovernmental transfers and grants for provinces and poor and smaller
local authorities is substantial. An assessment of the South African system, based on the
theoretical criteria that were outlined, is somewhat more subjective than the questions of
assignment discussed above. Adequacy, predictability and incentive are the problem areas
that were identified in this analysis. Whether the system provides adequate income to the
spheres is difficult to assess, since the rationale behind the vertical division of revenue is
not obvious and there is a lack of information as to how it was calculated. However,
provincial allocations have been decreasing, while local government allocations reflect
historical resource flows despite a broadening of mandates. This issue deserves further
research. Predicta.biliry has been hampered by successive changes to the criteria guiding the
horizontal distribution of the provincial equitable share. Incentives for sound financial
management at the provincial and local levels will remain weak as long as the respective
98
Stellenbosch University https://scholar.sun.ac.za

formulas for the horizontal distribution do not emphasise revenue criteria, which dis
courages efforts to increase own revenues and hampers accountability.
Table 31: Proposed Rating of Intergovernmental Transfers and Grants in South Mrica Criteria South Mrican Comments
Rating Auton0"!Y Medium.
Revenue Adequary Low.
Equity
Predictability
Efficienry
Simplicity
Incentive
High.
Potentially high, but so far low in practice.
Medium.
Medium to high.
Low.
Provincial equitable share to provinces is unconditional, but detailed norms and standards are imposed by national legislation.
Rationale behind the vertical division of revenue is not obvious. Provincial allocations have been decreasing, while local government allocations reflect historical resource Bows.
Formulas for the horizontal distribution of the provincial and local government shares are needs-driven and favour poor areas.
Formula-approach for horizontal distributions is more predictable than ad hoc allocations. Successive changes to the criteria guiding the horizontal distribution of the provincial equitable share have been partially due to the incorporation of new data.
Allocations are overwhelmingly unconditional, which enables spending patterns to reBect varying needs. However, very detailed national norms and standards limit room for provincial
~. expenditure prioritisation.
New component in provincial horizontal formula and related adjustments make formula more complex.
Formulas do not emphasise revenue criteria, which discourages efforts to increase own revenues and hampers accountability.
Safeguard of gran- Medium to Detailed norms and standards imposed on provinces through tor's objectives strong. national legislation. Source: Criteria in column one according to Shah (1994a: 33-34).
While economic theory may not be useful to determine a specific design for regulating
subnational borrowing activities, it nonetheless indicates that subnational borrowing is rec
ommended to fmance capital expenditure. The South African Constitution applies the
so-called "golden rule" by restricting provincial and local borrowing to amounts neces
sary to finance capital projects (apart from bridging purposes). The borrowing powers of
provinces, however, have not been functional so far. Effective provincial borrowing is
necessary to boost dwindling capital expenditure at this level, in order to address back
logs and extend service provision to all communities. While local governments in South
Africa engage in borrowing activities, it can be hoped that redemarcation will be able to
facilitate a more even access to the capital market.
99
Stellenbosch University https://scholar.sun.ac.za

In summary, on the expenditure side, there is substantial congruence between what is
theoretically desirable and what the Constitution permits~ In the medium to long-term,
once transitional challenges have been overcome, there are arguments in favour of
greater provincial and local responsibility in areas that have primarily local benefits.
Revenue assignment, on the other hand, remains centralised although the theoretical
framework indicates a number of sources that are suitable for provincial governments.
The provincial taxation powers contained in the Constitution should be implemented to
establish the link between expenditure and revenue that forms the basis of public fi
nance. The current system of intergovernmental transfers and grants has achieved sub
stantial equity. Further developments should be concerned with ensuring revenue ade
quacy for all spheres and providing incentives for sound financial management, while
maximising the predictability inherent in the formula approach by avoiding year-on-year
adaptations. The borrowing powers of provinces contained in the Constitution need to
be activated to enable a greater focus on developmental expenditures.
This analysis indicates that the constitutional assignment of functions and resources as
such cannot be blamed for a lack of governmental efficacy that has been experienced,
and should be fully implemented. However, the analysis of the South African system
pointed out several areas that hav~e impeded the smooth running of the governmental
system. It remains to be discussed how these problems can be addressed.
Corruption. Corruption is partially linked to procurement procedures, which are multiplied
at subnationallevel. It has also been described as an overhang from the previous dispen
sation, indicating that it is not inherently related to decentralisation. Clear procurement
procedures and vigorous prosecution seem best suited to address this problem.
Capacity. The rural and underdeveloped provinces in some instances had to amalgamate
several formerly separate administrations into one new provincial administration. Simi
larly, many newly created local authorities could not rely on an established service struc
ture. However, even if services were centralised, administration would rely on the same
public servants and their bureaucratic infrastructure. Rather, a drastic lack of capacity in
some instance might be resolved by a temporary asymmetrical approach, in line with the
Constitution (sections 41(1), 100, 125(3), 139 and 155(6)). As the Presidential Review
. Commission (1998: 44) recommended: "5 en'ous consideration should be given to the asymmetn·cal
100
Stellenbosch University https://scholar.sun.ac.za
devolution offunctions [emphasis in the original] (i.e. the devolution of some of the functions
to provinces and municipalities where there is capacity to undertake services rather than
delaying such devolution until there is capacity overall) as has been proposed by the De
partment of Housing. This could go some way to redress problems of capacity violating
the provisions of the Constitution." However, the notion of co-operative government as
a partnership between the spheres requires that any short-term interventions are ulti
mately aimed at restoring the capacity of the authority in question to effectively comply
with its executive obligations.
Mandates. The Ncholo Report noted that national departments tended to assume that
their policy would automatically become activity. More careful planning and the costing
of mandates would strengthen the ability of the provinces to implement national stan
dards. The NCOP is well-placed to consider the administrative and financial impact on
provinces of mandates contained in national legislation. This role should be developed,
for instance by enhancing the research capacity of the council. Rather than reducing
provinces to "conveyor belts for the centre" (Friedman 1999: 46), a greater degree of
flexibility through less detailed norms and standards could also enable provinces to set
individually suitable and realistic targets.
Personnel Expenditure. Rising personnel expenditure ratios across provinces threaten to
undermine their developmental ability by squeezing out developmental expenditure. The
ability of provinces to control their personnel expenditure, however, is highly limited due
to the centralised wage bargaininll process and the continued absence of an affordable
retrenchment tool. Provinces require a national policy on retrenchments, or they need to
be empowered to design their own. Consideration should also be given to the possibility
of decentralising the wage bargaining process for public servants.
None of these problem areas are systemic; they are not inherently connected to the de
sign of intergovernmental fiscal relations, and there is no evidence to suggest that they
could be addressed by adjustments to the assignment of functions and resources.
In conclusion, economic theory indicates that the constitutional assignment of responsi
bilities and resources to the different spheres in South Africa should not be adjusted for
the sake of greater efficiency. However, the challenge remains to implement the system
101
Stellenbosch University https://scholar.sun.ac.za
fully and properly, identify areas of concern, and to manage teething problems and tran
sitional difficulties proactively. Decentralisation includes a learning process, and newly
created structures and institutions need to be developed and strengthened before they
can be expected to deliver the full. benefits of decentralised government.
102
Stellenbosch University https://scholar.sun.ac.za
BIBLIOGRAPHY
a) literauure
Abedian, Iraj, Tania Ajarn and Laura Walker 1997: Promises, Plans, Priorities. South Africa's
Emerging Fiscal Structures, Cape Town (Idasa: Budget Infonnation Service).
African National Congress 1994: The Reconstruction and Development Programme, Johannes
burg (Umanyano Publications). ~
Ahmad, Ehtisharn and Jon Craig 1997: Intergovernmental Transfers; in: Teresa Ter
Minassian (ed.): Fiscal Federalism in Theory and Practice, Washington (International Monetary
Fund): 73-107.
Ahmad, Ehtisharn, Daniel Hewitt and Edgardo Ruggiero 1997: Assigning Expenditure
Responsibilities; in: Teresa Ter-Minassian (ed.): Fiscal Federalism in Theory and Practice,
Washington (International Monetary Fund): 25-48.
Ahmad, Junaid 1996: The Structure of Urban Governance in South African Cities, Inter-~.
national Tax and Public Finance Vol. 3: 193-213.
Ajarn, Tania 1997: StucJy on the National and Provincial Budget Processes (prepared for the
Presidential Review Commission on Public Sector Refonn, 22 October).
Ajarn, Tania 1998: NCOP challenged to make bigger impact on Budget; in: Budget Watch
Vol. 4 Issue 2 Gune): 2.
Banting, Keith G. and Richard Simeon (eds) 1985: Redesigning the State: The Politics of Con
stitutional Change, Toronto (University of Toronto Press).
Barberton, Conrad 1998: PSC's vision of social security short-sighted; in: Budget Watch
Vol. 4 Issue 2 Gune): 4.
103
Stellenbosch University https://scholar.sun.ac.za

Besdziek, Dirk 1998: Provincial Government, in: Albert Venter (ed.): Government and Poli
tics in the New South Africa, Pretoria O. L. van Schaik): 147-192.
Bhabha, Mohammed 1997: The Role of Local Government in the National Council of Provinces
(paper presented at Idasa, Cape Town, 22 July).
Biehl, Dieter 1994: Intergovernmen.tal Fiscal Relations and Macroeconomic Management
- Possible Lessons from a Federal Case: Germany; in: S. P. Gupta et al (eds): Inte~overn
mental Fiscal Relations and Macroeconomic Management in La~e Countries, New Delhi etc. (Al
lied Publishers): 68-115.
Bird, Richard M. 1993: Threading the Fiscal Labyrinth: Some Issues in Fiscal Decentrali
zation; in: National Tax Journal Vol. XLVI No.2 Oune): 207-227.
Bird, Richard M. and Duan-jie Chen 1998: Federal finance and fiscal federalism: the two
worlds of Canadian public finance; in: Canadian Public Administration Vol. 41 No.1: 51-74.
Bramley, Glen 1990: Equalization Grants and Local Expenditure Needs. The Price of Equality,
Aldershot etc. (Avebury).
Brosio, Giorgio and Sanjeev Gupta 1997: Ethiopia; in: Teresa Ter-Minassian (ed.): Fiscal
Federalism in Theory and Practice, Washington (International Monetary Fund): 504-526.
Bulpitt, Jim 1996: Federalism; in: lain McLean (ed.): Oxford Concise Dictionary of Politics, ~
Oxford (Oxford University Press): 179-180.
Bundesministerium der Finanzen 1996: Das Haushaltsrystem der Bundesrcpublik Deutschland,
Bonn.
Bundesministerium der Finanzen 1997: FinanfPolitikfiir die Deutsche Einheit. Fakten, Bonn.
Bundesministerium der Finanzen 1998: Die Finanzverteilung in der Bundesrcpublik Deutsch-
land, Bonn. "
104
Stellenbosch University https://scholar.sun.ac.za
Burgess, Michael and Alain-G. Gagnon 1993 (eds): Comparative Federalism and Federation.
Competing Traditions and Future Directions, New York etc. (Harvester Wheatsheaf).
Burgess, Michael and Franz Gress 1993: The Quest for a Federal Future: Gennan Unity
and European Union; in: Michael Burgess and Alain-G. Gagnon (eds): Comparative Feder
alism and Federation. Competing Traditions and Future Directions, New York etc. (Harvester
Wheatsheaf): 168-186.
Cameron, Robert 1996: Local Government Boundary Demarcation: The Case of the
Western Cape Metropolitan Area Substructures; in: Politiko"n Vol. 23 No.1: 21-42.
Campbell, Tim et a11991: Decentralization to Local Government in LA.C: National Strategies and
Local Response in Planning, Spending and Management, Washington D.C. (World Bank).
Cape Metropolitan Council et a11997: Towards E.ffective Metropolitan Governance for the Cape
Metropolitan Area (submission from local government in the Cape metropolitan area at
public hearings in Parliament on metropolitan government and the Green Paper, 3 No
vember, Cape Town).
Cashin, Paul and Ratna Sahay 1995: Internal Migration, Center-State Grants and Eco
nomic Growth in the States ofIndia, IMP Working Paper 95/58 (August).
Chelliah, Raja J. 1994: Intergovernmental Fiscal Relations and Macroeconomic Manage
ment in India; in: S. P. Gupta et al (eds): Intergovernmental Fiscal Relations and Macroeconomic
Management in Large Countries, New Delhi etc. (Allied Publishers): 188-212.
Cherry, Janet 1994: Development, Conflict and the Politics of Ethnicity in South Africa's
Transition to Democracy; in: Third WorldQuarter!J Vol. 15 No.4: 613-631. ~
Chothia, Farouk 1998: Now is the time to be nice to your rivals; in: Business Dqy, 29 April.
Christopher, A. J. 1994: The Atlas of Apartheid, Johannesburg (Witwatersrand University
Press).
105
Stellenbosch University https://scholar.sun.ac.za
~
Commission of Inquiry into certain Aspects of the Tax Structure of South Africa 1998:
Seventh Interim Report of the Commission of Inquiry into certain Aspeas of the Tax Structure of South
Africa. Synthesis ofPoliry Recommendations with regard to Provincial Taxation, 14 July, Johannes
burg.
Committee Appointed by the Minister for Safety and Security 1997: Report of the Committee
Appointed l?Y the Minister for Safety and Security on Decentralisation of Policing Functions, Devolution
of Political Authority, Municipal and Metropolitan Policing, and Civilian / Political Oversight, 31
May.
Constitutional Assembly (Theme~Committee 3: Relationship between levels of govern
ment) 1995: Memorandum on Federalism (Revised Version by D. M. Davis), 27 March.
Cotler, Irwin 1996: Can the Center Hoid? Federalism and Rights in Canada; in: Ellis Katz
and G. Alan Tarr (eds): Federalism and Rights, London (Rowman & Littlefield Publishers):
173-191.
Craig, Jon 1997: Australia; in: Teresa Ter-Minassian (ed.): Fiscal Federalism in Theory and
Practice, Washington (International Monetary Fund): 175-200.
Craig, Jon, John Norregaard and George Tsibouris 1997: Russian Federation; in: Teresa
Ter-Minassian (ed.): Fiscal Federalrsm in Theory and Practice, Washington (International
Monetary Fund): 680-701.
Cullinan, Kerry 1999: A Tale of Two Towns; in: S!yqya! Issue 4 (Autumn), Idasa (Cape
Town): 4-9.
De Villiers, Bertus (ed.) 1994a: Birth of a Constitution, Kenwyn auta).
De Villiers, Bertus 1994b: Intergovernmental Relations: A Constitutional Framework; in:
Bertus de Villiers (ed.): Birth of a Constitution, Kenwyn auta): 256- 280.
De Villiers, Bertus 1997a: Local-Provincial Relations: A Comparative Perspective, Kfmrad
Adenauer Foundation Occasional Paper (May),Johannesburg (Konrad Adenauer Foundation).
106
Stellenbosch University https://scholar.sun.ac.za
De Villiers, Bertus 1997b: Intergovernmental Relations in South Africa; in: South African
Public Law Vol. 12: 197-213.
Department of Constitutional Development (various issues): Project Viability Report, Pre
toria.
Department of Constitutional Development 1999: Strategic IJSues and Options for Poliry on
Co-operative Government and Intergovernmental Relations (second draft of a discussion docu
ment prepared for the Conference on Intergovernmental Relations and Provincial Gov
ernment: Fostering Mutual Co-operation, 29 and 30 March, Gallagher Estate, Midrand).
Department of Finance 1997a: Budget Review 1997, Pretoria.
Department of Finance 1997b: Medium Term Budget Poliry Statement, 2 December, Pretoria.
Department of Finance 1998a: Budget Review 1998, Pretoria.
Department of Finance 1998b: The Introduction of an Equitable Share ofNational(y RDised
Revenue for Local Government, 21 April, Pretoria.
Department of Finance 1998c: Medium Term Budget Poliry Statement, 2 November, Pretoria.
Department of Finance 1999: Budget Review 1999, 17 February, Pretoria.
Department of Provincial Affairs~and Constitutional Development and Department of
Finance 1997: The present state of municipal finance, and actions taken E!Y government to address the
situation (memorandum, 18 March).
Deutsches Institut fur Wirtschaftsforschung 1996: Sind die Finanzprobleme in Ost
deutschland durch die Neuordung des Finanzausgleichs gelost?, DIW Wochenbericht Vol.
69 No. 17.
107
Stellenbosch University https://scholar.sun.ac.za
Dollery, Brian 1998: An Initial Evaluation of Revenue-Sharing Arrangements in the New
South African Fiscal Federalism; in: Publius Vol. 28 No.2: 129-153.
Donian, Colin and Colleen Rip-Botha 1997: Census results impact on policy and budg
eting; in: Budget Watch Vol. 3 Issue 3 (September): 5.
Elazar, Daniel J. 1991 (ed.): Federal Systems of the World: A Handbook ofFedera4 Co1!federa4
and Autonomy Arrangements, Harlow (Longman Current Affairs). ~
Elazar, Daniel J. 1995: Federalism: An Overview, Federalism Theory and Application Vol. 1,
Pretoria (Human Sciences Research Council).
Financial and Fiscal Commission 1995: Framework Document for Intergovernmental Fiscal Re
lations in South Africa, May, Midrand.
Financial and Fiscal Commission 1996: The Financial and Fiscal Commission's Recommenda
tions for the Allocation of Financial Resources to the National and Provincial Governments for the
1997/98 Financial Year, May, Midrand.
Financial and Fiscal Commission 1997: Local Government in a System of Intergovernmental Fis
cal Relations in South Africa. A Discussion Document, 25 July, Midrand.
Financial and Fiscal Commission 1998a: Recommendations & Comments - The Allocation of Financial Resources to Nationa4 Provincial and Local Governments for the 1998/99 Fiscal Year,
Submitted in Terms of Section 9 of the Intergovernmental Fiscal Relations Act, 1997, 9 January,
Midrand.
Financial and Fiscal Commission 1998b: Should social security grants be the jurisdiction of the
national or provincial government? (draft report, 9 December).
Financial and Fiscal Commission 1999: Terms of Reference for Project 2001. FFC Formula De
velopment for the 2001/02 and Subsequent Fiscal Years (draft, 7 April).
108
Stellenbosch University https://scholar.sun.ac.za
Fitschen, Amanda 1999: What's good for provincial welfare?; in: Mail & Guardian, 5
March.
F6lscher, Alta 1999: Provincial borrowing framework under review; in: Budget Watch
Oune): 2-3.
Franks, Darwin 1998: A Report to the NCOP (case study of the intervention by the East
ern Cape Provincial Government in Butterworth Municipality, presented to the National
Council of Provinces on 27 September).
Friedman, Steven 1999: Power to the Provinces!; in: S&~a!Issue 4 (Autumn), Idasa
(Cape Town): 44-46.
Fiihr, Christoph 1997: The German Education System since 1945. Outlines and Problems, Bonn
(Inter Nationes).
Gildenhuys, J. S. H. 1997: Introduction to Local Government Finance. A South African Perspec
tive, Pretoria O. L. van Schaik).
Government of Canada 191)1): A Framework to Improve the Social Union for Canadians
(agreement between the Government of Canada and the Governments of the Provinces
and Territories, 4 February).
Gray, Cheryl W. and Daniel Kaufmann 1998: Corruption and Development; in: Finance
and Development Vol. 35 No.1 (March).
Gray, Gwen and Rodney F. White 1989: Federalism and the Evolution of Public Hospi
tal and Medical Coverage; in: Hodgins, Bruce W. et al (eds): Federalism in Canada and Aus
tralia. Historical Perspectives 1920-88, Peterborough / Canada (Frost Centre for Canadian
Heritage and Development Studies): 279-300.
Griggs, Richard 1997: Voting makes a lot more sense; in: Mail & Guardian, 25 July.·
109
Stellenbosch University https://scholar.sun.ac.za
Gullo, Theresa A. and Janet M. Kelley 1998, Federal Unfunded Mandate Reform: A
First-Year Retrospective; in: Public Administration Review Vol. 58 No.5: 379-387.
Gupta, S. P. et al (eds) 1994: Intergovernmental Fiscal Relations and Macroeconomic Management
in Large Countries, New Delhi etc. (Allied Publishers).
Hartzenberg, Trudi 1995: Clarity needed for function committees; in: Budget Watch Vol. 1
Issue 5 (December): 4.
Hemming, Richard, Neven Mates and Barry Potter 1997: India; in: Teresa Ter-Minassian
(ed.): Fiscal Federalism in Theory and Practice, Washington (International Monetary Fund):
527-539.
Hesse, Joachim J ens and Thomas Ellwein 1992: Das Regierungssystem der Bundesrepublik
Deutschland (71ft edition), Opladen (Westdeutscher Verlag).
Hesse, Joachim Jens and Thomas Ellwein 1997: Das Regierungssystem der Bundesrepublik
Deutschland (81ft edition), Opladen (Westdeutscher Verlag).
Hesse, Konrad 1962: Der unitarische Bundesstaat, Karlsruhe (C.F. Muller).
Heyns, J. v. d. S. 1995: Equity and Redistribution in South Africa. Some Fiscal Federal
ism Perspectives; in: South African Journal of Economics Vol. 63 No.2: 150-172.
Hobson, Paul A. R. and France St-Hilaire 1993: Towards sustainable federalism: reformingfed
eralprovincialfiscal arrangements, Montreal (Institute for Research on Public Policy).
Hodgins, Bruce W. et al (eds) 1989: Federalism in Canada and Australia. Historical Perspectives
1920-88, Peterborough / Canada (Frost Centre for Canadian Heritage and Development
Studies).
Hopley, Henry 1998: An Overview of the 1998/99 Northern Cape Provincial Budget, Cape
Town (Idasa: Budget Information Service).
110
Stellenbosch University https://scholar.sun.ac.za

Horowitz, D. L. 1991: A Democratic South Africa? Constitutional Engineering in a Divided Soci
ery, Berkeley (University of California Press).
Inkatha Freedom Party et a11993: Joint submission of the Inkatha Freedom Parry, the kwaZulu
government, the Afrikaner Volksunie, the Conseroative Parry, the Bophuthatswana government and the
Ciskei government to the Technical Committee on Constitutional Matters and to the Negotiating Coun
cilon a process of traniformation capable of establishing, amongst others, fideralism, 28 June.
Inkatha Freedom Party 1998: Amendments to the Constitution of the Republic of South Africa
Proposed by the Inkatha Freedom Parfy.
International Monetary Fund (annually): Government Finance Statistics Yearbook, Washington
D.C. (International Monetary Fund).
Isensee, Josef 1968: S ubsidiaritatspriniJp und Verfassungsrecht. Eine S tudie iiber das Regulativ des
Verhaltnisses von Staat und Gesellschaft (Schriften zum Offentlichen Recht, Band 80), Berlin
(Duncker & Humblot) ..
Ismail, Nazeem and Chisepo J. J. Mphaisha 1997: The Final Constitution of South M
rica: Local Government Provisio~s and their Implications, Konrad Adenauer Foundation
Occasional Paper Ganuary), Johannesburg (Konrad Adenauer Foundation).
Kendle, John 1997: Federal Britain. A History, London (Routledge).
Klitgaard, Robert 1998: International Cooperation Against Corruption; in: Finance and
Development Vol. 35 No.1 (March).
Krafchik, Warren and Joachim Wehner 1998a:Confusion over NCOP's role in process;
in: Budget Watch Vol. 4 Issue 2 Gune): 3.
Krafchik, ~arren and Joachim Wehner 1998b: The Role of Parliament in the Budgetary
Process; in: South African Journal of Economics Vol. 66 No.4: 512-541.
111
Stellenbosch University https://scholar.sun.ac.za
Krelove, Russel, Janet G. Stotsky and Charles L. Vehorn 1997: Canada; in: Teresa Ter
Minassian (ed.): Fiscal Federalism in Theory and Praaice, Washington (International Monetary
Fund): 201-225.
Kriek, Dan J. 1994: The new form of state in South Mrica: a true federation?; in: Politeia
Vol. 13 No.1: 118-120.
Kriek, Dan J. 1996: Unie of federasie?; in: Politeia Vol. 15 No.2: 62-64.
Ladd, Helen F. and John Yinger 1994: The Case for Equaliszing Aid; in: National Tax
Jou17lalVol. XLVII No.1: 211-224.
Laufer, Heinz and Ursula Munch 1997: Das flderative System der Budesrepublik Deutschland,
Bonn (Bundeszentrale fUr politis;he Bildung).
Leslie, Peter M. 1988: National Citizenship and Provincial Communities: A Review of
Canadian Fiscal Federalism, Research Paper No. 23, Kingston / Ontario (Queen's Univer
sity: Institute of Intergovernmental Relations).
Lodge, Tom 1995: The South African General Election, April 1994: Results, Analysis
and Implications; in: African Affairs Vol. 94: 471-500.
Lodge, Tom 1999: South African Politics Since 1994, Cape Town (David Philip Publishers).
MacGregor, John, Stephen Peterson and Claudio Schuftan 1998: Downsizing the civil
service in developing countries: the golden handshake option revisited; in: Public Admini
stration and Development Vol. 18 No.1: 61-76.
Makhanya, Mosila David 1998: An Overview of the 1998/99 Free State Provincial Budget, Cape
Town (Idasa: Budget Information Service).
Mashabela, Harry 1990: Mekhukhu. Urban African Cities of the Future, Johannesburg (South
African Institute of Race Relations).
112
Stellenbosch University https://scholar.sun.ac.za
Mattes, Robert 1995: The Election Book. Judgement and Choice in South Africa's 1994 Election,
Cape Town (Idasa: Public Opinion Service).
Mbeki, Thabo 1999: Kvmote Address (paper presented at the Conference on Intergovern
mental Relations and Provincial Government: Fostering Mutual Co-operation, 29 March,
Gallagher Estate, Midrand).
McCarthy, Jeff 1993: Factual Context to Political Competition; in: Development and Democ
raD': The Regional Question, 5 July, Johannesburg (Urban Foundation): 39-49.
McLure, Charles E. Jr. 1994: Intergovernmental Fiscal Relations in South Africa: The Assignment
of Expenditure Functions and Revenue Sources and the Design of Intergovernmental Grants and
Transfers, June 20 (World Bank discussion document).
Milne, David 1993: Whither Canadian Federalism? Alternative Constitutional Futures; in:
Michael Burgess and Alain-G. Gagnon (eds): Comparative Federalism and Federation. Com
peting Traditions and Future Directions, New York etc. (Harvester Wheatsheaf): 203-226.
Ministry for Provincial Affairs and Constitutional Development 1997: Green Paper on Lo
cal Government, October, Pretoria.
Ministry for Provincial Affairs and Constitutional Development 1998a: White Paper on
Local Government, March, Pretoria.
Ministry for the Public Service and Administration 1997: The Provincial Review Report,
Pretoria.
Mokgoro, Job 1994: Interprovincial Fiscal Equalization: The Role of the Financial and
Fiscal Commission; in: Bertus de Villiers (ed.): Birth of a Constitution, Kenwyn Guta): 281-
293.
Msimango, Luvuyo 1998: An Overview "0/ the 1998/99 Eastern Cape Provincial Budget, Cape
Town (Idasa: Budget Information Service).
113
Stellenbosch University https://scholar.sun.ac.za
Murray, Christina 1998: NCOP offers provinces role in Budget process; in: Budget Watch
Vol. 4 Issue 2 Qune): 1.
Murray, Christina and Richard Simeon 1998: From paper to practice: the National Council 0/ Provinces crfter its first year (unpublished paper).
Musgrave, R. A. 1959: The Theory o/Public Finance. A Stuc!Y in Public Economy, New York
(McGraw-Hill).
Nathan, Richard P. and Margarita M. Balmaceda: Comparing Federal Systems of Gov
ernment; in: Robert J. Bennett (ed.): Decentralization, UJcal Governments, and Markets. To
wards a Post-Welfare Agenda, Oxford (Clarendon Press): 59-77.
National Council of Provinces 1998: NeOp News. Newsletter 0/ the National Council o/Prov
inces (March), Cape Town.
National Council of Provinces 1999a: National Council o/Provinces 1996-1999 in Review,
CapeTown.
National Council of Provinces 1999b: The Imperative 0/ Co-operative Governance. Report 0/ the
National Council o/Provinces. National Conference 0/8-9 Mqy 1998, Cape Town.
National Council of Provinces 1999c: Provincial Comparative Stuc!Y. Report o/the National
Councilo/Provinces, Cape Town.
Newham, Gareth 1997: Legislature battles the budget; in: Provincial Whip, 11 August: 2-3.
Newton, Michael T. 1997: Institutions o/Modern Spain. A Political and Economic Guide, Cam
bridge (Cambridge University Press).
Norregaard, John 1997: Tax Assignment; in: Teresa Ter-Minassian (ed.): Fiscal Federalism
in Theory and Practice, Washington.(Intemational Monetary Fund): 49-72.
114
Stellenbosch University https://scholar.sun.ac.za

O'Malley, Kierin 1994: The interim constitution: a figleaf for federalism?; in: Politeia Vol.
13 No.1: 121-123.
Oates, Wallace E. 1993 (first published in 1972): Fiscal Federalism, Aldershot (Gregg Re
vivals).
Oates, Wallace E. 1994: Federalism and Government Finance; in: John M. Quigley and
Eugene Smolensky (eds): Moc/ern Public Finance, Cambridge, Massachusetts (Harvard Uni
versity Press): 126-151.
Oliveira, Joao do Carmo and Raul Velloso 1994: Intergovernmental Fiscal Relations in
Brazil. Trends and Issues; in: S. P. Gupta et al (eds): InteTl,overnmental Fiscal Relations and
Macroeconomic Management in La'l!,e Countries, New Delhi etc. (Allied Publishers): 122-187.
Pablos, Nicolas Pineda 1997: Fiscal Decentralization in Brazil; in: Policymaking in a Re
democratized Brazil, Poliry Research Report No. 119, Austin (University of Texas: Lyndon
B. Johnson School of Public Affairs).
Presiden tial Review Commission 1998: Developing a Culture of Good Governance. Report of the
Presidential Review Commission on the Reform and Transformation of the Public Service in South Af
rica. Presented to the President of South Africa, Mr. N. R Mandela, 27 February, Pretoria.
Prud'homme, Remy 1995: The Dangers of Decentralization; in: World Bank Research Ob
seroerVoi. 10 No.2 (August): 201-220.
Ramatlhodi, Ngoako 1998: Fresh look at levels of government needed; in: Business Dqy,
11 May.
Randall, Duncan J. 1998: The 1996 Municipal Elections in KwaZulu-Natal: An Eyewit
ness Account; in: Politikon Vol. 25 No.1: 103-128.
Rao, M. Govinda and Francois Vaillancourt 1994: Interstate Tax Disharmony in Iridia: A
Comparative Perspective; in: Publius Vol. 24 No.4: 99-114.
115
Stellenbosch University https://scholar.sun.ac.za
Rapoo, Thabo 1995: A System in Dispute: Provincial Government in Practice, Polity: Is
sues and Actorr Vol. 8 No. 10 (September), Johannesburg (Centre for Policy Studies).
Reddy, P.S. (ed.) 1996: Readings in Local Government Management and Development. A Southern
African Perspective, Kenwyn Outa).
Rudzio, Wolfgang 1991: Das Politische System der Bundesrepublik Deutschland, Opladen (Leske
und Budrich). ..,
Saunders, Cheryl 1995: Constitutional Arrangements in Federal Systems; in: Publius Vol.
25 No.2: 61-79.
Scharpf, Fritz W. 1988: The Joint-Decision Trap: Lessons from German Federalism and
European Integration; in: Public Administration Vol. 66 (Autumn): 239-278.
Schultze, Rainer-Olaf 1996: Foderalismus; in: Dieter Nohlen (ed.): Worterbuch Staat und
Politik, Bonn (Bundeszentrale fur politische Bildung): 155-164.
Sehurutshe, "Scrooge" Otsile Wa Ga and Gerrick Newham 1998: The National Council
of Provinces: Realising the potential; in: Provincial Whip, 22 January: 4-5.
Shah, Anwar 1994a: Perspectives on the Design of Intergovernmental Fiscal Relations in
Developing Transition Economies; in: S. P. Gupta et al (eds): Intergovernmental Fiscal Rela
tions and Macroeconomic Management in Large Countries, New Delhi etc. (Allied Publishers): 1-
68.
Shah, Anwar 1994b: The Reform of Intergovernmental Fiscal Relations in Developing
and Emerging Market Economies, Polity and Research Series No. 23, Washington (World
Bank).
Siebrits, F. K. 1997: The South African Government: Financial Relations, Expenditure
and Employment, Report No. 239, Pretoria (Bureau of Market Research).
116
Stellenbosch University https://scholar.sun.ac.za

Simeon, Richard 1972: FederalproJi,ncial diplomafY: the making of recent polifY in Canada, To
ronto (University of Toronto Press).
Simeon, Richard 1998: Considerations on the design of federations: the South African
constitution in comparative perspective; in: South African Public LAw Vol. 13: 42-71.
Simeon, Richard and Ian Robinson 1990: State, S ociery, and the Development of Canadian Fed
eralism, Toronto (University of Toronto Press).
Simkins, Charles 1997: Reconciling Equity and Diversity. Provincial Budgets in Perspec
tive; in: Budget Watch Vol. 3 No.2 Gune): 1.
Simon, David 1996: Restructuring the Local State in Post-Apartheid Cities: Namibian
Experience and Lessons for South Afnca; in: African Affairs Vol. 95 No. 379: 51-84.
Sindane, Jabu 1997: Discussion Paper on the Future of South African Politics; in: Hennie
Kotze (ed.): A Future South Africa? Prospeas for 1999 and B,!),ond, Stellenbosch (University
of Stellenbosch: Centre for International and Comparative Politics): 219-222.
Smith, Graham (ed.) 1995: Federalism: The Multiethnic Challenge, New York (Longman Pub
lishing).
Solomon, David 1998: Local Government in South Africa: Challenges and Solutions, Cape Town
(Idasa: Budget Information Service).
South African Local Government Association (Finance Working Group) 1998: Workshop
on the equitable share of nationallY raised revenue for local government, 17 August (summary docu
ment).
Southall, Roger 1994: The South African Elections of 1994: the Remaking of a Domi
nant-Party State; in: Journal of Modern African Studies Vol. 32 No.4: 629-655.
117
Stellenbosch University https://scholar.sun.ac.za

Spahn, Paul Bernard 1995: Local Taxation: Principles and Scope; in: J. Roy (ed.): Macro
economic Management and Fiscal Decentralisation, EDI Seminar Series, Washington (World
Bank).
Spahn, Paul Bernard and Wolfgang Fottinger 1997: Germany; in: Teresa Ter-Minassian
(ed.): Fiscal Federalism in Theory and Practice, Washington (International Monetary Fund):
226-248.
Sparks, Allister 1994: Tomorrow is Another Country. The Inside Story of South Africa's Negotiated
Revolution, Sandton (Struik Book Distributors).
Statistics South Africa 1998: The People of South Africa Population Census, 1996. Census in
Briif, Report No. 03-01-11 (1996), Pretoria.
Steyn, Glen 1998: An Overview of the 1998/99 Northern Province Provincial Budget, Cape Town
(Idasa: Budget Information Service).
Stotsky, Janet G. and Emil M. Sunley 1997: United States; in: Teresa Ter-Minassian (ed.):
Fiscal Federalism in Theory and Practice, Washington (International Monetary Fund): 359-
383.
Stuart, John 1997: Efficiency in the South African Public Sector: Fundamental Issues and
Lessons, Discussion Paper No. 17 (October), Cape Town (University of Cape Town:
Budget Project).
Tanzi, Vito 1996: Fiscal Federalis~ and Decentralization: A Review of Some Efficiency
and Macroeconomic Aspects; in: Michael Bruno and Boris Pleskovic (eds): Annual World
Bank Cotiference on Development Economics 1995, Washington D.C. (World Bank): 295-316.
Tapscott, Chris 1996: The Institutionalisation of Rural Local Government in Post
Apartheid South Africa; in: Konrad Adenauer Foundation Occasional Paper (November), Jo
hannesburg (Konrad Adenauer Foundation): 13-22.
118
Stellenbosch University https://scholar.sun.ac.za

Tapscott, Chris 1998: Intergovernmental Relations in South Africa - A Comparative
Analysis; in: Department of Constitutional Development and Provincial Affairs (ed.):
Intergovernmental Relations. An International Comparative Stutfy, Pretoria: 9-28.
Ter-Minassian, Teresa (ed.) 1997a: Fiscal Federalism in Theory and Pradice, Washington (In
ternational Monetary Fund).
Ter-Minassian, Teresa 1997b: Brazil; in: Teresa Ter-Minassian (ed.): Fiscal Federalism in
Theory and Pradice, Washington (International Monetary Fund): 438-457.
Ter-Minassian, Teresa and Jon Craig 1997: Control of Sub-National Government Bor
rowing; in: Teresa Ter-Minassian (ed.): Fiscal Federalism in Theory and Practice, Washington
(International Monetary Fund): 156-172.
Urban Foundation (Development Strategy and Policy Unit) 1993: Development and Democ
rary: The Regional Question, 5 July, Johannesburg (Urban Foundation).
Van den Heever, Alex 1998: Conditional Grants for Health: With a Special Emphasis on the
Central Hospital and Teaching and Research Grants (draft report submitted to the Financial
and Fiscal Commission).
Van der Merwe, Fanus and LaretteJansen van Rensburg 1998: An Overview of the 1998/99
Northwest Province Budget, Cape Town (Idasa: Budget Information Service).
Van Heerden, Reinett 1997: Lack of skills hampers NCOP; in: Provincial Whip, 11 August:
2.
Van Niekerk, Phillip and Barbara Ludman (eds) 1999: Mail & Guardian A - Z of South
African Politics 1999. The Essential Handbook, Sandton (penguin Books).
Van Zyl, Albert 1998a: Eastern Cape lessons. Can provinces stick to budgets?; in: Budget
Watch Vol. 4 Issue 1 (May): 3.
119
Stellenbosch University https://scholar.sun.ac.za

Van Zyl, Albert 1998b: An Overview of the 1998/99 Western Cape Provincial Budget, Cape
Town (Idasa: Budget Informatio~ Service).
Van Zyl, Albert 1998c: An Overview of the 1998/99 Gauteng Provincial Budget, Cape Town
(Idasa: Budget Information Service).
Van Zyl, Albert 1998d: An Overview of the 1998/99 Mpumalanga Provincial Budget, Cape
Town (Idasa: Budget Information Service).
Verney, Douglas V. 1995: Federalism, Federative Systems, and Federations: The United
States, Canada, and India; in: Publius Vol. 25 No.2: 81-97.
Walker, Laura 1998: An Overview f!! the 1998/99 KwaZulu-Natal Provincial Budget, Cape
Town (Idasa: Budget Information Service).
Walker, Laura 1999: Spend & Deliver: Review of the Budget 1998/99 - 2001/02, Cape Town
(Idasa: Budget Information Service).
Walker, Laura and Albert van Zyl 1999: Juggling central control and provincial fiscal
autonomy in South Africa; in: Development Southern Africa Vol. 16 No 2: 239-258.
Watts, Ronald L. 1990: Executive Federalism: A Comparative Analysis, Research Paper No.
26, Kingston / Ontario (Queen's University: Institute of Intergovernmental Relations).
Watts, Ronald L. 1997: Co-operative Government and Intergovernmental Relations: A Comparative
Perspective (notes for a presentation at the special meeting of intergovernmental co
ordinators, 22 May, Cape Town).
Wehner, Joachim 1997a: Resolving the uneven distribution of wealth among provinces;
in: Budget Watch Vol. 3 Issue 3 (September): 4-5.
Wehner, Joachim 1997b: Is NCOP just a rubber stamp?; in: Parliamentary Whip, 5 No
vember: 6.
120
Stellenbosch University https://scholar.sun.ac.za
Wehner, Joachim 1997c: Finance proposals must be made accessible; in: Local Government
Chronicle (SA), 21 November: 9.
Wehner, Joachim 1998a: Financing Local Government - A Comparative Perspective: Can
South Africa Benefit from International Experience?, Discussion Paper No. 24 (February),
Cape Town (University of Cape !own: Budget Project).
Wehner, Joachim 1998b: What is the Future of South Africa's Provinces?, Discussion Paper
No. 29 (August), Cape Town (University of Cape Town: Applied Fiscal Research Cen
tre).
Wehner, Joachim 1999a: Asymmetrical Devolution: An Outline, Discussion Paper No. 34
(March), Cape Town (University of Cape Town: Applied Fiscal Research Centre).
Wehner, Joachim 1999b: Parliament helps to redraft financial management framework;
in: Budget Watch Gune): 11.
Welsh, David 1994: The Provincial Boundary Demarcation Process; in: Bertus de Villiers
(ed.): Birth of a Constitution, Kenwyn Guta): 223-229.
Wheare, Kenneth C. 1946 (reissued edition, 1964): Federal Government, Oxford (Oxford
University Press).
Williams, Colin H. 1995: A Requiem for Canada?; in: Graham Smith (ed.): Federalism: The
Multiethnic Challenge, New York (Longman Publishing): 31-72.
Wiltshire, Kenneth 1989: Federal State / Provincial Financial Relations; in: Bruce W.
Hodgins et al (eds): Federalism in Canada and Australia. Historical Perspedives 1920-88, Peter
borough / Canada (Frost Centre for Canadian Heritage and Development Studies): 181-
199.
Wise, Charles 1998: Judicial Federalism: The Resurgence of the Supreme Court's Role in
the Protection of State Sovereignty; in: Public Administration Review Vol. 58 No.2: 95-98.
121
Stellenbosch University https://scholar.sun.ac.za
Wolman, Harold 1990: Decentralization: What It Is and Why We Should Care; in: Robert
J. Bennett (ed.): Decentralization, Local Governments, and Markets. Towards a Post-We!fare
Agenda, Oxford (Clarendon Press): 29-41.
b) South Mrican Legislation
Borrowing Powers of Provincial Governments Act, 1996 (Act 48 of 1996).
Constitution of the Republic of South 1irica, 1996 [Final Constitution] (Act 108 of 1996).
Constitution of the Republic of South Africa, 1993 [Interim Constitution] (Act 200 of 1993).
Division of Revenue Act, 1998 (Act 28 of i 998).
Financial and Fiscal Commission Act, 1997 (Act 99 of 1997).
Intergovernmental Fiscal Relations Act, 1997 (Act 97 of 1997).
Public Finance Management Act, 1999 (Act 1 of 1999) ..
c) Judgements of the Constitutional Court of South Mrica
Certification of the Constitution of the Republic of South Africa, 1996 [Certification Judgement 1],
1996 (4) SA 744 (CC).
Certification of the Amended Text of the Constitution of the Republic of South Africa, 1996 [Certifi
cation Judgement 11],1997 (1) BCLR 1 (CC).
Certification of the Constitution of the Province of KwaZulu-Nata4 1996, 1996 (11) BCLR 1419
(CC).
122
Stellenbosch University https://scholar.sun.ac.za
Certification of the Constitution of the Western Cape, 1997, 1997 (4) SA 794 (cq; 1997 (9)
BCLR 1167 (cq.
d) Referenced Constitutions of Other Countries
Brazil: Constitution of the Federal Republic ofBraifl, 1988.
Canada: Constitution Act, 1982.
Germany: Basic Law for the Federal Republic ofGermaf!)l, 1949.
India: Constitution of India, 1950.
e) Referenced Newspapers and Magazines
Business Dqy (South Africa).
Cape Argus (South Africa).
DailY Telegraph (United Kingdom).
Der Spiegel (Germany).
Economic Times (India).
Economist (United Kingdom).
Financial Mail (South Africa).
Hindu (India).
Mail & Guardian (South Africa).
123
Stellenbosch University https://scholar.sun.ac.za

Sowetan (South Africa).
Sundc[y Independent (South Africa).
f) Interviews and Discussions
Abdullah, Dr. Fareed (Department of Health, Western Cape, Chief Director: Health
Care), 17 June 1998.
Donian, Colin (Financial and Fiscal Commission, Research Co-ordinator), 8 April 1999.
Engela, Ronette (Department of Constitutional Affairs, Acting Director: Provincial Af
fairs), 9 April 1999.
Essop, Tasneem (Member of the Western Cape Provincial Legislature, African National
Congress Spokesperson on Finart.,ce), 18 May 1998.
Friedman, Joel (Department of Finance, Senior Manager: Provincial Budget Analysis), 9
June 1998.
Momoniat, Ismail (Department of Finance, Chief Director: Intergovernmental Finance),
10 June 1998.
Neumann, Ron (Department of Finance, Manitoba, Canada, Director: Intergovernmental
Finance), 9 April 1999.
Rich, Guy (Heath Special Investigating Unit, Personal Assistant to Judge Willem Heath)
and Gerhard Visagie (Heath Special Investigating Unit, Executive Manager: Legal Serv
ices), 29 March 1999.
Van Niekerk, Adriaan (Member of Parliament, National Council of Provinces, National
Party Delegate for the Northern Cape), 8 October 1997.
124
Stellenbosch University https://scholar.sun.ac.za
Woods, Dr. Gavin (Member of Parliament, National Assembly, Inkatha Freedom Party
Spokesperson on Finance), 9 June 1998.
g) Useful Internet Resources
African National Congress (ANC): http://www.anc.org.za
Business Dqy: http://www.bday.co.za
~
Department of Finance: http://www.finance.gov.za
Heath Special Investigating Unit. http://www.heathsiu.co.za
Institute for Democrary in South Africa (Idasa): http://www.idasa.org.za
Library of Congress: http://www.loc.gov
Mail & Guardian: http://www.mg.co.za
South African Constitutional AssembtJ: http://www.constitution.org.za
South African Government. http://www.polity.org.za
Statistics South Africa: http://www.statssa.gov.za
125
Stellenbosch University https://scholar.sun.ac.za